
 Submit a Paper
 Propose a Special lssue
 Open Access
ARTICLE

Feature Engineering Methods for Analyzing Blood Samples for Early Diagnosis of Hepatitis Using Machine Learning Approaches
1 Department of Information and Computer Science, College of Computer Science and Engineering, University of Ha’il, Hail, 81481, Saudi Arabia
2 Department of Computer Science, College of Applied Sciences, Hajjah University, Hajjah, 9677, Yemen
3 Department of Artificial Intelligence, Faculty of Computer Science and Information Technology, Al-Razi University, Sana’a, 9671, Yemen
* Corresponding Author: Mohamed A.G. Hazber. Email:
(This article belongs to the Special Issue: Exploring the Impact of Artificial Intelligence on Healthcare: Insights into Data Management, Integration, and Ethical Considerations)
Computer Modeling in Engineering & Sciences 2025, 142(3), 3229-3254. https://doi.org/10.32604/cmes.2025.062302
Received 15 December 2024; Accepted 11 February 2025; Issue published 03 March 2025
 View Full Text
 Download PDF
Abstract
Hepatitis is an infection that affects the liver through contaminated foods or blood transfusions, and it has many types, from normal to serious. Hepatitis is diagnosed through many blood tests and factors; Artificial Intelligence (AI) techniques have played an important role in early diagnosis and help physicians make decisions. This study evaluated the performance of Machine Learning (ML) algorithms on the hepatitis data set. The dataset contains missing values that have been processed and outliers removed. The dataset was counterbalanced by the Synthetic Minority Over-sampling Technique (SMOTE). The features of the data set were processed in two ways: first, the application of the Recursive Feature Elimination (RFE) algorithm to arrange the percentage of contribution of each feature to the diagnosis of hepatitis, then selection of important features using the t-distributed Stochastic Neighbor Embedding (t-SNE) and Principal Component Analysis (PCA) algorithms. Second, the SelectKBest function was applied to give scores for each attribute, followed by the t-SNE and PCA algorithms. Finally, the classification algorithms K-Nearest Neighbors (KNN), Support Vector Machine (SVM), Artificial Neural Network (ANN), Decision Tree (DT), and Random Forest (RF) were fed by the dataset after processing the features in different methods are RFE with t-SNE and PCA and SelectKBest with t-SNE and PCA). All algorithms yielded promising results for diagnosing hepatitis data sets. The RF with RFE and PCA methods achieved accuracy, Precision, Recall, and AUC of 97.18%, 96.72%, 97.29%, and 94.2%, respectively, during the training phase. During the testing phase, it reached accuracy, Precision, Recall, and AUC by 96.31%, 95.23%, 97.11%, and 92.67%, respectively.Keywords
The liver is one of the largest internal organs in the human body. Also, it regulates many chemical levels in the blood. All the blood that passes from the stomach and intestines passes through the liver to be cleaned and filtered. The liver produces a bile product that helps to digest and break down fats [1]. It also works to secrete cholesterol, drugs, and hormones. Also, a storage of vitamins, blood purification, and detoxification [2]. Hepatitis is a global health affecting millions of people worldwide. It is a viral infection that first affects the liver, potentially leading to severe liver damage if not detected and treated early [3]. Hepatitis is a problem that hinders the liver from performing its functions, affecting all age groups. Viral hepatitis has become a major global public health issue [4], which causes 1.5 million deaths worldwide [5]. Timely diagnosis is crucial for effective management and prevention of complications associated with hepatitis. The hepatitis virus is considered communicable, and its types are Hepatitis A, B, C, D, and E virus [6]. Types A and E are transmitted by eating contaminated foods and are cured without affecting the liver. The other three types, B, C, and D are called chronic hepatitis, which is transmitted through blood transfusions and causes cirrhosis if there is no early diagnosis [7]. The number of people infected with chronic hepatitis C virus ranges from 130 to 150 million people all over the world, according to the statement of the World Health Organization [8]. Hepatitis is diagnosed with a blood test. Diagnosing hepatitis is difficult, and a physician must perform many tests and check many factors when diagnosing the disease. So, the development of computer-aided diagnostics for accurate and early diagnosis of hepatitis to make and support a physician’s decision [9]. The development of technology in computer science has contributed to many areas, including medicine. AI technologies have played an important role in medicine, assisting physicians and saving many lives through early diagnosis. Data mining techniques provide effective tools for diagnosing disease from a large data set that is difficult for a clinician to interpret [10]. In recent years, the application of AI techniques in healthcare has gained significant attention. AI offers a promising approach to improve the accuracy, efficiency, and accessibility of hepatitis diagnosis. By harnessing the power of AI, detect the disease at its early stages, enabling prompt intervention and better patient outcomes. AI techniques, particularly ML and deep learning (DL), have appeared amazing capabilities in medical diagnostics [11]. Machine learning algorithms can analyze medical data, laboratory results, imaging tests, genetic information, and other patient data with high accuracy. It can identify patterns, biomarkers, and risk factors associated with liver infections, and also predicts the development of the disease [12]. Firstly, it assists AI in accurately identifying patients at risk of hepatitis [13]. Secondly, AI aids in interpreting medical data and provides additional insights to support diagnostic decisions [14]. Thirdly, AI algorithms assist in risk stratification and personalized treatment planning, ensuring patients receive the most appropriate care based on their characteristics [15]. Overall, data mining for early diagnosis of hepatitis leverages computational techniques to analyze large datasets, uncover patterns, and assist in the timely detection and management of the disease. It has the potential to improve healthcare outcomes by enabling early intervention and personalized treatment strategies. In this paper, the REF algorithm and SelectKBest function were applied to select the features and give a score and priority to each feature. Then it is fed to the t-SNE and PCA algorithms to select the significant features. These features were fed to SVM, KNN, ANN, DT, and RF classifiers to diagnose the selected features with high accuracy.
The main contributions to the study are as follows:
• Balancing the data set by the SMOTE technique.
• Applying the SelectKBest function to provide the degree of correlation of each feature with the target feature and select the significant features that strongly correlate with the target features using the t-SNE and PCA algorithms.
• Diagnosing the data set based on the priority ratio and the order of each feature associated with the target feature through the RFE algorithm and selecting the significant features using t-SNE and PCA algorithms.
• Adjusting the hyper-parameter of the classification algorithm to the best performance for predicting hepatitis.
• Highly efficient algorithms for diagnosing hepatitis generalize to help physicians make their diagnostic decisions.
The remainder of the paper is organized as follows: Section 2 describes related works, and Section 3—Background on data mining and classification algorithms. Section 4 describes the System Framework and the subsections for features processing. Section 5 analyzes the results achieved by the systems and Section 6 compares them with relevant studies. Finally, Section 7 concludes the paper.
Related work in the early diagnosis of hepatitis plays an important role in identifying gaps in previous studies because it provides a basis for understanding the current state of knowledge.
Kaya et al. [16] designed a novel decision-making system by integrating extreme ML. The system also involved feature selection to enhance its performance and address the issue of missing values through appropriate data handling methods. In their study, Sartakhti et al. [17] developed a novel hybrid system by combining a support vector machine with simulated annealing to diagnose hepatitis. The dataset was pruned to 80 records and underwent normalization. The resulting hybrid system demonstrated an impressive diagnostic accuracy of 96.25%. Chen et al. [18] utilized a hybrid approach combining local Fisher discriminant analysis (LFDA) with SVM for hepatitis diagnosis. The approach effectively managed missing values, performed data normalization, and employed LFDA to reduce the dimensions from 19 features to a concise set of 2 features. The study by Dogantekin et al. [19] employed PCA and least square SVM. Through the application of PCA, the feature set was effectively reduced to 10 features. Dogantekin et al. [20] devised a diagnostic system for hepatitis diseases that integrated linear discriminant analysis (LDA) with a network based on a fuzzy inference method (NFIM). LDA was utilized to select eight features from the dataset carefully. Subsequently, the dataset was partitioned into 60% for training and 40% for testing the developed system. Feature selection is a key step in ML, where the aim is to recognize the most relevant features from the dataset. By using the artificial bee colony method, Uzer et al. [21] sought to identify the cluster centers that would lead to the most discriminative and representative features for the problem at hand. Once the optimal cluster centers were determined through the artificial bee colony method, the selected features were fed into an SVM classifier. Ozyilmaz et al. [22] used a cone section neural network (CSNN) to diagnose hepatitis. Multilayer Perceptron (MLP) and Radial Basis Functions (RBF) algorithms were combined to form the hybrid CSNN, resulting in the most effective diagnostic performance of hepatitis. Anter et al. [23] discussed a hybrid feature selection approach that combines chaos and rookery search optimization techniques. This approach shows the ability to achieve an optimal solution. The approach achieved 68% accuracy in diagnosing hepatitis. Janghel et al. [24] discussed the performance of Backpropagation, Probabilistic Neural Network, and Learning Vector Quantization (LVQ) methods for diagnosing hepatitis. The algorithms were applied based on genetic algorithms (GA)-SVM methods which combine the strengths of genetic algorithms, SVM, and simulation annealing. Derya et al. [25] presented GA and wavelet kernel (WK) systems, which showed good results for hepatitis diagnosis. Madhu et al. [26] presented the XGBoost classifier for diagnosing liver infections. The MLP classifier and the Levenberg-Marquardt method were used to predict the missing features. Bascil et al. [27] presented an MLP method to get patterns in data in optimizing neural network parameters for effective diagnostic performance. This method allows for accurate pattern recognition and modeling, making it a promising approach to the diagnosis of hepatitis. Gong et al. [28] presented the RHSBoost method to address classification problems associated with imbalanced datasets. The RHSBoost method aims to reduce this problem by paying attention to the minority classes. Xiao et al. [29] presented a classification method for a cost-specific maximum regularization learning machine (CCR-ELM) with imbalanced data. The CCR-ELM includes a category-specific regulatory cost to achieve equilibrium. The effectiveness of CCR-ELM has been demonstrated through datasets, and experimental results indicate that CCR-ELM outperforms the original ELM. Demidova et al. [30] presented an artificial minority oversampling technique to address the problems of imbalanced data sets. The technique provides a solution to address class imbalance when classified by SVM. This technique provides a practical way to improve classification performance on these challenging datasets.
Previous studies have identified a gap in the ability to extract and select important features strongly associated with the objective feature. This study will address this gap by developing a new feature extraction and selection method.
Data mining is a technique that analyses and turns large useless data into valuable knowledge. It looks for patterns, anomalies, and correlations among millions of records to find correlations between features and predict accurate results. Data mining works to discover hidden correlations between features of future predictions that are difficult to discover manually. The fundamentals of data mining consist of three terms: statistics, AI, and ML. This section describes the materials and methods applied to analyze the features of the data set for diagnosing hepatitis. The data was processed, cleaned of outliers and missing values, and the data was normalized. Because the data set is unbalanced, the SMOTE method is applied to balance the data set. The RFE algorithm was used to rank the features and the correlation between the features and the target feature. The SelectKBest function was applied with the statistical function Chi-2 to find the correlation of each feature with the target feature. The t-SNE algorithm was applied to reduce the dimensions of the data set. Finally, the processed data set was classified by five classification algorithms to diagnose each inflammatory condition as living or dead. Fig. 1 describes the study’s methodology for diagnosing the hepatitis data set.
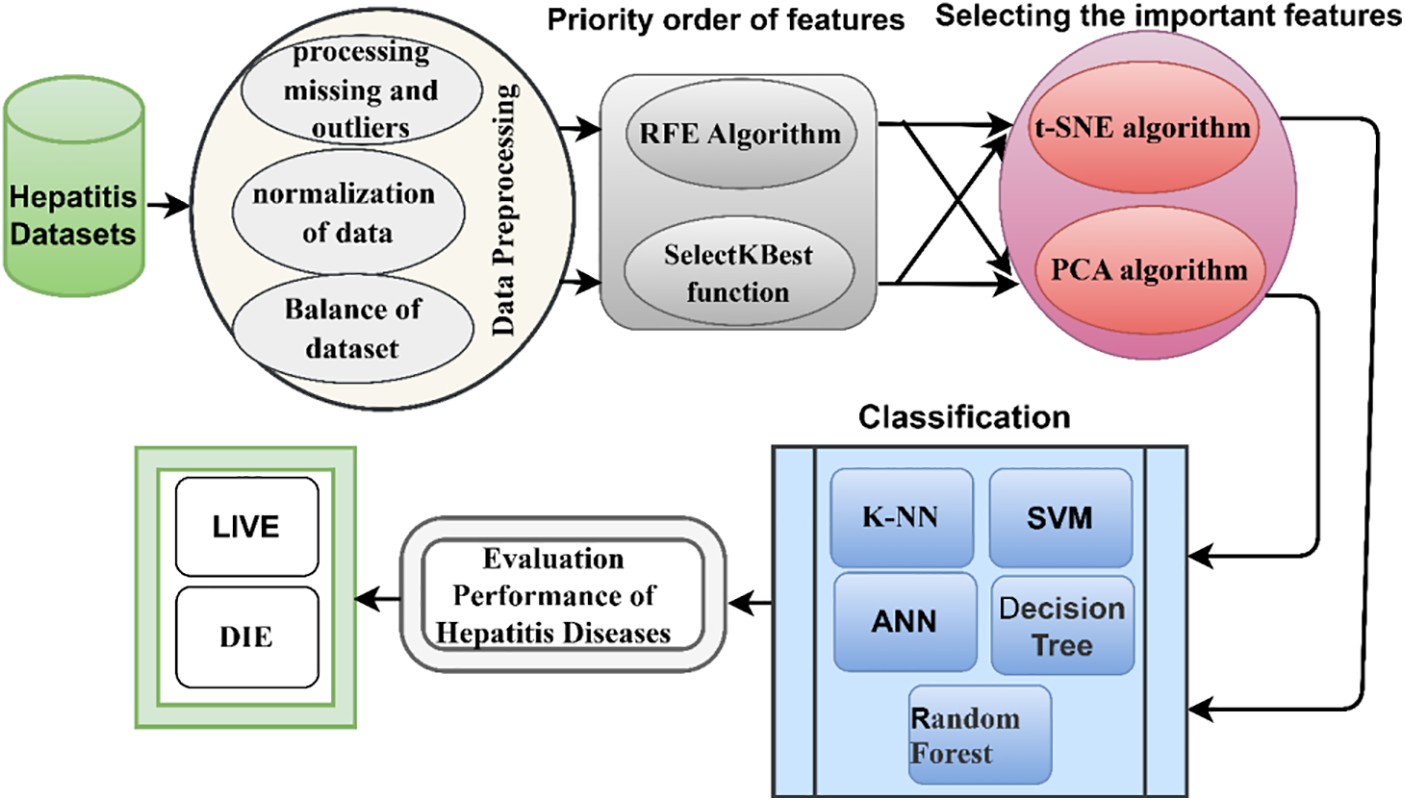
Figure 1: Proposed system for diagnosing hepatitis
The hepatitis dataset was obtained from the UCI of ML repository, which consists of 155 instances, each instance containing 19 features except for some instances which have missing values. The dataset contains 167 values that are missing from several features. The target feature contains two options for the hepatitis patient, either “Die” which contains 32 instances, or “Live” which contains 123 instances. Table 1 describes the data set with the features and missing values of each feature [31].

Getting the missing values in a dataset is essential for several reasons: Missing values lead to incomplete data, hindering accurate analysis and decision-making. Filling in missing values ensures the dataset is complete and representative of the actual observations, allowing for more robust and reliable analyses. Missing data introduce bias into analysis if the missing values are not handled properly [32]. This bias impacts the validity of any conclusions drawn from the dataset. Ensuring that missing values are appropriately handled helps reduce the risk of bias in the analysis. Many statistical methods and ML methods require complete datasets to work effectively. In ML, missing values cause issues during model training and evaluation. Some algorithms might struggle to handle missing data, leading to reduced performance [33]. Filling in missing values or using appropriate imputation techniques improves the chances of building a more accurate and reliable predictive model. The dataset should contain accurate and complete attribute values that allow predictive algorithms to obtain high diagnostic accuracy. The dataset contains missing values due to some tests being ignored while the patient is undergoing the tests. Therefore, these problems must be addressed to obtain high diagnostic accuracy. In this study, the data set contains 167 missing values. Therefore, the missing values are calculated from the existing values using the statistical expressions mean and mode. In the study, the mean method was used to calculate missing values for numeric attributes, and a mode method was used to calculate missing values for nominal attributes. Table 1 describes the number of missing attribute values in each attribute.
Data normalization is crucial in data mining, especially when dealing with datasets for early diagnosis of hepatitis or any medical condition. It involves transforming data into a standardized format to bring it within a specific range, usually between 0 and 1 or −1 and 1 [34]. The importance of data normalization in this context is understood through the following points: In medical datasets, the attributes or features have vastly different ranges. For example, age might range from 1 to 100, while certain blood parameters range from 0.1 to 1000. The algorithms might prioritize features with larger ranges without normalization [35], leading to biased results. Normalization helps in treating all features equally and prevents any single feature from dominating the analysis. Normalizing the data ensures that the algorithms converge efficiently and reach a stable solution more quickly. Normalization leads to better performance and accuracy of the model. When data is normalized, the model more easily detects patterns and relationships within the data, leading to more accurate predictions for early diagnosis of hepatitis. Normalization makes it easier to interpret the importance and effect of each feature on the diagnosis. Since all features are on the same scale, comparing the influence of different features in contributing to the diagnostic outcome becomes straightforward. Data normalization also makes models more robust to outliers. When features are on a similar scale, extreme values in one feature won’t overly influence the model’s decision-making process. In this study, min-max normalization was applied to generate the data set between values of 0 and 1. Eq. (1) describes the normalization process on the data set.
where
The significance of removing outliers in a data mining dataset for early diagnosis of hepatitis lies in improving the accuracy and reliability of the predictive models used in the diagnosis process. Outliers are data points that significantly deviate from most data and considerably impact the performance of data mining algorithms and statistical models [36]. Here are some reasons removing outliers is important for early diagnosis of hepatitis: Outliers distort statistical measures and negatively affect the performance of ML methods. By removing outliers, the models focus on patterns and relationships more representative of most of the data, leading to more accurate predictions. Outliers introduce bias into the model by disproportionately influencing the model’s decision boundaries. Eliminating outliers helps build more consistent and unbiased models that can be generalized to new data. By eliminating outliers, the model better captures these subtle patterns, which is crucial for early diagnosis [37]. Outliers lead to false positives (incorrectly diagnosing hepatitis when it is not present) or false negatives (failing to diagnose hepatitis when it is present). Removing outliers helps reduce these errors, ensuring a more reliable diagnostic process. By visualizing and analyzing data without outliers, AI gains a clearer and more accurate understanding of the distribution and features of the data. This understanding guides them in selecting appropriate features and building better diagnostic models. The hepatitis dataset contains outliers that do not represent the feature value and negatively affect the diagnostic process. Table 2 describes outliers that were detected and removed from the dataset. Fig. 2 describes the distribution of outliers for each feature of the data set.


Figure 2: Distribution of outliers for the hepatitis data set
Dataset balancing is crucial in data mining, especially for early diagnosis of hepatitis, because it ensures that the model is trained on a representative and unbiased data set. Dataset balancing refers to adjusting the class distribution within a dataset to avoid any significant imbalance between classes. In the context of early diagnosis of hepatitis, the importance of dataset balancing is understood through the following points: Imbalanced datasets lead to biased systems that are more accurate in predicting the majority class but perform poorly in the minority class (i.e., the positive cases of hepatitis) [38]. By balancing the dataset, the model becomes more capable of learning patterns and features from both positive and negative cases, leading to better overall performance and more accurate early diagnosis. An imbalanced dataset causes the model to tend to the majority class due to its higher prevalence. Overfitting means the model memorizes the dominant class rather than learning the underlying patterns and generalizing them to new, unseen data. Balancing the dataset assists stop overfitting and helps better generalization to new samples. In the context of early diagnosis, correctly identifying positive cases (patients with hepatitis) is of utmost importance [39]. An imbalanced dataset results in a higher number of false negatives (incorrectly classifying a patient with hepatitis as not having the disease), which have severe consequences for the patient’s health. Balancing the dataset ensures that positive cases receive equal attention during model training. In healthcare, biased models have ethical implications. Dataset imbalance leads to disparities in the accuracy of diagnosis and treatment recommendations for different groups of patients. By balancing the dataset, we aim to minimize these biases and ensure fairness in healthcare decision-making. Balancing the dataset is especially important when the misclassification cost is significantly different for different classes. In the case of early diagnosis of hepatitis, the cost of missing a positive case could be substantial in terms of delayed treatment and potential complications. To achieve dataset balancing, various techniques are employed, such as the SMOTE technique. The hepatitis dataset consists of 155 unbalanced records divided into two classes, Live containing 123 records (79.35%) and Die class containing 32 records (20.65%). Thus, the data set is unbalanced, which leads to tendencies of the overall accuracy to the majority class. Therefore, it is necessary to balance the data set to obtain superior results and represent all the data set classes. In this study, the SMOTE technique was applied to balance the data set. The algorithm creates new records by searching for the values of the minority class records according to the neighboring records during the training phase. The technique continues to add new records until the number of the minority class records is equal to the number of the majority class records. Table 3 describes the breakdown of the data set during the training and testing phase before and after applying the SMOTE technique.

In data mining, the correlation of features in a dataset is a crucial aspect when it comes to early diagnosis of hepatitis or any other medical condition. The significance of correlation lies in its ability to identify relationships and dependencies between different variables, which provide valuable insights into the disease’s early detection and understanding. Correlation analysis helps identify which features or attributes in the dataset are strongly associated with hepatitis [40]. These features include various blood tests, liver enzyme levels, patient demographics, risk factors, etc. By finding the features most associated with hepatitis, AI techniques learn the information most relevant to diagnosis. Correlated features contain redundant information. If multiple features are highly correlated, it might be possible to reduce the dimensionality of the dataset by keeping only one representative feature. This simplification leads to more efficient and accurate diagnosis models. Correlation analysis reveals patterns that indicate early stages of hepatitis or potential risk factors associated with the disease. This information is used to develop predictive models that flag patients for further examination or monitoring, enabling early detection and intervention. Understanding feature correlations enhances the performance of ML methods used for diagnosis [41]. Highly correlated features lead to multicollinearity, negatively impacting the model’s stability and interpretability. By recognizing and handling correlated features appropriately, the models provide more reliable and accurate predictions. Biomarker discovery: Correlation analysis helps identify potential biomarkers or combinations of features that strongly correlate with hepatitis. Biomarkers are specific indicators in the data used to distinguish between different disease states. The discovery of relevant biomarkers aids in developing diagnostic tests that are sensitive, specific, and reliable for early detection. Table 4 shows the correlation between each feature with the other. Fig. 3 describes the correlation and contribution of each feature with the target feature (class).


Figure 3: Correlation of each feature with the hepatitis feature
3.4.1 Recursive Feature Elimination Algorithm
The RFE algorithm is an important tool in ML methods for feature selection. It identifies and retains the relevant and informative features in a dataset while discarding less important ones. When applied to a data mining dataset for the early diagnosis of hepatitis, RFE brings several benefits and improves the overall performance of the predictive model: Hepatitis datasets contain many features (variables), some of which might be irrelevant or redundant. High-dimensional datasets increase computational complexity, longer training times, and a higher risk of overfitting the model [42]. RFE helps to reduce the number of features while preserving the most valuable ones, simplifying the problem and improving the model’s efficiency. RFE enhances the model’s predictive capabilities by focusing on the most informative features. Selecting the right subset of features reduces noise and ensures that the model captures the essential patterns and relationships in the data. As a result, the model’s predictive accuracy is likely to increase, leading to more reliable and earlier diagnosis of hepatitis cases. In the context of hepatitis diagnosis, certain features or biomarkers are critical indicators of the disease’s presence or progression. RFE helps identify these important biomarkers. RFE selects features and ranks them based on their importance. This ranking allows for a better interpretation of the model’s predictions. Classification techniques gain insights into which traits most influence the diagnostic process, leading to a better understanding of the underlying factors of disease. Removing irrelevant or redundant features through RFE reduces the risk of overfitting. By selecting only the relevant features, RFE helps the model focus on the essential patterns likely to hold true for new, unseen cases, thereby improving generalization. This study used the RFE algorithm to eliminate the features that have a weak correlation with the target feature, extracting the important features and giving each feature a rank based on its correlation with the target feature. Table 5 describes the important features extracted by the RFE algorithm and notes that the prime feature has the highest rank of 12 as a correlation with the target feature, followed by the sgot feature having a rank of 10 as a correlation with the target feature, etc. The algorithm also distributes the ratio of the correlation of each feature with the target feature, where it noted that the prime feature has the highest correlation with the target feature by 14.16%, followed by the sgot feature that correlates with the target feature by 11.8%, etc.

Feature selection using the SelectKBest function in data mining for the early diagnosis of hepatitis is significant for several reasons: Medical datasets often contain many features or variables, leading to the curse of dimensionality. This causes computational and memory inefficiencies and leads to overfitting. SelectKBest helps in reducing the number of features by selecting the top K most informative features, where K is a user-defined parameter. Selecting the most relevant features leads to a more focused and accurate model. Irrelevant or redundant features introduce noise into the data, making it harder for the model to discern meaningful patterns [43]. By eliminating these less important features, SelectKBest allows the model to focus on the most discriminative attributes, leading to better performance. In the context of medical diagnosis, interpretability is crucial. Using SelectKBest, the selected features are the ones that have shown the strongest correlation with the target variable (hepatitis diagnosis), making AI understand and trust the model’s predictions. Hepatitis diagnosis involves specific symptoms, biomarkers, or lab results highly indicative of the disease. SelectKBest highlights these critical features, guiding classification algorithms to focus on the most important factors during the classification process. However, it is essential to choose the appropriate value of K carefully [44]. Selecting too few features results in a loss of information while selecting too many features might lead to noise and less generalized models. The selection of K should be based on careful analysis, domain knowledge, and validation through cross-validation techniques. In this study, the SelectKBest function was applied with the statistical function Chi-2, considered a scoring rate of feature, where Chi-2 works to compute the correlation of each feature with the target feature. Table 6 describes the best features correlated with the target feature with appropriate scores, the higher the number, the more critical the feature.

3.5 Selecting Important Features
The significance of choosing highly relevant features exhibiting strong correlations with hepatitis is enhancing accurate detection and understanding of the underlying factors influencing the disease. By focusing on these crucial attributes, develop more effective diagnostic and predictive models, facilitating early identification and targeted interventions for individuals at risk of or affected by hepatitis. By focusing on fewer highly relevant features, it reduces the cost of diagnostic tests. Also, selecting features leads to speeding up the diagnostic process by focusing on fewer highly relevant features. This is important because early diagnosis and treatment of hepatitis help to prevent serious complications. In this study, the t-SNE and PCA algorithms were applied to select the most important features and reduce the dimensions of the dataset.
3.5.1 t-Distributed Stochastic Neighbor Embedding Algorithms
The t-SNE is a popular dimensionality reduction method used in ML methods to visualize high-dimensional data in a lower-dimensional space while preserving the relationships between data [45]. In the context of early diagnosis of hepatitis using a data mining dataset, the significance of applying t-SNE lies in its ability to provide insights and help classification algorithms in the following ways: Medical datasets, including those for hepatitis diagnosis, often have numerous features or attributes that describe various aspects of a patient’s health. These high-dimensional datasets were difficult to analyze and interpret directly. t-SNE transforms the data into a lower-dimensional space (usually 2D or 3D) while preserving the local structures and relationships among data points [46]. By visualizing the transformed data, it becomes easier to observe clusters or patterns that could indicate different subgroups or classes of patients. The t-SNE visualization reveals clusters of data points with similar features. In the context of hepatitis diagnosis, it might uncover groups of patients with similar symptoms, lab test results, or other health-related attributes. Such clusters could correspond to different stages or types of hepatitis, allowing for better understanding and differentiation. t-SNE applied to different patient groups or datasets, allowing for comparisons between, for example, healthy individuals and those with hepatitis or different stages of the disease. This comparison reveals dissimilarities between the groups and contributes to the discovery of distinguishing features. This study applied the t-SNE algorithm to select the most important features strongly correlated with hepatitis disease. The algorithm uses gradient descent for the joint probability distribution in the low dimensions to be similar to the high dimensions. The algorithm goes through three stages: The first stage is to calculate the Euclidean distance for each point with the other points. The distance is converted into conditional probabilities to measure the similarity between every two points and how probability (P) the two points are to be adjacent as in Eq. (2). The second stage is creating a new data set in a low-dimensional space and the computation of the joint probability (Q) as in Eq. (3). The third stage, using Kullback-Leiber (KL) to make the joint probability in a low dimensional space similar to the original data set. When the KL deviation value is zero, the probability distribution in a low-dimensional space is identical to the original data set. Eq. (4) describes the probability distribution of both P and Q. Thus, the dimensions of the data set are reduced while preserving the essential features and removing the iterative features that do not affect the target feature.
3.5.2 Principal Component Analysis
PCA is the method used in orthogonal transformation to convert a set of data of possibly correlated variables into values of linearly uncorrelated variables. PCA is used to select important features that strongly correlate with hepatitis disease by first calculating the covariance matrix of the data. After computing the covariance matrix, PCA identifies the eigenvectors and eigenvalues. The eigenvectors represent the directions of maximum variance in the data, and the eigenvalues correspond to these variances. The features with the largest eigenvalues are considered the most important, as they contribute the most to the data’s variance and thus are most strongly correlated with hepatitis disease.
The covariance matrix for displaying the covariance between each pair of features in the dataset. The covariance between two features means how much they vary together, as described in Eq. (5).
where X means feature vector, Y means another feature vector, μx is mean of feature X, μy is the mean of feature Y and E is the expectation operator.
The eigenvectors of the covariance matrix are the directions of maximum variance in the data. The eigenvalues are the corresponding variances as Eq. (6).
where A means covariance matrix, v means eigenvector, and
The principal components are the linear combinations of the original features aligned with the covariance matrix’s eigenvectors. The principal components with the largest eigenvalues are the most important features as in Eq. (7).
where z is the principal component, A is the covariance matrix, and v is the eigenvector.
PCA is a powerful tool that is used to select the most important features that strongly correlate with hepatitis disease. By using PCA, we develop more accurate diagnostic and predictive models and provide targeted interventions that help to prevent serious complications of hepatitis.
Following the initial feature engineering stage, which involved feature prioritization through the RFE and SelectKBest techniques, the subsequent step identified the most salient features via the t-SNE and PCA methods. This resulted in the creation of four distinct processed datasets: RFE-t-SNE, SelectKBest-t-SNE, RFE-PCA, and SelectKBest-PCA. These processed datasets were subsequently employed as input for classification tasks utilizing classifiers: KNN, SVM, ANN, DTs, and RFs. As a notable outcome, utilizing these advanced datasets with the mentioned classifiers led to robust and high-accuracy classification results.
4.1 K-Nearest Neighbor (KNN) Algorithm
The KNN algorithm is a popular ML method for classification tasks, including early diagnosis of diseases like hepatitis. Here is a summary of the mechanism of action of the KNN algorithm for early diagnosis of hepatitis: The algorithm requires a labeled dataset consisting of examples where each instance is associated with a class label. In the case of hepatitis diagnosis, the dataset would include various attributes of patients (e.g., age, sex, symptoms, blood test results) along with their corresponding hepatitis status (e.g., infected or not infected) [47]. The KNN algorithm calculates the similarity between instances in the dataset based on a chosen distance metric, such as Euclidean distance. This metric measures the dissimilarity between two instances by considering the differences in their attribute values. The algorithm considers the K nearest neighbors to a given test instance from the training dataset [48]. A smaller K value implies a more local analysis, while a larger K value considers a broader range of instances. In the case of binary classification like hepatitis diagnosis, a majority vote is often used. This approach makes it suitable for early diagnosis of hepatitis.
4.2 Support Vector Machine (SVM) Algorithm
SVM is a popular ML method for classification tasks, applicable across various domains including healthcare, while maintaining a consistent mechanism of action. SVM operates by establishing a decision boundary between different classes of data points. In the early diagnosis of hepatitis, SVM is employed to distinguish between individuals with hepatitis and those without, based on a set of features or variables [49]. During the training phase, the SVM algorithm learns from this preprocessed dataset, aiming to find an optimal hyperplane that maximally separates the two classes in the feature space. This hyperplane serves as the decision boundary between individuals with hepatitis and those without. The algorithm seeks to maximize the margin, which is the distance between the hyperplane and the nearest data points from each class [50]. In the testing phase, once the SVM model is trained, it is used to classify new, unseen instances. The model takes an individual’s feature values as input and predicts whether the person has hepatitis based on the learned decision boundary.
4.3 Artificial Neural Networks (ANN) Algorithm
ANNs are widely used for various applications, including medical diagnosis, such as the early detection of hepatitis [51]. The input layer receives the initial data for diagnosis. In the case of hepatitis, relevant features or attributes of patients are provided as input. These features could include demographic information, blood test results, medical history, etc. The hidden layers form the core of the ANN and perform complex computations on the input data. In this case, there are 15 hidden layers, meaning 15 layers are between the input and output layers. Each hidden layer consists of multiple artificial neurons, also known as nodes or units. Each neuron in the hidden layer receives inputs from the previous layer, applies a mathematical transformation to the inputs, and passes the transformed value to the next layer. This transformation typically involves applying weights and biases to the inputs, followed by the activation function. Weights represent the strength of the connections between neurons. During the training phase of the ANN, the weights are adjusted to optimize the model’s performance. Biases are added to introduce an offset to the neuron’s activation, allowing flexibility in learning. An activation function determines the output of a neuron based on its weighted inputs. The choice of activation function depends on the specific problem and the nature of the data. The output layers receive the transformed data from the final hidden layer and produce the output of the ANN. In this case, there are two output layers, likely representing binary classification (e.g., presence or absence of hepatitis). The activation function is used in the output layer to generate probabilities or a step function for binary outputs [52]. To train the ANN, a dataset with known inputs and corresponding outputs is required. The network weights and biases are adjusted iteratively using optimization techniques like backpropagation. During training, the network learns to minimize the difference between its predicted outputs and the true outputs in the training data. After training, the ANN was evaluated using a separate test dataset to assess its performance. The trained ANN with 15 hidden layers and two output layers is used for early diagnosis of hepatitis. By providing patient information as input, the network will process the data through the hidden layers, and the output layers will produce the diagnosis prediction.
DT algorithm is a popular ML method used for classification tasks, including the diagnosis of hepatitis [53]. The process of selecting the best attribute and splitting the data is repeated recursively for each subset created in the previous step. This recursive partitioning continues until a stopping criterion is met. The stopping criterion is a predefined depth of the tree, a minimum number of samples required to split a node, or other measures to prevent overfitting. As the tree grows, decision rules are formed based on the attribute values that lead to different branches [54]. The rules represent a series of if-else conditions that classify instances of hepatitis based on the values of specific attributes. After the tree is fully grown, it suffers from overfitting, becoming too specific to the training data, and performing poorly on new, unseen data. To address this, pruning techniques are applied to remove unnecessary branches or nodes from the tree. This helps to generalize the model and improve its performance on unseen data. Once the DT is constructed and pruned, it is used for making predictions. To diagnose hepatitis in a new patient, their information is passed through the tree, and the decision rules are used. The patient’s features are evaluated at each node, and based on the feature values, the corresponding branches are followed until a final prediction is reached at a leaf node.
After constructing multiple DTs, the RF algorithm combines their predictions to make a final prediction. For each input sample (patient), the algorithm passes it through each DT and collects the individual predictions. Voting for the final prediction [55]: The RF algorithm employs a majority voting scheme to determine the final prediction. Each DT’s prediction contributes to the final decision, and the class with the most votes is selected as the predicted class for the patient (whether they have hepatitis or not). The RF algorithm tends to be robust and capable of handling complex datasets. By aggregating the predictions from multiple DTs, it effectively reduces the impact of noisy or irrelevant features, improves generalization, and provides reliable predictions for early diagnosis of hepatitis.
5 Experiment Results and Comparison Studies
After the missing values were processed and outliers were removed. The important features were selected and ranked that have a greater importance on the target feature. The selected features were fed into KNN, SVM, ANN, DT, and RF classifiers to evaluate the hepatitis data set using four criteria: accuracy, precision, Recall, and AUC as in Eqs. (8)–(11) [56].
where:
True Negative (TP) is the number of Hepatitis which Die and that are correctly classified.
True Positive (TN) is the number of Hepatitis that LIVE and that are correctly classified.
False Negative (FN) is the number of Hepatitis which Die and that are classified as LIVE.
False Positive (FP) is the number of Hepatitis that LIVE and that are classified as Die.
5.2 Results of Classifiers Based on RFE with t-SNE and PCA Methods
This section applied five ML methods to diagnose the hepatitis dataset. The hyper-parameters and weights of all algorithms were tuned to reduce function loss and produce optimal networks capable of high diagnostic performance. The classifiers were fed with the data set after arranging the most vital features, and each feature provided its percentage of contribution to diagnosing hepatitis by the RFE algorithm. The t-SNE and PCA algorithms reduced the data set dimensions by selecting important features. Applying RFE with t-SNE algorithms and RFE with PCA algorithms in a dataset for early diagnosis of hepatitis is of significant importance.
Using RFE with t-SNE and RFE with PCA in hepatitis diagnosis creates a comprehensive data mining pipeline with the following benefits: The RFE prioritizes the features and their correlation with the inflammatory hepatitis disease features in the dataset. The t-SNE and PCA methods then reduced the feature of irrelevant information, making it easier to identify patterns and clusters related to different hepatitis cases. The combination of RFE with t-SNE and RFE with PCA helps classification algorithms make informed decisions based on clear and interpretable insights from the data. Then the data set was divided into 80% for training and 20% for testing. Table 7 describes the performance of the classifiers on the data set during the training and testing phases.

First, when feeding the classifiers with the engineering features of the RFE with the t-SNE method, the classifiers during the training and testing phases reached the following results:
During the training phase, the classifiers KNN, SVM, ANN, DT, and RF obtained an accuracy of 92.41%, 93.35%, 92.52%, 92.85%, and 94.2%, respectively. Precision of 100%, 96.28%, 97.2%, 94.64%, and 95.46%, respectively. Recall of 91.26%, 93.85%, 95%, 96.29%, and 98.85%, respectively. AUC of 88.25%, 91.15%, 89.1%, 92.8%, and 89.2%, respectively. While during the testing phase, the classifiers achieved an accuracy of 91.3%, 91.87%, 90.1%, 91.56% and 92.11%, respectively. Precision of 100%, 95.84%, 94.19%, 91.37% and 94.5%. Recall of 90.85%, 91.26%, 92.38%, 94.1% and 96.55%, respectively. AUC of 84.14%, 87.1%, 83.12%, 87.15%, and 86.7%, respectively.
Second, when feeding the classifiers with the engineering features of the RFE with the PCA method, the classifiers during the training and testing phases reached the following results:
During the training phase, the classifiers KNN, SVM, ANN, DT, and RF obtained an accuracy of 91.23%, 94.15%, 95.76%, 94.96%, and 97.18%, respectively. Precision of 97.65%, 98.2%, 98.18%, 97.36%, and 96.72%, respectively. Recall of 90.93%, 95.28%, 97.64%, 96.47%, and 97.29%, respectively. AUC of 82.95%, 93.83%, 91.29%, 90.91%, and 94.2%, respectively. While during the testing phase, the classifiers achieved an accuracy of 90.38%, 93.1%, 94.62%, 93.86% and 96.31%, respectively. Precision of 95.98%, 96.87%, 97.34%, 95.1% and 95.23%. Recall of 88.75%, 93.72%, 95.31%, 94.88% and 97.11%, respectively. AUC of 81.13%, 91.22%, 88.95%, 89.74%, and 92.67%, respectively.
Fig. 4 displays the visualization of the performance of the classifiers on the hepatitis data set during the training and testing phases.

Figure 4: Displaying the performance using classifiers with RFE and t-SNE methods
5.3 Results of Classifiers Based on SelectKBest with t-SNE and PCA Methods
This section applies the same classification algorithms as the previous section, with the same parameters and hyper-weights tuning to reduce the loss of functionality. Thus, we have obtained perfect classifiers with a superior ability to diagnose hepatitis. After processing, the classifiers were fed a dataset that estimated the contribution percentage of each feature by the SelectKBest function with the statistical function Chi-2. The t-SNE and PCA algorithms reduced the data set dimensions by selecting important features. Applying SelectKBest with t-SNE algorithms and SelectKBest with PCA algorithms in a dataset for early diagnosis of hepatitis is of significant importance.
Using SelectKBest with t-SNE and SelectKBest with PCA in hepatitis diagnosis creates a comprehensive data mining pipeline with the following benefits: The SelectKBest prioritizes the features and their correlation with the inflammatory hepatitis disease features in the dataset. The t-SNE and PCA methods then reduced the feature of irrelevant information, making it easier to identify patterns and clusters related to different hepatitis cases. The combination of SelectKBest with t-SNE and SelectKBest with PCA helps classification algorithms make informed decisions based on clear and interpretable insights from the data. Then the data set was divided into 80% for training and 20% for testing. All classification algorithms achieved superior results for diagnosing the hepatitis dataset. Table 8 shows the performance of the proposed algorithm during the training and testing phases.
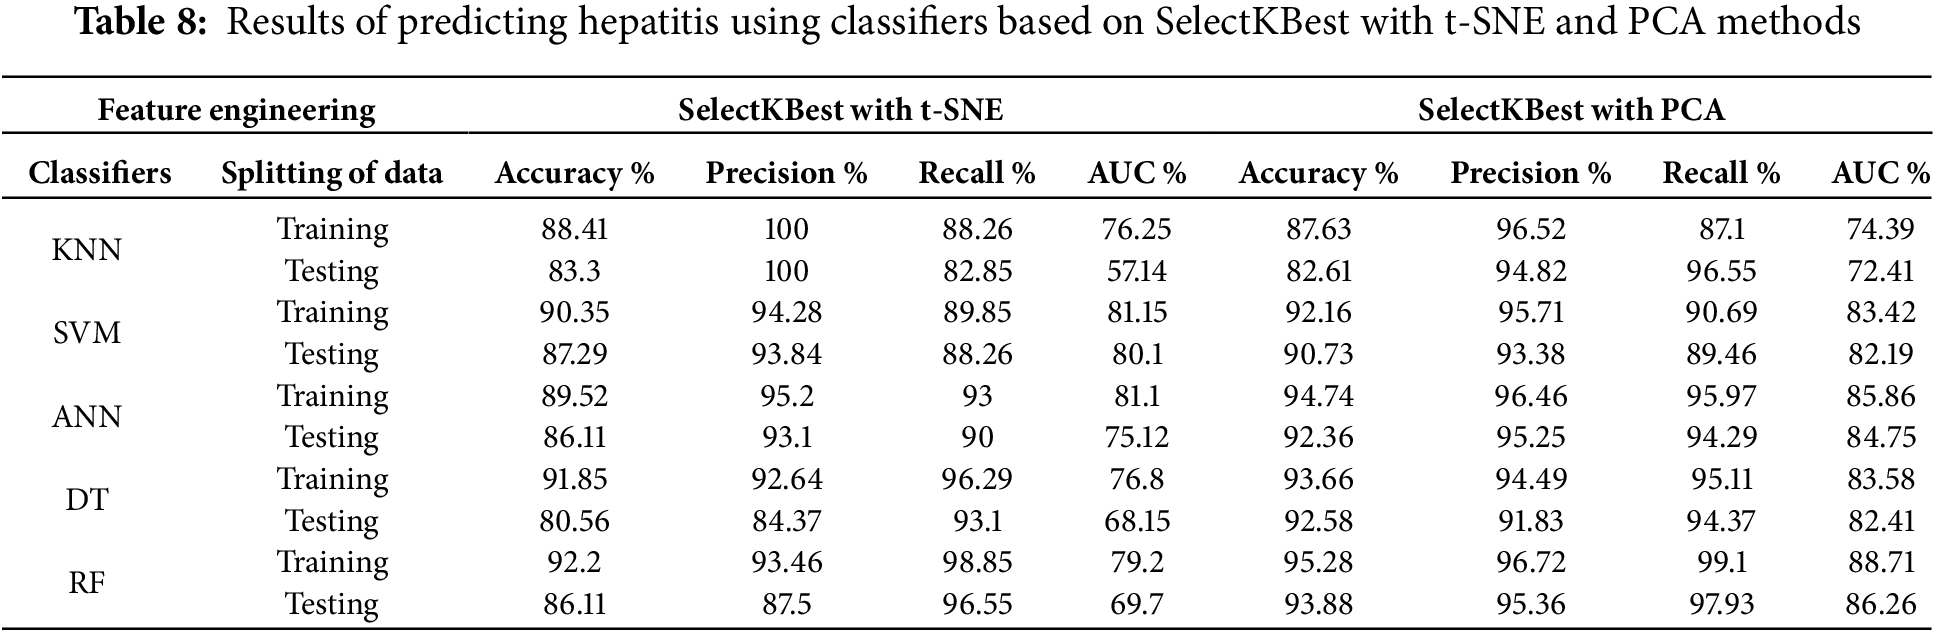
First, when feeding the classifiers with the engineering features of the SelectKBest with the t-SNE method, the classifiers during the training and testing phases reached the following results:
During the training phase, the KNN, SVM, ANN, DT, and RF classifiers had an Accuracy of 88.41%, 90.35%, 89.52%, 91.85%, and 92.2%, respectively. Precision of 99.84%, 94.28%, 95.2%, 92.64%, and 93.46%, respectively. Recall of 88.26%, 89.85%, 93%, 95.87%, and 98.51%, respectively. AUC of 76.25%, 81.15%, 81.1%, 76.8%, and 79.2%, respectively. At the same time, the classifiers during the testing phase achieved Accuracy of 83.3%, 87.29%, 86.11%, 80.56%, and 86.11%, respectively. The precision of 99.52%, 93.84%, 93.1%, 84.37% and 87.5%. Recall of 82.85%, 88.26%, 90%, 93.1%, and 96.22%, respectively. AUC of 57.14%, 80.1%, 75.12%, 68.15%, and 69.7%, respectively.
Second, when feeding the classifiers with the engineering features of the SelectKBest with PCA method, the classifiers during the training and testing phases reached the following results:
During the training phase, the KNN, SVM, ANN, DT, and RF classifiers had an Accuracy of 87.63%, 92.16%, 94.74%, 93.66%, and 95.28%, respectively. Precision of 96.52%, 95.71%, 96.46%, 94.49%, and 96.72%, respectively. Recall of 87.1%, 90.69%, 95.97%, 95.11%, and 99.1%, respectively. AUC of 74.39%, 83.42%, 85.86%, 83.58%, and 88.71%, respectively. At the same time, the classifiers during the testing phase achieved Accuracy of 82.61%, 90.73%, 92.36%, 92.58%, and 93.88%, respectively. The precision of 94.82%, 93.38%, 95.25%, 91.83% and 95.36%. Recall of 96.55%, 89.46%, 94.29%, 94.37%, and 97.93%, respectively. AUC of 72.41%, 82.19%, 84.75%, 82.71%, and 86.26%, respectively.
Fig. 5 displays a visualization of the performance of the classifiers on the hepatitis data set during the training and testing phases.

Figure 5: Displaying the performance using classifiers with SelectKBest and t-SNE methods
6 Discussion and Comparison of the Performance
In this section, we present the comprehensive evaluation of ML methods applied to the hepatitis dataset, including comparing the proposed systems’ performance with existing systems. The dataset underwent several preprocessing steps, starting with removing outliers and replacing missing values, followed by normalization to ensure standardized features. Due to the class imbalance in the dataset, SMOTE was employed to balance the data. To identify the most relevant features for diagnosing hepatitis, two feature ranking methods were utilized: the RFE algorithm and the SelectKBest method with the statistical function Chi-2.
The data set was fed to the t-SNE and PCA algorithms to select the most important features. Then it is fed to five classifiers: KNN, SVM, ANN, DT, and RF. All classifiers were applied with two feature engineering methods: (1) using the RFE method with t-SNE and PCA algorithms and (2) using the SelectKBest method with t-SNE and PCA algorithms.
RFE method with t-SNE algorithm and RFE method with PCA algorithms: The RFE method is used to evaluate features and their association with hepatitis. Then t-SNE or PCA algorithms are used to reduce the dimensionality of the data. The refined features are then fed into the five classifiers to perform classification.
SelectKBest method with t-SNE algorithm and SelectKBest method with PCA algorithms: SelectKBest method is used to evaluate the features of the hepatitis dataset. Then t-SNE or PCA algorithms are used to reduce the dimensionality of the data. The refined features are then fed into the five classifiers to perform classification.
The results of the study showed that both methods perform accurately in diagnosing hepatitis. However, the performance of the RFE method with the t-SNE algorithm is slightly better than the SelectKBest method with the PCA algorithm. The RFE method with the t-SNE algorithm achieved an accuracy of 92.41% on the training data and 91.3% on the test data, while the SelectKBest method with the PCA algorithm achieved an accuracy of 91.23% on the training data and 90.38% on the test data.
The performance of classifiers using the RFE method with PCA was better than the performance of classifiers using other feature engineering methods. The RF algorithm achieved an accuracy of 97.18% and 96.31% during the training and testing phases, respectively. In addition to the accuracy, the paper also reports the precision, recall, and AUC (area under the ROC curve) for each method. Precision, recall and AUC measure how well a classifier distinguishes between positive and negative examples. The higher the precision, recall, and AUC, the better the classifier performs. The paper results show that the RFE method with t-SNE and PCA algorithms performs better than the SelectKBest method with PCA and t-SNE algorithms. This supports the RFE in identifying the features most relevant to the classification task. The results revealed that all algorithms demonstrated superior performance. Notably, the classifiers using the dataset processed by RFE and PCA outperformed those with the dataset processed through SelectKBest with t-SNE and SelectKBest with PCA. During the testing phase, the accuracy, precision, recall, and AUC scores for each classifier.
When classifiers imputation was applied: The KNN achieved an accuracy of 85.3%, Precision of 93.8%, recall of 83.9%, and AUC of 77.8%. The SVM achieved an accuracy of 86.8%, precision of 90.2%, recall of 87.6%, and AUC of 81.5%. Similarly, the ANN reached an accuracy of 85.1%, precision of 91.9%, recall of 88.6% and AUC of 77.5%. The RF accuracy of 88.4%, precision of 92.1%, recall of 92.1% and AUC of 81.6%. These findings emphasize the classifiers’ sensitivity to variations in data imputation methods and highlight the importance of selecting the most appropriate technique for handling missing values in medical datasets.
We applied the proposed systems to the Hepatitis C Dataset, and the results confirmed the systems’ capability to generalize effectively to new data (Hepatitis C dataset). The Hepatitis C dataset contains demographic information (such as age and sex) and laboratory values of blood donors and patients diagnosed with Hepatitis C. It is sourced from the UCI Machine Learning Repository. The results of all the proposed systems applied to the hepatitis C data set agree well with those applied to the hepatitis data set, ensuring consistency and demonstrating the reliability of the methods. Table 9 includes these results. These results demonstrate the ability of the proposed systems to generalize effectively to diverse datasets and provide further evidence of their reliability.

Table 10 describes the evaluation of the performance of the proposed classifiers with the performance of the classifiers of previous studies through the criteria of accuracy, Precision, Recall, and AUC, while the previous studies were evaluated by some criteria. We note the superiority of the proposed system over all relevant studies. All the systems of the previous studies achieved an accuracy ranging between 66.2% and 89.58%, while our proposed system achieved an accuracy of 94.2% during the training phase and 92.11% during the testing phase. As for Precision criteria, previous studies reached a rate of between 66.3% and 81.8%, while our system reached a rate of 95.46% during the training phase and 94.5% during the testing phase. All previous studies achieved Recall (sensitivity) with a rate ranging between 68.7% and 85.71%, while our system achieved a rate of 98.85% and 96.55% during the training and testing phases, respectively. Also note the superiority of our system about the standard AUC, as our system achieved a percentage of 89.2% and 86.7% during the training and testing phases, respectively.

The literature review in Section 2 revealed a scientific gap concerning the processing of certain features. This study aimed to address the limitations of previous research by considering the features in two distinct ways: utilizing the RFE method with t-SNE and PCA algorithms and employing the SelectKBest method with t-SNE and PCA algorithms. As a result, the proposed methods yielded superior outcomes compared to the approaches used in previous studies.
From an ethical attitude, patient information, privateness, and knowledgeable consent are paramount. The dataset used in this study was anonymized and sourced from public repositories to ensure compliance with ethical requirements. In scientific settings, adopting such systems would require adherence to stringent statistics protection regulations to protect sensitive affected person records. Integrating these structures into practice could necessitate steady and obvious data managing protocols. Ethically, it’s critical to understand that such systems are decision-support tools, no longer replacements for clinical judgment. The model aims to enhance physician knowledge by identifying high-risk cases and important patterns that may be overlooked.
Feature selection is critical in improving the accuracy and interpretability of ML models used for hepatitis diagnosis. Several methods exist for selecting relevant features, including RFE and SelectKBest, often combined with dimensionality reduction techniques such as t-SNE and PCA. This study compared different feature selection approaches and evaluated their effectiveness based on multiple classification algorithms. RFE with t-SNE and PCA: The RFE algorithm ranks features based on their importance in hepatitis diagnosis. Subsequently, t-SNE and PCA were applied to reduce dimensionality while retaining important information. Classifiers such as KNN, SVM, ANN, DT, and RF demonstrated high performance, with RF achieving the highest accuracies of 92.11% (testing) and 94.2% (training) using RFE with t-SNE. RFE with PCA further improved the classification accuracy, particularly for the RF classifier (96.31% in testing and 97.18% in training). SelectKBest with t-SNE and PCA: SelectKBest (using Chi-2) prioritizes features based on their statistical significance. The application of t-SNE and PCA further optimizes the feature representation. RF again achieved the best performance (95.28% training and 86.11% testing) with SelectKBest + PCA. However, the SelectKBest method generally showed lower AUC values than the RFE-based methods, indicating a slightly weaker discriminatory power.
Challenges and Opportunities in Integrating AI-Based Diagnostic Tools into Clinical Practice for Hepatitis Diagnosis.
Challenges:
1. Data Quality and Availability: AI models rely on high-quality datasets. However, clinical datasets often contain lacking values, outliers, and imbalances, which affect the system’s overall performance. This study addressed these problems by employing preprocessing steps, including outlier removal, missing value imputation, and balancing dataset via SMOTE.
2. Feature Selection and Dimensionality Reduction: Selecting the essential features is crucial for system performance. Our study compared RFE with t-SNE and PCA against SelectKBest with t-SNE and PCA, thereby demonstrating the superiority of RFE in identifying discriminative features. However, in clinical practice, ensuring the interpretability and medical relevance of the chosen features remains essential.
3. Ethical and Privacy Concerns: Patient privacy and data are vital in AI-driven diagnostics. This paper used anonymized data from public repositories emphasizes the need for compliance with ethical standards and statistics-safety regulations in medical settings.
4. Integration into Clinical Workflow: AI systems should integrate into existing healthcare systems without disrupting workflows. This requires collaboration among AI researchers, clinicians, and IT experts.
Opportunities:
1. Improved Diagnostic Accuracy: Our proposed machine, particularly RF with RFE and PCA, achieved a higher accuracy of 96.31% than previous studies (accuracy variety: 66.2%–89.58%). This demonstrates AI’s capacity to improve the early and precise diagnosis of hepatitis.
2. Generalization Across Datasets: The study established its strategies on the Hepatitis dataset, reaching regular effects. This highlights AI’s capacity to be applied across diverse datasets to improve diagnostic reliability.
3. Early Detection and Decision Support: AI models can help physicians by selecting high-danger instances, allowing for earlier intervention and better consequences for affected people.
The liver is one of the largest organs in the body and works to regulate the chemicals in the blood, eliminate toxins in the blood, and perform many important functions. Hepatitis is one of the obstacles to the normal functioning of the liver, so early diagnosis of hepatitis has an important role in recovery and living. The diagnosis of the liver is made through a blood test and some factors and stored in electronic records. ML methods play an important role in the early diagnosis of hepatitis. In this study, hepatitis was diagnosed through the hepatitis data set; the data set was divided into 80% for training and 20% for testing. The missing values in the data set were processed and replaced with the meaning of the neighboring values, and outliers were removed. The data set was subjected to the RFE algorithm and the SelectKBest function with the statistical function Chi-2 for assigning the contribution of each feature with the target feature. The t-SNE and PCA algorithms selected the important features that strongly correlate with inflammatory hepatitis disease. The processed features were fed into five classification algorithms: KNN, SVM, ANN, DT, and RF. All algorithms achieved superior results in the diagnosis of hepatitis. When using the dataset processed by RFE and PCA methods, the RF achieved accuracy, Precision, Recall, and AUC of 97.18%, 96.72%, 97.29%, and 94.2%, respectively, during the training phase. During the testing phase, it reached accuracy, Precision, Recall, and AUC by 96.31%, 95.23%, 97.11%, and 92.67%, respectively.
Limitations were the ability of the proposed systems to generalize to external datasets. This limitation was resolved by evaluating the proposed methods on the Hepatitis C dataset, demonstrating that the systems can effectively generalize their performance beyond the original dataset.
Acknowledgement: We would like to acknowledge the Scientific Research Deanship at the University of Ha’il, Saudi Arabia, for funding this research through project number GR-24 009.
Funding Statement: This research has been funded by Scientific Research Deanship at University of Ha’il, Saudi Arabia, through project number GR-24 009.
Author Contributions: The authors confirm contribution to the paper as follows: study conception and design: Mohamed A.G. Hazber, Ebrahim Mohammed Senan; software: Hezam Saud Alrashidi, Mohamed A.G. Hazber, Ebrahim Mohammed Senan; data collection: Hezam Saud Alrashidi; analysis and interpretation of results: Ebrahim Mohammed Senan, Mohamed A.G. Hazber, Hezam Saud Alrashidi; draft manuscript preparation: Mohamed A.G. Hazber, Ebrahim Mohammed Senan. All authors reviewed the results and approved the final version of the manuscript.
Availability of Data and Materials: Data evaluating the performance of the proposed models were obtained from the publicly available online dataset at: https://archive.ics.uci.edu/ml/datasets/hepatitis (accessed on 25 March 2024).
Ethics Approval: The dataset in this study is publicly available and represents laboratory tests without disclosing the identity of the patients.
Conflicts of Interest: The authors declare no conflicts of interest to report regarding the present study.
References
1. Bahrulolum H, Tarrahimofrad H, Rouzbahani FN, Nooraei S, Sameh MM, Hajizade A, et al. Potential of CRISPR/Cas system as emerging tools in the detection of viral hepatitis infection. Virol J. 2023;20(1):91. doi:10.1186/s12985-023-02048-5. [Google Scholar] [CrossRef]
2. Anurag KS, Mukherjee S, Kumar S, Garg A, Saha S, Dubey BA. A mini review on pancreatin: prodigious focus on hepatic ischemia-reperfusion injury. Int J Sci Healthc Res. 2023;8(1):273–81. doi:10.52403/ijshr.20230139. [Google Scholar] [CrossRef]
3. Covelli C, Sacchi D, Sarcognato S, Cazzagon N, Grillo F, Baciorri F, et al. Pathology of autoimmune hepatitis. Pathologica. 2021;113(3):185–19. doi:10.32074/1591-951X-241. [Google Scholar] [CrossRef]
4. Cheemerla S, Balakrishnan M. Global epidemiology of chronic liver disease. Clin Liver Dis. 2021;17(5):365. doi:10.1002/cld.1061. [Google Scholar] [CrossRef]
5. Uwishema O, Mahmoud A, Wellington J, Mohammed SM, Yadav T, Derbieh M, et al. A review on acute, severe hepatitis of unknown origin in children: a call for concern. Ann Med Surg. 2022;81:104457. doi:10.1016/J.AMSU.2022.104457. [Google Scholar] [CrossRef]
6. Kristanti RA, Hadibarata T, Syafrudin M, Yılmaz M, Abdullah S. Microbiological contaminants in drinking water: current status and challenges. Water Air Soil Pollut. 2022;233(8):299. doi:10.1007/S11270-022-05698-3/FIGURES/4. [Google Scholar] [CrossRef]
7. Torre P, Aglitti A, Masarone M, Persico M. Viral hepatitis: milestones, unresolved issues, and future goals. World J Gastroenterol. 2021;27(28):4603. doi:10.3748/WJG.V27.I28.460. [Google Scholar] [CrossRef]
8. Mekonnen BD. Prevalence of hepatitis C virus infection among pregnant women in Ethiopia: a sys-tematic review and meta-analysis. Adv Prev Med. 2021;2021(3):1–8. doi:10.1155/2021/6615008. [Google Scholar] [CrossRef]
9. Chalasani NP, Porter K, Bhattacharya A, Book AJ, Neis BM, Xiong KM, et al. Validation of a novel multitarget blood test shows high sensitivity to detect early stage hepatocellular carcinoma. Clin Gas-Troenterology Hepatol. 2022;20(1):173–82. doi:10.1016/J.CGH.2021.08.010. [Google Scholar] [CrossRef]
10. Ekwonwune EN, Ubochi CI, Duroha AE. Data mining as a technique for healthcare approach. Interna-Tional J Commun Netw Syst Sci. 2022;15(9):149–65. doi:10.4236/IJCNS.2022.159011. [Google Scholar] [CrossRef]
11. Chen H, Sung JJ. Potentials of AI in medical image analysis in gastroenterology and hepatology. J Gastroenterol Hepatol. 2021;36(1):31–8. doi:10.1111/JGH.15327. [Google Scholar] [CrossRef]
12. Wu JG, Yan Y, Zhang DX, Liu BW, Zheng QB, Xie XL, et al. Machine learning for structure determination in single-particle cryo-electron microscopy: a systematic review. IEEE Trans Neural Netw Learn Syst. 2021;33(2):452–72. doi:10.1109/TNNLS.2021.3131325. [Google Scholar] [CrossRef]
13. Javaid M, Haleem A, Singh RP, Suman R, Rab S. Significance of machine learning in healthcare: features, pillars and applications. Int J Intell Netw. 2022;3(11):58–73. doi:10.1016/j.ijin.2022.05.002. [Google Scholar] [CrossRef]
14. Panigutti C, Beretta A, Giannotti F, Pedreschi D. Understanding the impact of explanations on advice-taking: a user study for AI-based clinical Decision Support Systems. In: Proceedings of the 2022 CHI Conference on Human Factors in Computing Systems; 2022 Apr 29–May 5; New Orleans, LA, USA. Now York, NY, USA: Association for Computing Machinery; 2022. doi:10.1145/3491102.3502104. [Google Scholar] [CrossRef]
15. Shegai PV, Shatalov PA, Zabolotneva AA, Falaleeva NA, Ivanov SA, Kaprin AD. Challenges faced by clinicians in the personalized treatment planning: a literature review and the first results of the Russian National Cancer Program. Crit Care Res Pract. 2021;2021:6649771–7. doi:10.1155/2021/6649771. [Google Scholar] [CrossRef]
16. Kaya Y, Uyar M. A hybrid decision support system based on rough set and extreme learning machine for diagnosis of hepatitis disease. Appl Soft Comput. 2013;13(8):3429–38. doi:10.1016/j.asoc.2013.03.008. [Google Scholar] [CrossRef]
17. Sartakhti JS, Zangooei MH, Mozafari K. Hepatitis disease diagnosis using a novel hybrid method based on support vector machine and simulated annealing (SVM-SA). Comput Methods Programs Biomed. 2012;108(2):570–9. doi:10.1016/j.cmpb.2011.08.003. [Google Scholar] [CrossRef]
18. Chen HL, Liu DY, Yang B, Liu J, Wang G. A new hybrid method based on local fisher discriminant analysis and support vector machines for hepatitis disease diagnosis. Expert Syst Appl. 2011;38(9):11796–803. doi:10.1016/j.eswa.2011.03.066. [Google Scholar] [CrossRef]
19. Çalişir D, Dogantekin E. A new intelligent hepatitis diagnosis system: PCA-LSSVM. Expert Syst Appl. 2011;38(8):10705–8. doi:10.1016/j.eswa.2011.01.014. [Google Scholar] [CrossRef]
20. Dogantekin E, Dogantekin A, Avci D. Automatic hepatitis diagnosis system based on linear discriminant analysis and adaptive network based on fuzzy inference system. Expert Syst Appl. 2009;36(8):11282–6. doi:10.1016/j.eswa.2009.03.021. [Google Scholar] [CrossRef]
21. Uzer MS, Yilmaz N, Inan O. Feature selection method based on artificial bee colony algorithm and support vector machines for medical datasets classification. Sci World J. 2013;2013(1):419187. doi:10.1155/2013/419187. [Google Scholar] [CrossRef]
22. Ozyilmaz L, Yildirim T. Artificial neural networks for diagnosis of hepatitis disease. In: Proceedings of the In-ternational Joint Conference on Neural Networks; 2003 Jul 20–24; Portland, OR, USA. p. 586–9. doi:10.1109/IJCNN.2003.122342. [Google Scholar] [CrossRef]
23. Anter AM, Ali M. Feature selection strategy based on hybrid crow search optimization algorithm integrated with chaos theory and fuzzy c-means algorithm for medical diagnosis problems. Soft Comput. 2020;24(3):1565–84. doi:10.1007/s00500-019-03988-3. [Google Scholar] [CrossRef]
24. Janghel RR, Shukla A, Verma K. Soft computing based expert system for Hepatitis and liver disorders. In: 2016 IEEE International Conference on Engineering and Technology (ICETECH); 2016 Mar 17–18; Coimbatore, India. p. 740–4. doi:10.1109/ICETECH.2016.7569346. [Google Scholar] [CrossRef]
25. Avci D. An automatic diagnosis system for hepatitis diseases based on genetic wavelet kernel extreme learning machine. J Electr Eng Technol. 2016;11(4):993–1002. doi:10.5370/JEET.2016.11.4.993. [Google Scholar] [CrossRef]
26. Madhu G, Bharadwaj BL, Nagachandrika G, Vardhan KS. A novel algorithm for missing data imputation on machine learning. In: 2019 International Conference on Smart Systems and Inventive Technology (ICSSIT); 2019 Nov 27–29; Tirunelveli, India. p. 173–7. doi:10.1109/ICSSIT46314.2019.898789. [Google Scholar] [CrossRef]
27. Bascil MS. Temurtas FA study on hepatitis disease diagnosis using multilayer neural network with Levenberg Marquardt training algorithm. J Med Syst. 2011;35(3):433–6. doi:10.1007/s10916-009-9378-2. [Google Scholar] [CrossRef]
28. Gong J, Kim H. RHSBoost: improving classification performance in imbalance data. Comput Stat Data Anal. 2017;111(2–3):1–13. doi:10.1016/j.csda.2017.01.005. [Google Scholar] [CrossRef]
29. Xiao W, Zhang J, Li Y, Zhang S, Yang W. Class-specific cost regulation extreme learning machine for im-balanced classification. Neurocomputing. 2017;261(1):70–82. doi:10.1016/j.neucom.2016.09.120. [Google Scholar] [CrossRef]
30. Demidova L, Klyueva I. SVM classification: optimization with the SMOTE algorithm for the class imbalance problem. In: 2017 6th Mediterranean Conference on Embedded Computing (MECO); 2017 Jun 11–15; Bar, Montenegro: IEEE; 2017. p. 1–4. doi:10.1109/MECO.2017.7977136. [Google Scholar] [CrossRef]
31. Hepatitis—UCI Machine Learning Repository [Internet]. Irvine, CA, USA. [cited 2022 Dec 17]. Available from: https://archive.ics.uci.edu/dataset/46/hepatitis. [Google Scholar]
32. Alizargar A, Chang YL, Tan TH. Performance comparison of machine learning approaches on hepatitis C prediction employing data mining techniques. Bioengineering. 2023;10(4):481. doi:10.3390/bioengineering10040481. [Google Scholar] [CrossRef]
33. Purwar A, Singh SK. Hybrid prediction model with missing value imputation for medical data. Expert Syst Appl. 2015;42(13):5621–31. doi:10.1016/j.eswa.2015.02.050. [Google Scholar] [CrossRef]
34. Gao B, Wu TC, Lang S, Jiang L, Duan Y, Fouts DE, et al. Machine learning applied to omics datasets predicts mortality in patients with alcoholic hepatitis. Metabolites. 2022;12(1):41. doi:10.3390/metabo12010041. [Google Scholar] [CrossRef]
35. Obaido G, Ogbuokiri B, Swart TG, Ayawei N, Kasongo SM, Aruleba K, et al. An interpretable machine learning approach for hepatitis B diagnosis. Appl Sci. 2022;12(21):11127. doi:10.3390/app122111127. [Google Scholar] [CrossRef]
36. Alotaibi A, Alnajrani L, Alsheikh N, Alanazy A, Alshammasi S, Almusairii M, et al. Explainable ensemble-based machine learning models for detecting the presence of cirrhosis in hepatitis C patients. Computation. 2023;11(6):104. doi:10.3390/computation11060104. [Google Scholar] [CrossRef]
37. Singh V, Asari VK, Rajasekaran R. A deep neural network for early detection and prediction of chronic kidney disease. Diagnostics. 2022;12(1):116. doi:10.3390/diagnostics12010116. [Google Scholar] [CrossRef]
38. Elaziz MA, Ewees AA, Al-qaness MAA, Alshathri S, Ibrahim RA. Feature selection for high dimensional datasets based on quantum-based dwarf mongoose optimization. Mathematics. 2022;10(23):4565. doi:10.3390/math10234565. [Google Scholar] [CrossRef]
39. Anđelić N, Lorencin I, Šegota SB, Car Z. The development of symbolic expressions for the detection of hepatitis C patients and the disease progression from blood parameters using genetic programming-symbolic classification algorithm. Appl Sci. 2023;13(1):574. doi:10.3390/app13010574. [Google Scholar] [CrossRef]
40. Ali AM, Hassan MR, Aburub F, Alauthman M, Aldweesh A, Al-Qerem A, et al. Explainable machine learning approach for hepatitis C diagnosis using SFS feature selection. Machines. 2023;11(3):391. doi:10.3390/machines11030391. [Google Scholar] [CrossRef]
41. Li Y, Qi D, Zhu B, Ye X. Analysis of m6A RNA methylation-related genes in liver hepatocellular carcinoma and their correlation with survival. Int J Mol Sci. 2021;22(3):1474. doi:10.3390/ijms22031474. [Google Scholar] [CrossRef]
42. Senan EM, Al-Adhaileh MH, Alsaade FW, Aldhyani TH, Alqarni AA, Alsharif N, et al. Diagnosis of chronic kidney disease using effective classification algorithms and recursive feature elimination techniques. J Healthc Eng. 2021;2021(2):1004767. doi:10.1155/2021/1004767. [Google Scholar] [CrossRef]
43. Vekariya V, Passi K, Jain CK. Predicting liver cancer on epigenomics data using machine learning. Front Bioinform. 2022;2:954529. doi:10.3389/fbinf.2022.954529. [Google Scholar] [CrossRef]
44. Kamarajugadda R, Rayala PD, Gunti GS, Vegineti DT. An effective methodology to forecast the progression of liver disease and its stages using ensemble technique. In: International Conference on Innovative Computing and Communication; 2023 Feb 17–18; New Delhi, India. Singapore: Springer Nature. p. 255–84. [Google Scholar]
45. Alalayah KM, Senan EM, Atlam HF, Ahmed IA, Shatnawi HSA. Automatic and early detection of par-kinson’s disease by analyzing acoustic signals using classification algorithms based on recursive feature elimination method. Diagnostics. 2023;13(11):1924. doi:10.3390/diagnostics13111924. [Google Scholar] [CrossRef]
46. Alalayah KM, Senan EM, Atlam HF, Ahmed IA, Shatnawi HSA. Effective early detection of epileptic seizures through EEG signals using classification algorithms based on t-distributed stochastic neighbor embedding and K-means. Diagnostics. 2023;13(11):1957. doi:10.3390/diagnostics13111957. [Google Scholar] [CrossRef]
47. Chumachenko D, Meniailov I, Bazilevych K, Chumachenko T, Yakovlev S. Investigation of statistical machine learning models for COVID-19 epidemic process simulation: random forest K-nearest neighbors gradient boosting. Computation. 2022;10(6):86. doi:10.3390/computation10060086. [Google Scholar] [CrossRef]
48. Mohammed BA, Senan EM, Rassem TH, Makbol NM, Alanazi AA, Al-Mekhlafi ZG, et al. Multi-method analysis of medical records and MRI images for early diagnosis of dementia and Alzheimer’s disease based on deep learning and hybrid methods. Electronics. 2021;21(10):2860. doi:10.3390/electronics10222860. [Google Scholar] [CrossRef]
49. Maqsood S, Damaševičius R, Maskeliūnas R. Multi-modal brain tumor detection using deep neural net-work and multiclass SVM. Medicina. 2022;58(8):1090. doi:10.3390/medicina58081090. [Google Scholar] [CrossRef]
50. Al-Jabbar M, Alshahrani M, Senan EM, Ahmed IA. Multi-method diagnosis of histopathological images for early detection of breast cancer based on hybrid and deep learning. Mathematics. 2023;11(6):1429. doi:10.3390/math11061429. [Google Scholar] [CrossRef]
51. Zhang S, Jiang C, Jiang L, Chen H, Huang J, Gao X, et al. Construction of a diagnostic model for hepa-titis B-related hepatocellular carcinoma using machine learning and artificial neural networks and revealing the correlation by immunoassay. Tumour Virus Res. 2023;16:200271. doi:10.1016/j.tvr.2023.200271. [Google Scholar] [CrossRef]
52. Ahmed IA, Senan EM, Shatnawi HSA, Alkhraisha ZM, Al-Azzam MMA. Multi-models of analyzing dermoscopy images for early detection of multi-class skin lesions based on fused features. Processes. 2023;11(3):910. doi:10.3390/pr11030910. [Google Scholar] [CrossRef]
53. Hamdi M, Senan EM, Jadhav ME, Olayah F, Awaji B, Alalayah KM. Hybrid models based on fusion features of a CNN and handcrafted features for accurate histopathological image analysis for diagnosing malignant lymphomas. Diagnostics. 2023;13(13):2258. doi:10.3390/diagnostics13132258. [Google Scholar] [CrossRef]
54. Makino K, Lee S, Bae S, Chiba I, Harada K, Katayama O, et al. Simplified decision-tree algorithm to predict falls for community-dwelling older adults. J Clin Med. 2021;10(21):5184. doi:10.3390/jcm10215184. [Google Scholar] [CrossRef]
55. Ahmed IA, Senan EM, Shatnawi HSA, Alkhraisha ZM, Al-Azzam MMA. Hybrid techniques for the diagnosis of acute lymphoblastic leukemia based on fusion of CNN features. Diagnostics. 2023;13(6):1026. doi:10.3390/diagnostics13061026. [Google Scholar] [CrossRef]
56. Senan EM, Abunadi I, Jadhav ME, Fati SM. Score and correlation coefficient-based feature selection for predicting heart failure diagnosis by using machine learning algorithms. Comput Math Methods Med. 2021;2021(1):8500314. doi:10.1155/2021/8500314. [Google Scholar] [CrossRef]
57. Qureshi MSG, Khan B, Khan NM. Intelligence based hepatitis diagnosis: an empirical study. Univ Swabi J. 2018;2(3):8–12. [Google Scholar]
58. Bhargav KS, Thota DSSB, Kumari TD, Vikas B. Application of machine learning classification algorithms on hepatitis dataset. Int J Appl Eng Res. 2018;13(16):12732–7. [Google Scholar]
59. Yarasuri VK, Indukuri GK, Nair AK. Prediction of hepatitis disease using machine learning technique. In: 2019 Third International Conference on I-SMAC (IoT in Social Mobile, Analytics and Cloud) (I-SMAC); 2019 Dec 12–14; Padampur, India. p. 265–9. doi:10.1109/I-SMAC47947.2019.9032585. [Google Scholar] [CrossRef]
60. El Houby EMF. Analysis of associative classification for prediction of HCV response to treatment. Int J Comput Appl. 2013;975:8887. [Google Scholar]
61. Polat K. Similarity-based attribute weighting methods via clustering algorithms in the classification of imbalanced medical datasets. Neural Comput Appl. 2018;30(3):987–1013. doi:10.1007/s00521-018-3471-8. [Google Scholar] [CrossRef]
Cite This Article
 Copyright © 2025 The Author(s). Published by Tech Science Press.
This work is licensed under a Creative Commons Attribution 4.0 International License , which permits unrestricted use, distribution, and reproduction in any medium, provided the original work is properly cited.
 Downloads
 Citation Tools