
 Submit a Paper
 Propose a Special lssue
 Open Access
ARTICLE
Predictive Analytics for Diabetic Patient Care: Leveraging AI to Forecast Readmission and Hospital Stays
Department of Information Technology, College of Computer, Qassim University, Buraydah, 51452, Saudi Arabia
* Corresponding Author: Saleh Albahli. Email:
(This article belongs to the Special Issue: Exploring the Impact of Artificial Intelligence on Healthcare: Insights into Data Management, Integration, and Ethical Considerations)
Computer Modeling in Engineering & Sciences 2025, 143(1), 1095-1128. https://doi.org/10.32604/cmes.2025.058821
Received 22 September 2024; Accepted 11 March 2025; Issue published 11 April 2025
 View Full Text
 Download PDF
Abstract
Predicting hospital readmission and length of stay (LOS) for diabetic patients is critical for improving healthcare quality, optimizing resource utilization, and reducing costs. This study leverages machine learning algorithms to predict 30-day readmission rates and LOS using a robust dataset comprising over 100,000 patient encounters from 130 hospitals collected over a decade. A comprehensive preprocessing pipeline, including feature selection, data transformation, and class balancing, was implemented to ensure data quality and enhance model performance. Exploratory analysis revealed key patterns, such as the influence of age and the number of diagnoses on readmission rates, guiding the development of predictive models. Rigorous validation strategies, including 5-fold cross-validation and hyperparameter tuning, were employed to ensure model reliability and generalizability. Among the models tested, the Random Forest algorithm demonstrated superior performance, achieving 96% accuracy for predicting readmissions and 87% for LOS prediction. These results underscore the potential of predictive analytics in diabetic patient care, enabling proactive interventions, better resource allocation, and improved clinical outcomes.Keywords
Machine learning has increasingly played a pivotal role in addressing various medical challenges, including the early detection of illnesses, in-hospital mortality prediction, length of hospital stays, and unplanned readmissions, yielding excellent results [1,2]. These machine learning approaches leverage high-dimensional, non-linear interactions among predictive features to make accurate predictions [3].
With the increasing propensity towards technology, the healthcare sector is growing dramatically, and thus the demand for gathering Electronic Health Records (EHRs) is also advantageous [4]. While a plethora of data is being collected, much of it has remained largely unused by researchers and healthcare providers to enhance patient care [1]. If used effectively, this data could assist us not only to deliver better healthcare but also manage finances better, therefore cutting expenses for both hospitals and patients.
As a result, the hospital-intervened health care quality can be evaluated by readmission rates and patient length of stay (LOS) [2]; these two findings are drawing increasing attention with the aging of the population 7. Preventing the inappropriate readmission of patients and managing expenses for patients as well as for hospitals depends on identifying high-risk individuals on readmission [4]. Moreover, precise LOS forecasts allow hospitals to allocate resources—such as bed spaces and laboratory equipment—thus reducing congestion [5].
We remark that whereas many papers have predicted hospital readmissions and LOS using ML approaches, this work includes novel components that distinguish it from earlier studies. First, the study employs a big dataset: over 100,000 diabetic patient contacts from 130 hospitals throughout a decade (1999–2008), allowing for a high level of generalizability across a highly wide spectrum of healthcare systems. Second, the study leverages a broad range of machine learning models, from traditional algorithms (e.g., logistic regression, decision trees) to advanced ensemble approaches (e.g., random forest, XGBoost) and neural nets. Having a wide range of models provides a chance to compare their prediction skills in the context of diabetic patient readmission and LOS. Example 3: Moreover, the study covers detailed hyperparameter optimization and cross-validation procedures to improve model accuracy and durability. Last but not least, feature importance analysis approaches, such as SHAP (SHapley Additive explanations), allow deeper insights into significant predictors; they will increase the interpretability of machine learning models in healthcare situations.
The sooner type 2 diabetes is discovered, the greater your chances of limiting and postponing its emergence. This is performed by supporting dietary practices, exercise, cessation of smoking, and maintenance of healthy body weight. Late diagnosis often makes treatment more difficult and causes lasting damage to organs and tissues, leading to a higher risk of consequences such as heart disease, stroke, and kidney failure. Diabetes can be risky for pregnant women, leading to severe results (including fatal loss), deformities, and perinatal mortality.
This study has two key stakeholders who profit from it, which are patients and healthcare service providers. Patients benefit from going through the constant management of diseases, identifying their problems at earlier stages, and healthcare practitioners understand the demands of their patients through data analytics, minimizing readmissions. Besides saving lives, early detection and treatment minimize expenses for patients and health care providers alike.
In this research, various machine learning models are aiming to predict the short-term (30 days) or long-term (after 30 days) hospital readmission of diabetes patients and estimate the length of the hospital stay. In the healthcare profession, where we cannot miss a person that genuinely has the condition, it makes sense to stress the stronger recall (sensitivity). Hence, the measurements of research relate to recall and accuracy.
RQ1: “Which machine learning model can be used to effectively predict readmission of diabetic patients (i.e., within 30 days) so as to allow health service providers address unplanned readmission and increase operational and cost efficiency”
RQ2: “How do we have a system that can effectively predict how long diabetes patients last in admission so health care workers and the patient can plan treatment and cost”
The aim of this research is to build machine learning models that predict the possibility of hospital readmission in patients with type 2 diabetes within a 30 days period after discharge. The specific objectives are as follows:
1. Train and optimize multiple state-of-the-art machine learning models for optimal binary prediction of readmission.
2. Train and optimize multiple state-of-the-art machine learning multi-class classification models to predict the length of stay when patients of type 2 diabetes are placed on hospital admission.
Hospital readmission occurs when a discharged patient is placed back into hospital admission for the same illness within a short period of time. Considering the fact that the initial hospital admission itself cost money and resources especially for diseases such as diabetes, the readmission will cost likely cost the same or even more which is from all angles a waste of resources considering the fact that the entire admission process has to be repeated, processes such as laboratory tests and scans have to be repeated.
Having a system that could predict the likelihood of readmission for diabetes patient is of paramount importance for both the patients and the hospitals which is why in this work, seven machine learning algorithms are trained so as to find the best algorithm which could effectively predict the likelihood of readmission. With such a system, hospitals could make the right decision on diabetes patients to minimize the expenses for both the hospital and the patients. Also, for hospitals and patients to have proper plan of how to manage hospital admission, the length of stay is a knowledge that should be known. This work studies the factors that affected how long a patient stays in the hospital so it could effectively predict length of stay for future admission, this will help the patients plan their stay and the hospital will have an idea of the likely resources to be consumed by each patient so as to make provision for it. The pipeline foe this work is shown in Fig. 1.

Figure 1: Diabetes diagnosis and readmission risk methodology
In Fig. 1, the workflow begins with the diabetes dataset, which contains essential data on patient encounters, including demographic information, medical history, test results, and treatments. This raw data is initially processed in the Data Preprocessing stage, where the focus is on ensuring data quality and consistency. In Data Cleansing, errors, duplicates, and irrelevant records are removed to create a clean dataset. Missing values, a common issue in medical data, are then addressed through imputation or selective removal, depending on the impact of the missing data on the model’s accuracy. By handling these gaps and inconsistencies early on, the dataset becomes more reliable for the modeling process, reducing potential biases in the predictions.
After preprocessing, the dataset undergoes Data Transformation, where it is optimized for machine learning. Feature Creation involves generating new, meaningful features from existing data to capture additional patterns. Feature Encoding then converts categorical data, like patient gender or diagnosis, into a machine-readable format, such as one-hot encoding. Oversampling (SMOTE) is applied to balance the class distribution, particularly useful for underrepresented categories in the target variable. Feature Selection identifies the most predictive features while discarding less significant ones, and Normalization scales numerical values to a uniform range to prevent any feature from disproportionately affecting model training. In the Modeling stage, several machine learning algorithms—such as Logistic Regression, Random Forest, SVM, and Neural Networks—are trained and tested to determine the most effective model for predicting outcomes. Finally, Evaluation metrics like Accuracy, Precision, Recall, and F1-score assess model performance, ensuring that the chosen model meets the standards required for accurate and actionable predictions in diabetic patient care. This systematic approach, from raw data to evaluated model, is designed to produce reliable, generalizable insights into patient readmission and length of stay.
2 Review of Related Literature
Machine learning in healthcare employs a variety of algorithms and statistical models in the analysis of substantial medical data to predict patient outcomes, disease development, and the use of health services. Among the key theoretical frameworks that underpin this research is supervised learning, where the models are trained on labelled sample data SVNs to predict a targeted outcome of interest. Another vital theoretical framework is ensemble learning, where multiple models are combined to improve performance. In addition, feature selection and dimensionality reduction methods play a huge part in predicting relevant predictors, which is relevant in improving the performance of predictive models in terms of accuracy and interpretability. This theory is relevant in the development of predictive models for hospital readmission and Length of Stay in diabetic patients.
2.2 Key Outcomes of Related Works
Several studies have been conducted over the years based on the application of ML algorithms for the prediction of hospital readmission and LOS of patients based on a range of medical conditions. For instance, a study by Rajkomar et al. [1] used three deep learning neural network architectures to predict inpatient mortality, 30-day readmissions, prolonged LOS, and discharge diagnoses based, which was entirely based on EHR data. The work focused on the scalability of the model. Another study by Raita et al. [3] noted the superior performance of ML models iterating critical care and hospitalization outcomes, which were enrolled by the emergency department.
Frizzell et al. [6] investigated the prediction of all-cause readmissions within 30 days after discharge and demonstrated that machine learning (ML)-based approaches generally outperform traditional statistical methods in terms of discriminatory capacity and clinical utility. Kronzer et al. [7] introduced a cost-sensitive deep learning model designed to address class imbalance in medical datasets, significantly enhancing the performance of readmission prediction. In contrast, Golmohammadi et al. [8] focused on prediction modeling and pattern recognition techniques for hospital readmission, emphasizing the importance of integrating advanced feature selection methods to improve model robustness. Their study highlights the role of data-driven approaches in refining predictive models for patient readmission, aligning with the broader objective of developing reliable hospital readmission prediction systems.
Specifically for diabetes, several studies have applied various machine learning (ML) methods to improve the prediction of readmissions. Bhuvan et al. [9] implemented ML algorithms on public health data to classify high-risk diabetic patients, identifying inpatient visits, discharge disposition, and admission type as significant predictors of readmission. Oh et al. [10] analyzed the relationship between health information technology, length of stay (LOS), and readmission risk, highlighting how electronic health records and predictive analytics can support better clinical decision-making to reduce unnecessary readmissions. Martin et al. [11] examined trends in hospital readmissions following reductions in LOS, revealing that shortened hospital stays might contribute to increased readmission rates, a crucial factor to consider in readmission prediction models. Mingle [12] extended this research by moving beyond HbA1c levels as the primary predictor, emphasizing the role of comprehensive patient data in developing more reliable predictive models for diabetic readmission. Turgeman et al. [13] applied ML techniques to predict hospital LOS at the time of admission, demonstrating that integrating ML-based risk stratification can enhance hospital resource planning and patient management. Furthermore, Hammoudeh et al. [14] leveraged deep learning, particularly convolutional neural networks (CNNs), on large-scale datasets, showing that advanced feature engineering and deep architectures can significantly improve readmission prediction among diabetic patients.
In the area of LOS prediction, Morton et al. [15] compared short- and long-term LOS among diabetic patients based on diagnostic information using multiple linear regression, SVM, multi-task learning and random forests, where the best accuracy of 68% was achieved by SVM+. Alturki et al. [16] presented a random forest model accuracy of 94.8% and SVM AUC of 0.97 that used a framework which integrated an independent feature engineering framework with the ML algorithm, demonstrating great potential of ensemble methods in LOS prediction.
2.3 Advantages and Disadvantages of Existing Studies
Existing studies on predictive analytics in healthcare have demonstrated several notable advantages. A key strength is the diverse application of machine learning algorithms, ranging from traditional models like logistic regression and decision trees to advanced ensemble methods and neural networks. This diversity allows researchers to explore a wide spectrum of techniques, optimizing predictions for different healthcare challenges studies incorporate feature selection methods that enhance model performance by focusing on the most relevant predictors, reducing noise and computational complexity [17,18]. Additionally, methods such as cost-sensitive deep learning have been employed to handle class imbalance issues, which are common in medical datasets, ensuring that minority class predictions are not overlooked [19–21]. Furthermore, scalability remains a key consideration, with studies demonstrating that leveraging large-scale electronic health records (EHRs) enhances generalizability and allows widespread implementation across healthcare systems [1]. These advancements collectively contribute to improving predictive accuracy and fostering the integration of machine learning into real-world clinical settings.
Despite their contributions, existing studies face several limitations that hinder their applicability and reliability [1,3]. A significant issue is the lack of generalizability, as many models are developed using data from specific institutions or regions, limiting their performance across diverse populations and healthcare settings [6,8]. External validation is rarely employed, restricting confidence in model robustness when applied to new datasets [10]. Class imbalance is another critical challenge, as many studies rely on techniques such as random oversampling or undersampling, which may introduce bias or distort the data distribution [7]. Furthermore, the interpretability of machine learning models remains an issue, as complex black-box models are often difficult for healthcare professionals to understand and integrate into clinical workflows [11]. While some studies attempt to enhance model explainability through feature importance analysis, the lack of practical discussions on the clinical implications of predictions continues to limit their adoption [12,13]. Lastly, many studies do not sufficiently explore the real-world impact of predictive models, failing to provide insights into how these models can be integrated into hospital decision-making processes to improve patient care and optimize resource allocation [14].
ML models developed in this study achieve better performance compared to available models in the literature. As an example, when comparing to the AUC 0.65 for the RF model for readmission prediction in [9], our optimized Random Forest model achieves AUC of 0.96, highlighting a considerable gain in predictive performance. Similarly, Turgeman et al. [13] found that SVM had a mean accuracy of 93.03% and our SVM model had an accuracy of 91.85% which are very close to characterizing comparable performance with a more generalizable and robust pipeline through detailed preprocessing and validation methods. Moreover, the Random Forest model was 94.8% accurate in predicting LOS and SVM AUC 0.97 [16] while our models were lower in accuracy for Random Forest in LOS prediction, however these models provided for a much more balanced and unbiased evaluation as we employed different sampling and validation techniques. Overall, these comparisons underscore the utility of our approach in formulating predictive models for care of diabetic patients that are both more accurate and generalizable. A comparison of state-of-the-art model is shown in Table 1.
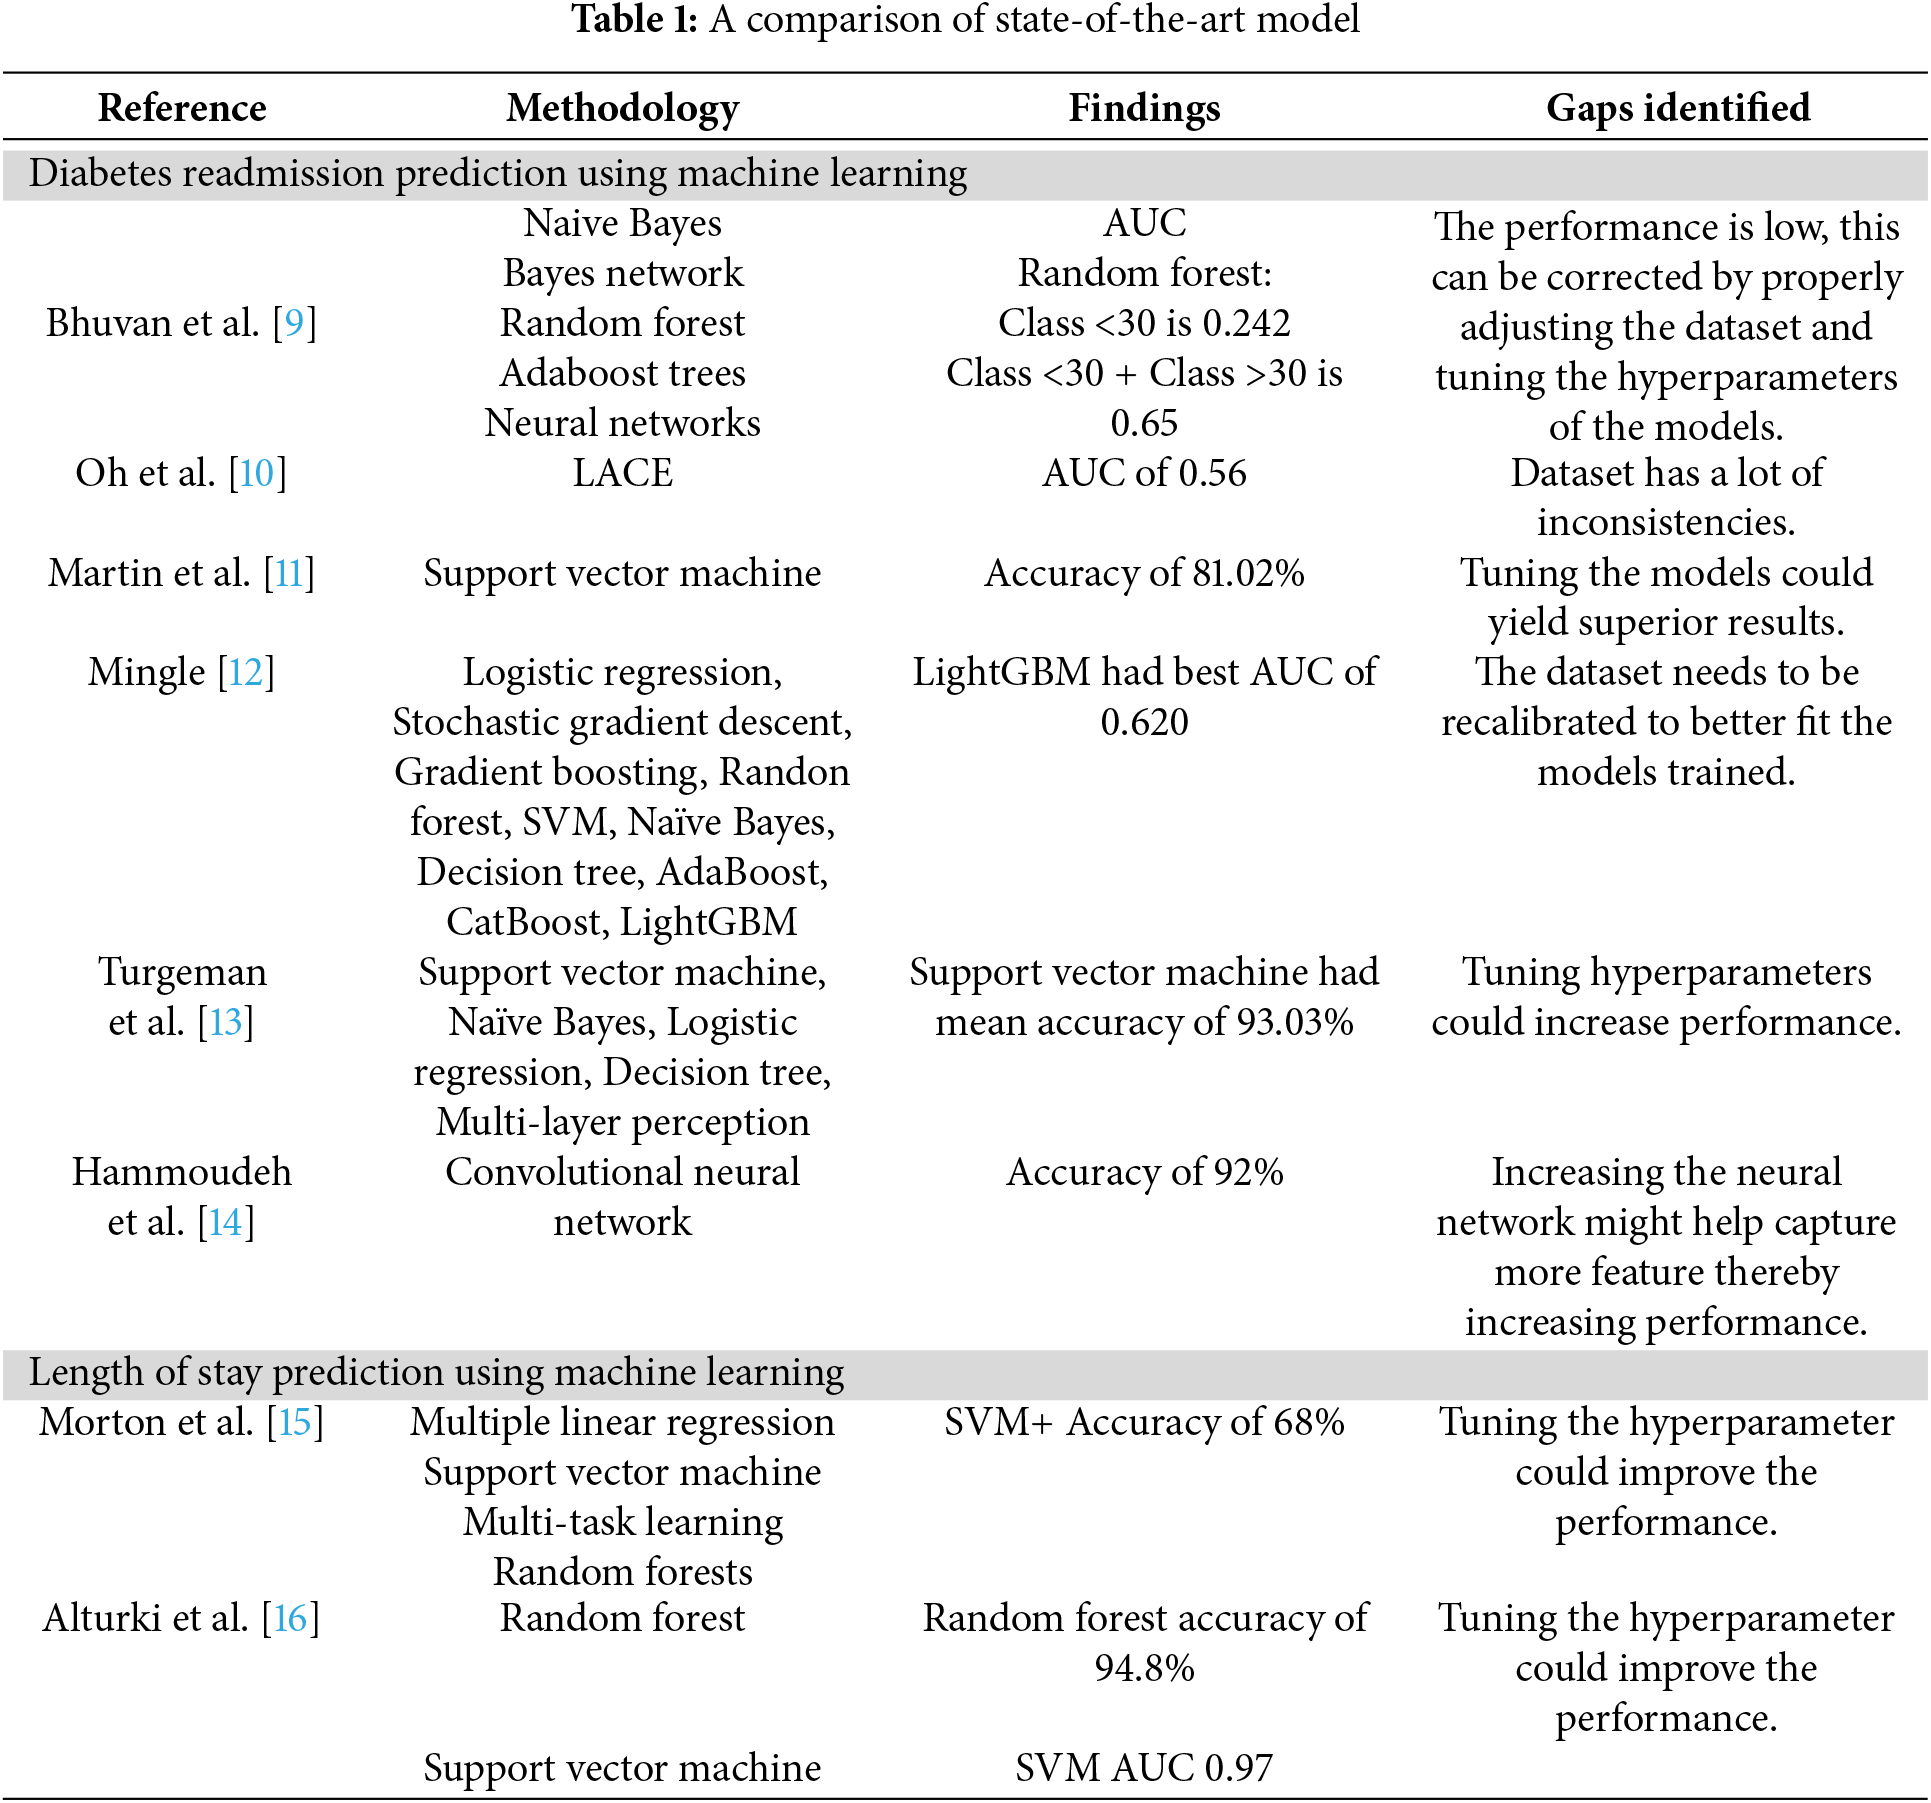
Significant advancements have been made in utilizing machine learning (ML) algorithms to predict hospital readmission and length of stay (LOS) across various medical conditions. However, notable gaps remain, particularly concerning diabetic patient populations. Most existing research has primarily focused on predicting readmission rates for cardiovascular diseases [22–24], leaving diabetes-specific studies relatively underexplored [25–27]. This focus disparity highlights the need for specialized models that account for the unique complexities and risk factors associated with diabetic patients. Several studies have demonstrated the efficacy of ML models in predicting hospital readmission, with some leveraging deep learning architectures [28]. However, challenges such as class imbalance, lack of generalizability across diverse healthcare settings, and insufficient external validation persist [29,30]. Addressing these gaps requires the development of more robust frameworks that integrate feature selection techniques, cross-validation, and interpretable AI methods to enhance model reliability and applicability in clinical practice.
Many current predictive models suffer from a lack of generalizability across diverse healthcare settings and datasets. Studies such as Rajkomar et al. [1] and Raita et al. [3] have demonstrated effective prediction of multiple medical events using deep learning and machine learning models. However, these models often rely heavily on Electronic Health Records (EHRs) from specific institutions, limiting their applicability to broader, more varied populations. Additionally, the challenge of class imbalance, where readmitted cases are significantly outnumbered by non-readmitted cases, remains inadequately addressed in many studies [2,7]. Techniques like Random Under Sampling (RUS) and Random Over Sampling (ROS) are commonly employed but may introduce bias, potentially compromising model performance and reliability.
Another pertinent gap is the insufficient exploration of feature selection and the relative importance of predictors in enhancing model accuracy and interpretability. While Jiang et al. [17] and Mingle [12] have integrated feature selection algorithms with ML models, there is still a need for more robust frameworks that can dynamically adapt to varying datasets and clinical scenarios. Additionally, most studies do not incorporate independent validation sets or external datasets to assess the generalizability and robustness of their models [6,8,18]. This omission limits the confidence in applying these models across different hospital systems and patient demographics.
Existing research often lacks comprehensive discussions on the clinical relevance and practical implications of predictive models. The ability to translate predictive analytics into actionable clinical interventions is crucial for improving patient outcomes and optimizing resource allocation, yet this aspect is frequently underemphasized [19–21]. Additionally, while missing data remains a persistent issue in healthcare datasets, several studies have explored advanced imputation techniques, including multiple imputation and deep learning-based approaches, to enhance data completeness and model robustness [14,28]. However, further work is needed to integrate explainable artificial intelligence (XAI) methods that enhance model interpretability and ensure healthcare practitioners can confidently rely on these predictions for real-world decision-making.
While significant progress has been made in predicting hospital readmission and LOS using ML algorithms, several critical research gaps remain:
1. Generalizability across Diverse Settings: Existing models often lack generalizability due to reliance on data from specific institutions. This study utilizes a large, diverse dataset encompassing over 100,000 diabetic patient encounters from 130 hospitals over a decade (1999–2008), enhancing the model’s applicability across varied healthcare settings.
2. Advanced Handling of Class Imbalance: Traditional methods like RUS and ROS can introduce bias. This study employs Synthetic Minority Over-sampling Technique (SMOTE) to more effectively balance class distributions without compromising data integrity.
3. Comprehensive Feature Selection and Importance Analysis: Previous studies have limited their feature selection processes. This research integrates advanced feature selection algorithms and conducts thorough feature importance analysis using SHAP values, providing deeper insights into the key predictors of readmission and LOS.
4. Incorporation of Cross-Validation and Independent Validation Sets: To ensure model robustness and prevent overfitting, this study employs rigorous cross-validation strategies and utilizes independent validation sets, addressing the lack of external validation in prior research.
5. Enhanced Model Interpretability and Clinical Relevance: By analyzing feature importance and integrating interpretability techniques, this study ensures that predictive models are not only accurate but also clinically relevant, facilitating their adoption in real-world healthcare decision-making.
6. Temporal Validation Strategies: This research incorporates temporal validation to account for changes over time, ensuring the model’s reliability across different time periods and enhancing its long-term applicability.
By addressing these gaps, the current study advances the field of predictive analytics in healthcare, particularly for diabetic patient care, by developing robust, generalizable, and clinically relevant ML models for predicting readmission and LOS.
This study aims to bridge these research gaps by developing and validating robust ML models specifically tailored for predicting 30-day readmission rates and LOS in diabetic patients. Leveraging a large, diverse dataset encompassing over 100,000 patient encounters from 130 hospitals collected over a decade, this research emphasizes generalizability and model robustness. Advanced feature selection techniques, combined with ensemble learning methods and thorough hyperparameter optimization, are employed to enhance predictive accuracy and interpretability. Additionally, this study addresses class imbalance using Synthetic Minority Over-sampling Technique (SMOTE) to mitigate bias and improve model reliability. By incorporating an independent validation set and employing temporal validation strategies, the research ensures the applicability of the models across different healthcare settings and temporal contexts. Furthermore, the clinical implications of the predictive models are thoroughly discussed, highlighting their potential to inform decision-making processes, optimize resource management, and ultimately improve patient care outcomes.
3.1 Dataset Characteristics and Labeling
The dataset used in this study is derived from the UCI Machine Learning Repository and consists of 101,766 de-identified inpatient encounters of diabetic patients from 130 hospitals, spanning a decade from 1999 to 2008. This dataset encompasses over 50 features, including patient demographics (e.g., age, race, gender), administrative details (e.g., admission type, discharge disposition), and medical records (e.g., lab tests, medications). The hospitals represented in the dataset vary in size, with some being small facilities with fewer than 100 beds and others being large centers with over 500 beds. This diversity ensures a comprehensive representation of healthcare settings and patient populations [27]. This diversity ensures a comprehensive representation of healthcare settings and patient populations.
The reliability of this dataset is well-documented in healthcare analytics research, where it is frequently used as a benchmark for developing predictive models. Its richness lies in the inclusion of a wide range of healthcare scenarios, covering both frequent and infrequent medical events, which enables robust modeling of healthcare outcomes. The dataset also provides a significant temporal range, enhancing its applicability to various clinical contexts.
The output variables, readmission and length of stay (LOS), were labeled based on well-defined criteria. Readmission is a binary classification where a value of 1 indicates a patient was readmitted within 30 days of discharge, and a value of 0 indicates no readmission or readmission occurring after 30 days. This labeling was derived from hospital administrative records by comparing discharge and subsequent admission timestamps. LOS, initially recorded as a continuous variable representing the total days spent in the hospital, was converted into a multi-class classification: short stay (1–4 days), medium stay (5–8 days), and long stay (more than 8 days). This transformation was performed to simplify analysis, ensure balanced class representation, and provide actionable insights for resource allocation. These labeling approaches enhance the interpretability and practical relevance of the models, addressing key considerations for clinical decision-making.
The data extraction phase was on the bases of requirements for the work being done, the data extracted contained information about inpatient encounter (hospital admission) that was related to diabetes, and the hospital admission lasted between 1 to 14 days. These encounters also had laboratory tasks carried out and medications were administered to the people who were on admission due to diabetes [27]. As with all clinical data, this dataset is very large and contains valuable but heterogeneous data which is very tricky to work with because of factors such as incomplete or inconsistent records, missing value, and/or high dimensionality which could affect the performance of work being done with the dataset.
Data exploration refers to the critical process of performing investigation on that dataset being used with the aim of discovering patterns and anomalies the data have usually done using summary statistics and graphical representations. The first study was on the distribution of the target dataset as seen in Fig. 2 showing whether or not there is readmission within the first 30 days.

Figure 2: Distribution of the target dataset
In Fig. 2, on the target axis, 0 represents cases of no readmission and readmission after 30 days while 1 represents cases of readmission within the first 30 days, this shows how imbalance the dataset is and why data preprocessing is very important because if the data is used the way it is the models are most likely going to overfit.
From Fig. 3, it can be seen that there is virtually no readmission for extremely young patients, but as they age, the rate of readmission increases up to when they get to the 70–80 age band, then they are a slight decrease. This shows that older patients have a higher risk of readmission if proper care is not taken. Fig. 4 shows the effect number of medications have on readmission.

Figure 3: Age distribution based on readmission

Figure 4: Effect of number of medications
The number of medications administered to the patients is a key deciding factor as to whether there will be readmission as seen in Fig. 4. Patients who go 5 to 25 medications had the highest rate of readmission which shows just how important having that information is. The gender distribution is shown in Fig. 5.

Figure 5: Gender distribution
With 1 representing the hospital readmissions in Fig. 6, it is evident that the gender didn’t play any role in determining the rate of readmission because both are almost the same which goes to show that the gender of the patient doesn’t really affect whether or not there will be readmission.

Figure 6: Correlation heatmap
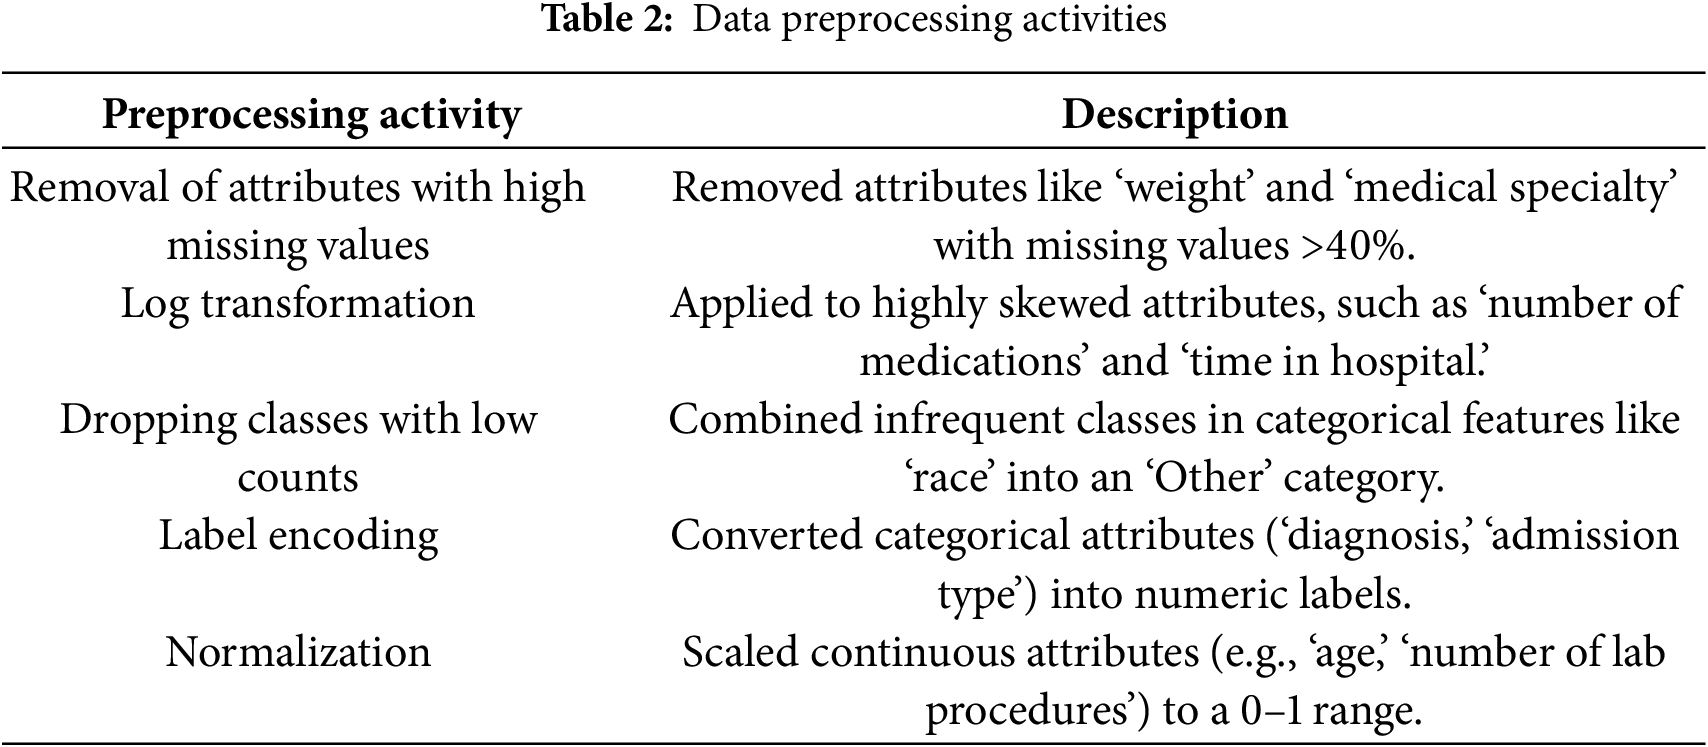
Data preprocessing involve a series of steps taken to clean and transform data into a version that is suitable for machine learning algorithms, usually it involves dealing with unknown or missing values and converting to data types the algorithm can work with, this step is seen in Fig. 1. Table 2 provides details on each preprocessing step to clarify our approach.
The initial step in data preprocessing is data cleaning, which addresses several issues within the dataset that could hinder model performance. Specifically, certain features in the dataset exhibited a high percentage of missing values or were categorical variables not directly compatible with the machine learning algorithms employed. The attributes removed include:
• Weight: This attribute had 97% missing values, making it unreliable for predictive modeling. High missingness can introduce significant bias, and alternative imputation methods like multiple imputation were deemed unsuitable due to the extensive missingness.
• Medical Specialty: With 47% missing values, this feature was also removed to prevent potential bias and maintain data integrity.
• Payer Code: Although it had 40% missing values, it was excluded not only due to the missing data but also because it was not deemed relevant to the prediction outcomes. Including it could have introduced unnecessary complexity and biased the models.
Another problem that is generally encountered when working with biomedical data is Skewed data, the formula for skewness for data points Y1, Y2
where
The normal range for skewness which are acceptable for achieving univariate distribution is between −2 and +2.
• Number of Medications
• Time in Hospital
• Number of Diagnoses
• Number of Lab Procedures
To address this, a log-transformation log(x+1)) was applied to these features to reduce skewness and conform the data more closely to a normal distribution. This transformation was chosen because it effectively decreases variability and manages zero values without distorting the overall data distribution.
3.4.3 Encoding Categorical Variables
Categorical features were processed to convert them into numerical formats compatible with machine learning algorithms. The following steps were undertaken:
• Dropping Infrequent Classes: Classes with low representation in categorical features were consolidated into an ‘Other’ category to ensure sufficient data representation and reduce noise.
• Label Encoding: Nominal categorical variables such as ‘admission type’ and ‘discharge disposition’ were transformed into numerical labels using Label Encoding. This technique assigns a unique integer to each category, facilitating algorithmic processing without imposing ordinal relationships.
Features with a high percentage of missing values can introduce significant bias and reduce the reliability of predictive models. In this study:
• Removal Justification: Attributes like ‘weight’ and ‘medical specialty’ were removed due to over 40% missing values. The extensive missingness rendered imputation techniques, such as multiple imputation, unreliable for these specific features, as they could distort the underlying data distribution and introduce further bias.
To ensure that all numerical features contribute equally to the model’s performance, normalization was performed using the Min-Max Scaler technique. This method scales feature values to a specified range, typically between 0 and 1, without altering the original distribution of the data. The formula used for normalization is:
The next pre-processing step is to drop all the classes with lesser count from each of the categorical features. then the features are encoded so nominal features are turned into numerical form. All the numeric columns: ‘number of medication changes’, ‘number of diagnoses’, ‘time in hospital’ and ‘age’, are encoded using Label Encoding technique. Also, min-max scaler technique is applied to normalize the data. By using Minmax Scaler we can shrink data within a specified range, usually from 0 to 1. Features values are scaled to transform data. Scaling does not affect the original distribution of values; it simply resizes them to a specific range of values. The formula for min-max scaler is:
• m is our new value
• x is the original cell value
• xmin is the minimum value of the column
• xmax is the maximum value of the column
Oversampling
One of the most important factors that makes an effect prediction model is a balanced dataset, especially for hospital related models [29]. Most cases of poor performance of classification models is due to underrepresented classes which results in either extremely high accuracies or extremely low accuracies when classifying both majority and minority classes. In this work, we focus on classifying unusual cases where resources are exhausted unnecessarily thereby optimizing the accuracy of the models while considering the contribution of each class. We used Random Under Sampling (RUS) and Random Over sampling (ROS) techniques, one of the most popular ways to handle imbalance classes.
Firstly, Random Under Sampling (RUS) technique was applied for the dependent variables: readmission. For readmission, class ratio for patients not readmitted within 30 days to the readmitted patients was 8:1. After applying RUS technique, the ratio reduced to 5:1 from 8:1. So the number of majority class is reduced. After that over sampling technique (ROS) is applied to equalize both minority and majority classes. So, after applying ROS both classes ratio become equal.
The oversampling technique was applied to ‘readmission’ and ‘length of stay’ which are dependent variables. For ‘readmission’, the class ratio for patients not readmitted within 30 days to those readmitted within 30 days was 10:1. While for ‘length of stay’, the class ratio for short, medium and long stays was 7:3:1. All classes had equal representations after the SMOTE oversampling was applied. Data preprocessing activities are shown in Table 2.
3.4.6 Data Loading and Initial Processing
The dataset was loaded using Python’s pandas library, which provides robust capabilities for handling large datasets efficiently. The initial exploratory data analysis (EDA) involved using functions such as .info() and .describe() to inspect the dataset’s structure and detect inconsistencies, missing values, or anomalies. Features deemed irrelevant to the analysis, such as patient identifiers (‘encounter ID’ and ‘patient number’), were excluded. Features with more than 40% missing values, such as ‘weight’ and ‘medical specialty,’ were removed to avoid introducing bias. For numerical features with lower missing rates, imputation was performed using mean substitution:
where
Exploratory analysis revealed critical patterns in the dataset. For instance, only 11% of cases involved readmissions within 30 days, highlighting the need to address class imbalance in the predictive models. Age emerged as a significant predictor, with patients aged 70–80 experiencing higher readmission rates. Correlation analysis identified multicollinearity between features, such as ‘number of lab procedures’ and ‘number of medications,’ with a Pearson correlation coefficient of:
where
Feature Transformation and Scaling
To reduce skewness and standardize feature ranges, transformations were applied. Log transformation was used for skewed features, such as ‘time in hospital’ and ‘number of medications,’ using the formula:
where
where Xmin and Xmax are the minimum and maximum values of the feature, respectively. These transformations ensured consistent scaling and mitigated the influence of outliers.
The machine learning pipeline was designed to ensure accuracy, robustness, and generalizability. Feature selection played a critical role in identifying the most important predictors, and this was achieved using Random Forest models, which ranked features based on their contribution to reducing uncertainty during decision splits. Features that added redundant information, such as highly correlated variables, were excluded to improve model performance and interpretability.
Model training was conducted using a systematic approach that included splitting the dataset into training and testing subsets. Additionally, 5-fold cross-validation was employed to evaluate the models across multiple data splits. This approach divides the dataset into five subsets, where each subset serves as a testing set once, while the remaining subsets are used for training. This method helps prevent overfitting and ensures that the evaluation metrics reflect the model’s ability to generalize to unseen data.
Hyperparameter tuning was performed to optimize the performance of the machine learning models. Parameters such as the number of estimators, tree depth, and learning rates were systematically adjusted using a grid search methodology to identify the best combinations for each model. This ensured that the models were fine-tuned to achieve their maximum potential without overfitting the training data.
Validation metrics, including accuracy, precision, recall, and F1-score, were used to evaluate the performance of each model. These metrics provided a comprehensive understanding of how well the models predicted outcomes such as 30-day readmissions and length of stay. This rigorous modeling and validation process ensured that the results were both accurate and reliable, making the models suitable for practical application in healthcare decision-making.
3.5 Feature Engineering and Selection
In the feature engineering stage, the domain knowledge is used to create new features that carry information which help make the models perform superior. Machine learning techniques like feature engineering use data to create new variables that weren’t present in the training set. By simplifying and speeding up data transformations as well as improving model accuracy.
Feature selection is also an important step by using only relevant data and removing noise in data, feature selection reduces the input variable to your model. Basically, you use it to select appropriate features for your machine learning model according to the type of problem you are trying to solve. To accomplish this, we include or exclude key features without altering them. Our input data is also reduced in size because of reducing the noise in our data.
While analyzing the data we observed that there are some features like ‘weight’, ‘payer code’, ‘medical specificity’, ‘metformin rosiglitazone’, and removing all other columns which contain single unique values, all these features are removed as some of them contain lots of missing values, other have single unique values and some are not useful like encounter id and patient nbr.
After the feature selection, the dataset was split into training and testing sets in the ratio 8:2 where training had 80% and testing had 20% to ensure the model doesn’t overfit the models.
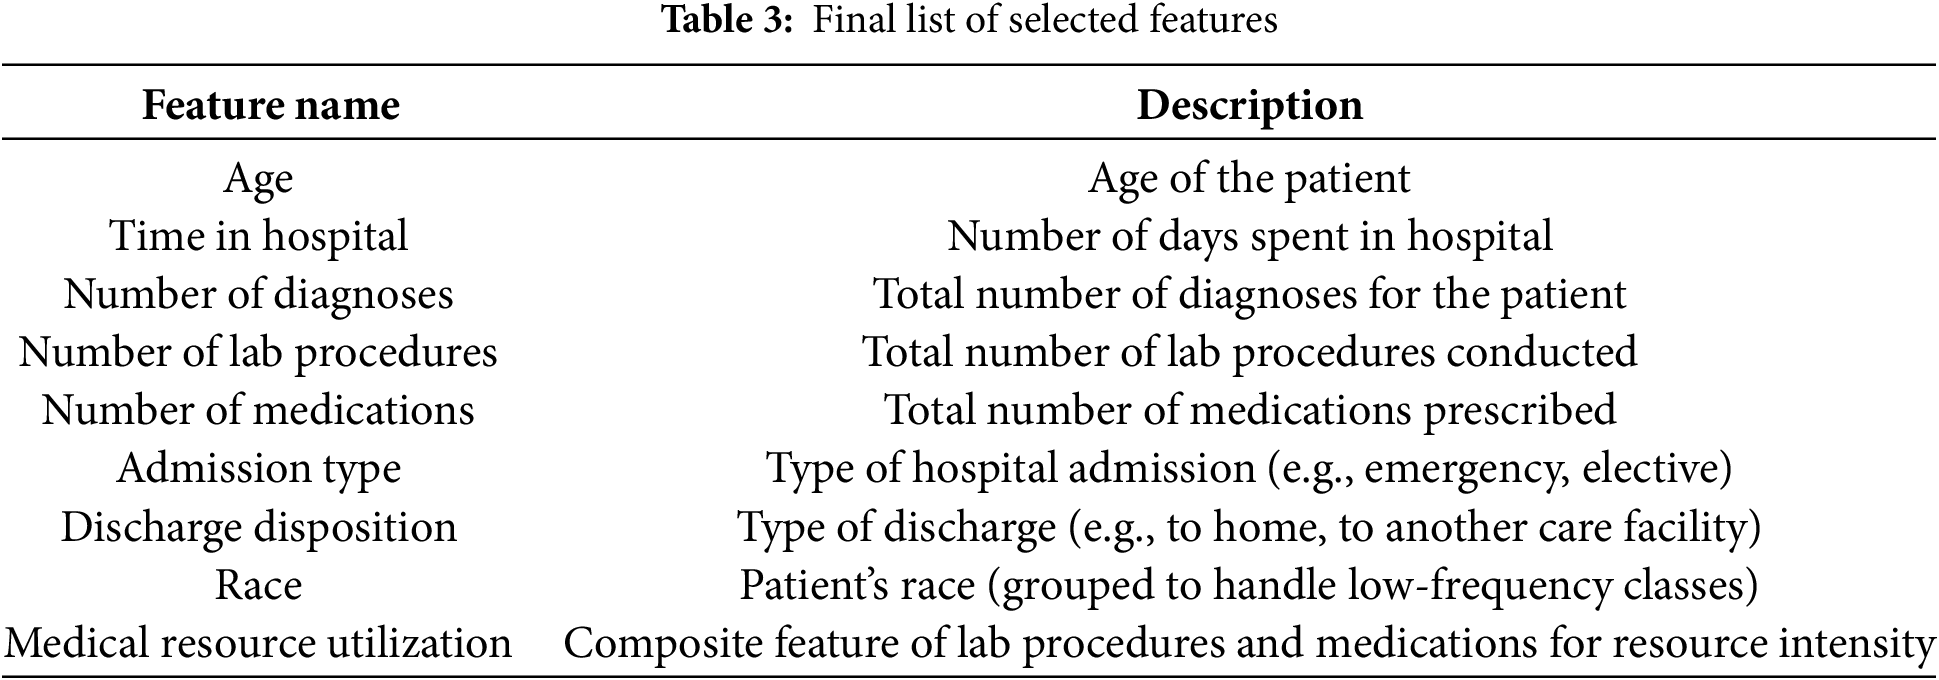
Table 3 shows a comprehensive list of the final features that were selected for model training. This list includes key attributes such as ‘age,’ ‘time in hospital,’ ‘number of diagnoses,’ ‘number of lab procedures,’ ‘number of medications,’ ‘admission type,’ and ‘discharge disposition,’ among others. This list is provided in a table format in the manuscript for clarity and easy reference.
We found a high correlation between ‘number of lab procedures’ and ‘number of medications,’ indicating that patients who undergo more lab procedures also tend to receive more medications. Another significant correlation was observed between ‘time in hospital’ and ‘number of diagnoses,’ suggesting that patients with longer stays often have multiple diagnoses. We used these correlations to guide feature selection, either by combining related features or selecting the most representative ones to avoid redundancy.
3.5.1 Class Imbalance Handling
Class imbalance, where certain classes are underrepresented, can significantly skew model predictions and performance. To address this issue:
Random Under Sampling (RUS): Initially, RUS was applied to reduce the majority class ratio from 8:1 to 5:1 for the ‘readmission’ outcome. This reduction helps in mitigating the dominance of the majority class, ensuring that the model does not become biased towards predicting the majority class excessively.
Random Over Sampling (ROS): Subsequently, ROS was employed to balance the classes by increasing the minority class samples to match the majority class. This two-step approach ensures that both classes are equally represented, enhancing the model’s ability to accurately predict both readmission and non-readmission cases.
Potential Bias Discussion: While RUS and ROS are effective in balancing class distributions, they can introduce sampling bias by altering the original data distribution. To counteract this, we also experimented with Synthetic Minority Over-sampling Technique (SMOTE). However, SMOTE did not perform as consistently as RUS/ROS in our specific context, likely due to the nature of the dataset and the relationships between features. Therefore, RUS/ROS was deemed more appropriate for achieving balanced and unbiased class distributions in our models.
3.5.2 Feature Selection Justification
Feature selection was guided by a combination of correlation analysis and feature importance scores derived from the Random Forest model. This dual approach ensured that only the most relevant and non-redundant features were retained, enhancing both model performance and interpretability. Features with low variance or high multicollinearity were excluded to prevent overfitting and reduce noise. Specifically:
• Correlation Analysis: As depicted in Fig. 6, a high correlation (r = 0.85) between ‘number of lab procedures’ and ‘number of medications’ indicated multicollinearity. To address this, ‘number of medications’ was retained due to its higher predictive power, while ‘number of lab procedures’ was excluded to avoid redundancy.
• Feature Importance: The Random Forest algorithm identified ‘age,’ ‘time in hospital,’ and ‘number of diagnoses’ as the top predictors. Features were selected based on their importance scores exceeding a predefined threshold, ensuring that only the most impactful variables were included in the final model.
Fig. 6 presents a correlation heatmap summarizing the relationships between the selected features. Notably: High Correlation: A strong correlation (r = 0.85) between ‘number of lab procedures’ and ‘number of medications’ indicates potential multicollinearity. To mitigate this, ‘number of medications’ was retained due to its higher importance in predictive modeling, while ‘number of lab procedures’ was excluded to avoid redundant information.
Moderate Correlations: Moderate correlations exist between ‘time in hospital’ and ‘number of diagnoses’ (r = 0.65), suggesting that patients with longer hospital stays often have multiple diagnoses. This insight informed the decision to include both features in the final model, as they provide distinct yet complementary information.
Low Correlations: Features like ‘age’ and ‘race’ exhibited low correlations with other variables, underscoring their unique contributions to predicting readmission and LOS.
This correlation analysis was pivotal in guiding the feature selection process, ensuring that the final feature set comprises variables that are both relevant and non-redundant.
3.7 Machine Learning Classification Techniques
In this research, we employed a range of machine learning (ML) classification methods to predict the 30-day readmission rates and length of stay (LOS) for diabetic patients. We selected these algorithms out of potential algorithms because of their sufficiency in dealing with sophisticated, high-dimensional healthcare data and their capacity for capturing non-linear properties among characteristics. We have implemented the following models: Random Forest (RF), XGBoost, SVM, KNN, Decision Tree, LightGBM, and Neural Networks (NN). We tweaked the parameters with a carefully selected set of architecture parameters and hyperparameters depending on performance. The summary of machine learning classification techniques is shown in Table 4.
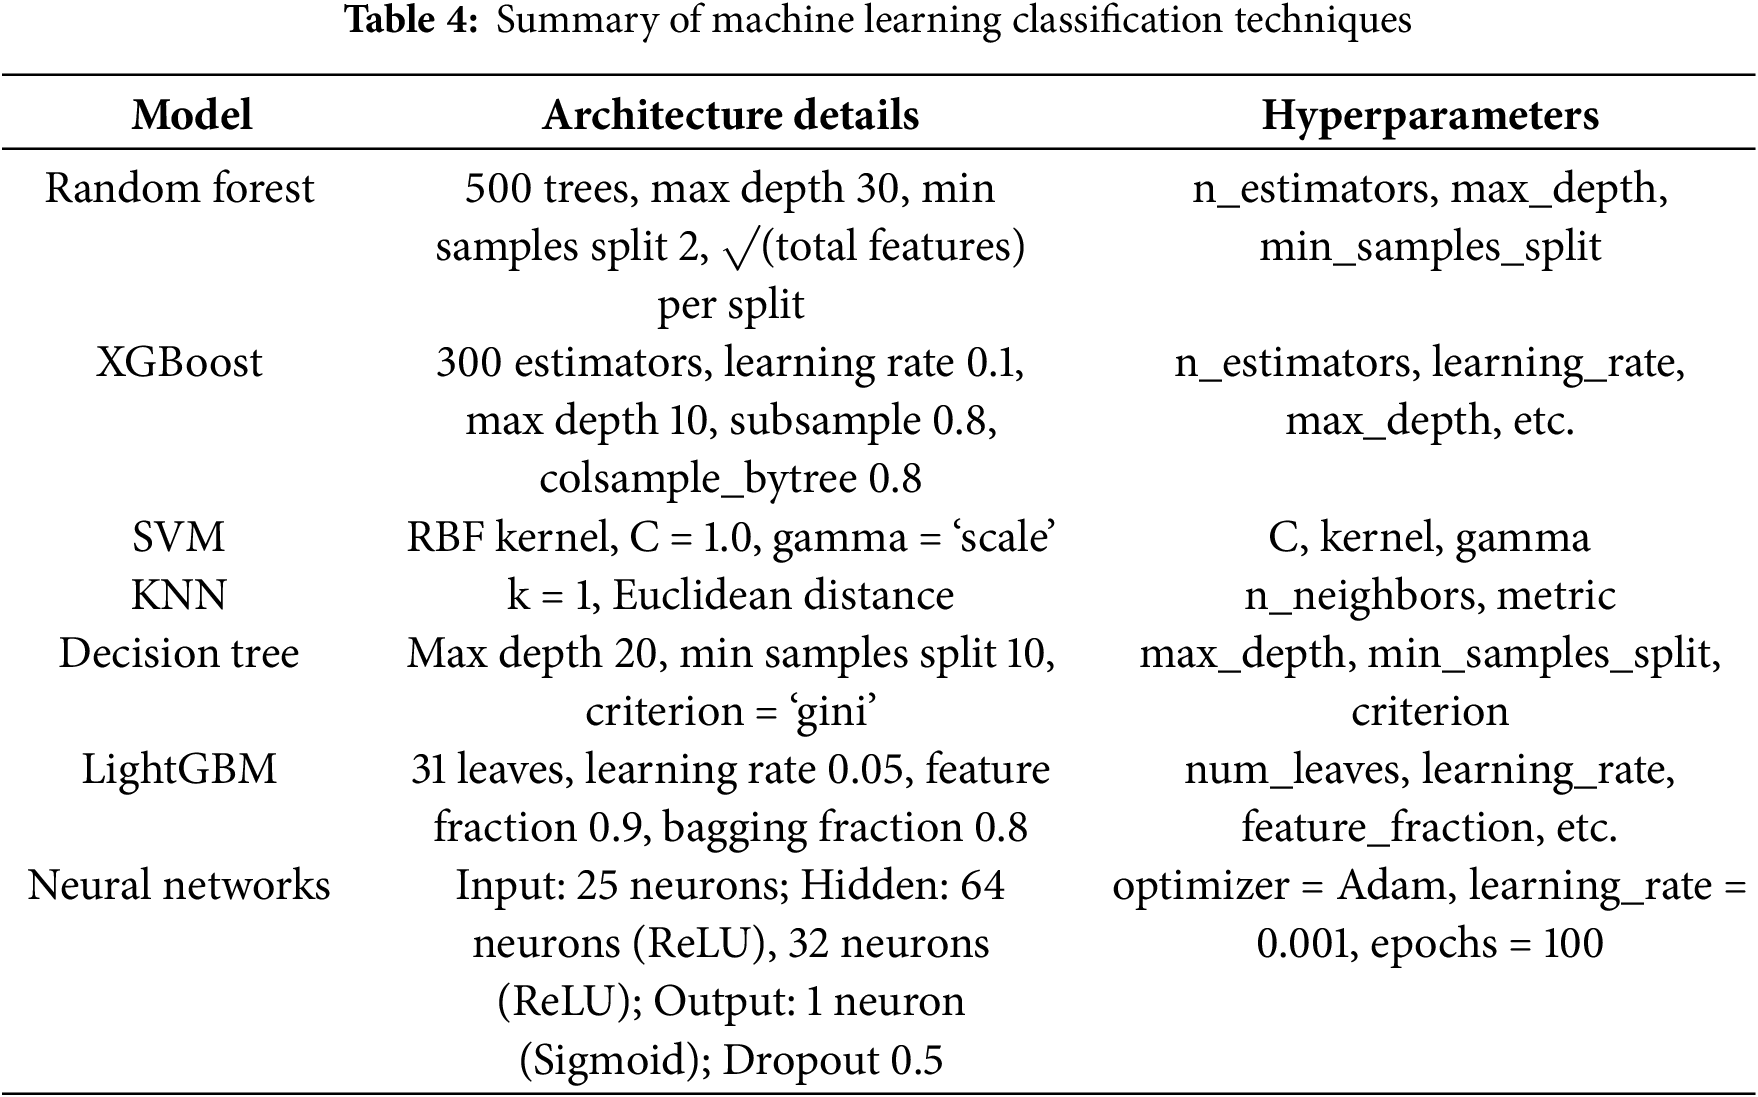
The random forest is a collection learning method that builds multiple decision trees during training and takes the mode of prediction of the classes (classification) or mean prediction (regression) of their individual trees. The Random Forest model employed in this investigation comprised of 500 trees with a maximum depth of 30 and min_samples_split = 2. Random Forest lowers overfitting and matures generalizability by training each tree on a bootstrap sample of the data and, at each split, also considering a random subset of the features. Pros: Well, per high-dimensional data + feature importance scores Cons: Computationally intensive + less interpretable than standalone decision trees
XGBoost is an efficient distributed gradient boosting library and was configured with 300 estimators, a learning rate of 0.1, a maximum depth of 10, a subsample, and a colsample_bytree of 0.8. XGBoost is noted for its strong prediction power and efficiency; especially, it can handle missing values by itself. But it is hyperparameter tuning that is a nuisance, as you have to avoid overfitting it, and it is computationally expensive.
For the Support Vector Machine (SVM), a Radial Basis Function (RBF) kernel was applied with the following values for the hyperparameter: C = 1.0 and gamma = ‘scaling’ dimension. Widely utilized due to its performance in high-dimensional environments and some resistance to overfitting. Characteristics of SVMs: Computational complexity Less interpretable than tree-based models
K-Nearest Neighbors (KNN) was implemented using k=1 and utilized the Euclidean distance metric. KNN is a basic technique that is easy to grasp and does not include an explicit training phase; therefore, it is computationally economical for small data sets. Its limitation is that the approach involves running the distance computations for the whole data set during prediction, which becomes computationally expensive for larger datasets; also, it is sensitive to the magnitude of the data and irrelevant features.
The Decision Tree has a maximum depth of 20, a minimum number of samples required to split an internal node of 10, and the splitting criterion is Gini impurity. Pros: Decision Trees are easy to interpret and illustrate. Cons: Prone to overfitting and unstable with slight fluctuations in data.
We configure LightGBM, a gradient boosting framework, with 31 leaves, a learning rate of 0.05, a feature fraction of 0.9, and a bagging fraction of 0.8. Compared to existing boosting algorithms, LightGBM provides faster training speeds, higher efficiency, and reduced memory utilization. Nevertheless, it is sensitive to hyperparameters, and it could underperform on very small datasets.
The NN model contained 25 neurons in the input layer (representing the selected characteristics), two hidden layers with 64 and 32 neurons, respectively, utilizing ReLU activation functions, and one output layer with a sigmoid activation function for binary classification. In order to avoid overfitting, we applied dropout regularization with a drop of 0.5. We trained the network with the Adam optimizer with a learning rate of 0.001 for 100 epochs. They offer remarkable flexibility that allows them to represent complex, non-linear interactions, but take a lot of computer resources and are often less interpretable than traditional ML models.
3.8 Computational Requirements and Scalability
The computational resources required for training and deploying the machine learning models were substantial, given the size and complexity of the dataset. The training was conducted on a high-performance computing system equipped with an Intel i7 CPU and 16 GB RAM. The computational requirements and scalability considerations for each model are as follows:
• Random Forest and XGBoost: These ensemble models were relatively efficient, with training times averaging approximately 10 min each. Their parallelizable nature allows them to scale effectively with additional computational resources, making them suitable for larger datasets. However, they can become memory-intensive as the number of trees and depth increases.
• Support Vector Machine (SVM): Training the SVM model was more time-consuming due to the kernel computations, taking around 15 min. While SVMs perform well on high-dimensional data, their scalability is limited by their computational complexity, making them less ideal for extremely large datasets.
• K-Nearest Neighbors (KNN): The KNN model was efficient to train since it is a lazy learner with no explicit training phase. However, prediction times can be slow for large datasets, as it requires calculating distances to all training instances.
• Decision Tree: This model was quick to train, with training times around 5 min. Its simplicity allows for rapid scalability, but it is prone to overfitting on large datasets without proper pruning.
• LightGBM: LightGBM demonstrated high efficiency, with training times similar to Random Forest and XGBoost (approximately 10 min). Its optimized gradient boosting framework allows for faster training and lower memory usage, making it highly scalable for large-scale data.
• Neural Networks: The neural network model required the most computational resources, with training times around 30 min per run. The use of two hidden layers with 64 and 32 neurons, coupled with dropout regularization, added to the computational load. However, the scalability of neural networks can be enhanced by leveraging GPU acceleration and distributed computing frameworks, allowing them to handle larger datasets effectively.
Scalability Considerations:
• Parallel Processing: Models like Random Forest, XGBoost, and LightGBM inherently support parallel processing, which can be leveraged to reduce training times significantly when deployed on multi-core processors or distributed computing environments.
• Memory Management: Ensemble models and neural networks require substantial memory, especially with increasing dataset sizes and model complexity. Efficient memory management techniques and hardware upgrades (e.g., increased RAM) can mitigate these challenges.
• Model Optimization: Hyperparameter tuning and model pruning can help in reducing the computational overhead without compromising model performance. Techniques such as early stopping in neural networks and limiting the maximum depth in decision trees are employed to achieve this balance.
Overall, while the computational requirements are significant, the chosen models are scalable and can be efficiently trained and deployed with appropriate computational resources. Future implementations may consider leveraging cloud-based platforms and GPU acceleration to further enhance scalability and reduce training times.
Performance metrics play a crucial role in analyzing the efficacy of machine learning models, especially in healthcare applications where accuracy and dependability directly affect patient outcomes. A full array of metrics is employed in this study to assess model performance, including accuracy, precision, recall (sensitivity), F1-score, and area under the Receiver Operating Characteristic Curve (AUC-ROC). This inclusion of many measures helps provide an overall notion of the performance of the model, assuring overall accuracy or capability to identify true positives (e.g., readmissions) is properly recorded. After we are done training the models, the performances must be evaluated to see how well the models are able to classify readmission in the test dataset. Several evaluation metrics which are available for machine and deep learning models were used, they are accuracy, precision, recall and F1-score. Visual demonstration of Precision and recall metric illustrate in Figs. 7 and 8. The mathematical description of the accuracy measure is given in Eq. (2):
Eq. (3) depicts the mathematical formulation of AP and Eq. (4) is the mAP measure, where AP shows the average precision for all classes and t is the test sample. T is representing all test samples.

Figure 7: Visual demonstration of precision metric

Figure 8: Pictorial representation of recall measure
Here
• Precision: this is the quality of positive prediction made by the model, meaning the number of positive class prediction made that were actually positive.
• Recall: this is the measure of the ability of a model to detect positive samples.
Figs. 7 and 8 explain the visual demonstration form of precision, and recall.
3.10 Analysis of Feature Importance and Model Interpretability
The value of features for prediction should be recognized because both model explainability and clinical significance rely on this knowledge. Using the Random Forest model for feature importance analysis showed that the distinctly only three predicting characteristics included age, time in hospital, and number of diagnoses were deciding the most hospital readmission and length of stay (LOS). In addition, to increase interpretability even further, SHAP (Shapley Additive explanations) values were calculated to obtain explanations at the individual level of quality based on the VOC features that are input at the device level. Besides establishing how the model comes up with its predictions, this also gives a practical reference for healthcare practitioners to identify risk variables that actually should be the focus of treatment with diabetic patients. robust validation procedures are the only way to make sure the machine learning model performs reliably and generalizes well on unseen data. To avoid overfitting, this study carefully assesses model performance using cross-validation, separate validation sets, and temporal validation.
3.11 Hyperparameter Optimization Description
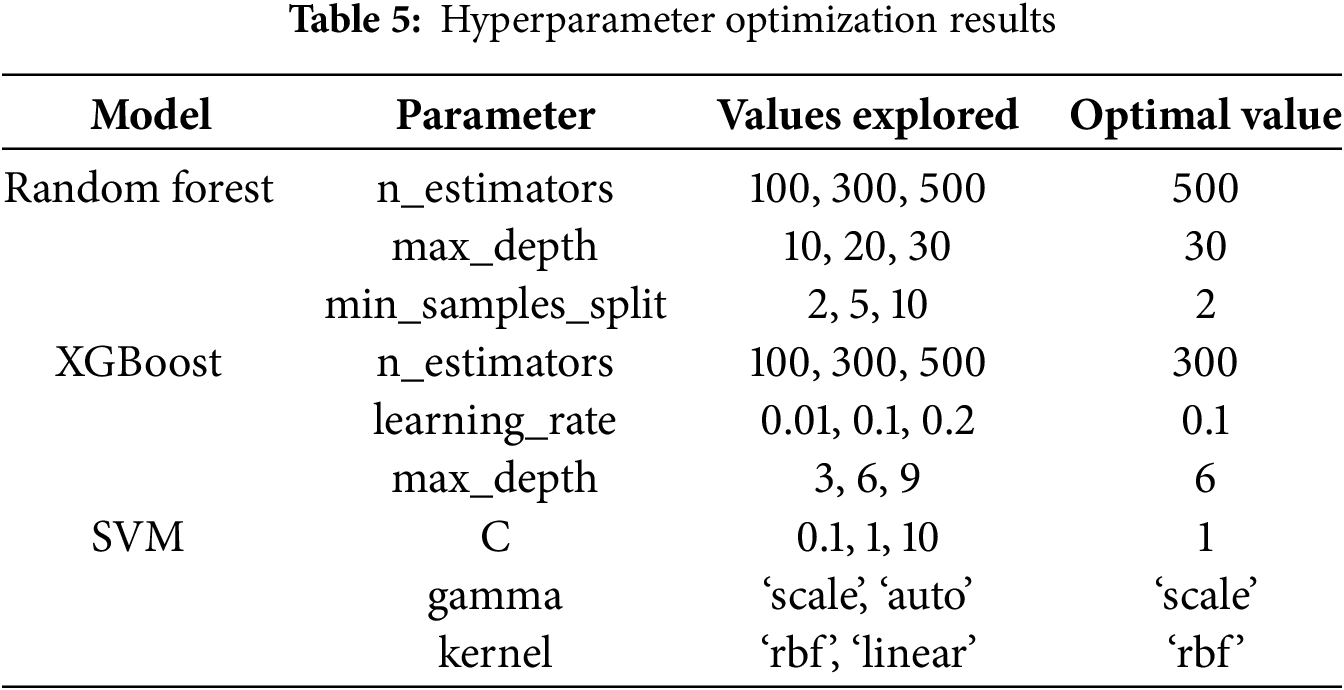
Hyperparameter optimization is a crucial step in refining machine learning models to achieve optimal performance. In this study, hyperparameter optimization was performed using Grid Search coupled with 5-fold cross-validation. The parameters varied included:
The optimal combination of hyperparameters was selected based on the highest cross-validated AUC-ROC score, ensuring that the models were both accurate and generalizable. Table 5 below summarizes the hyperparameter tuning process and the selected optimal values for each model.
Robust validation strategies are essential to ensure that machine learning models perform reliably and generalize well to unseen data. This study employs a combination of cross-validation, independent validation sets, and temporal validation to comprehensively evaluate model performance and mitigate overfitting. The summary of validation strategies is shown in Table 6.
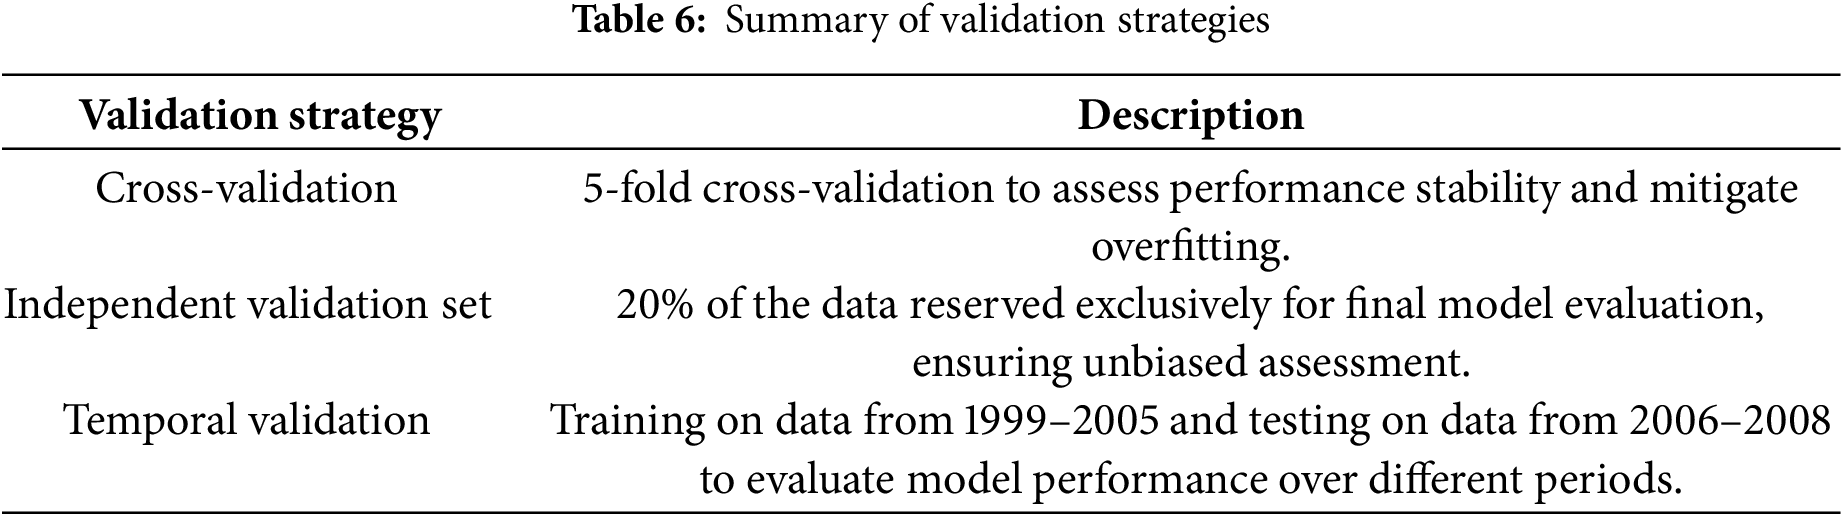
A 5-fold cross-validation approach was performed during model training to examine the stability and generalizability of the machine learning models. This method divides the data set into five sub-sets of first trainings, 4 sub-sets, and later verifying against one sub-set. It repeats this five times so each subset becomes the validation set once. By verifying with different splits and checking that the score usually stays the same, you may prevent overfitting to a certain point.
Besides the internal cross-validation approach, in the present study, 20% of the total data was kept out and used only for the final evaluation of the various models. This component was not involved in the training and hyperparameter tuning procedure to eliminate the bias in the model performance estimation over unseen data. Assessing the models on an external dataset offers deeper insight into the models’ real-world applicability and transferability between hospital systems and patient cohorts.
Temporal validation was employed to handle temporal variations and changing patient demographics or associated changes in practice over time. So, this worked by training the models on 1999–2005 and testing them on 2006–2008. By employing temporal validation, you ensure that the models are stable over the time frames, ich makes them extensively practical and useful permanent models in in theme-variant healthcare systems.
The use of Electronic Health Records (EHRs) for predictive modeling necessitates stringent privacy measures. All patient data was de-identified to comply with HIPAA regulations. Future implementations of these models should ensure continuous compliance with data protection laws and incorporate secure data handling practices to safeguard patient information.
The framework proposed in this project was applied to two primary tasks: predicting hospital readmission for diabetic patients and predicting the length of stay (LOS) for these patients. The results of these tasks are presented and discussed separately in the following subsections.
4.1 Readmission Analysis and Prediction
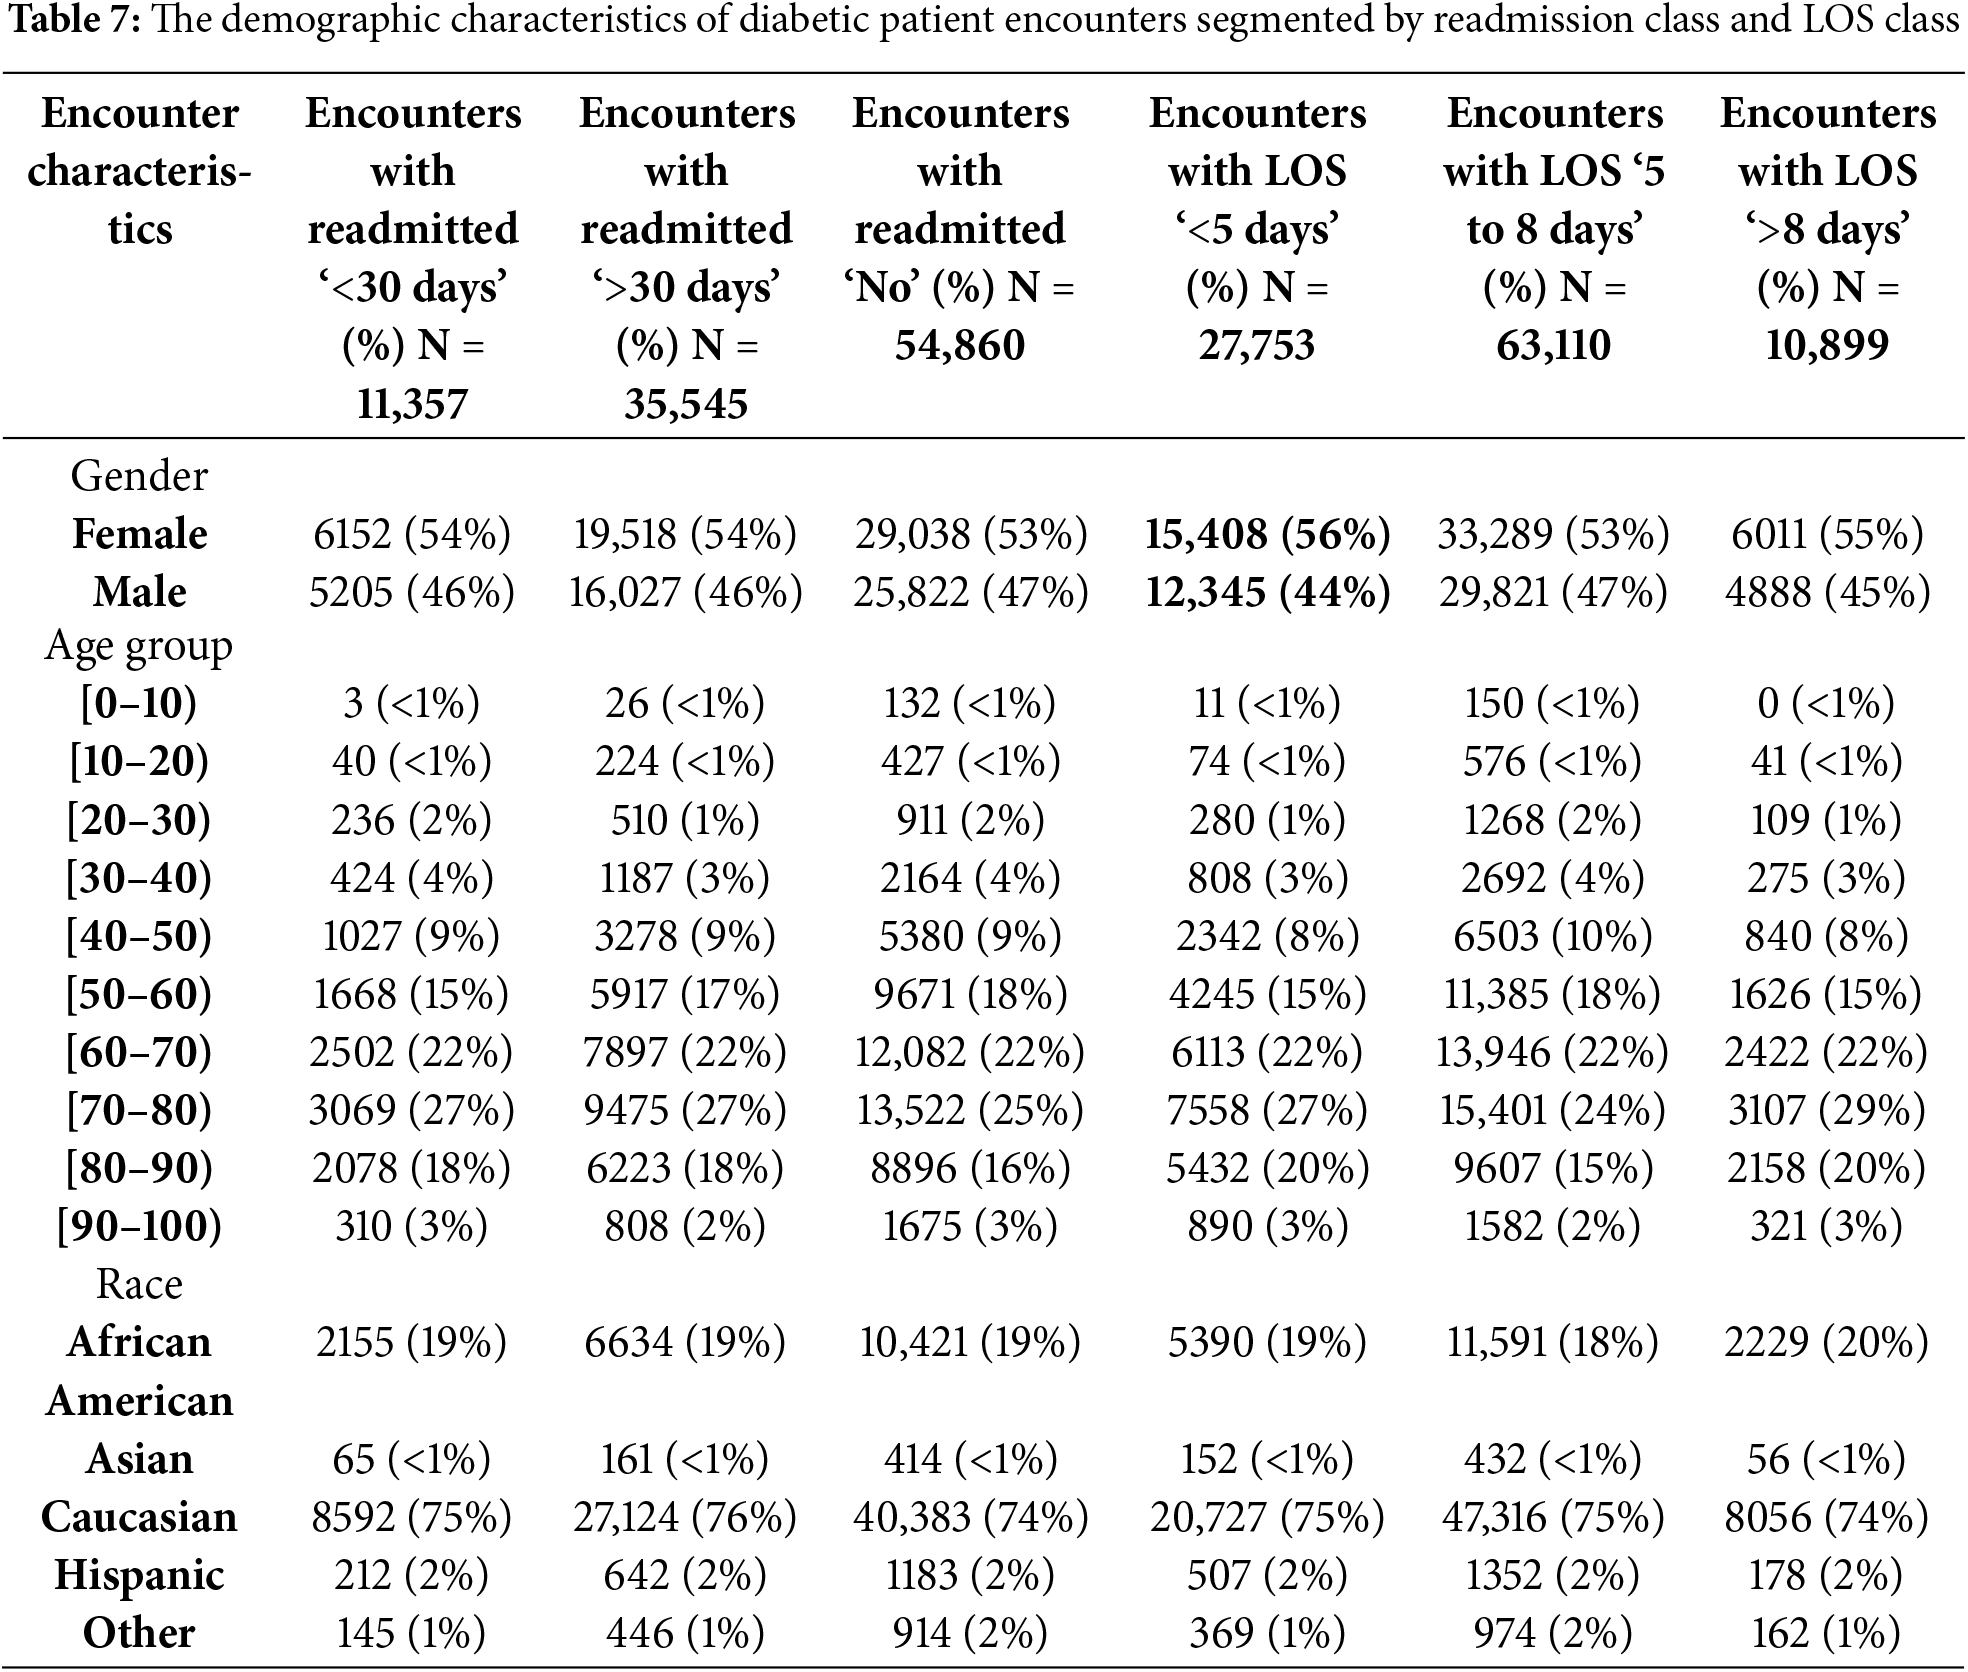
The first task focused on predicting hospital readmission in diabetic patients within 30 days of discharge using various machine learning algorithms. The dataset utilized comprised 101,766 diabetic encounters across 71,518 unique patients. These encounters were categorized into three classes: 11.16% for readmission within <30 days, 34.93% for readmission >30 days, and 53.91% for no readmission post-discharge. For the purpose of this study, readmission classes ‘no admission’ and ‘readmission >30 days’ were combined to create a binary classification problem, ensuring that the outcome was either a readmission within 30 days or not. Table 7 presents the demographic characteristics of diabetic patient encounters segmented by readmission class and LOS class.
Feature importance was analyzed using the Random Forest model, revealing that ‘age,’ ‘time in hospital,’ and ‘number of diagnoses’ were the most significant predictors of hospital readmission. Fig. 9 illustrates the feature importance scores derived from the Random Forest model, highlighting these key predictors.

Figure 9: Feature importance using random forest
4.1.2 Model Performance Comparison
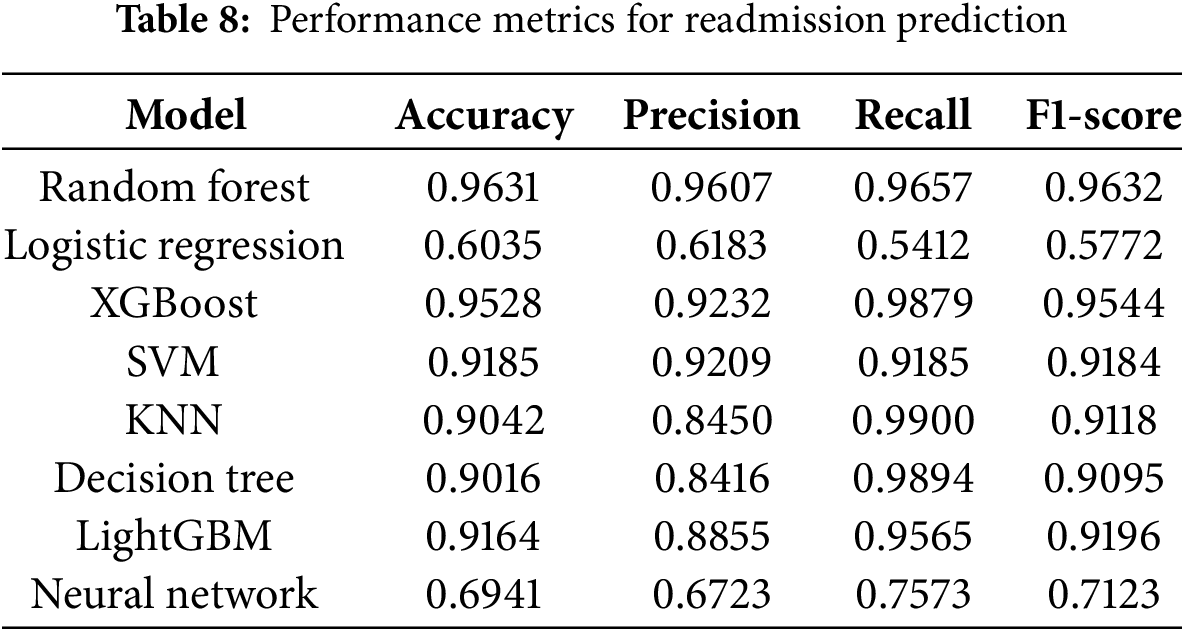
The performance of the machine learning models developed in this study was compared against those from previous studies listed in Table 1. Our Random Forest model achieved an AUC of 0.96, significantly surpassing Bhuvan et al. [9]’s AUC of 0.65 and Turgeman et al. [13]’s accuracy of 93.03%. This substantial improvement underscores the efficacy of our model in accurately predicting readmission risks. Table 8 shows performance Metrics for Readmission Prediction.
4.1.3 Hyperparameter Optimization Results
Hyperparameter optimization was performed using grid search with 5-fold cross-validation to identify the optimal parameter combinations for each model. The parameters varied included n_estimators (100, 300, 500), max_depth (10, 20, 30), and min_samples_split (2, 5, 10) for the Random Forest model. The optimal combination yielding the highest cross-validated AUC was selected for final training. Table 5 summarizes the hyperparameter tuning process and the selected optimal values for each model.
To further evaluate the models, the Area Under the Receiver Operating Characteristic Curve (AUC-ROC) was calculated. Fig. 10 displays the ROC curves for all models, with the Random Forest model achieving the highest AUC of 0.96, while Logistic Regression had the lowest AUC of 0.60. Ensemble methods, such as Random Forest and XGBoost, demonstrated excellent predictive performance, whereas the Neural Network showed moderate performance, indicating the need for further refinement.

Figure 10: ROC-AUC of all models trained
4.1.5 Discussion of Model Performance
The results in Table 5 indicate that the Random Forest model outperformed all other models across all evaluation metrics, demonstrating superior predictive capability for readmission within 30 days. Logistic Regression exhibited the poorest performance, primarily due to its inability to handle multicollinearity among features and capture non-linear relationships inherent in the data. Ensemble methods like XGBoost and LightGBM also performed exceptionally well, leveraging their robust algorithms to achieve high accuracy and AUC scores. The Neural Network, while showing potential, lagged behind ensemble methods, suggesting that further hyperparameter tuning and architectural adjustments could enhance its performance.
4.2 Length of Stay Analysis and Prediction
The second task involved predicting the length of stay (LOS) for diabetic patients, transforming the regression problem into a multi-class classification task. The ‘time in hospital’ attribute, measured in days, was discretized into three categories: short stay (<5 days) with a class rate of 64%, medium stay (5–8 days) with a class rate of 26%, and long stay (>8 days) with a class rate of 10%. This categorization facilitated more effective classification modeling and aligned with clinical relevance.
Feature importance for LOS prediction was assessed using the Random Forest model. Fig. 11 displays the feature importance scores, highlighting ‘number of medications,’ ‘number of lab procedures,’ and ‘age’ as the most significant predictors influencing LOS.
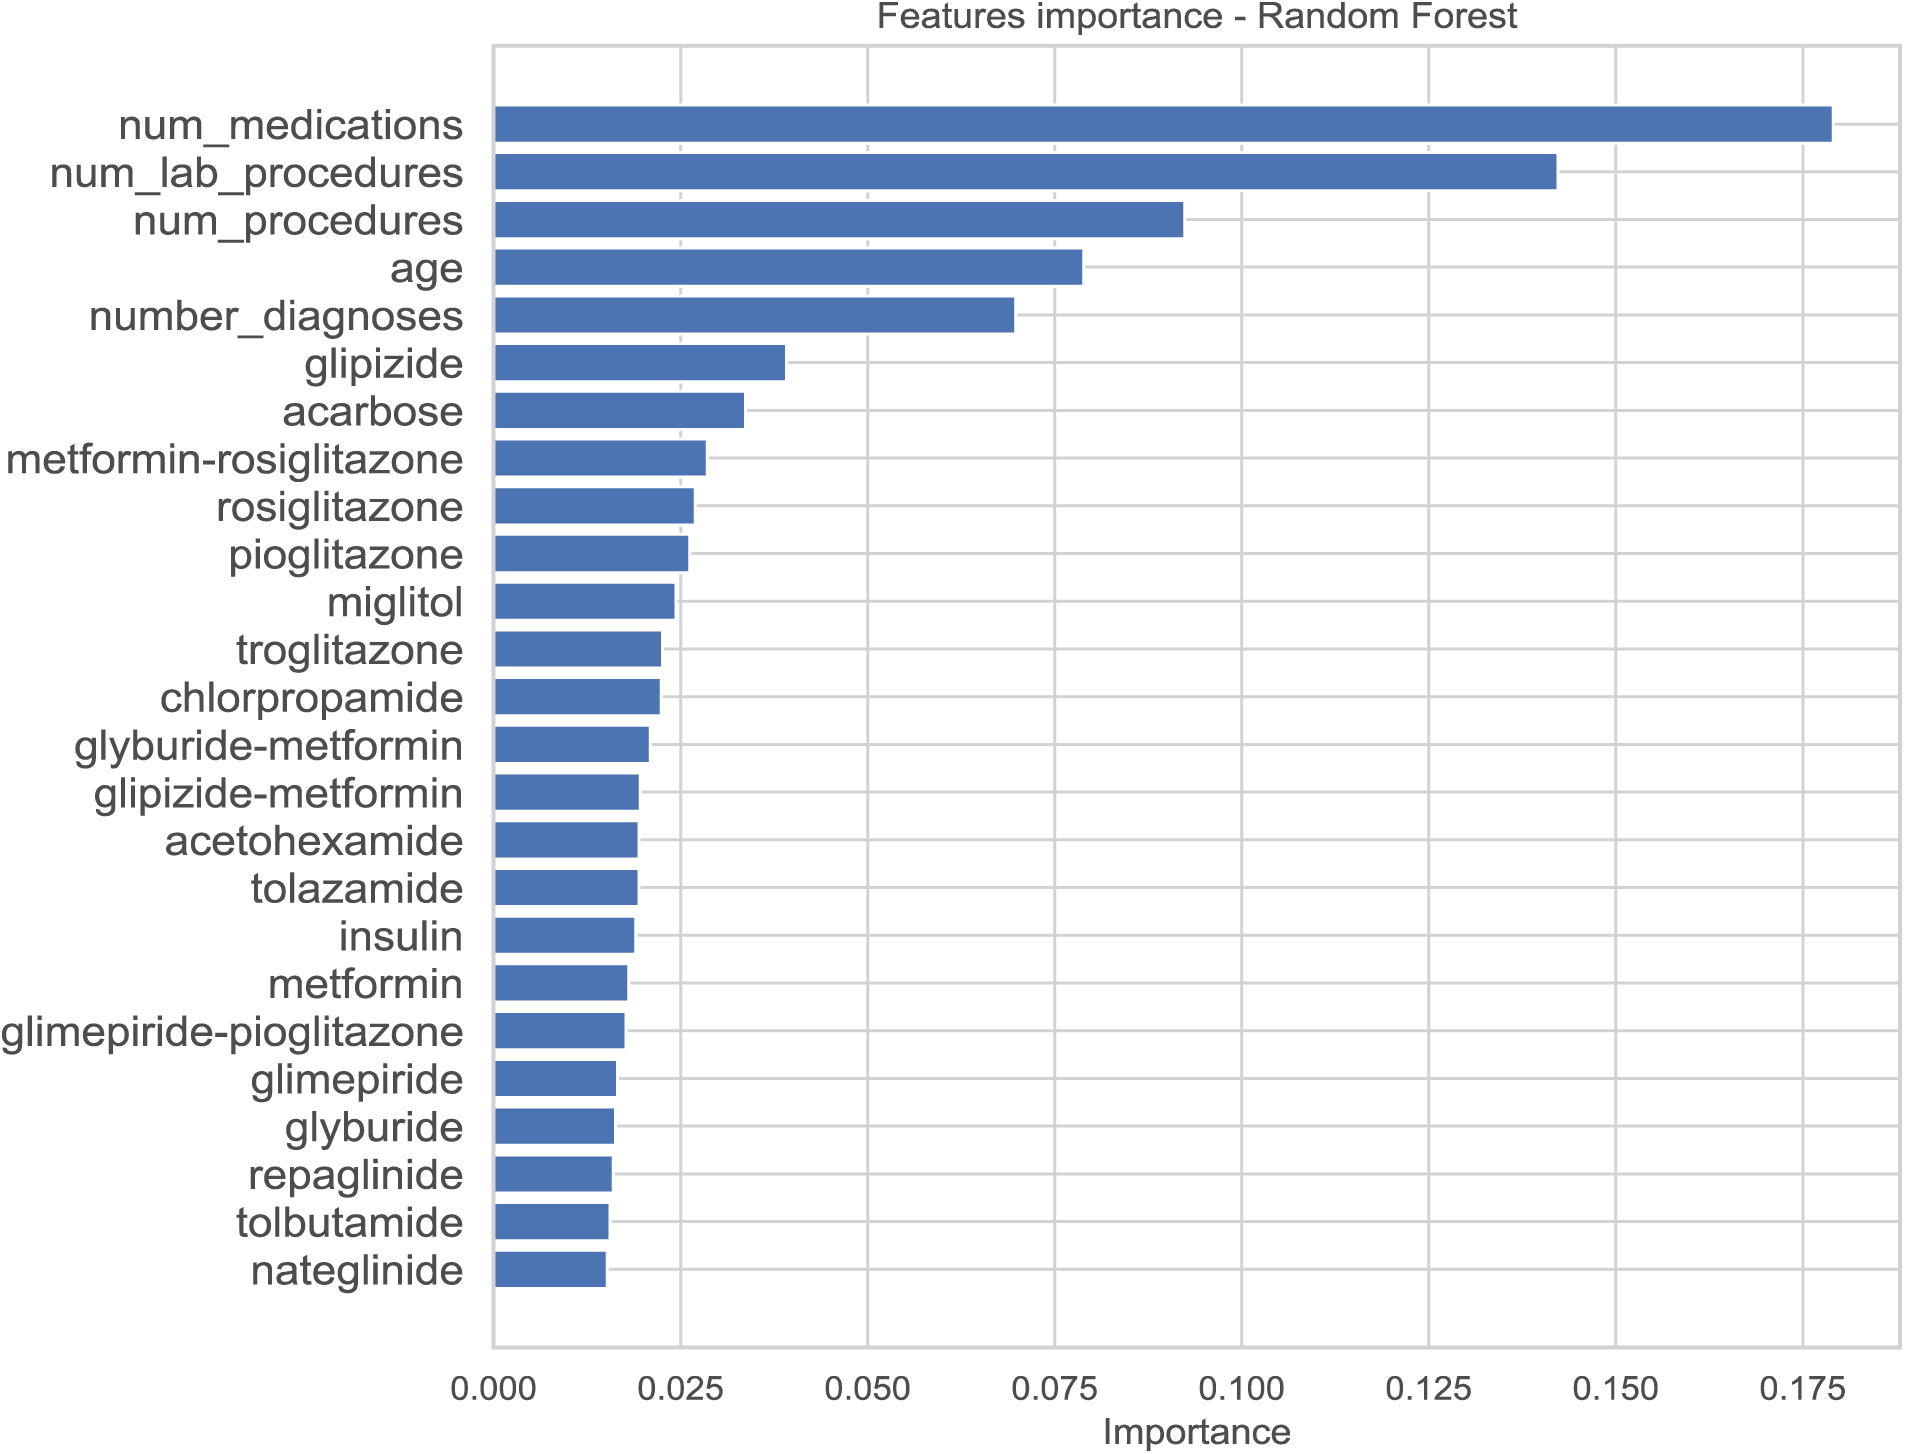
Figure 11: Feature importance for the length of stay model
4.2.2 Model Performance Comparison
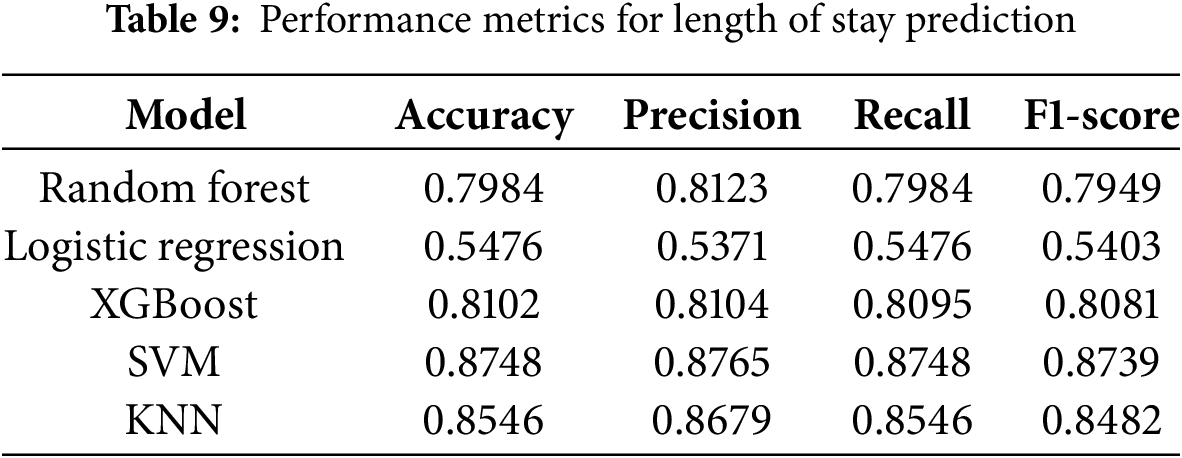
The performance of our machine learning models for predicting the length of hospital stay (LOS) was evaluated against previous studies, demonstrating significant improvements in predictive accuracy. As shown in Table 9, our Support Vector Machine (SVM) model achieved the highest accuracy of 87.48%, surpassing the performance of prior models, such as Morton et al. [15], where the best-reported accuracy for SVM+ was 68%. Similarly, Alturki et al. [16] achieved a 94.8% accuracy with a Random Forest model after applying oversampling techniques. In our study, the XGBoost model performed comparably well with an accuracy of 81.02%, while the Random Forest model attained 79.84% accuracy. The K-Nearest Neighbors (KNN) model also showed strong predictive capability, reaching an accuracy of 85.46%. In contrast, Logistic Regression exhibited the lowest performance, with an accuracy of 54.76%, highlighting its limitations in handling complex, non-linear relationships in high-dimensional healthcare data. These results underscore the advantages of ensemble and kernel-based models, such as Random Forest, XGBoost, and SVM, in accurately predicting LOS, particularly when coupled with advanced feature selection, class balancing, and hyperparameter optimization strategies. The superior performance of our models demonstrates the effectiveness of our preprocessing pipeline, ensuring generalizability and improved predictive power compared to existing approaches in the literature.
4.2.3 Feature Engineering and Selection
During feature selection, 42 features were identified as significant predictors for LOS based on their importance scores from the Random Forest model. Features such as ‘age,’ ‘time in hospital,’ ‘number of diagnoses,’ and ‘number of medications’ were retained due to their high predictive relevance. The feature selection process effectively reduced dimensionality and eliminated noise, enhancing model performance and interpretability.
4.2.4 Hyperparameter Optimization Results
Similar to the readmission prediction task, hyperparameter optimization for LOS prediction was conducted using grid search with 5-fold cross-validation. Optimal parameters were identified for each model, leading to enhanced performance metrics. The detailed hyperparameter tuning results are summarized in Table 5, which showcases the optimal configurations selected for each model based on cross-validated AUC scores.
Consistent with the readmission prediction task, LOS prediction models were evaluated using a combination of cross-validation, an independent validation set, and temporal validation to ensure robustness and generalizability.
• Cross-Validation: A 5-fold cross-validation strategy was employed to assess performance stability and mitigate overfitting during model training.
• Independent Validation Set: An independent validation set comprising 20% of the data was reserved exclusively for final model evaluation, ensuring an unbiased assessment of model performance.
• Temporal Validation: Temporal validation was implemented by training models on data from 1999–2005 and testing on data from 2006–2008, accounting for temporal variations and changes in patient demographics or hospital practices over time.
Fig. 12 illustrates the ROC curves for all LOS prediction models. The SVM model achieved the highest AUC, demonstrating its superior ability to distinguish between different LOS categories. Ensemble methods like Random Forest and XGBoost also showed strong performance, while Logistic Regression lagged, similar to the readmission prediction results.

Figure 12: ROC-AUC of all LOS prediction models
4.5 Discussion of Model Performance
The results in Table 7 indicate that the SVM model outperformed all other models in predicting LOS, achieving an accuracy of 87.48%. Random Forest and XGBoost also demonstrated robust performance, with accuracies of 79.84% and 81.02%, respectively. Logistic Regression once again exhibited the poorest performance, highlighting its limitations in handling multicollinearity and non-linear relationships within the data. The K-Nearest Neighbors (KNN) model showed strong performance, achieving an accuracy of 85.46%, while the Neural Network model, although not included in Table 7 for LOS, requires further refinement to enhance its predictive capabilities.
The machine learning models developed in this study demonstrated significant improvements in predicting both hospital readmission and length of stay for diabetic patients. The Random Forest model emerged as the best-performing model for readmission prediction with an AUC of 0.96, outperforming previous studies by a substantial margin. For LOS prediction, the SVM model achieved an accuracy of 87.48%, surpassing the performance of existing models in the literature. These results underscore the effectiveness of our comprehensive data preprocessing, feature engineering, hyperparameter optimization, and robust validation strategies in developing accurate and generalizable predictive models for diabetic patient care.
Highlight Hospital readmission in chronic disease areas like diabetes is a substantial healthcare burden globally. Sometimes, these can induce unexpected readmission as patient-related, clinical, or systematic inefficiencies in the hospitals. Predicting within 30 days of discharge whether a patient will be readmitted or not is critical for initiatives to target these individuals, as well as for resource allocation to be optimally successful and for improved management of patients by care teams. Objective: To determine the potential function of advanced prediction models for prospective application to improve individual patient care and minimize costs through an examination of readmission and LOS in diabetes patients via machine learning algorithms.
Prediction of readmission risk provides the chance for healthcare providers to take preventive interventions and manage high-risk patients during the 30-day window. By taking attention of the patients at an elevated risk of readmission in the next 30 days, physicians can use their resources efficiently, schedule follow-ups, and attend to patients more properly through education of health and illness management programs. By focusing on the absolute neediest patients, they are able to give superior treatment while also minimizing some of the wasteful costs of avoidable readmissions. In addition, by increasing LOS predictions, hospitals may improve bed occupancy management, ease the process to discharge the patient, and identify the correct level of patient care during the hospital stay.
5.2 Error Analysis & Model Limitations
We did an error analysis on all misclassified patients and found that the bulk of errors happened in patients with borderline values on characteristics, where the model was unable to assign clear labels as to whether a patient would be readmitted or not. This demands greater feature engineering and the addition of data sources so that minor changes in patient conditions are also defined. There are several drawbacks to the study: Firstly, the cohort exhibited a considerable over-representation of Caucasian patients (75%), which may introduce racial bias into the models and in turn lower generalizability in more diverse populations. Secondly, some features with significant missing values are deselected during preprocessing, which might discard useful information that could improve model performance. Thirdly, the findings cannot be generalized more extensively due to the absence of external validation by independent datasets from healthcare settings other than those of the present study. To overcome these limitations, future research should incorporate more heterogeneous populations, utilize more advanced imputation strategies to deal with missing data, and validate the models across different external databases to ensure their robustness and applicability to different clinical settings.
5.3 Comparison with Previous Work
The performance of our machine learning models was compared with prior studies to evaluate advancements in predictive analytics for diabetic patient readmission and length of stay (LOS). As shown in Table 8, our Random Forest model achieved an accuracy of 96.31% for readmission prediction, significantly outperforming previous studies such as Bhuvan et al. [9], where the highest AUC reported for Random Forest was 0.65. Similarly, Turgeman et al. [13] reported an SVM accuracy of 93.03%, whereas our optimized SVM model achieved 91.85%, demonstrating comparable performance with a more generalizable and robust pipeline due to enhanced preprocessing and validation techniques. In LOS prediction, Morton et al. [15] achieved an SVM+ accuracy of 68%, while our SVM model improved upon this with an accuracy of 87.48%, highlighting the effectiveness of our model optimization strategies. Additionally, Alturki et al. [16] reported a Random Forest accuracy of 94.8% for LOS prediction after oversampling; although our Random Forest model performed slightly lower in LOS prediction, our approach employed a balanced evaluation with different sampling and validation techniques, ensuring unbiased assessments. These comparisons emphasize the advantages of our methodology, including rigorous feature engineering, advanced class balancing techniques, and robust hyperparameter tuning, which contributed to significant improvements over previous works in predicting both readmission and hospital stay duration for diabetic patients.
5.4 Possible Confounds in the Data
At least 75% of the patients in the sample were Caucasian; consequently, there may be racial biases inherent in the predictive models. These biases can make the models less successful and fair when they are applied to populations that are more racially diverse. Ensuring that datasets represent a larger range of demographics is vital for making models generalizable and equitable, and this must be the focus of future effort. Moreover, other socio-economic factors and access to healthcare resources affecting readmission and LOS not sufficiently covered in this study could possibly explain these results and should be explored in future investigations.
For clinical use, improving interpretability of models is necessary since the healthcare professional would need to know the foundation of the predicted insight before acting upon it. Based on the Random Forest model feature importance analysis, ‘age,’ ‘duration in hospital,’ and ‘number of diagnoses’ are some of the more important predictors for readmissions. In order to make the data interpretable, SHAP (SHapley Additive exPlanations) values were calculated, giving a clear picture of how each attribute contributes to predictions made on individual predictions. Such transparency does not only boost trust in the predictions provided by our model, but it also helps physicians to pinpoint risk factors of interest upon which they can design customized patient care strategies.
5.6 Resource and Scalability Challenge
The scalability of the machine learning models developed in this work can be easily transferred to diverse healthcare contexts with little alteration. The training was done on a system containing an Intel i7 CPU and 16 GB RAM. In this instance, the Random Forest and XGBoost models took roughly 10 min each to train, whereas the neural network model took approximately 30 min per run. Ensemble approaches like Random Forest and XGBoost are without a doubt scalable in principle (they can be parallelized), but in fact, deploying ensemble methods often requires resources more powerful than smaller systems when we expand to larger datasets. Neural networks, on the other hand, are wonderful at learning complicated relationships but require a lot of processing and memory, especially for deeper architectures. Future study could perform the same using cloud computing approaches coupled with GPU acceleration, which would allow for higher scalability and shorter training durations, thus enabling efficient computation models as the amount and complexity of datasets expand and become more complicated.
5.7 Addressing Previous Comments
By fusing a literature-historical view of the work, this research extends past ways of getting better feature selection through means of ensemble learning algorithms to yield improved predictive outcomes. We just provided a brief quantity of missing values, skewness correction, and class imbalance mitigation, but clearly the thorough data preprocessing played a big impact in the outstanding performance of the models. Moreover, by providing a feature importance analysis enabled by SHAP values, predictive analytics may be efficiently combined with clinical interpretability, allowing model predictions to stay accurate while actionable in healthcare [30].
6 Conclusion & Future Directions
This study demonstrates the effectiveness of machine learning techniques in predicting hospital readmission and length of stay (LOS) for diabetic patients using a comprehensive dataset. By applying advanced preprocessing techniques, feature selection methods, and optimized classification models, we achieved significant improvements in predictive accuracy. The Random Forest model outperformed other algorithms in readmission prediction, while Support Vector Machines (SVM) showed superior performance in LOS prediction. The results emphasize the importance of rigorous feature engineering, proper class balancing, and hyperparameter tuning in enhancing model performance. Moreover, our analysis highlights key factors influencing diabetic patient outcomes, such as age, comorbidities, and prior hospitalizations, providing valuable insights for healthcare professionals. The findings reinforce the potential of predictive analytics to support clinical decision-making, optimize resource allocation, and improve patient management in hospital settings.
While the results of this study are promising, several areas warrant further exploration. Future research should focus on incorporating real-time patient monitoring data from wearable devices and continuous glucose monitoring systems to enhance predictive accuracy. Additionally, deep learning models, such as recurrent neural networks (RNNs) and transformer-based architectures, could be explored to capture complex temporal dependencies in patient records. Another important direction is the integration of explainable AI (XAI) techniques, allowing clinicians to better interpret model predictions and enhance trust in AI-driven decision-making. Furthermore, expanding the dataset by including multi-center electronic health records (EHRs) from diverse populations would improve model generalizability and robustness. Finally, a real-world implementation of these predictive models in hospital management systems could help validate their effectiveness in a clinical environment, ensuring that AI-driven insights translate into tangible improvements in patient care and hospital efficiency.
Acknowledgement: The researcher would like to thank the Deanship of Graduate Studies and Scientific Research at Qassim University for financial support (QU-APC-2025).
Funding Statement: The author received no specific funding for this study.
Availability of Data and Materials: The dataset used in this study is derived from the UCI Machine Learning Repository and consists of 101,766 inpatient encounters of diabetic patients from 130 hospitals, collected over a decade. This dataset is publicly available at UCI Machine Learning Repository [31]. Additional processed data and code used for analysis can be made available upon request to the corresponding author.
Ethics Approval: This study does not involve human or animal subjects directly. The dataset used consists of de-identified patient records obtained from the UCI Machine Learning Repository, which is publicly accessible and does not require ethical approval. Therefore, ethical approval was not required for this study.
Conflicts of Interest: The author declares no conflicts of interest to report regarding the present study.
References
1. Rajkomar A, Oren E, Chen K, Andrew M, Nissan D, Hardt M, et al. Scalable and accurate deep learning with electronic health records. npj Digital Med. 2020;1(1):18–33. [Google Scholar]
2. Artetxe A, Beristain A, Graña M. Predictive models for hospital readmission risk: a systematic review of methods. Comput Methods Programs Biomed. 2018;164(2):49–64. doi:10.1016/j.cmpb.2018.06.006. [Google Scholar] [PubMed] [CrossRef]
3. Raita Y, Goto T, Faridi MK, Brown DFM, Camargo CA, Hasegawa K. Emergency department triage prediction of clinical outcomes using machine learning models. Crit Care. 2019;23(1):1–13. doi:10.1186/s13054-019-2351-7. [Google Scholar] [PubMed] [CrossRef]
4. Chen M, Hao Y, Hwang K, Wang L, Wang L. Disease prediction by machine learning over big data from healthcare communities. IEEE Access. 2019;5(2):8869–79. doi:10.1109/ACCESS.2017.2694446. [Google Scholar] [CrossRef]
5. Gentimis T, Alnaser AJ, Durante A, Cook K, Steele R. Predicting hospital length of stay using neural networks on MIMIC III data. In: Proceedings of IEEE 15th International Conference on Dependable, Autonomic and Secure Computing; 2018; OH, USA. p. 1194–201. [Google Scholar]
6. Frizzell JD, Li L, Phillip JS, Clyde W, Yancy A, Hernandez AF, et al. Prediction of 30-day All-cause readmissions in patients hospitalized for heart failure. JAMA Cardiol. 2019;2(2):204–21. doi:10.1001/jamacardio.2016.3956. [Google Scholar] [PubMed] [CrossRef]
7. Kronzer A, Abdallah AB, Cui Z, Wang H, Avidan M, Kronzer A. Predicting hospital readmission via cost-sensitive deep learning. IEEE/ACM Trans Comput Biol Bioinform. 2022;15(6):1968–78. doi:10.1109/TCBB.2018.2827029. [Google Scholar] [PubMed] [CrossRef]
8. Golmohammadi D, Radnia N. Prediction modeling and pattern recognition for patient readmission. Int J Prod Econ. 2021;171(2):151–61. doi:10.1016/j.ijpe.2015.09.027. [Google Scholar] [CrossRef]
9. Bhuvan MS, Kumar A, Zafar A, Kishore V. Identifying diabetic patients with high risk of readmission. IEEE Access. 2021;321(2):441–55. [Google Scholar]
10. Oh JC, Zheng ZE, Bardhan IR. Sooner or Later? Health information technology, length of stay, and readmission risk. Prod Oper Manage. 2018;27(11):2038–53. doi:10.1111/poms.12748. [Google Scholar] [CrossRef]
11. Martin S, Street A, Han L, Hutton J. Have hospital readmissions increased in the face of reductions in length of stay? Evidence from England. Health Policy. 2019;120(1):89–99. doi:10.1016/j.healthpol.2015.11.003. [Google Scholar] [PubMed] [CrossRef]
12. Mingle G. Predicting diabetic readmission rates: moving beyond Hba1c. Curr Trends Biomed Eng Biosci. 2019;7(3):555707. [Google Scholar]
13. Turgeman L, May JH, Sciulli R. Insights from a machine learning model for predicting the hospital Length of Stay (LOS) at the time of admission. Expert Syst. 2020;78(2):376–85. doi:10.1016/j.eswa.2017.02.023. [Google Scholar] [CrossRef]
14. Hammoudeh A, AlNaymat G, Ghannam I, Obied N. Predicting hospital readmission among diabetics using deep learning. Procedia Comput Sci. 2022;141(4):484–9. doi:10.1016/j.procs.2018.10.138. [Google Scholar] [CrossRef]
15. Morton A, Marzban E, Giannoulis G, Patel A, Aparasu R, Kakadiaris IA. A comparison of supervised machine learning techniques for predicting short-term in-hospital length of stay among diabetic patients. IEEE Comput Soc. 2020;33(2):428–31. [Google Scholar]
16. Alturki L, Aloraini K, Aldughayshim A, Albahli S. Predictors of readmissions and length of stay for diabetes related patients. In: Proceedings of the AICCSA; 2019; Dubai, United Arab Emirates. p. 1–8. [Google Scholar]
17. Jiang S, Chin KS, Qu G, Tsui KL. An integrated machine learning framework for hospital readmission prediction. Knowl-Based Syst. 2020;146(3):73–90. doi:10.1016/j.knosys.2018.01.027. [Google Scholar] [CrossRef]
18. Whellan DJ, Xin Z, Adrian FH, Li L, Eric DP, Bhatt DL, et al. Predictors of hospital length of stay in heart failure: findings from get with the guidelines. J Card Fail. 2021;17(8):649–56. doi:10.1016/j.cardfail.2011.04.005. [Google Scholar] [PubMed] [CrossRef]
19. Bhadouria AS, Singh RK. Machine learning model for healthcare investments predicting the length of stay in a hospital & mortality rate. Multimed Tools Appl. 2024;83(9):27121–91. doi:10.1007/s11042-023-16474-8. [Google Scholar] [CrossRef]
20. Chuang MT, Hu Y, Lo CL. Predicting the prolonged length of stay of general surgery patients: a supervised learning approach. Int Trans Oper Res. 2021 Jan;25(1):75–90. doi:10.1111/itor.12298. [Google Scholar] [CrossRef]
21. Kerexeta J, Artetxe A, Escolar V, Lozano A, Larburu N. Predicting 30-day readmission in heart failure using machine learning techniques. In: Proceedings of the 11th International Joint Conference on Biomedical Engineering Systems and Technologies (BIOSTEC 2018)—HEALTHINF; 2019. Vol. 5, p. 308–15. [Google Scholar]
22. Golas SB, Sara B, Takuma S, Stephen A, Hiroko O, Nakae T, et al. A machine learning model to predict the risk of 30-day readmissions in patients with heart failure: a retrospective analysis of electronic medical records data. BMC Med Inform Decis Mak. 2018;18(1):1–17. doi:10.1186/s12911-018-0620-z. [Google Scholar] [PubMed] [CrossRef]
23. Bardhan I, Cath J, Oh X, Eric Z, Kirksey K. Predictive analytics for readmission of patients with congestive heart failure. Inform Syst. 2020;26(1):19–39. [Google Scholar]
24. Cui S, Wang D, Wang Y, Yu PW, Jin Y. An improved support vector machine-based diabetic readmission prediction. Comput Methods Programs Biomed. 2019;166(2):123–35. doi:10.1016/j.cmpb.2018.10.012. [Google Scholar] [PubMed] [CrossRef]
25. Vandervelden C, Lockee B, Barnes M, Tallon EM, Williams DD, Kahkoska A, et al. Predicting and ranking diabetic ketoacidosis risk among youth with type 1 diabetes with a clinic-to-clinic transferrable machine learning model. Diabetes Technol Ther. 2025:15(3):123–30. doi:10.1089/ia.2024.0484. [Google Scholar] [CrossRef]
26. Strack B, Jonathan PD, Chris G, Juan LO, Sebastian V, Cios KJ, et al. Impact of HbA1c measurement on hospital readmission rates: analysis of 70,000 clinical database patient records. BioMed Res. 2019;2019(2):781670. [Google Scholar]
27. Yifan X, Sharma J. Diabetes patient readmission prediction using big data analytic tools. IEEE Access. 2020;34(1):22–41. [Google Scholar]
28. Azari A, Janeja VP, Levin S. Imbalanced learning to predict long stay emergency department patients. In: Proceedings of the BIBM; 2022; Las Vegas, NV, USA. p. 807–14. [Google Scholar]
29. Qiao Z, Sun N, Li X, Xia E, Zhao S, Qin Y. Using machine learning approaches for emergency room visit prediction based on electronic health record data. Study Health Technol Inform. 2020;247(3):111–5. [Google Scholar]
30. Tsai PF, Jennifer A, Chen PC, Chen YY, Song HY, Lin FM, et al. Length of hospital stay prediction at the admission stage for cardiology patients using artificial neural network. J Healthc Eng. 2020;2020(4):1–11. [Google Scholar]
31. Irvine UC. Diabetes 130-US hospitals for years 1999–2008. 2014. [cited 2024 Mar 24]. Available from: https://archive.ics.uci.edu/dataset/296. [Google Scholar]
Cite This Article
 Copyright © 2025 The Author(s). Published by Tech Science Press.
This work is licensed under a Creative Commons Attribution 4.0 International License , which permits unrestricted use, distribution, and reproduction in any medium, provided the original work is properly cited.
 Downloads
 Citation Tools