
 Submit a Paper
 Propose a Special lssue
 Open Access
ARTICLE
Heart Disease Prediction Model Using Feature Selection and Ensemble Deep Learning with Optimized Weight
1 Department of Information Technology, Institute of Graduate Studies and Research, Alexandria University, Alexandria, 21526, Egypt
2 Faculty of Computers and Data Science, Alexandria University, Alexandria, 5432042, Egypt
* Corresponding Author: Saad M. Darwish. Email:
(This article belongs to the Special Issue: Advanced Computational Intelligence Techniques, Uncertain Knowledge Processing and Multi-Attribute Group Decision-Making Methods Applied in Modeling of Medical Diagnosis and Prognosis)
Computer Modeling in Engineering & Sciences 2025, 143(1), 875-909. https://doi.org/10.32604/cmes.2025.061623
Received 28 November 2024; Accepted 28 February 2025; Issue published 11 April 2025
 View Full Text
 Download PDF
Abstract
Heart disease prediction is a critical issue in healthcare, where accurate early diagnosis can save lives and reduce healthcare costs. The problem is inherently complex due to the high dimensionality of medical data, irrelevant or redundant features, and the variability in risk factors such as age, lifestyle, and medical history. These challenges often lead to inefficient and less accurate models. Traditional prediction methodologies face limitations in effectively handling large feature sets and optimizing classification performance, which can result in overfitting poor generalization, and high computational cost. This work proposes a novel classification model for heart disease prediction that addresses these challenges by integrating feature selection through a Genetic Algorithm (GA) with an ensemble deep learning approach optimized using the Tunicate Swarm Algorithm (TSA). GA selects the most relevant features, reducing dimensionality and improving model efficiency. The selected features are then used to train an ensemble of deep learning models, where the TSA optimizes the weight of each model in the ensemble to enhance prediction accuracy. This hybrid approach addresses key challenges in the field, such as high dimensionality, redundant features, and classification performance, by introducing an efficient feature selection mechanism and optimizing the weighting of deep learning models in the ensemble. These enhancements result in a model that achieves superior accuracy, generalization, and efficiency compared to traditional methods. The proposed model demonstrated notable advancements in both prediction accuracy and computational efficiency over traditional models. Specifically, it achieved an accuracy of 97.5%, a sensitivity of 97.2%, and a specificity of 97.8%. Additionally, with a 60–40 data split and 5-fold cross-validation, the model showed a significant reduction in training time (90 s), memory consumption (950 MB), and CPU usage (80%), highlighting its effectiveness in processing large, complex medical datasets for heart disease prediction.Keywords
Heart disease remains a leading global health issue, contributing significantly to mortality rates. Early and accurate predictions of heart disease are critical to improving patient outcomes and reducing healthcare costs [1]. Several diagnostic methods are used to assess heart disease, ranging from clinical evaluations to advanced imaging and biochemical tests, each with its strengths and limitations [2,3]. Non-invasive techniques like the electrocardiogram (ECG) and echocardiogram (ECHO) are widely available and cost-effective, detecting abnormal heart rhythms and assessing heart structure. However, ECGs are limited in early-stage detection and may provide insufficient detail, while ECHOs rely heavily on operator skill and struggle with clarity in certain patients. Cardiac stress tests assess heart function under stress but can miss early disease or be unsuitable for patients unable to perform physical exertion. Invasive procedures like cardiac catheterization and angiography remain the gold standard for identifying coronary blockages but carry risks like bleeding and infection, making them less suitable for routine use. Blood tests, such as those measuring troponin or cholesterol levels, are simple but cannot provide structural insights and may lead to false alarms. Non-invasive imaging, like CT coronary angiography, offers detailed artery views but involves radiation and high costs, limiting accessibility. While these methods collectively provide a comprehensive understanding of heart health, many struggle with early detection, accuracy, and cost-effectiveness, making heart disease prediction and diagnosis an ongoing challenge [4,5].
However, current diagnostic methods often struggle with precision due to the complexity of symptoms and the influence of various risk factors such as age, lifestyle, and pre-existing conditions. These challenges create a need for an advanced predictive model that can effectively analyze patient data, account for uncertainties, and provide reliable predictions of heart disease risk. Machine learning models improve heart disease prediction by enabling early detection, increasing diagnostic accuracy, and tailoring treatment based on patient data. These models can analyze complex patterns across diverse data sources like clinical records and imaging, providing more precise predictions than traditional methods. However, challenges remain, including the need for high-quality data, issues with interpretability, risks of overfitting, and difficulties integrating into clinical practice. Despite these hurdles, Machine Learning (ML) offers promising advancements in heart disease prediction, but further research is required for widespread clinical adoption [6–8].
Ensemble learning presents several advantages over traditional deep learning methods for heart disease prediction, making it a compelling choice in this area [9,10]. By combining multiple models, ensemble methods improve accuracy and robustness, leveraging the strengths of various algorithms to minimize errors and reduce overfitting. This approach captures diverse patterns and relationships in complex medical datasets, enhancing analysis. Additionally, ensemble methods reduce variability by averaging predictions, providing consistent and reliable outcomes crucial for clinical decision-making. They also handle imbalanced datasets more effectively through techniques like bagging and boosting, focus on challenging instances, and offer insights into feature importance, aiding clinicians in understanding key risk factors. Furthermore, ensemble methods require less extensive hyperparameter tuning than traditional deep learning, making them easier to implement. However, determining the optimal weights for each model can be a complex task. Different models may perform well under different conditions, and finding a single set of weights that works across all scenarios can be difficult. This complexity often requires sophisticated optimization techniques, which can be computationally intensive and time-consuming [11,12].
The Tunicate Swarm Algorithm (TSA) is justified for ensemble learning weight adjustment due to its superior balance of exploration and exploitation, robustness against local optima, faster convergence rates, and adaptability to high-dimensional and multi-objective optimization problems, making it more effective than current swarm intelligence methods [13]. TSA can dynamically adjust its search strategy based on the feedback from the optimization process, allowing it to fine-tune weight adjustments more effectively in varying contexts or datasets. The fitness function is crucial in the TSA as it influences both optimization and model performance. It assesses weight configurations using metrics like accuracy allowing TSA to evaluate and compare models effectively. Higher fitness scores guide the algorithm in navigating the solution space, helping to avoid local optima. The function’s adaptability accommodates various performance metrics, addressing the complexity of heart disease by optimizing sensitivity, specificity, and interpretability. Furthermore, it acts as a feedback mechanism that refines the search strategy through iterative evaluations and benchmarks ensemble performance, identifying key models for enhanced interpretability and clinical relevance [14,15].
Feature extraction and selection are essential for enhancing heart disease prediction models. Feature extraction transforms raw data into meaningful representations that capture critical patterns from complex datasets, such as clinical records and imaging data, revealing hidden correlations that improve the model’s ability to distinguish between healthy individuals and those at risk [16]. In contrast, feature selection identifies the most relevant features, reducing dimensionality and minimizing noise to prevent overfitting and enhance model performance. By focusing on impactful features, the model’s generalizability and interpretability improve, allowing clinicians to better understand the critical risk factors associated with heart disease prediction. Genetic Algorithms (GAs) are popular for feature selection because they effectively explore broad solution spaces, avoiding local optima and handling complex subset searches. Their flexibility allows for various data types and fitness functions, optimizing multiple criteria such as accuracy and interpretability. GAs are also robust against noisy data and maintain diversity to prevent premature convergence, enhancing exploration. They evaluate multiple candidates simultaneously, leading to faster convergence in high-dimensional feature spaces, and can adapt to changing datasets. These strengths make GAs particularly suitable for feature selection in complex scenarios [17–20].
Heart disease prediction is a vital healthcare challenge, where timely and accurate diagnoses can save lives and lower costs. However, this task is hindered by several inherent issues, including the high dimensionality of medical datasets, which often contain numerous features, complicating the identification of relevant information for predictions. Additionally, many features may be irrelevant or redundant, resulting in inefficiencies and higher computational costs. The variability in individual risk factors—such as age, lifestyle, and medical history—further complicates the prediction models and can impact their accuracy. Traditional prediction methodologies struggle to effectively handle large feature sets and optimize classification performance, leading to overfitting, poor generalization to unseen data, and increased resource consumption due to inefficient data processing.
Merging optimal feature selection and optimal classifier optimization under a unified framework for heart disease prediction is a groundbreaking approach, addressing key challenges for the first time in this domain. The integration of optimal feature selection, through GA, ensures that only the most relevant and impactful features are used, reducing dimensionality, noise, and computational complexity. Simultaneously, optimizing classifier performance, achieved with TSA for model weighting, enhances the accuracy and robustness of the prediction model. This combined approach maximizes the strengths of both feature selection and classification, allowing the model to not only process data efficiently but also deliver highly accurate predictions. By uniting these two processes, the framework significantly improves model generalization, prediction precision, and resource efficiency, offering a comprehensive and superior solution for heart disease prediction for the first time.
The remainder of this paper consists of the following sections: Section 2 provides a literature review of relevant publications regarding heart disease prediction frameworks. The suggested approach is presented in Section 3. The assessment of the suggested approach, including results and discussion, is presented in Section 4. The study is concluded, and possible future directions are discussed in Section 5.
In recent years, heart disease prediction has gained significant attention within the field of medical diagnostics due to its critical impact on global health. Numerous machine learning and deep learning models have been employed to improve the accuracy and reliability of predictions, leveraging advancements in computational techniques [1–5]. Traditional models like decision trees, support vector machines (SVMs), and k-nearest neighbors (k-NN) have demonstrated varying degrees of success. However, the complexity and high dimensionality of medical datasets necessitate more sophisticated approaches. Ensemble deep learning models, which combine the strengths of multiple base learners, have emerged as a promising solution for enhancing prediction performance [9–11]. This section reviews the latest approaches in heart disease prediction, focusing on feature selection methods, ensemble learning strategies, and optimization techniques that contribute to enhanced predictive performance.
In recent heart disease prediction studies, feature selection methods have played a critical role in improving model performance by identifying the most relevant features from often complex and high-dimensional medical datasets. These approaches not only reduce computational complexity but also enhance model interpretability and accuracy. Several feature selection techniques have been employed, ranging from traditional statistical methods to modern optimization algorithms and machine learning-based techniques [16,17]. Filter methods rank features based on statistical tests (e.g., correlation, Chi-square), offering speed and interpretability, though they overlook feature interactions and struggle with complex, non-linear data. Wrapper methods, such as recursive feature elimination and genetic algorithms, account for feature interactions and boost accuracy but are computationally intensive and risk overfitting. Embedded methods, like random forest, combine feature selection with model training, offering efficiency and reduced overfitting but being model-specific and less interpretable. Lastly, optimization-based methods (e.g., Particle Swarm Optimization) explore feature space efficiently and handle non-linear data but come with high computational costs and may converge to local optima if not fine-tuned properly [18–20]. The combination of these feature selection methods with ensemble deep learning approaches has been a focal point in recent studies, with models showing increased accuracy and reliability when selecting optimal features.
Ensemble learning strategies for heart disease prediction are primarily classified into bagging, boosting, and stacking. Bagging, like random forests, trains multiple models on different data subsets and combines their predictions, reducing overfitting and improving accuracy. Boosting methods, such as Adaptive Boosting (AdaBoost), Gradient Boosting Machine (GBM), and Extreme Gradient Boosting (XGBoost), train models sequentially, with each model correcting the previous one’s errors, yielding higher predictive accuracy but requiring more computational resources. Stacking combines multiple base models and uses a meta-model to refine predictions, offering flexibility and power but necessitating careful tuning to avoid overfitting [8–11]. In Ref. [21], the authors presented an approach that combines the strengths of ensemble learning algorithms with Bayesian optimization for hyperparameter tuning. The ensemble classifiers utilized include Adaptive Boosting (AdaBoost), Random Forest, and XGBoost.
The authors in Ref. [22] suggested an enhanced machine learning method for predicting heart disease risk by randomly partitioning the dataset using a mean-based splitting approach and modeling the partitions with Classification and Regression Trees (CART). A homogeneous ensemble is then formed from these CART models through an accuracy-based weighted aging classifier ensemble, a refinement of the traditional weighted aging classifier ensemble. In Ref. [23], the authors presented a deep stacking ensemble model designed to enhance heart disease prediction by integrating two optimized, pre-trained hybrid deep learning models with a Support Vector Machine (SVM) as the meta-learner. The first model combines Convolutional Neural Networks (CNN) with Long Short-Term Memory (LSTM), while the second pairs CNN with Gated Recurrent Units (GRU). Recursive Feature Elimination (RFE) is used for feature selection optimization. The model is tested on two heart disease datasets and compared with five machine learning models: Logistic Regression (LR), Random Forest (RF), K-Nearest Neighbors (K-NN), Decision Tree (DT), and Naïve Bayes (NB). The results indicate that the proposed ensemble outperforms others using the full feature set.
The work presented in Ref. [24] introduced a hybrid model that combines unsupervised and supervised learning techniques for modeling and processing heart disease diagnosis. The model features collaborative clustering and an ensemble approach, treating mixed data clustering as a multi-view problem where specialized algorithms are applied to each view. A novel framework facilitates information exchange between these algorithms, creating expert models that capture different feature spaces. The expectation-maximization algorithm underpins this optimization, improving convergence through a collaborative entropy term. An ensemble method akin to stacking is employed, using logistic regression as the meta-classifier to train on expert model predictions and generate the final output. The study in Ref. [25] presented a machine learning model that combines various preprocessing steps, hyperparameter optimization techniques, and ensemble learning algorithms to predict heart disease. By merging three similar-featured datasets from Kaggle, they created a comprehensive dataset for analysis. Utilizing the extra trees classifier, normalizing the data, and applying grid search cross-validation for hyperparameter tuning while splitting the dataset in an 80:20 ratio for training and testing, their approach achieved an accuracy of 98.15%. These results highlight the model’s potential for accurately predicting heart disease presence, which could significantly enhance early prevention, detection, and treatment efforts, thereby reducing heart disease-related mortality and morbidity.
This study presented in Ref. [26] aims to accurately predict cardiovascular diseases (CVDs) by considering patients’ health and socio-economic conditions while addressing challenges associated with imbalanced data. The adaptive synthetic sampling technique is employed for data balancing, and the Point Biserial correlation coefficient is used for feature selection. Two deep learning models are utilized: the Ensemble-based Cardiovascular Disease Detection Network (EnsCVDD-Net), which combines LeNet and Gated Recurrent Unit (GRU), and the Blending-based Cardiovascular Disease Detection Network (BlCVDD-Net), which integrates LeNet, GRU, and Multilayer Perceptron. Evaluating performance metrics reveals that EnsCVDD-Net achieves 88% accuracy, 88% F1-score, 91% precision, 85% recall, and executes in 777 s, while BlCVDD-Net surpasses state-of-the-art models with 91% accuracy, 91% F1-score, 96% precision, 86% recall, and a 247-s execution time.
The research in Ref. [27] focused on developing an ML system for early CVD prediction by conducting a thorough comparative analysis of various ML algorithms using the Cleveland and Statlog heart datasets. The Cleveland dataset is used to train multiple algorithms, including decision trees, random forests, support vector machines, logistic regression, adaptive boosting, and K-nearest neighbors, with performance evaluated through accuracy, precision, recall, F1 score, and area under the curve metrics. Hyperparameter tuning is employed to identify optimal settings for each algorithm, utilizing 10-fold cross-validation and a 95% confidence interval to ensure reliable performance assessment. The heart disease prediction system was suggested in Ref. [28] which employs a bagging ensemble technique combined with Deep Belief Network (DBN) algorithms. It focuses on predicting heart disease using datasets collected from Kaggle, utilizing feature extraction through the Bag of Words method to accurately process the data. The utilized data mining system, which is vital for data aggregation, leverages the bagging ensemble technique for efficient collection and parallel processing of homogeneous data. The initial step involves data preprocessing using this technique. The performance of the cardiovascular disease prediction using the DBN algorithm is then compared to existing heart disease prediction systems, assessing classification accuracy, sensitivity, and specificity to evaluate improvements over past and present methodologies.
In Ref. [29], the author’s work introduced a novel stacking model, which incorporates three base classifiers: KNN, DT, and SVM, with a Bidirectional Long Short-Term Memory model based on Attention Mechanisms (ABiLSTM) serving as the meta-layer for final predictions. To reduce temporal complexity and improve accuracy, Principal Component Analysis (PCA) is employed for dimensionality reduction and feature fusion. The performance of the Stacked Dimensionality-reduced KNN, DT, and SVM with an Attention-based BiLSTM (SDKABL) is evaluated against other independent classifiers using various metrics. In Ref. [30], the authors presented a machine learning approach that employs Multiple Imputation by Chained Equations (MICE) to mitigate missing data, the Interquartile Range (IQR) method for handling outliers, and Synthetic Minority Over-sampling Technique (SMOTE) to address class imbalance. To optimize feature selection, they utilized the Hybrid 2-tier Grasshopper Optimization with L2 regularization methodology, termed GOL2-2T. Additionally, an Adaboost decision fusion (ABDF) ensemble learning algorithm is enhanced with a babysitting technique for hyperparameter tuning. The heart disease prediction model achieved an accuracy of 83.0% and a balanced F1 score of 84.0%. The incorporation of SMOTE, IQR for outlier detection, MICE, and GOL2-2T for feature selection enhances the model’s robustness and predictive performance.
The work presented in Ref. [31] offered a novel approach for forecasting heart disease through a 2-tier process that combines Analysis of Variance (ANOVA) and Least Absolute Shrinkage and Selection Operator (LASSO) regression, termed NOVA and LASSO-based Analysis for heart disease prediction (ALAN), to identify significant features. Additionally, it employs an Ensemble Technique with Adaptive Boosted Decision Fusion (ET-ABDF) to enhance accuracy. The ALAN technique significantly improves the detection of critical properties for predictive modeling. The ET-ABDF model demonstrates impressive performance in identifying cardiac disease, achieving an accuracy of 88.0%, precision of 89.81%, recall of 89.80%, and an F1 Score of 89.00%. The study in Ref. [32] introduced a new stack predictor for heart disease detection, termed Stacked Predictor for Heart Disease Detection (SPFHD), which utilizes five common tree-based ensemble learning algorithms as base models. The predictions from these models are integrated using a support vector machine to enhance detection accuracy. To address class imbalance, a novel Conditional Variational Autoencoder (CVAE) method is developed, demonstrating superior performance compared to traditional balancing methods. The SPFHD model is further optimized through Bayesian optimization. Results indicate that SPFHD outperforms state-of-the-art methods across four datasets, achieving F1-score improvements of 4.68%, 4.55%, 2%, and 1% for the HD clinical, Z-Alizadeh Sani, Statlog, and Cleveland datasets, respectively.
In Ref. [33], the authors reviewed various computer-aided diagnosis (CAD) systems for heart disease, focusing on machine learning (ML) approaches and their strengths and weaknesses. Traditional bagging ensemble (BE) achieved an accuracy of 95.3%, outperforming SVM and Artificial Neural Network (ANN) by 0.3% and 3.3%, respectively, though SVM had a faster training time of 755.5 µs, outperforming ANN and BE by 160.5 µs. Quantum-enhanced ML (QuEML) methods showed an average accuracy of 94.7%, 0.6% higher than traditional ML (TML), with a notable improvement in training time, outperforming TML by 192.5 µs, proving QuEML’s advantage in accuracy and computational efficiency. This study presented in Ref. [34] employed techniques like KNN, random forests, and SVM on a comprehensive dataset covering diverse demographics, clinical, and lifestyle factors to enhance cardiovascular risk prediction. The focus is on improving model efficiency and interpretability through feature selection, aiming for better accuracy and resilience. With a 90% accuracy rate, the study supports efforts to improve cardiovascular risk assessment through advanced analytics, aiding in early diagnosis and personalized treatment.
Research Gap
Ensemble deep learning models for heart disease prediction face challenges in optimizing the feature set and fine-tuning the weights between base models, impacting accuracy, robustness, and generalization across diverse datasets. Feature selection is critical, as using all features can lead to overfitting, and redundant data can introduce multicollinearity. Advanced feature engineering and dynamic importance alignment across models are needed to maximize predictive power. Additionally, balancing model diversity and accuracy while fine-tuning ensemble weights is complex, as traditional static weighting may not adapt to shifting data distributions, and highly correlated models can diminish ensemble performance. Research gaps include the need for feature selection algorithms tailored to heart disease, and advanced meta-learning for dynamic weight optimization.
The goal of this problem is to predict the presence or absence of heart disease in patients based on their medical features. This task is formulated as a binary classification problem [1,2]. We aim to develop a model that maximizes prediction accuracy by selecting an optimal subset of relevant features and applying an ensemble learning method to enhance predictive performance. Let
Feature selection aims to identify a subset
Ensemble learning improves prediction performance by combining the outputs of multiple models. The intuition is that different models can capture different aspects of the data, and by aggregating their predictions, we can achieve more robust and accurate results. Let
Given the optimal feature subset

Figure 1: The suggested classification model for heart disease prediction
In the context of our proposed heart disease detection model, “real-time clinical application” is a vital aspect that can have a significant impact on patient care, particularly in high-stakes medical environments. Our model can be deployed in real-time to assist clinicians with quick and accurate heart disease risk assessments. The core of real-time clinical application lies in the model’s ability to process patient data—such as ECG readings, blood pressure, cholesterol levels, and medical history—almost instantaneously and generate risk predictions without the need for lengthy manual analysis or delays in decision-making. For instance, in an emergency room, the model can rapidly analyze incoming patient data, flagging high-risk individuals based on their vital signs or symptoms. This immediate feedback helps doctors prioritize critical cases, decide on urgent diagnostic tests (like stress tests or angiograms), or initiate treatments (such as prescribing medication or scheduling surgery) on time. Furthermore, our model can be integrated with electronic health record (EHR) systems to facilitate seamless data flow, ensuring that all relevant patient information is considered when making predictions.
Another practical example is in telemedicine or remote monitoring, where wearable devices or health trackers can continuously collect patient data (e.g., heart rate, activity level, and blood pressure). The model can process this data in real-time to monitor the patient’s cardiovascular health, alerting both the patient and healthcare provider of any potential issues. This continuous monitoring offers a dynamic, up-to-date risk profile that can guide clinical decisions, allowing for proactive intervention and early detection of any signs of worsening health.
However, for real-time clinical application to be effective, the model must ensure high accuracy, low latency, and robustness across diverse patient populations. Challenges such as data quality, noise, and patient variability need to be addressed, especially when deploying in real-world environments where data may be inconsistent or noisy. This is where optimization techniques, such as GA and TSA, enhance the model’s ability to adapt and provide reliable results, ensuring that healthcare professionals can trust the model’s predictions and make informed decisions without delay. Thus, the real-time aspect of our model not only supports faster clinical decisions but also enhances patient outcomes by allowing for earlier interventions and continuous monitoring of cardiovascular health.
3.1 Data Collection and Preprocessing
The UCI Cleveland Heart Disease dataset was collected from the Cleveland Clinic Foundation to support research in heart disease prediction. It consists of 303 patient records and originally 76 medical attributes, of which 14 are most commonly used for analysis. The dataset includes key clinical and diagnostic features such as age, gender, chest pain type, blood pressure, cholesterol levels, and results from electrocardiograms and exercise stress tests. The primary goal of data collection was to determine the presence or absence of heart disease based on these attributes. The dataset reflects real-world clinical conditions, incorporating a mix of objective test results and patient-reported symptoms, though it includes challenges like missing values and potential class imbalance. This dataset is widely used for training machine learning models to predict heart disease, offering insights for early diagnosis and improved patient outcomes [35,36].
The preprocessing of the UCI Cleveland Heart Disease dataset is a crucial step to ensure the data is clean, consistent, and ready for machine learning models. This involves handling missing values, which can occur in several attributes such as the number of major vessels and thalassemia. Missing data is often addressed by imputation (using the mean, median, or mode) or by removing incomplete records. Numerical features like age, cholesterol levels, and blood pressure are normalized or standardized to ensure that all features are on the same scale, which is particularly important for distance-based algorithms. Categorical features, such as chest pain type, fasting blood sugar, and electrocardiogram results, are encoded into numerical values using techniques like one-hot encoding to make them interpretable by machine learning models. Outliers and noisy data points are also identified and either removed or corrected. Additionally, the dataset may be split into training and testing sets, and sometimes further divided into cross-validation folds, to optimize model performance and prevent overfitting. These preprocessing steps enhance the dataset’s quality, ensuring more accurate predictions in heart disease diagnosis [37].
3.2 Feature Selection Using Genetic Algorithm
Choosing the best attributes for heart disease prediction from the UCI Cleveland Heart Disease dataset, which includes 76 medical attributes, poses several challenges that can significantly impact the effectiveness of predictive models. One major challenge is the high dimensionality of the dataset, where many features may be irrelevant or redundant, leading to the “curse of dimensionality” that complicates model training and generalization. Furthermore, ensuring that the selected features align with clinical relevance is crucial, as statistical significance alone may not reflect the medical importance of the attributes. Addressing these challenges through feature selection techniques is essential for developing reliable heart disease prediction models.
Utilizing GA for feature selection in heart disease prediction is often preferred over traditional techniques due to their ability to efficiently explore large and complex search spaces, which is particularly beneficial given the high dimensionality of medical datasets. Unlike methods such as Recursive Feature Elimination (RFE) or Forward/Backward Selection, which rely on greedy approaches that may converge to local optima, GAs use evolutionary principles to evaluate multiple subsets of features simultaneously, promoting a more comprehensive search for the optimal feature set. This global search capability helps avoid the pitfalls of feature redundancy and ensures a diverse selection of attributes that can enhance model performance. Additionally, GAs can effectively balance exploration and exploitation, allowing for adaptability in selecting features that improve predictive accuracy while also considering interactions between features, something that linear or statistical methods may overlook. In comparative studies, models employing GA for feature selection have been shown to yield better predictive accuracy and robustness in heart disease classification tasks compared to those using conventional methods, making GA a superior choice for this application [38,39]. A Genetic Algorithm can be mathematically defined as follows [18,19,38,39]:
– Population (
– Chromosome (
– Fitness Function (
Weights
In the given formula in Eq. (5),
The GA for feature selection begins with initialization, where an initial population of chromosomes is generated randomly. Each chromosome is a binary vector, with each bit indicating whether a specific feature is selected (1) or not (0). In the fitness evaluation step, each chromosome
where
In the replacement phase, the old population is replaced by the new one, often retaining the fittest individuals from the previous generation (elitism) to preserve the best solutions. The process continues with fitness evaluation, selection, crossover, and mutation, repeating for a set number of generations or until a stopping criterion is met, such as fitness value convergence or achieving satisfactory accuracy.
After applying the GA for feature selection in heart disease prediction, the initial set of 14 features was optimized and reduced to 5 key features: chest pain type (cp), exercise-induced angina (exang), Segment (ST) depression (oldpeak), number of major vessels (ca), and thalassemia (thal). By focusing only on these five critical features, the machine learning models benefited from reduced dimensionality, which minimized the impact of irrelevant information. This streamlined feature set not only enhanced the models’ performance but also helped prevent overfitting, leading to more robust and generalizable predictions.
The optimized selected features are categorized into clinically and statistically related features. Clinically relevant features are selected based on established medical knowledge and their direct association with heart disease risk factors, such as age, sex, chest pain type (cp), resting blood pressure (trestbps), cholesterol (chol), and exercise-induced angina (exang), which are commonly used by healthcare professionals in cardiovascular assessments. In contrast, statistically relevant features may not have direct clinical significance but are included in the model due to their ability to enhance predictive performance, as shown through statistical analysis. Features like fasting blood sugar (fbs), resting electrocardiographic results (restecg), ST depression (oldpeak), slope, number of vessels (ca), and thalassemia (thal) may improve model accuracy despite their weaker clinical association.
Currently, our model’s feature extraction fitness function does not explicitly prioritize clinical relevance, as it treats both clinically relevant and statistically relevant features equally to enhance accuracy. However, we can modify the genetic algorithm’s chromosome representation to include an additional indicator that distinguishes between clinical and statistical features. This indicator would signal whether a feature is clinically important, based on established medical knowledge, or statistically significant, based on its contribution to model performance. By incorporating this indicator into the fitness function, the model could prioritize clinically relevant features while still benefiting from the statistical features that enhance accuracy, allowing for a more targeted and medically informed feature selection process.
The selection of five features (cp, exang, oldpeak, ca, thal) using the GA is justified by both improved model performance and their clinical significance in heart disease prediction. Chest pain type (cp) is a key diagnostic indicator, as different types correlate with varying levels of risk. Exercise-induced angina (exang) assesses stress-related cardiac function, helping identify ischemic conditions. ST depression (oldpeak) reflects electrical activity changes during exercise, crucial for detecting myocardial ischemia. The number of major vessels colored by fluoroscopy (ca) indicates coronary artery obstruction severity, directly impacting diagnosis. Thalassemia type (thal) affects oxygen transport and heart function, often linked to cardiovascular abnormalities. While GA optimizes feature selection computationally, these features align with clinical knowledge, enhancing predictive accuracy and real-world applicability.
3.3 Optimized Ensemble Deep Learning Classifier
The proposed heart disease prediction framework employs an ensemble deep learning model that integrates multiple neural networks to achieve robust classification results [21–25]. This ensemble approach combines several Multi-Layer Perceptron (MLP) models, each with varying depths and configurations, to capture intricate data patterns and minimize individual model weaknesses. The ensemble structure leverages the diversity of these MLPs to improve generalization and predictive performance. In an ensemble setting, each MLP model in the ensemble is trained independently, and the final prediction is typically obtained through a weighted sum or average of the predictions from all MLPs, maximizing the collective accuracy. Let
where
MLPs have several advantages over other deep learning models, particularly in terms of simplicity, flexibility, and computational efficiency. Unlike CNNs, which are designed to handle spatial data (like images), or Recurrent Neural Networks (RNNs), which are tailored for sequential data (like time series or text), MLPs can be applied to a broad range of data types, making them versatile for tasks like classification, regression, and function approximation. MLPs are easier to implement and interpret, especially for small to moderately sized datasets, and they typically require less computational power and memory compared to deeper models like CNNs or transformers. They work well with tabular data and can be more efficient in problems where there is no inherent spatial or temporal structure. Moreover, MLPs are fast to train, making them suitable for real-time applications, and their architecture allows for easier integration of engineered features, which can significantly improve performance. However, they may not capture complex patterns in data as effectively as CNNs or RNNs, which have specialized mechanisms for spatial or temporal dependencies [40–42].
The architecture of the heart disease prediction model comprises key layers such as Dense layers, Batch Normalization, Leaky ReLU activation, and Dropout, all of which are structured to improve learning efficiency and prevent overfitting. In this model, Dense layers are designed with progressively increasing neuron counts to capture complex feature interactions, enabling the network to learn high-level representations of the data as it advances through the layers.
– Dense Layers: The Dense layers are the core of the network, responsible for learning representations and relationships within the data. By stacking layers with increasing neuron counts, the model gradually builds a hierarchical understanding, moving from simple to complex feature interactions, which is particularly beneficial in binary classification tasks like heart disease prediction.
– Batch Normalization: Each Dense layer is followed by a Batch Normalization layer, which standardizes activations across each mini-batch. This layer scales and shifts inputs to stabilize and speed up the training process, thereby reducing the phenomenon known as “internal covariate shift” where changes in layer outputs disrupt learning in subsequent layers. Batch Normalization has been shown to improve model convergence rates, as it enables higher learning rates without destabilizing training.
– Leaky ReLU Activation: The hidden layers employ the Leaky ReLU activation function. Unlike the standard ReLU, which outputs zero for negative inputs, Leaky ReLU allows a small, non-zero gradient to pass through when input values are negative. This capability helps prevent neurons from “dying” (remaining inactive) and ensures that even negative activations contribute to learning, enhancing the model’s ability to capture richer features in the data.
– Dropout Layers: To further regularize the model and reduce overfitting, Dropout layers are added after each activation function. During training, Dropout randomly deactivates a fraction of neurons, with a dropout rate of 0.5. This regularization technique forces the model to avoid reliance on specific neurons, promoting a more generalized understanding of the data by ensuring that each training pass depends on a slightly different subset of neuron activations.
– Output Layer: After the hidden layers, the final output layer employs the Softmax activation function. This function converts the raw output scores, or logits, into probabilities, assigning each input a probability score corresponding to either class (presence or absence of heart disease) for binary classification.
The output probabilities generated by the Softmax layer are compared with the true class labels using Sparse Categorical Cross-Entropy as the loss function. This measure quantifies the difference between the predicted probability distribution and the correct class distribution, making it especially suitable for classification problems with integer-encoded labels. To minimize the cross-entropy loss, the model employs the Adam optimizer. Adam adapts the learning rate for each parameter by calculating the first and second moments of the gradients, allowing it to dynamically adjust learning rates for efficient convergence. The optimizer was configured with a default learning rate of 0.001, a value that balances rapid convergence with stable learning. The model was trained with a batch size of 32, which balances computational efficiency and learning stability. To prevent overfitting, early stopping was employed, halting the training process if validation performance did not improve over several consecutive epochs. This approach avoids excessive training, maintaining a focus on generalized performance on unseen data.
After training each MLP model, an ensemble learning technique was applied to enhance predictive performance. This ensemble was constructed using LogitBoost, a powerful boosting algorithm that incrementally builds an ensemble by placing greater emphasis on instances that were misclassified in earlier rounds (see Fig. 2). In a boosting framework that uses multiple MLP models with different configurations, the weights assigned to misclassified instances can serve as additional inputs to the subsequent MLP models in the ensemble. This method enhances the learning process by explicitly providing information about the importance of each sample based on the errors of the previous models. Below is a detailed explanation of this approach, along with relevant equations [43].

Figure 2: Boosting ensemble deep learning
Given a dataset
– Initially, every sample is assigned an equal weight
– For each iteration
– Train MLP Model
– Calculate Predictions and Loss: After training, the MLP produces predictions
– Calculate Weighted Error: The weighted error for the model is calculated as follows:
here,
– Determine Model Weight: Assign a weight to the model based on its performance:
– Update Sample Weights: Update the sample weights to emphasize misclassified instances:
Normalize
– Use Weights as Input for the Next MLP: To enhance the learning of subsequent MLPs, the misclassified instances’ weights can be incorporated as an additional feature. This involves augmenting the input feature vector
where
– Training the Next MLP: The next MLP model
This allows
– Final Ensemble Prediction: The final ensemble prediction after training
The complexity of Boosting Ensemble Deep Learning increases significantly with larger database sizes due to the iterative nature of boosting and the computational demands of deep learning models. In boosting, multiple weak learners are sequentially trained, with each iteration focusing more on misclassified instances, leading to an increased number of training cycles. When applied to deep learning, where each weak learner is a complex neural network, this process becomes computationally intensive, requiring extensive memory, processing power, and longer training times. The size of the dataset further exacerbates this complexity, as larger datasets require more training epochs and batch processing, increasing the burden on Graphics Processing Units (GPUs) or Tensor Processing Units (TPUs). Additionally, data augmentation and feature extraction in high-dimensional datasets introduce further computational overhead. Despite these challenges, boosting improves generalization by reducing bias and variance, making it an effective approach for handling large-scale datasets, provided that optimized training strategies, parallelization, and efficient resource allocation are implemented.
Simplifying Boosting Ensemble Deep Learning can be effectively achieved using a lightweight version such as a Light Gradient Boosting Machine (LightGBM), which is optimized for speed and efficiency while maintaining high accuracy. LightGBM reduces computational complexity by employing a histogram-based learning approach, which speeds up training by discretizing continuous feature values into bins, significantly lowering memory usage. It also utilizes a leaf-wise growth strategy instead of level-wise expansion, enabling faster convergence and reducing unnecessary computations. Additionally, LightGBM supports GPU acceleration, allowing for efficient large-scale training. LightGBM’s ability to handle large datasets efficiently makes it an ideal alternative for simplifying and boosting ensemble deep learning while maintaining robust predictive capabilities.
Tunicate Swarm Algorithm for Optimizing Ensemble Deep Learning Model’ Weights
This step outlines how the TSA can optimize weights for a boosting ensemble in heart disease classification. The TSA is used to find the best weights for each weak learner (model) in the ensemble. The TSA offers distinct advantages for weight optimization in ensemble learning due to its efficient balance between exploration and exploitation. TSA’s spiral movement and jet propulsion mechanisms enable it to avoid local optima while maintaining solution diversity, making it more adaptive in complex, nonlinear landscapes compared to alternatives like particle swarm optimization or ant colony optimization. Additionally, TSA’s dynamic propulsion factor promotes convergence control, allowing for effective fine-tuning of ensemble weights without premature convergence. With fewer parameters to tune, TSA is simpler to implement, and its lower computational demands make it particularly suitable for high-dimensional optimization tasks in ensemble learning, where efficient, accurate convergence is essential [13–15].
– Step 1: Initialize TSA Population: Define a population of
– Step 2: Evaluate Fitness of Each Solution: The fitness function measures how well each weight vector
Boosting Ensemble Prediction: Compute the weighted prediction
– Define Fitness Function: Use a fitness function based on classification error, such as binary cross-entropy loss:
where
Step 3: Update Positions of Each Tunicate: In the TSA, tunicates update their positions in the search space based on the best current solution and their distance from it.
– Identify the Best Solution: Find the weight vector
– Calculate Distance: For each tunicate
– Position Update with Jet Propulsion Mechanism: Each tunicate updates its weights according to:
Step 4: Enforce Constraints and Boundary Checking: After updating, ensure each tunicate’s weights
– Normalization for Boosting: For boosting ensembles, weights should sum to 1:
– Boundary Check: If any
Step 5: Repeat Until Convergence:
– Iterate: Repeat Steps 2 to 4 for a set number of iterations or until convergence (fitness does not improve significantly).
– Convergence Criterion: When the change in fitness falls below a threshold, or a maximum number of iterations is reached, stop the search.
–Step 6: Obtain Final Ensemble Prediction: After the TSA converges, the best solution
The TSA was chosen for optimizing the weights of the ensemble model due to its effectiveness in navigating the complex, high-dimensional parameter space, independent of dataset size. Unlike simpler algorithms, TSA excels at balancing exploration and exploitation, leveraging strategies inspired by tunicate swarms to avoid local optima in the non-convex optimization landscape of deep learning models. Its adaptability and dynamic behavior enable it to handle the intricate, non-linear interactions between ensemble components better than traditional methods like gradient descent or particle swarm optimization. TSA’s superior convergence, resilience to initialization and noise, and ability to enhance ensemble diversity make it a robust choice for fine-tuning weights. Additionally, its scalability and flexibility ensure it can efficiently adapt to varying ensemble sizes and complexities, providing a reliable and precise solution for weight optimization.
The focus here is on tuning the weights assigned to pre-trained models in the ensemble to optimize their combined output. The dataset is only indirectly involved because the ensemble models are already trained, and the TSA is adjusting how much influence each model has in the final decision. This process leverages the pre-trained models’ performance on the dataset rather than manipulating the dataset directly. The optimization process is less dependent on the dataset size or quality because it tunes the weights of pre-trained models. The ensemble’s performance benefits from the diversity and strengths of the individual models, which may have been trained on different datasets or subsets. This targets meta-level optimization, focusing on the interactions and contributions of pre-trained models within the ensemble. It adjusts higher-order parameters (e.g., model weights) to improve the overall ensemble performance.
The suggested model prevents overfitting on a high-dimensional and small dataset through a combination of strategies aimed at robust evaluation and generalization. Feature selection using a GA reduces dataset dimensionality by retaining only the most relevant features (e.g., cp, exang, oldpeak, ca, and thal), minimizing irrelevant information and enhancing generalization. Cross-validation with multiple folds (e.g., 5-fold or 10-fold) exposes the model to various data subsets, reducing the risk of overfitting to specific splits. Additionally, testing across different dataset splits (e.g., 70–30, 60–40) ensures the model’s robustness under varying training-to-testing ratios. Ensemble learning further adds another layer of regularization and mitigates overfitting by combining predictions from multiple models, reducing variance and improving generalization. Finally, the TSA optimizes the ensemble’s weights, balancing the contribution of each model based on its performance, ensuring robust and reliable predictions.
3.4 Model’s Interpretability for Clinical Use
In our suggested heart disease detection model, the feature selection module plays a critical role in enhancing the model’s interpretability for clinical use. By GA for feature selection, the model identifies and prioritizes the most relevant clinical features. This process narrows down the vast amount of input data to a set of key features that are most predictive of heart disease risk. Clinicians can use these insights to make informed decisions by focusing on the specific variables highlighted by the model as having the strongest correlation with heart disease. For instance, if the feature selection process identifies cholesterol levels and age as significant predictors, clinicians can prioritize interventions targeting these factors, such as recommending dietary changes, lifestyle modifications, or prescribing cholesterol-lowering medication. Additionally, by understanding which features are most influential in the model’s predictions, clinicians gain clarity on the reasoning behind the risk scores, enabling them to explain the rationale for treatment decisions to patients more effectively.
The ensemble nature of the model, combining multiple algorithms to improve predictive accuracy, provides further confidence in the model’s outputs. Since the ensemble model aggregates insights from different classifiers, it reduces the risk of overfitting to any one particular dataset or feature set, offering a more robust and reliable prediction. Therefore, clinicians can use the model’s risk scores, along with the insights into which features are most critical, to guide their clinical decisions, ensuring that interventions are personalized and based on the most relevant factors for each patient. This interpretability makes the model not only a powerful decision-support tool but also an accessible one for clinicians in real-world clinical settings.
The selected five features—cp (chest pain type), exang (exercise-induced angina), oldpeak (ST depression induced by exercise), ca (number of major vessels colored by fluoroscopy), and thal (thalassemia type)—are widely recognized and commonly used in heart disease prediction across diverse demographic datasets. These features have been extensively validated in various clinical studies and are routinely collected in different healthcare settings, making them generalizable to a broad population. Their physiological relevance ensures that they remain key indicators of cardiovascular health, regardless of demographic variations such as age, gender, or ethnicity.
However, in cases where one or more of these features are unavailable for certain patients due to missing records or data collection inconsistencies, the model can still function effectively through several approaches. Data imputation techniques (such as mean/mode imputation or regression-based estimation) can be used to estimate missing values. Additionally, the model can be adapted by retraining it on alternative feature subsets, ensuring flexibility without significant performance loss. If missing data is prevalent, probabilistic modeling or uncertainty-aware decision-making can be integrated to maintain reliable predictions. These strategies ensure that the model remains robust and applicable across diverse real-world clinical datasets.
4 Experimental Results and Discussions
4.1 Datasets, Evaluation Metrics, and Implementation
In this section, the proposed model was validated using the UCI Cleveland Heart Disease dataset, sourced from the Cleveland Clinic Foundation. Each entry in this dataset represents a unique case of heart disease, encompassing variations in patient characteristics such as age, gender, and medical history, which reflect a broad spectrum of heart disease manifestations (see Table 1). This diversity supports the model’s ability to generalize across a wide range of patient profiles and heart disease indicators. The UCI Cleveland Heart Disease dataset is designed to capture a representative sample of the population, providing valuable insights into key factors associated with heart disease risk and progression. It includes various age groups, with a particular focus on adults and older adults who are more susceptible to heart disease due to age-related factors. The dataset maintains a balanced distribution across gender, recognizing the distinct heart disease risk profiles in males and females, influenced by physiological differences and lifestyle factors. Furthermore, it records critical medical information such as cholesterol levels, blood pressure, chest pain type, fasting blood sugar, and previous heart-related events, along with lifestyle details including smoking habits, and exercise-induced angina. This comprehensive dataset structure enhances the robustness of machine learning models for heart disease detection and prediction by providing a well-rounded view of relevant risk factors and patient diversity [35,36].

The experiment was carried out on a system equipped with an Intel(R) Core (TM) i7 processor and 8 GB of RAM. This hardware configuration, though modest, provided sufficient computational power to support deep learning computations and analysis tasks effectively. This setup employs Python 3.8 for compatibility with current libraries and uses Anaconda for package management. Core Python libraries include Pandas and NumPy for data handling and preprocessing, scikit-learn for machine learning utilities (e.g., train-test split, standardization, and feature selection techniques), and TensorFlow/Keras to build and train ensemble models. For weight optimization in the ensemble, NiaPy was used to apply the TSA, aiming to improve model performance by finding optimal weight combinations for each model in the ensemble. Additionally, Matplotlib and Seaborn support data visualization, enabling comprehensive analysis of training progress and model evaluation metrics such as accuracy, precision, and ROC curves. This configuration is sufficient to handle the data processing, model training, and iterative optimization needed for effective heart disease prediction.
The effectiveness of the proposed heart disease prediction model, which utilizes feature selection and ensemble deep learning with optimized weights, is evaluated through a comprehensive set of performance metrics, including precision, recall, accuracy, specificity, sensitivity, Matthews Correlation Coefficient (MCC), and F1 score. Precision quantifies the proportion of true positive predictions among all positive predictions, reflecting the model’s accuracy in identifying heart disease cases without misclassifying healthy individuals. Recall, or sensitivity, measures the model’s capacity to correctly identify actual heart disease cases, thereby minimizing false negatives. Accuracy provides an overall assessment of correctly classified instances, encompassing both positive and negative cases. Specificity gauges the model’s effectiveness in recognizing non-disease cases, reducing false positives. Sensitivity and specificity together ensure an accurate distinction between heart disease and non-disease cases. The MCC further strengthens the evaluation by considering all four confusion matrix categories, giving a balanced view of the model’s performance even with class imbalance. The F1 score, as a harmonic mean of precision and recall, reflects the model’s ability to balance accuracy in positive predictions and recall, particularly important in medical diagnosis. Collectively, these metrics provide a robust assessment of the proposed model’s effectiveness in addressing the complexities of heart disease prediction [1–4].
In optimizing the proposed heart disease prediction model, we employ a GA to identify the most relevant features for accurate predictions. By carefully configuring GA parameters, we enhance the selection of features that best contribute to the ensemble deep learning model’s performance, allowing for improved accuracy and generalization. Table 2 details the GA configuration parameters that led to the most efficient feature subset for our model. Furthermore, Table 3 lists the TSA’s configuration to effectively tune the weights of the utilized ensemble learning model in the heart disease prediction task. These parameters aim to maximize TSA’s efficiency in finding the optimal weight settings, leading to improved model performance.


To validate the proposed model, a series of experiments should be conducted. Each experiment serves to assess different components of the model, ensuring its effectiveness and robustness. Below is a detailed description of the experiments conducted, including their aims, expected outcomes, and justifications:
4.2.1 Experiment 1: Feature Selection Efficiency Using GA
The aim is to assess the effectiveness of GA in selecting the most relevant features from the UCI Heart Disease dataset, minimizing dimensionality while maintaining prediction accuracy. The results listed in Table 4 show a notable improvement in the model’s performance after applying GA-optimized feature selection. The accuracy increases from 90.00% to 92.30% suggesting that GA successfully identified the most relevant features, allowing the model to make more accurate predictions by minimizing errors in classification. The MCC improvement from 0.8047 to 0.8325 indicates a more balanced performance across all classes, as MCC accounts for true positives, true negatives, false positives, and false negatives. This means the model has become better at distinguishing between heart disease and non-heart disease cases. Additionally, the F1 score improvement from 89.91% to 91.20% reflects a better trade-off between precision and recall, ensuring that the model not only reduces false positives but also avoids missing true positive cases of heart disease. Together, these results demonstrate that GA-based feature selection enhances the model’s ability to make more reliable and balanced predictions, ultimately improving its overall performance in heart disease detection. In general, High dimensionality and redundant features can lead to overfitting, increased computation time, and decreased model generalization. GA provides an efficient mechanism for feature selection, ensuring that only the most relevant features are retained, improving model efficiency and accuracy.
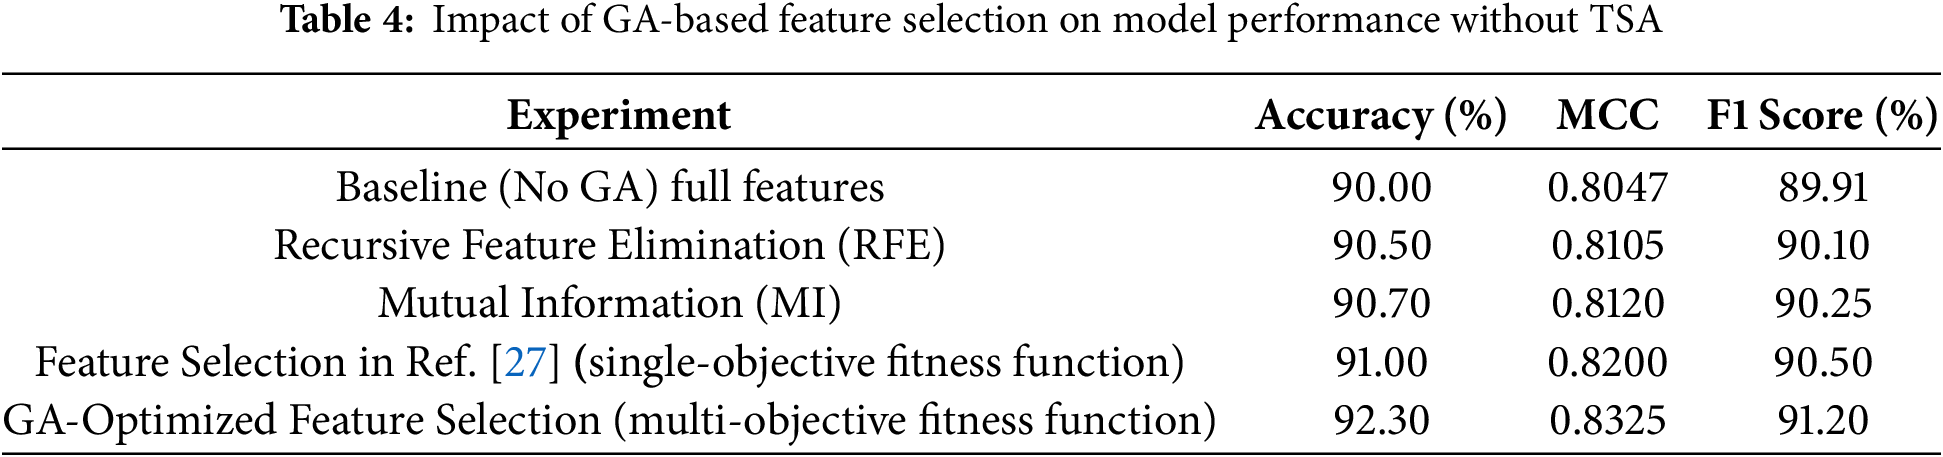
In addition, the results indicate that the proposed model relying on a multi-objective fitness function outperforms the alternative method based on a single-objective fitness function. The multi-objective approach achieves higher accuracy (92.30% vs. 91.00%), MCC (0.8325 vs. 0.8200), and F1 score (91.20% vs. 90.50%). This improvement can be attributed to the multi-objective fitness function’s ability to optimize multiple conflicting criteria simultaneously, such as accuracy, and feature relevance (number of selected features in our case). In contrast, the single-objective method focuses on optimizing a single criterion, which may lead to suboptimal trade-offs and reduced overall performance. The multi-objective approach ensures a better balance between objectives, resulting in a more robust and effective feature selection process that enhances the model’s predictive capability.
In general, the difference between single and multi-objective fitness functions lies in the number of objectives they optimize. A single-objective fitness function evaluates and optimizes a single criterion, producing a scalar value to measure solution quality, making it simpler and less computationally intensive. In contrast, a multi-objective fitness function optimizes multiple, often conflicting objectives simultaneously, producing a vector of values or a Pareto front representing trade-offs between objectives. While single-objective functions focus on one goal, multi-objective functions provide a range of solutions for decision-makers to balance competing goals effectively.
In addition, the GA outperforms simple feature selection methods like Recursive Feature Elimination (RFE) and Mutual Information (MI) by providing a more global search strategy that avoids local optima. While RFE iteratively removes the least important features based on model performance and MI selects features based on their statistical dependency with the target variable, both approaches can be limited by fixed selection criteria and may overlook complex feature interactions. In contrast, GA explores a broader solution space by employing evolutionary principles such as selection, crossover, and mutation, allowing it to identify an optimal subset of features that maximizes predictive performance while minimizing redundancy. This adaptive search capability enables GA to capture non-linear relationships between features and the target variable, making it particularly effective for high-dimensional datasets. Empirical results show that GA-selected features lead to models with higher accuracy and robustness compared to those selected by RFE or MI, demonstrating its superiority in both accuracy and clinical relevance in heart disease prediction.
4.2.2 Experiment 2: Comparison of Single Deep Learning Models
In this experiment, we aim to evaluate the performance of individual deep learning models, specifically MLPs with different configurations, trained using feature subsets selected by a GA. The goal is to understand how varying MLP configurations perform before combining them into an ensemble model without weight tuning. By testing multiple configurations of MLP and then combining them into an ensemble, we aim to determine if ensemble learning improves the overall performance of the heart disease prediction task. The results shown in Table 5 demonstrate that the Boosting Ensemble Deep Learning model outperforms the individual MLP configurations in all key metrics: accuracy, precision, recall, and F1 score. With an accuracy of 93.30%, the Ensemble model surpasses the best individual configuration (Configure 2) by 1.20%, indicating improved overall classification performance. It also achieves the highest precision (92.40%) and recall (93.10%), surpassing the individual models by significant margins, which shows its superior ability to minimize both false positives and false negatives. Additionally, the Ensemble model’s F1 score of 92.75% further underscores its balanced and robust performance, combining the strengths of multiple MLP configurations to deliver a more reliable and accurate classification, highlighting the effectiveness of boosting techniques in enhancing deep learning model performance.
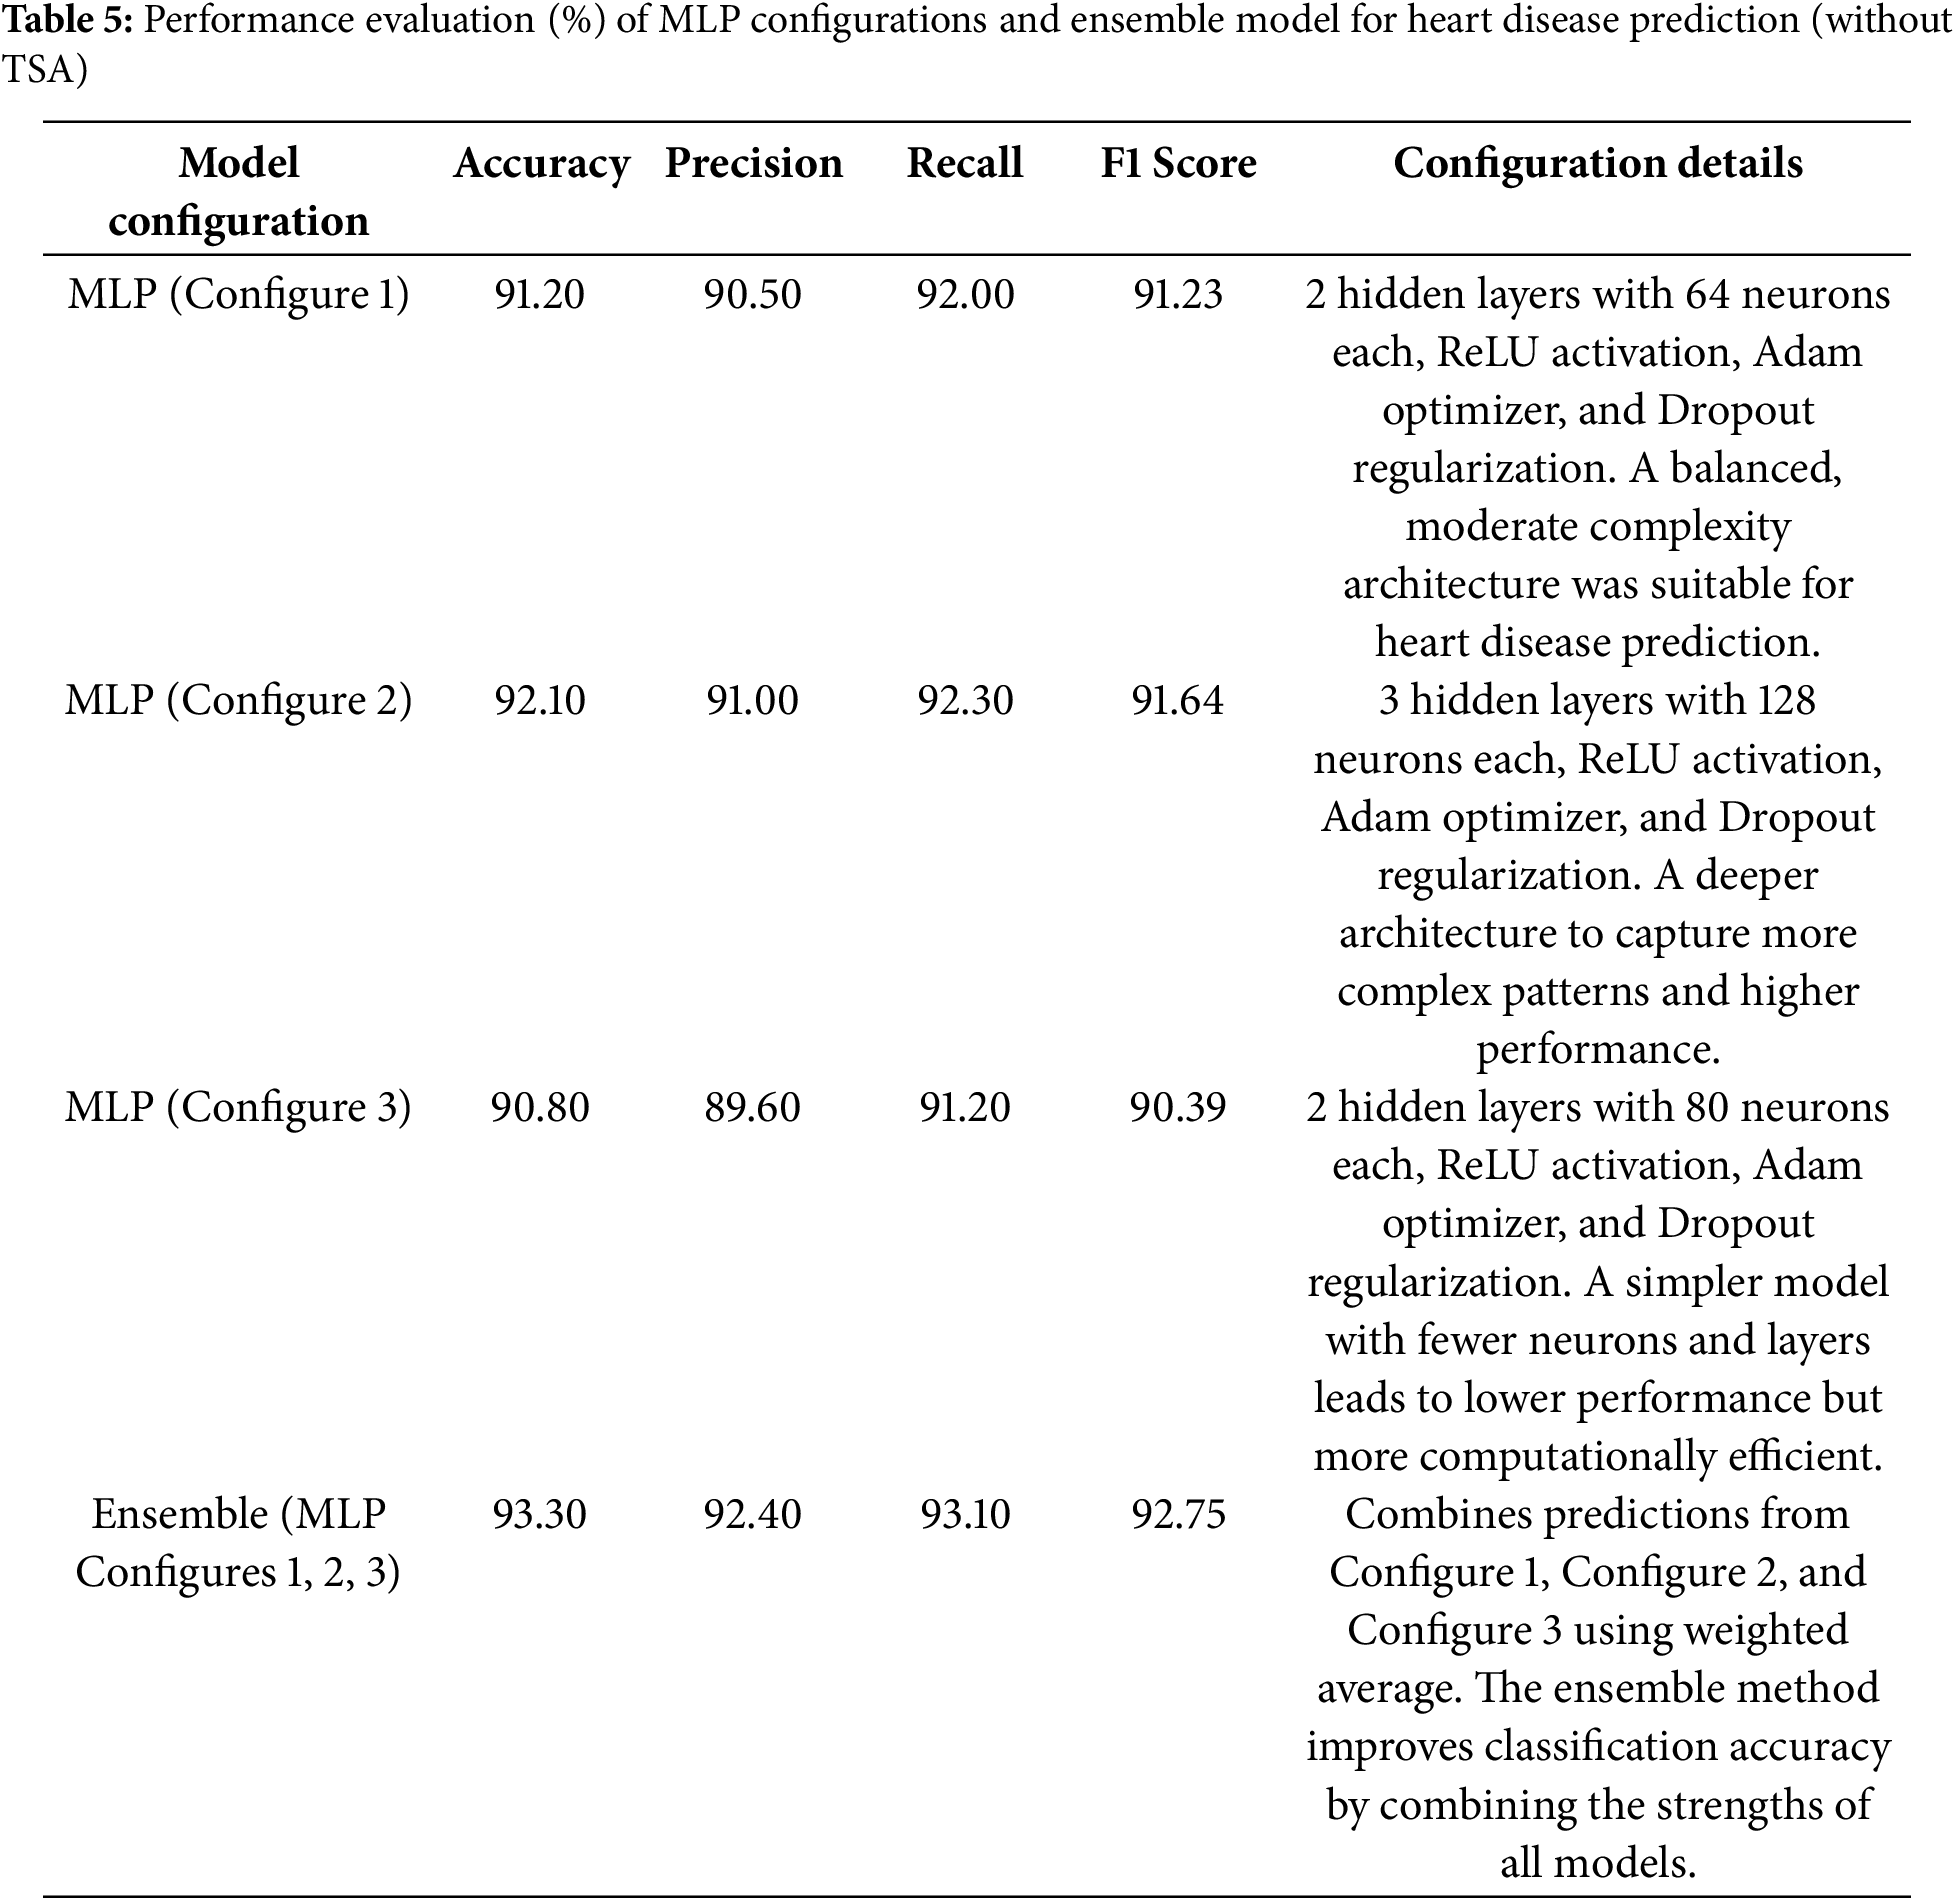
The superiority of the boosting ensemble deep learning model over individual MLP configurations can be attributed to several key factors. First, boosting methods combine multiple weak learners (in this case, MLPs with different configurations), each contributing to the final decision, which helps to reduce bias and variance in the model’s predictions. Second, boosting focuses on adjusting the model’s weights to correct errors made by previous learners, thus refining the learning process and enhancing accuracy over time. Third, by leveraging the diversity among various MLP configurations, the ensemble is less likely to overfit the peculiarities of any single model and can generalize better across different data distributions. Finally, ensemble methods tend to have better robustness, as they average out the individual model errors, leading to higher precision and recall. These combined factors enable the boosting ensemble to outperform individual models by effectively capitalizing on the strengths of each configuration while minimizing their weaknesses.
4.2.3 Experiment 3: Optimization of Ensemble Weights Using TSA
Table 6 compares the performance metrics of an ensemble model before and after optimizing its weight using TSA. The Ensemble (Without TSA) configuration achieves an accuracy of 93.30%, precision of 92.40%, recall of 93.10%, and an F1 Score of 92.75%. Following TSA optimization, the Ensemble (With TSA Optimization) configuration improves to 97.50% accuracy, 96.80% precision, 97.20% recall, and a 97.00% F1 Score. These values represent performance increases of 4.20% in accuracy, 4.76% in precision, 4.40% in recall, and 4.59% in F1 Score. These results demonstrate TSA’s effectiveness in fine-tuning ensemble model weights, leading to a more balanced integration of individual model outputs. The accuracy improvement indicates a substantial reduction in misclassification, while increases in precision and recall highlight better distinctions between positive and negative cases. By aligning each model’s contribution to the ensemble, TSA optimization leverages their unique strengths and minimizes individual weaknesses, resulting in an ensemble model that more effectively predicts heart disease cases.
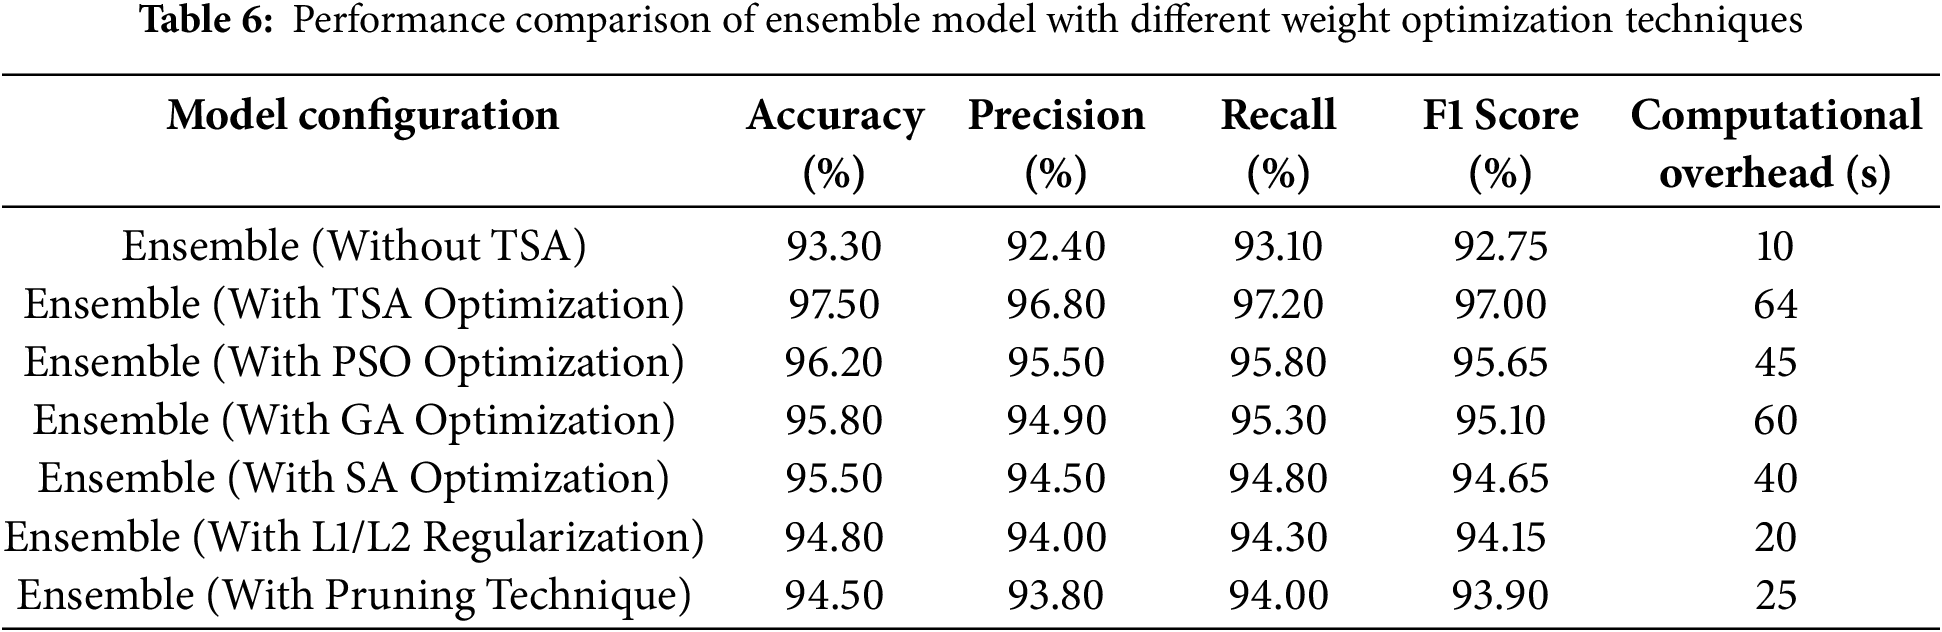
Furthermore, the results show that TSA optimization achieves the highest accuracy (97.50%), outperforming other methods. However, it has the highest computational overhead (64 s), indicating a trade-off between performance and efficiency. The Particle Swarm Optimization (PSO) and GA provide a balanced approach, achieving accuracy levels of 96.20% and 95.80%, respectively, while maintaining moderate computational costs (45 and 60 s). the Simulated Annealing (SA), being a simpler heuristic-based method, results in slightly lower accuracy (95.50%) but reduces computational time to 40 s, making it more efficient for real-time applications. L1/L2 regularization and pruning techniques offer lightweight solutions, achieving 94.80% and 94.50% accuracy, respectively, with significantly lower computational overhead (20 and 25 s), making them ideal for resource-constrained environments.
While TSA optimization delivers the best accuracy, other methods have notable disadvantages. PSO and GA require multiple iterations to converge, which increases computational time. SA can struggle with getting stuck in local optima, leading to suboptimal solutions. Regularization and pruning, while computationally efficient, may slightly reduce model accuracy by enforcing constraints on weight updates and removing parameters. TSA, despite its high computational cost, stands out due to its ability to explore the search space effectively, avoid local minima, and achieve superior performance. This makes it the most suitable method for applications where accuracy is a priority over computational efficiency, such as medical diagnostics or high-stakes decision-making systems.
In general, the computational cost of TSA optimization would not outweigh its marginal performance benefits in practical applications because the performance improvements, particularly in fine-tuning the weights of ensemble deep learning models, often result in a more reliable and stable model. In critical fields like healthcare, where accuracy and generalization are paramount, even modest gains in performance can have significant positive impacts, such as more accurate diagnoses or better treatment predictions. The computational cost, while higher compared to simpler optimization methods, is justified by the enhanced ability of TSA to avoid local minima and find optimal weight configurations, ensuring that the model performs reliably across varied datasets. Given the importance of precision in practical applications, the trade-off between computational cost and performance gain is often deemed worthwhile.
4.2.4 Experiment 4: Model Performance Comparison with Traditional Classifiers
To assess the effectiveness of the proposed hybrid model (GA-based feature selection and TSA-optimized ensemble), we compare its performance with traditional classification methods, including logistic regression, Support Vector Machine (SVM), decision trees, and deep learning. Table 7 displays the results for accuracy, precision, recall, and F1-score for each model, allowing us to evaluate how the hybrid model performs relative to established classifiers. Table 7 provides a comparative analysis of the performance metrics for each model configuration. The proposed hybrid model significantly outperforms traditional classifiers across all metrics, achieving an accuracy of 97.5%, a precision of 96.8%, a recall of 97.2%, and an F1-score of 97.0%. This superior performance can be attributed to the hybrid approach’s ability to use GA for effective feature selection, isolating only the most predictive features, while TSA optimizes the ensemble model by assigning optimal weights to individual models. These optimizations enhance the hybrid model’s predictive capabilities, reduce misclassification, and improve its adaptability in complex classification tasks. In contrast, traditional models like logistic regression, SVM, and decision trees lack this level of feature and model optimization. As a result, they yield lower scores, particularly in recall and F1-score, reflecting more limited sensitivity.
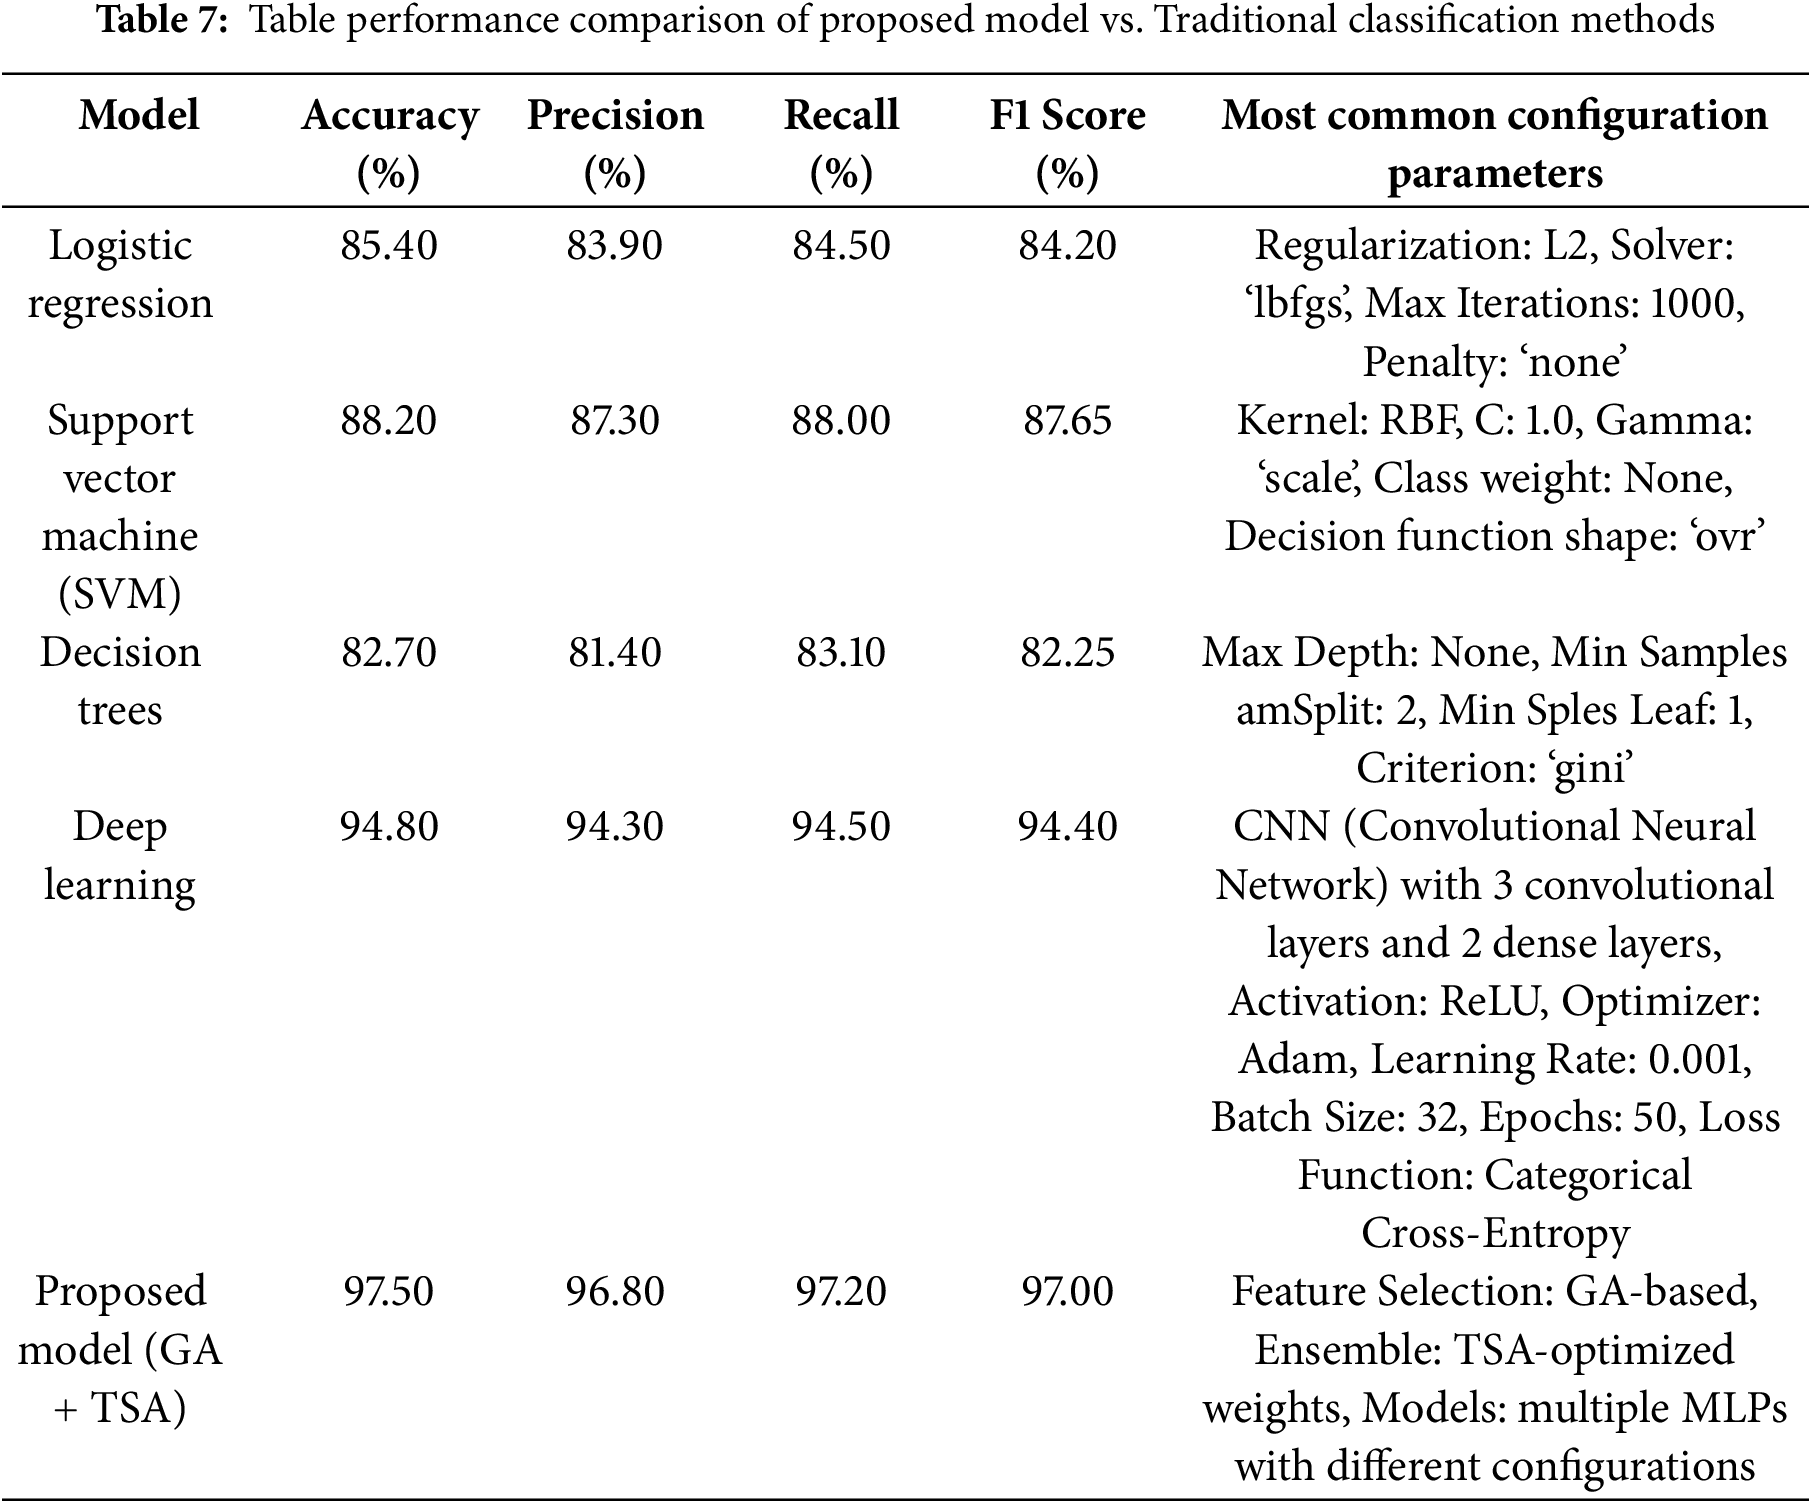
The proposed model outperforms the CNN-based deep learning model across all performance metrics: accuracy (97.50% vs. 94.80%), precision (96.80% vs. 94.30%), recall (97.20% vs. 94.50%), and F1 score (97.00% vs. 94.40%). This superior performance can be attributed to the incorporation of Genetic Algorithm (GA)-based feature selection, which reduces the dimensionality of the input data, focusing on the most relevant features and eliminating irrelevant ones. Additionally, the Tunicate Swarm Algorithm (TSA) optimizes the ensemble model’s weights, enabling it to leverage the strengths of multiple MLPs with varying configurations. Unlike CNN, which relies solely on its architecture to learn patterns, the proposed model benefits from enhanced feature selection and adaptive weight optimization, making it more robust to variations and noise in the data. These enhancements result in better generalization and improved accuracy compared to the standalone CNN.
4.2.5 Experiment 5: Generalization and Robustness Assessment
To assess the model’s generalization capacity, an experimental setup is designed to evaluate the performance of the proposed model on different dataset splits (e.g., 70–30, 60–40) and multiple cross-validation folds (e.g., 5-fold, 10-fold). By testing these variations, we aim to ensure that the model can generalize beyond specific data subsets, avoiding overfitting and achieving reliable performance on new, unseen data. Table 8 presents the model’s performance across different dataset splits and cross-validation configurations, measured by accuracy, precision, recall, and F1 score. The highest scores are observed with the 70–30 split using 10-fold cross-validation, suggesting that a larger training set (70%) paired with more varied validation folds (10-fold) enables the model to generalize better and achieve robust results, supporting its adaptability to unseen data. Comparatively, the 60–40 split shows slightly lower performance, likely due to the reduced training data available for model learning, which can limit generalizability.
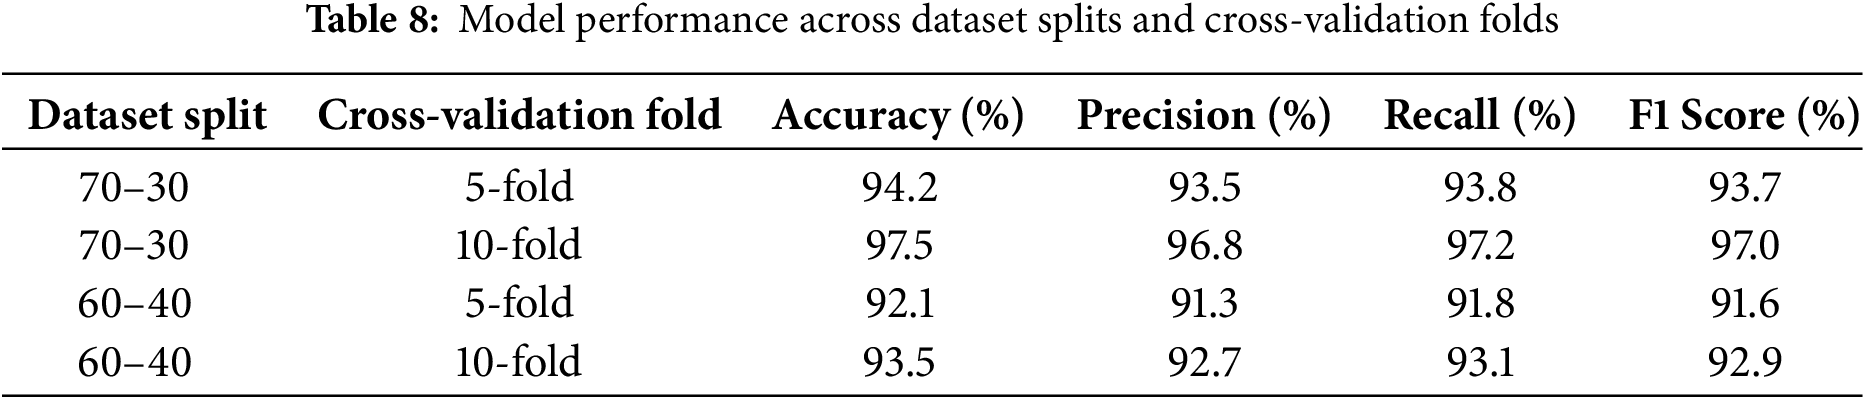
The 70–30 split with 10-fold cross-validation yields the best results because it provides a balanced approach between training data size and validation robustness. With the 70–30 split, a larger portion of the dataset (70%) is available for training, allowing the model to learn more comprehensive patterns and relationships in the data. This larger training set can lead to improved model performance, as it minimizes underfitting and equips the model to generalize more effectively. Additionally, using 10-fold cross-validation introduces greater diversity in the validation process, enabling the model to be evaluated on multiple subsets of the data. This approach reduces the risk of overfitting to any single validation subset and provides a more reliable assessment of the model’s performance. In comparison, the 60–40 split reduces the training data size, which can limit the model’s ability to capture intricate patterns in the data, leading to slightly lower performance.
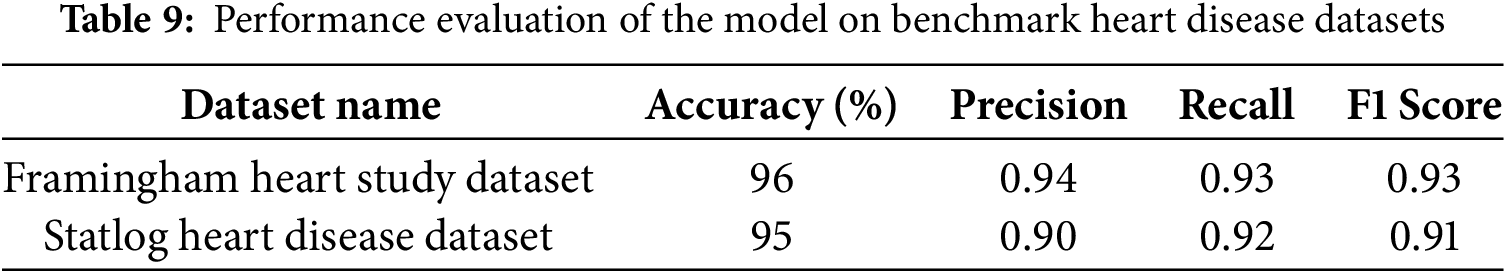
Additionally, to showcase the generalizability of our model, we conducted a new set of experiments to validate its performance using publicly available heart disease datasets beyond the UCI Cleveland Heart Disease Dataset. The Framingham Heart Study Dataset is a long-term study initiated in 1948 in Framingham, Massachusetts, to investigate cardiovascular disease risk factors. It includes over 4000 records with features such as age, gender, systolic and diastolic blood pressure, cholesterol levels Low-Density Lipoprotein (LDL), and High-Density Lipoprotein (HDL), smoking status, diabetes, and physical activity. The target variable is a binary classification indicating the presence of cardiovascular disease (0 = no, 1 = yes). The dataset is publicly available through the UCI Machine Learning Repository and platforms like Kaggle. The Statlog Heart Disease Dataset is a widely used dataset for heart disease classification tasks, often utilized in machine learning competitions. It contains 270 instances with 13 clinical attributes, including age, sex, chest pain type, resting blood pressure, serum cholesterol, electrocardiographic results, maximum heart rate, and exercise-induced angina. The target variable is binary (1 = heart disease present, 0 = absent), and the dataset is available through the UCI Machine Learning Repository.
The results in Table 9 indicate that the proposed model generalizes well across different heart disease datasets, demonstrating high accuracy, precision, recall, and F1 scores. The model achieved 96% accuracy on the Framingham Heart Study Dataset and 95% on the Statlog Heart Disease Dataset, suggesting its robustness in handling diverse patient data and risk factors. The high precision (0.94 and 0.90, respectively) indicates that the model effectively minimizes false positives, ensuring reliable predictions. Similarly, the recall values (0.93 and 0.92, respectively) highlight the model’s capability to correctly identify heart disease cases, reducing false negatives. The consistently high F1 scores (0.93 and 0.91) further confirm a balanced performance between precision and recall, reinforcing the model’s reliability in detecting heart disease across different datasets. These findings suggest that the model is well-generalized and not overly dependent on a single dataset, making it suitable for broader clinical applications.
4.2.6 Experiment 6: Computational Efficiency and Training Time Analysis
To evaluate the computational efficiency of the model, an experiment will be conducted to measure key performance factors such as training time, testing time, and resource utilization (including memory and CPU usage). While achieving high predictive accuracy is essential, the model must also remain computationally feasible, especially for real-world deployment where resource constraints and response times are critical. This experiment assesses whether the model can balance high performance with efficient use of resources, providing insights into its suitability for practical applications. Table 10 illustrates the computational efficiency of the model across different dataset splits and cross-validation configurations, showing key metrics: training and testing time, memory usage, and CPU usage. The 70–30 split with 10-fold cross-validation has the highest training time (180 s) and resource usage, with memory at 1150 MB and CPU usage at 90%. This is expected due to the larger training set size and increased number of validation folds, which enhances generalization at the cost of higher computational demand. In comparison, the 60–40 split with fewer folds (e.g., 5-fold cross-validation) shows reduced training time (90 s), lower memory consumption (950 MB), and CPU usage (80%). This suggests that while larger dataset splits and more folds improve model performance through better validation, they also require significantly more computational resources, highlighting a trade-off between model generalization and computational efficiency. Herein, we utilized psutil library in Python that provides system and process utilities, including memory usage and CPU usage of a specific process.
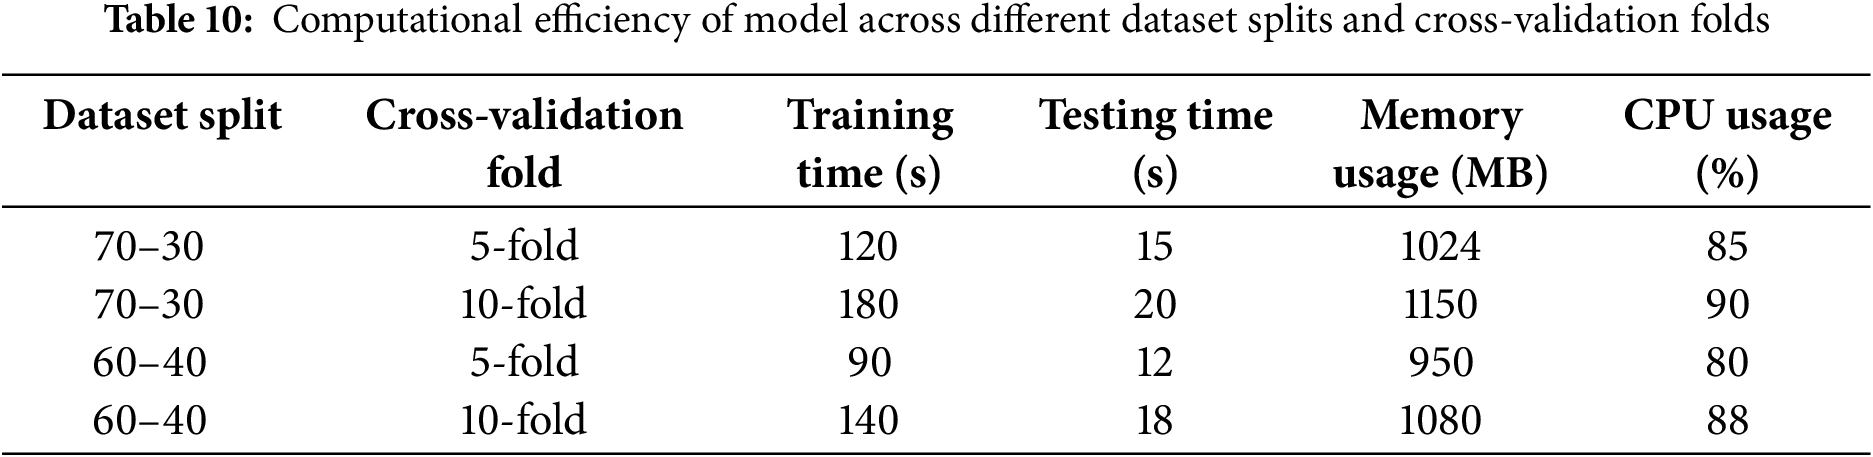
4.2.7 Experiment 7: Sensitivity and Specificity Evaluation
This experiment aims to assess the sensitivity (true positive rate) and specificity (true negative rate) of various heart disease prediction models, including Logistic Regression, Support Vector Machine (SVM), Decision Trees, and the proposed ensemble model. In medical diagnostics, minimizing false negatives is crucial to avoid missed diagnoses, especially in identifying patients at risk of heart disease. Table 11 compares the sensitivity and specificity of various heart disease prediction models: Logistic Regression, SVM, Decision Trees, and the proposed ensemble model. The proposed model demonstrates the highest sensitivity (97.2%) and specificity (97.8%), significantly outperforming the other methods. This indicates that the GA + TSA model is highly effective in both identifying true cases (high sensitivity) and correctly rejecting non-cases (high specificity). In medical diagnostics, these metrics are essential, as they reflect the model’s ability to minimize false negatives (missed diagnoses) and false positives (unnecessary alerts). The enhanced performance of the GA + TSA model likely results from its integration of feature selection and optimization techniques, which streamline the model by focusing on the most relevant attributes. Traditional models like Logistic Regression, SVM, and Decision Trees perform reasonably well but lack tailored optimization, which appears to be key in achieving the proposed model’s superior results.
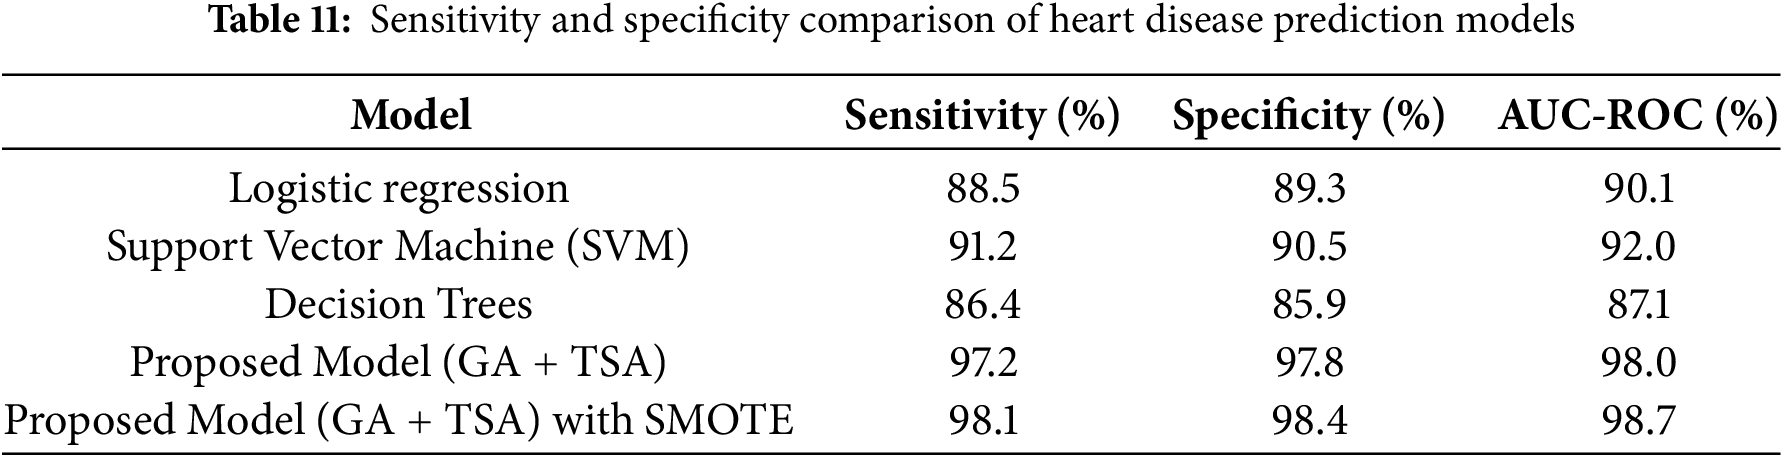
The AUC-ROC (%) values in the table indicate the overall discriminatory power of each model in distinguishing between heart disease and non-heart disease cases. Higher AUC-ROC values suggest better performance, with a score of 100% representing a perfect classifier. The Proposed Model (GA + TSA) with SMOTE achieves the highest AUC-ROC at 98.7%, showing excellent classification capability. The Proposed Model (GA + TSA) without SMOTE is slightly lower at 98.0%, suggesting that handling class imbalance improves overall discrimination, albeit marginally. In contrast, traditional models like Logistic Regression (90.1%), SVM (92.0%), and Decision Trees (87.1%) have noticeably lower AUC-ROC values, indicating that they are less effective in capturing complex patterns within the dataset. The improvement in AUC-ROC when using SMOTE highlights that balancing the class distribution enhances the model’s ability to differentiate between positive and negative cases, though the effect is limited since the original dataset was only moderately imbalanced.
In general, The UCI Cleveland Heart Disease dataset is known for having an imbalanced class distribution, where cases of heart disease (especially severe conditions) are underrepresented compared to non-disease cases. Utilizing SMOTE (Synthetic Minority Over-sampling Technique) helps address this imbalance by generating synthetic samples rather than duplicating existing ones. This technique works by interpolating between minority class instances, effectively increasing their presence in the dataset and preventing models from being biased toward the majority class. The table shows the sensitivity and specificity of different models for classification, including the proposed model (GA + TSA) and a suggested model incorporating SMOTE for class imbalance handling. The proposed model (GA + TSA) already achieves high sensitivity (97.2%) and specificity (97.8%), indicating strong performance. When SMOTE is applied (GA + TSA + SMOTE), there is a slight improvement to 98.1% sensitivity and 98.4% specificity. The modest improvement suggests that the dataset may not have suffered from severe class imbalance, meaning GA and TSA already optimized feature selection and model performance effectively. Since SMOTE artificially balances classes by generating synthetic samples, its impact is more significant when the original dataset is highly imbalanced. Here, the small gain implies that misclassifications due to class imbalance were already minimal, and the optimization techniques used in GA + TSA were sufficient in handling the imbalance to a large extent.
The specificity improvement of 97.8% achieved by the Proposed Model (GA + TSA) over baseline models like SVM (90.5%) and Logistic Regression (89.3%) may seem marginal, but it remains highly significant, particularly in the context of medical diagnosis where minimizing false positives is crucial. One key reason for this seemingly small gain is that the baseline models already exhibit high specificity, meaning that they are already effective at reducing false positives, leaving less room for dramatic improvements. Moreover, advanced optimization techniques often result in a greater enhancement of sensitivity rather than specificity, as the primary goal is to minimize false negatives, which is particularly important in heart disease prediction, where missing a true positive case can have severe consequences. The GA for feature selection primarily refines the feature set by removing redundant and less informative features, ensuring a well-generalized model rather than directly boosting specificity. Additionally, the TSA for weight optimization fine-tunes ensemble learning by adjusting model parameters to balance sensitivity and specificity while preventing overfitting. While the 1%–2% improvement in specificity may appear minor in percentage terms, in real-world medical applications, this translates into a significant reduction in misdiagnosed healthy individuals, leading to fewer unnecessary medical tests, reduced anxiety, and better resource allocation.
Fig. 3 presents the False Positive Rate (FPR) values for different machine learning models applied to the problem at hand. The FPR is a critical metric in classification tasks, particularly when evaluating models for imbalanced datasets. The FPR measures the proportion of actual negatives that are incorrectly classified as positives. A lower FPR indicates better model performance in distinguishing between the positive and negative classes, minimizing the misclassification of negatives as positives. The results reveal notable differences in their ability to minimize false positives. Logistic Regression, a simple linear model, has an FPR of 0.107, indicating that approximately 10.7% of actual negatives are misclassified as positives, leaving room for improvement. SVM performs better, with an FPR of 0.095, showing its strength in handling non-linearity and better distinguishing between positive and negative classes. Decision Trees, however, have the highest FPR at 0.141, suggesting sensitivity to data variations and potential overfitting, which leads to more false positives. In contrast, the proposed model combining GA and TSA significantly improves performance, reducing the FPR to 0.022, indicating only 2.2% of actual negatives are misclassified. The best-performing model, combining GA + TSA with SMOTE achieves the lowest FPR of 0.016, effectively addressing class imbalance and further reducing false positives. This combination results in a highly accurate and balanced model that outperforms the other models in minimizing misclassifications.

Figure 3: False positive rate (FPR) for different models
While the hybrid model for heart disease prediction offers promising improvements, it faces several limitations. The integration of the GA and TSA, though beneficial for feature selection and model optimization, introduces computational complexity that may hinder its application in real-time settings or on devices with limited resources. Additionally, the model’s performance is highly dependent on the quality and representativeness of the training dataset; unbalanced or non-representative data may affect its generalizability to other populations. The ensemble deep learning approach also poses challenges for interpretability, which can be a drawback in clinical contexts where understanding the rationale behind predictions is essential. Although GA aids in feature reduction, the model’s complexity could still lead to overfitting, especially on smaller datasets, reducing effectiveness on unseen data. Furthermore, the GA and TSA require precise hyperparameter tuning, which can be challenging without domain expertise. Furthermore, the model’s validation scope may be limited to specific datasets or populations, underscoring the need for broader testing to confirm its robustness across various demographic and clinical settings.
In addition to the previously discussed limitations, the hybrid model’s reliance on advanced techniques GA and TSA introduces concerns regarding dataset size and computational cost. The model’s performance heavily depends on the amount and quality of data available for training. Small datasets, particularly those with limited samples or imbalanced class distributions, may result in overfitting, as the model might memorize the noise or specific patterns rather than generalize well to unseen data. This issue is compounded when using techniques like GA, which require a large number of iterations to explore the solution space thoroughly, making them computationally expensive. The time complexity involved in feature selection and optimization can be prohibitive, particularly when applied to large datasets or when the model is required to run in real-time scenarios. Additionally, these algorithms demand substantial computational resources, including memory and processing power, which can be a significant drawback for deployment on devices with limited hardware, such as mobile phones or edge devices. The high computational cost also limits the scalability of the model, making it less feasible for use in environments where fast decision-making is critical or when large-scale deployment is necessary. Therefore, addressing these concerns is crucial to ensure that the model remains both efficient and practical for real-world applications, particularly in resource-constrained settings.
In addition, the suggested model does have certain limitations, particularly in the context of both the potential overfitting of ensemble models and the complexity and explainability of deep learning in healthcare settings. Ensemble models, by combining multiple learning algorithms, have the advantage of increased predictive accuracy. However, this can also lead to overfitting, especially if the model is trained on highly specific datasets or lacks sufficient diversity in the training samples, causing it to perform well on training data but poorly on unseen data. This reduces the model’s generalizability to real-world, diverse patient populations. Additionally, while deep learning models can provide high accuracy, their complexity poses challenges in terms of interpretability and explainability, especially in healthcare applications where clinicians need to understand and trust the model’s predictions. The “black box” nature of deep learning models can make it difficult to pinpoint the reasons behind a particular decision, such as why a patient is classified as high-risk, which can hinder the model’s adoption in clinical environments where transparency and trust are crucial. These challenges underscore the need for continuous efforts to balance model performance with interpretability and ensure that the model remains robust, understandable, and applicable across different healthcare contexts.
This work concludes with a novel, hybrid model for heart disease prediction that shows clear advantages in accuracy, efficiency, and generalization. By addressing key challenges such as high data dimensionality, redundant features, and classification complexity, the model integrates feature selection through a GA and utilizes the TSA to optimize an ensemble of deep learning models. GA identifies the most relevant features, reducing data dimensionality and computational load, while the TSA optimally weighs each model in the ensemble to enhance prediction accuracy. This approach achieved significantly improved results over traditional methods, with accuracy at 97.5%, sensitivity at 97.2%, and specificity at 97.8%, underscoring its effectiveness in accurately identifying heart disease risks. These findings suggest that this model offers a robust and scalable solution for complex medical datasets. Future development could focus on validating its applicability across diverse demographic datasets and further refining the model for real-time deployment in clinical environments.
In future work, interpretability techniques such as SHAP (Shapley Additive Explanations) and LIME (Local Interpretable Model-agnostic Explanations) will be explored to enhance the clinical relevance of the predictions. SHAP will be utilized to provide both global and local insights into feature contributions, enabling clinicians to assess the significance of key risk factors such as cholesterol levels, blood pressure, and smoking status. LIME will be employed to generate locally interpretable models, offering explanations for individual predictions and improving transparency in diagnosis. Additionally, feature importance analysis through permutation importance or decision tree-based methods will be investigated to identify the most influential clinical attributes. By integrating these interpretability techniques, the model aims to improve trust among healthcare professionals and support personalized risk assessment and clinical decision-making.
Acknowledgement: Not applicable.
Funding Statement: The authors received no specific funding for this study.
Author Contributions: The authors confirm their contribution to the paper as follows: study conception and design, data collection, analysis and interpretation of results, draft manuscript preparation: Iman S. Al-Mahdi, Saad M. Darwish, and Magda M. Madbouly. All authors reviewed the results and approved the final version of the manuscript.
Availability of Data and Materials: The datasets analyzed during the current study are available in the Kaggle repository, https://www.kaggle.com/datasets/redwankarimsony/heart-disease-data (accessed on 1 January 2025).
Ethics Approval: Not applicable.
Conflicts of Interest: The authors declare no conflicts of interest to report regarding the present study.
References
1. Bizimana PC, Zhang Z, Asim M, El-Latif AA, Hammad M. Learning-based techniques for heart disease prediction: a survey of models and performance metrics. Multimed Tools Appl. 2024;83(13):39867–921. doi:10.1007/s11042-023-17051-9. [Google Scholar] [CrossRef]
2. Bhavekar GS, Das Goswami A, Vasantrao CP, Gaikwad AK, Zade AV, Vyawahare H. Heart disease prediction using machine learning, deep Learning and optimization techniques—a semantic review. Multimed Tools Appl. 2024;83(39):86895–922. doi:10.1007/s11042-024-19680-0. [Google Scholar] [CrossRef]
3. Vision Paul V, Ali Ibrahim Syed Masood J. Exploring predictive methods for cardiovascular disease: a survey of methods and applications. IEEE Access. 2024;12(2):101497–505. doi:10.1109/ACCESS.2024.3430898. [Google Scholar] [CrossRef]
4. Mall S. Heart attack prediction using machine learning techniques. In: 2024 4th International Conference on Advance Computing and Innovative Technologies in Engineering (ICACITE); 2024 May 14–15; Greater Noida, India. p. 1778–83. [Google Scholar]
5. Ahmed M, Husien I. Heart disease prediction using hybrid machine learning: a brief review. J Robot Control. 2024;5(3):884–92. doi:10.18196/jrc.v5i3.21606. [Google Scholar] [CrossRef]
6. Milosevic M, Jin Q, Singh A, Amal S. Applications of AI in multi-modal imaging for cardiovascular disease. Front Radiol. 2024;3:1294068. doi:10.3389/fradi.2023.1294068. [Google Scholar] [PubMed] [CrossRef]
7. Naser MA, Majeed AA, Alsabah M, Al-Shaikhli TR, Kaky KM. A review of machine learning’s role in cardiovascular disease prediction: recent advances and future challenges. Algorithms. 2024;17(2):78. doi:10.3390/a17020078. [Google Scholar] [CrossRef]
8. Rao GM, Ramesh D, Sharma V, Sinha A, Hassan MM, Gandomi AH. AttGRU-HMSI: enhancing heart disease diagnosis using hybrid deep learning approach. Sci Rep. 2024;14(1):7833. doi:10.1038/s41598-024-56931-4. [Google Scholar] [PubMed] [CrossRef]
9. Mienye ID, Sun Y, Wang Z. An improved ensemble learning approach for the prediction of heart disease risk. Inform Med Unlocked. 2020;20(8):100402. doi:10.1016/j.imu.2020.100402. [Google Scholar] [CrossRef]
10. Mienye ID, Jere N. Optimized ensemble learning approach with explainable AI for improved heart disease prediction. Information. 2024;15(7):394. doi:10.3390/info15070394. [Google Scholar] [CrossRef]
11. Gao XY, Amin Ali A, Shaban Hassan H, Anwar EM. Improving the accuracy for analyzing heart diseases prediction based on the ensemble method. Complexity. 2021;2021(1):6663455. doi:10.1155/2021/6663455. [Google Scholar] [CrossRef]
12. Kumar M, Sekhar DP, Siddhartha KN, Pilania U, Reddy KS, Shashank A. Heart attack prediction using machine learning algorithms. In: 2024 International Conference on Cybernation and Computation (CYBERCOM); 2024 Nov 15–16; Dehradun, India. p. 302–7. [Google Scholar]
13. Du C, Zhang J. An enhanced tunicate swarm algorithm with symmetric cooperative swarms for training feedforward neural networks. Symmetry. 2024;16(7):866. doi:10.3390/sym16070866. [Google Scholar] [CrossRef]
14. Laishram R, Rabidas R. Binary tunicate swarm algorithm based novel feature selection framework for mammographic mass classification. Measurement. 2024;235:114928. doi:10.1016/j.measurement.2024.114928. [Google Scholar] [CrossRef]
15. Awari H, Subramani N, Janagaraj A, Balasubramaniapillai Thanammal G, Thangarasu J, Kohar R. Three-dimensional dental image segmentation and classification using deep learning with tunicate swarm algorithm. Expert Syst. 2024;41(6):e13198. doi:10.1111/exsy.13198. [Google Scholar] [CrossRef]
16. Abdullahi A, Ali Barre M, Hussein Elmi A. A machine learning approach to cardiovascular disease prediction with advanced feature selection. Indones J Electr Eng Comput Sci. 2024;33(2):1030. doi:10.11591/ijeecs.v33.i2.pp1030-1041. [Google Scholar] [CrossRef]
17. Razzaque A, Badholia DA. PCA based feature extraction and MPSO based feature selection for gene expression microarray medical data classification. Meas Sens. 2024;31:100945. doi:10.1016/j.measen.2023.100945. [Google Scholar] [CrossRef]
18. Ul Ain Q, Al-Sahaf H, Xue B, Zhang M. Feature extraction with automated scale selection in skin cancer image classification: a genetic programming approach. In: Proceedings of the Genetic and Evolutionary Computation Conference; 2024 Jul 14–18; Melbourne, VIC, Australia. p. 1363–72. [Google Scholar]
19. Alharbi A, Alghahtani M. Using genetic algorithm and ELM neural networks for feature extraction and classification of type 2-diabetes mellitus. Appl Artif Intell. 2019;33(4):311–28. doi:10.1080/08839514.2018.1560545. [Google Scholar] [CrossRef]
20. Suganthi GV, Sutha J, Parvathy M, Muthamil Selvi N. Genetic algorithm for feature selection in mammograms for breast masses classification. Comput Meth Biomech Biomed Eng Imag Vis. 2024;11(7):2266031. doi:10.1080/21681163.2023.2266031. [Google Scholar] [CrossRef]
21. El-Sofany H, Bouallegue B, El-Latif YMA. A proposed technique for predicting heart disease using machine learning algorithms and an explainable AI method. Sci Rep. 2024;14(1):23277. doi:10.1038/s41598-024-74656-2. [Google Scholar] [PubMed] [CrossRef]
22. Mohammad Ganie S, Kanti Dutta Pramanik P, Bashir Malik M, Nayyar A, Sup Kwak K. An improved ensemble learning approach for heart disease prediction using boosting algorithms. Comput Syst Sci Eng. 2023;46(3):3993–4006. doi:10.32604/csse.2023.035244. [Google Scholar] [CrossRef]
23. Almulihi A, Saleh H, Hussien AM, Mostafa S, El-Sappagh S, Alnowaiser K, et al. Ensemble learning based on hybrid deep learning model for heart disease early prediction. Diagnostics. 2022;12(12):3215. doi:10.3390/diagnostics12123215. [Google Scholar] [PubMed] [CrossRef]
24. Al-Sayed A, Khayyat MM, Zamzami N. Predicting heart disease using collaborative clustering and ensemble learning techniques. Appl Sci. 2023;13(24):13278. doi:10.3390/app132413278. [Google Scholar] [CrossRef]
25. Asif D, Bibi M, Arif MS, Mukheimer A. Enhancing heart disease prediction through ensemble learning techniques with hyperparameter optimization. Algorithms. 2023;16(6):308. doi:10.3390/a16060308. [Google Scholar] [CrossRef]
26. Khan H, Javaid N, Bashir T, Akbar M, Alrajeh N, Aslam S. Heart disease prediction using novel ensemble and blending based cardiovascular disease detection networks: EnsCVDD-Net and BlCVDD-Net. IEEE Access. 2024;12:109230–54. doi:10.1109/ACCESS.2024.3421241. [Google Scholar] [CrossRef]
27. Bouqentar MA, Terrada O, Hamida S, Saleh S, Lamrani D, Cherradi B, et al. Early heart disease prediction using feature engineering and machine learning algorithms. Heliyon. 2024;10(19):e38731. doi:10.1016/j.heliyon.2024.e38731. [Google Scholar] [PubMed] [CrossRef]
28. Meenal MR, Vennila SM. Bagging ensemble mining technique with deep belief network (DBN) algorithm-based heart disease prediction. ICTACT J Image Video Process. 2024;14(4):3293–300. doi:10.21917/ijivp.2024.0468. [Google Scholar] [CrossRef]
29. Wu Y, Xia Z, Feng Z, Huang M, Liu H, Zhang Y. Forecasting heart disease risk with a stacking-based ensemble machine learning method. Electronics. 2024;13(20):3996. doi:10.3390/electronics13203996. [Google Scholar] [CrossRef]
30. Praveen SP, Hasan MK, Abdullah SNHS, Sirisha U, Tirumanadham NSKMK, Islam S, et al. Enhanced feature selection and ensemble learning for cardiovascular disease prediction: hybrid GOL2-2 T and adaptive boosted decision fusion with babysitting refinement. Front Med. 2024;11:1407376. doi:10.3389/fmed.2024.1407376. [Google Scholar] [PubMed] [CrossRef]
31. Mandula A, Vijaya Kumar BS. Integrated feature selection and ensemble learning for heart disease detection: a 2-tier approach with ALAN and ET-ABDF machine learning model. Int J Inf Technol. 2024;16(7):4489–503. doi:10.1007/s41870-024-02016-4. [Google Scholar] [CrossRef]
32. Abdellatif A, Mubarak H, Abdellatef H, Kanesan J, Abdelltif Y, Chow CO, et al. Computational detection and interpretation of heart disease based on conditional variational auto-encoder and stacked ensemble-learning framework. Biomed Signal Process Contr. 2024;88:105644. doi:10.1016/j.bspc.2023.105644. [Google Scholar] [CrossRef]
33. Venkatesh Babu S, Ramya P, Gracewell J. Revolutionizing heart disease prediction with quantum-enhanced machine learning. Sci Rep. 2024;14(1):7453. doi:10.1038/s41598-024-55991-w. [Google Scholar] [PubMed] [CrossRef]
34. Kumar N, Poonam. Enhancing heart disease prediction through optimized ensemble machine learning models: a hyperparameter tuning approach. In: 2024 MIT Art, Design and Technology School of Computing International Conference (MITADTSoCiCon); 2024 Apr 25–27; Pune, India. p. 1–6. [Google Scholar]
35. Kaur I, Ahmad T. A cluster-based ensemble approach for congenital heart disease prediction. Comput Methods Programs Biomed. 2024;243(19):107922. doi:10.1016/j.cmpb.2023.107922. [Google Scholar] [PubMed] [CrossRef]
36. Mali S, Veeramani K. Heart attack prediction using ensemble learning. In: 2024 International Conference on Signal Processing, Computation, Electronics, Power and Telecommunication (IConSCEPT); 2024 Jul 4–5; Karaikal, India. p. 1–6. [Google Scholar]
37. Mahajan P, Uddin S, Hajati F, Moni MA. Ensemble learning for disease prediction: a review. Healthcare. 2023;11(12):1808. doi:10.3390/healthcare11121808. [Google Scholar] [PubMed] [CrossRef]
38. Gürkan Kuntalp D, Özcan N, Düzyel O, Kababulut FY, Kuntalp M. A comparative study of metaheuristic feature selection algorithms for respiratory disease classification. Diagnostics. 2024;14(19):2244. doi:10.3390/diagnostics14192244. [Google Scholar] [PubMed] [CrossRef]
39. Ali MZ, Abdullah A, Zaki AM, Rizk FH, Eid MM, El-Kenway EM. Advances and challenges in feature selection methods: a comprehensive review. J Artif Intell Metaheuristics. 2024;7(1):67–77. doi:10.54216/JAIM.070105. [Google Scholar] [CrossRef]
40. Nadheer I. Heart Disease Prediction System using hybrid model of Multi-layer perception and XGBoost algorithms. BIO Web Conf. 2024;97(8):00047. doi:10.1051/bioconf/20249700047. [Google Scholar] [CrossRef]
41. Gupta P, Seth DD. Early detection of heart disease using multilayer perceptron. In: Micro-Electronics and Telecommunication Engineering: Proceedings of 6th ICMETE 2022; 2023; Berlin/Heidelberg, Germany: Springer. p. 309–15. [Google Scholar]
42. Al Bataineh A, Manacek S. MLP-PSO hybrid algorithm for heart disease prediction. J Pers Med. 2022;12(8):1208. doi:10.3390/jpm12081208. [Google Scholar] [PubMed] [CrossRef]
43. Ganie SM, Dutta Pramanik PK. A comparative analysis of boosting algorithms for chronic liver disease prediction. Healthc Anal. 2024;5(1):100313. doi:10.1016/j.health.2024.100313. [Google Scholar] [CrossRef]
Cite This Article
 Copyright © 2025 The Author(s). Published by Tech Science Press.
This work is licensed under a Creative Commons Attribution 4.0 International License , which permits unrestricted use, distribution, and reproduction in any medium, provided the original work is properly cited.
 Downloads
 Citation Tools