
 Submit a Paper
 Propose a Special lssue
 Open Access
ARTICLE
Wavelet Transform Convolution and Transformer-Based Learning Approach for Wind Power Prediction in Extreme Scenarios
1 Electric Power Research Institute, State Grid Hebei Electric Power Co., Ltd., Shijiazhuang, 050021, China
2 State Grid Hebei Electric Power Co., Ltd., Shijiazhuang, 050021, China
3 College of Artificial Intelligence and Automation, Hohai University, Nanjing, 210098, China
4 China National Power Dispatching and Control Center, State Grid Corporation of China, Beijing, 100031, China
5 China Electric Power Research Institute Co., Ltd., Beijing, 210037, China
* Corresponding Author: Yonghui Sun. Email:
(This article belongs to the Special Issue: Advances in Deep Learning for Time Series Forecasting: Research and Applications)
Computer Modeling in Engineering & Sciences 2025, 143(1), 945-965. https://doi.org/10.32604/cmes.2025.062315
Received 16 December 2024; Accepted 03 March 2025; Issue published 11 April 2025
 View Full Text
 Download PDF
Abstract
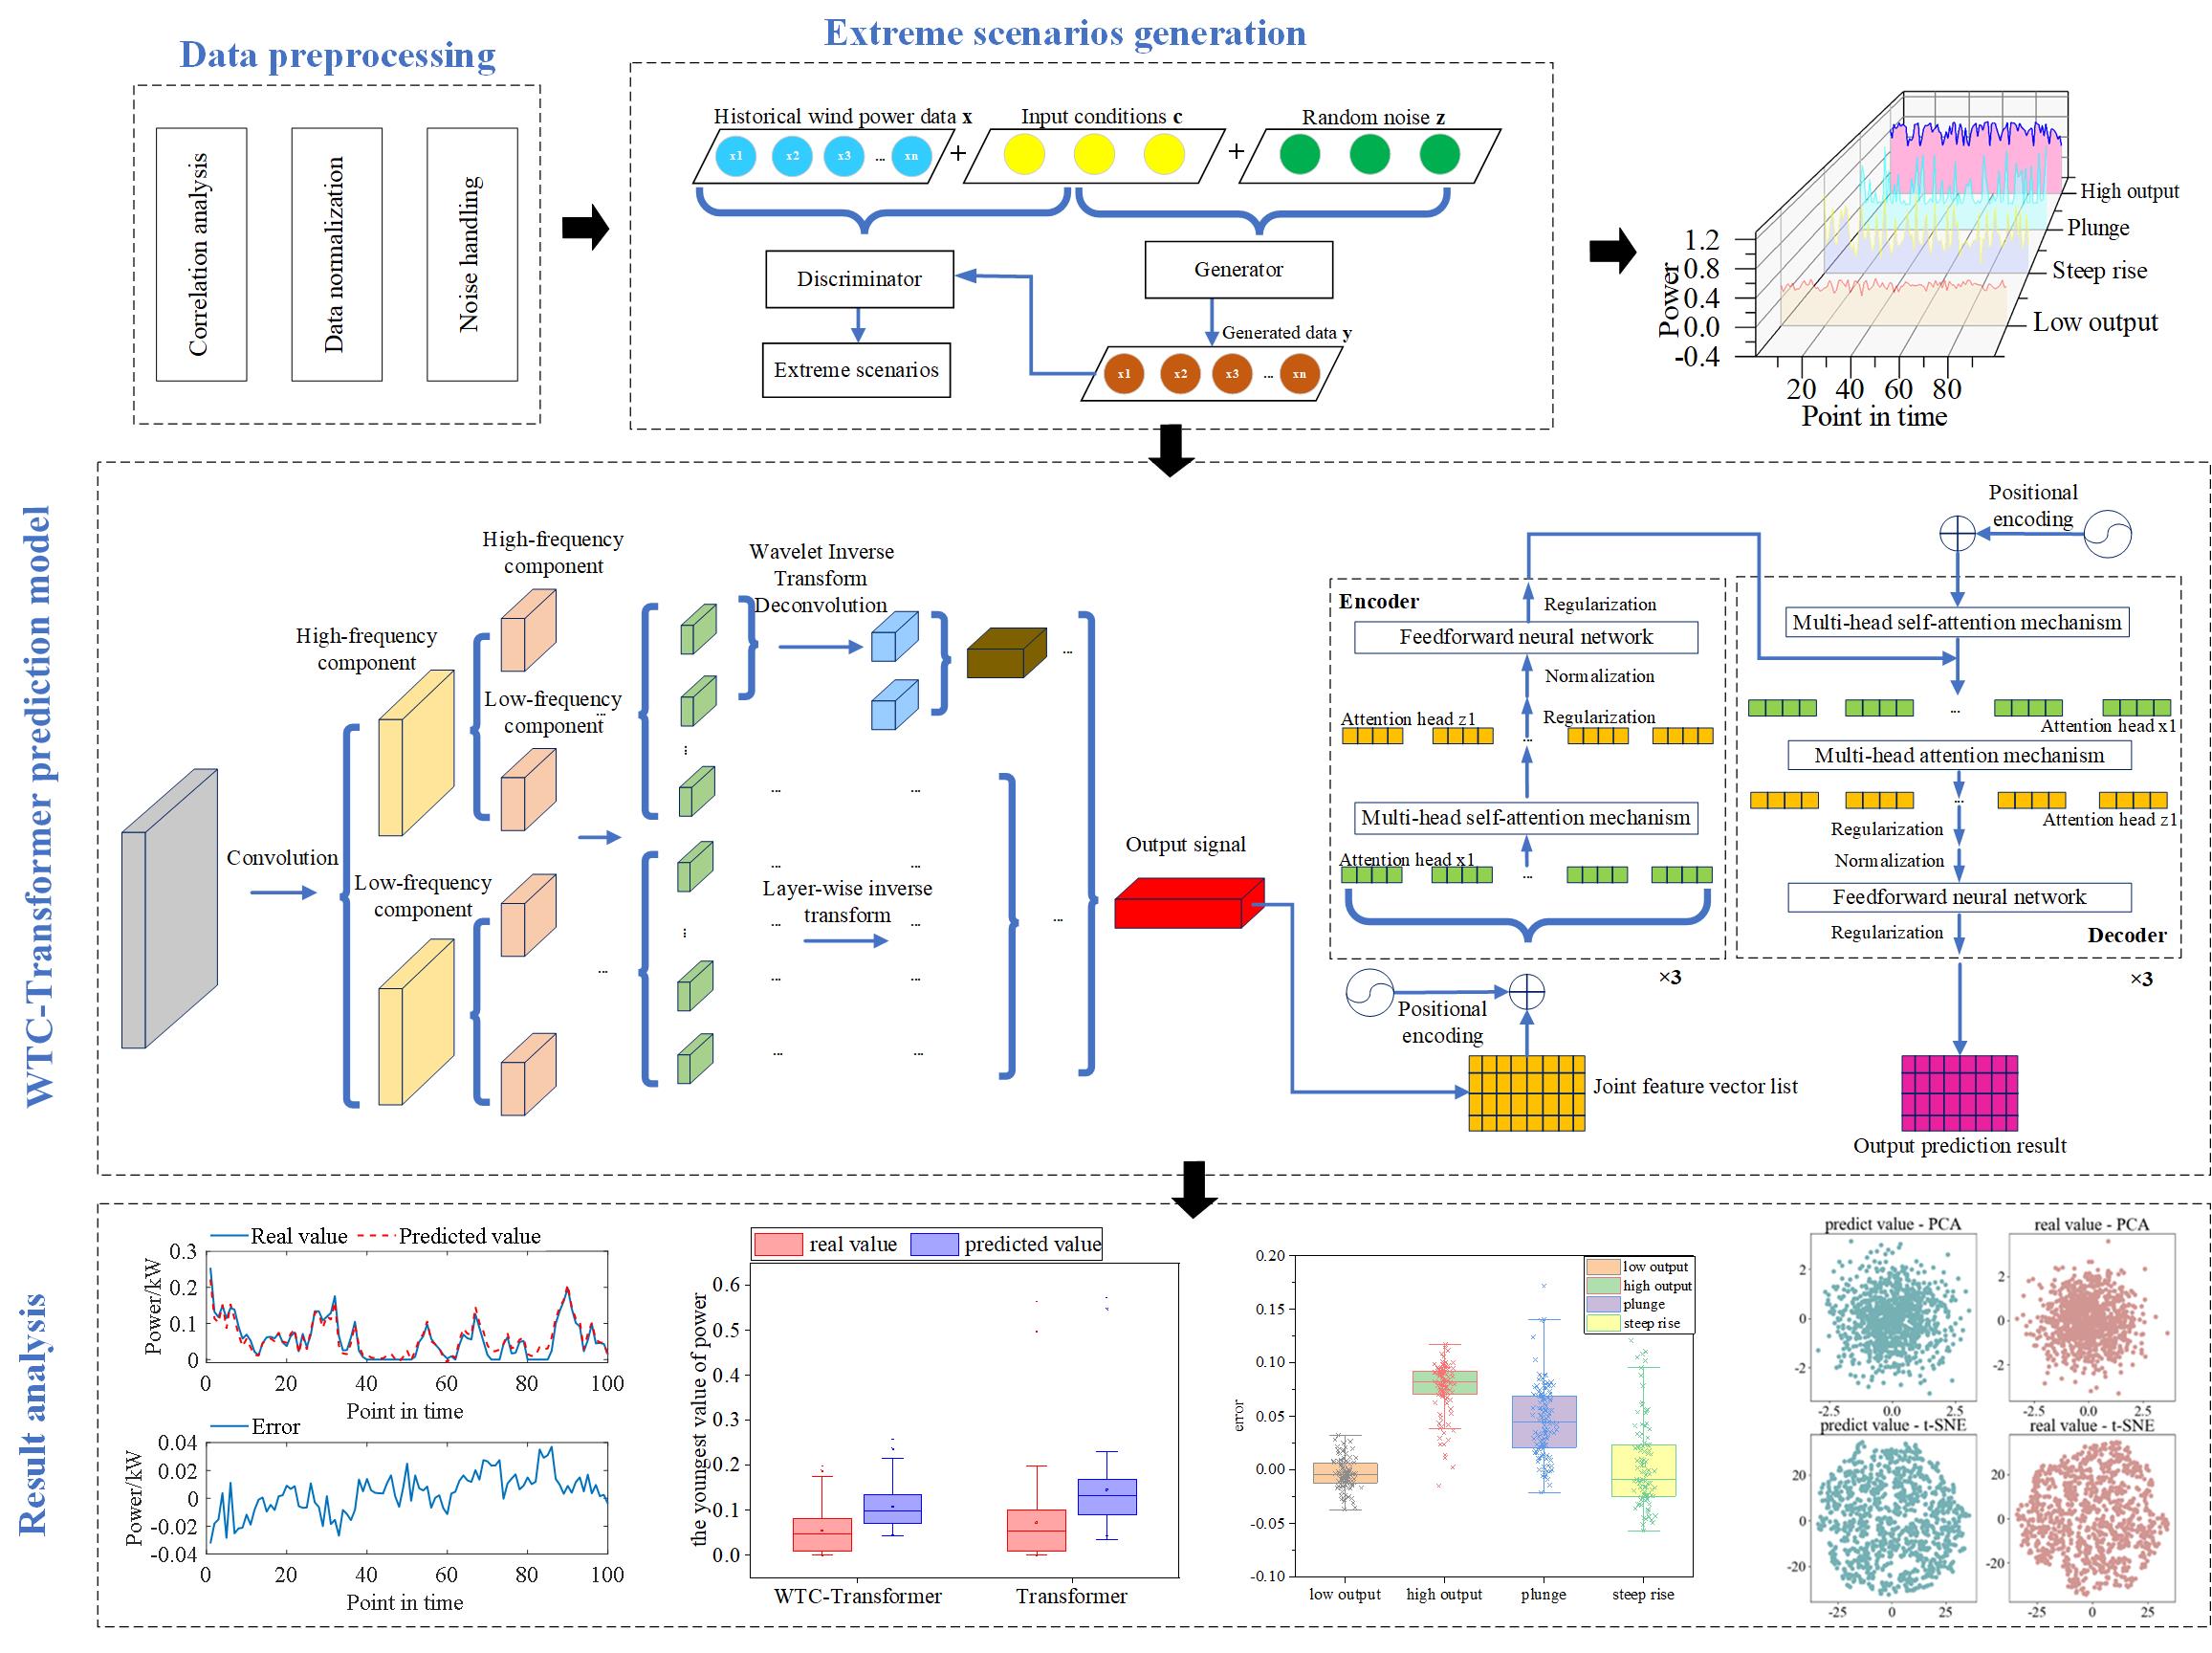
Wind power generation is subjected to complex and variable meteorological conditions, resulting in intermittent and volatile power generation. Accurate wind power prediction plays a crucial role in enabling the power grid dispatching departments to rationally plan power transmission and energy storage operations. This enhances the efficiency of wind power integration into the grid. It allows grid operators to anticipate and mitigate the impact of wind power fluctuations, significantly improving the resilience of wind farms and the overall power grid. Furthermore, it assists wind farm operators in optimizing the management of power generation facilities and reducing maintenance costs. Despite these benefits, accurate wind power prediction especially in extreme scenarios remains a significant challenge. To address this issue, a novel wind power prediction model based on learning approach is proposed by integrating wavelet transform and Transformer. First, a conditional generative adversarial network (CGAN) generates dynamic extreme scenarios guided by physical constraints and expert rules to ensure realism and capture critical features of wind power fluctuations under extreme conditions. Next, the wavelet transform convolutional layer is applied to enhance sensitivity to frequency domain characteristics, enabling effective feature extraction from extreme scenarios for a deeper understanding of input data. The model then leverages the Transformer’s self-attention mechanism to capture global dependencies between features, strengthening its sequence modelling capabilities. Case analyses verify the model’s superior performance in extreme scenario prediction by effectively capturing local fluctuation features while maintaining a grasp of global trends. Compared to other models, it achieves R-squared (R2) as high as 0.95, and the mean absolute error (MAE) and root mean square error (RMSE) are also significantly lower than those of other models, proving its high accuracy and effectiveness in managing complex wind power generation conditions.Graphic Abstract
Keywords
In alignment with the carbon peaking and carbon neutrality goals, China is advancing toward a power system primarily powered by renewable energy sources. Wind power is a central contributor to this transformation [1,2]. As one of the most abundant and clean renewable energy sources, wind power has become a crucial component of global energy transition strategies. Its widespread deployment not only reduces dependence on fossil fuels but also significantly mitigates greenhouse gas emissions, contributing to sustainable energy development.
Despite its advantages, wind power generation is inherently intermittent and highly dependent on meteorological conditions, leading to significant fluctuations in power output. Variations in wind speed, atmospheric pressure, temperature, and other environmental factors introduce considerable uncertainty into wind power forecasting [3]. These uncertainties pose challenges for power grid operation, requiring robust prediction models to ensure accurate forecasting and the efficient integration of wind energy into the grid.
Moreover, extreme weather events, such as typhoons, cold waves, and thunderstorms, further complicate wind power prediction. These extreme conditions can cause sudden and drastic fluctuations in wind power output, increasing the risk of grid instability and energy imbalances [4]. Therefore, improving the accuracy and reliability of wind power prediction under extreme scenarios is crucial for ensuring the safe and stable operation of power systems.
Given these challenges, advanced forecasting methodologies that incorporate meteorological dynamics, deep learning techniques, and hybrid modeling approaches have gained significant attention. Enhancing wind power prediction under extreme conditions not only supports grid stability but also facilitates better resource allocation, dispatch optimization, and overall efficiency in renewable energy utilization.
Extreme scenarios, while critical for grid operations and decision-making, account for only a minor fraction of historical data. This scarcity significantly limits the effectiveness of traditional modeling approaches in managing extreme conditions [5,6]. This highlights the need for methods to generate synthetic extreme scenario data to expand available data samples for analysis. Methods for scenario generation can be broadly classified into model-driven and data-driven approaches. Model-driven approaches employ probabilistic models, such as Markov chains [7], copula function [8], and extreme value theory [9]. These methods excel in theoretical formulations and statistical modeling. However, they often fail to capture feature interdependencies and complex, nonlinear dynamics, thereby limiting their application in realistic, multidimensional scenarios. Data-driven approaches [10], on the other hand, rely on advanced machine learning models like generative adversarial networks (GANs) [11], variational autoencoder (VAE) [12], and diffusion model [13], facilitating the integration of diverse data characteristics and enabling realistic simulations that align with practical requirements. Recent studies have explored various data-driven methods for scenario generation. For instance, in [14], a clustering-based method was proposed to generate time-series scenarios, enhancing the quality of generated scenarios.
Meanwhile, in [15], an improved VAE model for renewable energy scenario generation that combines graph neural networks with time-series convolutions was proposed to capture correlations and introduce tagged values. Besides, in [16], an approach combining Informer and a time-series GAN generated prediction error sequences was proposed to create accurate day-ahead wind power scenarios. While these methods achieve impressive results in typical scenario generation, they are less effective in addressing unexpected events or extreme conditions. They frequently struggle to capture long-term dependencies and fail to ensure sufficient diversity under such scenarios. To overcome these limitations, further exploration into extreme scenario generation is essential for enhancing model adaptability and accuracy under extreme conditions.
To address the scarcity of extreme scenario data, recent studies have focused on transfer learning [17] and small-sample simulation methods [18]. For example, in [19], a distribution transfer method was applied to increase the proportion of extreme scenarios within the training set, generating diverse types of extreme scenarios to mitigate the limitations posed by small sample sizes. However, this approach struggles to adapt to complex, nonlinear, multidimensional scenarios and has limited capability in capturing long-term dependencies. In [20], a weighted adversarial bidirectional long short-term memory (BiLSTM) model was applied to analyze temporal correlations between photovoltaic (PV) power and meteorological data. It achieved accurate prediction under limited data conditions. However, the reliance on established models constrained its ability to generate novel extreme scenarios, resulting in limited diversity in generated results. Given these challenges, this study proposes a conditional generative adversarial network (CGAN) approach tailored for extreme scenario generation. This approach generates diverse and controllable scenarios by incorporating physical constraints and expert rules. Unlike traditional transfer learning or small-sample simulation methods, incorporating physical constraints ensures that generated extreme scenarios remain within realistic boundaries, thereby avoiding unrealistic wind power outputs. Expert rules enable the model to accurately reflect wind power fluctuations during extreme events, enhancing the robustness of the generated scenarios. The proposed method effectively handles complex, nonlinear, and multidimensional data while addressing long-term dependencies, a challenge for many existing approaches.
Wind power is highly volatile and unpredictable, where sudden shifts threaten grid stability. Accurate wind power prediction enables power system operators to proactively formulate response strategies, ensuring grid stability during adverse conditions. This approach mitigates the impact of wind power integration on grid stability and reduces economic losses. Wind power prediction methods span from statistical and machine learning approaches to deep learning models. In [21], a prediction model that combined VAE and self-attention mechanism was proposed, which obtained better prediction performance. In [22], an ensemble learning method combined multiple models was proposed, which obtained better prediction results than independent models. In [23], convolutional neural networks (CNN) were proposed for probabilistic wind power prediction. To overcome the scalability constraints and vanishing gradient phenomena in multilayer perceptron (MLP), the Kolmogorov-Arnold network (KAN) as an innovative architectural alternative was proposed in [24]. In [25], a CGAN-based model was proposed, in which CNN was used as internal structure. Although the above methods have achieved good prediction performance, there is a lack of research on the wind power in extreme scenarios. In recent years, extreme weather such as cold wave and typhoon have caused serious losses to the power system. Therefore, the research on accurate and reliable wind power prediction in extreme scenarios has gradually become a hot topic [26]. Recent advancements in deep learning, particularly with models like long short-term memory (LSTM) networks, CNN, and Transformer [27], have made substantial progress in extreme scenario prediction. In [28], a lightweight gradient lifting model optimized with Bayesian techniques was developed to assess the time-series data from wind turbines under ice-covering conditions, enhancing prediction accuracy in imbalanced scenarios. Although the prediction accuracy of the model was improved under the condition of ice cover. However, the sample diversity was insufficient and the interpretability was lacking. For wind power abrupt change in extreme scenarios, long-term low output and high power, no relevant prediction accuracy improvement methods were given. The wavelet transform and Transformer integration can capture both frequency domain features and time dependencies, enhancing the model’s adaptability to nonstationary and complex wind power data. In [29], wavelet transform was shown to extend the sensory field and improve low-frequency information capture, bolstering network robustness. With powerful time-frequency analysis capabilities, wavelet transform excels in handling non-smooth signals and extracting multi-scale data features. While Transformer’s robust sequence modelling enhances time-series prediction.
1.3 Contributions of This Paper
Based on the above-mentioned studies, this paper proposes a novel wavelet transform convolution-Transformer (WTC-Transformer) based learning approach for wind power prediction in extreme scenarios. By leveraging CGAN to generate adjustable extreme scenarios, this approach integrates physical constraints and expert rules to enhance scenario generation. The wavelet transform is applied to process scenario features, which are then fed into the Transformer model, enhancing the accuracy of extreme scenario prediction. The model is trained on diverse scenarios to improve predictive performance across extreme conditions. The main contributions of this paper are summarized as follows:
(1) A CGAN-based method is proposed to simulate wind power distribution under extreme meteorological conditions. It provides controllable multi-scenario data for wind power prediction in extreme scenarios.
(2) A novel wind power prediction model is proposed which integrates wavelet transform with the self-attention mechanism. It effectively captures multi-scale features in wind power time series, improving prediction accuracy.
(3) By incorporating CGAN-generated extreme scenarios, the WTC-Transformer model improves its ability to capture complex wind power time-series pattern. This approach enhances its adaptability to a variety of extreme scenarios, advancing its overall robustness and precision.
The overall structure of this paper is as follows: Section 2 introduces the proposed approach, including the model architecture and the key techniques adopted. In Section 3, the overall steps and framework of the model are described. In Section 4, the experiments and data sets used are described, followed by results and performance evaluations. Finally, Section 5 summarizes the research results of this paper and the direction of future work.
2.1 CGAN for Extreme Scenario Generation
Given the scarcity of extreme samples in wind power scenarios, generating additional samples is essential. Generative adversarial networks are well-suited for this task as they comprise two networks: a generator and a discriminator. The generator creates data based on random noise, and the discriminator distinguishes generated samples from real data. Through iterative competition, the generator learns to produce realistic samples.
However, traditional GANs struggle to capture specific, essential features in the data, particularly under complex conditions such as extreme wind power scenarios. To address this, the Conditional generative adversarial network extends the traditional GANs by incorporating physical condition information as an input condition [30]. This modification allows the CGAN to learn better and generate samples that align with real-world extreme conditions. CGAN addresses data scarcity by expanding training sets and increasing diversity. Its flexibility allows the generation of diverse, controllable extreme scenarios, enhancing predictive model testing. Moreover, CGAN’s ability to learn complex, nonlinear patterns through condition vectors results in clearer, more realistic samples for grid stability analysis.
In a CGAN, the generator receives a random noise vector
where
In CGAN, the objective functions of the generator and discriminator are shown as:
where
Eventually, the generator and the discriminator go through several iterations and play the game, very small values to reach the Nash equilibrium, which is shown as:
The structure of CGAN is shown in Fig. 1.
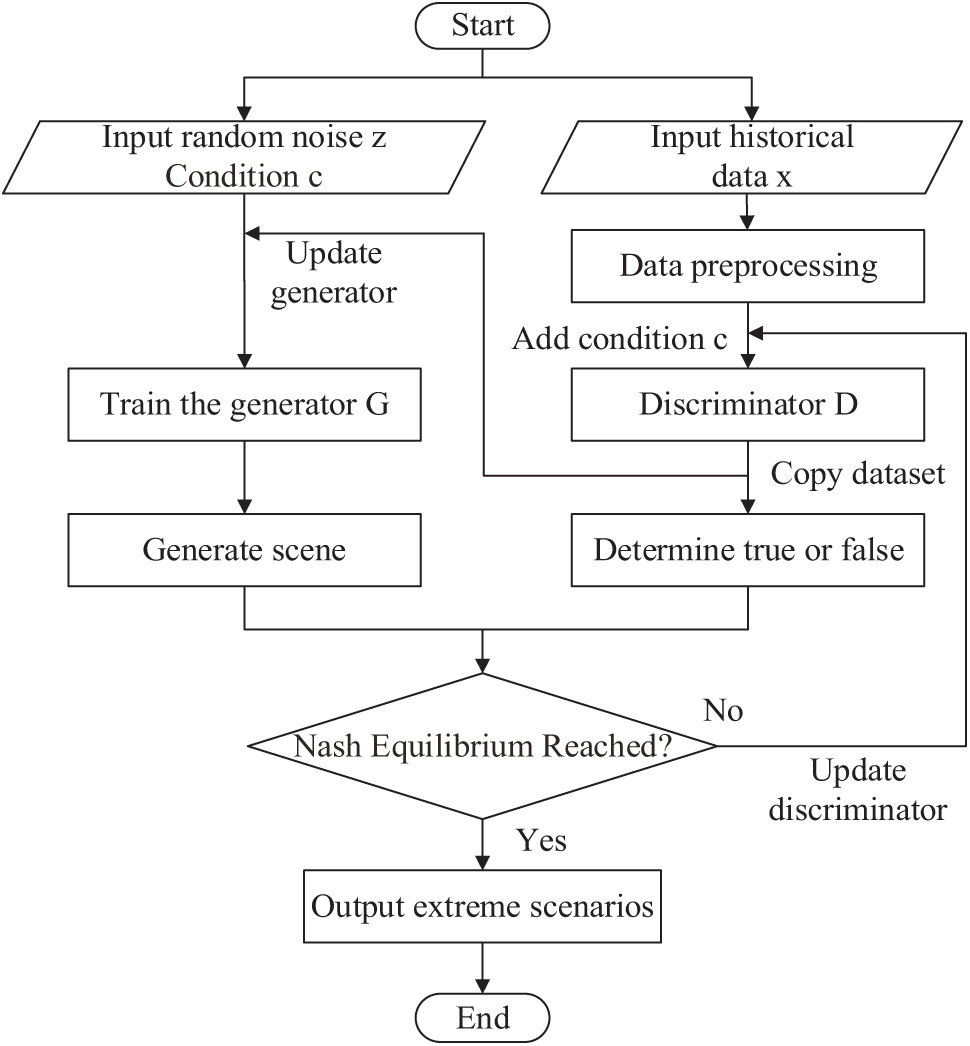
Figure 1: Structure of CGAN proposed in this paper
2.2 Wavelet Transform Convolution Module
Wavelet transform convolution (WTC) combines wavelet transforms with convolutional neural networks. It leverages wavelets’ ability to perform multi-scale analysis by scaling and shifting wavelet functions. This setup enables WTC to effectively capture details across different scales and extract complex features. The wavelet transform formula is shown as:
where
In the WTC setup, a one-dimensional convolutional layer is formed by combining wavelet transforms and CNN to leverage both wavelet’s multi-resolution analysis and CNN’s feature extraction capabilities [27].
The wavelet transform decomposes the signal layer-by-layer into low-frequency and high-frequency components, and each layer’s output undergoes convolution operations with amplitude adjustments for each scale. After decomposing, the inverse wavelet transform reconstructs the signal from the high- and low-frequency components, from the last layer to the first. The final output signal is obtained by summing the original input with the reconstructed signal, passing through a base convolution layer and scaling module. This WTC approach enables the model to perform multi-resolution analysis, capturing the frequency characteristics of signals across different time scales, effectively handling global trends and local variations within the data.
The Transformer architecture uses the self-attention mechanism that effectively models dependencies within sequential data. It consists of encoder and decoder. The ender encodes input sequences into hidden vectors, and then the decoder transforms these vectors into output sequences.
2.3.1 Self-Attention Mechanism
The self-attention mechanism empowers the model to focus on the most significant parts of the input sequence when processing data. This enhances its ability to understand and process information. In wind power prediction, each time point includes multiple features, and the correlations between these features may vary over time. The self-attention mechanism enables the model to learn these dynamic changes and assign different attention weights to each feature at each time point.
For each time point, the model generates a query vector
where
Wind power prediction entails complex patterns, such as seasonal fluctuations and short-term weather changes. The multi-head self-attention mechanism can capture multiple features in these complex patterns by computing attention independently across several subspaces. Each attention head focuses on a specific temporal feature or influencing factor of wind power, enabling a comprehensive understanding of the intricate relationships involved in wind power prediction.
Moreover, extreme weather events like storms or abnormal wind speeds can lead to significant fluctuations in wind power output. Although these extreme scenarios occur infrequently, they are crucial for predict accuracy. The self-attention mechanism improves predict precision by dynamically adjusting the model’s attention allocation during these critical events, focusing on relevant data.
Positional encoding is integrated into the input to retain positional information within the sequence. Positional encoding enables the model to differentiate between various positions in the sequence by introducing a unique encoding for each position. It typically comprises sine and cosine functions defined as follows:
where
The encoder consists of multiple identical layers stacked on top of each other, each comprising two primary components: the self-attention mechanism and a feed-forward neural network with a GELU activation function.
The multi-head self-attention mechanism is responsible for calculating the attention scores between the positions in the input sequence, splicing the outputs of multiple attention heads together, and performing a linear transformation to generate the final attention output:
where
The attention output
Subsequently, the output of the feedforward neural network (FNN) is obtained by passing through the second fully connected layer:
To enhance training stability and effectiveness, residual connections and layer normalization are implemented within the encoder layer. The input sequence
Then, the output of the feed-forward network is combined with the normalized output via a residual connection, followed by a second layer normalization to generate the final encoder layer output:
The decoder structure mirrors the encoder’s but incorporates an encoder-decoder attention mechanism [31]. This mechanism utilizes a multi-head attention layer to compute the relationships between the decoder’s attention scores at the current time step and the encoder output. The decoder’s self-attention output and the encoder-decoder attention output undergo residual connections and layer normalization.
The overall structure of the Transformer model is illustrated in Fig. 2.
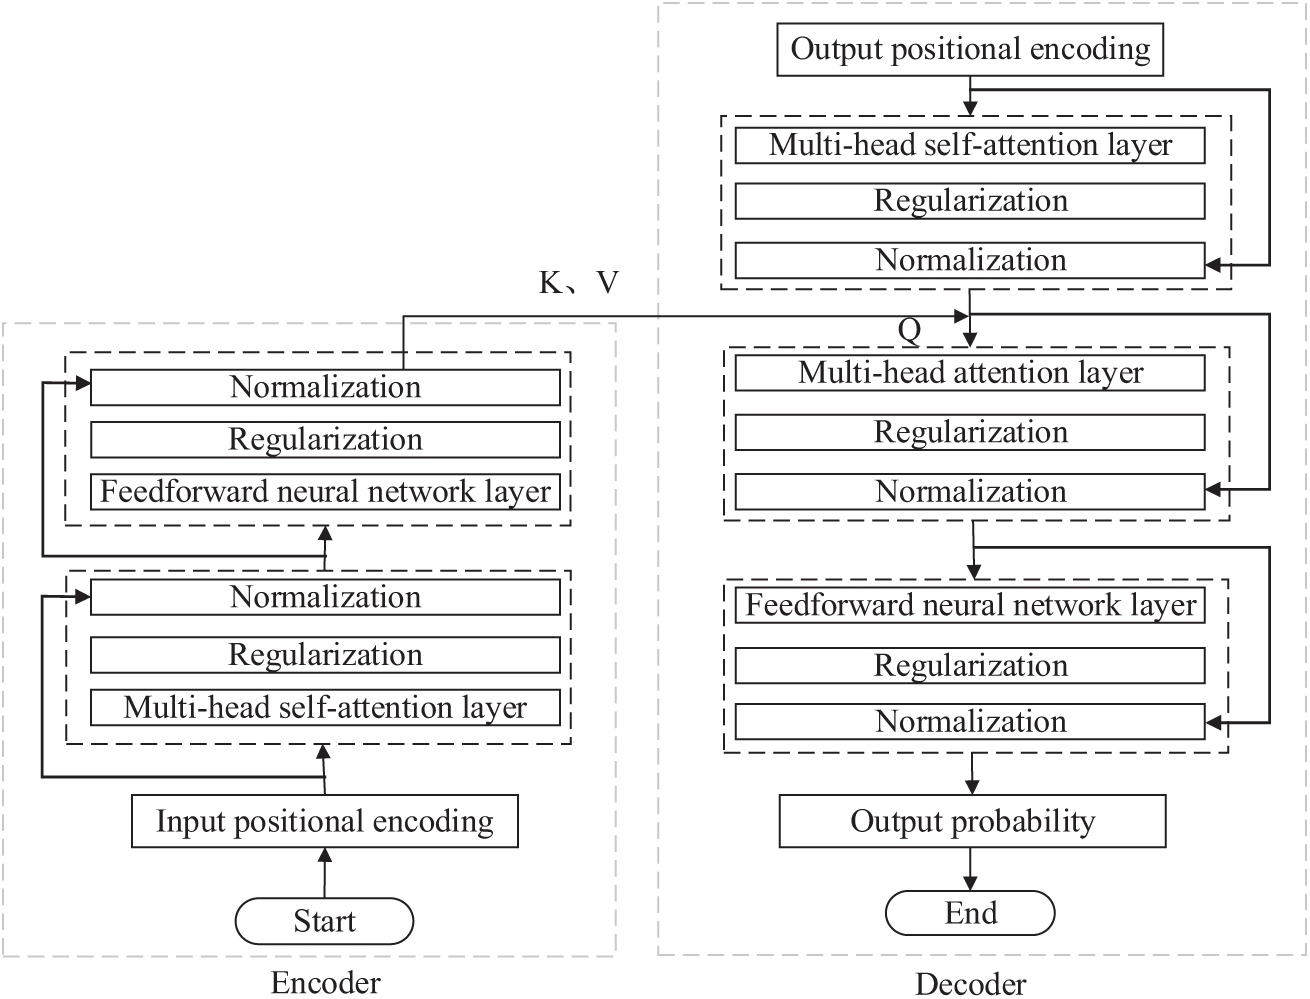
Figure 2: Structure diagram of Transformer
3 Proposed Wind Power Prediction Model for Extreme Scenarios Based on WTC-Transformer
The WTC-Transformer prediction process is outlined as follows:
Step 1: Define various conditions, such as low output, high output, steep rise, and plunge, and assign corresponding labels.
Step 2: Train the CGAN to iteratively generate data under defined conditions by having the generator produce samples that the discriminator cannot distinguish from real data.
Step 3: Specify training parameters, including learning rate, batch size, embedding dimension, hidden neurons, and attention heads.
Step 4: Apply a 1D wavelet transform, decompose it into low- and high-frequency components, and perform an inverse wavelet transform for signal reconstruction.
Step 5: Feed WTC-processed features into the Transformer’s encoder to extract and model key temporal patterns.
Step 6: Pass the encoder output to the decoder, using multi-head attention to evaluate interactions with the encoder’s output.
Step 7: Calculate loss and back-propagate to finalize the wind power prediction under extreme conditions.
This approach combines CGAN-based extreme scenario generation with the WTC-Transformer model, enabling robust wind power prediction in extreme scenarios and enhancing the model’s ability to capture complex temporal dependencies. The flow chart of the proposed prediction model is illustrated in Fig. 3.
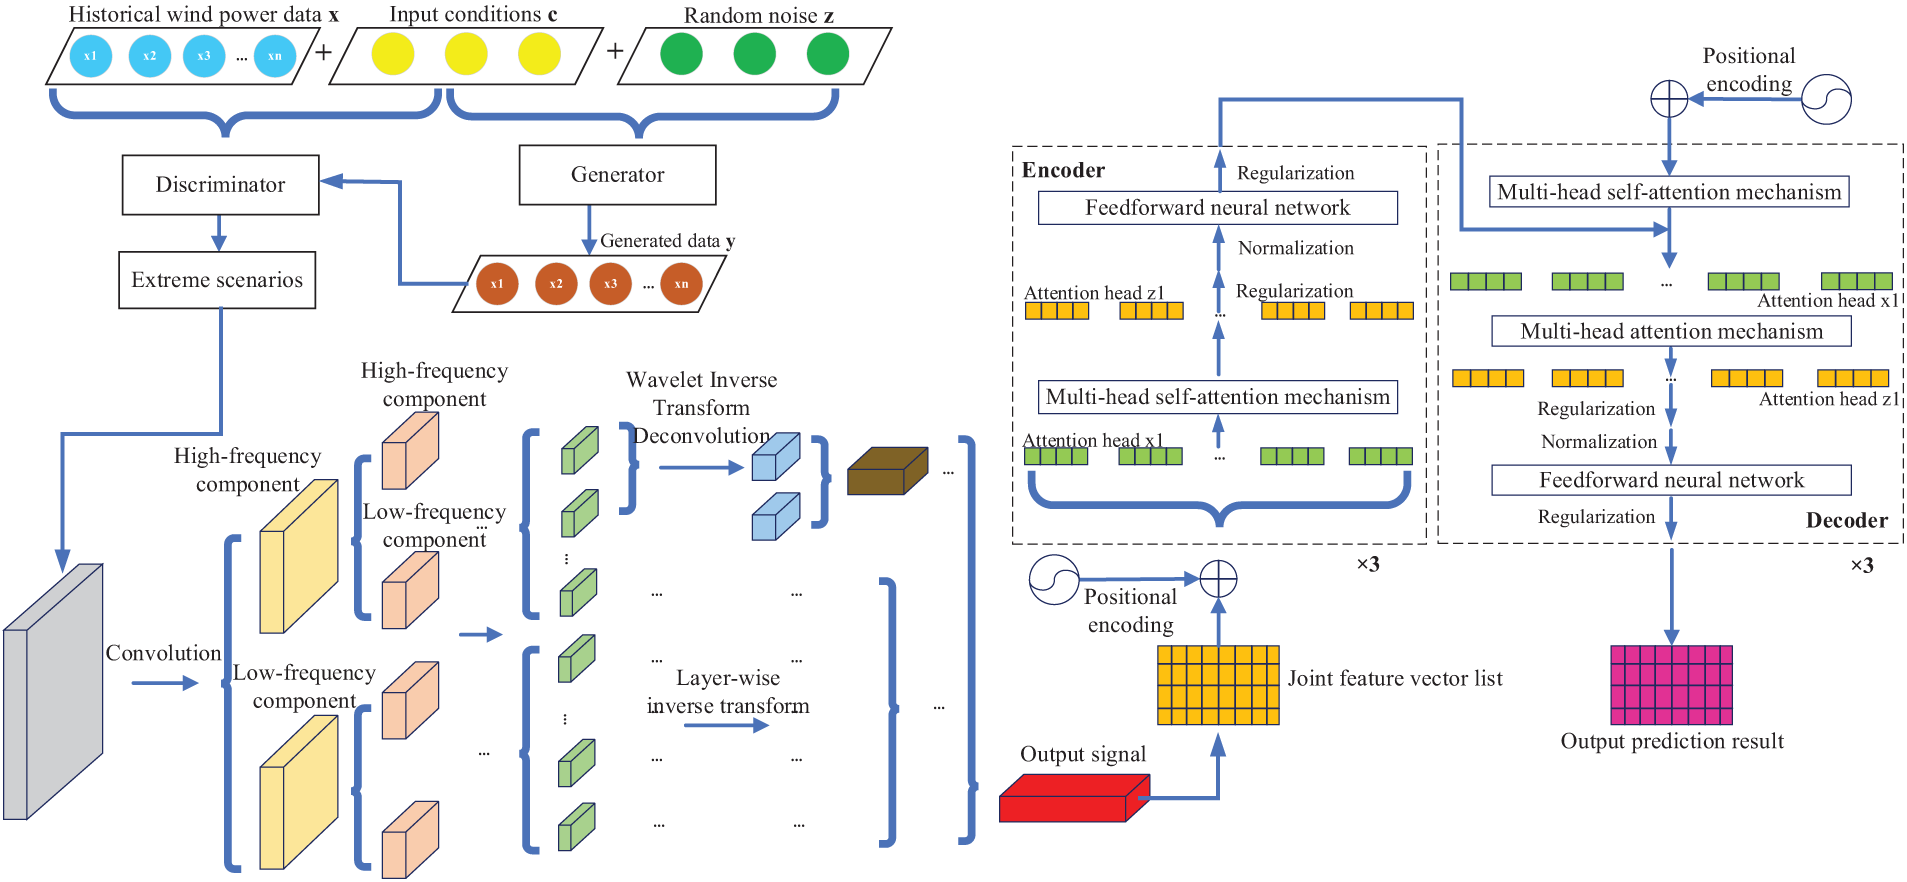
Figure 3: Flow chart of wind power prediction based on WTC-Transformer in extreme scenarios
Fig. 4 illustrates the overall process of this study. The input historical data undergoes preprocessing, including correlation analysis, normalization, and noise handling. The preprocessed data then moves on to extreme scenario generation and wind power prediction. Finally, the data goes through anti-normalization, producing the output prediction result.
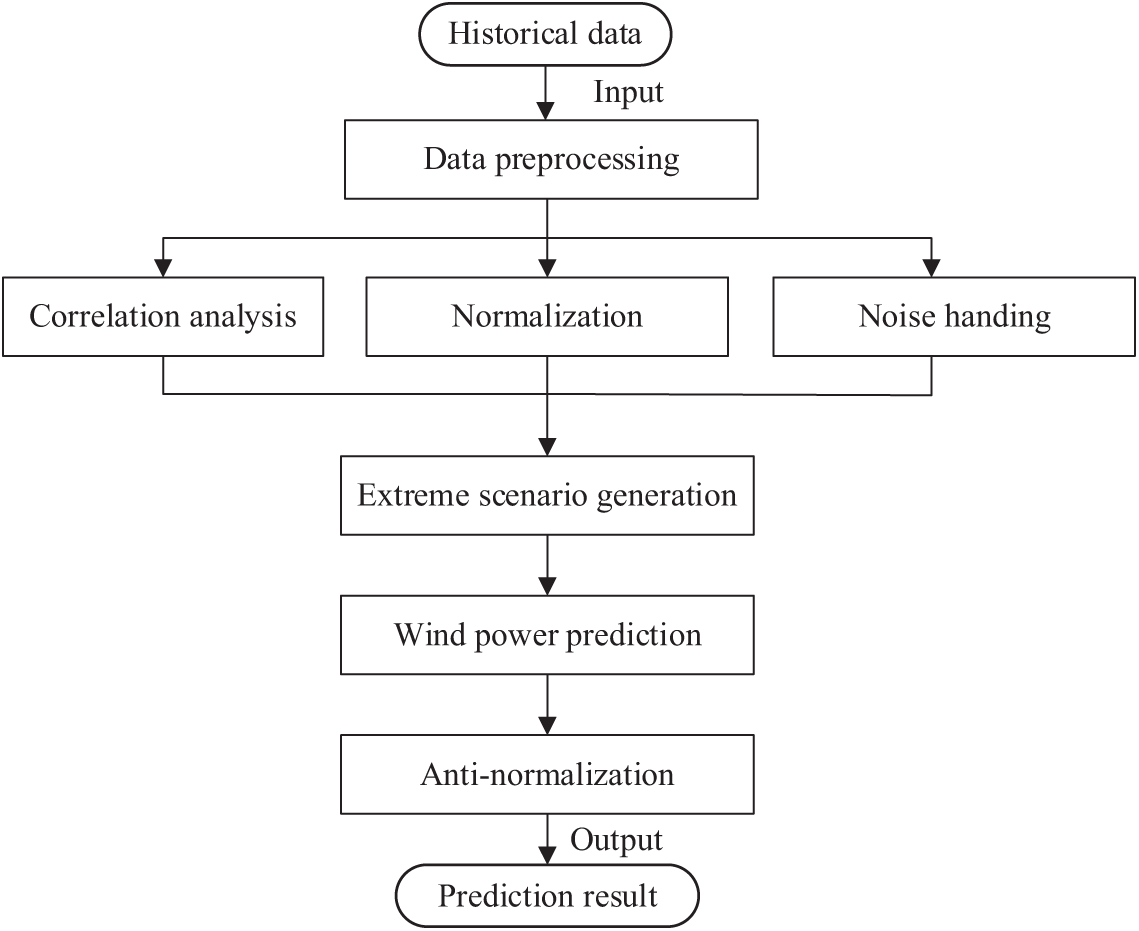
Figure 4: Overall flow chart of this paper
4.1 Introduction of Case Configuration
This study employs historical wind power generation data from the global energy forecasting competition 2014 (GEFCom2014), comprising records from ten Australian wind farms between 1 January 2012, and 1 December 2023. This dataset includes hourly wind speed measurements at both 10 and 100 m, alongside zonal and meridional wind components. It collects a total of 168,000 samples for modelling wind power prediction. The dataset consists of pre-normalized values, and all visualizations in this study are based on the available normalized data. All models are implemented in Pytorch 3.8 with CUDA 10.0 GPU acceleration.
Wind speed, wind direction, temperature and other meteorological factors directly affect the output power of the fan, which is very important for the analysis of wind farm power. Therefore, the correlation analysis of meteorological data and power data of wind farms can help to deeply understand the influence of meteorological factors on power output. In order to quantify this relationship, Pearson correlation coefficient is used to analyze the main meteorological variables and power data of wind farms. The calculation results based on Pearson correlation coefficient are shown in Table 1, where
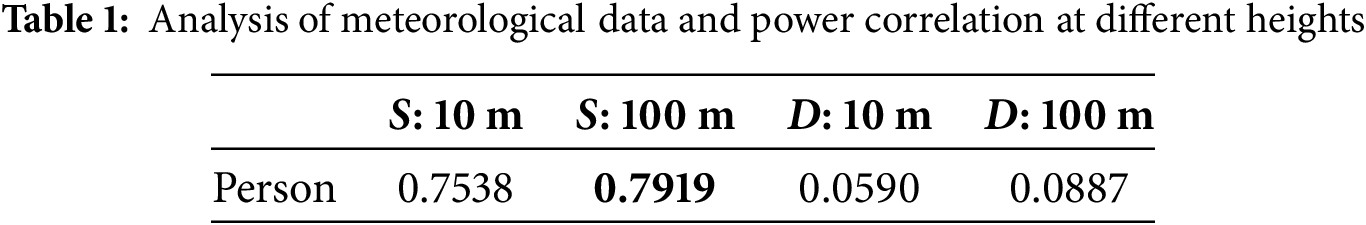
As can be seen from Table 1, Pearson correlation coefficient shows a positive correlation between meteorological data and wind power at the height of 10 and 100 m. In these data, the correlation between wind direction and power is weak, indicating that wind direction has little effect on power generation. The correlation between wind speed and power is strong. Among them, the wind speed at the height of 100 m has the strongest correlation with power, up to 0.79. Therefore, the study in this paper is based on wind speed at a height of 100 m.
To ensure the quality and consistency of the input data, the following preprocessing steps are applied.
(1) Data normalization
The wind power data and supplementary meteorological features are normalized to a [0, 1] range using Min-Max Normalization. This step standardizes feature scales, ensuring uniform contribution during model training and improving convergence. The normalization formula is as follows:
where
After the prediction is complete, the original data output is restored from the normalized values. Reverse normalization is performed using the following formula:
This process ensures that the model’s output corresponds to the original scale of the data.
(2) Noise handling
During the operation of wind farms, the collected meteorological and power data may be subject to various factors that lead to the presence of outliers and noise. These anomalous data points can significantly impact the monitoring of wind farm operations, as well as the accuracy of power prediction and subsequent data analysis. To effectively identify and handle these outliers, this study employs density-based spatial clustering of applications with noise (DBSCAN). DBSCAN automatically identifies noise points and distinguishes them from the normal data. The results are shown in Fig. 5, where blue points represent normal data, and red points indicate the noise points identified as outliers. By addressing these noise points, the data quality can be improved, thereby providing more accurate data support for subsequent power prediction and optimization.
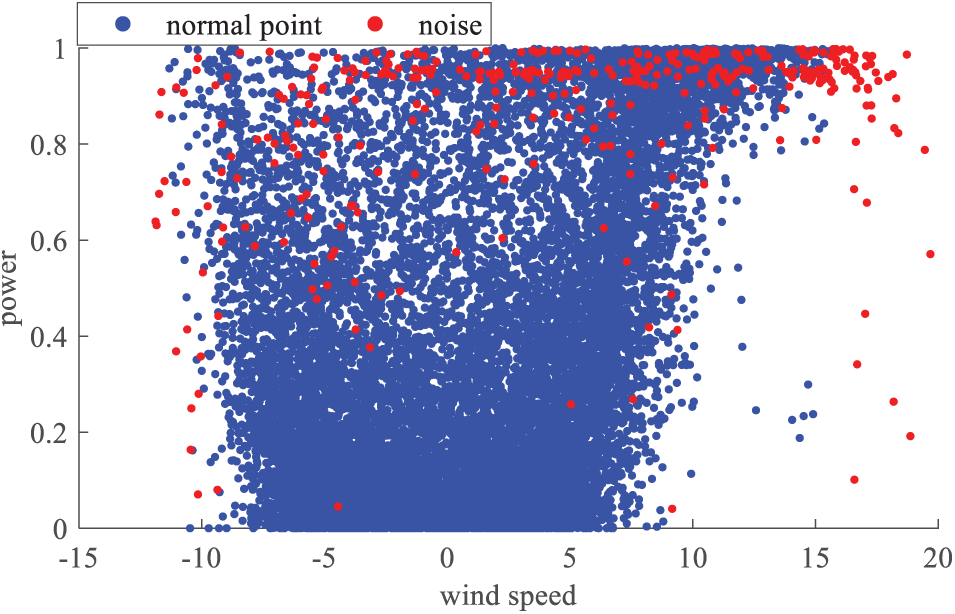
Figure 5: Profile of noise
(3) Parameter setting
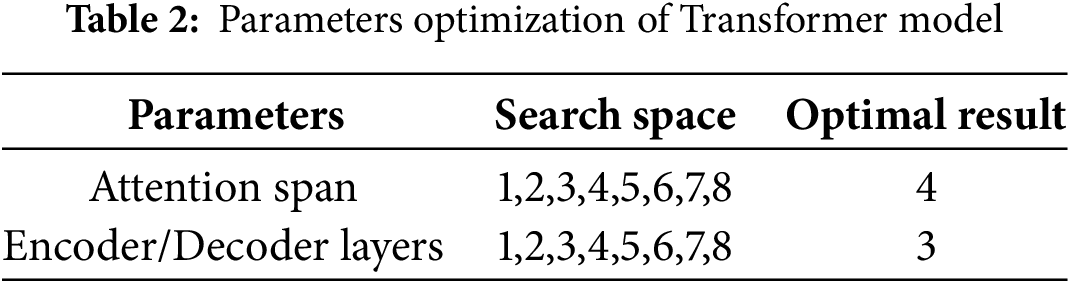
In Transformer, the number of multi-head attention mechanisms and the number of layers of encoder and decoder are key indicators that affect the prediction accuracy. Parameter optimization is carried out through grid search, and the initial value is set to 1, and the maximum value is set to 8, increasing successively. When the number of multi-head attention mechanism is 4 and the number of encoder and decoder layers is 3, the best prediction accuracy is obtained. The optimization results are shown in Table 2.
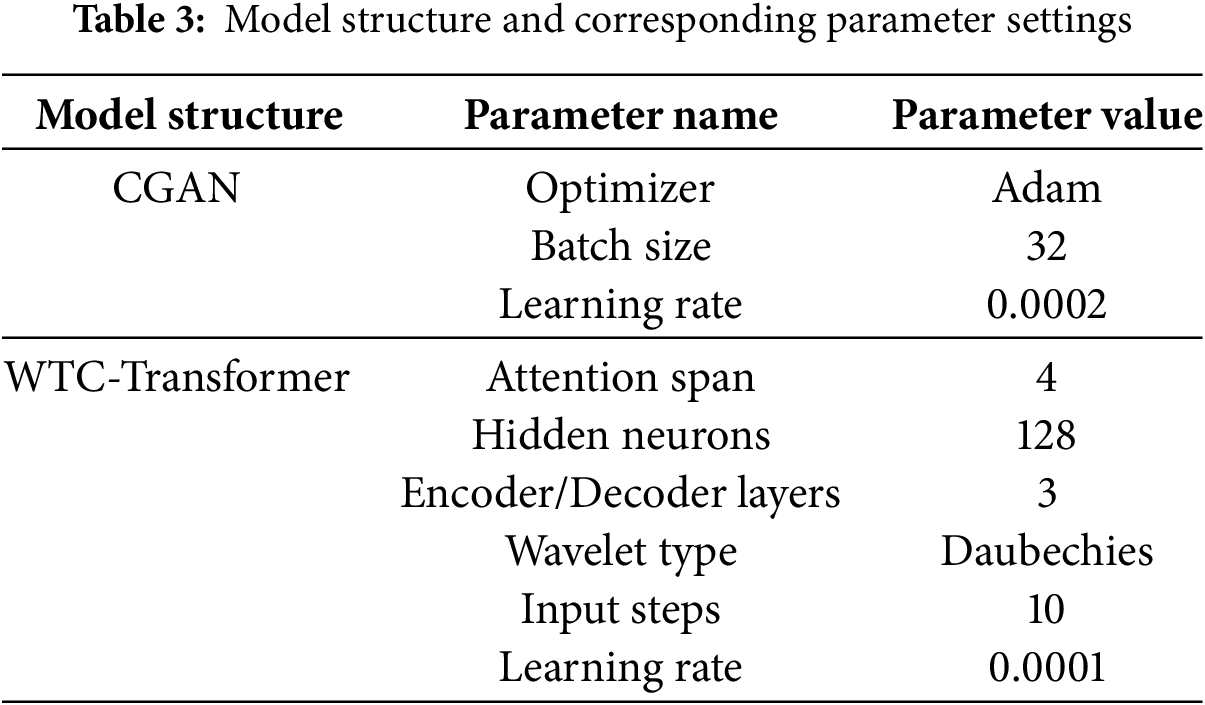
Add an early stop mechanism during training. To prevent overfitting of the model, set the maximum number of iterations to 50. If the loss rises four consecutive times, the training is stopped early. The primary model parameters are outlined in Table 3.
4.2 Extreme Scenarios Generation
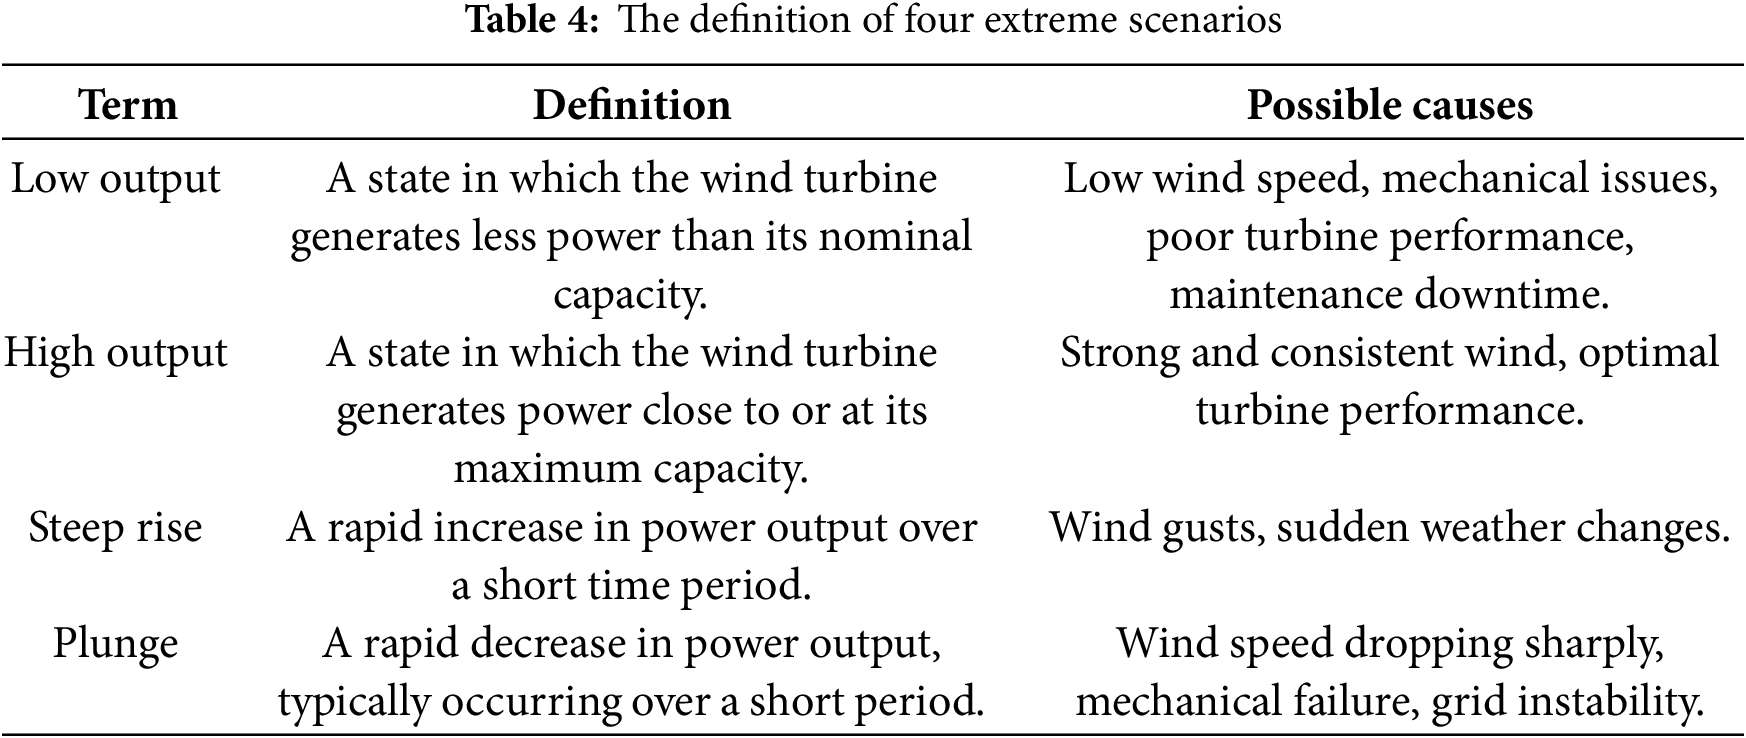
The CGAN model generates extreme wind power scenarios. It uses a discriminator composed of multiple fully connected layers with ReLU activation to distinguish real from synthetic data. The generator utilizes fully connected layers with ReLU activation to convert input noise and conditioning factors into simulated wind power scenarios. Binary cross-entropy loss measures both generator and discriminator losses. Fig. 6 illustrates four generated scenarios: high output, low output, steep rise, and sharp decline, representing diverse extreme patterns in wind power. Table 4 is a complement to Fig. 4, clearly giving the definitions of low output, high force, plunge and steep rise, and the possible causes.
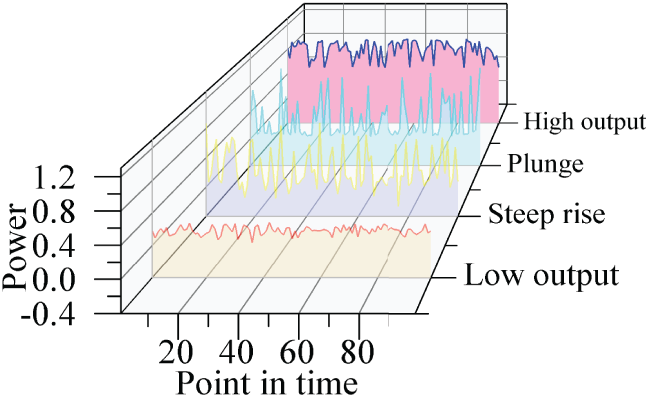
Figure 6: Diagram of extreme scenarios generation
4.3 Comprehensive Evaluation Metrics and Downscaling Analyses
The generated data undergoes a 7:2:1 split for training, validation, and testing. Each feature is normalized to a [0, 1] range. The WTC-Transformer model then processes the normalized input, leveraging WTC with self-attention via the Transformer. Results are evaluated using quantitative metrics and visualization, comparing the WTC-Transformer with LSTM and Transformer model.
(1) Comparison of similarity score and prediction efficiency
Various similarity metrics evaluate the correlation between generated and actual data, including mean absolute error (MAE), root mean square error (RMSE), and R-squared (R2). They are suggested by various studies [30,32]. RMSE is a widely used metric that measures the square root of the average squared differences between predicted and actual values. It reflects the degree to which the predicted value deviates from the actual value. MAE measures the average magnitude of the errors in a set of prediction, without considering their direction. R2 represents the proportion of the variance in the dependent variable that is predictable from the independent variables. Its value ranges from 0 to 1. The closer R2 is to 1, the better the fit between the predicted results and the actual data. The specific calculation formula is as follows:
where
The results are summarized in Table 5.
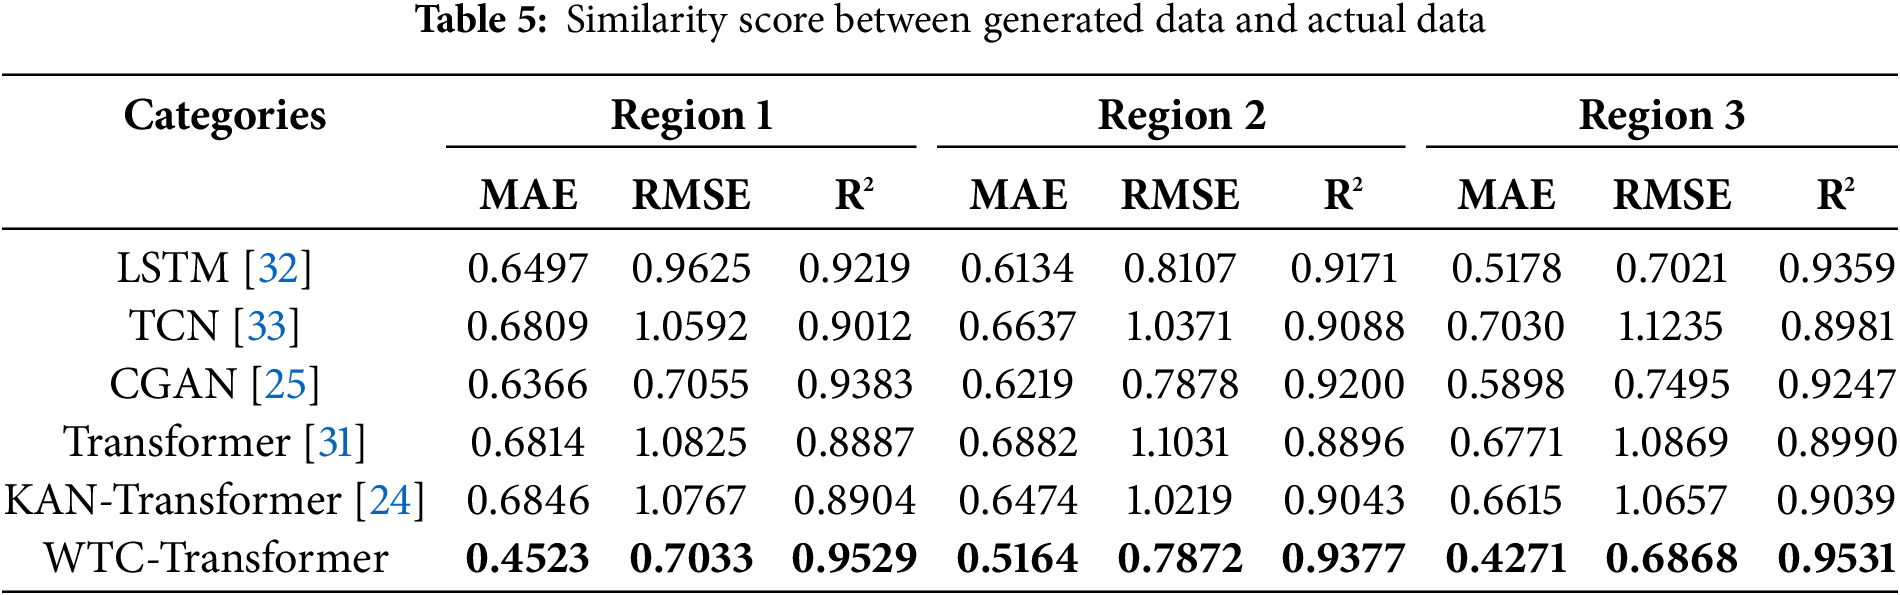
As can be seen from Table 5, compared to the benchmark model Transformer, WTC-Transformer increased R2 by 7.22% in region 1. MAE decreased by 36.92% and RMSE decreased by 36.81% in region 3.
The confidence intervals of MAE, RMSE and R² for region 1 at 95% confidence level are [0.4668, 0.4923], [0.7273, 0.8018] and [0.9459, 0.9530], respectively. These intervals demonstrate the statistical stability of the model’s performance in multiple random samples, providing a more reliable assessment.
The Diebold-Mariano test is conducted to compare the predictive performance of the Transformer and WTC-Transformer models. The test yields a DM value of 1.8843 and a p-value of 0.1326, which is greater than the conventional significance level of 0.05. The results indicate that the WTC-Transformer aligns more closely with the original data compared to the standard Transformer model. This highlights its superior performance and potential for enhanced accuracy in predictive tasks.
As shown in Table 5, compared with Transformer, KAN improves prediction accuracy to some extent. It excels at capturing complex, nonlinear relationships in time-series data, making it effective for tasks that involve structured, deterministic patterns, CGAN, with its generative adversarial framework, is better suited for handling the inherent uncertainty in data. It is particularly adept at modelling extreme conditions and data with high variability. Compared with KAN, CGAN performs better. However, among various models, the WTC-Transformer consistently outperforms models like LSTM, TCN, and KAN in predicting wind power. It excels in reducing MAE and RMSE, highlighting its ability to minimize errors relative to actual observations. Its high R² values indicate robust explanatory power, effectively capturing data variability and providing insight into underlying patterns. The WTC-Transformer demonstrates substantial advantages in generating accurate data, reducing errors, and effectively capturing data variability. Wind power data have significant multi-scale characteristics, such as periodic changes and sudden changes in wind speed. Wavelet transform can effectively decompose signals on multiple frequency scales, so as to better capture complex wave patterns in wind power data. By incorporating wavelet transform into the Transformer, the model achieves high accuracy in capturing both short-term fluctuations and long-term trends. This significantly enhances the overall prediction performance.
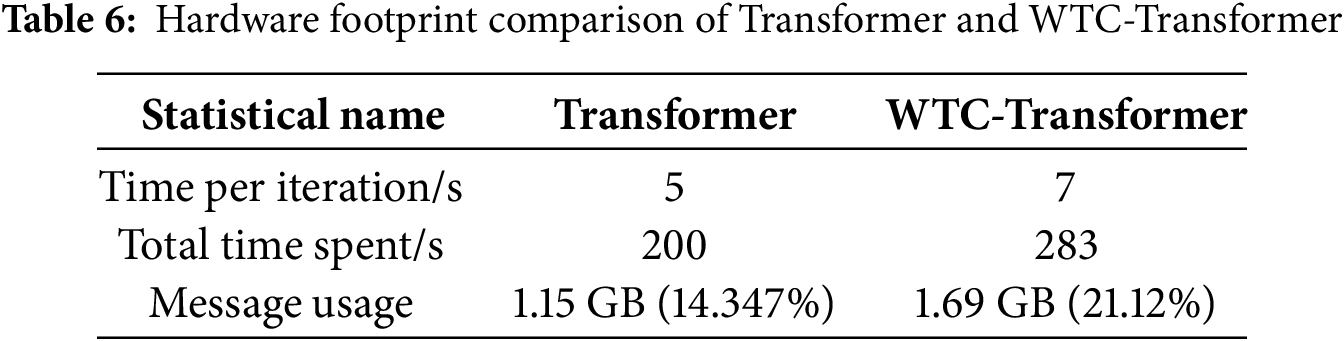
The WTC-Transformer model proposed in this paper is improved on the basis of Transformer. As can be seen from Table 6, there is little difference in training duration between the two. Because WTC-Transformer introduces a wavelet transform module in the model architecture, its single iteration time is slightly higher than Transformer. In addition, WTC-Transformer has a memory footprint of 1.69 GB, which is about 0.5 GB higher than Transformer. This increase in memory usage is mainly attributed to the additional parameters introduced by the wavelet transform and the need for computational storage. To sum up, WTC-Transformer sacrifices a certain amount of computational efficiency in exchange for higher prediction accuracy. This provides powerful modelling capabilities for wind power prediction.
(2) Error analysis
The prediction performance of the WTC-Transformer model compared to the Transformer model under various extreme wind power scenarios is presented in Fig. 7. The figure is divided into four subplots, each representing a specific extreme scenario: (a) Low output, (b) High output, (c) Plunge, and (d) Steep rise. The left panels in each subplot show the predicted values vs. the real wind power values over time, alongside the prediction errors. The blue solid lines represent the real wind power values, while the red dashed lines represent the predicted values. The error plots highlight the deviation between the predicted and real values, offering insight into the model’s accuracy over different time points. The right panels show boxplots comparing the distribution of predicted values (blue) and real values (red) for both the WTC-Transformer and Transformer models. These boxplots illustrate the range, interquartile spread, and outliers in the prediction values, which provides a statistical perspective on the models’ performance. The WTC-Transformer demonstrates a smaller error magnitude and better alignment with the real values compared to the Transformer model. It shows less variation and fewer extreme outliers, especially in capturing sudden changes and extreme values. Fig. 8 presents the boxplot of prediction errors under different wind power scenarios. The boxplots illustrate the distribution, variability, and potential outliers in the prediction errors across these scenarios.
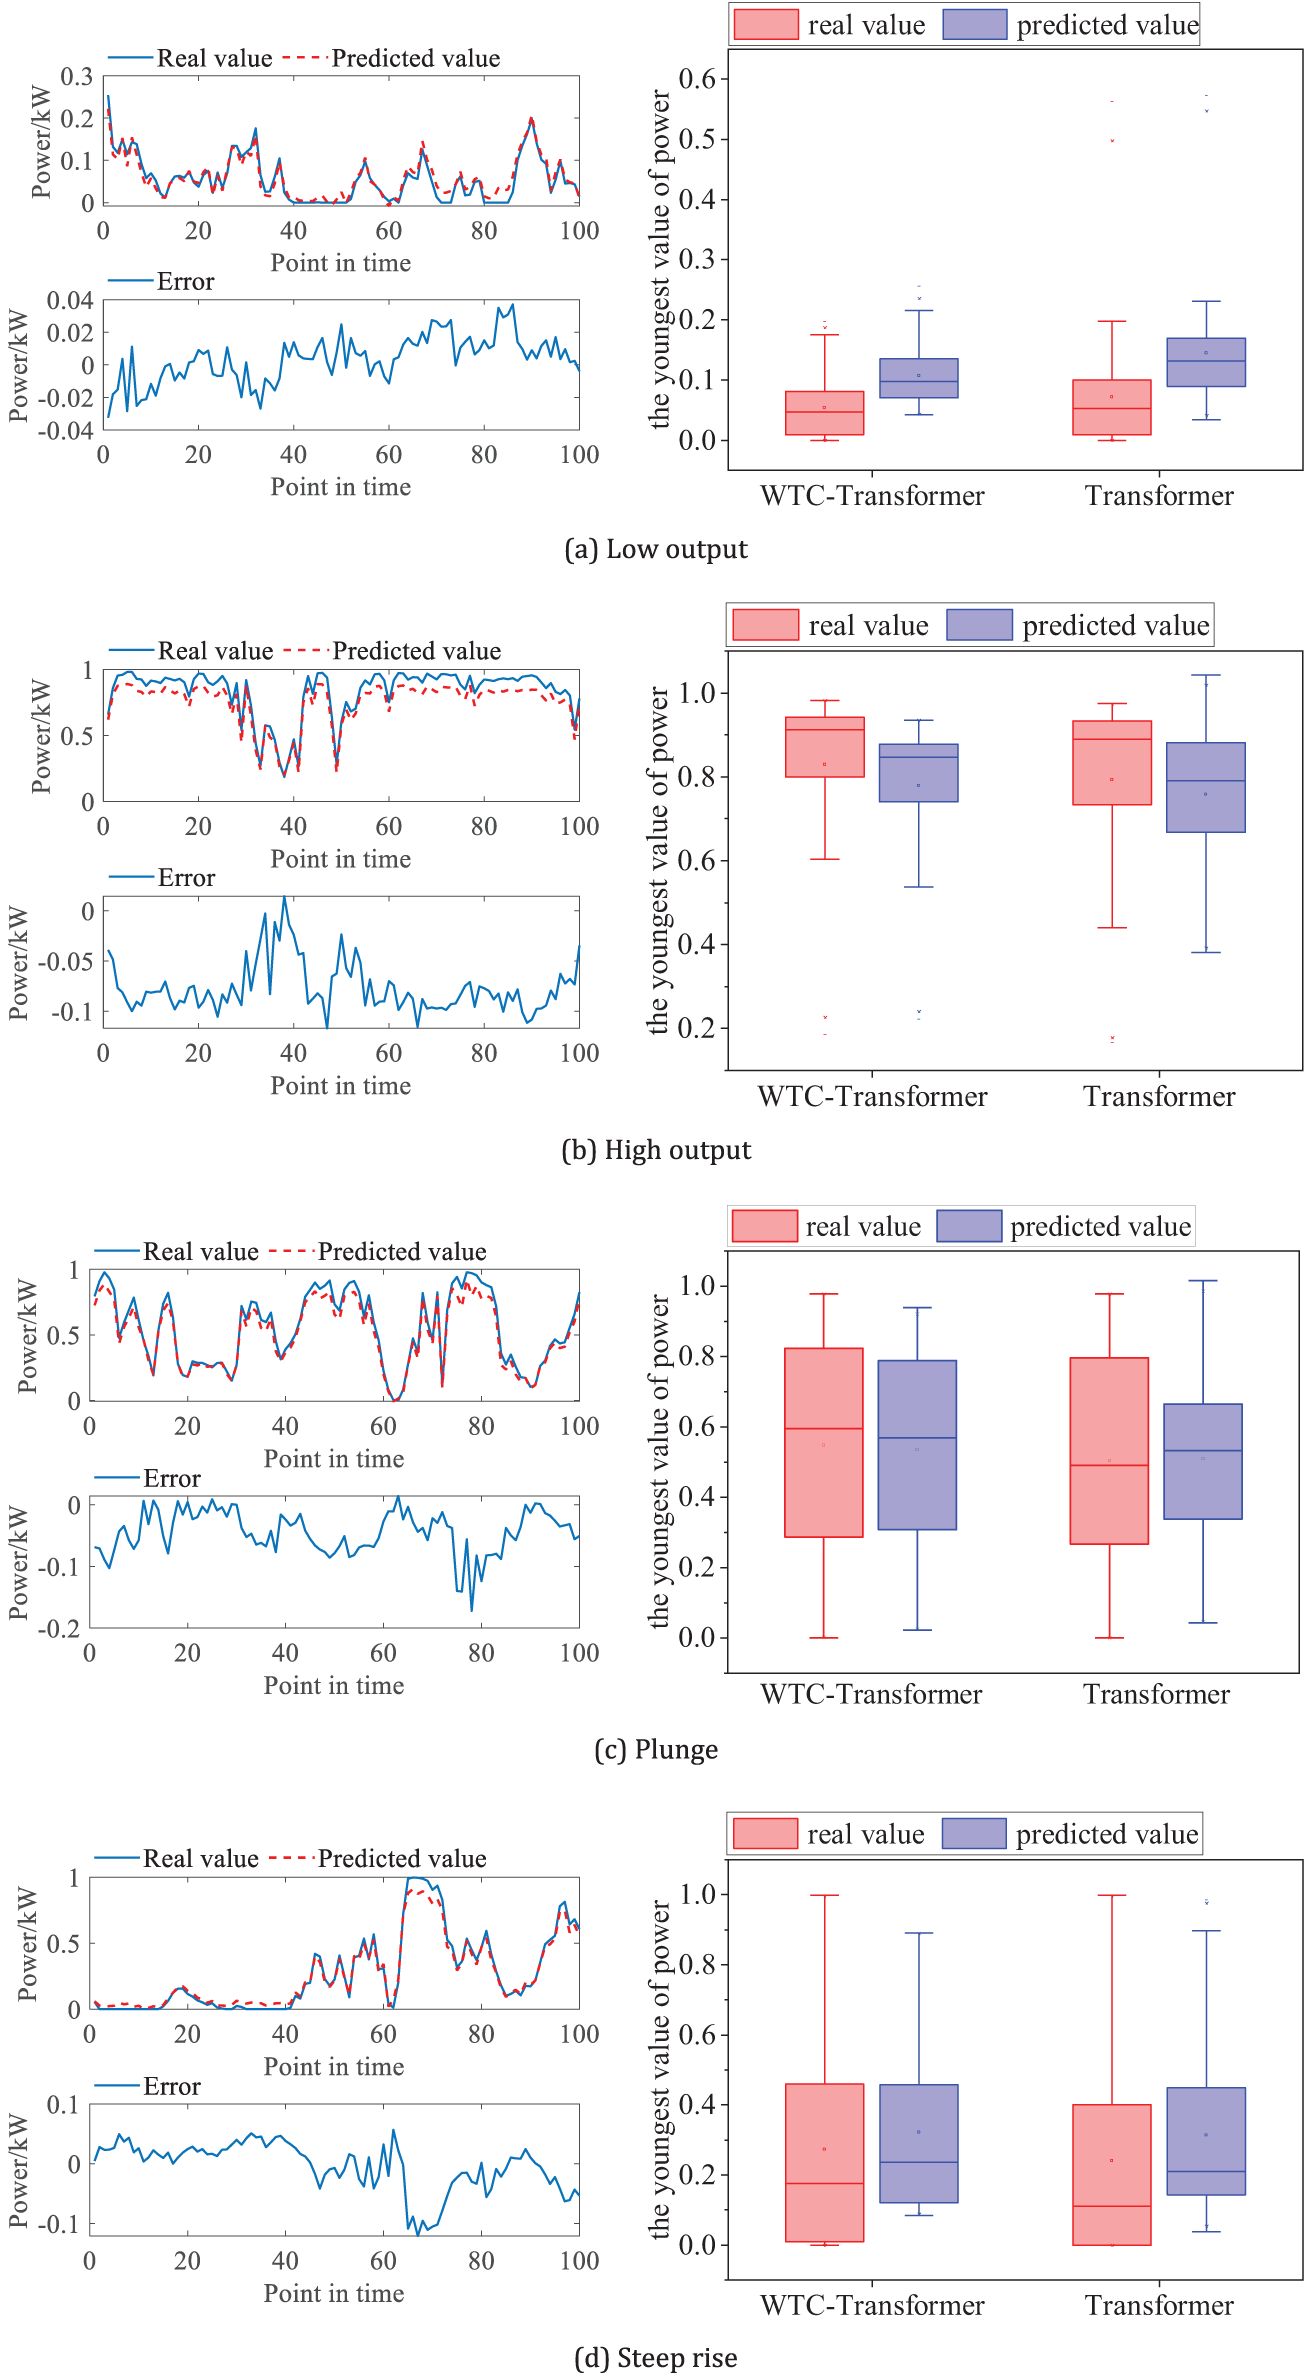
Figure 7: Distribution map of extreme scenarios error
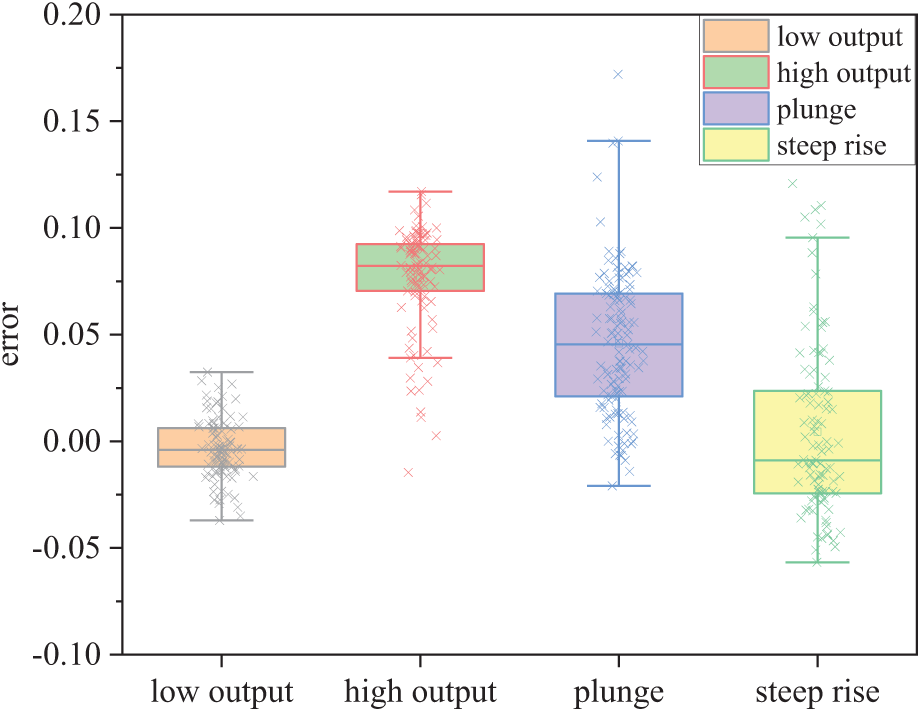
Figure 8: Boxplots of the prediction errors
The model can capture the actual value’s trend in the low output scenario, with error fluctuations remaining below 0.04. The interquartile range is narrow, and there are few outliers, indicating stable and accurate predictions. Compared to the Transformer model, the prediction from this paper is closer to the central part of the actual data, indicating higher prediction accuracy and stable performance in handling low fluctuations and smooth outputs.
In high-output scenarios, the predicted values exhibit significant convergence, with results more closely distributed. However, the prediction error in high-output scenarios is greater than in low-output scenarios. This difference is attributed to the wavelet transform’s longer time window for analysing low-frequency signals, effectively capturing smooth changes and long-term trends. For high-frequency signals, the model more accurately identifies signal mutations, aligning with wind power characteristics, where the low-frequency component contains primary features and global information. Conversely, the high-frequency component reveals local transformations and detailed information. In the plunge and steep rise scenarios, the model successfully identifies overall trends but shows greater deviations at critical transition points. The largest variability is observed in plunge, with a wide error range and numerous outliers. This is mainly due to the fact that the prediction model is affected by recent trends. The sudden change in wind power at a critical turning point is a sharp departure from previous trends. As a result, model lags in adapting to these rapid changes. In addition, critical turning points represent rare events compared to more frequent incremental changes in the data set. The model may be trained less on these scenarios, leading to higher prediction errors.
Overall, the model performs well in stable scenarios but exhibits limitations when handling extreme fluctuations. Enhancing model robustness in volatile scenarios may require incorporating additional fluctuation-related features or adopting more complex model architectures.
(3) PCA as well as t-SNE downscaling visualization
Principal component analysis (PCA) and t-distributed stochastic neighbor embedding (t-SNE) dimensionality reduction techniques are applied to visually compare the generated and actual data. Those comparison results are shown in Fig. 9.
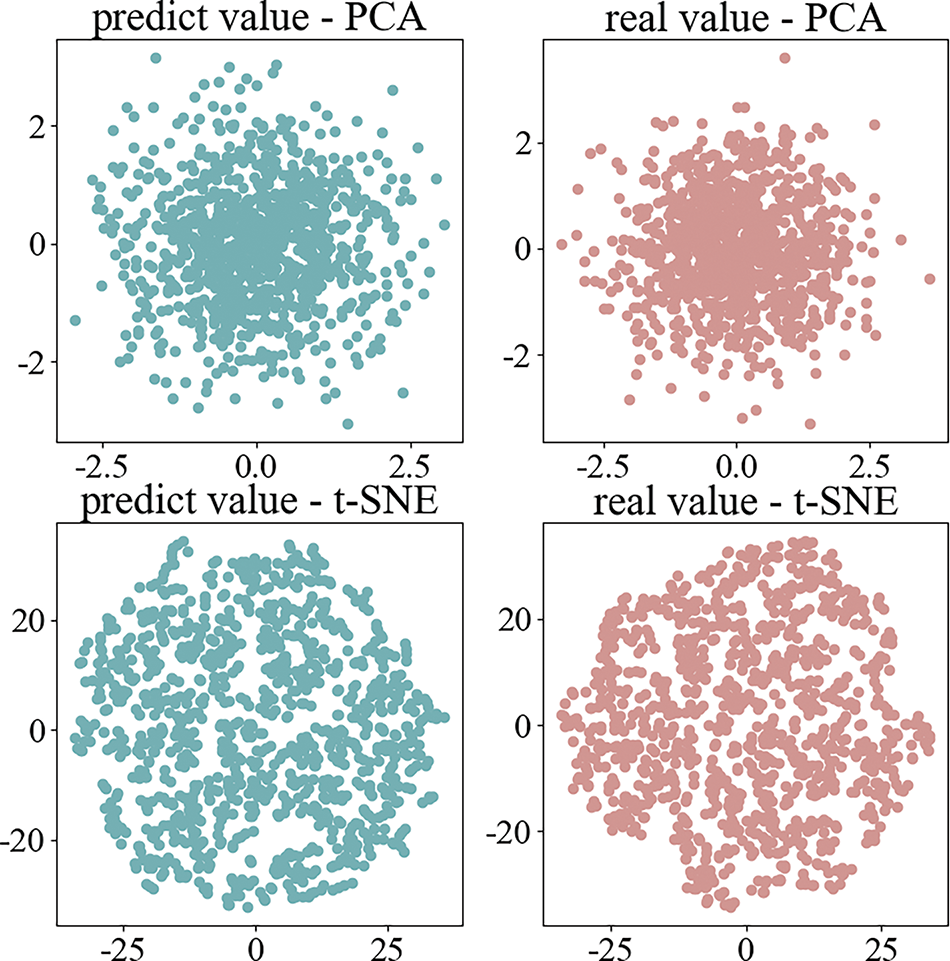
Figure 9: PCA and t-SNE dimensionality reduction visualization
Fig. 8 demonstrates that the distribution of data points generated by the WTC-Transformer closely aligns with that of actual data points in PCA space, indicating that the model effectively preserves the primary variability of the data during generation. This close resemblance highlights the model’s ability to capture essential structural and pattern-based characteristics in the reduced space. Furthermore, the similarity observed between WTC-Transformer-generated data points and actual data points in t-SNE space reveals that the model maintains local structural features even in nonlinear dimensionality reduction, enabling the generated data to reflect a high degree of consistency with actual data during high- to low-dimensional mapping. This alignment further confirms the WTC-Transformer model’s robustness in data generation and underscores its advantages in producing high-quality synthetic data.
The findings of this research have important implications for renewable energy systems and policies. Policymakers should use advanced predictive models in energy management. These models optimize renewable resource use and ensure grid stability. Governments can invest in them to improve prediction accuracy. This enables better planning and reduces reliance on fossil fuels. Collaboration among researchers, data scientists, and policymakers is essential. It ensures the prediction is practical and actionable. Researchers should refine these models by integrating multimodal data. Improving interpretability will support transparent and informed decisions.
A novel wind power prediction model based on learning approach was proposed in this study, which combined wavelet transform with Transformer to address the challenge of large prediction errors in extreme scenarios. In the paper the WTC was applied for multi-scale feature extraction and Transformer was combined to enhance sequence modelling. This model achieved high accuracy of wind power prediction, particularly in extreme scenarios where prediction deviations are typically substantial. The model’s multi-scale feature learning capabilities effectively captured both short-term wind speed fluctuations and long-term climate trends. Furthermore, it extracted global trends and local details, greatly improving existing models.
The findings underscore the model’s effectiveness in wind power prediction under extreme conditions, offering significant accuracy gains through its unique combination of wavelet transform and self-attention mechanisms. This multi-scale feature extraction approach has provided the model with an enhanced ability to learn diverse features across temporal scales, suggesting valuable implications for more reliable wind power prediction frameworks in high-variability conditions.
Furthermore, deep learning relies heavily on large amounts of training data. When datasets are limited or lack diversity, the model’s generalization ability weakens. This highlights the need to improve robustness in small-sample scenarios. Future efforts could focus on transfer learning, advanced data augmentation, or hybrid methods. Integrating domain-specific knowledge can also enhance performance under data-scarce conditions.
Acknowledgement: The authors sincerely thank the support of Science and Technology Project of State Grid Corporation of China, they also thank the anonymous reviewers and journal editors for their valuable comments, which significantly improved this paper.
Funding Statement: This work was funded by the Science and Technology Project of State Grid Corporation of China under Grant No. 5108-202218280A-2-299-XG.
Author Contributions: The authors confirm contribution to the paper as follows: study conception and design: Jifeng Liang; data collection: Qiang Wang; analysis and interpretation of results: Leibao Wang, Ziwei Zhang; draft manuscript preparation: Jifeng Liang, Ziwei Zhang; supervision: Yonghui Sun, Hongzhu Tao, Xiaofei Li. All authors reviewed the results and approved the final version of the manuscript.
Availability of Data and Materials: The authors confirm that the data supporting the findings of this study are available within probabilistic energy forecasting: Global Energy Forecasting Competition 2014 and beyond and its supplementary materials. https://www.sciencedirect.com/science/article/pii/S0169207016000133 (accessed on 28 February 2025).
Ethics Approval: Not applicable.
Conflicts of Interest: The authors declare no conflicts of interest to report regarding the present study.
Nomenclature
| GANs | Generative Adversarial Networks |
| CGAN | Conditional Generative Adversarial Network |
| WTC | Wavelet Transform Convolution |
| LSTM | Long Short-Term Memory |
| VAE | Variational Autoencoder |
| CNN | Convolutional Neural Network |
| BiLSTM | Bidirectional Long Short-Term Memory |
| PV | Photovoltaic |
| MLP | Multilayer Perceptron |
| KAN | Kolmogorov-Arnold Network |
| FNN | Feedforward Neural Network |
| DBSCAN | Density-Based Spatial Clustering of Applications with Noise |
| MAE | Mean Absolute Error |
| RMSE | Root Mean Square Error |
| R² | R-squared |
| TCN | Temporal Convolutional Network |
| PCA | Principal Component Analysis |
| t-SNE | t-Distributed Stochastic Neighbor Embedding |
References
1. Gao J, Ji M, Wang H, Du Z. Research on the IL-Bagging-DHKELM short-term wind power prediction algorithm based on error AP clustering analysis. Comput Mater Contin. 2024;79(3):5017–30. doi:10.32604/cmc.2024.050158. [Google Scholar] [CrossRef]
2. Feng Z, Huang Q, Niu W, Yang T, Wang J, Wen S. Multi-step-ahead solar output time series prediction with gate recurrent unit neural network using data decomposition and cooperation search algorithm. Energy. 2022;261:125217. doi:10.1016/j.energy.2022.125217. [Google Scholar] [CrossRef]
3. An G, Jiang Z, Cao X, Liang Y, Zhao Y, Li Z. Short-term wind power prediction based on particle swarm optimization-extreme learning machine model combined with adaboost algorithm. IEEE Access. 2021;9:94040–52. doi:10.1109/ACCESS.2021.3093646. [Google Scholar] [CrossRef]
4. Ozbak M, Ghazizadeh-Ahsaee M, Ahrari M, Jahantigh M, Mirshekar S, Mirmozaffari M. Improving power output wind turbine in micro-grids assisted virtual wind speed prediction. Sustain Operat Comput. 2024;5(9):119–30. doi:10.1016/j.susoc.2024.06.004. [Google Scholar] [CrossRef]
5. Medina SV, Ajenjo UP. Performance improvement of artificial neural network model in short-term forecasting of wind farm power output. J Mod Power Syst Clean Energy. 2020;8(3):484–90. doi:10.35833/MPCE.2018.000792. [Google Scholar] [CrossRef]
6. Wu Z, Sun B, Feng Q, Wang Z, Pan J. Physics-informed AI surrogates for day-ahead wind power probabilistic forecasting with incomplete data for smart grid in smart cities. Comput Model Eng Sci. 2023;137(1):527–54. doi:10.32604/cmes.2023.027124. [Google Scholar] [CrossRef]
7. Lara JD, Dowson O, Doubleday K, Hodge B, Callaway DS. A multi-stage stochastic risk assessment with markovian representation of renewable power. IEEE Trans Sustain Energy. 2022;13(1):414–26. doi:10.1109/TSTE.2021.3114615. [Google Scholar] [CrossRef]
8. Tu Q, Miao S, Yao F, Li Y, Yin H, Han J. Forecasting scenario generation for multiple wind farms considering time-series characteristics and spatial-temporal correlation. J Mod Power Syst Clean Energy. 2021;9(4):837–48. doi:10.35833/MPCE.2020.000935. [Google Scholar] [CrossRef]
9. Li Y, Jones B. The use of extreme value theory for forecasting long-term substation maximum electricity demand. IEEE Trans Power Syst. 2020;35(1):128–39. doi:10.1109/TPWRS.2019.2930113. [Google Scholar] [CrossRef]
10. Wan C, Cao Z, Lee WJ, Song Y, Ju P. An adaptive ensemble data driven approach for nonparametric probabilistic forecasting of electricity load. IEEE Trans Smart Grid. 2021;12(6):5396–408. doi:10.1109/TSG.2021.3101672. [Google Scholar] [CrossRef]
11. Mi Y, Lu C, Shen J, Yang X, Ge L. Wind power extreme scenario generation based on conditional generative adversarial network. High Voltage Eng. 2023;49:2253–63. (In Chinese). doi:10.13336/j.1003-6520.hve.20230459. [Google Scholar] [CrossRef]
12. Cramer E, Gorjão LR, Mitsos A, Schäfer B, Witthaut D, Dahmen M. Validation methods for energy time series scenarios from deep generative models. IEEE Access. 2022;10(2):8194–207. doi:10.1109/ACCESS.2022.3141875. [Google Scholar] [CrossRef]
13. Yang Z, Yang J, Wang K, Li Y, Liu J, Zhang S. A stochastic scenario generation method based on denoising diffusion probabilistic models for integrated hydro-PV power system. Automat Elect Pow Syst. 2024;48:171–80. (In Chinese). [Google Scholar]
14. Lyu Y, Li L, Sun L, Luo Y, Chen S. Typical source-load temporal scenario generation method based on modification of sampling probability interval. Automat Elect Pow Syst. 2024;48:141–50. (In Chinese). [Google Scholar]
15. Wang X, Li Y, Dong X, Wang H, Sun Y. Multi-source-load scenario generation of active distribution network based on variational autoencoder. Pow Syst Technol. 2021;45(8):2962–9. doi:10.13335/j.1000-3673.pst.2020.0903. [Google Scholar] [CrossRef]
16. Ye L, Peng Y, Li Y, Li Z. A novel informer-time-series generative adversarial networks for day-ahead scenario generation of wind power. Appl Energy. 2024;364(2):123182. doi:10.1016/j.apenergy.2024.123182. [Google Scholar] [CrossRef]
17. Liu Y, Wang J. Transfer learning based multi-layer extreme learning machine for probabilistic wind power forecasting. Appl Energy. 2022;312(24):118729. doi:10.1016/j.apenergy.2022.118729. [Google Scholar] [CrossRef]
18. Yousuf M, Al-Bahadly I, Avci E. Statistical wind speed forecasting models for small sample datasets: problems, improvements, and prospects. Energy Convers Manag. 2022;261(9):115658. doi:10.1016/j.enconman.2022.115658. [Google Scholar] [CrossRef]
19. Guo H, Li Y, Chen L, Wang Z, Ma Q, Liu Y. An improved generative adversarial network for extreme scenarios generation. In: IEEE Conference on Energy Internet and Energy System Integration; 2023; Hangzhou, China. p. 1472–7. [Google Scholar]
20. Wang S, Sun Y, Zhang W, Chung CY, Srinivasan D. Very short-term wind power forecasting considering static data: an improved transformer model. Energy. 2024;312(5):133577. doi:10.1016/j.energy.2024.133577. [Google Scholar] [CrossRef]
21. Harrou F, Dairi A, Dorbane A, Sun Y. Enhancing wind power prediction with self-attentive variational autoencoders: a comparative study. Res Eng. 2024;23(18):102504. doi:10.1016/j.rineng.2024.102504. [Google Scholar] [CrossRef]
22. Lee J, Wang W, Harrou F, Sun Y. Wind power prediction using ensemble learning-based models. IEEE Access. 2020;8:61517–27. doi:10.1109/ACCESS.2020.2983234. [Google Scholar] [CrossRef]
23. Wang H, Li G, Wang G, Peng J, Jiang H, Liu Y. Deep learning based ensemble approach for probabilistic wind power forecasting. Appl Energy. 2017;188(6):56–70. doi:10.1016/j.apenergy.2016.11.111. [Google Scholar] [CrossRef]
24. Mubarak AS, Ameena ZS, Mati S, Lasisi A, Naveed QN, Abdulkadir RA. Quasi-Newton optimised Kolmogorov-Arnold networks for wind farm power prediction. Heliyon. 2024;10(23):e40799. doi:10.1016/j.heliyon.2024.e40799. [Google Scholar] [PubMed] [CrossRef]
25. Chen R, Liu H, Yang X, Zhou Y, Shen L, Yu G. Short-term wind power forecasting based on conditional generative adversarial networks. In: 2022 6th International Conference on Power and Energy Engineering; 2022; Shanghai, China. p. 52–8. [Google Scholar]
26. Liu Y, Wang J, Liu L. Physics-informed reinforcement learning for probabilistic wind power forecasting under extreme events. Appl Energy. 2024;376(11):124068. doi:10.1016/j.apenergy.2024.124068. [Google Scholar] [CrossRef]
27. Thiyagarajan A, Revathi BS, Suresh V. A deep learning model using transformer network and expert optimizer for an hour ahead wind power forecasting. IEEE Access. 2025;13:33935–55. doi:10.1109/ACCESS.2025.3543594. [Google Scholar] [CrossRef]
28. Wang K, Liu W, Chen Z, Huang Z, Yu T, Pan Z. Power prediction of wind turbine under icing weather based on operation state and power characteristic guidance. Elect Pow Automat Equip. 2024;44:88–93. (In Chinese). [Google Scholar]
29. Finder SE, Amoyal R, Treister E, Freifeld O. Wavelet convolutions for large receptive fields. arXiv:2407.05848. 2024. [Google Scholar]
30. Wang S, Zhang W, Sun Y, Trivedi A, Chung CY, Srinivasan D. Wind power forecasting in the presence of data scarcity: a very short-term conditional probabilistic modeling framework. Energy. 2024;291(1):130305. doi:10.1016/j.energy.2024.130305. [Google Scholar] [CrossRef]
31. Ju Y, Li J, Sun G. Ultra-short-term photovoltaic power prediction based on self-attention mechanism and multi-task learning. IEEE Access. 2020;8:44821–29. doi:10.1109/ACCESS.2020.2978635. [Google Scholar] [CrossRef]
32. Abou Houran M, Bukhari SMS, Zafar MH, Mansoor M, Chen W. COA-CNN-LSTM: coati optimization algorithm-based hybrid deep learning model for PV/wind power forecasting in smart grid applications. Appl Energy. 2023;349(3):121638. doi:10.1016/j.apenergy.2023.121638. [Google Scholar] [CrossRef]
33. Li Q, Ren X, Zhang F, Gao L, Hao B. A novel ultra-short-term wind power forecasting method based on TCN and Informer models. Comput Electr Eng. 2024;120(3):109632. doi:10.1016/j.compeleceng.2024.109632. [Google Scholar] [CrossRef]
Cite This Article
 Copyright © 2025 The Author(s). Published by Tech Science Press.
This work is licensed under a Creative Commons Attribution 4.0 International License , which permits unrestricted use, distribution, and reproduction in any medium, provided the original work is properly cited.
 Downloads
 Citation Tools