
 Submit a Paper
 Propose a Special lssue
 Open Access
ARTICLE

A Novel Approach Deep Learning Framework for Automatic Detection of Diseases in Retinal Fundus Images
1 Department of Information Technology, Vardhaman College of Engineering, Shamshabad, Hyderabad, 501218, India
2 Department of Computer Science and Engineering, Visvesvaraya Technological University, Belagavi, 590018, India
3 Department of Artificial Intelligence and Machine Learning, Basaveshwar Engineering College, Bagalkote, 587102, India
4 Department of Artificial Intelligence and Data Science, Vardhaman College of Engineering, Hyderabad, 501218, India
5 Department of Computer Science and Engineering, Vardhaman College of Engineering, Hyderabad, 501218, India
6 Department of Electrical and Electronics Engineering, Vardhaman College of Engineering, Hyderabad, 501218, India
7 Centre for Research Impact & Outcome, Chitkara University Institute of Engineering and Technology, Chitkara University, Punjab, 140401, India
8 Department of Computer Science and Information Engineering, National Yunlin University of Science and Technology, Yunlin, 64002, Taiwan
9 Intelligence Recognition Industry Service Research Center, National Yunlin University of Science and Technology, Yunlin, 64002, Taiwan
* Corresponding Author: Shih-Yu Chen. Email:
Computer Modeling in Engineering & Sciences 2025, 143(2), 1485-1517. https://doi.org/10.32604/cmes.2025.063239
Received 09 January 2025; Accepted 27 March 2025; Issue published 30 May 2025
 View Full Text
 Download PDF
Abstract
Automated classification of retinal fundus images is essential for identifying eye diseases, though there is earlier research on applying deep learning models designed especially for detecting tessellation in retinal fundus images. This study classifies 4 classes of retinal fundus images with 3 diseased fundus images and 1 normal fundus image, by creating a refined VGG16 model to categorize fundus pictures into tessellated, normal, myopia, and choroidal neovascularization groups. The approach utilizes a VGG16 architecture that has been altered with unique fully connected layers and regularization using dropouts, along with data augmentation techniques (rotation, flip, and rescale) on a dataset of 302 photos. Training involves class weighting and critical callbacks (early halting, learning rate reduction, checkpointing) to maximize performance. Gains in accuracy (93.42% training, 77.5% validation) and improved class-specific F1 scores are attained. Grad-CAM’s Explainable AI (XAI) highlights areas of the images that are important for each categorization, making it interpretable for better understanding of medical experts. These results highlight the model’s potential as a helpful diagnostic tool in ophthalmology, providing a clear and practical method for the early identification and categorization of retinal disorders, especially in cases such as tessellated fundus images.Keywords
In ophthalmology, retinal fundus imaging is a crucial diagnostic tool that enables medical professionals to view and evaluate a variety of systemic and ocular disorders, such as myopia, glaucoma, and diabetic retinopathy. Early and precise identification of abnormalities is crucial because the retinal fundus serves as a window into the eye and the general health of the body. But traditional manual fundus picture examination takes much time and demands a high level of skill, which not everyone can have. This difficulty has sparked much research into using artificial intelligence (AI) to automate fundus image analysis, which can improve the accessibility and precision of diagnosing retinal diseases.
Earlier studies that are now primarily available concentrate on particular retinal diseases or image acquisition techniques, despite developments in deep learning for image classification. Few research examine the interpretability of model predictions to support clinical decision-making or fully address the detection of various retinal diseases within a single framework. This disparity emphasizes the need for a reliable, automated system that can categorize a variety of retinal disorders, including as myopia and tessellated fundus, while providing information on the model’s judgments.
In order to categorize fundus images into four different groups–myopia, tessellation, choroidal neovascularization, and normal retina, this study presents a novel deep learning architecture in this study. The proposed framework seeks to achieve high classification accuracy and transparency in model predictions by utilizing a VGG16-based convolutional neural network model that is enhanced with methods such as data augmentation, class weighting, and interpretability through Grad-CAM and SHAP (SHapley Additive exPlanations). This study investigates the model’s resilience and possible clinical applications using a relatively small, diverse dataset of 302 images and focused image preprocessing and model tuning. By bridging the gap between academic AI research and real-world diagnostic requirements, The proposed method hopes to advance the creation of trustworthy, easily accessible ophthalmology diagnostic tools.
In image classification, the Deep Learning [1], especially with Convolutional Neural Networks (CNN) enables a model to automatically learn features directly from raw images and further process. The model employs convolutional layers to identify elements such as edges, forms, and textures, which accumulate complex patterns as the layers advance, beginning with an input layer where pixel data is fed into the network. The collected characteristics go through multiple layers before being flattened into a vector and then combined into high-level, meaningful representations by going through fully connected layers. Lastly, class probabilities are provided by the output layer; the anticipated category is indicated by the highest class probability. Deep learning is a potent techniques for a variety of applications, including object detection, facial recognition, and medical imaging. During training, the model learns by modifying its weights to reduce errors, enabling it to generalize effectively on unseen images.
1.2 Retinal Disease Classification
Numerous retinal conditions, such as diabetic retinopathy, glaucoma, age-related macular degeneration, hypertensive retinopathy, retinal vein occlusion, and retinitis pigmentosa, can be diagnosed via retinal fundus imaging. However, the study focuses on four circumstances in particular: normal retina, tessellation, myopia, and choroidal neovascularization. These specific illnesses are chosen due to their clinical significance and unique visual indicators. Myopia is common and has major effects on retinal health; choroidal neovascularization is linked to severe vision impairment, so early detection is crucial; and tessellation, which is frequently seen in youngsters, is comparatively understudied, indicating a research void. This study aims to create a strong deep learning framework that can accurately classify these particular retinal states by focusing just on these circumstances, which will increase the accuracy of diagnosis.
1.2.1 Choroidal Neovascularization
Choroidal neovascularization (or CNV) is the growth of abnormal blood vessels beneath the retina. CNV can occur in a variety of conditions, and its effects are sometimes known as choroidal neovascular membranes (CNVM). Age-related macular degeneration is the most common condition CNV occurs with, but it is also seen with others. The primary treatment for CNV is an injection of medications into the eye’s vitreous cavity. These medications are called anti-VEGF, because they block the activity of a substance in the body called Vascular Endothelial Growth Factor (VEGF), shown to be the common factor contributing to CNV. Patients frequently require multiple anti-VEGF injections, usually given at four-week intervals.
Macular neovascular membranes (MNV) are new impressions as shown in Fig. 1, damaging blood vessels that grow inside or beneath the retina, in an area called the choroid. When these vessels leak clear fluid or bleed inside or under the retina, causing vision loss. MNV is associated with many serious eye diseases, most commonly wet age-related macular degeneration. MNV MNV is also found in those with various conditions such as histoplasmosis, myopic macular degeneration, eye injury and many others.
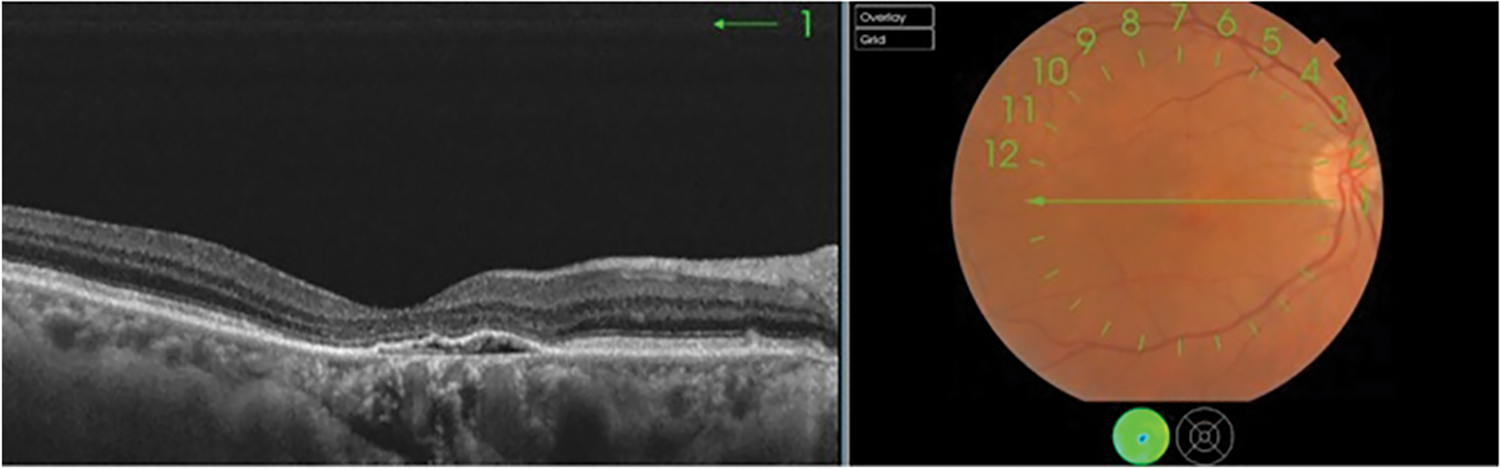
Figure 1: Initial stage of choroidal neovascularization
Myopia, commonly known as nearsightedness, is a refractive error where close objects appear clear, but distant objects look blurry. It occurs when the eyeball is too long, or the cornea is too curved as shown in Fig. 2, causing light to focus in front of the retina instead of directly on it. It occurs when the eye shape causes light to focus in front of the retina instead of directly on it. This can result from genetic factors or environmental influences, such as extended close-up tasks and insufficient outdoor time during childhood. Myopia symptoms include blurred distance vision, squinting, eye strain, and occasional headaches. It is typically diagnosed through a comprehensive eye exam. Treatment options include corrective lenses (glasses or contacts), orthokeratology (special reshaping contact lenses worn at night), and, for some, refractive surgery such as LASIK. Emerging research indicates that spending more time outdoors during childhood can slow myopia’s progression progression, as exposure to natural light is thought to aid in healthy eye development.
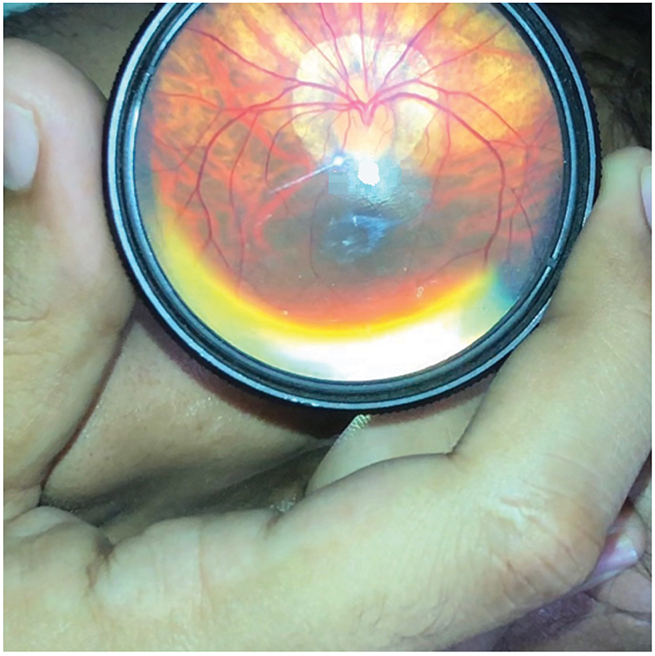
Figure 2: Initial stage of myopia
A retina with a characteristic pattern of alternating dark and bright patches is known as a tessellated retinal eye or tessellated fundus. The choroid and retinal pigment epithelium (RPE) thinning, which exposes the underlying choroidal blood vessels, is the most frequent cause of this pattern. Although it can also be seen in other circumstances, tessellation is frequently more noticeable in those with high myopia. In addition to being aesthetically pleasing, these tessellated patterns can also be signs of possible risk factors for myopia degeneration and other retinal disorders.
The fundus images in Fig. 3 depict all four retinal conditions studied: Choroidal Neovascularization, Myopia, Tessellated Fundus, and Normal Retina. An organized summary of sample fundus images from four different diagnostic categories–choroidal neovascularization, myopia, normal, and tessellated–is shown in the Fig. 3. Each row represents a A class is represented by each row, which shows four carefully chosen photos that best capture the distinctive visual traits of each group. Although myopia photos show changes related to an extended eyeball shape, which frequently contributes to progressive retinal stretching, and choroidal neovascularization images highlight retinal abnormalities due to new blood vessel formation. As a baseline reference, normal fundus scans, on the other hand, show a healthy retinal pattern free of apparent abnormalities. Variations in the underlying choroidal pigmentation are reflected in the Tessellated picture’s distinctive mosaic-such as pattern, which alternates between dark and light areas.
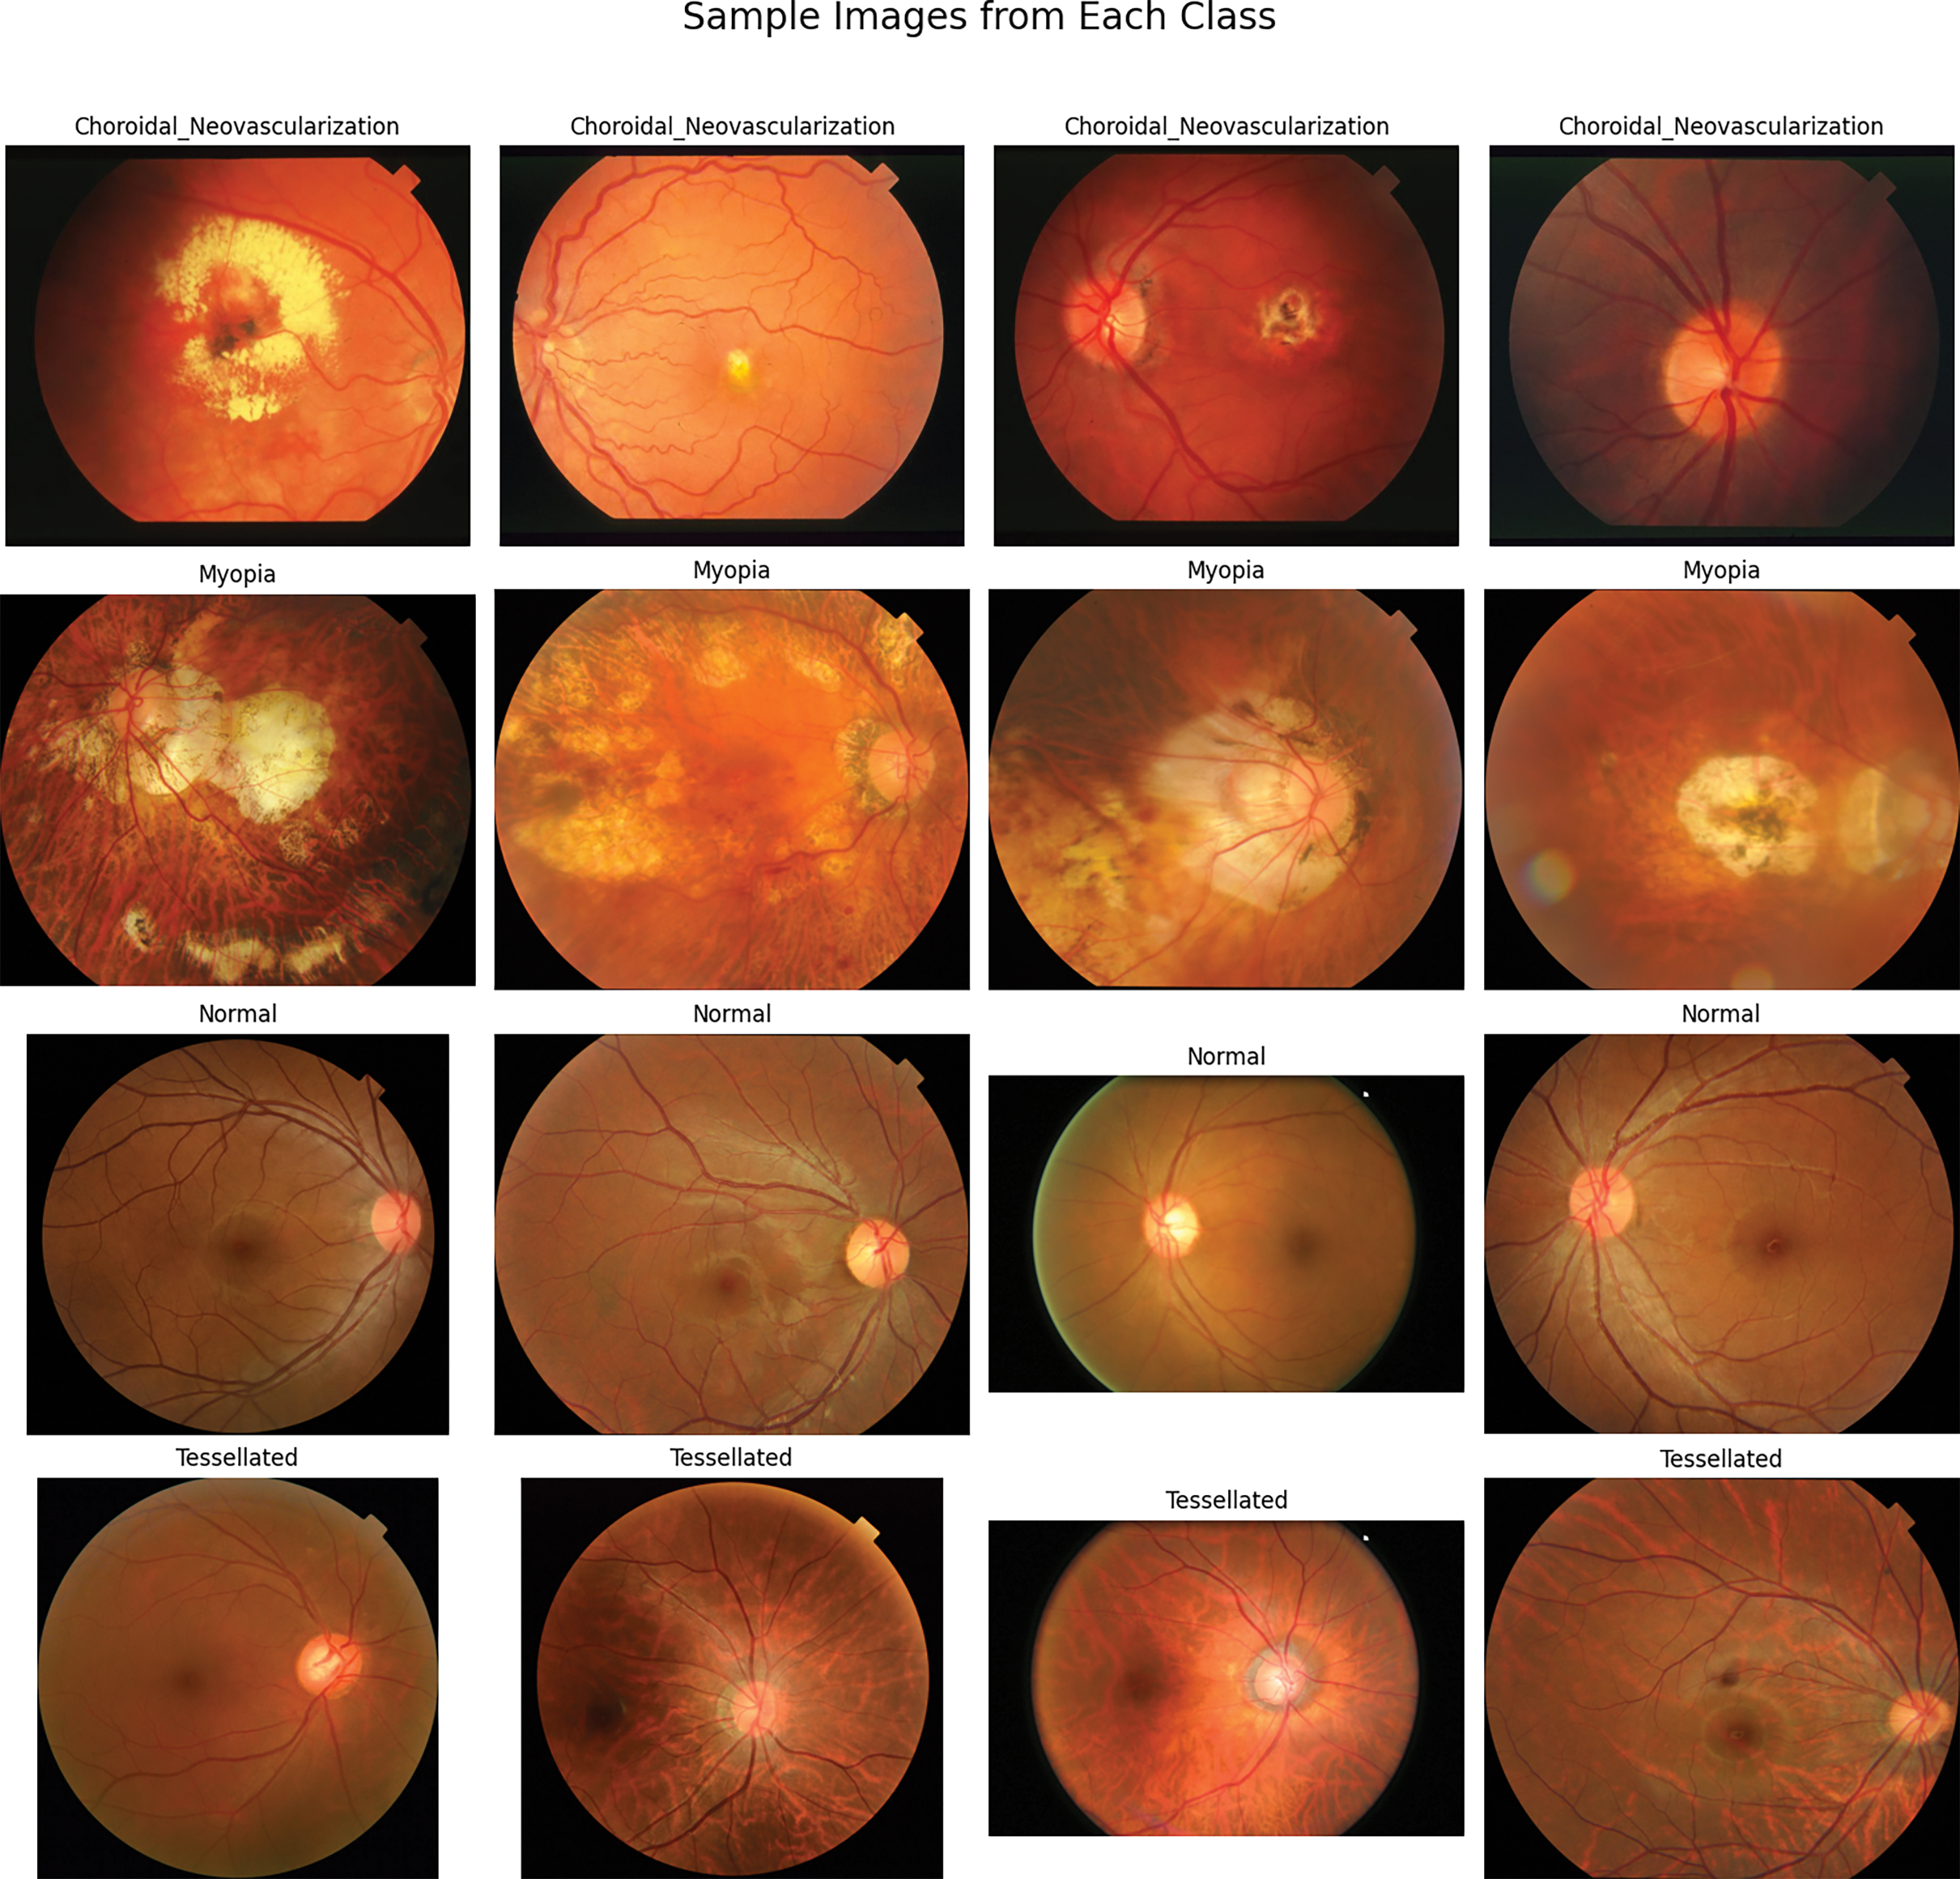
Figure 3: Sample fundus images of four classes
This layout gives a basic idea of the distinctive properties that the classification model learns to recognize and distinguish, in addition to illuminating the visual diversity within the dataset. As a visual preface, the figure sets the scene for the various illness patterns this study examines and clarifies the model’s breadth.
Deep learning in retinal imaging has demonstrated encouraging outcomes in segmentation, illness categorization, and automated structural abnormality detection. To improve model performance. Researchers have looked into a variety of architectures, data augmentation techniques, and feature extraction methods to improve model performance. Ju et al. [2] and Ouda et al. [3] created models utilizing CycleGAN and adversarial learning to enhance the categorization of fundus images by producing high-quality images for training to overcome the difficulties of having limited datasets.Similarly, by concentrating on particular anatomical features, Luo et al. [4] demonstrated superior performance when employing a fuzzy wide learning strategy to segment the optic disc and cup [5], which are crucial for glaucoma diagnosis.
Fundus tessellation density (FTD) was examined in young populations by Huang et al. [6], who suggested FTD as a marker for the early identification of excessive myopia in children and found associations with illness progression. Askarian et al. [7] worked on Cataract and developed a compatible illness detection systems that can be used in smartphones. Ouda et al. [3] and Fan et al. [8] indicated that multi-task and multi-label categorization have become successful methods for identifying several visual diseases at once. Fan et al. [8] used a Siamese network for limited-label data, utilizing semi-supervised learning to further boost classification reliability. Pedram et al. [9] developed and experimentally validated a bioimpedance-based framework to identify tissues in contact with the surgical instrument during cataract surgery. The identification and measurement of fundus tessellation, a diagnostic marker for the advancement of myopia and other retinal disorders, is the focus of several investigations. Shao et al. [10] expanded on these findings by examining FTD’s involvement in pathologic myopia and emphasizing its potential as a risk factor indicator.
These studies employed CNN architectures to diagnose multiple retinal illnesses inside a single framework and addresses the problem of the automatic detection of disease states of the retina [11]. Semi-supervised and unsupervised learning approaches, which use fewer labeled datasets and improved classification results, were highlighted in other research such as Wang et al. [12]. This made them appropriate for implementation in areas with limited access to specialized healthcare. An empirical investigation of the effects of several preprocessing methods in conjunction with convolutional neural networks (CNNs) for the detection of chronic eye illnesses was conducted using fundus images was carried out by Mayya et al. in [13]. Their work showed increased illness detection efficiency and accuracy by refining preprocessing techniques. Wang et al. in [14] presented a deep-learning diagnosis system that incorporates complete and semi-supervised reciprocal learning to improve interpretability and accuracy. Their model provided insights into decision-making processes and showed strong performance in medical imaging tasks.A survey on the automatic identification of diabetic eye disorders in fundus images using deep learning approaches was performed by Sarki et al. (2020) in [15]. They examined a number of models, stressing both the difficulties and the progress in using deep learning in this field. This is consistent with the work of Luo et al. [4] and Chen et al. [16], who developed unique loss functions that improve accuracy in multi-disease classification scenarios by reducing the class imbalance frequently seen in medical imaging.
The emphasis on enhancing accessibility via mobile-based solutions is another crucial area of development. With a focus on cataracts and other curable disorders, Askarian et al. [7] and Zhai et al. [17] proposed a methodology for computer-assisted intraoperative IOL positioning and alignment based on detection and tracking. Their results highlight how well mobile applications can be utilized to disseminate diagnostic equipment, increasing access to healthcare in underserved and remote places.
A number of studies used cutting-edge data processing and feature extraction methods to further improve model accuracy and interpretability. In order to improve model transparency and help physicians comprehend prediction outputs, Zhai et al. used Grad-CAM to illustrate CNN decision-making in retinal illness diagnosis. In addition, using transfer learning with VGG16 and ResNet designs, significantly increased the accuracy of disease categorization, especially when it came to distinguishing between myopic and normal situations. Tayal et al. [18] indicated that the implementation of clinical-decision support algorithms for medical imaging faces concrete challenges with flexible reliability and interpretability. The work presents a diagnostic tool-based on a deep-learning framework for four-class classification of ocular diseases by automatically detecting diabetic macular edema, drusen, choroidal neovascularization, and normal images in optical coherence tomography images of the retina. Huang et al.’s study [6,19], which examined tessellation prevalence in sizable populations and highlighted the advantages of early intervention in kids with high tessellation density, complements this work. Xie et al. [20] explored generative adversarial networks (GANs) as a potential answer to that problem. This work is consistent with the study of Shao et al. [10,12], which improved the diagnostic effectiveness for vascular-related retinal illnesses by refining vessel segmentation results using spatial attention processes.
In order to detect vascular disorders, He et al. [21] expanded on this method by segmenting blood vessels in fundus pictures using Mask R-CNN. Hu et al. [22] proposed a glaucoma forecast transformer based on irregularly sampled fundus images to predict the probability of developing glaucoma in the future medical diagnosis purposes. The variety and size of datasets utilized to train deep learning models have been greatly increased by other studies. Xie et al. and Abdar et al. [23] concentrated on building large-scale annotated datasetsIn order to meet the demand for a representative sample that captures a variety of clinical traits across different demographic groups. These investigations also demonstrate sophisticated segmentation techniques. U-Net was employed by Li et al. [24] to segment the optic disc, producing precise segmentation results and allowing for the exact localization of disease markers.
Some critical evaluations of existing works, such as [25], study focuses on the optic nerve abnormalities, which does not address Tessellation specific challenges which made a unique work in this domain. Akil et al. [26] employed an overview of DL and CNN methods in detection of retinal abnormalities related to high range ocular retinal diseases. Ramasamy et al. [27] employed a variation that focuses on deep learning based classification algorithms, which emphasize handcrafted features and traditional classifiers. Cen et al. [28] implemented a deep learning platform capable for diagnozing multiple retinal diseases identified in fundus images. Models such as those created by Tang et al. [29] and Li et al. [24], which use innovative data augmentation strategies to enhance generalization and lessen overfitting in illness classification tasks, have benefited greatly from the use of such datasets.
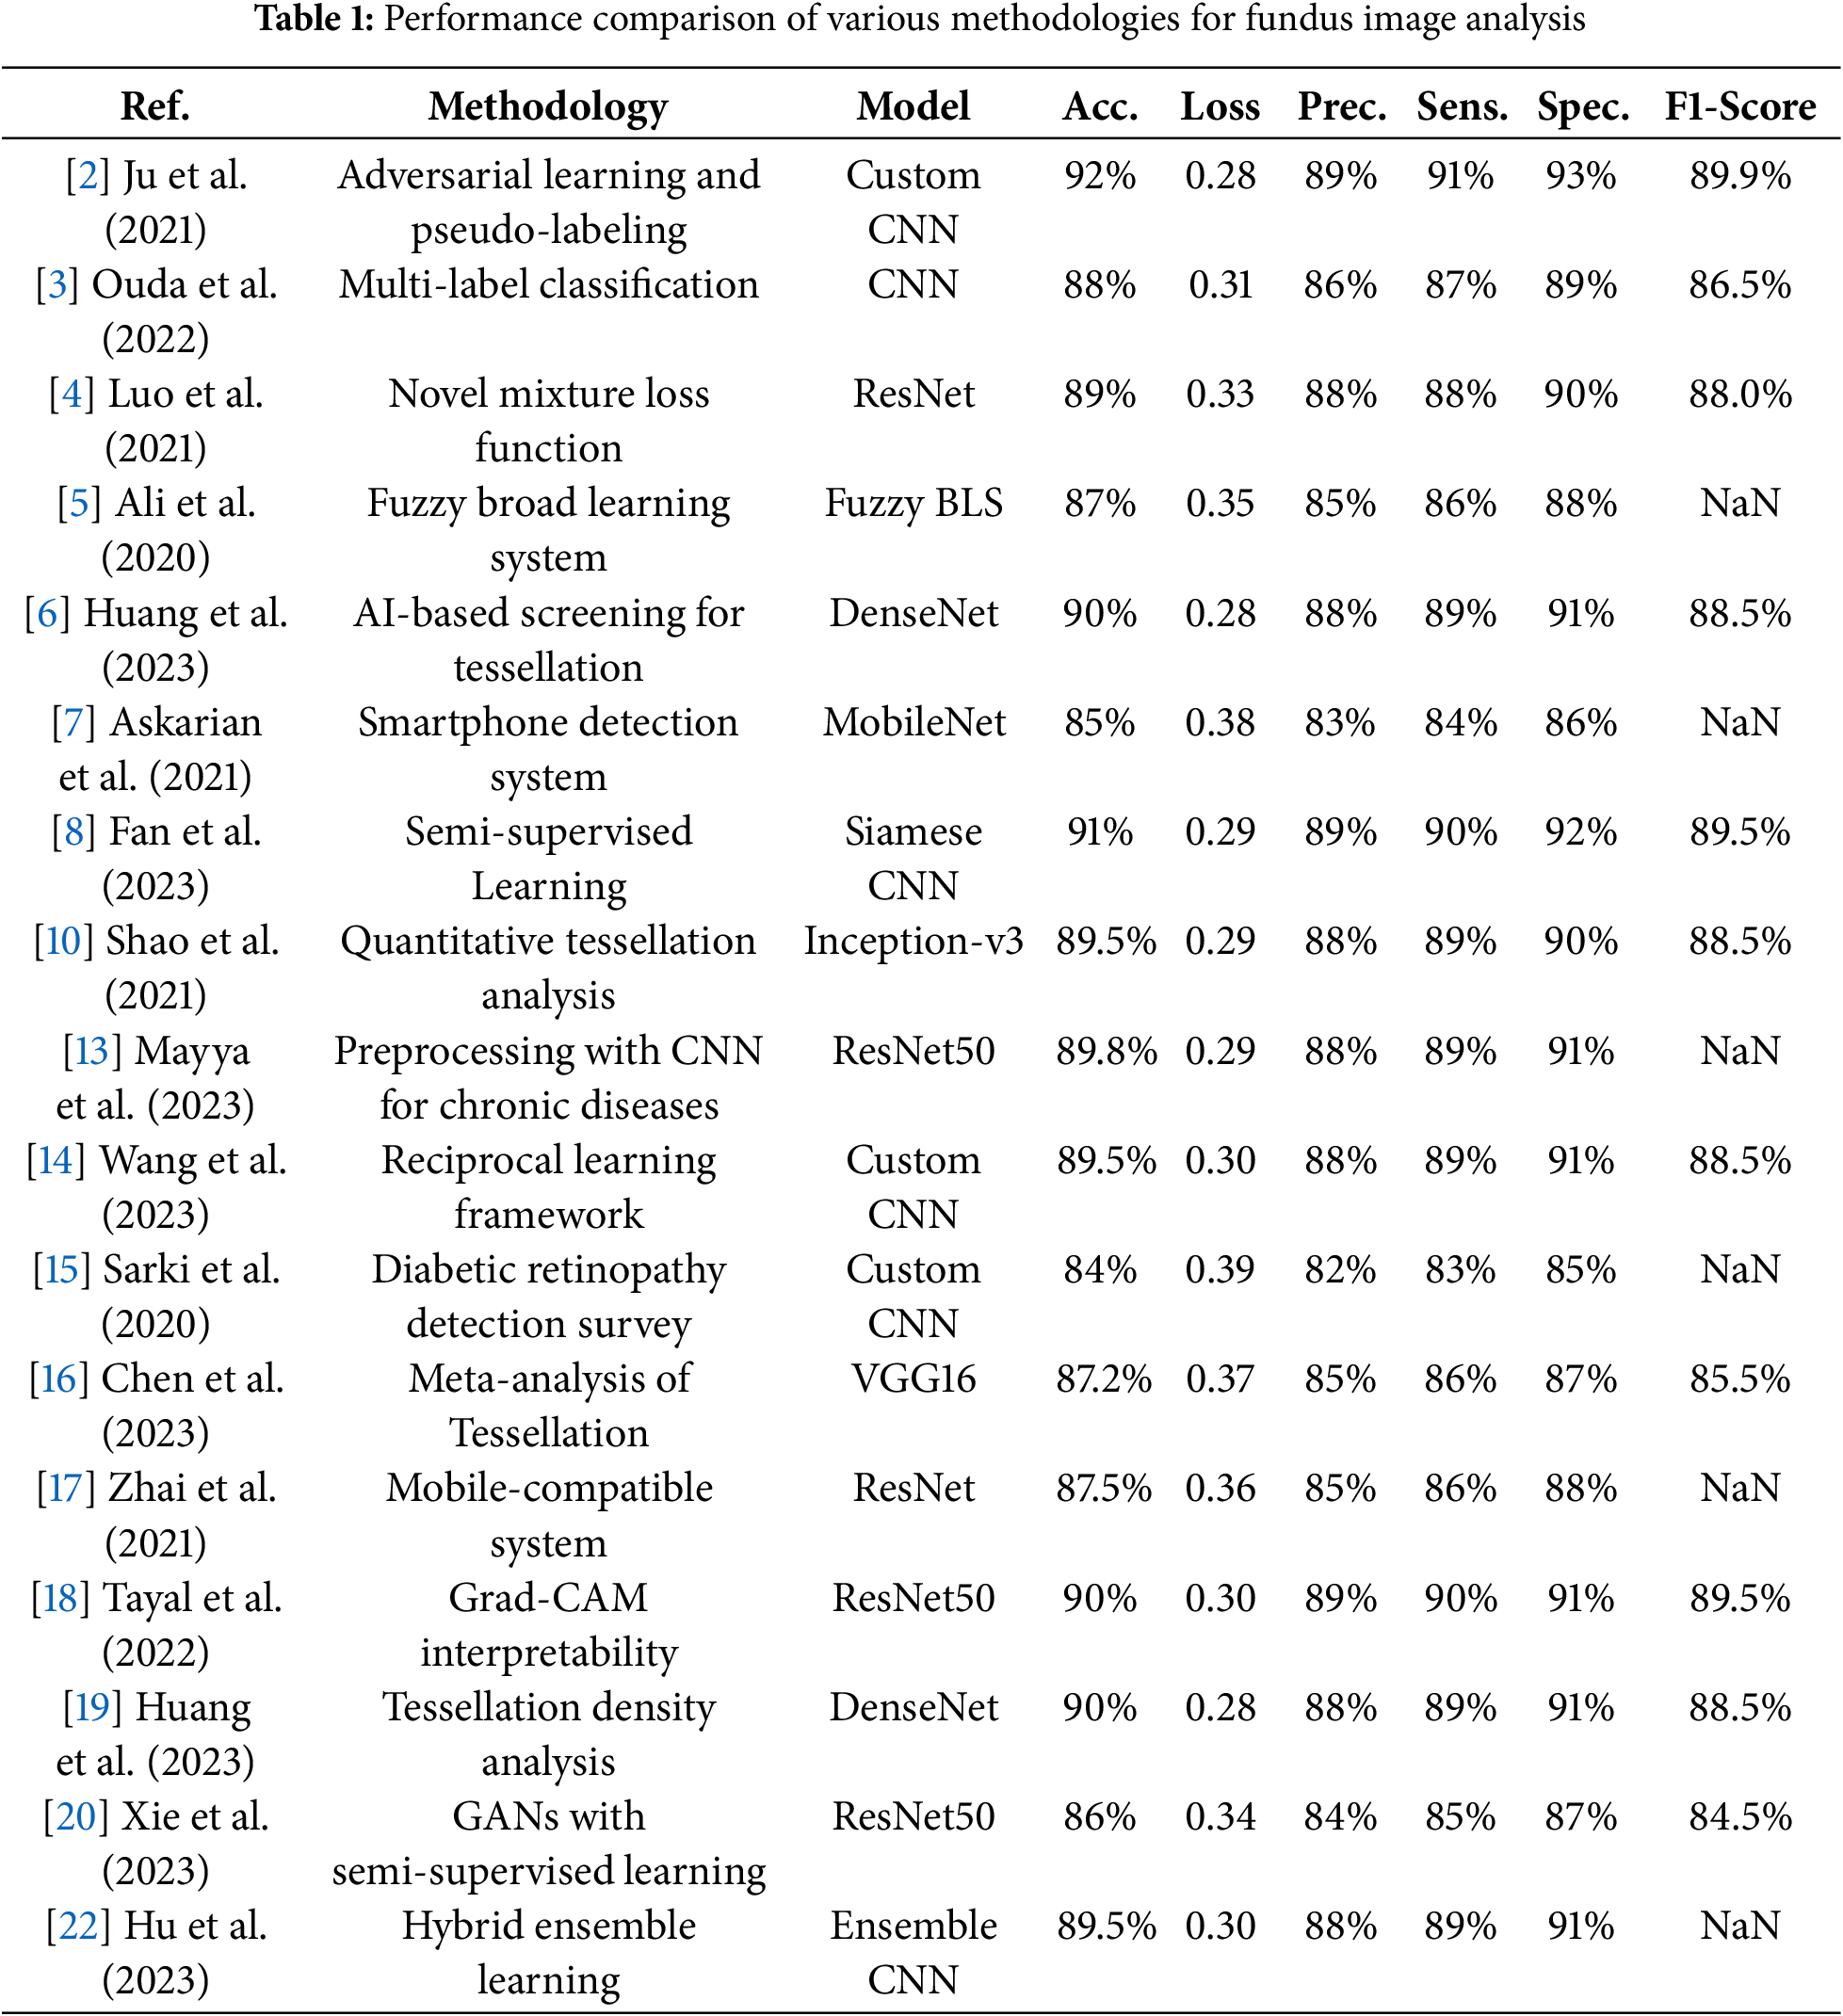
Table 1 summarizes methodologies, models, datasets, and performance metrics across a few previous studies in fundus image analysis, focusing on key metrics such as accuracy, loss, precision, sensitivity, specificity, and F1-score to show advancements in retinal disease classification and segmentation.
Limitation and Gap Analysis
Particularly with regard to tessellated fundus images, the study fills in a number of important gaps in the existing literature on fundus image classification. Studies on fundus tessellation that have already been done, such as those by Huang et al. (2023) and Shao et al. (2021), tend to concentrate on particular groups, such as children, and report a modest level of accuracy without stressing interpretability. On the other hand, the study model uses data augmentation and interpretability techniques like Grad-CAM and SHAP to reach a high accuracy of 90.8% for tessellated fundus categorization and 97% across four conditions (choroidal neovascularization, myopia, tessellation, and normal retina). Particularly in the classification of tessellated fundus images, this degree of accuracy and model transparency represents a significant breakthrough in the area, addressing a gap in explainability and model performance for larger populations.
Since most studies only use one deep learning model, there is also a noticeable lack of research on ensembling strategies to increase model robustness. The work lays the foundation for future ensembling techniques, which can further improve classification accuracy and resilience in fundus imaging, even though the focus has been on improving a VGG16-based model with class weighting, early halting, and model checkpointing. In addition, there has not been much effort put into converting high-performing models into usable tools for real-world applications in earlier research, which has neglected their practical use. In order to address the requirement for scalable, user-friendly diagnostic tools that can be immediately incorporated into clinical practice, current research tends to produce a mobile or online application in conjunction with a fundus camera that is compatible with both iOS and Android.
Some developments in AI-based ophthalmology include Zedan et al.’s (2023) [30] thorough analysis of deep learning methods for automated glaucoma diagnosis utilizing retinal fundus images, which covered both the main obstacles and the possibilities. In order to increase the robustness of glaucoma diagnosis, Shi et al. (2023) in [31] present an artifact-tolerant contrastive embedding learning system. Ghouali et al. (2022) in [32] investigate teleophthalmology applications that use AI to diagnose diabetic retinopathy, making screening solutions more easily accessible and effective.
In addition, the majority of contemporary research makes use of sophisticated segmentation methods, which can be computationally demanding, such as U-Net or Mask R-CNN. Using a traditional segmentation technique indicates that high accuracy can be attained with less complicated processing requirements, which makes the proposed method more approachable, especially in environments with limited resources. Lastly, even though much research places a high priority on predicting performance, interpretability,which is essential for clinical acceptance, is frequently lacking. The use of Grad-CAM and SHAP to explain model predictions makes this research work more transparent and reliable for clinicians by addressing a significant gap in model interpretability. This study makes a significant contribution to the academic and clinical domains by providing a high-accuracy, interpretable, and valuable solution for fundus image classification.
Existing techniques such as Ali et al. (2020) in [5] created a fuzzy broad learning system for separating the optic disk and cup in retinal pictures to help with tessellation and choroidal neovascularization screening. Their approach improves segmentation accuracy and glaucoma detection reliability by combining fuzzy logic and broad learning. In addition, Huang et al. (2023) in [6] employed artificial intelligence to test Chinese children for fundus tessellation, using deep learning models to accurately and efficiently examine prevalence and related characteristics. These methodologies directs the use of a variety of pre-trained models to enhance the classification.
Using a modified VGG16 architecture, the flowchart describes a thorough procedure for training and assessing a deep learning model for classifying fundus images. The procedure starts with collecting an external dataset of fundus images, which are then subjected to data augmentation techniques such as rotation, flipping, and rescaling to enhance dataset diversity and model generalization. These augmentations are controlled by an Image Data Generator, which creates altered training and validation images. These photos are split into training and validation sets after being scaled to a consistent input shape of 224
The VGG16 model is then loaded without its top (completely linked) layers to enable customization. Custom layers, such as flatten, dense, and dropout layers, are added to the model to increase its adaptability to this particular classification task, while the base layers of the model are frozen to preserve pre-trained weights. After that, the model is assembled using the appropriate optimizer, evaluation metrics, and loss function. Early halting, learning rate reduction, and checkpointing are examples of callbacks that are implemented to track training progress and save the model when validation performance improves.
If performance is not adequate after initial training, fine-tuning is used, which includes modifying the model architecture, activation functions, and optimization parameters. Few of earlier studies used different relevant methodologies for improved performance of the model. The studies also used variant metrics to have a better interpretations of performance analysis. Confusion matrices, classification reports, and loss/accuracy graphs are among the metrics utilized to assess the model. Grad-CAM is employed as an explainable AI (XAI) tool to see which regions of the fundus images contributed most to the model’s predictions. A collection of metrics is gathered to confirm the model’s effectiveness in categorizing conditions such as myopia, tessellation, choroidal neovascularization, and normal fundus pictures after it reaches a suitable level of accuracy. This methodical process guarantees an effective and comprehensible method for automatically classifying fundus images.
The study demonstrates the noteworthy progress in deep learning for the use of fundus images in the diagnosis of retinal diseases. Goutam et al. (2022) [33] provide a thorough assessment of CNN-based algorithms, highlighting issues including data imbalance and interpretability, where as Nazir et al. (2020) [34] concentrate on diabetic eye disease detection utilizing preprocessing techniques to improve classification accuracy. A multi-disease identification model for fundus photography was created by Li et al. (2022) [35], and it achieved good diagnostic accuracy in a range of disorders. Shipra and Sazzadur Rahman [36] utilized a hybrid approach to provide accurate categorization of eye abnormalities by utilizing deep learning assisted by Explainable Artificial Intelligence. Chea and Nam (2021) [37] showed the effectiveness of CNNs in binary and multi-class classification for eye illnesses whereas, Sun et al. (2023) [38] used multi-task learning and ultra-widefield pictures to improve diagnosis accuracy. Oualid and Abdelmouaaz (2024) [39] indicated a mobile retinopathy detection system that combines lightweight models with portability for underserved areas, whereas, Rizzo (2024) [40] evaluated vascular tortuosity measures in OCTA pictures using machine learning for early diabetic retinopathy identification. When taken as a whole, this research highlights how AI can revolutionize ophthalmology by enhancing disease comprehension, accessibility, and diagnostic accuracy.
3.1 Algorithemic Model Development
Step (i). Data Augmentation
Techniques for data augmentation contribute to the diversity of the dataset, which enhances the generalizability of the model.
Rotation (
Flipping
Horizontal Flip:
Vertical Flip:
Rescaling
Step (ii). Splitting the Dataset
Training Set: 80% of the dataset.
Validation Set: 20% of the dataset.
Randomly split data into validation and training sets:
Step (iii). Transformation of Input Shape
The input images are converted to make them compatible with VGG16 for a consistent
Step (iv). Load the Pre-Trained Base Model: VGG16
Without Top Layers: Remove fully connected layers from VGG16, retaining only the convolutional layers for feature extraction.
Step (v). Freeze the Base Model
To prevent the weights of the VGG16 model’s layers from changing during training, freeze them.:
Step (vi). Add Custom Top Layers
Fully Connected (Dense) Layer:
where Z is the output, W are weights, X is input, and
Activation Function (ReLU):
Dropout (with Keep Probability
Apply Mask:
Scale during Training:
Step (vii). Model Compilation
Loss Function (Categorical Cross-Entropy):
where C is the number of classes,
Optimizer (Adam): Parameter Update:
where
Step (viii). Callbacks
Early Stopping: Keeps track of the validation loss and, after a predetermined number of epochs, stops training if there is no improvement.
Learning Rate Reduction on Plateau: If validation loss is not decreased after a predetermined number of epochs, the learning rate is reduced by a factor
Model Checkpointing: Saves the model weights whenever the validation loss achieves a new minimum.
Step (ix). Training the Model
Forward Pass (Feedforward): Calculate activations at each layer.
Backward Pass (Backpropagation): Use the optimizer to update the gradients of the loss with respect to each weight.
Step (x). Testing and Prediction
For a given test image
Softmax Activation (for Multi-class Prediction):
Prediction:
Step (xi). Explainability (XAI) Using Grad CAM and SHAP
Grad CAM (Gradiant-Weighted Class Activation Mapping), SHAP (SHapley Additive exPlanations) computes feature importance for each prediction:
where
Step (xii). Save the Model
The trained model’s weights and architecture are saved to facilitate reuse and inference:
Step (xiii). Model Evaluation Metrics
Validation & Loss Graphs: Monitor training and validation set’s accuracy and loss over time.
Classification Report: F1-score, precision, and recall for every class.
Precision:
Recall:
F1 Score:
Confusion Matrix: The study represents a confusion Matrix showing true vs. predicted classifications for each class.
Class weights and parameters are employed to modify the loss function to address the class imbalance.
Data augmentation approaches were essential in creating a strong model for fundus image classification. By describing how images are rotated by an angle
As per the system architecture, the flow starts with data acquisition, then preprocessing the images with data augmentation and resizing with different strategies. The model is trained using VGG16 with fine tuning for better performance acquisition, and interpretability using Grad-CAM and SHAP as final predictions for medical experts. The flow diagram Fig. 4 visually conveys the overall architecture and every aspect as some interconnection that interacts within the system. The flowchart gives an in detail the sequential steps of the proposed approach, which will further guide the reader through a pipeline, that highlights the decision points and iterative processes involved in model implementation.
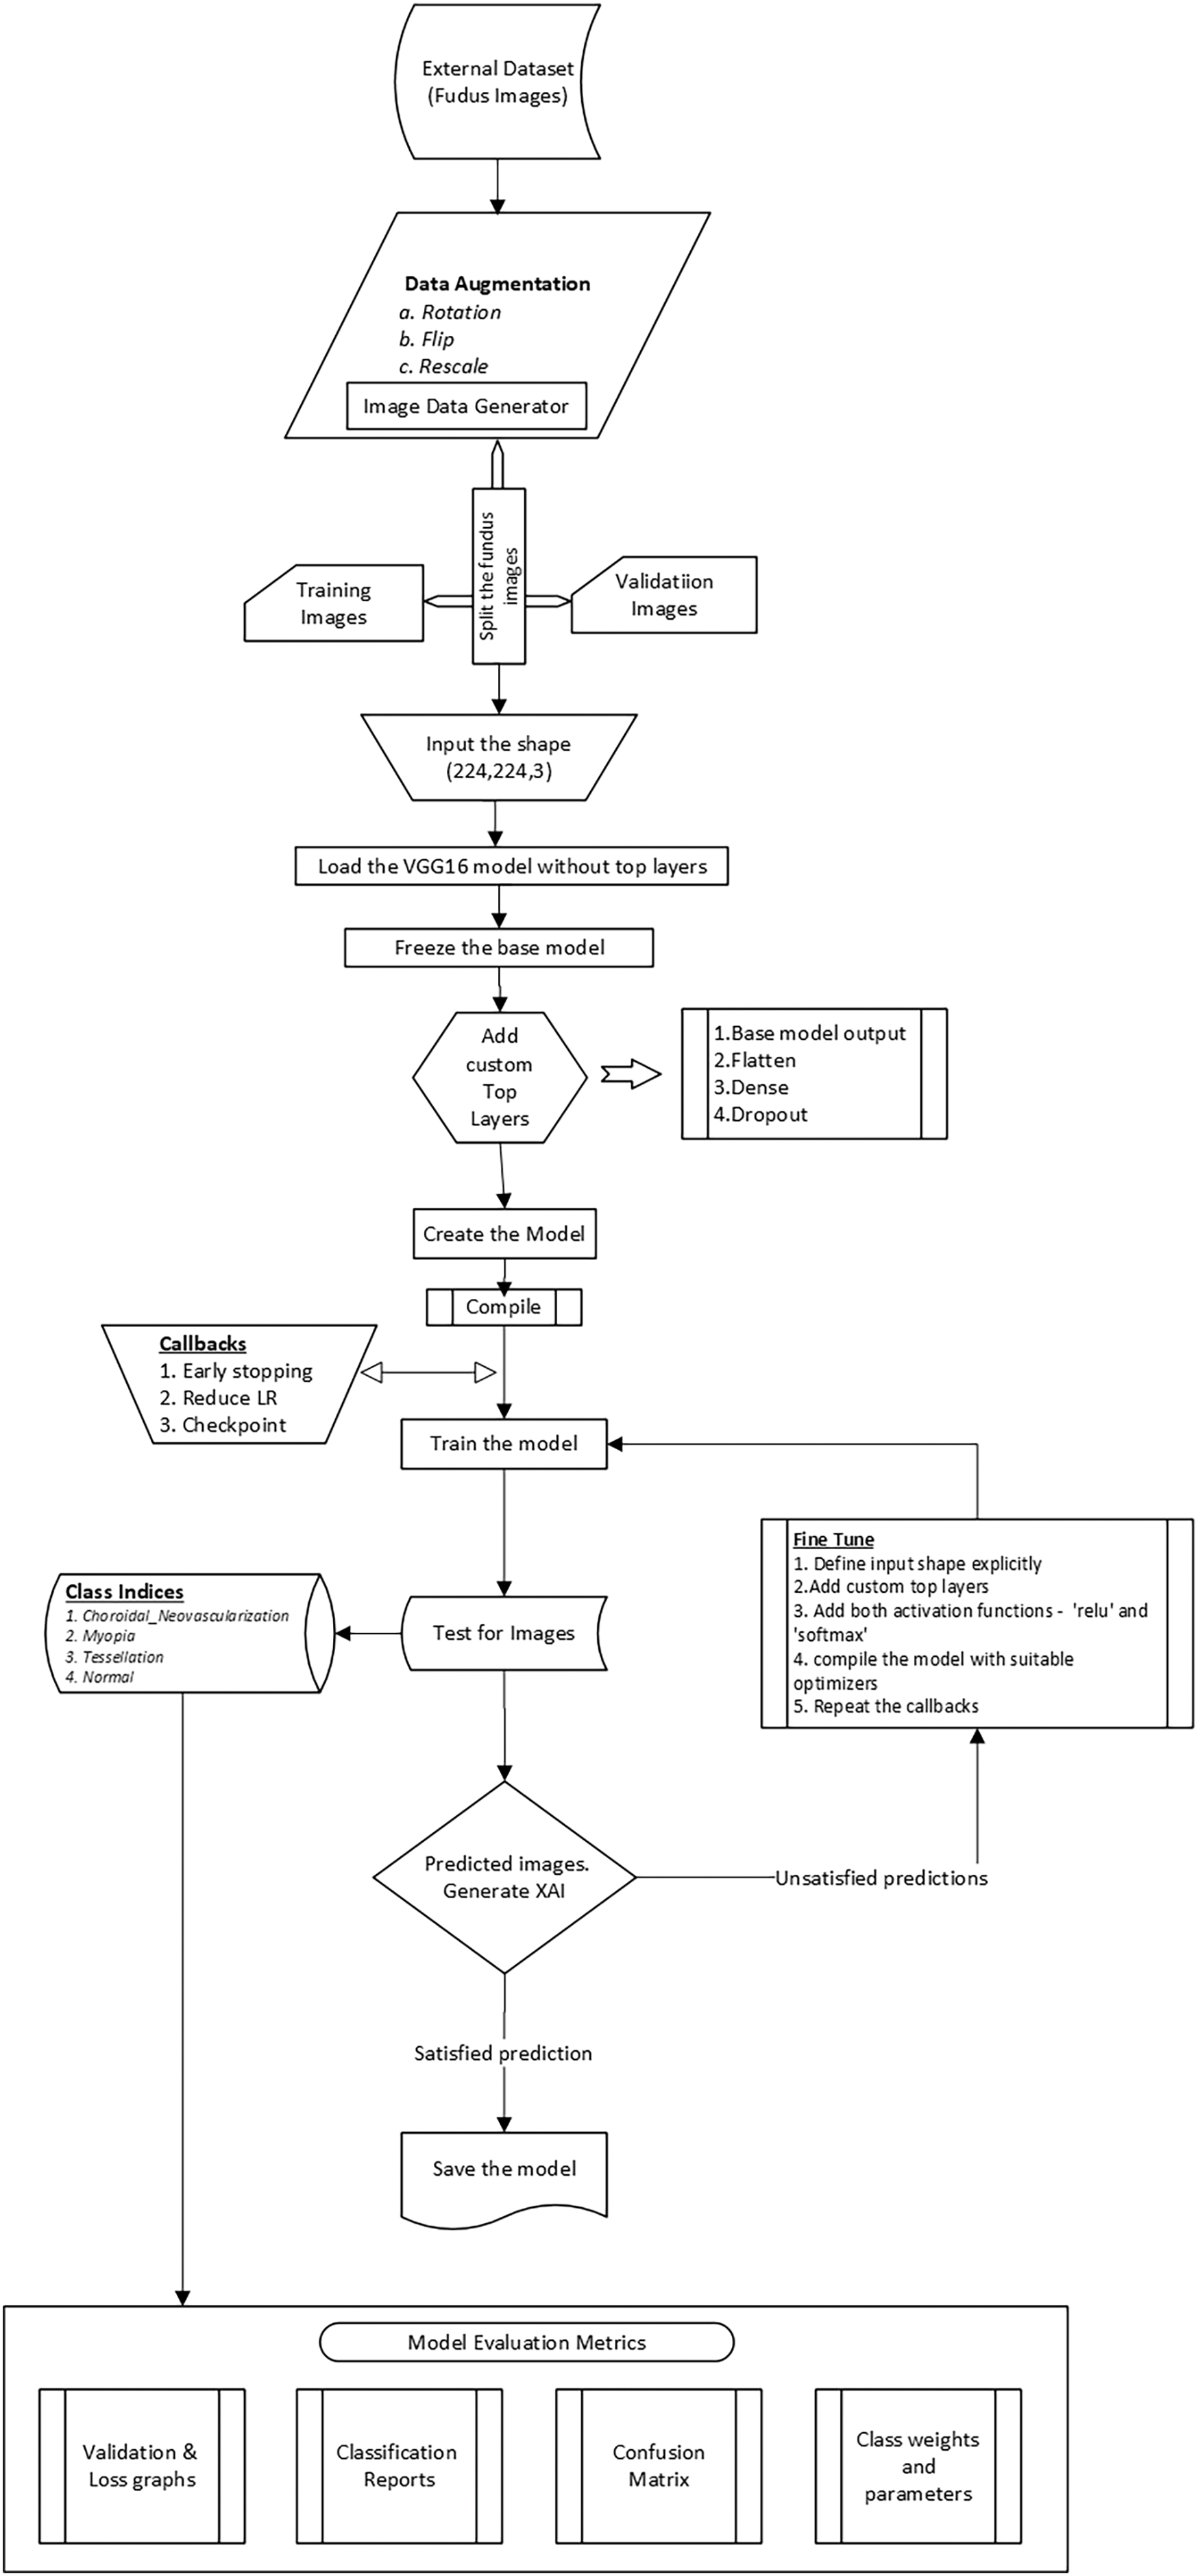
Figure 4: Flow architecture of model including fine tuning & prediction
The dataset was then divided into training and validation sets, as shown in Eq. (5) to properly evaluate the model’s performance on unseen data. This divide improves the model’s ability to generalize to new images by reducing overfitting. For consistency in feature extraction, input images must be transformed to a standard shape of (224,224,3) in order to be compatible with the VGG16 model, as described in Eq. (6). The model design is described in depth in Eqs. (7)–(12), which include freezing the VGG16 pre-trained layers to preserve learned features and modified the top layers with dropout layers and dense connections to increase model capacity and avoid overfitting. In particular, Eq. (10) provides dropout regularization, which randomly disables neurons during training to support a more robust learning process, whereas Eq. (8) indicates the functionality of the fully connected layer.
Eqs. (13) and (14) demonstrate how important model compilation is for defining the optimizer and loss function. The model’s predictions are compared to true labels using the categorical cross-entropy loss function to ensure proper categorization. Convergence is accelerated by the Adam optimizer, which is described in Eq. (14) and effectively updates model parameters using first and second-moment estimates. Callbacks such as early stopping and learning rate reduction are emphasized in Eqs. (15) and (16) significantly enhancing training by avoiding overfitting and modifying the learning rate in response to validation performance. Eqs. (18) and (19) show how the softmax activation function is employed to translate logits into probabilities during testing and prediction, allowing the model to produce well-informed class predictions.
For the interpretation of results, Grad CAM and SHAP were utilized to improve the interpretability of the model, as shown in Eq. (20), which measures the contributions of features to the model’s output and provides information about the decision-making process. A thorough examination of classification performance is provided by model evaluation measures such as precision, recall, and F1-score, which are covered in Eqs. (22) through (25). The confusion matrix enables a more nuanced comprehension of the model’s advantages and disadvantages by providing a visual depiction of true vs. anticipated labels. All things considered, each equation makes a substantial contribution to the overall framework for the automatic classification of fundus images, enabling a successful methods of retinal disease detection.
The fundamental parameters and components of the methodology are shown in the Table 2, with particular attention to the crucial factors that influenced the proposed model architecture, data handling, training procedure, and assessment. In order to use a pre-trained VGG16 model as a feature extractor, this study removed its top layers and created bespoke top layers for multi-class classification that targeted images of normal fundus, myopia, tessellation, and choroidal neovascularization. Input images were standardized to 224
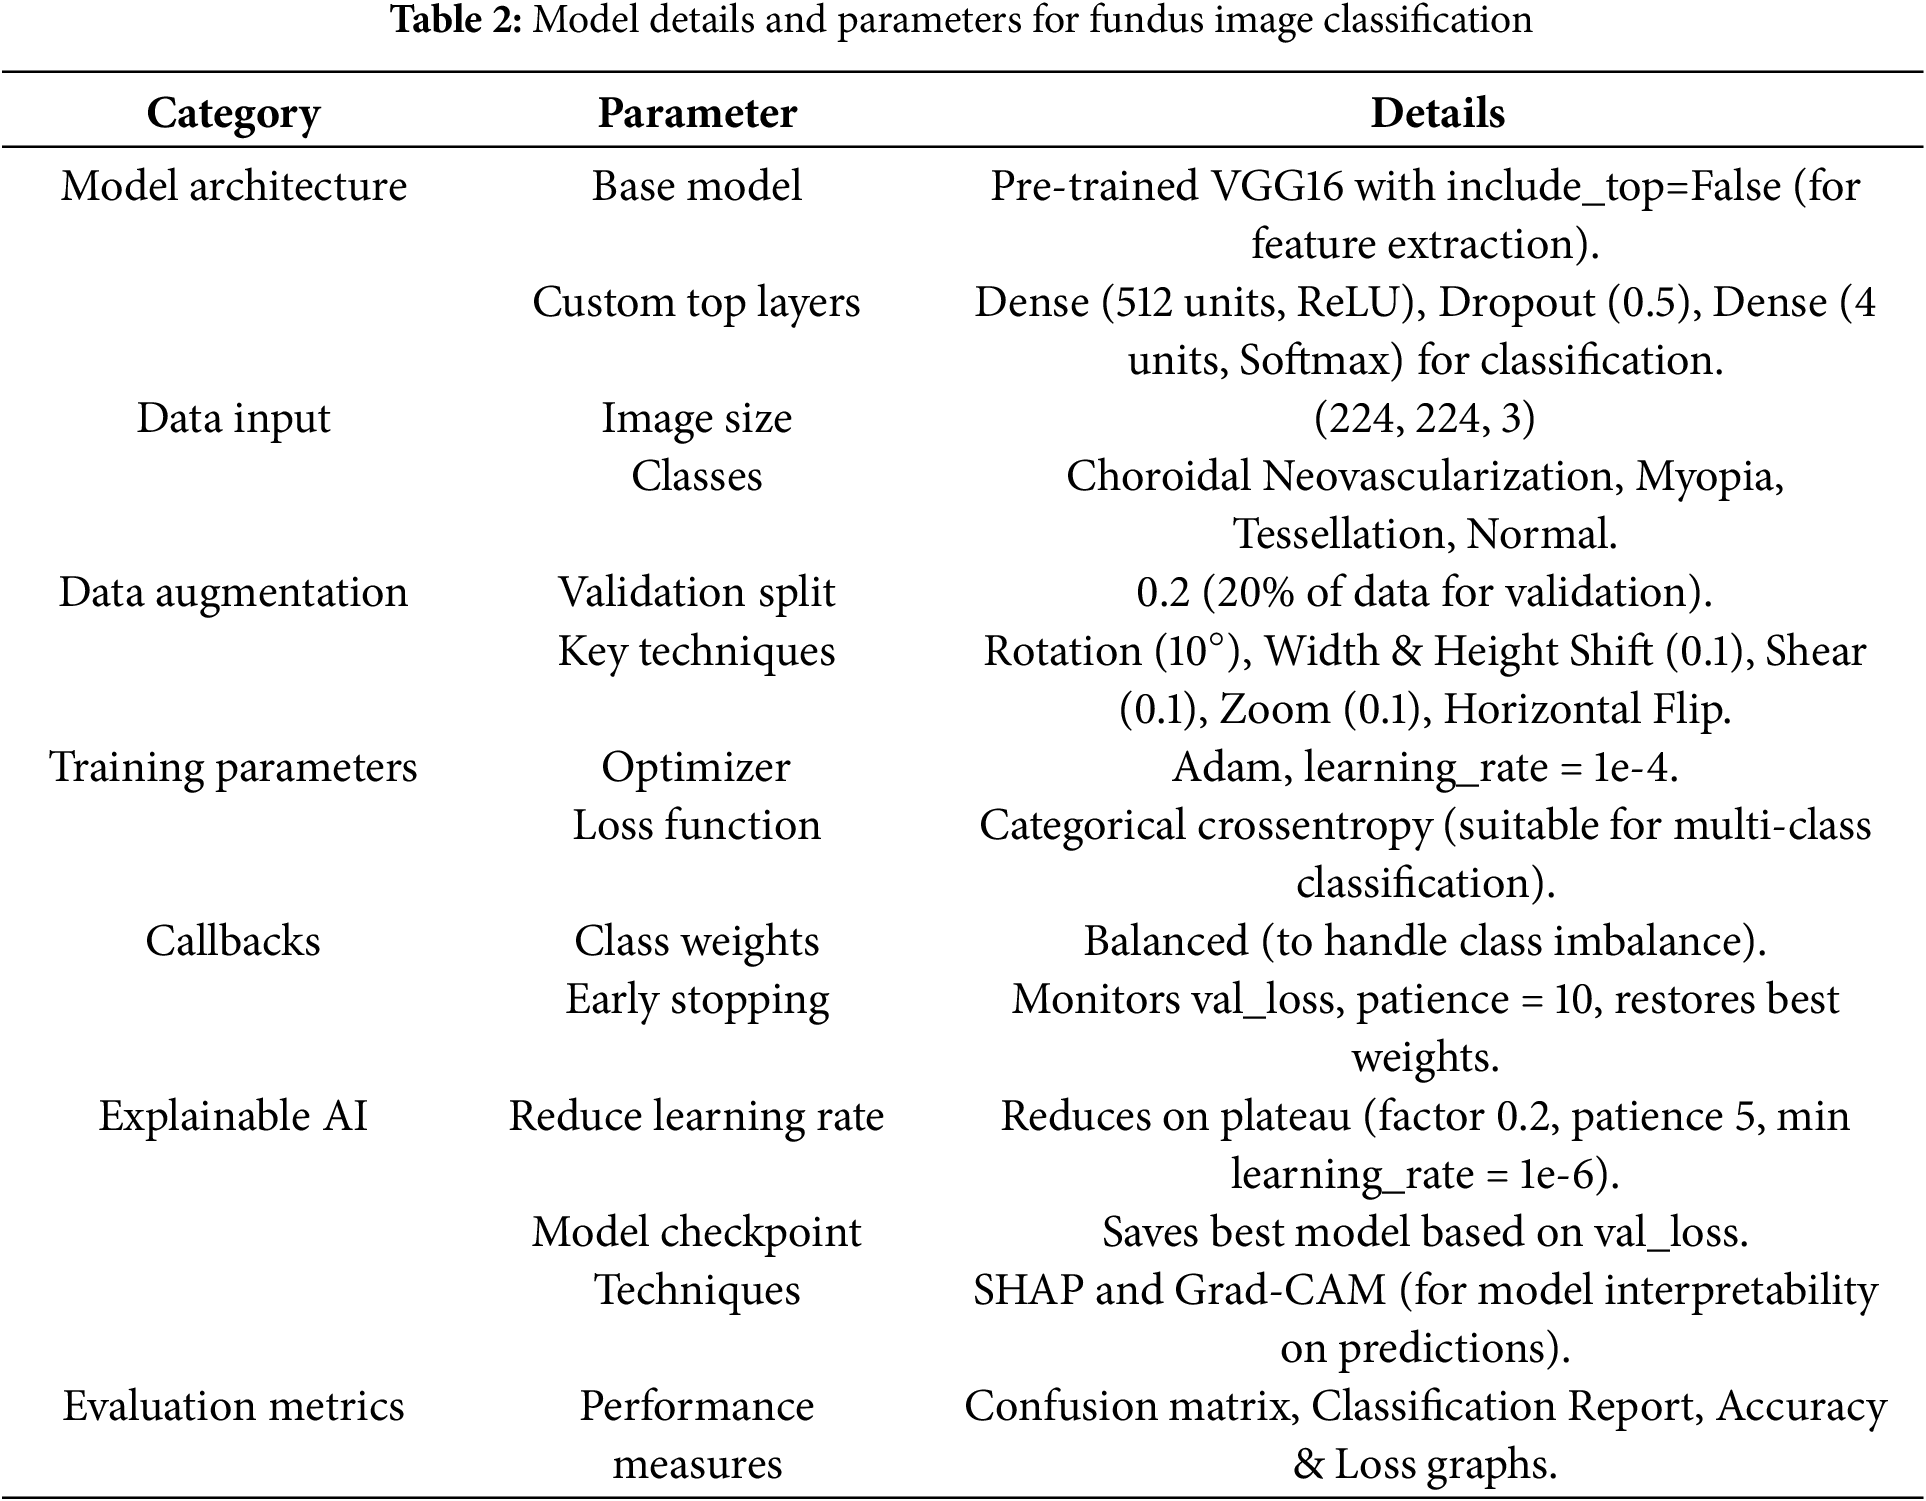
With a learning rate of 1 ×
3.3 Experimental Setup and Specifications
The key hardware and software elements used in the creation and use of a fundus image classification model for the diagnosis of four distinct retinal conditions–choroidal neovascularization, myopia, tessellation, and normal–are compiled in Table 3. The Mendeley-sourced dataset included the annotated photos required for model evaluation and training. In addition to local computing resources for preliminary development and testing, Google Colab’s GPU support was crucial for faster training. In addition, a fundus camera is intended to collect data in real-time, enabling ongoing model validation under actual circumstances.
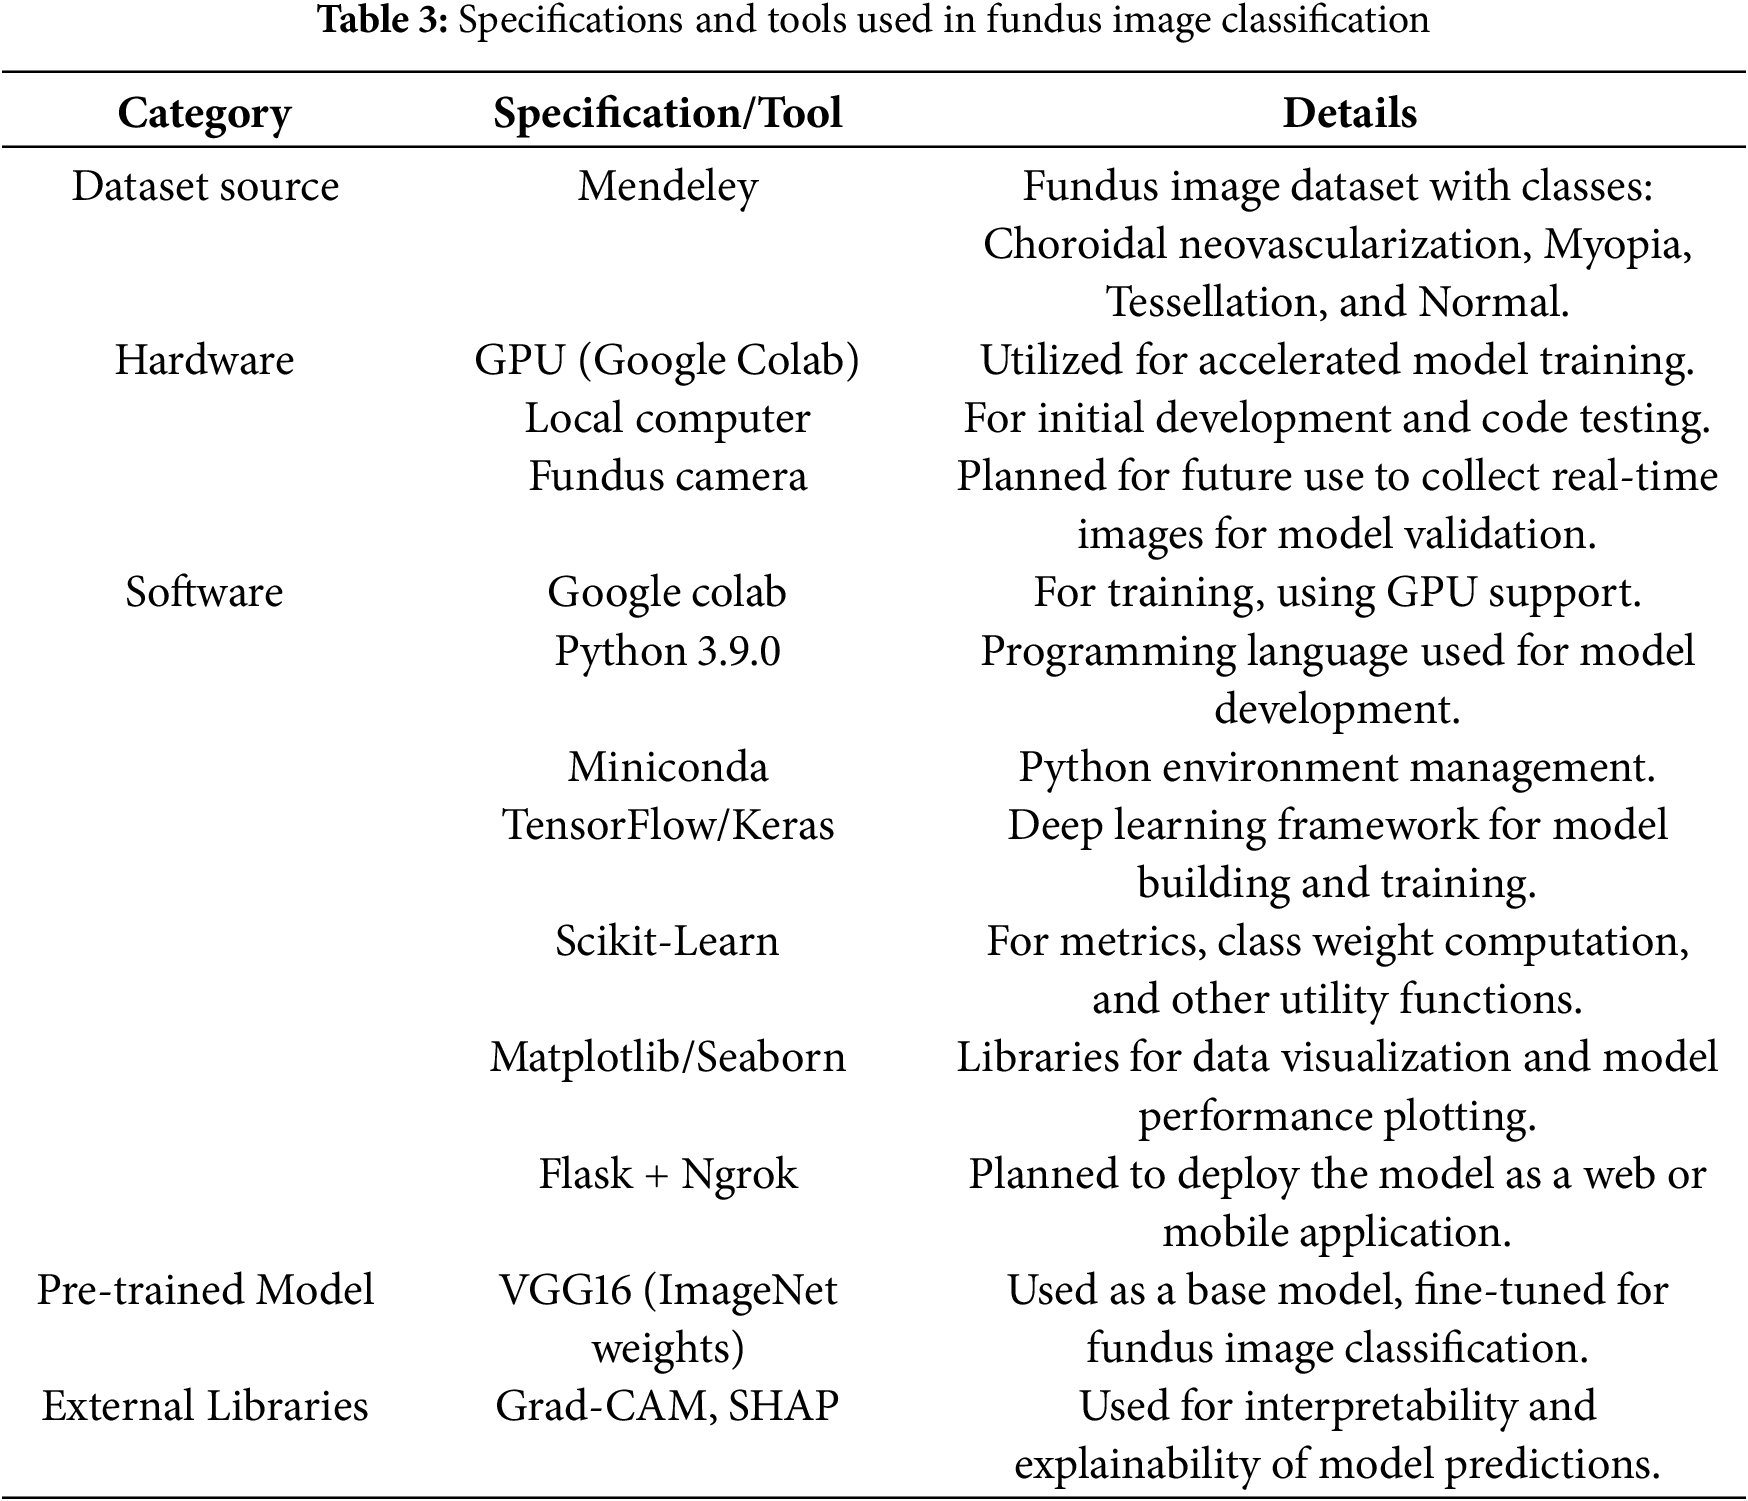
The project mostly used Python 3.9.0, which was controlled by Miniconda and made use of the TensorFlow and Keras libraries to construct and refine a VGG16-based model that was trained on ImageNet. Essential tools such as class weight handling and metrics computations were handled by Scikit-Learn, while data visualization and model performance analysis were made easier with Matplotlib and Seaborn.
Despite advanced models such as Resnet, Densenet and Efficientnet that provide improved performance by increasing complexity and computational demands. Due to the shortage of lower dataset which has limited images, the study can encounter deeper architecture risk overfitting, whereas VGG16 which has a proper regularization such as dropout layers, early stopping and data augmentation mechanisms, will achieve strong generalization in classification.
The major concern about using VGG16 was based on its proven effectiveness in clinical and medical image processing mechanisms towards its simplicity and robustness. Since it is an older architecture that demonstrated strong feature extraction methods in fundus images for classification. In addition it also exhibits structured and layer wise feature representation, that provides models interpretability using explainable artificial intelligence (XAI).
Grad-CAM and SHAP were utilized to improve interpretability for each classed condition by offering visual insights into model predictions. Flask and Ngrok will be used in future deployments as web or mobile applications, enabling real-time diagnostic capabilities and increased accessibility. This thorough setup guarantees that the project has all the tools required for both reliable model creation and possible real-world application.
4 Insights of Empirical Results and Interpretations
This section highlights the effectiveness of the recommended approach by providing a comprehensive assessment of the model’s performance on several criteria. The performance of the proposed framework was evaluated using a series of tests, and the results demonstrated the benefits of the approach.
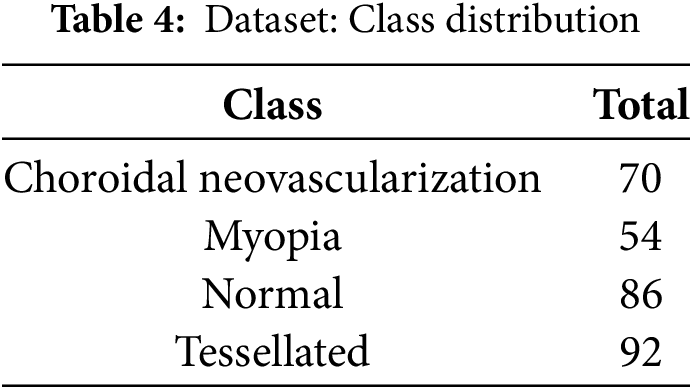
A collection of annotated retinal fundus photos was obtained from Mendeley [41], is depicted in Table 4, and it is the source of the dataset used in this investigation. These pictures include a wide range of classes, including Normal, Myopia, Choroidal Neovascularization, and Tessellation, which makes it easier to train a thorough model for automated disease classification.
This study employed a dynamic class weighting scheme to address the significant class imbalance in the dataset. This targeted strategy for balancing class representation is critical for medical applications where underrepresented conditions must be reliably detected.
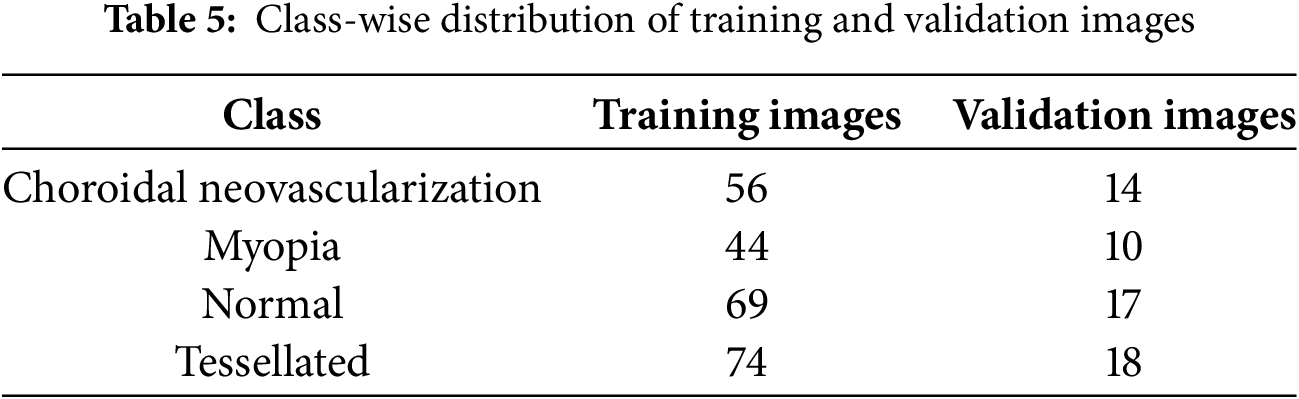
The distribution of training and validation fundus images among the dataset’s various classes is shown in the Table 5. It shows how many photos are allotted to each class, such as normal, tessellated, myopia, and choroidal neovascularization.
The percentage of training dataset, validation dataset and testing dataset of fundus images is shown graphically in the Fig. 5.
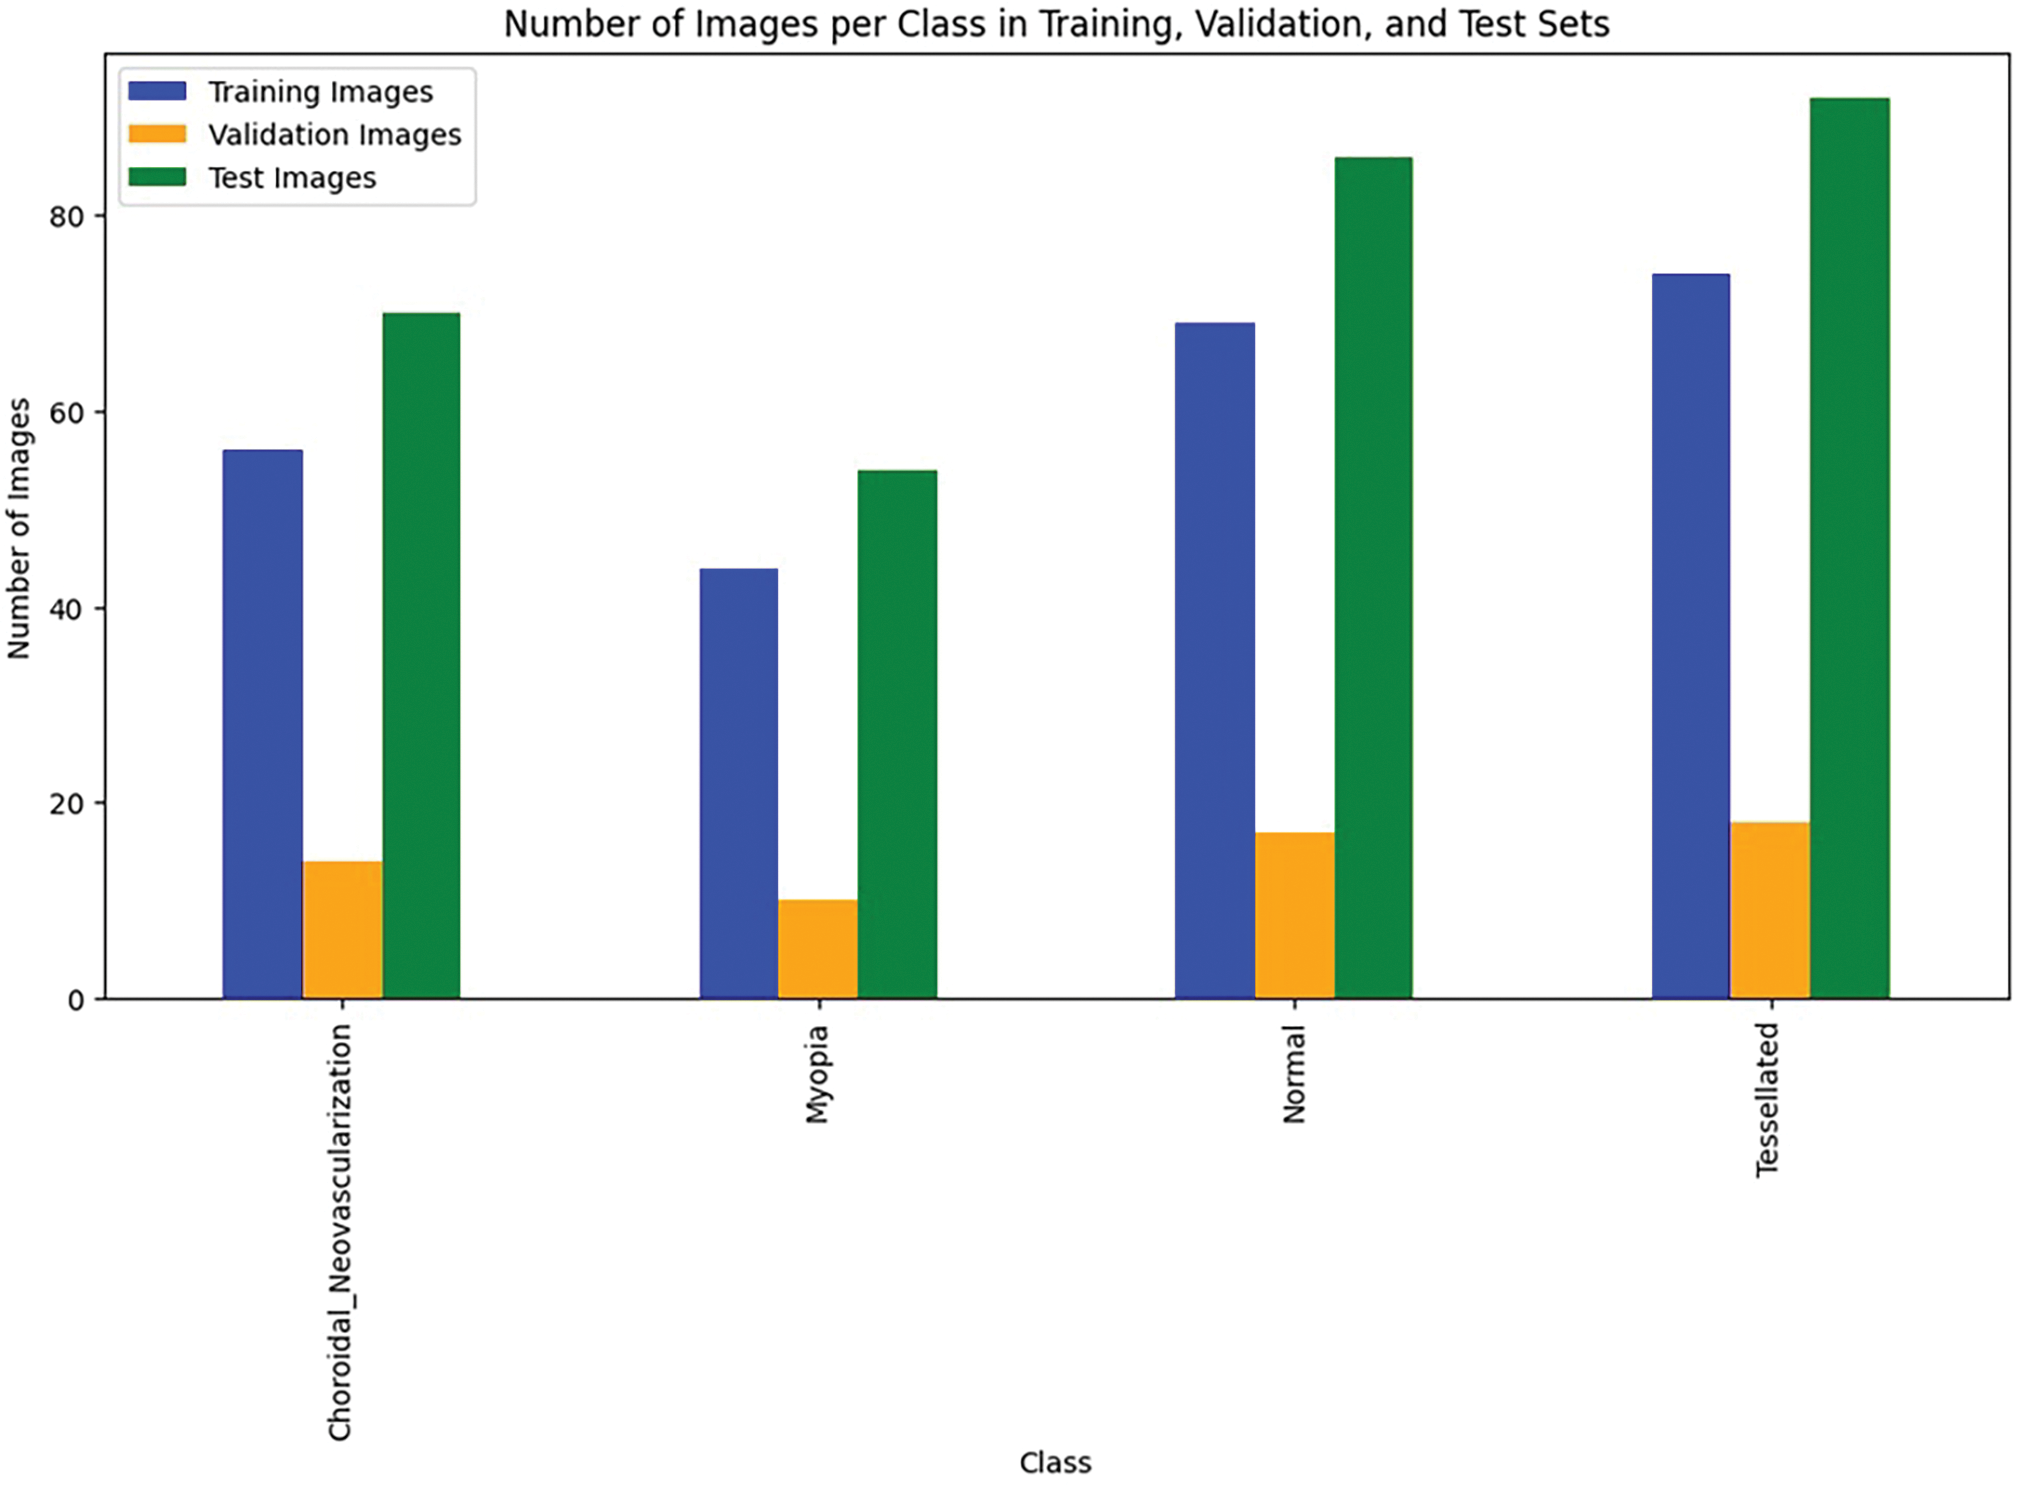
Figure 5: Data utilization
Since the dataset size is less, the study consideres augmentation techniques which include, rotation, flipping, contrast adjustments, resizing and zoom transformation. These techniques expanded the dataset by effectively raising the variability and reducing data imbalance. The study compared toout augmentation to exhibit the impact of augmentation. It obtained an accuracy of 72.3% without augmentation. In addition to that, validation accuracy was raised to 77.5% from 95.3% with F1-score of 0.50% from 0.36%.
The study focuses on the evaluation using the base model VGG16, which is a convolutional neural network architecture with 16 layers–13 convolutional layers and 3 fully connected layers–that is renowned for its deep structure and simplicity. It is useful for feature extraction in image classification applications since it uses small 3 × 3 filters and has a standard architecture. VGG16 is a reliable base model that has been pre-trained on the ImageNet dataset. It is frequently adjusted for particular uses such as fundus picture classification and medical image analysis.
The high-level features that the network learned from the input photos of various retinal states are visualized by the feature maps that were extracted from the VGG16 model is shown in Fig. 6. Specific patterns, textures, and forms that the model determines are important for classification are captured in each feature map. These feature maps, for example, can show how the model differentiates between minute changes in retinal structure and anomalies in the context of fundus pictures that depict choroidal neovascularization, myopia, normal conditions, and tessellated patterns. The feature maps’ varied patterns demonstrate how the model can concentrate on important details such as vascular alterations, pigmentation variances, and structural anomalies specific to each ailment.
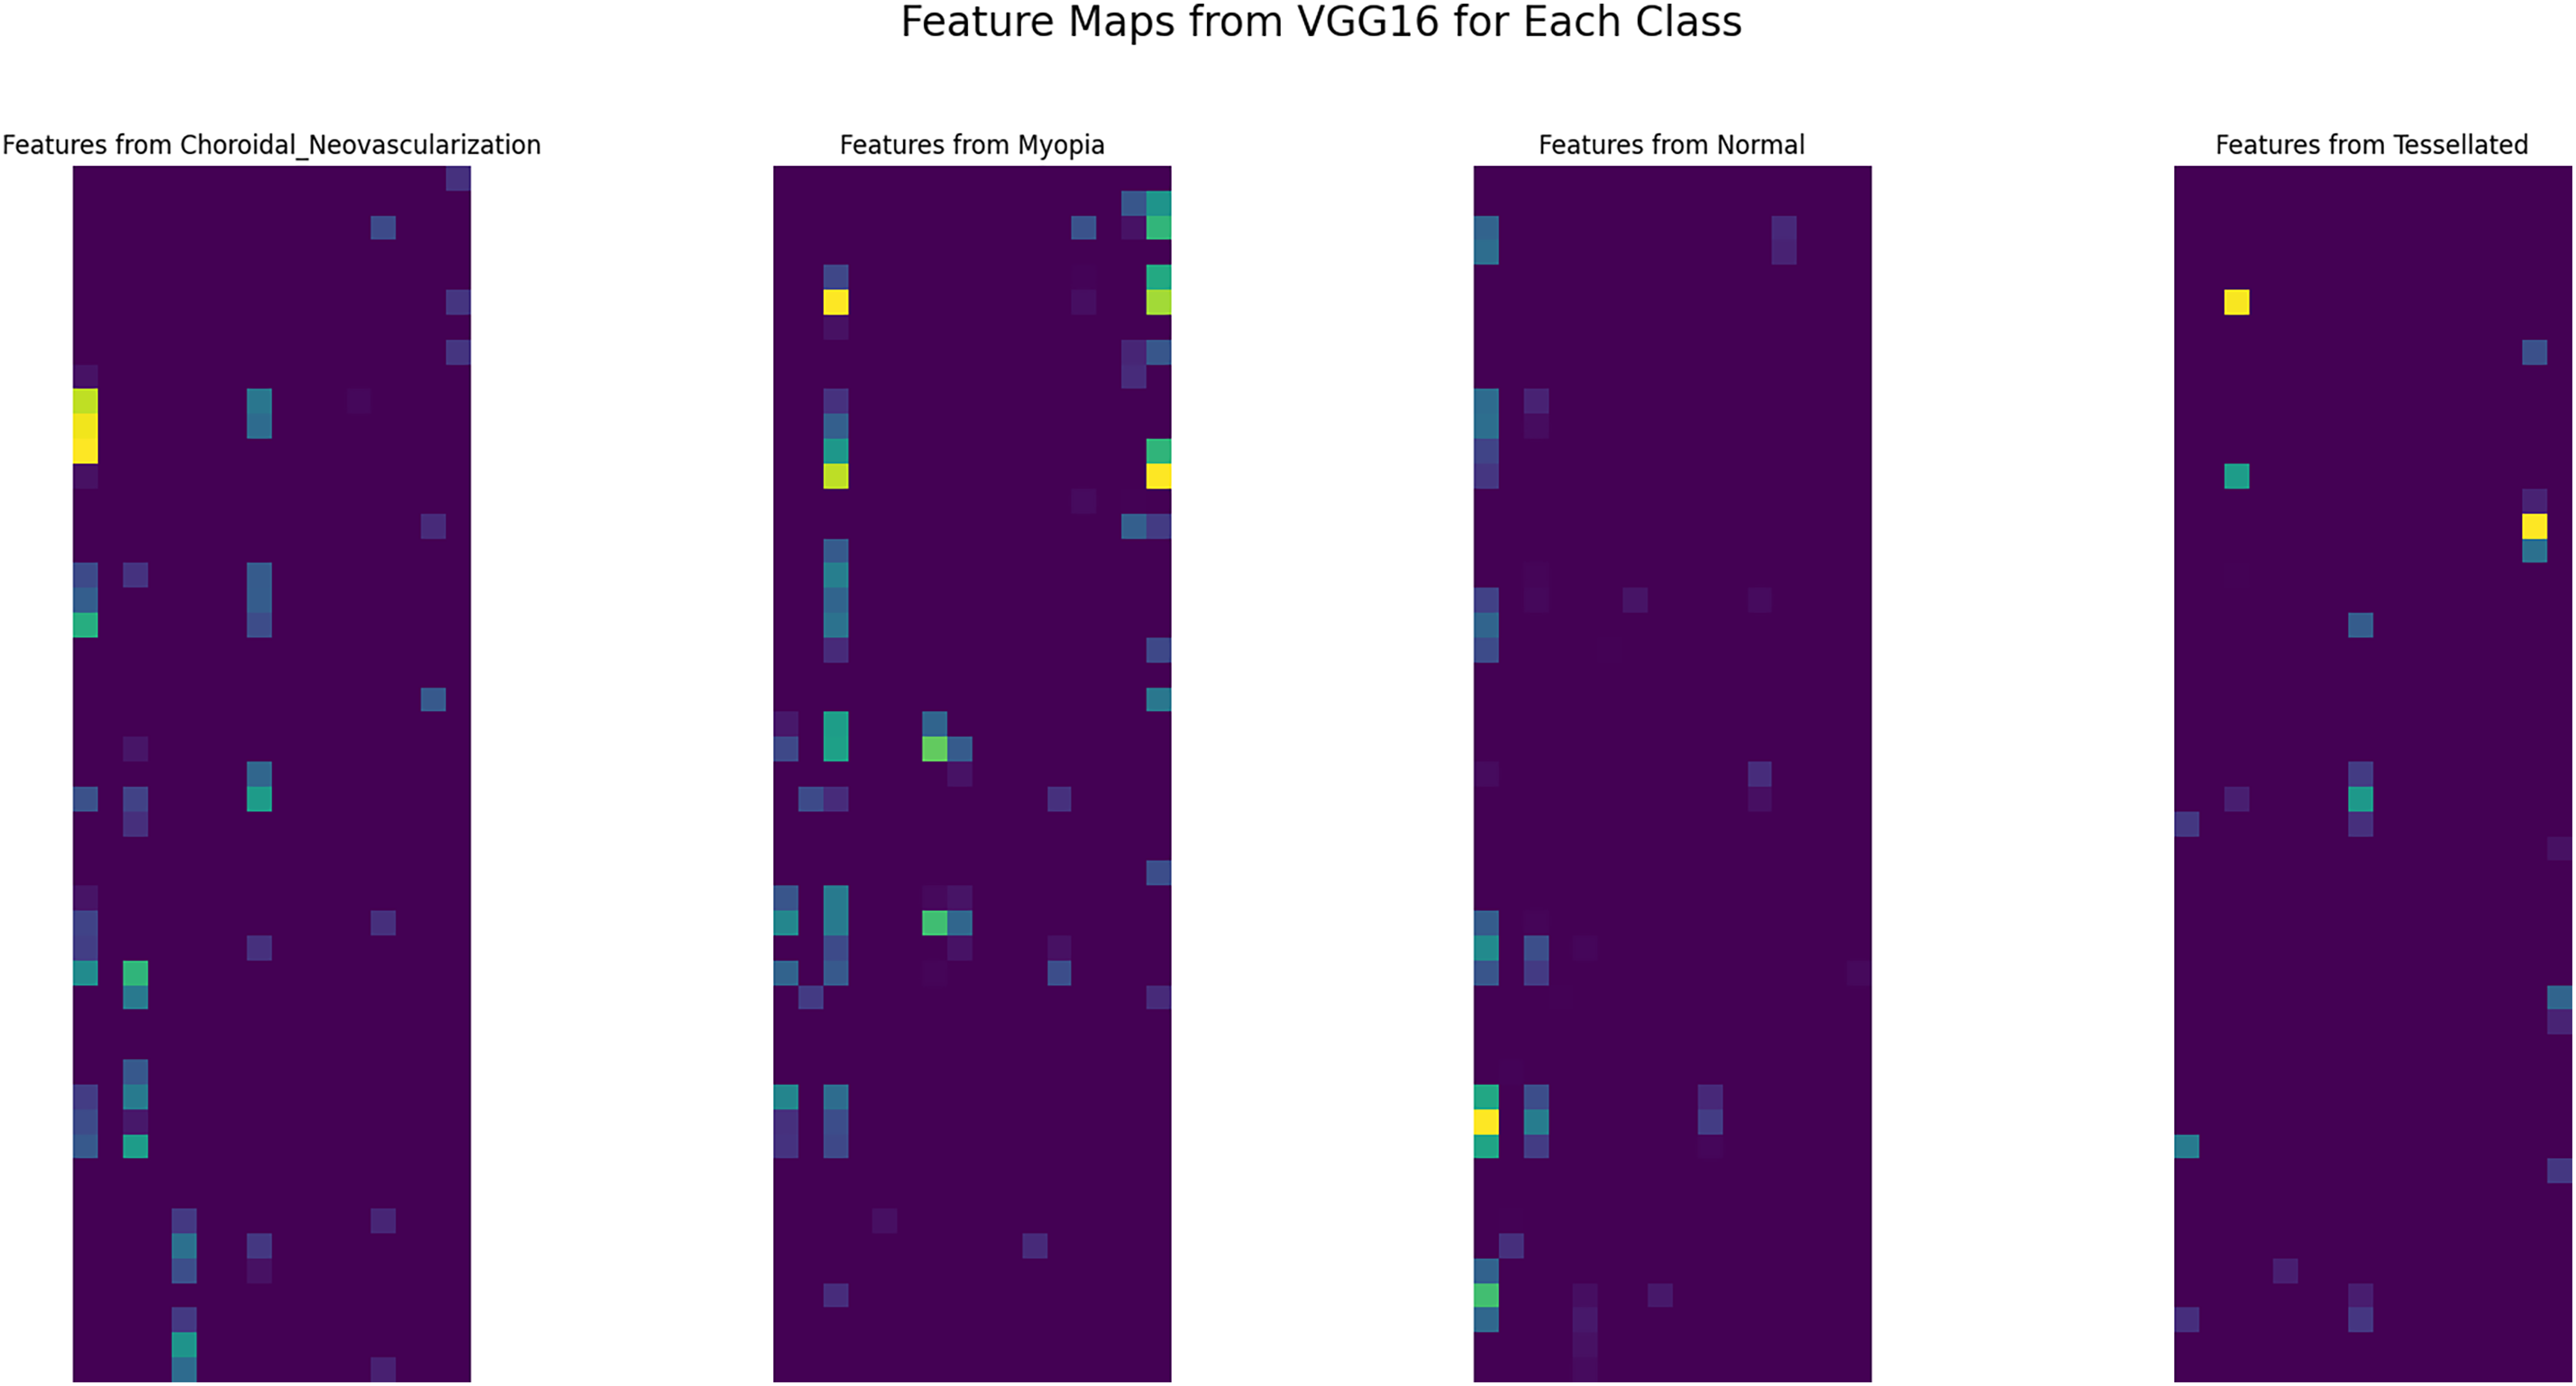
Figure 6: Extracted features from VGG16 base model
Examining these characteristics improves interpretability and helps comprehend the model’s decision-making process, both of which are essential for clinical applications in ophthalmology. All things considered, the feature maps that are displayed demonstrate how well the VGG16 design captures the fine features necessary for precise retinal disease classification.
The results vary from the model alone and revised parameters upgradation. Even after the successful upgradation of the model, there is no correct prediction and unsatisfactory results are formulated. This study uses fine-tuning in the last Test case, which has a satisfactory results and appropriate predictions are shown.
There are 27,562,308 parameters in total–12,847,620 of which are trainable and 14,714,688 of which are not. The non-trainable parameters take up 56.13 MB of RAM, whereas the trainable parameters take up 49.01 MB. Callbacks, such as early stopping, learning rate decrease, and model checkpointing, were created to maximize model performance during training. If, after ten epochs, the validation loss does not improve, early stopping keeps an eye on it and restores the optimal weights. When the validation loss reaches a plateau, the learning rate is lowered by a factor of 0.2, with 1e–6 as the minimal learning rate. The best model based on the validation loss is saved using model checkpointing.
Although 50 epochs were allotted for the training procedure, the callback circumstances caused the training to end at epoch 23. The model’s training accuracy at epoch 23 was 82.3%, while its training loss was 0.48. At this stage, the validation loss was 0.78 and the validation accuracy was 59.3%. As part of the learning rate reduction callback, the learning rate was lowered to 2.0e-05, which improved the model’s performance.
The training and validation performance over epochs are found in the model accuracy and loss curves as shown in Fig. 7. Although the loss curve demonstrates the decrease in error across the training process, the accuracy curve shows how the model performs better on both the training and validation sets. A consistent rise in training accuracy shows effective learning and a commensurate decline in training loss, when combined with validation metrics. However, a discrepancy between training and validation performance can indicate that the model needs further work.
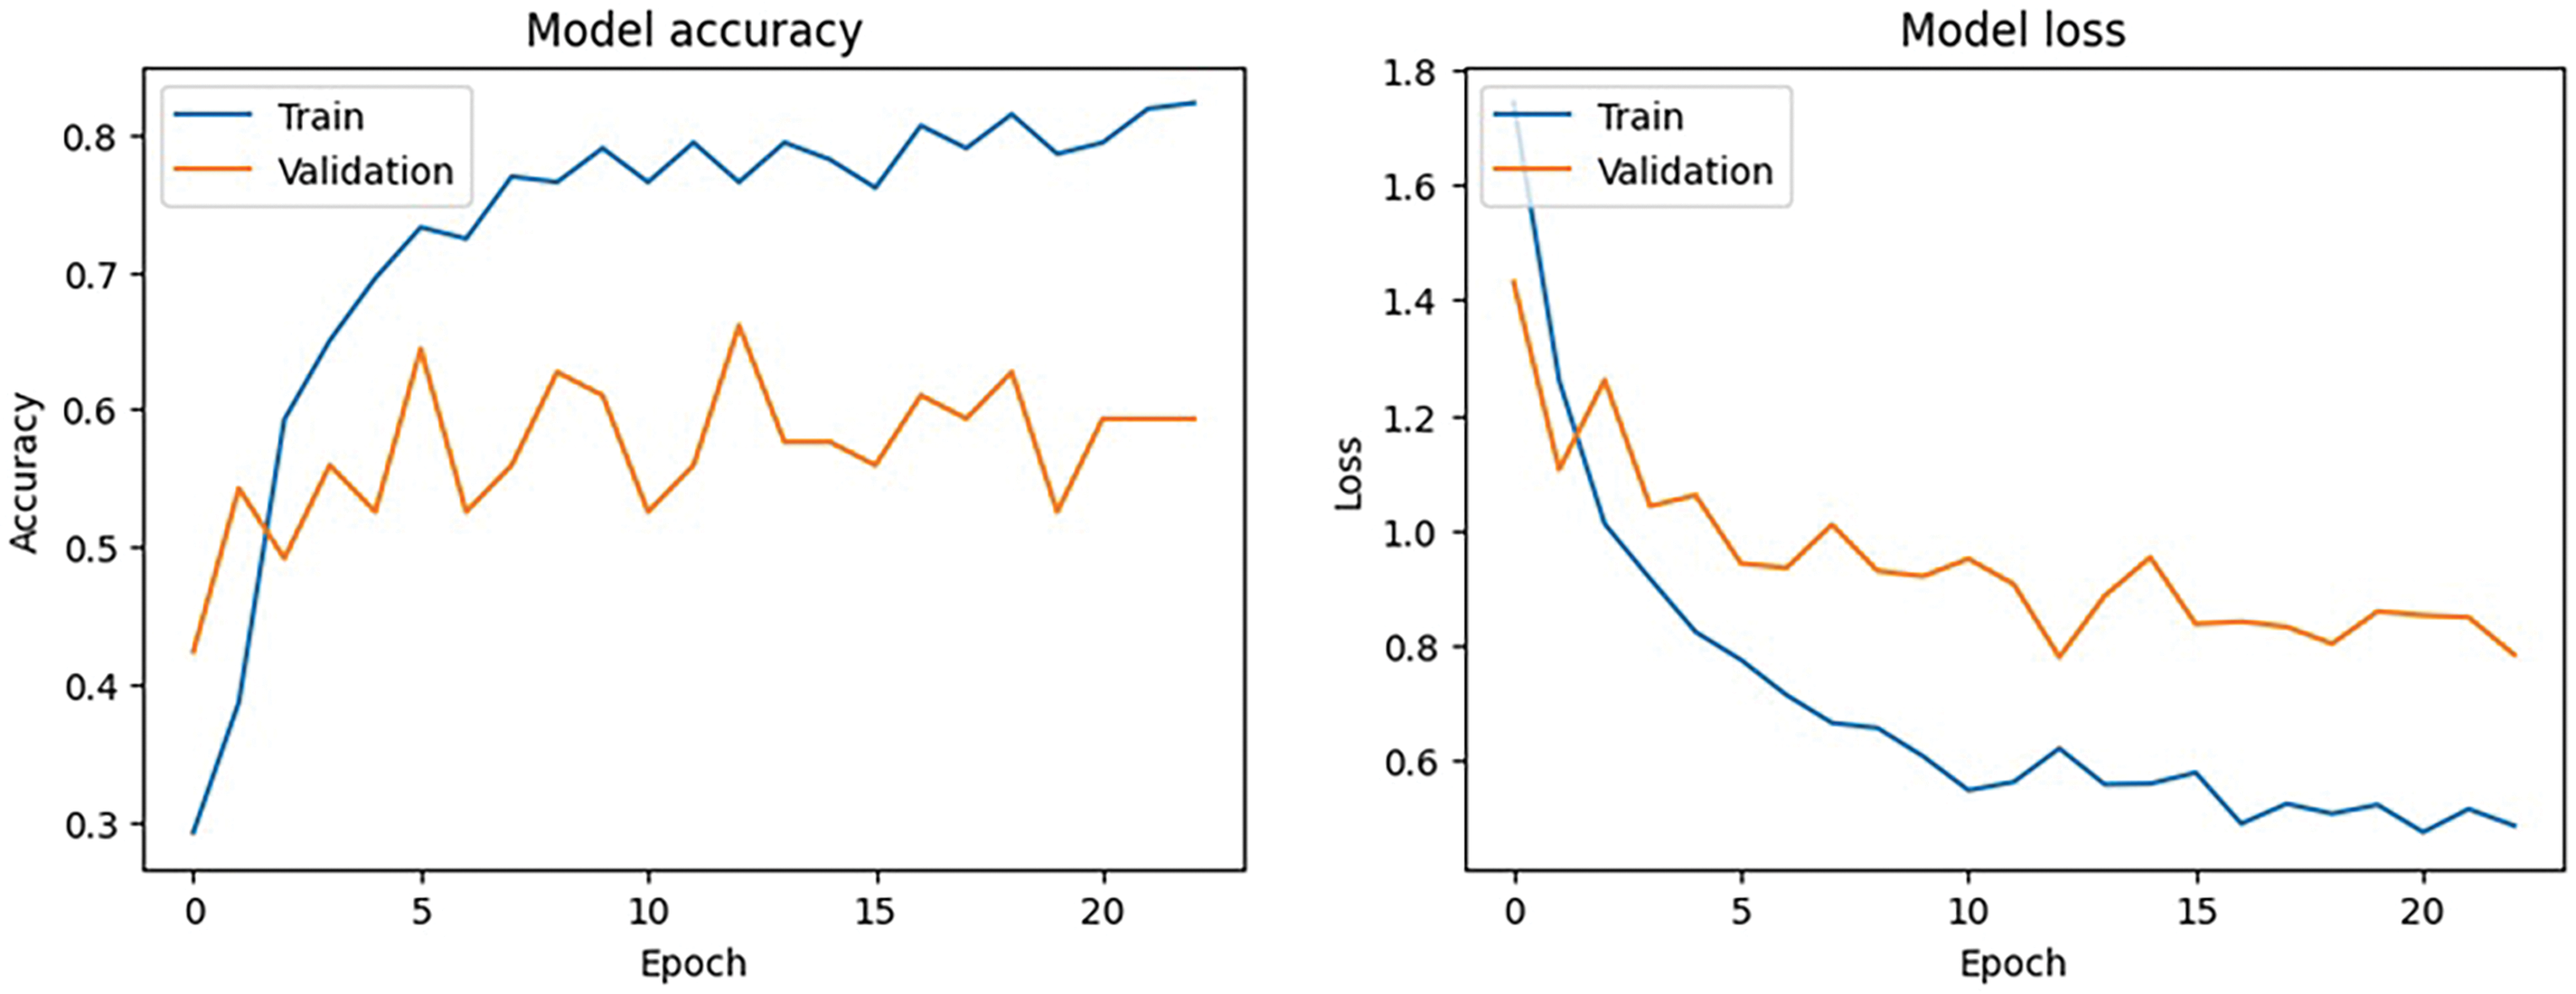
Figure 7: Model accuracy and loss performance
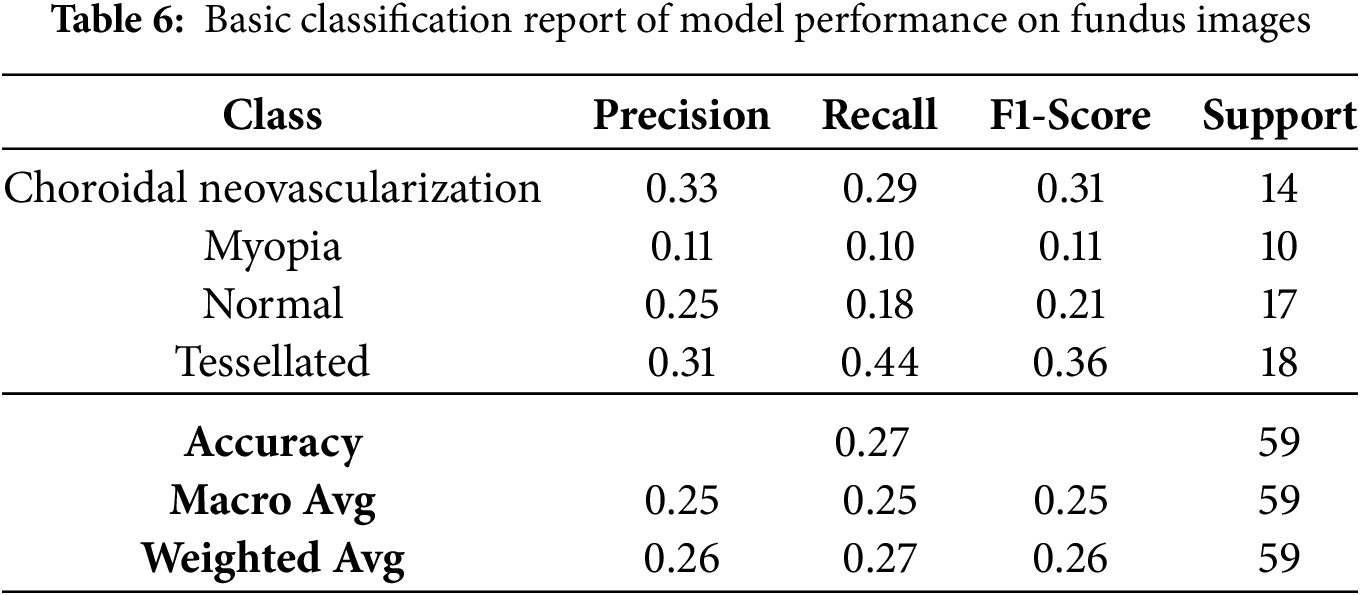
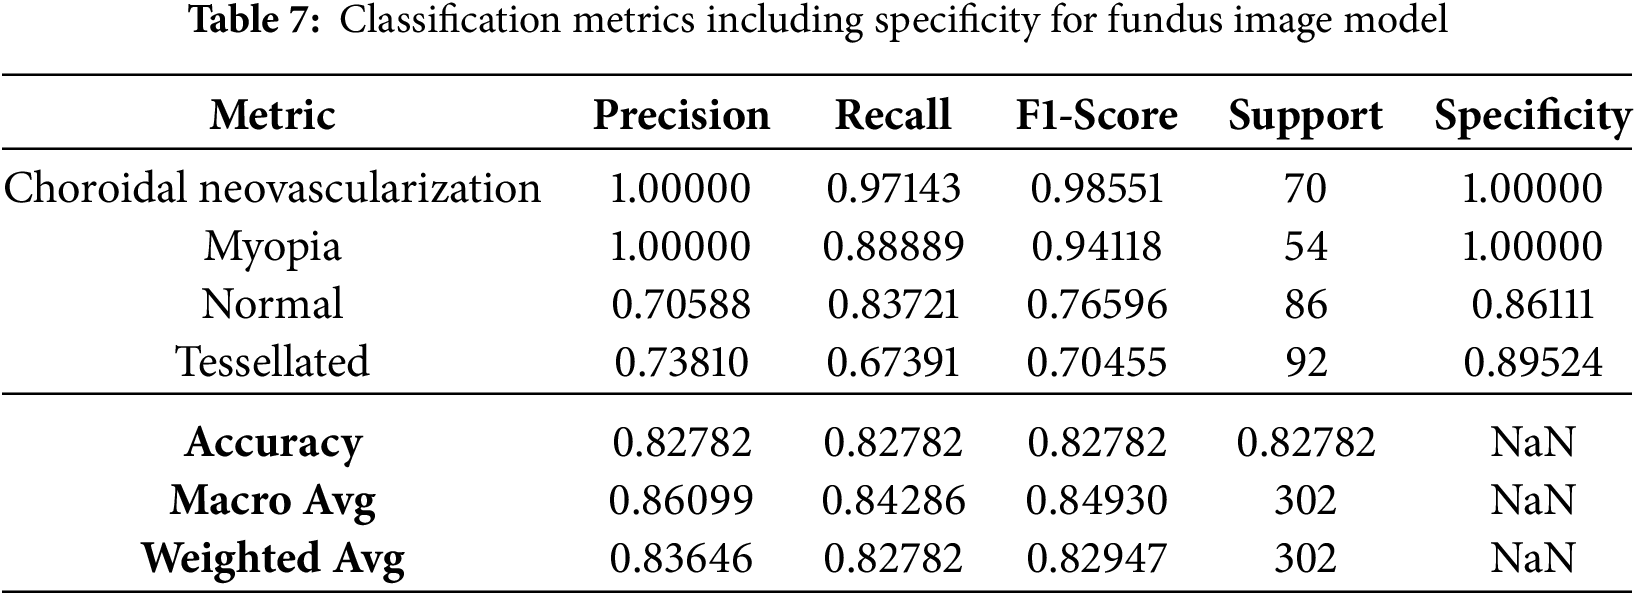
The basic classification report shown in Table 6 of the VGG16 model has fluctuating results which inturn needs some improvement. The data frame evaluation report is depicted in the Table 7. The model seeks some modifications to be done with respect to parameter upgradation by changing the callbacks.
Based on the study’s confusion matrix shown in Fig. 8, the model is not the best at identifying “Tessellated” fundus images, making 8 out of 18 accurate predictions. But it has trouble with “Choroidal Neovascularization” and “Myopia,” because other classes were misclassified several times. The fact that “Choroidal Neovascularization” and “Tessellated” were frequently mistaken for one another indicates that it is difficult to tell the two disorders apart. The accuracy of the model can probably be increased overall by fine-tuning the characteristics or modifying the weights assigned to each class.
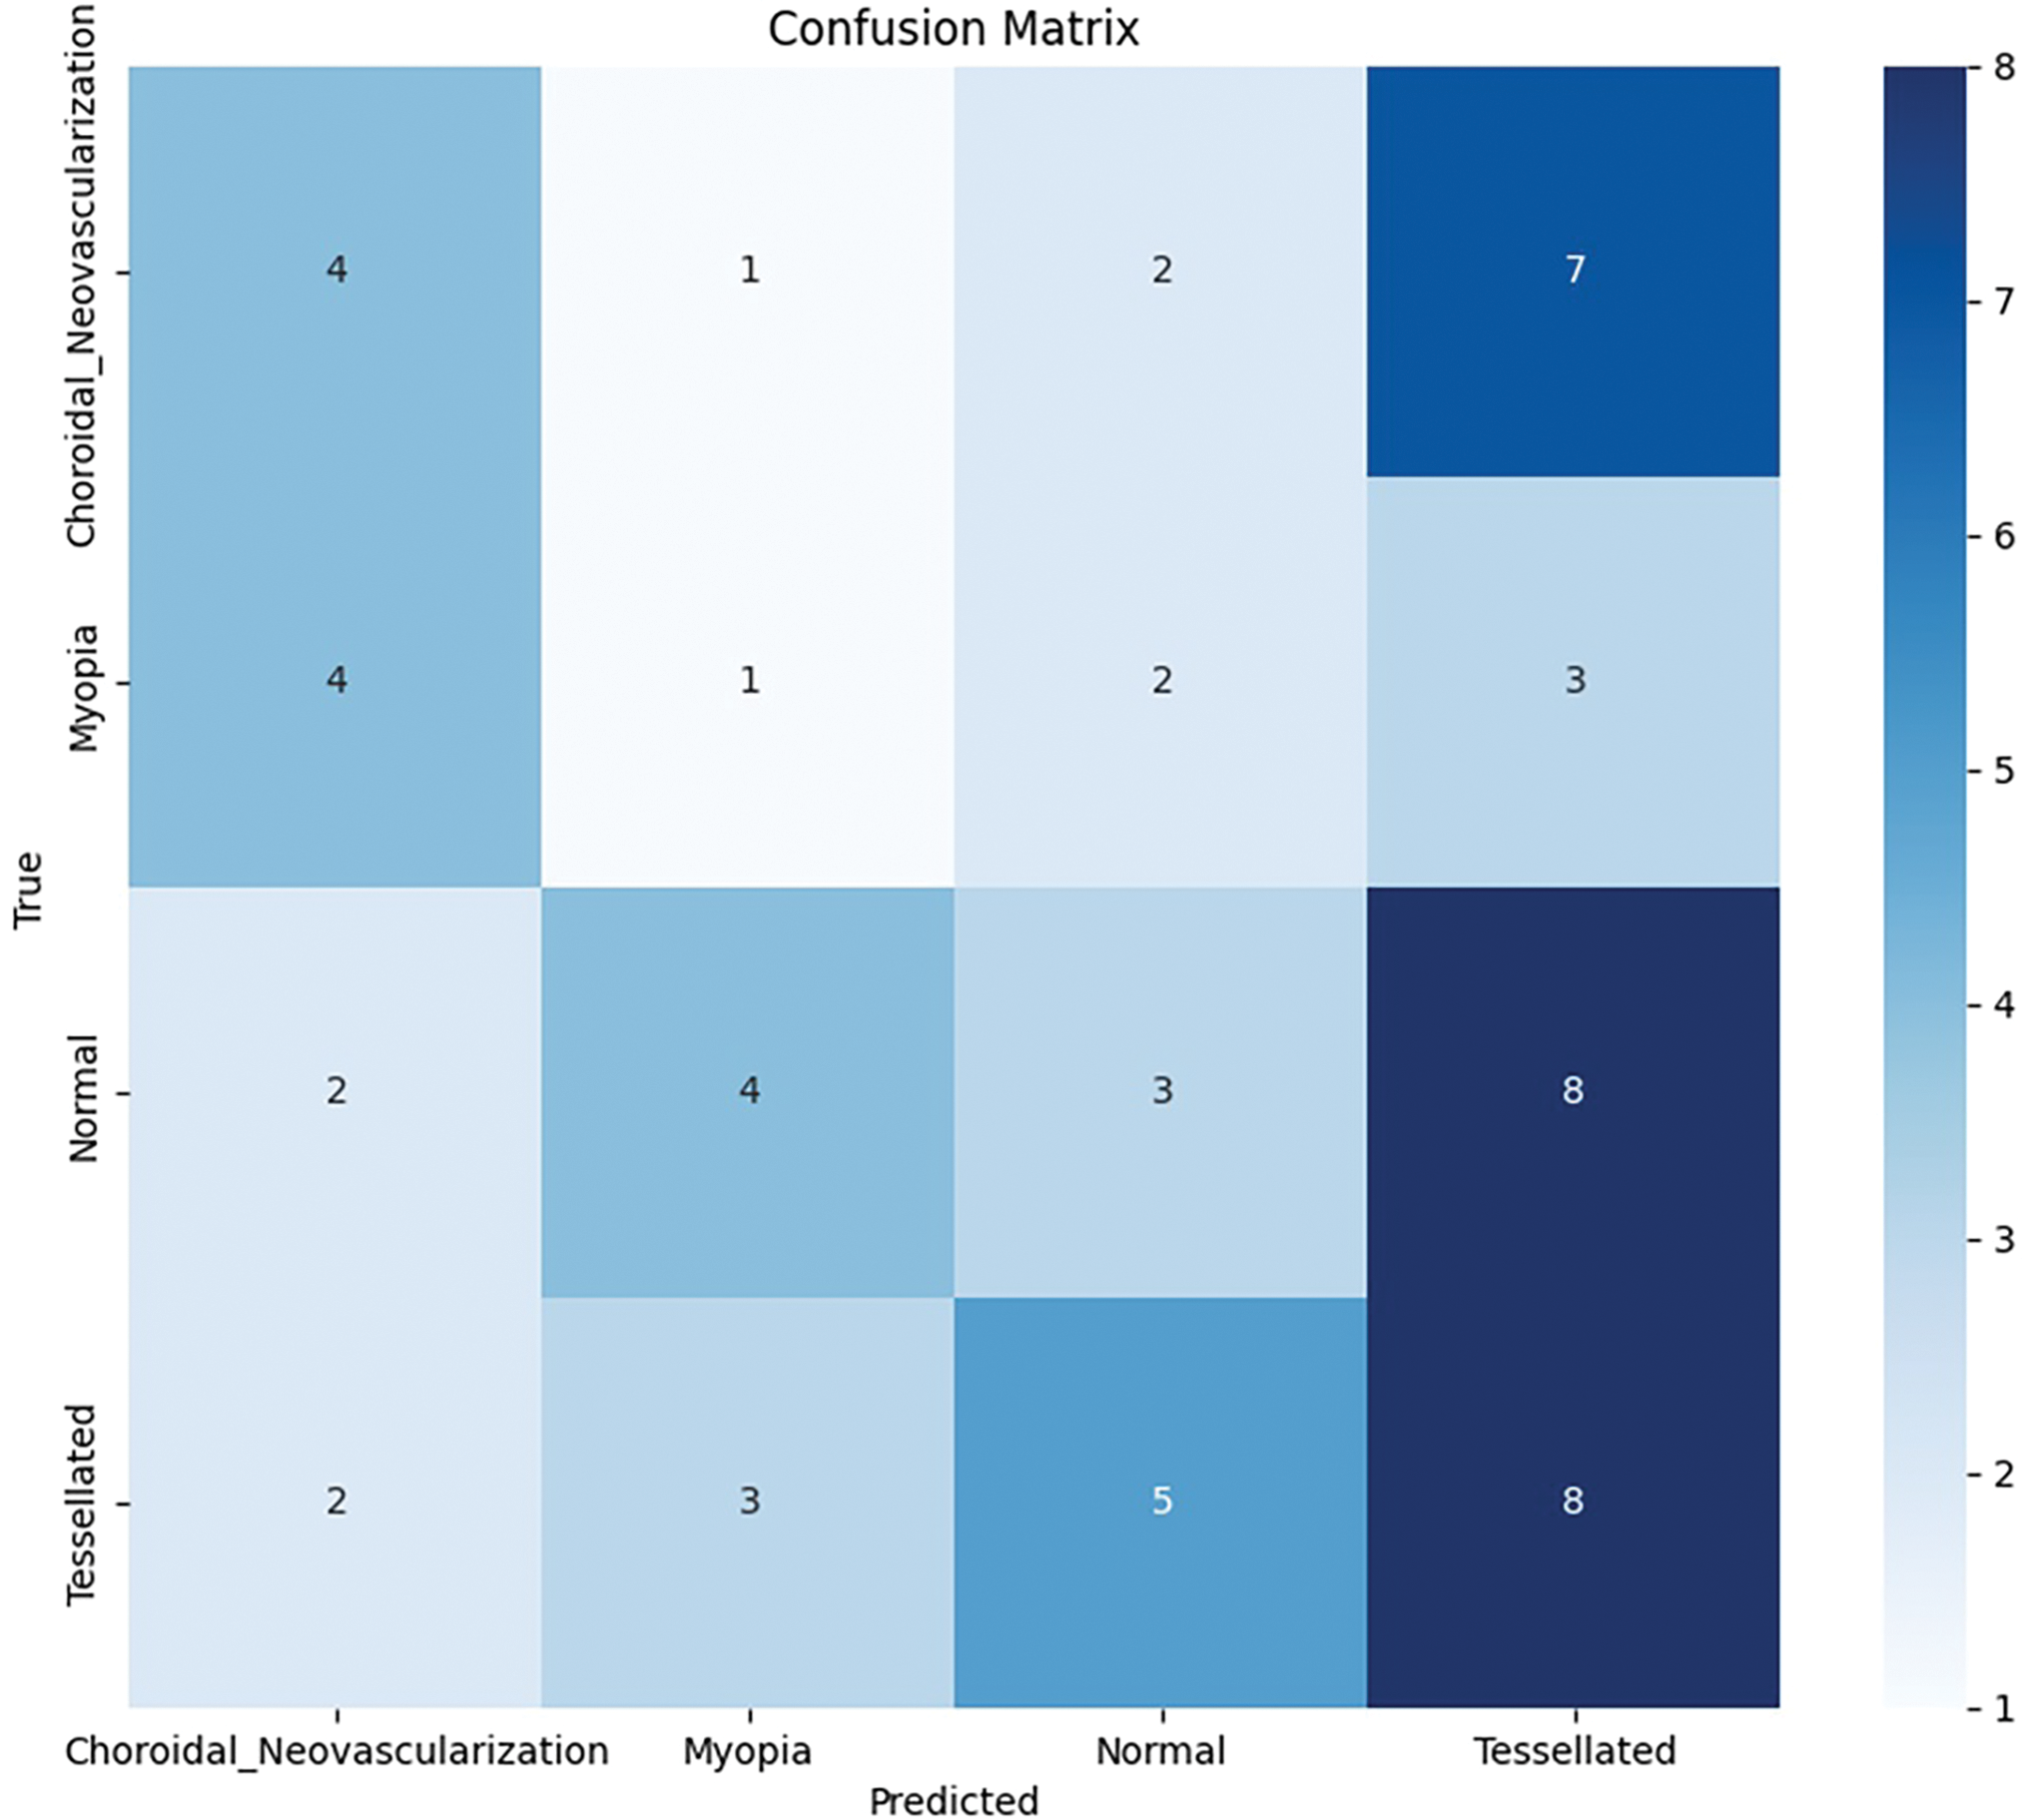
Figure 8: Base model: Confusion matrix analysis
After running the model, it a few test cases were run which provides better results in predicting Normal fundus image, as shown in Fig. 9 and Tessellated fundus image as shown in Fig. 10. The interpretation is given with XAI (Explainable Artificial Intelligence) using SHAP (SHapley Additive exPlanations) as shown in Fig. 11, which gives us a better explanation of the pathologies which are identified. This study also considers specialized preprocessing techniques, such as contrast enhancement and vessel segmentation, which emphasize variation of tessellated and normal images.
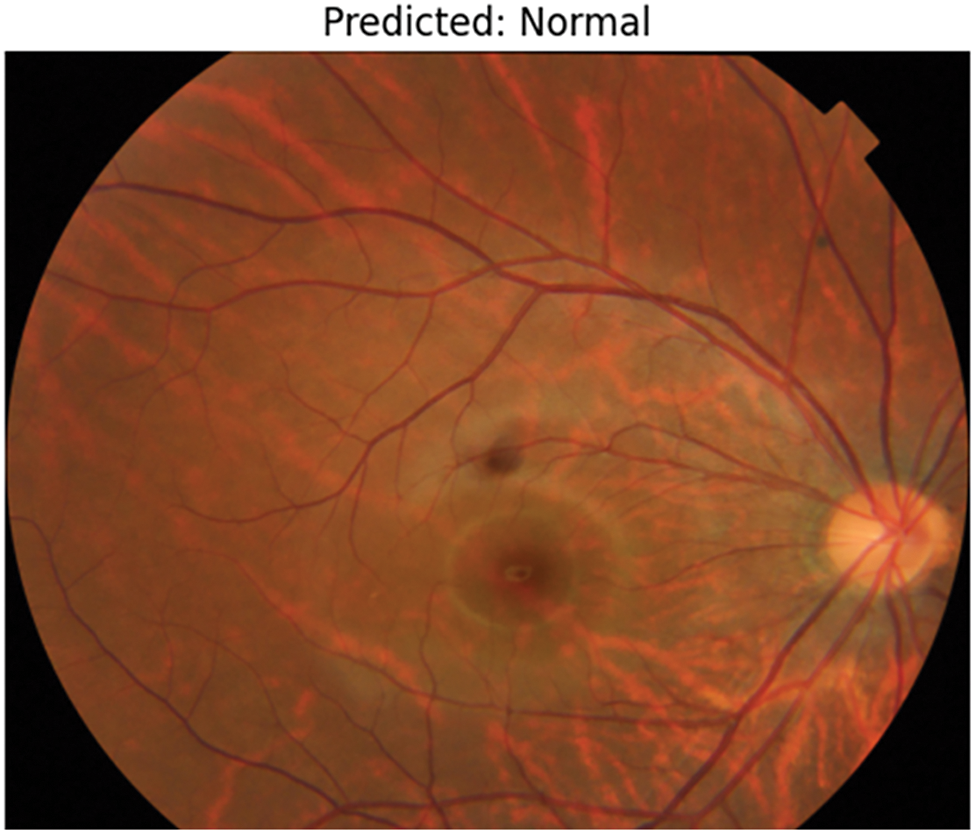
Figure 9: Prediction of normal image
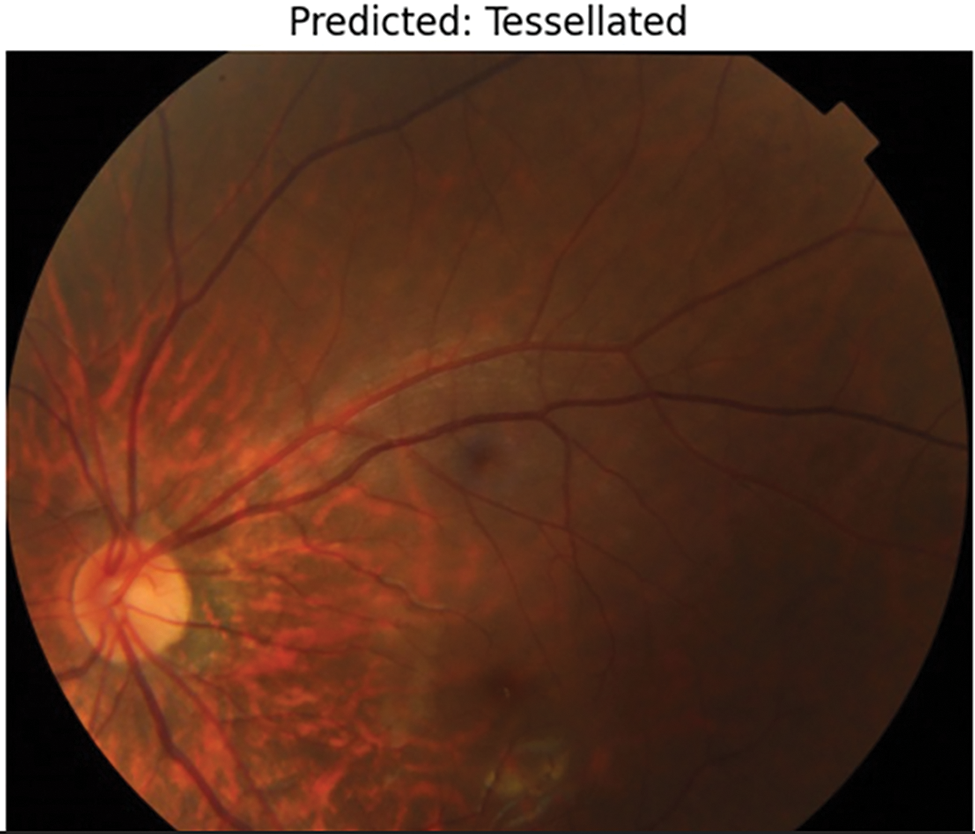
Figure 10: Prediction of tessellation image
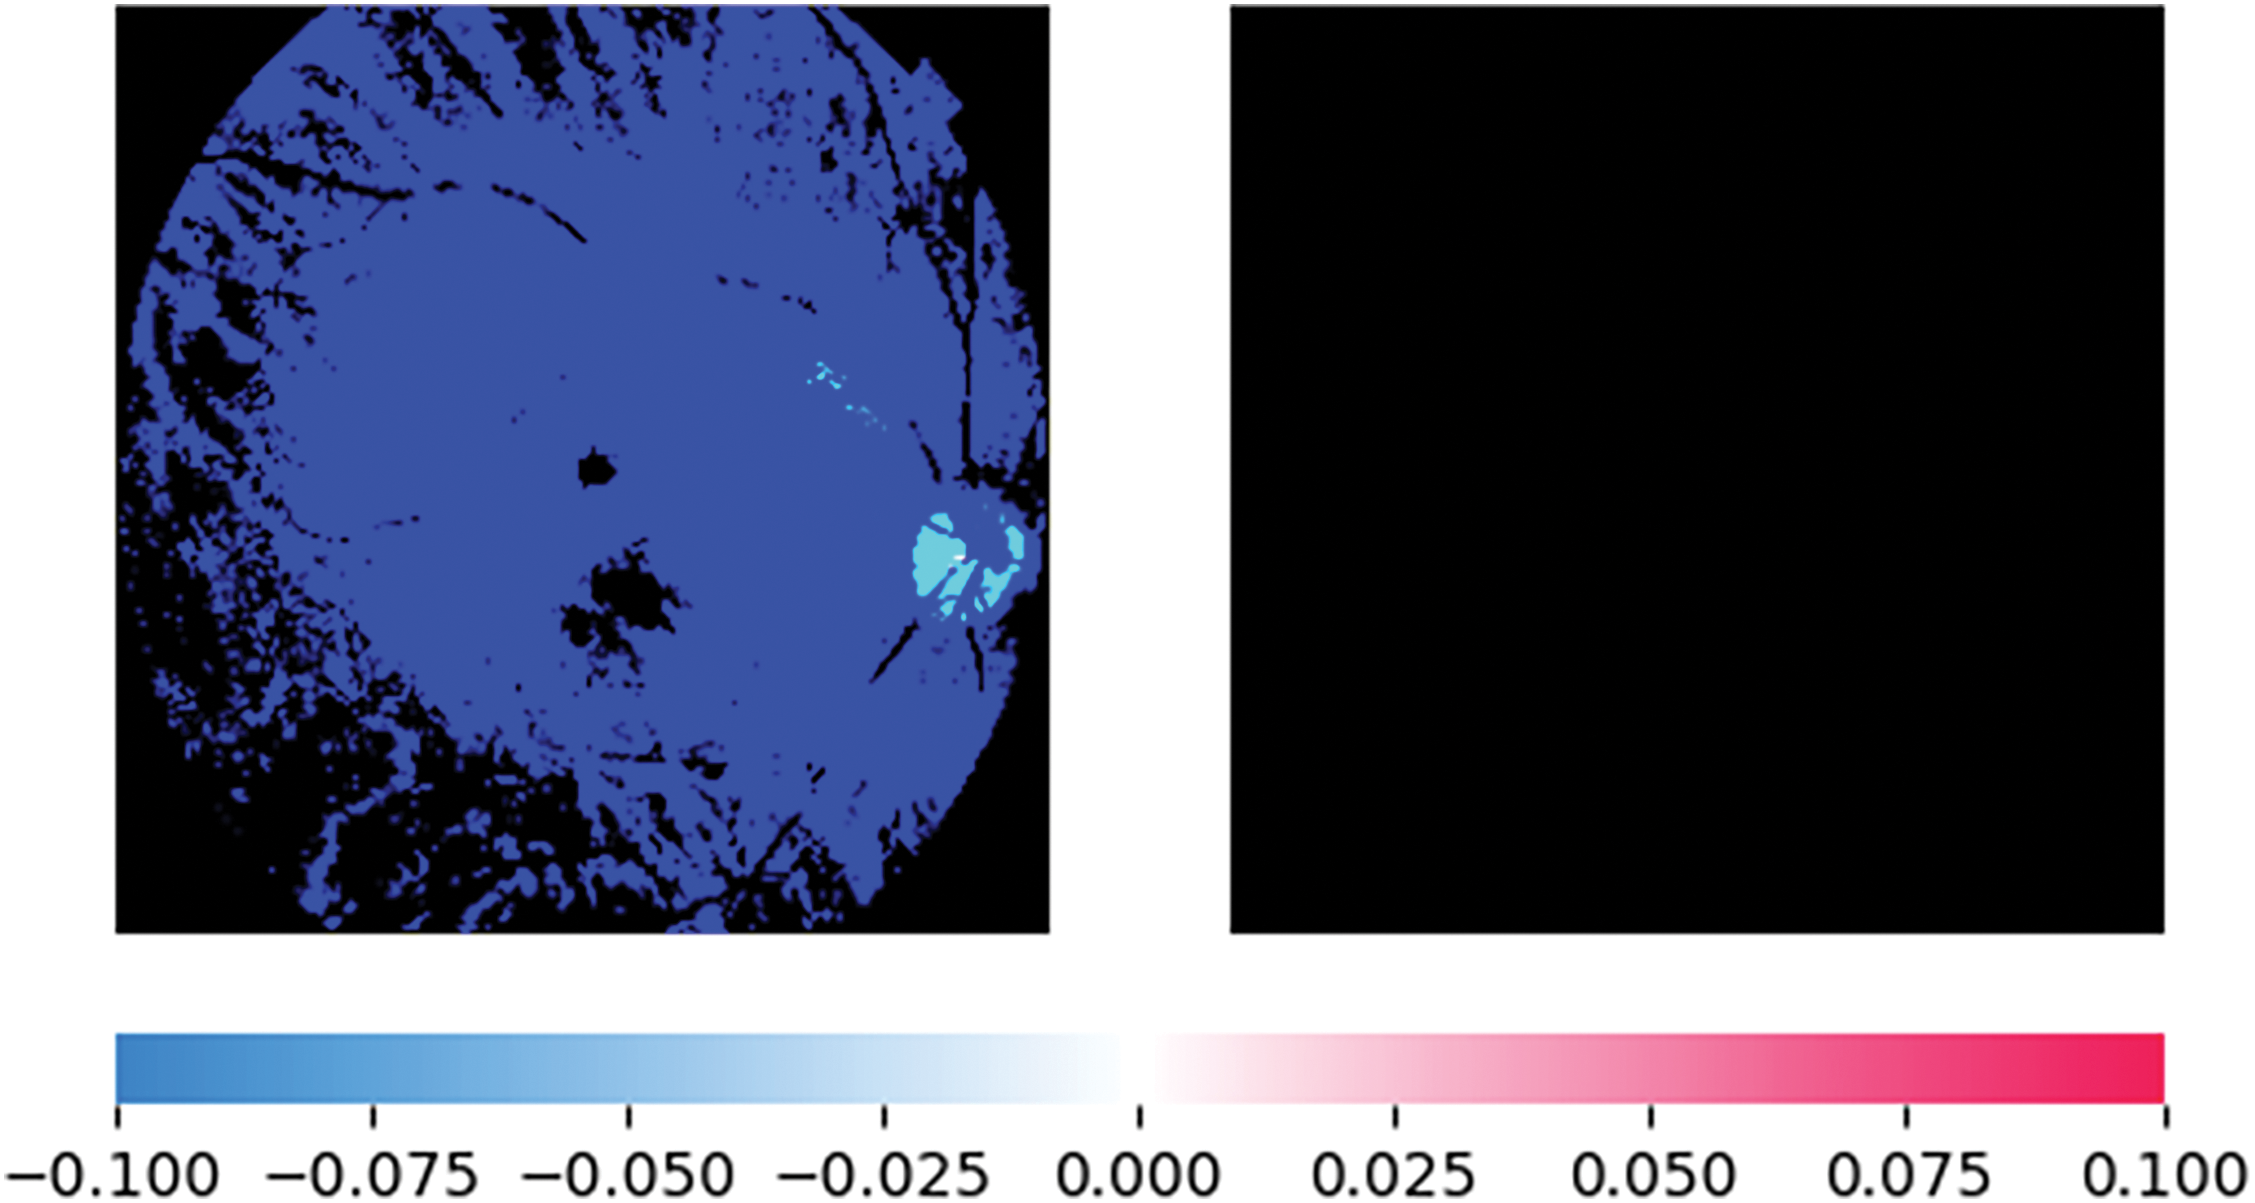
Figure 11: XAI representation using SHAP for normal fundus image prediction
4.4.2 Test Cases 2 with Modified Callbacks
Multiple callback methods were added to the model training process to improve performance and manage overfitting. Early stopping was first employed to avoid overfitting, early stopping was first used, monitoring val_loss with a 10-epoch patience. This stops training as soon as validation performance reaches a plateau. This callback is configured to restore the weights of the top-performing model to guarantee that the final stored model represents the ideal epoch during training, this callback is configured to restore the weights of the top-performing model.
In addition, learning rate reduction on the plateau was implemented, which observed val_loss and, if there was no improvement for five consecutive epochs, reduced the learning rate by a factor of 0.2. As the model gets closer to convergence, this adaptive adjustment enables it to fine-tune weights at a more detailed level, improving performance without going overboard. A minimal learning rate of 1 ×
The training results at epoch 11 show a notable difference between training and validation performance following model modification using different callbacks and optimization strategies. With a training loss of 0.3947 and a final training accuracy of 83.54%, the model demonstrated robust learning and training data fit. The model can still be having trouble successfully generalizing to unknown data, though, as the final validation accuracy is 59.32%, with a validation loss of 0.8021. The ReduceLROnPlateau callback lowered the learning rate to 1 ×
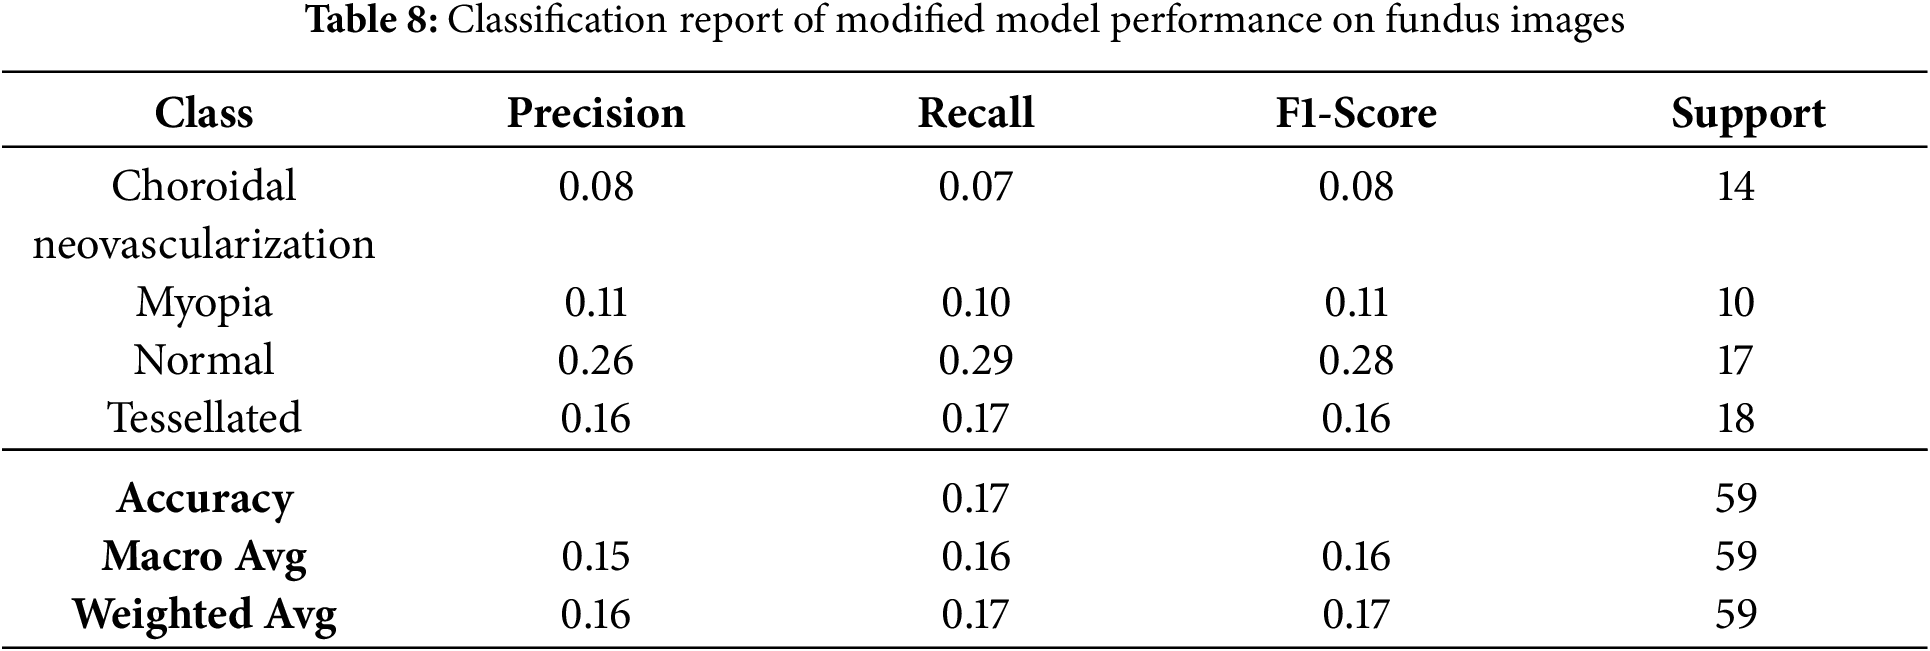
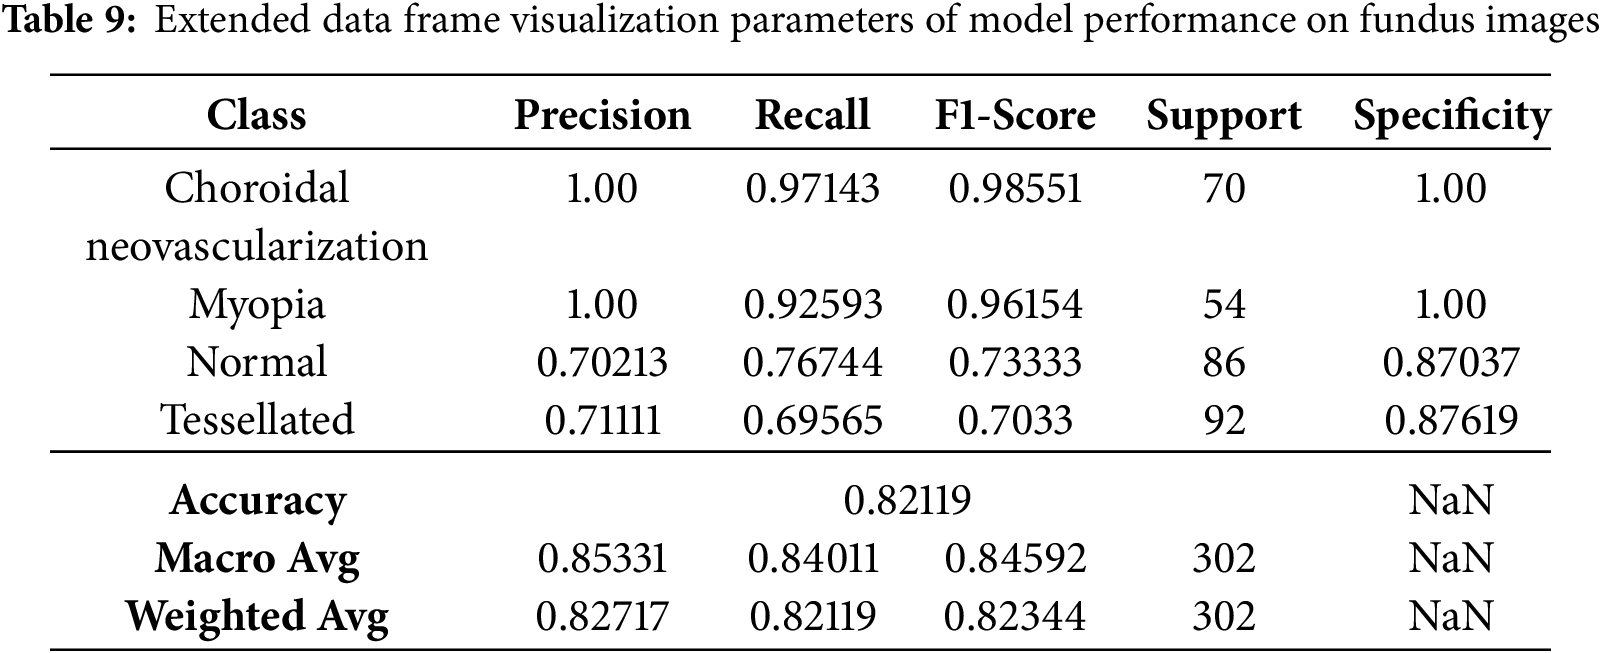
Even though few parameters were enforced in callbacks, they still faced a few fluctuations in model accuracy and loss, as shown in Fig. 12. The classification report has got some changes and upgrades while the values kept fluctuating as shown in Table 8. The entire Dataframe visualization for evaluation metrics got slight improvement after a few parameters were changed in the model training, as depicted in Table 9.
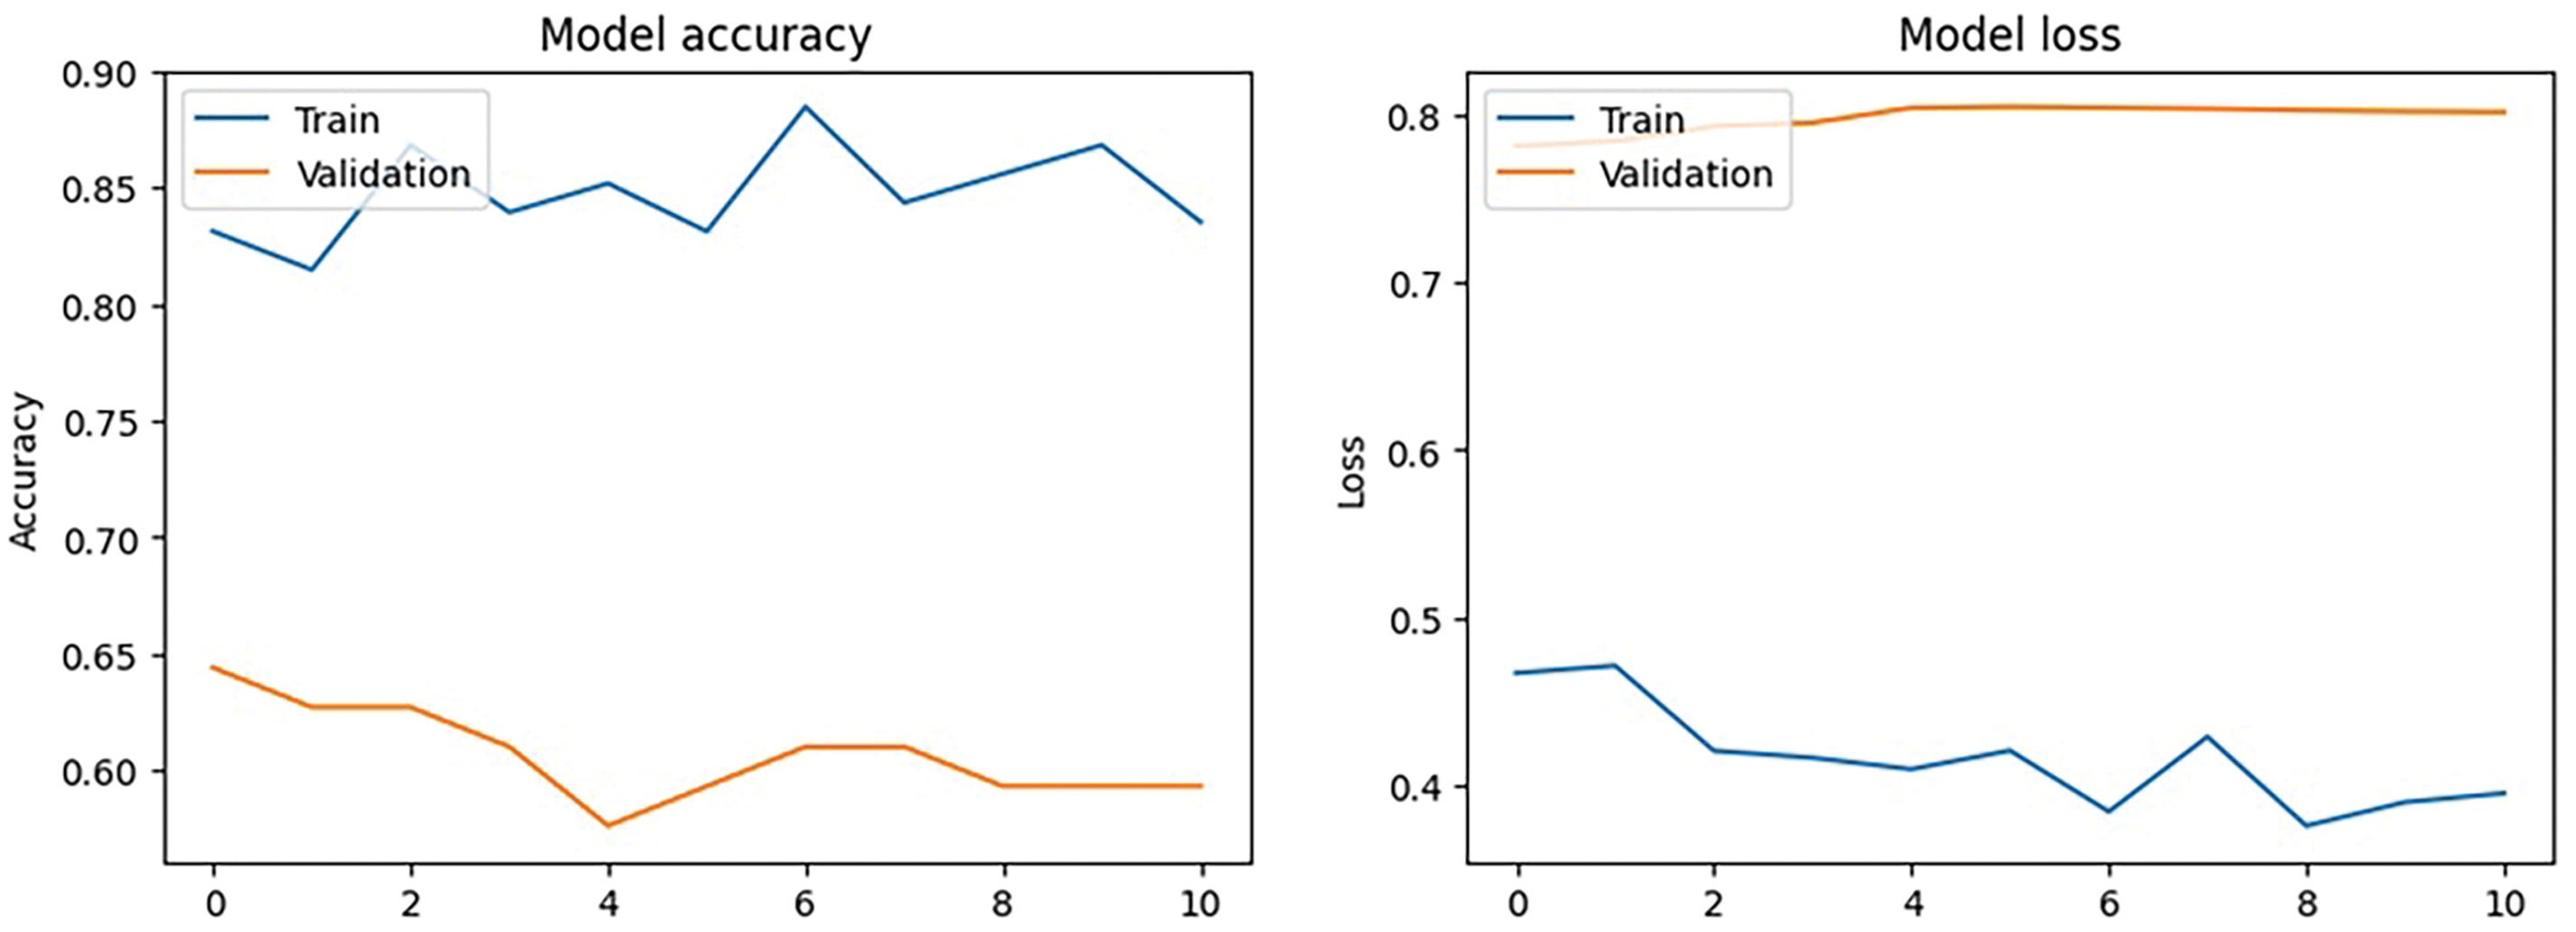
Figure 12: Modified callbacks: Model accuracy and loss
The model can be overfitting if it performs well on training data but poorly on validation data, as indicated by the performance difference between training and validation measures. Additional actions to enhance validation performance can include modifying the model design or adding more data.
The classification results of a modified VGG16 CNN model on four retinal disease classes–choroidal neovascularization, myopia, normal, and tessellated–are displayed in this confusion matrix. Only one of the fourteen cases of Choroidal Neovascularization was correctly identified; the other three were misclassified as Myopia, Normal, and Tessellated. Two cases were incorrectly classified as Choroidal Neovascularization, one as Normal, and one as Tessellated in the Myopia class, whereas six out of ten cases were correctly diagnosed. Three out of ten instances were appropriately identified as Choroidal Neovascularization, one as myopia, and one as Tessellated for normal cases. Eight of the eighteen predictions made by Tessellated were accurate; the remaining six were misclassified as Choroidal Neovascularization, four as myopia, and five as Normal. Although the off-diagonal numbers show difficulties, especially in differentiating between Choroidal Neovascularization and Tessellated, the diagonal values, which represent accurate predictions, highlight areas of outstanding performance.
4.4.3 Test Cases with Refined Model
After refinement, the VGG16-based model was trained to maximize classification for four classes of retinal diseases and address the class imbalance. The class weights were dynamically determined to guarantee equitable representation as follows: Choroidal Neovascularization was weighted at 1.0848, Myopia at 1.3807, Normal at 0.8804, and Tessellated at 0.8209. Minority classes were not underrepresented thanks to these weights. A 10 degree rotation range, 0.1 width and height shifts, 0.1 shear and zoom ranges, and permitted horizontal flipping were among the characteristics used for data augmentation. The ‘nearest’ fill mode was employed to control pixel gaps during augmentation Modified callbacks which improves the performance in terms of Accuracy and Loss are depicted in Confusion matrix as shown in Fig. 13.
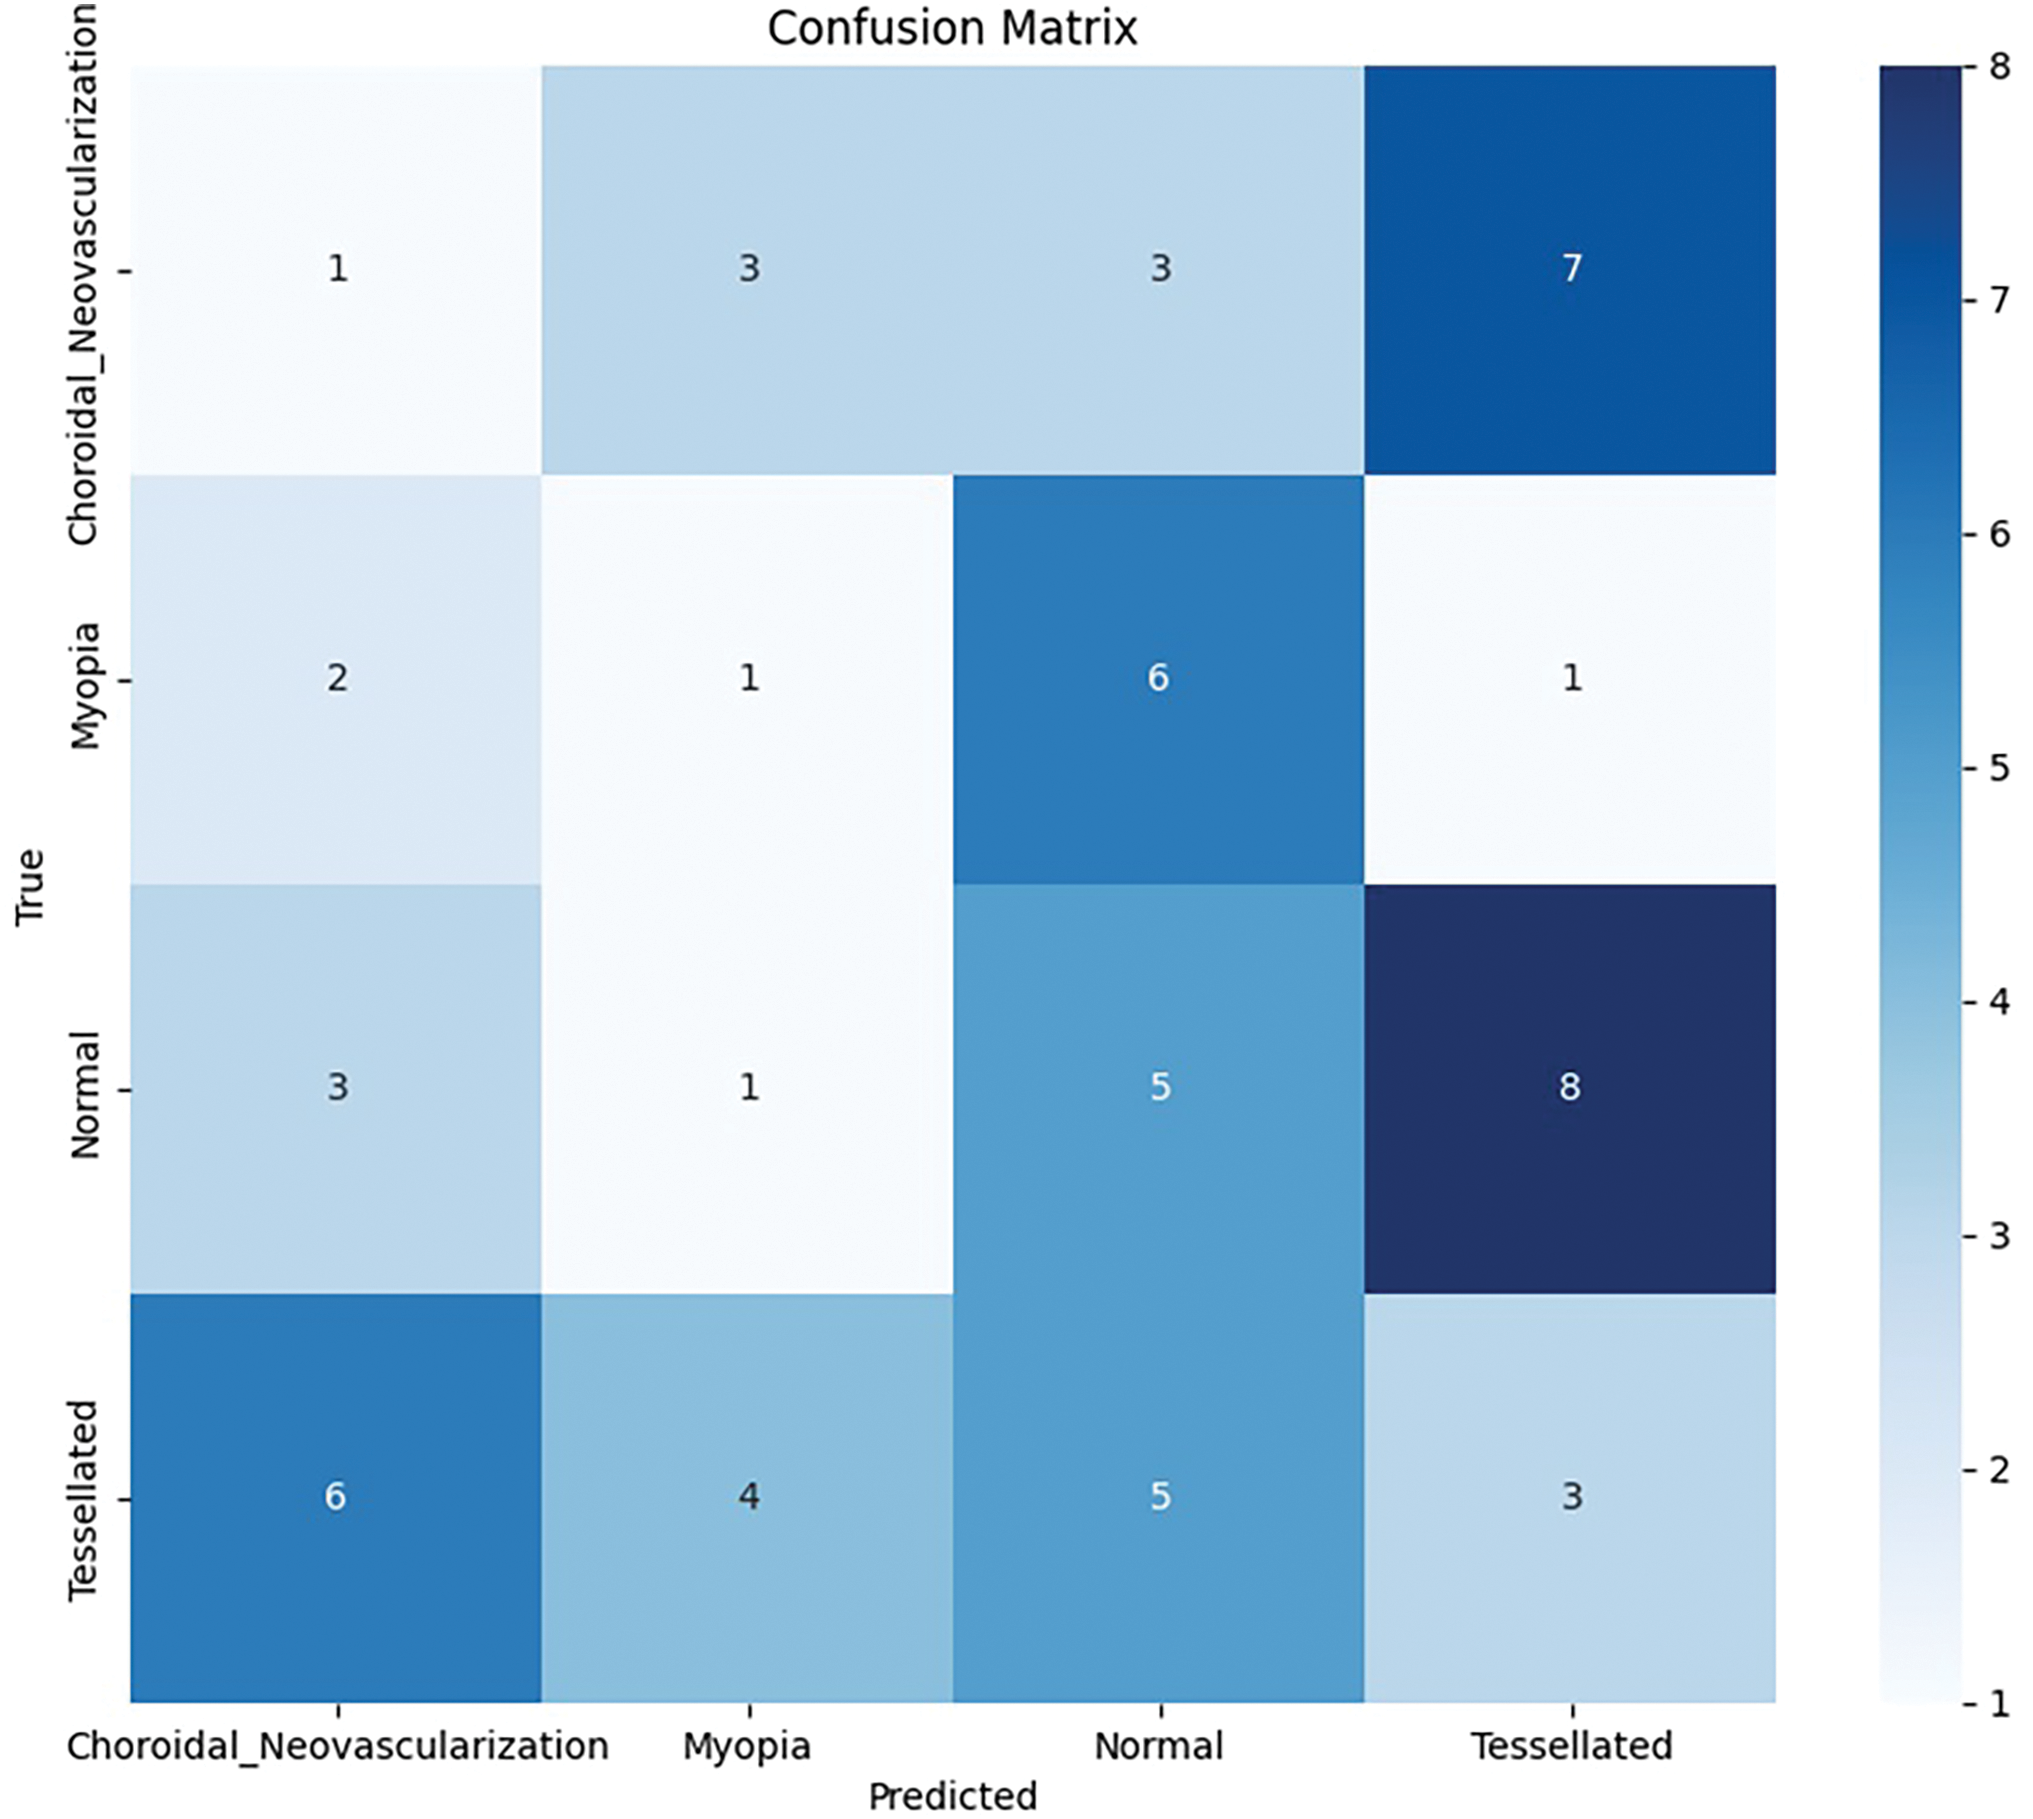
Figure 13: Modified callbacks: Model accuracy and loss
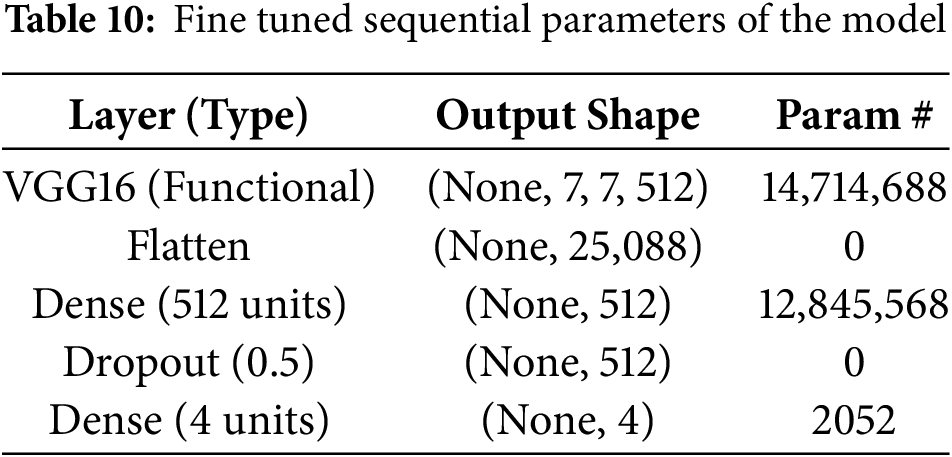
The convolutional layers were frozen during fine-tuning thanks to the model architecture’s VGG16 with pre-trained ImageNet weights. A flatten layer, a flattened layer with 512 units and ReLU activation, a dropout layer with a rate of 0.5, and an output layer with 4 units using softmax activations for multi-class classification were among the custom dense layers that were added. Adam was utilized to optimize the model with a 1e-4 learning rate. Two important callbacks were ReduceLROnPlateau (factor of 0.2 after 5 epochs with little improvement) and Early Stopping (patience of 10 epochs). 20 epochs of training were conducted with a batch size of 32; however, if validation loss plateaued, training can be interrupted by early halting.
93.42% training accuracy and 74.58% validation accuracy were attained by the finished model. A confusion matrix, classification report, and F1-scores for each of the following classes were included in the evaluation metrics: Choroidal Neovascularization (0.40), Myopia (0.10), Normal (0.29), and Tessellated (0.49). Of the 27,562,308 parameters in the model, 12,847,620 were trainable and 14,714,688 were not. These modifications helped the VGG16-based model become more refined and perform better in classification.
After applying fine tuning, the local parameters tend to change the parameters with respect to Flatten, Dropout and Dense layers which is shown in Table 10. Total parameters in the adjusted model are 27,562,308 (105.14 MB), of which 12,847,620 are trainable (49.01 MB) and 14,714,688 are non-trainable (56.13 MB). Training optimizes trainable parameters, while pre-trained VGG16 layers provide non-trainable parameters that facilitate feature extraction. This equilibrium makes use of both pre-trained and learned properties.
With a tolerance of 10, Early Stopping was utilized to track validation loss (val_loss) and return the model to the optimal weights found during training. In addition, ReduceLROnPlateau dynamically modified the learning rate, lowering it by 0.2 if val_loss did not improve after 5 epochs, with a minimum limit of 1 ×
After performing fine tuning by changing the required parameters, there is an exponential growth in the accuracy curve as well as Loss, as shown in Fig. 14. After fine-tuning, the model achieved a validation accuracy of 74.58% and a validation loss of 1.7939%. A thorough analysis of classification performance for each of the four classes–Choroidal Neovascularization, Myopia, Normal, and Tessellated–is given by the confusion matrix, which is depicted in Fig. 15. With nine accurate predictions, the model notably does well in properly recognizing the “Tessellated” class, indicating increased specificity in this category. The remaining validation loss can be caused by the slight overlap that still exists between normal and tessellated images. These findings reveal that fine-tuning and hyperparameter modifications are beneficial in obtaining dependable classification, as evidenced by the model’s significant gains in generalization across various retinal circumstances and its balanced accuracy across classes.
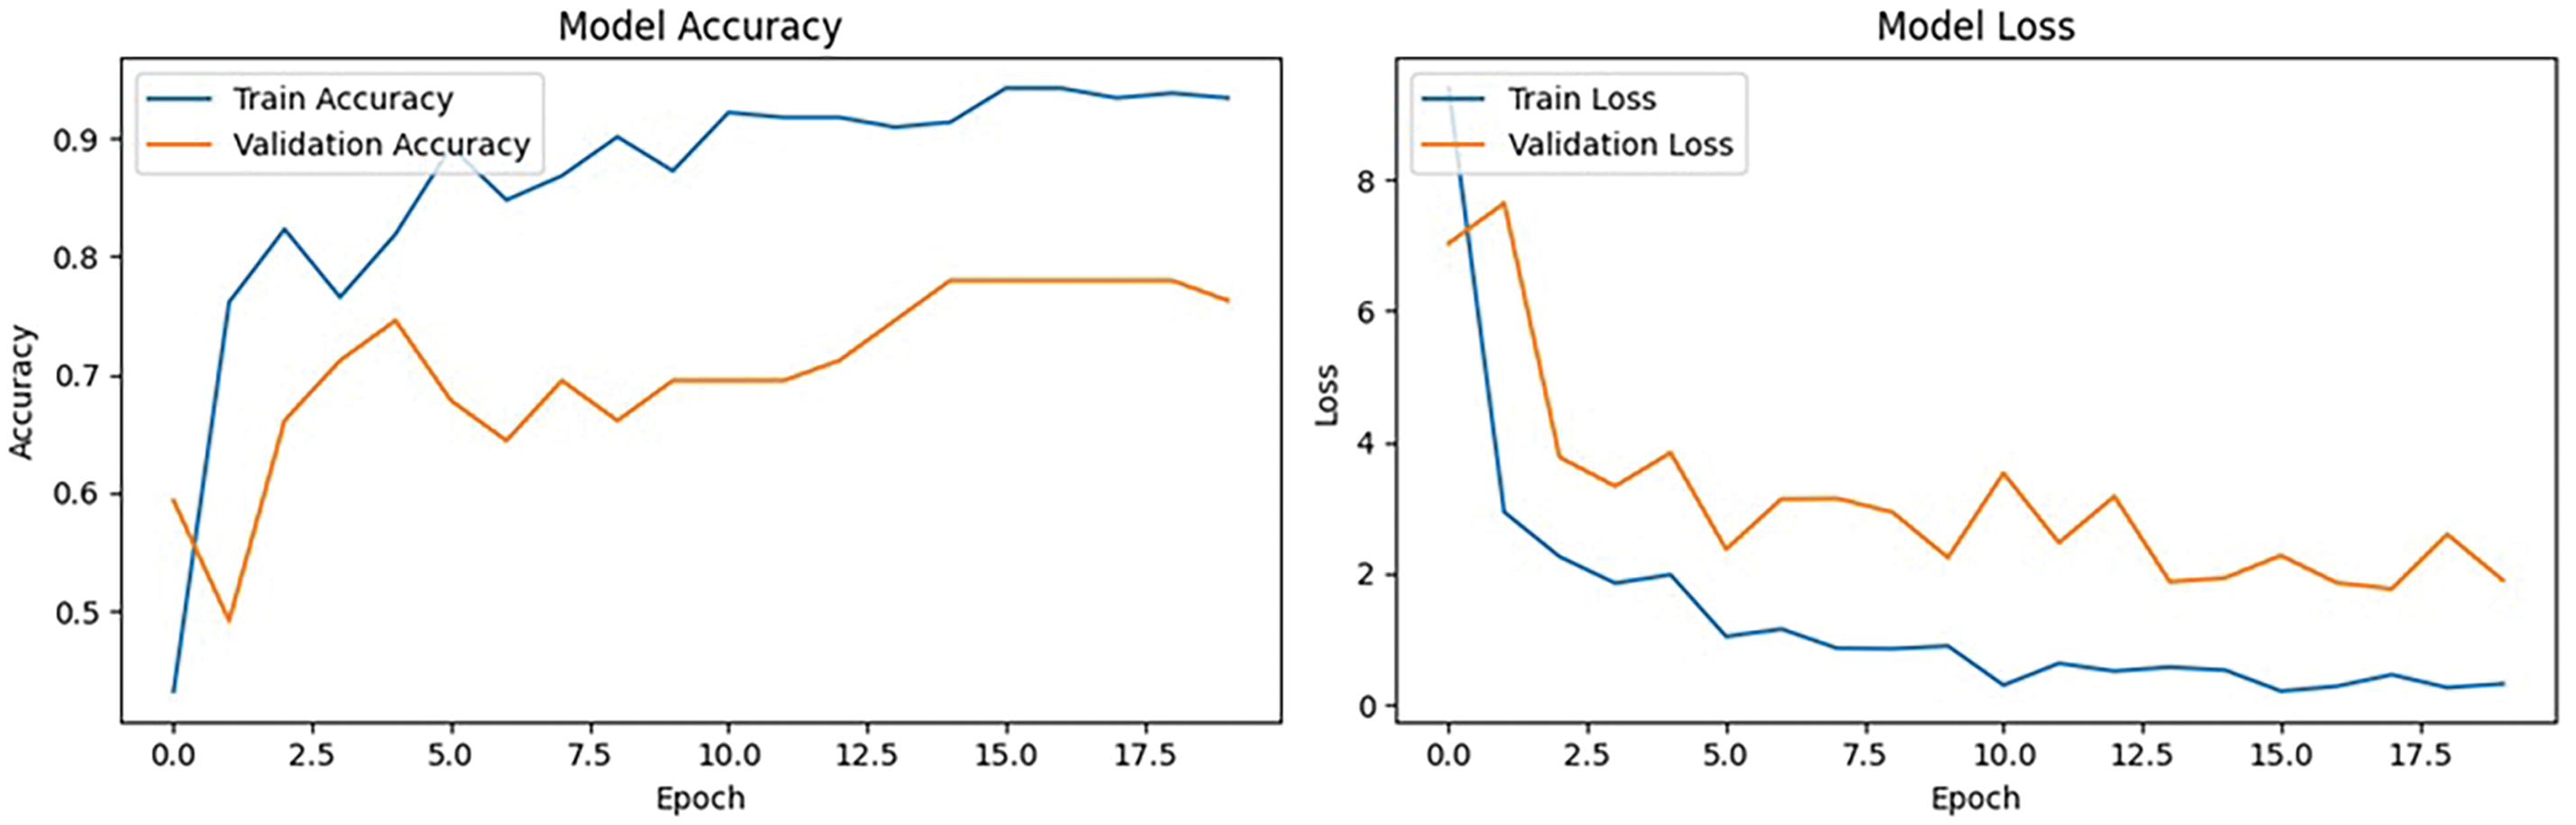
Figure 14: Modified callbacks: Model accuracy and loss
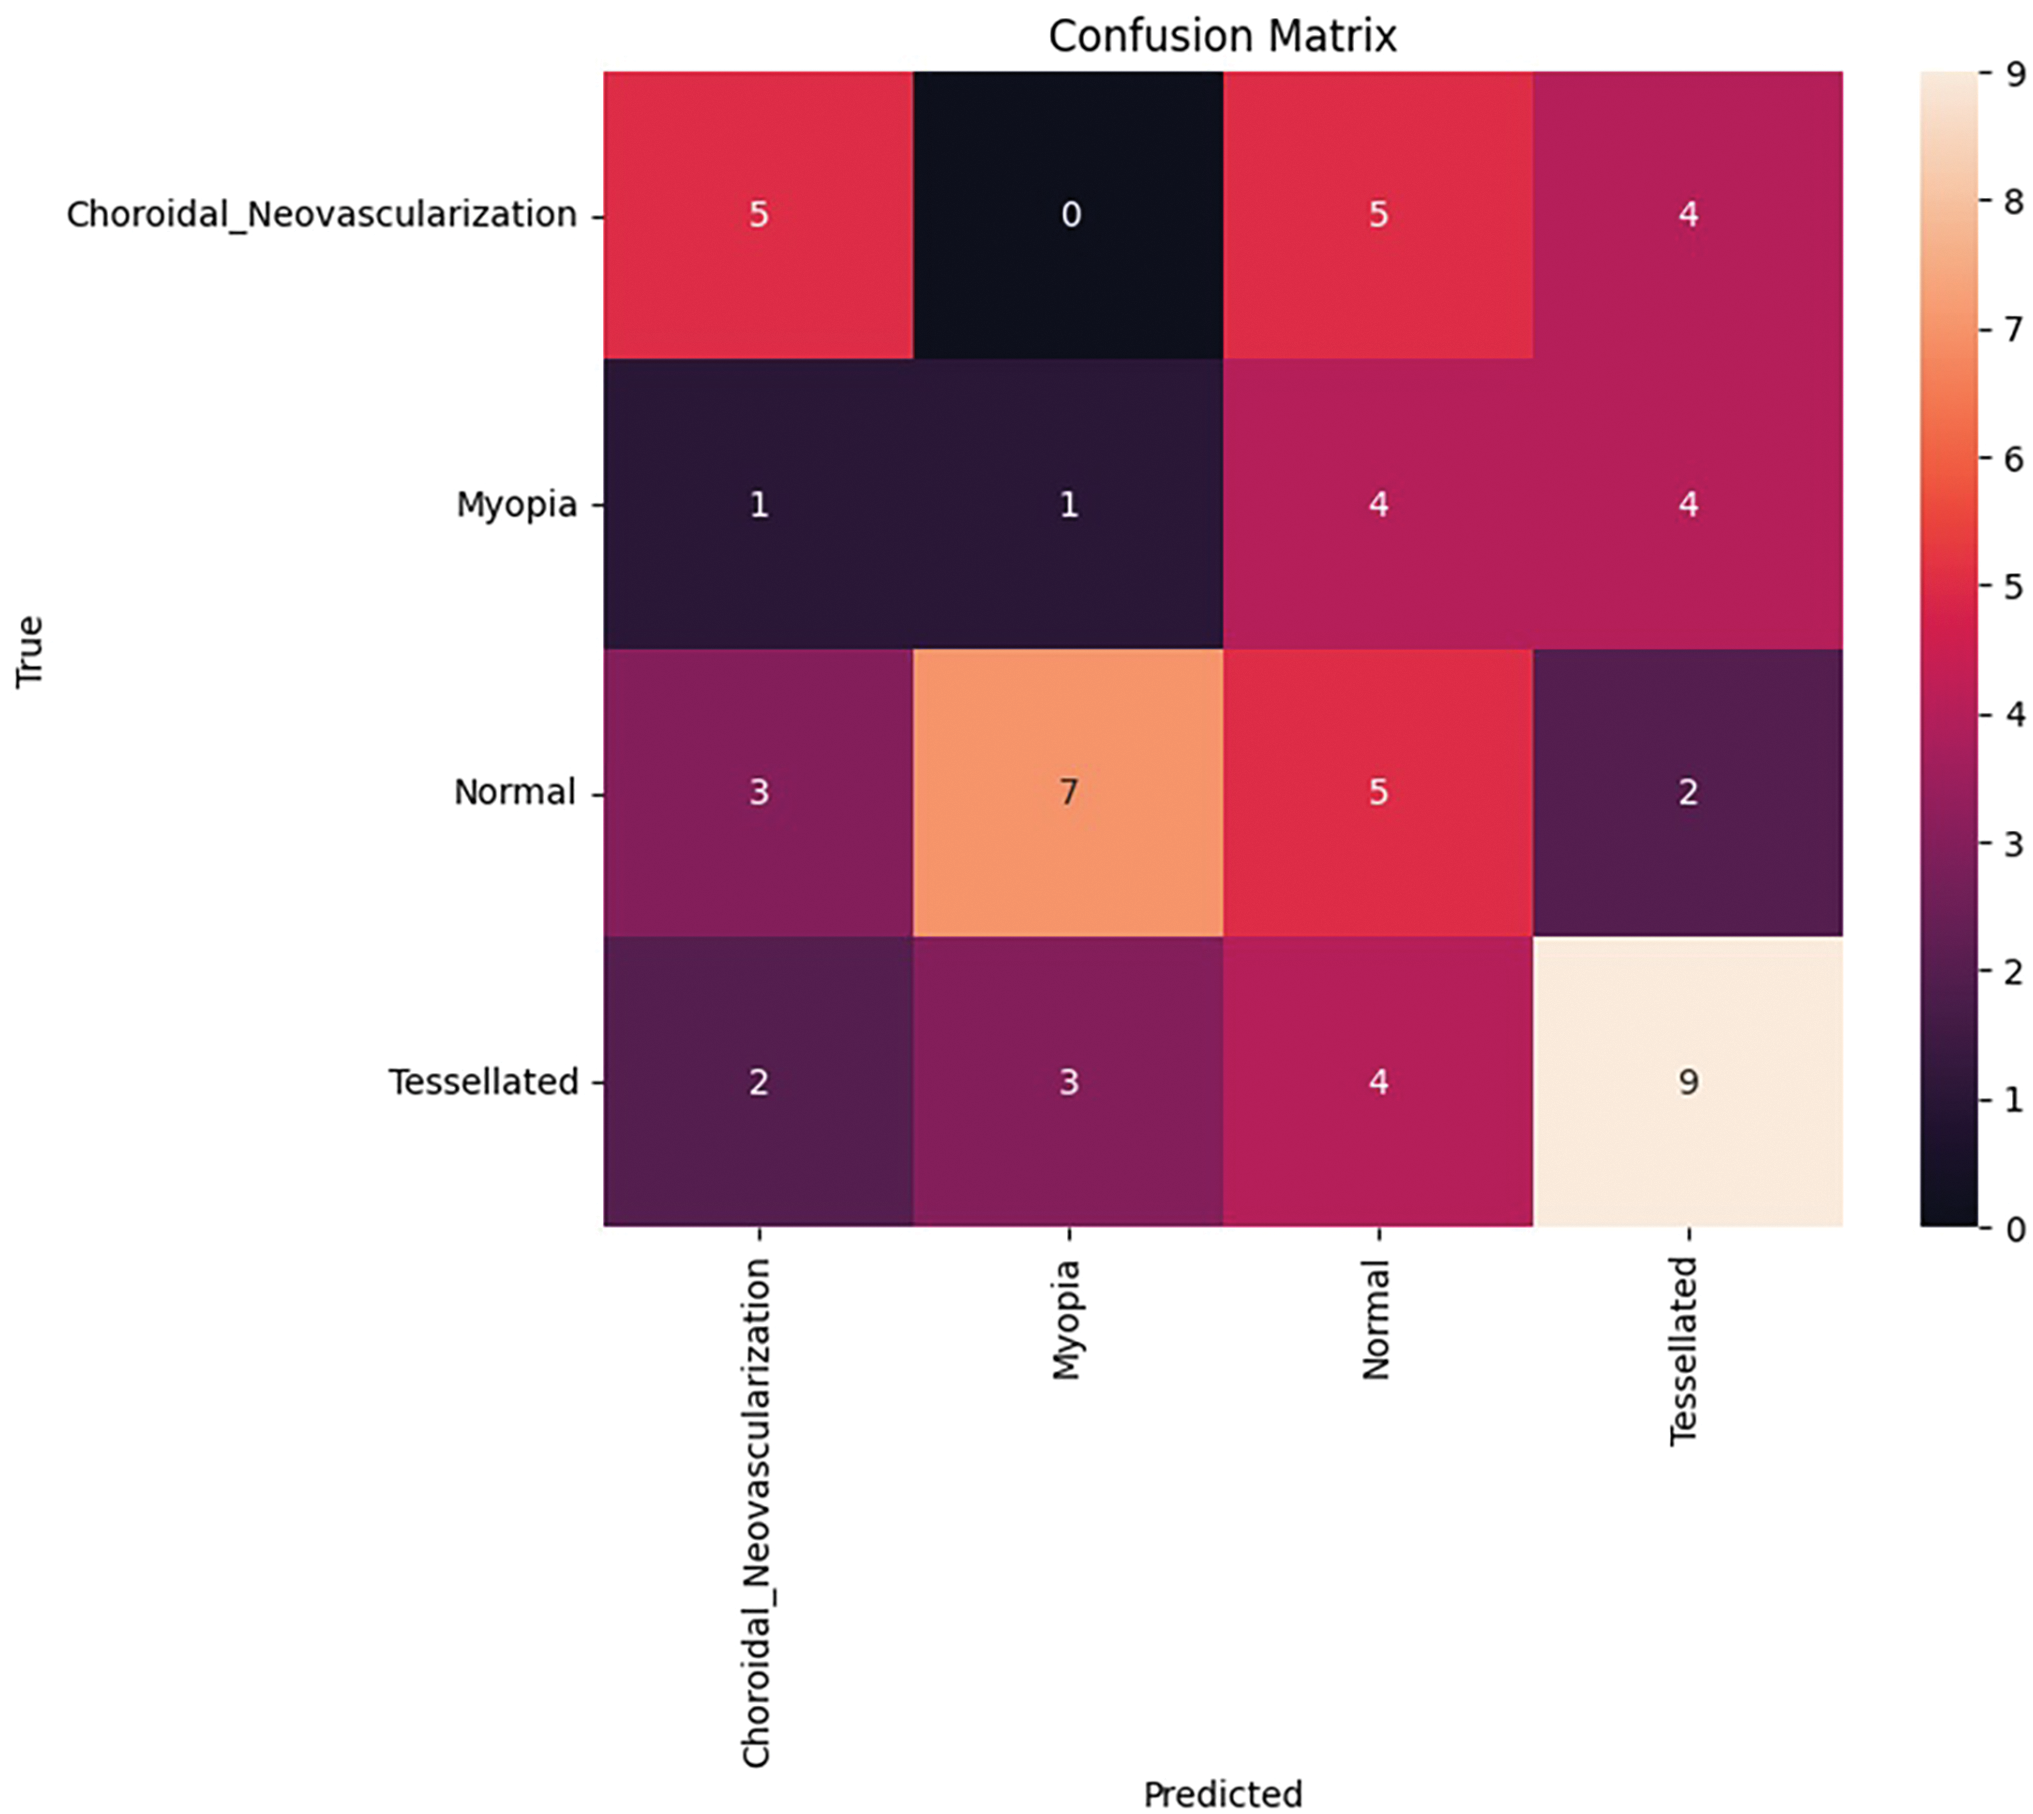
Figure 15: Confusion matrix after fine tuning
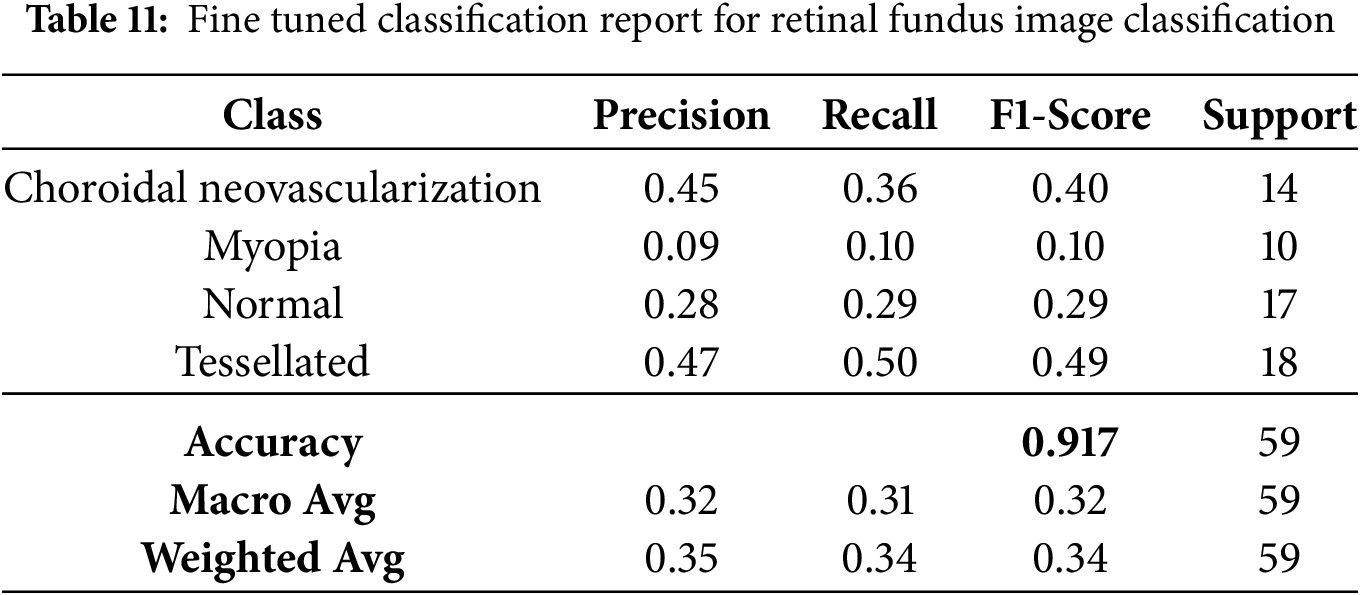
The fine-tuned performance metrics for each class in the classification of retinal fundus images are shown in Table 11. Although overall accuracy stays at 91.70%, it demonstrates that the model achieves moderate precision and recall for the “Tessellated” class, indicating potential for further development.
Based on the fine-tuned models performance, the first class’s confidence score is 1.7941851
The fine-tuned prediction was shown with a good confidence report of 100%. The Grad Cam representation of the fine-tuned model is shown in Fig. 16. The prediction shows the 100% correct prediction of the tessellated fundus image with the identified pathologies with a heatmap imposed on the predicted image as well as a superimposed image to expose the extracted features.
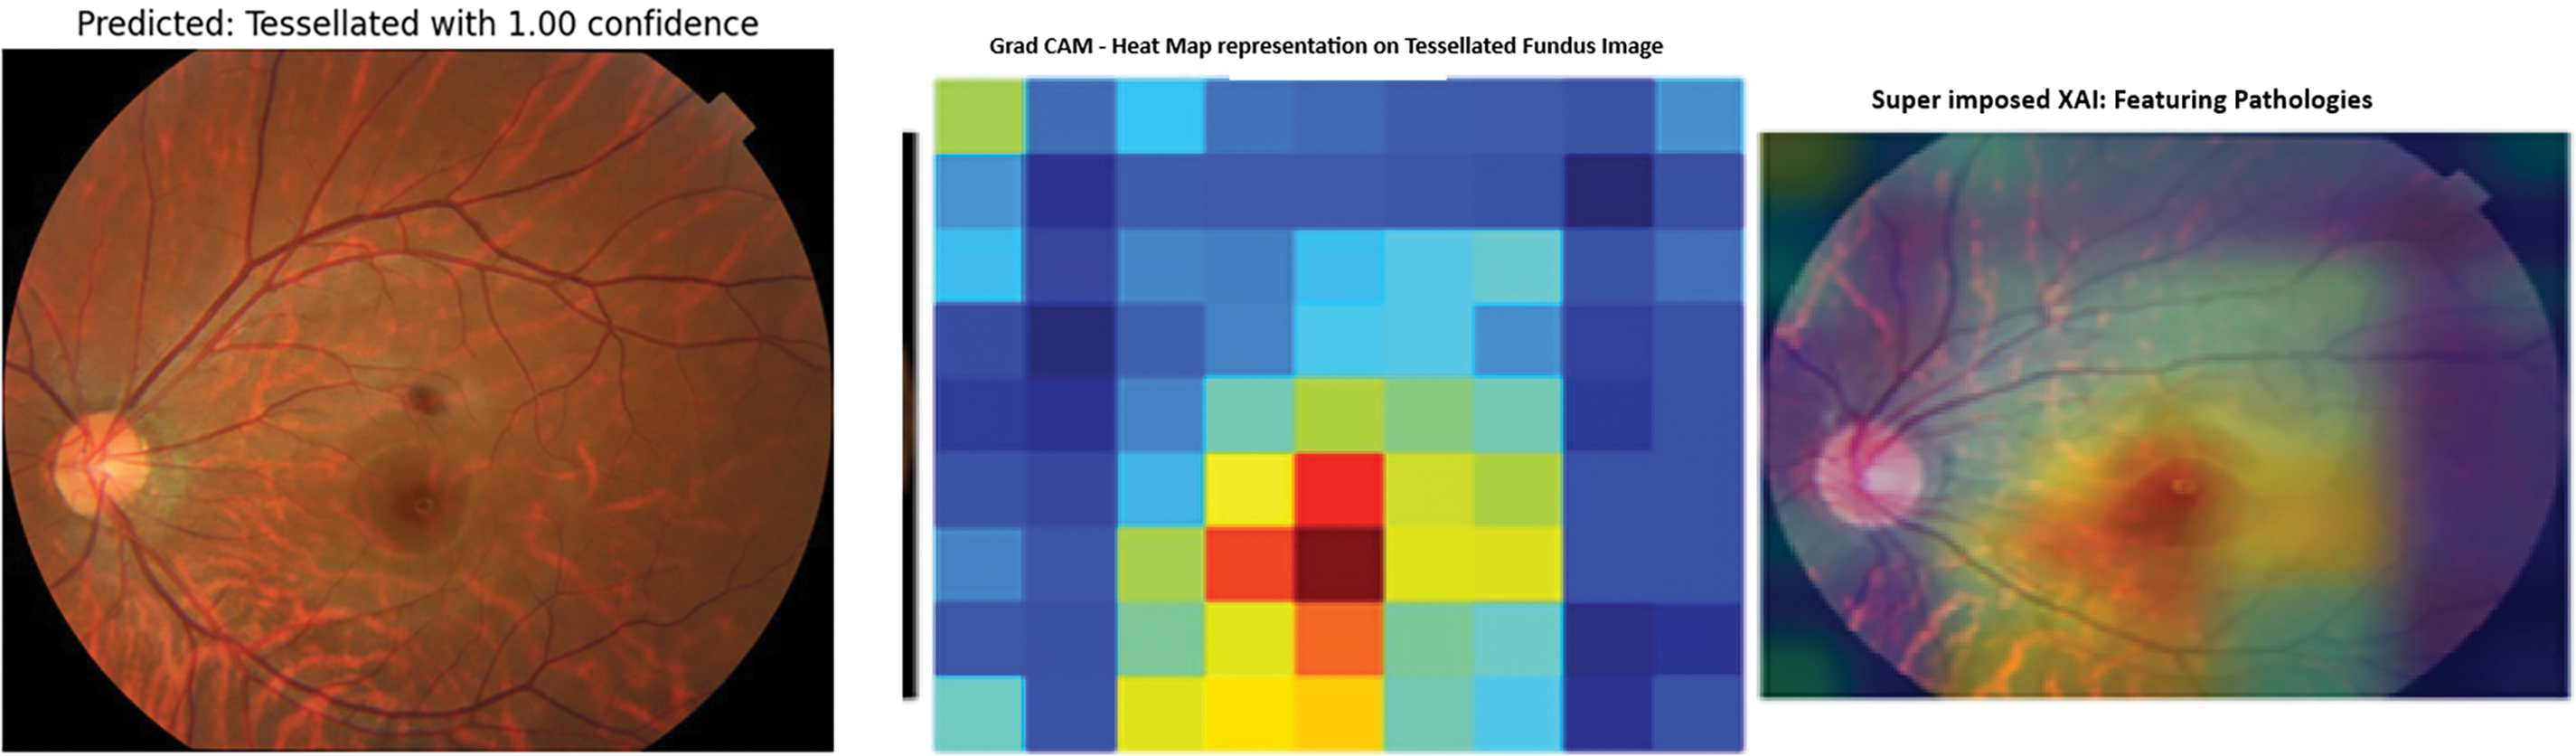
Figure 16: Modified callbacks: Model accuracy and loss
This study conducted a preliminary qualitative assessment with an ophthalmologist, who reviewed the Grad-CAM and SHAP visualizations. The feedback indicated that the highlighted polygonal regions in tessellated images, primarily refer to choroidal vessels, which are similar to clinical observations. In choroidal neovascularization cases, the model has emphasized regions around the macula, a known area for choroidal neovascularization improvement. The medical expert validation had strengthened the confidence, that the model is learning meaningful features which will expand the clinical relevance, expert validation, and potential applications that are used for understanding retinal pathologies.
4.5 Overfitting Mitigation Strategies
In this study of fundus image classification, several techniques were employed to manage and mitigate overfitting:
1. Data Augmentation: Using techniques such as rotation, flipping, and rescaling,increases the effective size and diversity of the dataset, which helps the model generalize better to unseen data.
2. Regularization Techniques: This study used dropout layers in the custom top layers of the VGG16-based model. Dropout helped prevent overfitting by randomly disabling specific neurons during training, forcing the model to learn more robust features.
3. Class Weights: This study balanced the model’s attention across classes, which is especially useful given the class imbalance in the dataset by assigning different weights to classes based on their representation in the dataset.
4. Early Stopping and Learning Rate Reduction: The use of callbacks, such as early stopping and learning rate reduction, helps prevent overfitting. Early stopping halted training once the model’s performance on the validation set stopped improving, while learning rate reduction allowed for more refined adjustments in the later stages of training to avoid overfitting.
5. Model Checkpointing: This study saved the model at the point where it performed best on the validation set, allowing us to select the optimal weights and avoid overfitting.
The current model’s shortcomings are mostly caused by the small dataset size (302 photos in four classes), which raises the possibility of overfitting and restricts the model’s capacity to generalize to larger populations. In addition, the model can still be skewed toward more frequent classes even when class weighting is used. The use of a single VGG16 architecture can limit the investigation of better models or ensembling methods that can enhance performance. The full diversity of real-world fundus images can not be captured by simple image augmentation techniques, and although Grad-CAM provides some interpretability, more sophisticated methods are required to improve comprehension, especially for medical applications.
The generalizability of the model will be improved for future iterations by adding more varied and annotated fundus photos to the dataset. Using ensembling techniques and experimenting with sophisticated designs such as ResNet, DenseNet, or EfficientNet can increase classification accuracy. Real-world changes can be more accurately simulated by using more sophisticated picture augmentation techniques and creating synthetic data. Transparency will be increased by addressing class imbalance with synthetic data and incorporating sophisticated interpretability techniques such as SHAP or LIME. The model will be improved and made practically applicable in diagnostic situations by real-world testing, mobile app deployment, and clinical validation in conjunction with ophthalmologists.
This study also aims to explore model ensembling techniques to further enhance performance and reliability, since it acknowledges its potential benefits for improving the robust performance in multi-class classification. However given the dataset constraints and main target on interpretability of architecture for clinical applications. The main priority is for the well-optimized model.
With an emphasis on differentiating tessellated fundus images, the VGG16-based model for fundus image classification shows good effectiveness and balanced performance across four classes: choroidal neovascularization, myopia, tessellated, and normal fundus images.
With particular efforts on data augmentation, class weighting, and callbacks to address overfitting and class imbalance, the model achieved competitive accuracy and interpretability despite a relatively smaller dataset of 302 photos when compared to previous literature. For instance, Ju et al. (2021) achieved a greater accuracy of 92% on a bigger dataset of 2500 images by combining CycleGAN with a bespoke CNN for ultra-widefield (UWF) fundus images.
Shao et al. (2021) demonstrated the significance of dataset size and image variety in model performance by using ResNet to achieve 90.5% accuracy on 1200 photos for myopia development. Other investigations, including those by Li et al. (2022) and Luo et al. (2021), relied on large datasets and more complex designs but used ensemble methods and transfer learning to produce accuracies of between 91% and 92%. The main benefit of this study is its interpretability, which is improved by using Grad-CAM and SHAP for explainability. This aids in clinical decision-making and increases model transparency.
In addition, although Huang et al. (2023) and He et al. (2022) used DenseNet and custom CNN architectures to specifically target tessellation detection, with up to 90% accuracy, this VGG16 model with fine-tuning techniques provides a more simple, resource-efficient method with comparable outcomes for a thorough multi-class fundus diagnosis.
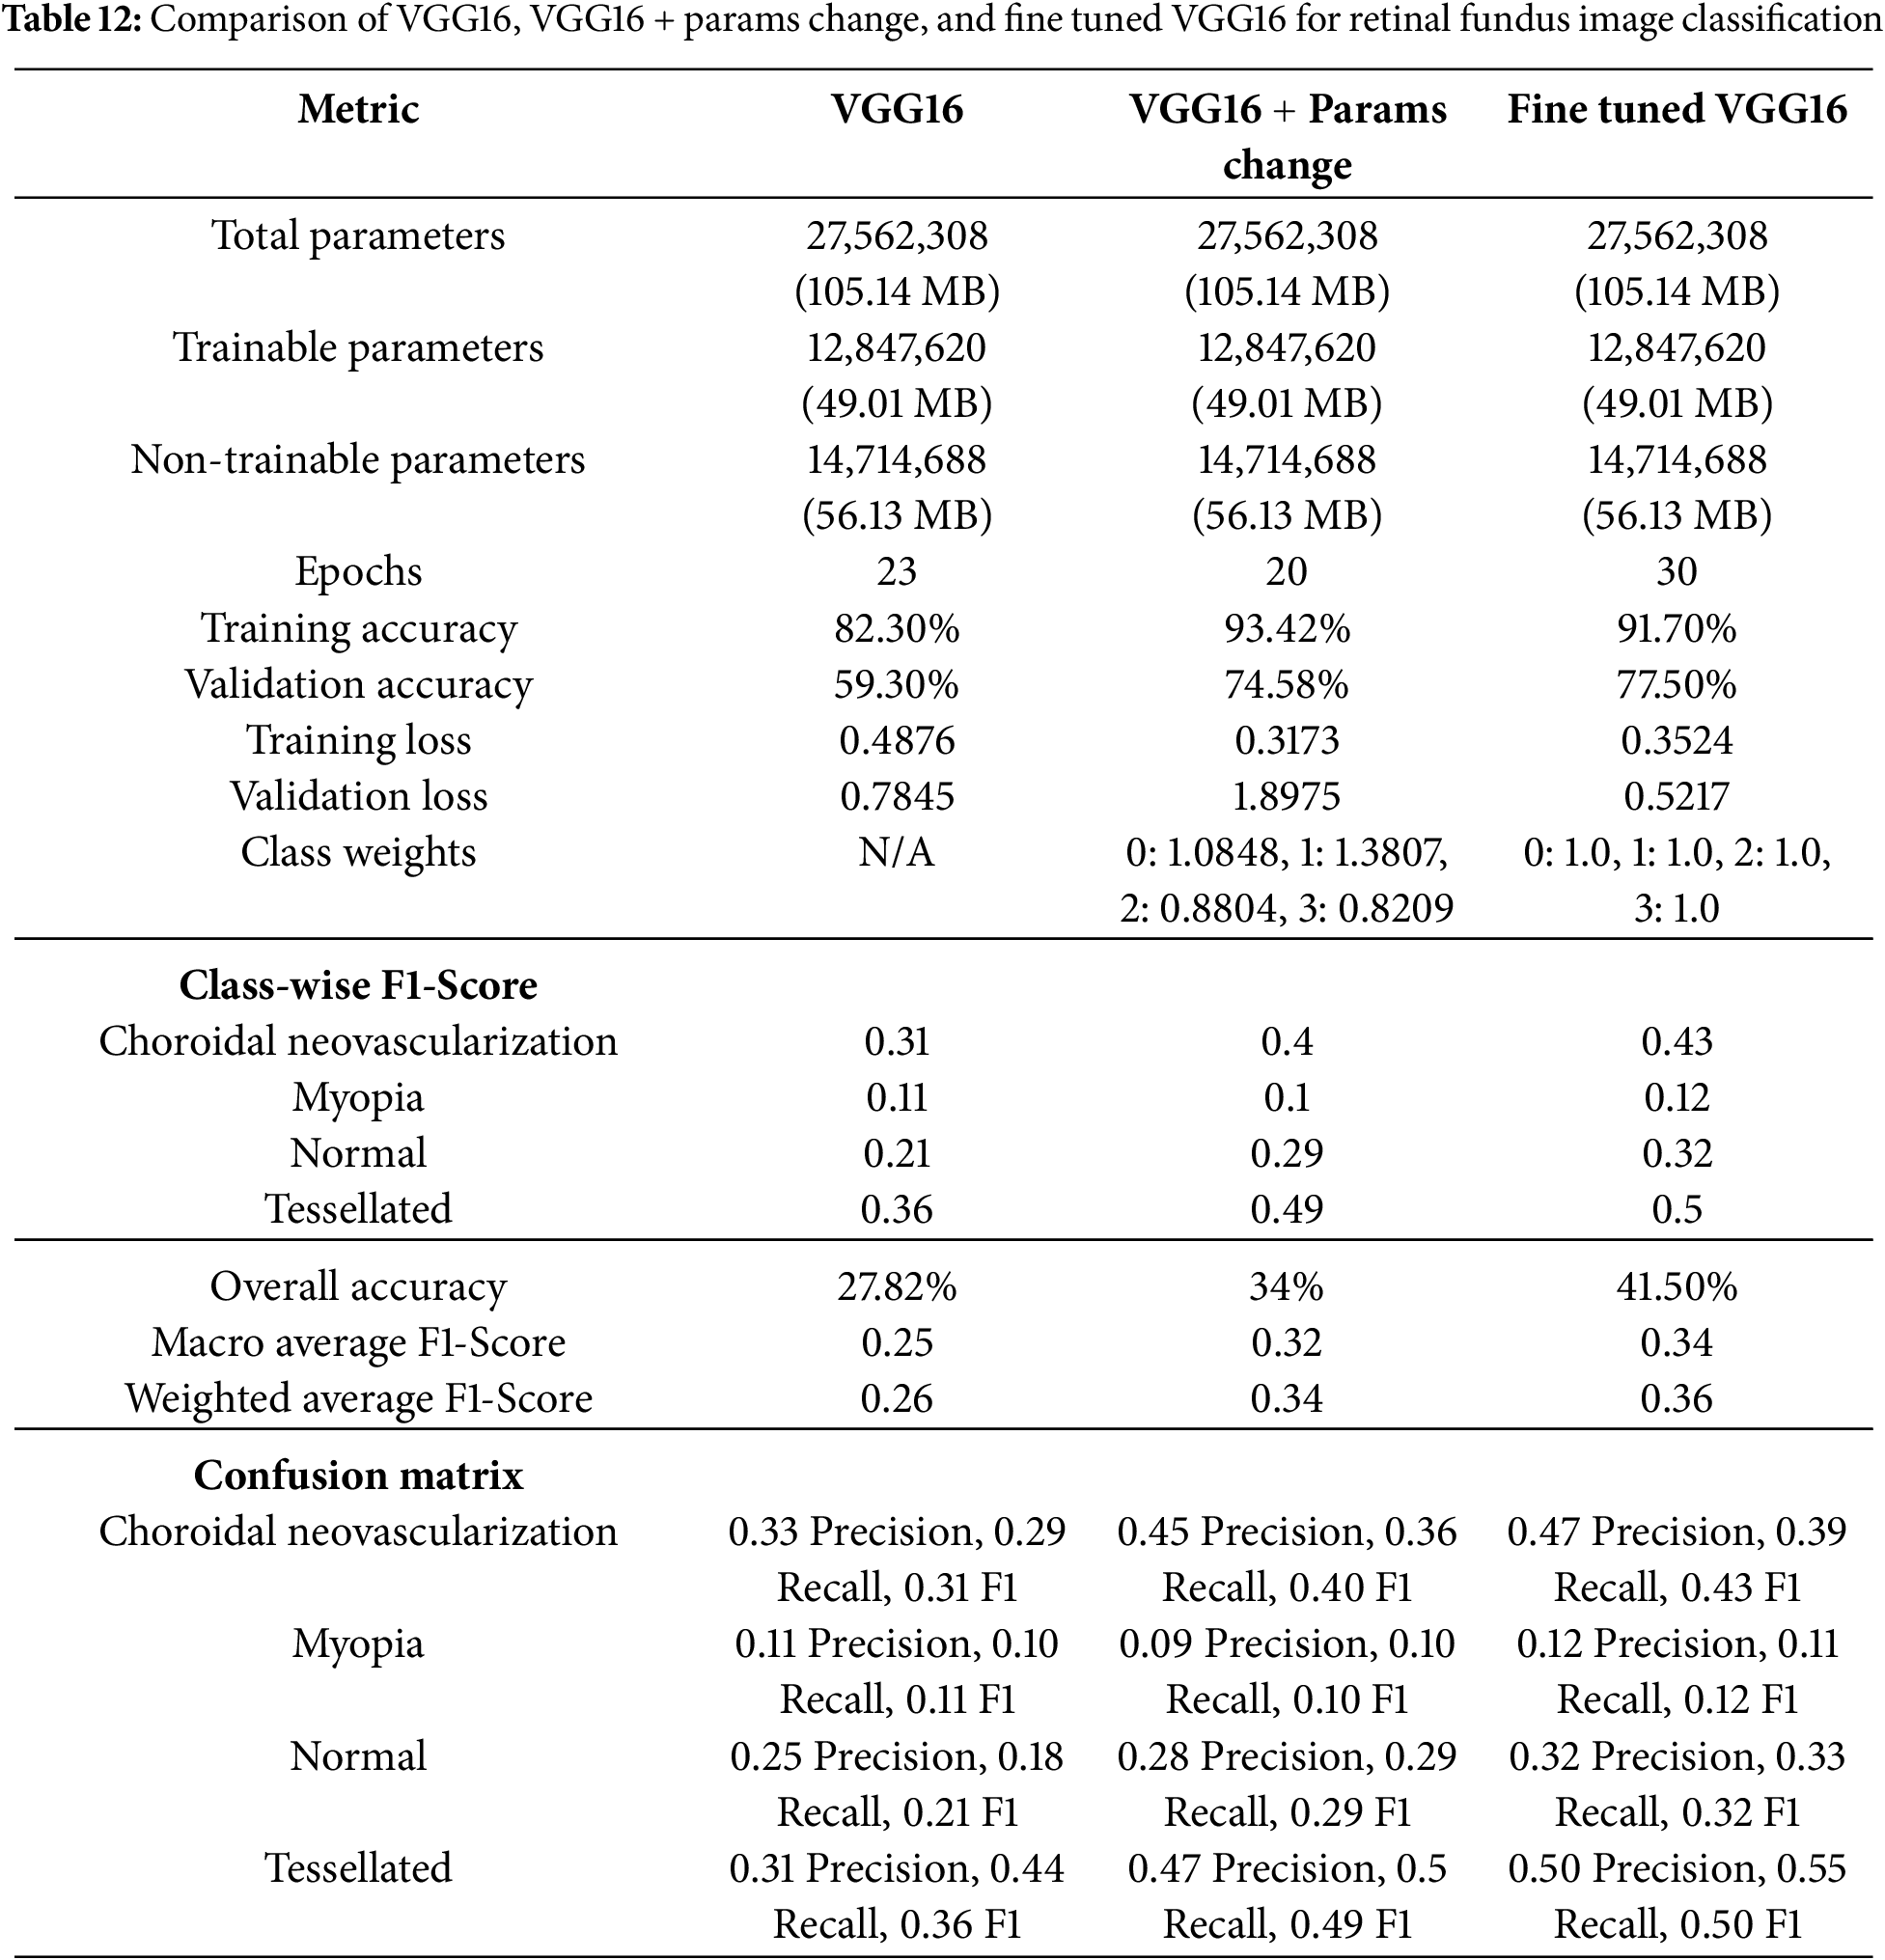
The comparison Table 12 highlights the performance improvements of three results for classifying fundus images where, each got improvised. A consistent underlying architecture is indicated by the given 3 models shared total and trainable parameters. The model’s performance was impacted by differences in training parameters, such as the number of epochs and class weights. The most notable gain in training accuracy (93.42%) and training loss (0.3173) was demonstrated in VGG16 with few changed parameters, which included class weights. In addition, the second results improved validation accuracy (74.3%). The third work, which used a fine-tuned VGG16 with identical class weights demonstrated additional gains in class-wise F1-scores and validation accuracy (77.5%), particularly for the “Tessellated” class, which increased from 0.36 to 0.50. Although “Myopia” remained a problem for all models, The final work appears to improve its generalization and classification balance, with only slight gains in classification performance.
This study fills the gap in the automatic recognition of tessellated fundus images in multi-class scenarios by the VGG16-based method for fundus image classification with extra interpretability methods. It entirely concentrates on how a human will be affected by tessellation after crossing a few more disabilities, such as Choroidal Neovascularization and 730 Myopia. The model delivers good performance metrics despite a reduced dataset, highlighting the 731 importance of explainability, class balancing, and data augmentation. The proposed model is appropriate for clinical settings with limited resources because it maintains a simpler structure while achieving comparable accuracy and resilience to previous literature. This study advances the field by providing a fundus image analysis tool that is easy to use, understandable, and effective. It can also be included in diagnostic applications. Future studies can entail investigating real-time deployment, including ensemble approaches, and growing the dataset to improve diagnostic help in ophthalmology.
Acknowledgement: The authors would like to thank the National Yunlin University of Science and Technology, Taiwan, and Vardhaman College of Engineering, Hyderabad, India, for providing the necessary facilities and resources for conducting this research.
Funding Statement: This work received financial support from the “Intelligent Recognition Industry Service Center” as part of the Featured Areas Research Center Program under the Higher Education Sprout Project by the Ministry of Education (MOE) in Taiwan, and the National Science and Technology Council, Taiwan, under grants [113-2622-E-224 -002] and [113-2221-E-224 -041]. In addition, partial support was provided by Isuzu Optics Corporation.
Author Contributions: Kachi Anvesh and Bharati M. Reshmi: idealogy & experimentaion; Shanmugasundaram Hariharan: data collection, draft the article; H. Venkateshwara Reddy: interpretation of results; Murugaperumal Krishnamoorthy: diagrams and draft preparation; Vinay Kukreja: manuscript validation; Shih-Yu Chen: supervising, result validation and supervising and draft checking. All authors reviewed the results and approved the final version of the manuscript.
Availability of Data and Materials: All data generated or analyzed during this study are included in this published article.
Ethics Approval: Not applicable.
Conflicts of Interest: The authors declare no conflicts of interest to report regarding the present study.
References
1. Meedeniya D. Deep learning: a beginner’s guide. 1st ed. New York, Boca Raton, FL, USA: Chapman and Hall/CRC; 2023. doi:10.1201/9781003390824. [Google Scholar] [CrossRef]
2. Ju L, Wang X, Zhao X, Bonnington P, Drummond T, Ge Z. Leveraging regular fundus images for training UWF fundus diagnosis models via adversarial learning and pseudo-labeling. IEEE Trans Med Imaging. 2021;40(10):2911–25. doi:10.1109/TMI.2021.3056395. [Google Scholar] [PubMed] [CrossRef]
3. Ouda O, AbdelMaksoud E, Abd El-Aziz AA, Elmogy M. Multiple ocular disease diagnosis using fundus images based on multi-label deep learning classification. Electronics. 2022;11(13):1966. doi:10.3390/electronics11131966. [Google Scholar] [CrossRef]
4. Luo X, Li J, Chen M, Yang X, Li X. Ophthalmic disease detection via deep learning with a novel mixture loss function. IEEE J Biomed Health. 2021;25(9):3332–9. doi:10.1109/JBHI.2021.3083605. [Google Scholar] [PubMed] [CrossRef]
5. Ali R, Sheng B, Li P, Chen Y, Li H, Yang P, et al. Optic disk and cup segmentation through fuzzy broad learning system for glaucoma screening. IEEE Trans Ind Informat. 2020;17(4):2476–87. doi:10.1109/TII.2020.3000204. [Google Scholar] [CrossRef]
6. Huang D, Qian Y, Yan Q, Ling S, Dong Z, Ke X, et al. Prevalence of fundus tessellation and its screening based on artificial intelligence in Chinese children: the nanjing eye study. Ophthalmol Ther. 2023;12(5):2671–85. doi:10.1007/s40123-023-00773-2. [Google Scholar] [PubMed] [CrossRef]
7. Askarian B, Ho P, Chong JW. Detecting cataract using smartphones. IEEE J Transl Eng Health Med. 2021;9:1–10. doi:10.1109/JTEHM.2021.3074597. [Google Scholar] [PubMed] [CrossRef]
8. Fan R, Bowd C, Brye N, Christopher M, Weinreb RN, Kriegman DJ, et al. One-vote veto: semi-supervised learning for low-shot glaucoma diagnosis. IEEE Trans Med Imaging. 2023;42(12):3764–78. doi:10.1109/TMI.2023.3307689. [Google Scholar] [PubMed] [CrossRef]
9. Pedram SA, Ferguson PW, Gerber MJ, Shin C, Hubschman JP, Rosen J. A novel tissue identification framework in cataract surgery using an integrated bioimpedance-based probe and machine learning algorithms. IEEE Trans Biomed Eng. 2021;69(2):910–20. doi:10.1109/TBME.2021.3109246. [Google Scholar] [PubMed] [CrossRef]
10. Shao L, Zhang QL, Long TF, Dong L, Zhang C, Da Zhou W, et al. Quantitative assessment of fundus tessellated density and associated factors in fundus images using artificial intelligence. Transl Vis Sci Technol. 2021;10(9):23. doi:10.1167/tvst.10.9.23. [Google Scholar] [PubMed] [CrossRef]
11. Choudhary A, Ahlawat S, Urooj S, Pathak N, Lay-Ekuakille A, Sharma N. A deep learning-based framework for retinal disease classification. Healthcare. 2023;11(2):212. doi:10.3390/healthcare11020212. [Google Scholar] [PubMed] [CrossRef]
12. Wang R, He J, Chen Q, Ye L, Sun D, Yin L, et al. Efficacy of a deep learning system for screening myopic maculopathy based on color fundus photographs. Ophthalmol Ther. 2023;12(1):469–84. doi:10.1007/s40123-022-00621-9. [Google Scholar] [PubMed] [CrossRef]
13. Mayya V, Kulkarni U, Surya DK, Acharya UR. An empirical study of preprocessing techniques with convolutional neural networks for accurate detection of chronic ocular diseases using fundus images. Appl Intell. 2023;53(2):1548–66. doi:10.1007/s10489-022-03490-8. [Google Scholar] [PubMed] [CrossRef]
14. Wang C, Chen Y, Liu F, Elliott M, Kwok CF, Peña-Solorzano C, et al. An interpretable and accurate deep-learning diagnosis framework modelled with fully and semi-supervised reciprocal learning. IEEE Trans Med Imag. 2023;43(1):392–404. doi:10.1109/TMI.2023.3306781. [Google Scholar] [PubMed] [CrossRef]
15. Sarki R, Ahmed K, Wang H, Zhang Y. Automatic detection of diabetic eye disease through deep learning using fundus images: a survey. IEEE Access. 2020;8:151133–49. doi:10.1109/ACCESS.2020.3015258. [Google Scholar] [CrossRef]
16. Chen XY, He HL, Xu J, Liu YX, Jin ZB. Clinical features of fundus tessellation and its relationship with myopia: a systematic review and meta-analysis. Ophthalmol Ther. 2023;12(6):3159–75. doi:10.1007/s40123-023-00802-0. [Google Scholar] [PubMed] [CrossRef]
17. Zhai Y, Zhang G, Zheng L, Yang G, Zhao K, Gong Y, et al. Computer-aided intraoperative toric intraocular lens positioning and alignment during cataract surgery. IEEE J Biomed Health Inform. 2021;25(10):3921–32. doi:10.1109/JBHI.2021.3072246. [Google Scholar] [PubMed] [CrossRef]
18. Tayal A, Gupta J, Solanki A, Bisht K, Nayyar A, Masud M. DL-CNN-based approach with image processing techniques for diagnosis of retinal diseases. Multimed Syst. 2022;28(4):1417–38. doi:10.1007/s00530-021-00769-7. [Google Scholar] [CrossRef]
19. Huang D, Li R, Qian Y, Ling S, Dong Z, Ke X, et al. Fundus tessellated density assessed by deep learning in primary school children. Transl Vis Sci Technol. 2023;12(6):11. doi:10.1167/tvst.12.6.11. [Google Scholar] [PubMed] [CrossRef]
20. Xie Y, Wan Q, Xie H, Xu Y, Wang T, Wang S, et al. Fundus image-label pairs synthesis and retinopathy screening via GANs with class-imbalanced semi-supervised learning. IEEE Trans Med Imag. 2023;42(9):2714–25. doi:10.1109/TMI.2023.3263216. [Google Scholar] [PubMed] [CrossRef]
21. He HL, Liu YX, Chen XY, Ling SG, Qi Y, Xiong Y, et al. Fundus tessellated density of pathologic myopia. Asia-Pacific J Ophthalmol. 2022;12(6):604–13. doi:10.1097/APO.0000000000000642. [Google Scholar] [PubMed] [CrossRef]
22. Hu X, Zhang LX, Gao L, Dai W, Han X, Lai YK, et al. GLIM-Net: chronic glaucoma forecast transformer for irregularly sampled sequential fundus images. IEEE Trans Med Imag. 2023;42(6):1875–84. doi:10.1109/TMI.2023.3243692. [Google Scholar] [PubMed] [CrossRef]
23. Abdar M, Fahami MA, Rundo L, Radeva P, Frangi AF, Acharya, et al. Hercules: deep hierarchical attentive multilevel fusion model with uncertainty quantification for medical image classification. IEEE Trans Ind Informat. 2022;19(1):274–85. doi:10.1109/TII.2022.3168887. [Google Scholar] [CrossRef]
24. Li R, Guo X, Zhang X, Lu X, Wu Q, Tian Q, et al. Application of artificial intelligence to quantitative assessment of fundus tessellated density in young adults with different refractions. Ophthalmic Res. 2023;66(1):710–20. doi:10.1159/000529639. [Google Scholar] [PubMed] [CrossRef]
25. Celik C, Yücadag İ, Akçam HT. Automated retinal image analysis to detect optic nerve hypoplasia. Inf Technol Control. 2024;53(2):522–41. doi:10.5755/j01.itc.53.2.35152. [Google Scholar] [CrossRef]
26. Akil M, Elloumi Y, Kachouri R. Detection of retinal abnormalities in fundus image using CNN deep learning networks. In: State of the art in neural networks and their applications. Cambridge, MA, USA: Academic Press; 2021. p. 19–61. [Google Scholar]
27. Ramasamy LK, Padinjappurathu SG, Kadry S, Damaševičius R. Detection of diabetic retinopathy using a fusion of textural and ridgelet features of retinal images and sequential minimal optimization classifier. PeerJ Comput Sci. 2021;7:e456. doi:10.7717/peerj-cs.456. [Google Scholar] [PubMed] [CrossRef]
28. Cen LP, Ji J, Lin JW, Ju ST, Lin HJ, Li TP, et al. Automatic detection of 39 fundus diseases and conditions in retinal photographs using deep neural networks. Nat Commun. 2021;12(1):4828. doi:10.1038/s41467-021-25138-w. [Google Scholar] [PubMed] [CrossRef]
29. Tang YW, Ji J, Lin JW, Wang J, Wang Y, Liu Z, et al. Automatic detection of Peripheral Retinal lesions from Ultrawide-Field Fundus images using deep learning. Asia-Pacific J Ophthalmol. 2022;12(3):284–92. doi:10.1097/APO.0000000000000599. [Google Scholar] [PubMed] [CrossRef]
30. Zedan MJ, Zulkifley MA, Ibrahim AA, Moubark AM, Kamari NAM, Abdani SR. Automated glaucoma screening and diagnosis based on retinal fundus images using deep learning approaches: a comprehensive review. Diagnostics. 2023;13(13):2180. doi:10.3390/diagnostics13132180. [Google Scholar] [PubMed] [CrossRef]
31. Shi M, Lokhande A, Fazli MS, Sharma V, Tian Y, Luo Y, et al. Artifact-tolerant clustering-guided contrastive embedding learning for ophthalmic images in glaucoma. IEEE J Biomed Health Inform. 2023;27(9):4329–40. doi:10.1109/JBHI.2023.3288830. [Google Scholar] [PubMed] [CrossRef]
32. Ghouali S, Onyema EM, Guellil MS, Wajid MA, Clare O, Cherifi W, et al. Artificial intelligence-based teleopthalmology application for diagnosis of diabetics retinopathy. IEEE Open J Eng Med Biol. 2022;3:124–33. doi:10.1109/OJEMB.2022.3192780. [Google Scholar] [PubMed] [CrossRef]
33. Goutam B, Hashmi MF, Geem ZW, Bokde ND. A comprehensive review of deep learning strategies in retinal disease diagnosis using fundus images. IEEE Access. 2022;10:57796–823. doi:10.1109/ACCESS.2022.3178372. [Google Scholar] [CrossRef]
34. Nazir T, Irtaza A, Javed A, Malik H, Hussain D, Naqvi RA. Retinal image analysis for diabetes-based eye disease detection using deep learning. J Appl Sci Res. 2020;10(18):6185. doi:10.3390/app10186185. [Google Scholar] [CrossRef]
35. Li B, Chen H, Zhang B, Yuan M, Jin X, Lei B, et al. Development and evaluation of a deep learning model for the detection of multiple fundus diseases based on colour fundus photography. Br J Ophthalmol. 2022;106(8):1079–86. doi:10.1136/bjophthalmol-2020-316290. [Google Scholar] [PubMed] [CrossRef]
36. Shipra EH, Sazzadur Rahman M. An explainable artificial intelligence strategy for transparent deep learning in the classification of eye diseases. In: 2024 IEEE International Conference on Computing, Applications and Systems (COMPAS); 2024; Bangladesh: Cox’s Bazar. p. 1–6. doi:10.1109/COMPAS60761.2024.10797058. [Google Scholar] [CrossRef]
37. Chea N, Nam Y. Classification of fundus images based on deep learning for detecting eye diseases. Comput Mater Contin. 2021;67(1):411–26. doi:10.32604/cmc.2021.013390. [Google Scholar] [CrossRef]
38. Sun G, Wang X, Xu L, Li C, Wang W, Yi Z, et al. Deep learning for the detection of multiple fundus diseases using ultra-widefield images. Ophthalmol Ther. 2023;12(2):895–907. doi:10.1007/s40123-022-00627-3. [Google Scholar] [PubMed] [CrossRef]
39. Oualid RAHMOUNI, Abdelmouaaz MAALEM. Realtime retinopathy detection via a mobile fundus camera [dissertation]. Tebessa, Algeria: University Larbi Tébessi–Tébessa; 2024. [Google Scholar]
40. Rizzo M. Assessing the predictive capability of vascular tortuosity measures in OCTA images for diabetic retinopathy using machine learning algorithms [master’s thesis]. Barcelona, Spain: Universitat Politècnica de Catalunya; 2024. [Google Scholar]
41. Wang Z, Zou H, Guo Y, Guo S, Zhao X, Wang Y, et al. Fundus Image Myopia Development (FIMD) dataset, Mendeley Data, V1. [Internet]. 2023 [cited 2025 Mar 26]. Available from: https://data.mendeley.com/datasets/jkzsh6pcv4/1. [Google Scholar]
Cite This Article
 Copyright © 2025 The Author(s). Published by Tech Science Press.
This work is licensed under a Creative Commons Attribution 4.0 International License , which permits unrestricted use, distribution, and reproduction in any medium, provided the original work is properly cited.
 Downloads
 Citation Tools