
 Submit a Paper
 Propose a Special lssue
 Open Access
ARTICLE

Hybrid Techniques of Multi-CNN and Ensemble Learning to Analyze Handwritten Spiral and Wave Drawing for Diagnosing Parkinson’s Disease
1 Computer Department, Applied College, Najran University, Najran, 66462, Saudi Arabia
2 Department of Computer Science, College of Applied Sciences, Hajjah University, Hajjah, 9671, Yemen
3 Department of Artificial Intelligence, Faculty of Computer Science and Information Technology, Al-Razi University, Sana’a, 9677, Yemen
4 Department of Software Engineering, College of Computer and Information Sciences, King Saud University, Riyadh, 11543, Saudi Arabia
5 Computer Science and Information Technology Department, Thamar University, Dhamar, 9676, Yemen
* Corresponding Author: Mohammed Alshahrani. Email:
(This article belongs to the Special Issue: Advanced Computational Intelligence Techniques, Uncertain Knowledge Processing and Multi-Attribute Group Decision-Making Methods Applied in Modeling of Medical Diagnosis and Prognosis)
Computer Modeling in Engineering & Sciences 2025, 143(2), 2429-2457. https://doi.org/10.32604/cmes.2025.063938
Received 29 January 2025; Accepted 15 April 2025; Issue published 30 May 2025
 View Full Text
 Download PDF
Abstract
Parkinson’s disease (PD) is a progressive neurodegenerative disorder characterized by tremors, rigidity, and decreased movement. PD poses risks to individuals’ lives and independence. Early detection of PD is essential because it allows timely intervention, which can slow disease progression and improve outcomes. Manual diagnosis of PD is problematic because it is difficult to capture the subtle patterns and changes that help diagnose PD. In addition, the subjectivity and lack of doctors compared to the number of patients constitute an obstacle to early diagnosis. Artificial intelligence (AI) techniques, especially deep and automated learning models, provide promising solutions to address deficiencies in manual diagnosis. This study develops robust systems for PD diagnosis by analyzing handwritten helical and wave graphical images. Handwritten graphic images of the PD dataset are enhanced using two overlapping filters, the average filter and the Laplacian filter, to improve image quality and highlight essential features. The enhanced images are segmented to isolate regions of interest (ROIs) from the rest of the image using a gradient vector flow (GVF) algorithm, which ensures that features are extracted from only relevant regions. The segmented ROIs are fed into convolutional neural network (CNN) models, namely DenseNet169, MobileNet, and VGG16, to extract fine and deep feature maps that capture complex patterns and representations relevant to PD diagnosis. Fine and deep feature maps extracted from individual CNN models are combined into fused feature vectors for DenseNet169-MobileNet, MobileNet-VGG16, DenseNet169-VGG16, and DenseNet169-MobileNet-VGG16 models. This fusion technique aims to combine complementary and robust features from several models, which improves the extracted features. Two feature selection algorithms are considered to remove redundancy and weak correlations within the combined feature set: Ant Colony Optimization (ACO) and Maximum Entropy Score-based Selection (MESbS). These algorithms identify and retain the most strongly correlated features while eliminating redundant and weakly correlated features, thus optimizing the features to improve system performance. The fused and enhanced feature vectors are fed into two powerful classifiers, XGBoost and random forest (RF), for accurate classification and differentiation between individuals with PD and healthy controls. The proposed hybrid systems show superior performance, where the RF classifier used the combined features from the DenseNet169-MobileNet-VGG16 models with the ACO feature selection method, achieving outstanding results: area under the curve (AUC) of 99%, sensitivity of 99.6%, 99.3% accuracy, 99.35% accuracy, and 99.65% specificity.Keywords
PD is a neurodegenerative condition that gradually impacts motor function [1]. It arises due to the gradual decline of neurons that produce dopamine within a brain region known as the substantia nigra. Dopamine, a neurotransmitter essential for governing movement and coordination, is involved [2]. The exact cause of PD is still unknown, but it is thought to be caused by a combination of genetic, environmental, and genetic factors [3]. Individuals over the age of 60 are more susceptible to PD, as are genetic and some genetic mutations [4]. PD is first diagnosed based on clinical symptoms and neurological tests. There is no single test to confirm that a patient has PD. There are some clinical and neurological symptoms, such as tremors, especially at rest, slow movement, muscle stiffness, balance problems, and difficulty with coordination [5]. Some techniques help diagnose and evaluate PD. One such technique is the use of drawing tasks, which helps identify specific motor impairments associated with PD [6]. One of the drawing tasks most commonly used in diagnosing PD is the spiral drawing test. In this test, the patient is asked to draw a spiral or a series of spirals using a pen or pencil on a piece of study. Individuals with PD often show characteristic imbalances in their spiral drawings [7]. A wave drawing task is used, where the patient is asked to draw a series of waves or sine curves on a piece of study. This task reveals similar defects, such as microscopic imaging, irregularities, and tremors, which are features of PD. Early diagnosis allows immediate treatment, which helps maintain quality of life and independence for a longer period. Early diagnosis increases the chances of benefiting from neuroprotective treatments, as they are likely to be more effective when administered in the early stages of the disease [8]. With diagnosis, individuals make necessary lifestyle changes, such as exercising regularly, modifying their diet, and modifying their living environment. Early diagnosis helps rule out possible causes of other neurological disorders and ensures appropriate treatment and management [9]. The manual diagnosis of early PD has several limitations. Evaluating early symptoms, such as slight tremors in movement, requires highly skilled health experts [10]. Other neurological conditions overlap with the symptoms of tremor, which causes an obstacle to manual diagnosis [11]. Clinical symptoms vary from one patient to another, which complicates the task of early manual diagnosis. It is difficult to predict the course of the disease because its development varies from one patient to another [12]. In some regions, especially developing countries, health centers are scarce and far apart compared to the number of patients. AI technologies have the potential to address many of the limitations of manual diagnosis of PD by providing data-driven techniques [13]. AI techniques analyze various data sources, such as handwritten spiral and wave drawings, sensor data, or speech recordings, to evaluate and measure subtle changes that can be indicative of early PD [14]. AI techniques excel at identifying complex patterns in large datasets by analyzing multiple and complex data points, such as hand drawing, speech, and gait, which indicate symptoms of PD that are difficult for doctors to detect [15]. AI techniques analyze various biomarkers to identify early indicators of PD [16].
This study develops several techniques that rely on integrating model features from several convolutional neural networks (CNNs). Combining the features of multiple CNNs has the disadvantage of redundant features correlated with the target feature. Therefore, this limitation is overcome by applying feature selection algorithms to eliminate redundant features and those that are weakly related to the target feature. The fused and filtered features from several CNNs are fed to the XGBoost and RF classifier for high-accuracy classification.
The main contributions of this study are as follows:
• Improving images of handwritten spiral and wave drawings using two successive filters, the average and Laplacian filters.
• Isolating ROI from the background using the GVF algorithm.
• Fusing feature maps of DenseNet169, MobileNet, and VGG16 to form fused feature maps for models: DenseNet169-MobileNet, MobileNet-VGG16, DenseNet169-VGG16, and DenseNet169-MobileNet-VGG16.
• Reducing the high-dimensional space using the ACO and MESbS algorithms to select the most important features and classify them using the XGBoost and RF classifiers.
The rest of this study is organized as follows: Section 2 discusses the methods and results of several relevant previous studies; Section 3 explains the methods and tools proposed in this study for analyzing handwritten spiral and wave graphics images for the PD dataset; Section 4 summarizes the performance results of the hybrid systems proposed for diagnostics PD; Section 5 discusses and compares the systems’ performance with previous studies; Section 6 provides the study conclusions.
In this section, the methods and results of previous studies on the diagnosis of PD are discussed. Alissa et al. [17] employed a CNN to diagnose PD based on deviations in their drawing movements. The convolutional classifier, trained on augmented spiral pentagon drawing images, achieved 93.5% accuracy in distinguishing PD from healthy controls. Kurmi et al. [18] developed an ensemble of deep learning (DL) for Parkinson’s prediction using DaTscan. A Fuzzy logic ensemble method was then applied to improve overall classification results. An evaluation was conducted on a public database, yielding a recognition accuracy of 95.34% and a sensitivity of 96.51%. Keles et al. [19] investigated the adaptability of an artificial neural network (ANN) trained images for PD diagnosis. The retrained network, called PARNet, was evaluated for its ability to detect PD. PARNet showed outstanding performance, achieving 95.43% accuracy, 95.25% sensitivity, 95.70% specificity, 97% precision, and 96% F1 score. Vyas et al. [20] introduced DL techniques and introduced two approaches that use 2D and 3D CNNs to diagnose PD. Pre-processing techniques, namely bias field correction, Z-score normalization, and image resizing, were essential for accurate model training. The 3D model achieved 88.9% accuracy with 0.86 AUC, outperforming the 2D model, which achieved a modest 72.22% accuracy with 0.50 AUC. Hireš et al. [21] presented an ensemble of CNNs for PD detection. The results demonstrated the ability of this approach to discriminate between PD patients and healthy individuals for all vowels, with the best performance achieving 86.2% sensitivity, 93.3% specificity, and 89.6% AUC. Vidya et al. [22] developed a signal analysis of a classification model using hybrid CNN-LSTM (Long short-term memory) to predict PD and assist doctors in diagnosis. Vertical ground reaction force (VGRF) signals were first analyzed for variance and then analyzed using empirical mode decomposition to extract important intrinsic containing key features. Sahu et al. [23] presented a hybrid approach, namely approximate sets and artificial neural networks, for effective diagnosis of PD. Pre-processing and estimation of pre-processed data were performed using regression analysis (RA). The calculated results showed the superiority of the system, as it achieved an accuracy of 93.46%. Pahuja and Prasad [24] presented DL frameworks, features, and models to PD. Under the feature framework, all features in a heterogeneous dataset were combined and fed into two deep learning models for diagnosis. The models achieved an accuracy of 93.33% for CNN in feature. Zhao et al. [25] employed a greedy method to combine CNN. The greedy method achieved an AUC of 94.1%. Lilhore et al. [26] applied a hybrid model that uses enhanced feature analysis utilizing CNN for PD recognition. The model operated in multiple stages, including noise removal, feature extraction using the ResNet-50 CNN model, and the final classification stage. The accuracy levels achieved by the CNN and XGBoost models were 72.69% and 90.81%, respectively. Li et al. [27] presented a convolution network to facilitate the diagnosis of PD and enhance diagnostic accuracy by investigating various features of spiral hand drawings. Thereafter, a spiral hand drawing was created to accurately capture the vibration, shape, and spacing of the images without being limited to specific application scenarios. CC-Net achieved a classification accuracy of approximately 89.3%. Faragó et al. [28] presented a workflow for analyzing continuous speech samples and explored the effectiveness of Wiener filtering for speech denoising in characterizing Parkinsonian speech. The workflow used feature evaluation to identify feature differences, followed by convolutional neural network-based speech classification. It achieved the highest classification accuracy of 93%. Shaban and Amara [29] presented a DL based on the 20-layer. This approach reached a sensitivity of 95.4% and a weighted kappa of 94%. Dzotsenidze et al. [30] introduced generative adversarial networks (GANs) to synthesize drawing tests obtained from PD. The results indicated that image augmentation generated by GAN outperforms standard augmentation techniques in PD classification. The StyleGAN2-ADA (adaptive discriminator augmentation) + LeCam network with AlexNet data augmentation achieved a sensitivity of 88.6% and a specificity of 68.6%. Quan et al. [31] presented a DL model for PD detection. The model used distributed CNNs to extract the dynamic features of the time series and CNNs to capture the features. Visualization of the features generated by the model revealed that the dynamic features effectively captured the frequency domain characteristics and reduced contrast. The model reached an accuracy of 81.6%.
It is clear that all researchers devoted their efforts and time to getting satisfactory results by reviewing the methodology and results of previous studies. Satisfactory results remain the goal of all researchers. It is also clear from previous studies that there is a scientific gap in the lack of optimal exploitation of CNN in extracting deep features. Therefore, this problem was addressed in this study by focusing on extracting features from many CNN models and then merging them into feature maps sequentially to form fused feature vectors from many CNN models. Feature selection algorithms were also applied to focus on the essential features that are strongly associated with the target features and eliminate redundant features.
Fig. 1 shows the framework of the proposed hybrid systems for analyzing handwritten spiral and wave graphics of the PD dataset. Images were enhanced with an average filter followed by a Laplacian filter. The region of interest (handwriting) was segmented by the GVF algorithm. Feature extraction for handwriting drawing features was done using DenseNet169, MobileNet, and VGG16 models. The features of the CNN were combined as DenseNet169-MobileNet, MobileNet-VGG16, DenseNet169-VGG16, and DenseNet169-MobileNet-VGG16 models. The features were reduced, and the important ones were selected using the ACO and MESbS methods. Finally, the fused and enhanced features were fed to the XGBoost and RF classifiers for classification, and promising results were obtained.
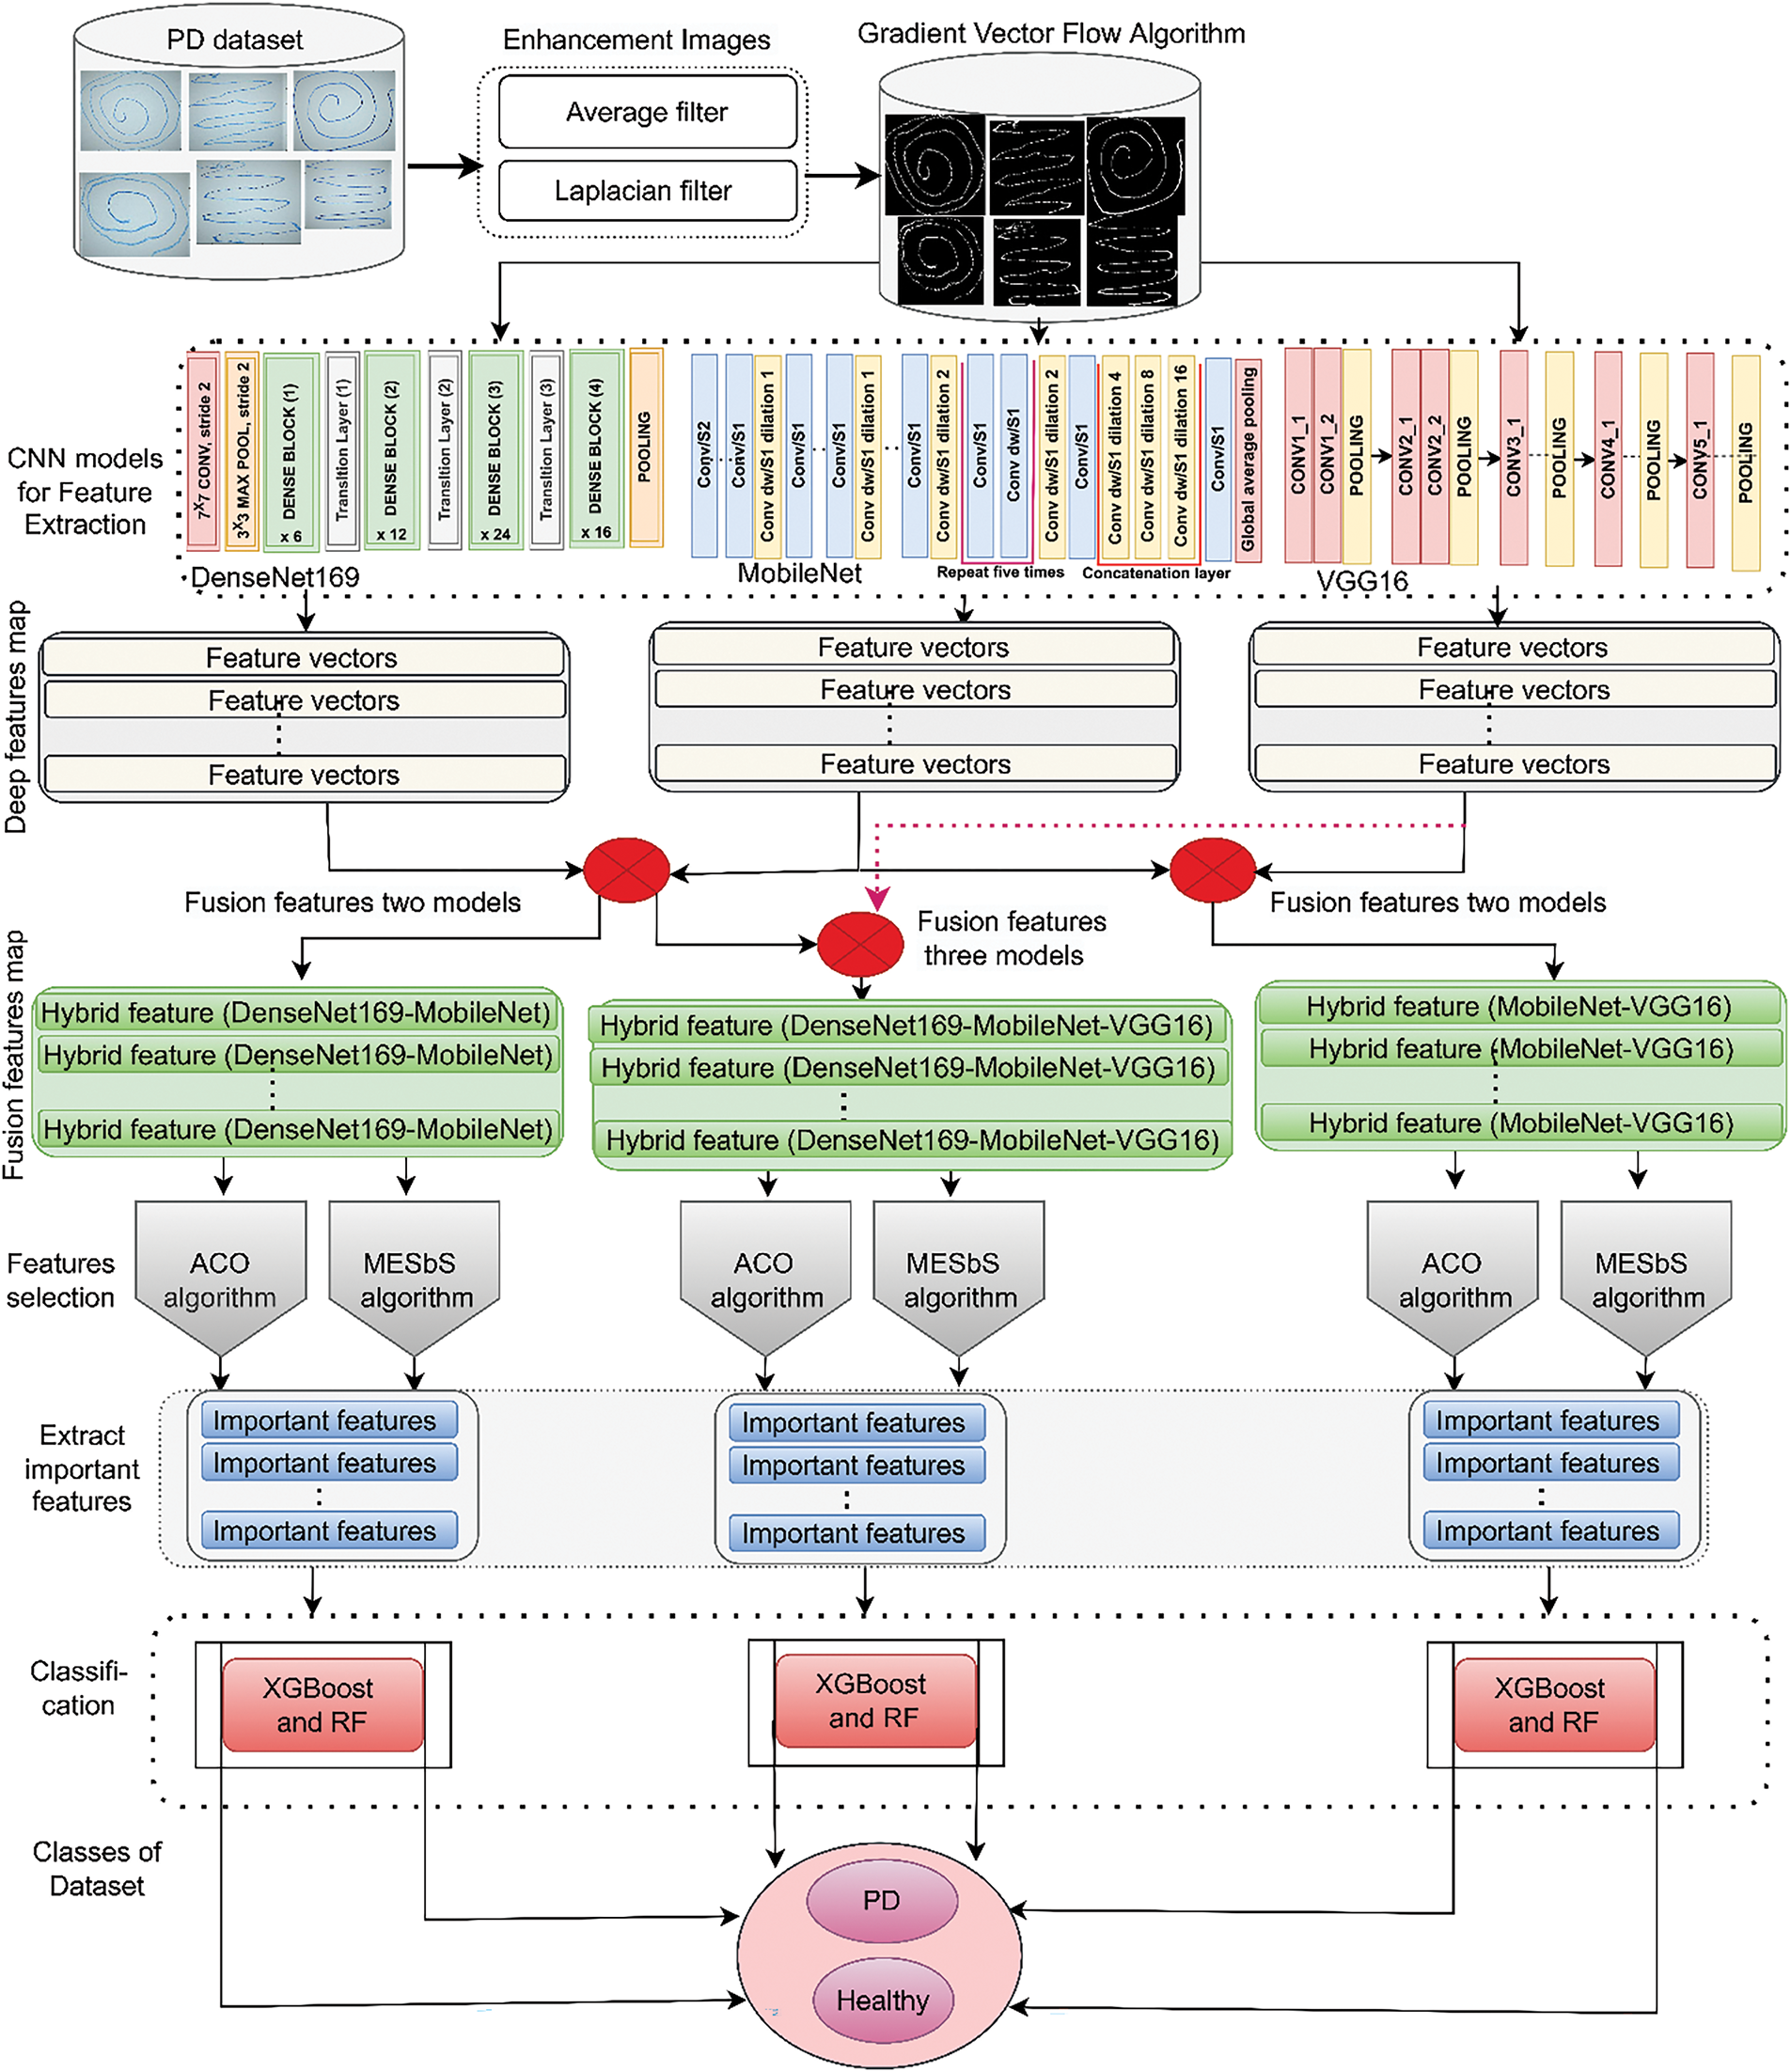
Figure 1: The proposed hybrid systems framework for analyzing handwritten spiral and wave graphic images of the PD dataset
3.1 Description of the PD Dataset for Spiral and Wave Graphics
The fused systems in this study were evaluated using a handwritten dataset of patients with essential tremors. The dataset was created by Scott Mader and evaluated at the Federal University [32]. The dataset consists of 204 images of handwriting from Parkinson’s patients and healthy controls, divided equally [33]. The dataset includes handwritten wave and spiral images. A data augmentation technique was applied to the dataset to overcome the problems of overfitting. Images were created artificially from each original image using operations such as rotation, flip, shift, and others. The dataset images were increased from 204 images to 3060 images for the PD and healthy subjects.
3.2 Enhancement PD Images for Spiral and Wave Graphics
Improving images of handwritten spiral and wave drawings is important for patients with tremors. AI techs gain valuable insights into the severity of a patient’s tremor, bradykinesia, and overall motor control by analyzing the quality and regularity of the spirals and waves drawn. The characteristic appearance of the drawings, such as the presence of irregularities or patterns of tremors, helps in the diagnosis of PD [34]. The degree of distortion or irregularity in the drawings provides a quantitative measure of the severity of the patient’s tremor or motor impairment. In this study, two successive filters were used: the average filter to remove unwanted artifacts and the Laplacian to show the edges of spiral and wave lines.
The average filter is a simple and effective technique used in image processing to remove noise and remove unwanted blemishes from images. This study uses an average filter with an operating factor of 5 × 5 that helps improve the images to analyze PD images of spiral and wave patterns [35]. Each target pixel value is replaced by the average value of 25 neighboring pixels, as in Eq. (1).
where the
Applying an average filter to PD images of spiral and wave drawings will smooth out noise and unwanted artifacts, resulting in a better and more consistent representation of handwritten patterns. The images are then passed into a Laplacian filter to show the edges of the hand-drawing lines.
Laplacian filter is a second-order derivative filter used in image processing to detect edges. It is important for enhancing the edges of hand-drawn lines in PD images of spiral and wavy drawings of the PD dataset, as it highlights areas of rapid changes in intensity that correspond to line boundaries or edges [36]. The Laplace filter is defined as the sum of the second-order derivatives of the image function f(x, y) concerning x and y as in Eqs. (2)–(4) [37].
where x and y are as in Eqs. (3) and (4).
The Laplacian filter operation is represented as a convolution between the input image I(x, y) and the Laplacian kernel K, as in Eq. (5).
where
Applying a Laplacian filter to PD images of spiral and wavy drawings highlights the edges or boundaries of hand-drawn lines by producing strong positive and negative responses at these locations. Finally, enhanced images are obtained with better visible edges, as shown in Fig. 2, and are fed to a segmentation to isolate the hand-drawn lines.
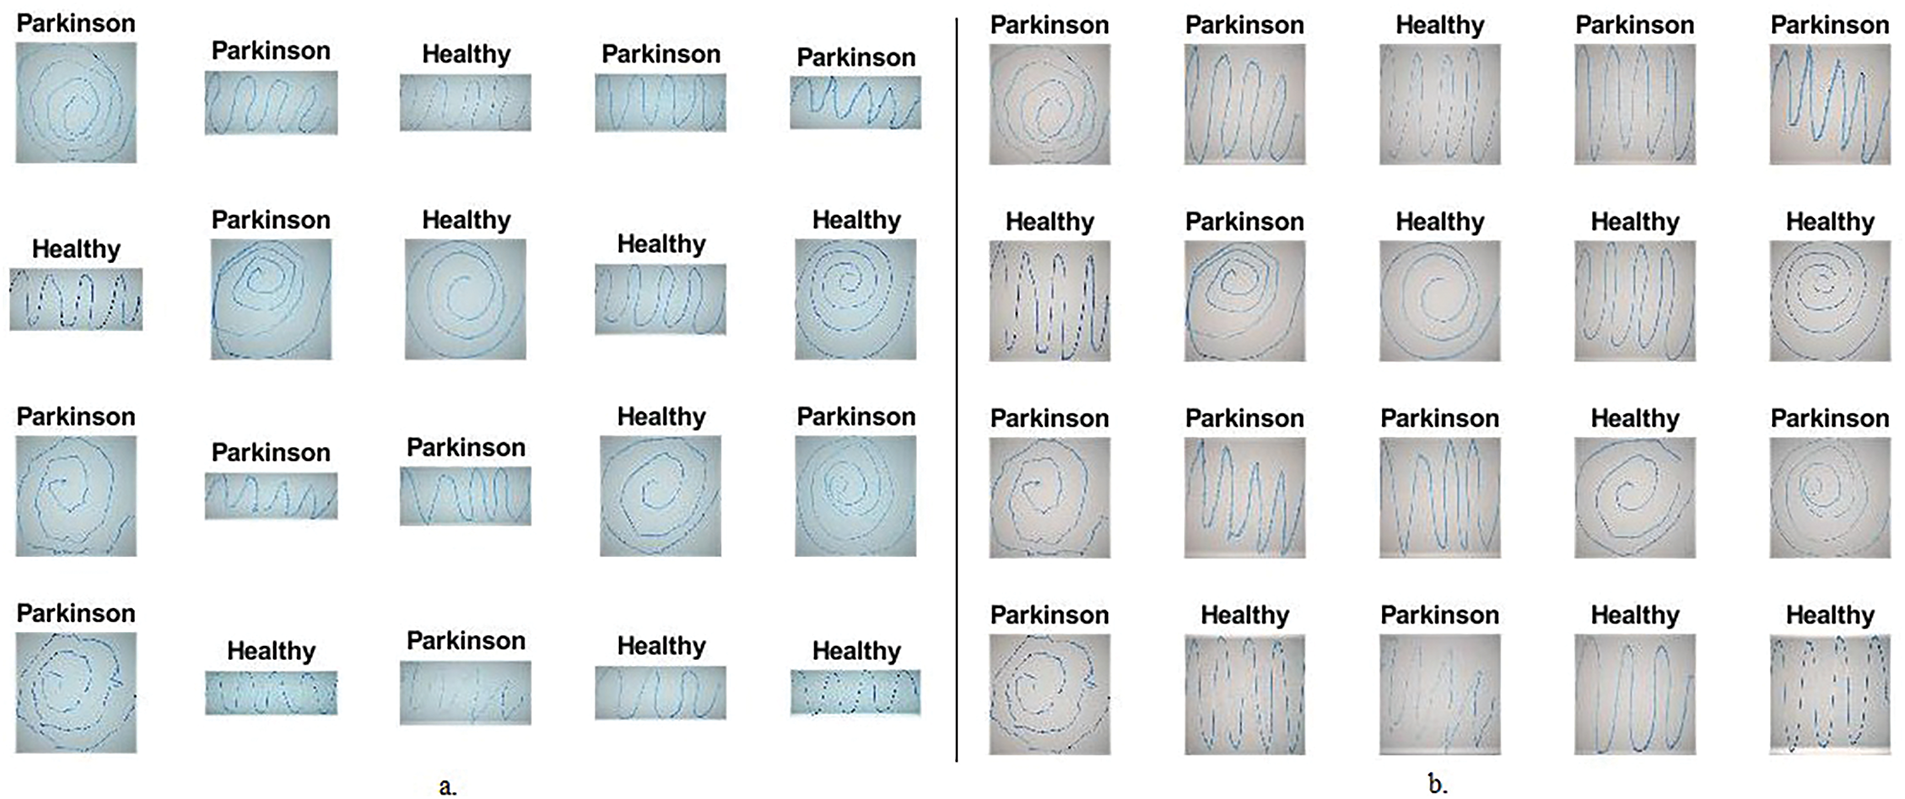
Figure 2: Samples of handwritten spiral and wave graphics images for the PD dataset. a. Original graphics b. After enhancement
3.3 Gradient Vector Flow Algorithm
Using the GVF algorithm to separate freehand lines ROI is essential for accurate analysis of PD images for spiral and wave graphics. The GVF algorithm is applied to effectively capture the edges of objects within the image, making it suitable for extracting hand-drawn spiral and wave lines from the background in PD images. Systems focus their analyses on relevant areas of interest without interference from background or other unrelated areas by carefully separating the lines [38]. The GVF algorithm is an iterative process that calculates a vector field from the image, which is then utilized to direct an active contour toward the edges of the desired object. The GVF algorithm works by solving the partial differential equation (PDE) that defines the vector field as in Eq. (6).
where V(x, y) is the GVF vector field to be calculated, f(x, y) is the input image, ∇ is the gradient factor, ∇2 is the Laplacian factor, and μ is a regularization controlling the trade-off between field smoothness and gradient matching.
The first term μ∇2V(x, y) in the equation imposes smoothness of the vector field, while the second term (V(x, y) − ∇f(x, y))/∇f(x, y) /2 ensures that the A vector corresponds to gradients (edges) in the input image [39]. The algorithm iteratively updates the vector field V(x, y) using Eq. (7) to solve this PDE numerically.
where n is the iteration number, b is a constant controlling the trade-off between the current and previous vector field values, γ and c are constants controlling the smoothness and gradient fit conditions, respectively.
The GVF starts with an initial vector field, usually set to the gradient of the input image: V(x, y)0 = ∇f(x, y). It then iteratively updates the vector field using the above equation until it converges to a stable solution. Once the GVF vector field is calculated, it is utilized to distort the active contour towards the desired object boundaries (hand-drawn lines) in the image. The active contour is initially placed close to the object of interest and then iteratively deformed by a GVF vector field until it aligns with the object’s boundaries. Then, the deformation is subject to the active contour as in Eq. (8).
where
Iteratively updating the active contour using a GVF vector field draws it towards the hand-drawn lines in the PD image, accurately and efficiently separating it from the rest of the image. The ability of the GVF to handle complex object boundaries, including cavities and discontinuities, as in this dataset, makes it particularly useful for separating irregular and discontinuous hand-drawn lines in PD, as shown in Fig. 3. The separated lines are then fed to CNN for accurate analysis and extraction of deep feature maps.
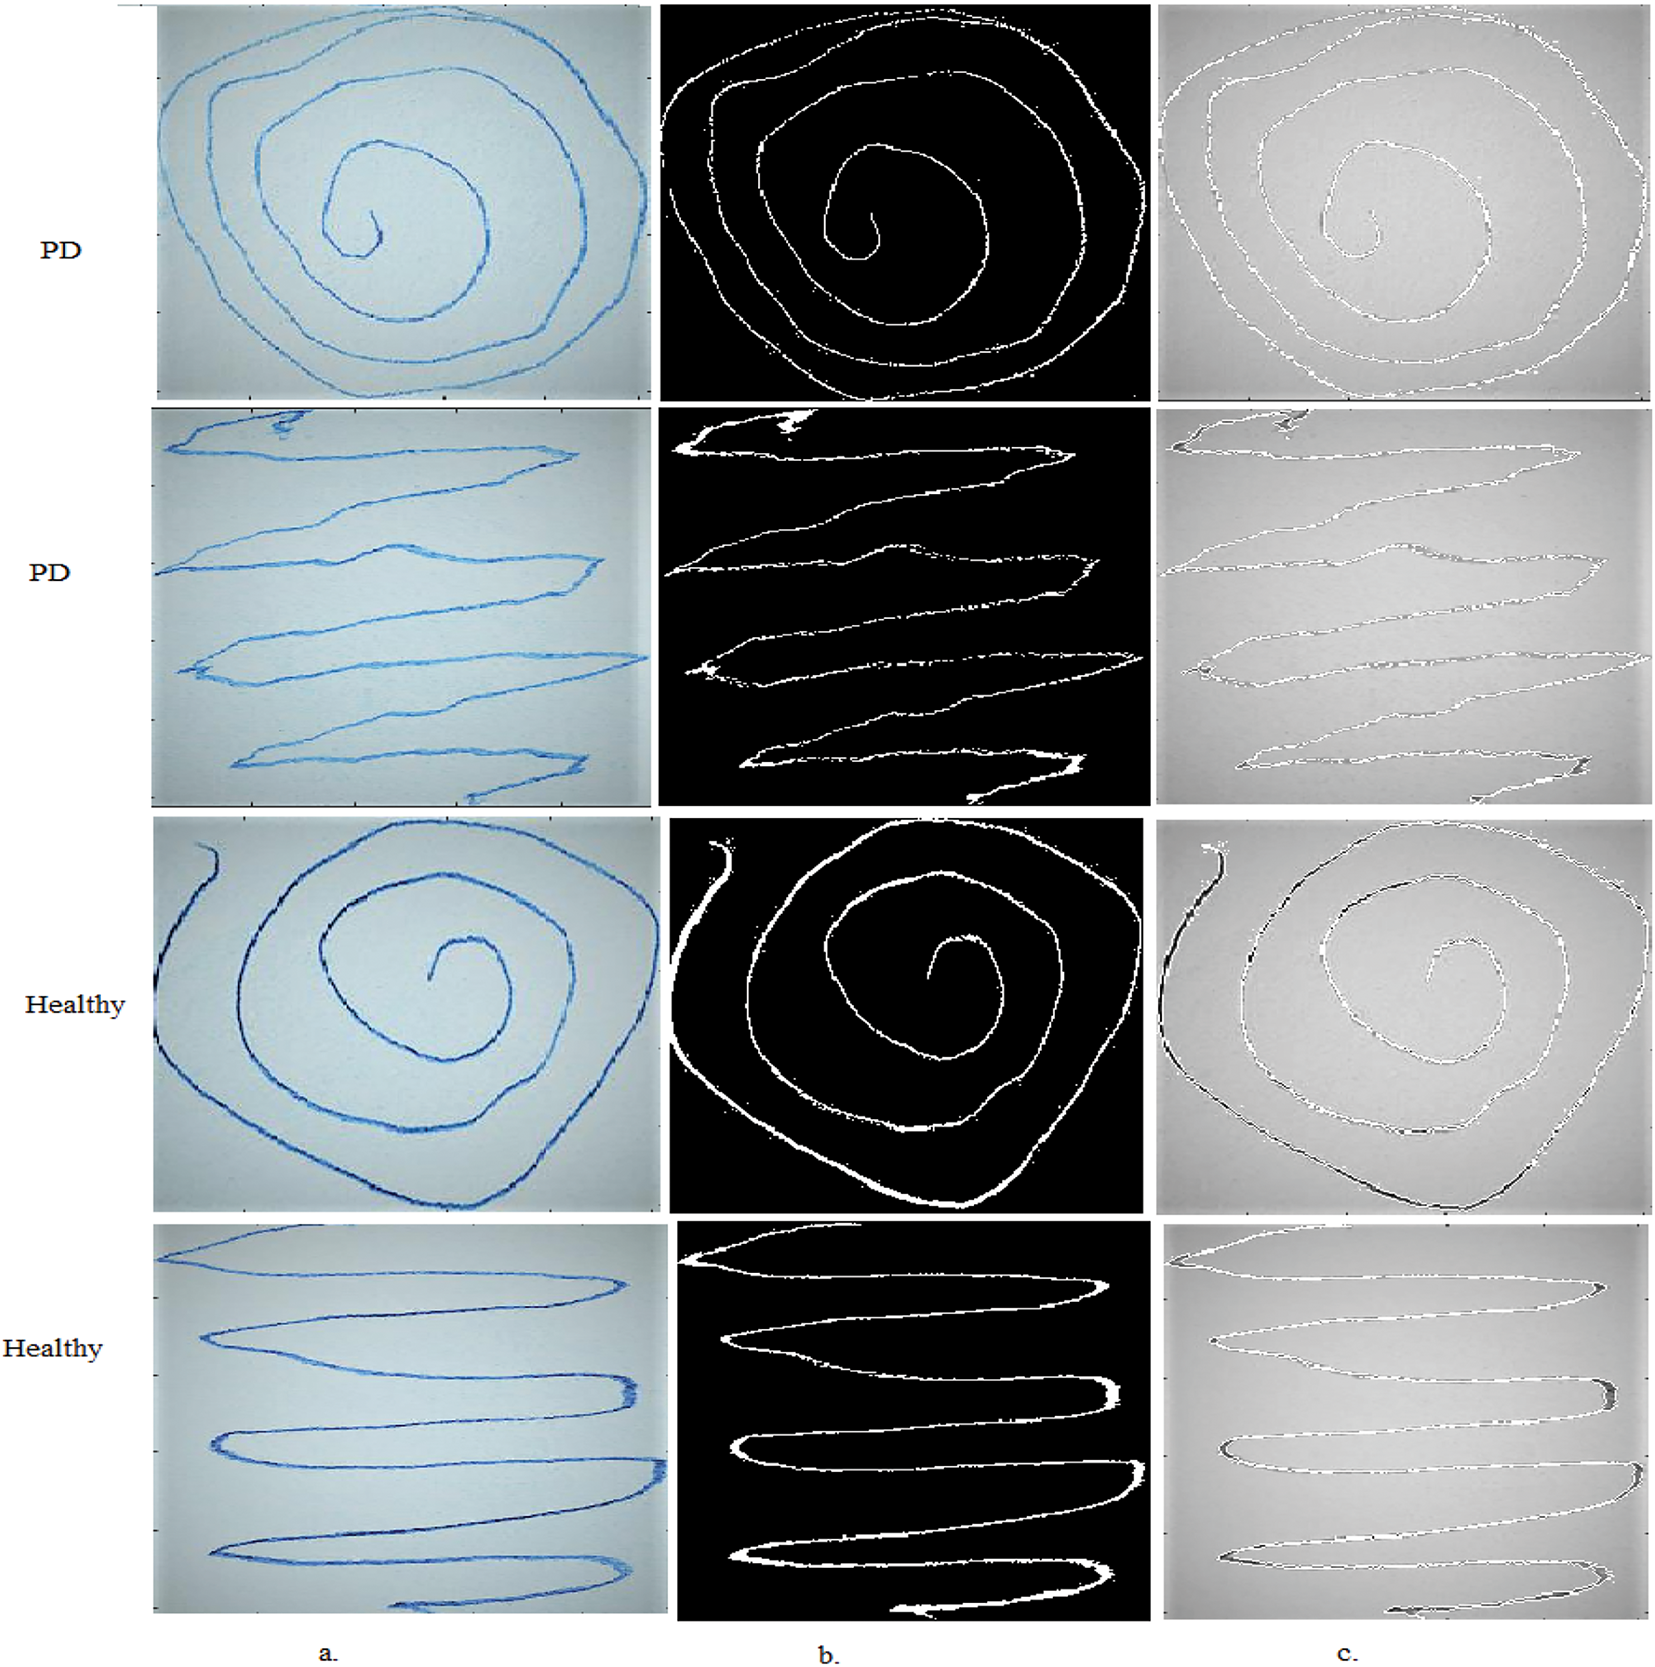
Figure 3: Samples of handwritten spiral and wave graphics images for the PD dataset a. Original drawings b. After segmentation c. ROI
3.4 Extracting Deep Feature Maps
The application of CNN to extract features from PD images of spiral and wave graphics is important. CNN models learn high-level abstract features that capture complex patterns and representations within images that are difficult to extract with traditional methods [40]. Training CNN models on large datasets, making them more robust and generalizable to other datasets. The important CNN layers are convolutional, pooling, fully connected, and auxiliary layers [41]. Convolutional layers in CNNs are designed to extract deep feature maps from input PD images by applying a set of learnable filters that convolve around the image. This process includes three primary parameters: filter size, step (p-step), and zero padding. The filter size determines the spatial extent of the filter that slides over the input image [42]. The size of the filter controls the receptive field, which contributes to the value of a particular feature map. The p-step parameter controls the step size that the filter slides across the input image. Zero padding is the process of adding zero-valued boundaries to the input image [43]. Zero padding allows filters to wrap around image boundaries, preserving the dimensions of the output feature. Stacking multiple convolutional layers causes the CNN to learn increasingly complex and abstract feature representations from the input PD dataset images [44]. Deeper layers combine these low-level features to represent higher-level concepts or patterns relevant to the task at hand (identifying tremors or irregularities in spiral and wave PD drawings).
Pooling layers in CNNs play a key role in reducing the dimensionality of deep feature maps generated by convolutional layers. These layers operate on feature maps, effectively reducing spatial dimensions while preserving essential features. There are two commonly used pooling methods: Maximum Pooling and Average Pooling. Max-pooling is the most widely used pooling technique in CNNs [45]. It works by moving a fixed-size window across the input feature map and outputting the maximum value within each window. This process is repeated for each window position, as in Eq. (9). Average pooling is similar to maximum pooling, but instead of taking the maximum value within each window, it averages the values. This process is repeated for all window positions, as in Eq. (10) [46].
where f is the filter applied to the image, while m and n are the specific locations in the matrix, the parameter k is the number of pixels, and p is the step size.
This study uses the CNN models of DenseNet169, MobileNet, and VGG16 to extract deep feature maps associated with spiral and wave handwriting from 3060 images. These CNN models transform input images into features that are highly representative of complex morphological features of spiral and wave graphs through convolution and pooling layers. The dimensions of the output images of the final convolutional layer are: (32, 32, 640) for DenseNet169, (7, 7, 1024) for MobileNet, and (7, 7, 512) for VGG16. This study employs a global average pooling (GAP) layer to produce features of sizes 1920 for DenseNet169, and 1664 for MobileNet for each input image to represent these high 2D feature maps into 1D vectors for classification. The PD dataset containing 3060 images is encoded into distinct dimensions of 3060 × 1664 using DenseNet169, 3060 × 1024 using MobileNet, and 3060 × 4096 using VGG16. In this study, feature maps from several CNNs are combined as follows: DenseNet169-MobileNet, MobileNet-VGG16, DenseNet169-VGG16, and DenseNet169-MobileNet-VGG16. The process of merging feature maps from several CNNs leads to high feature maps that contain redundant and unimportant features. Therefore, the ACO and MESbS were applied to remove redundant and unimportant features and retain important feature vectors.
3.5 Selection Important Features
Applying feature selection algorithms after integrating the features of several CNN (DenseNet169-MobileNet, MobileNet-VGG16, DenseNet169-VGG16, and DenseNet169-MobileNet-VGG16) extracted from spiral and wave hand drawing images of PD is of great importance. Each model extracts hundreds or thousands of features from the image, forming high-dimensional feature vectors when features from several CNN models are fused. Each CNN model extracts hundreds or thousands of features from input images, resulting in a high feature space when combining features from multiple models. Feature selection algorithms help reduce the features of combined feature spaces by identifying and retaining the most relevant and informative features while eliminating redundant or irrelevant features [47]. After applying feature selection algorithms, the performance of the systems improves in general. Feature selection algorithms help identify the essential features that are strongly associated with a target and that contribute to prediction. Reducing the dimensions of features also improves computational efficiency, especially with large datasets. After applying feature selection algorithms, the systems can generalize to evaluate other datasets.
This study employs ACO and MESbS for feature selection. These techniques significantly reduced model complexity, training time, and memory consumption, making the system more suitable for real-world healthcare deployment.
The computational efficiency of ACO and MESbS are analyzed in terms of feature space reduction and search optimization:
ACO for Feature Selection: The computational complexity of ACO is about O (n × m × t), where n is the number of functions, m is the number of ants, and t is the number of iterations. ACO reduces redundant functions and accelerates the learning system’s convergence by probabilistically selecting the maximum relevant features.
MESbS for Feature Selection: The algorithm evaluates feature subsets iteratively, leading to an approximate O(n2) complexity in the worst case. However, the entropy-based selection criterion significantly reduces the number of iterations needed for convergence.
Memory and Storage Optimization: Reducing features reduces Random Access Memory (RAM) consumption during training and inference. Since fewer features must be stored, the dataset’s overall size decreases, facilitating efficient data handling in clinical applications. Reduced training time makes the proposed system more feasible for real-time healthcare deployment, particularly in resource-limited environments.
3.5.1 Ant Colony Optimization Algorithm
The ACO algorithm is a bio-inspired metaheuristic algorithm that is effectively used for feature selection in high-dimensional datasets, such as combined features extracted from multiple CNN models (DenseNet169-MobileNet, MobileNet-VGG16, DenseNet169-VGG16 and DenseNet169-MobileNet-VGG16) used on graphics images. Spiral and wave manual for PD patients [48]. The ACO algorithm works based on the behavior of ant colonies in searching for food. Ants build pheromone trails when searching for food. Over time, pheromone pathways enhance access to food sources, allowing the colony to build the closest solution. Describe the mechanism of the ACO algorithm to select the most important feature as follows [49]:
Initialization: Let F = {f1, f2, … , fn} be the set of n features extracted from the multi-CNN models. Initializing a pheromone matrix τ, where τij represents the pheromone value associated with feature fj for ant i. Initializing the number of ants (k) and the maximum number of iterations (maxIter).
Ant Colony Construction: For each ant i (i = 1, 2, … , k): a. Initializing an empty feature subset Si. b. For each feature fj (j = 1, 2, … , n): Calculating the probability pij of selecting feature fj using the following as in Eq. (11).
where τij is the pheromone value associated with feature fj of ant i, ηj is the heuristic value associated with the feature fj, a and b are the parameters that control the relative importance of the pheromone and indicative values, respectively, Ni is the set of features that are not yet included in Si and feature fj is identified with probability pij and added to Si.
Pheromone updating: After all ants have built feature subsets, the pheromone values are updated as in Eqs. (12) and (13).
a. Evaporation:
b. Reinforcement: For each ant i and feature fj in Si, update
where Δ
Iteration and termination: The previous two steps are repeated until the stopping criterion is met. Feature subset selection: After the algorithm is finished based on the completion criterion, the subset(s) of features with the highest correlation to the target feature are selected [50]. The ability of the ACO algorithm to explore the feature space and select feature subsets with the highest correlation with target features through pheromone enhancement makes it an effective feature selection technique, especially with high-dimensional datasets collected from many CNNs. Finally, the features that are most closely related to the target feature are inputted into the XGBoost and RF classifiers to classify them.
3.5.2 Maximum Entropy Score-Based Selection Algorithm
The MESbS algorithm is an efficient feature selection method that aims to select important and relevant features from high-feature vectors. The algorithm is useful in this study to reduce the dimensionality of fused features from multiple CNN models (DenseNet169-MobileNet, MobileNet-VGG16, DenseNet169-VGG16, and DenseNet169-MobileNet-VGG16) applied to spiral and wavy PD hand graphics images. The MESbS algorithm is based on the concept of maximum entropy, based on the probability distribution that best represents the current state of knowledge by having maximum entropy, subject to known constraints or data. The MESbS mechanism for selecting the most important features from a probability density function (PDF) representation of the dataset is described as follows [51]:
Feature classification: X = {x1, x2, … , xn} is let be the set of n features extracted from multiple CNN models. For each feature xi (i = 1, 2, … , n), the maximum entropy score (MES) is calculated using Eq. (14).
where
where
Selecting a subset of features: The features are ranked in descending order based on the MES results. The k important features with the highest MES scores are selected as a subset of the selected features. The MESbS algorithm aims to select features that have the highest entropy
The XGBoost classifier is an efficient machine learning method that effectively handles the combined features obtained from multiple CNN models (DenseNet169-MobileNet, MobileNet-VGG16, DenseNet169-VGG16, and DenseNet169-MobileNet-VGG16) used on spiral and wave hand drawing images of PD patients. XGBoost starts by initializing a set of weak base learners, which are decision trees. These essential learners are initially assigned to predict PD [52]. XGBoost trains a series of decision trees (base learners) iteratively by minimizing a loss function. During each iteration, an additional decision tree is incorporated into the ensemble, and its predictions are combined with those of previous decision trees. The new decision tree is trained to predict the errors of the previous group, effectively correcting the errors made by the previous decision trees. The training process in XGBoost is based on the gradient boosting principle [53]. The gradient is then utilized to determine the direction in which the new basic decision tree should be trained to minimize the loss function. After the training process, the XGBoost classifier makes predictions on the new data (test dataset) by summing the predictions of all decision trees in the set. The final prediction is a weighted sum, where the contribution of each underlying decision tree is proportional to its performance during the training process. Therefore, XGBoost is a powerful choice for classifying fused features from several CNN models used on spiral and wave graphics of PD.
The RF classifier is an ensemble learning method that effectively handles the fused features of multiple CNN models (DenseNet169-MobileNet, MobileNet-VGG16, DenseNet169-VGG16, and DenseNet169-MobileNet-VGG16) used on helical and waveform graphical images of the handwriting of PD patients. The RF classifier is built on bootstrap aggregating, which involves creating multiple decision trees. Each decision tree extracts a bootstrap sample from the original training dataset with replacement [54]. Although selecting features for each decision tree, the RF classifier operates on a random distribution in every node. At each node in the tree, a random subset of the combined features of the CNN models is selected [55]. Therefore, randomization eliminates the correlation between individual decision trees, which improves generalization performance and reduces the risk of overfitting. After all decision trees are generated, the RF classifier makes predictions on the test dataset by taking the majority votes among the individual tree predictions [56]. The new photo is assigned to the class with the largest number of votes. Therefore, RF is a powerful choice for classifying fused features from several CNN models used on spiral and wave graphics of PD.
4 Results of the Proposed Hybrid Methodologies
4.1 Split of PD Dataset for Spiral and Wave Graphics
The performance of the systems proposed in this work was evaluated on handwritten spiral and wave graphics images of the PD dataset. The dataset consists of 3060 images equally divided between the PD and Healthy classes. The dataset was divided into 80% for training and validation (80:20), where 979 handwritten graphic images were allocated equally to the training phase for each class. Each class was also allocated 245 handwritten graphic images for the validation phase. Although 306 handwritten graphic images were allocated for the performance testing phase.
4.2 Performance Measures of Methodologies
In this work, the performance of the proposed hybrid systems is evaluated using two metrics: Confusion Matrix and Area Under the Curve (AUC). The confusion matrix is a powerful tool for evaluating performance. It is considered effective for assessing model performance because it provides a detailed analysis of actual class labels compared to model predictions. The dataset represents all correctly classified instances in the cells of the main diagonal, called True Positives (TP). On the other hand, incorrectly classified samples are represented in the other cells, which include False Positives (FP) and False Negatives (FN). The Receiver Operating Characteristic (ROC) curve is another widely used measure to evaluate system performance. Eqs. (17)–(21) show the metrics utilized to measure the performance of the systems, where the variables are derived from the confusion matrix and AUC.
4.3 Performance Results of Pre-Trained CNN Models
This section shows the results of the DenseNet169, MobileNet, and VGG16 for analyzing handwriting spiral and wave graphic images on the PD dataset. The ImagNet dataset consists of over a million images from over a thousand classes. Unfortunately, this dataset has no handwritten spiral and wave graphics images. Thus, the knowledge gained by the CNN models was transferred to train the ImagNet dataset to perform new tasks, namely classifying handwritten spiral and wave graphic images for the PD dataset.
Table 1 and Fig. 4 summarize the results of the models DenseNet169, MobileNet, and VGG16, analyzing handwriting spiral and wave graphic images on the PD dataset. DenseNet169 reached an AUC of 91.35%, sensitivity of 91.8%, accuracy of 91.3%, precision of 91.3%, and specificity of 91.65%. MobileNet has an AUC of 90.75%, sensitivity of 91.6%, accuracy of 91.8%, precision of 91.85%, and specificity of 91.55%. The VGG16 reached an AUC of 90.15%, sensitivity of 90.85%, accuracy of 90.5%, precision of 90.55%, and specificity of 90.7%.
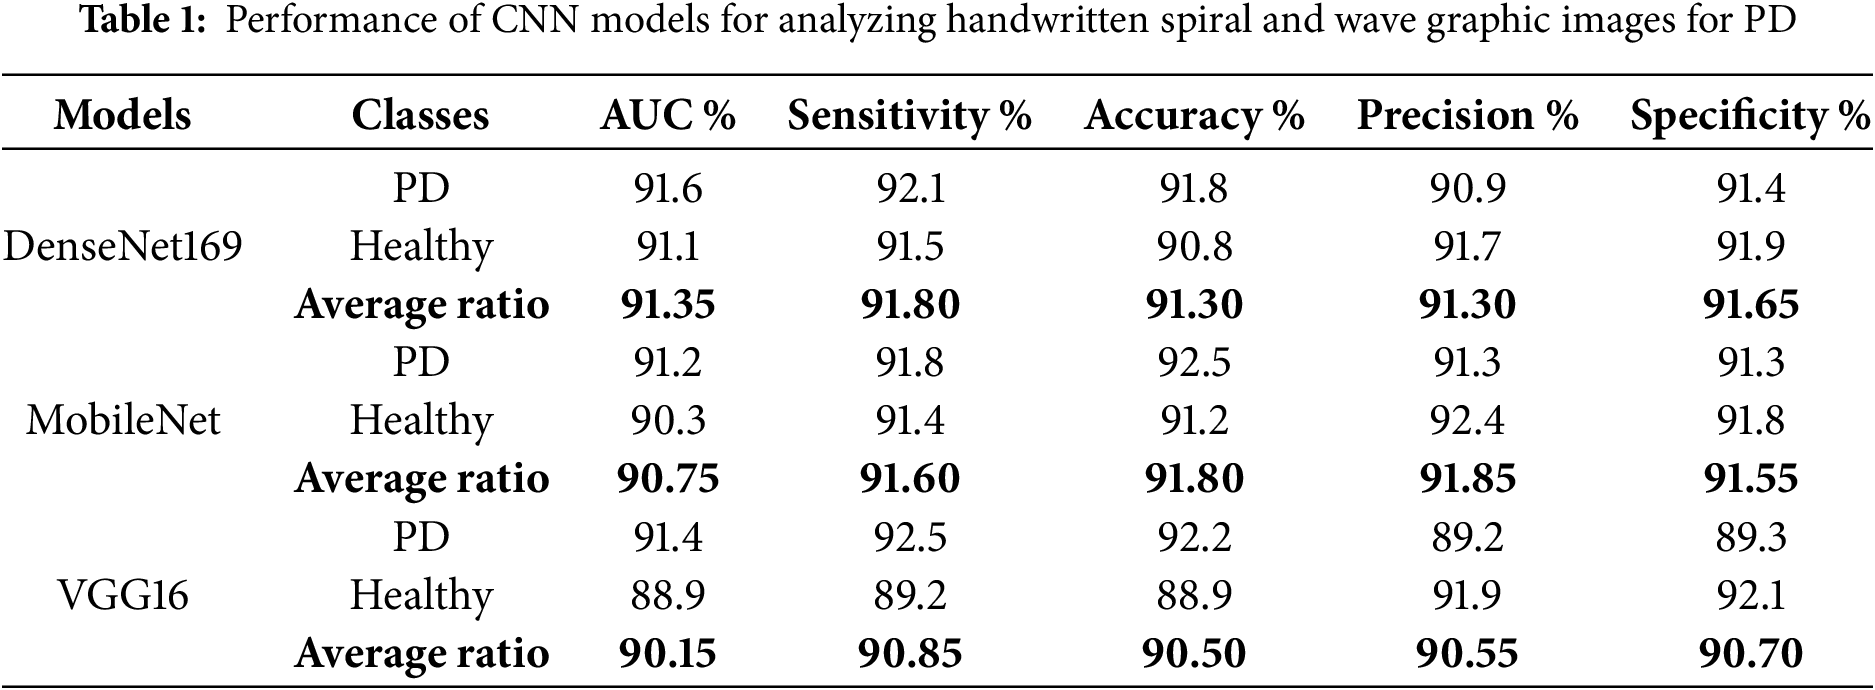
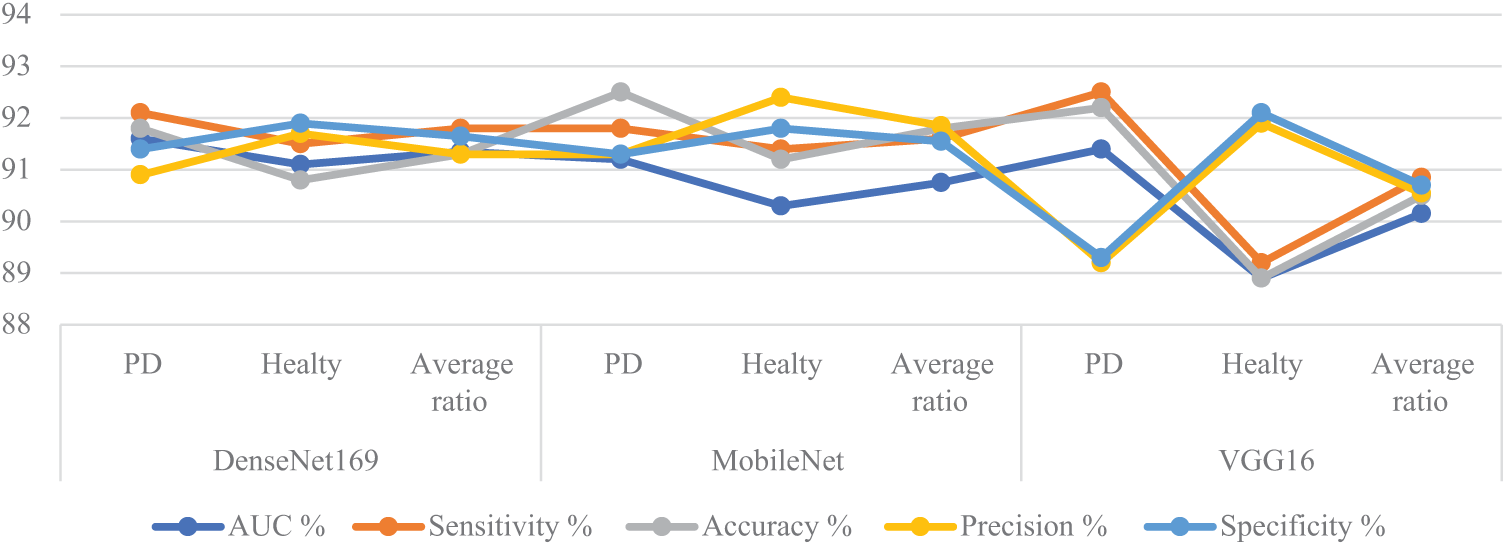
Figure 4: Display of CNN results for analyzing handwritten spiral and wave graphic images for the PD dataset
4.4 Results of Machine Learning Classifiers with Multi-CNN Based on the ACO Algorithm
The section presents the results of the hybrid model proposed by XGBoost and RF classifiers with fused features from several CNN with ACO to analyze handwritten spiral and wave graphical images for the PD. The graphic was passed through two filters, Average and Laplacian, to enhance the handwritten graphic. ROI (handwriting drawings) were segmented by the GVF. ROI was fed to DenseNet169, MobileNet, and VGG16 to extract features and save them in feature vectors. The feature vectors of several CNNs were sequentially integrated as follows: DenseNet169-MobileNet, MobileNet-VGG16, DenseNet169-VGG16, and DenseNet169-MobileNet-VGG16. Fused features were preserved from many CNNs, but they were high dimensional and contained redundant features. Therefore, the fused features were passed to the ACO to select the features that were strongly associated with the target feature. The fused and selected features were passed to XGBoost and RF classifiers to classify them with high accuracy.
The results evaluation of the XGBoost classifier with fused features extracted from multiple CNN models using the ACO algorithm for feature selection is summarized in Table 2 and illustrated in Fig. 5. These results pertain to analyzing handwritten spiral and wave graphic images from the PD dataset. Among the investigated models, the DenseNet169-MobileNet-VGG16-XGBoost model achieved the highest diagnostic performance, outperforming the other configurations. Specifically, this hybrid model attained an impressive AUC of 98.95%, sensitivity of 98.95%, accuracy of 99.15%, precision of 99.15%, and specificity of 99%. The DenseNet169-MobileNet-XGBoost model exhibited competitive results, with an AUC of 97.9%, sensitivity of 98.75%, accuracy of 98.5%, precision of 98.55%, and specificity of 98.55%. The MobileNet-VGG16-XGBoost achieved an AUC of 97.75%, sensitivity of 98.25%, accuracy of 97.9%, precision of 97.9%, and specificity of 98.05%. Lastly, the DenseNet169-VGG16-XGBoost model demonstrated an AUC of 96.5%, sensitivity of 97.35%, accuracy of 97.1%, precision of 97.1%, and specificity of 97.05%. This study highlights the superiority of the DenseNet169-MobileNet-VGG16-XGBoost hybrid model, which utilized the fused features extracted from multiple CNN and the discriminative power of the XGBoost classifier, augmented by the efficient feature selection capabilities of the ACO algorithm.
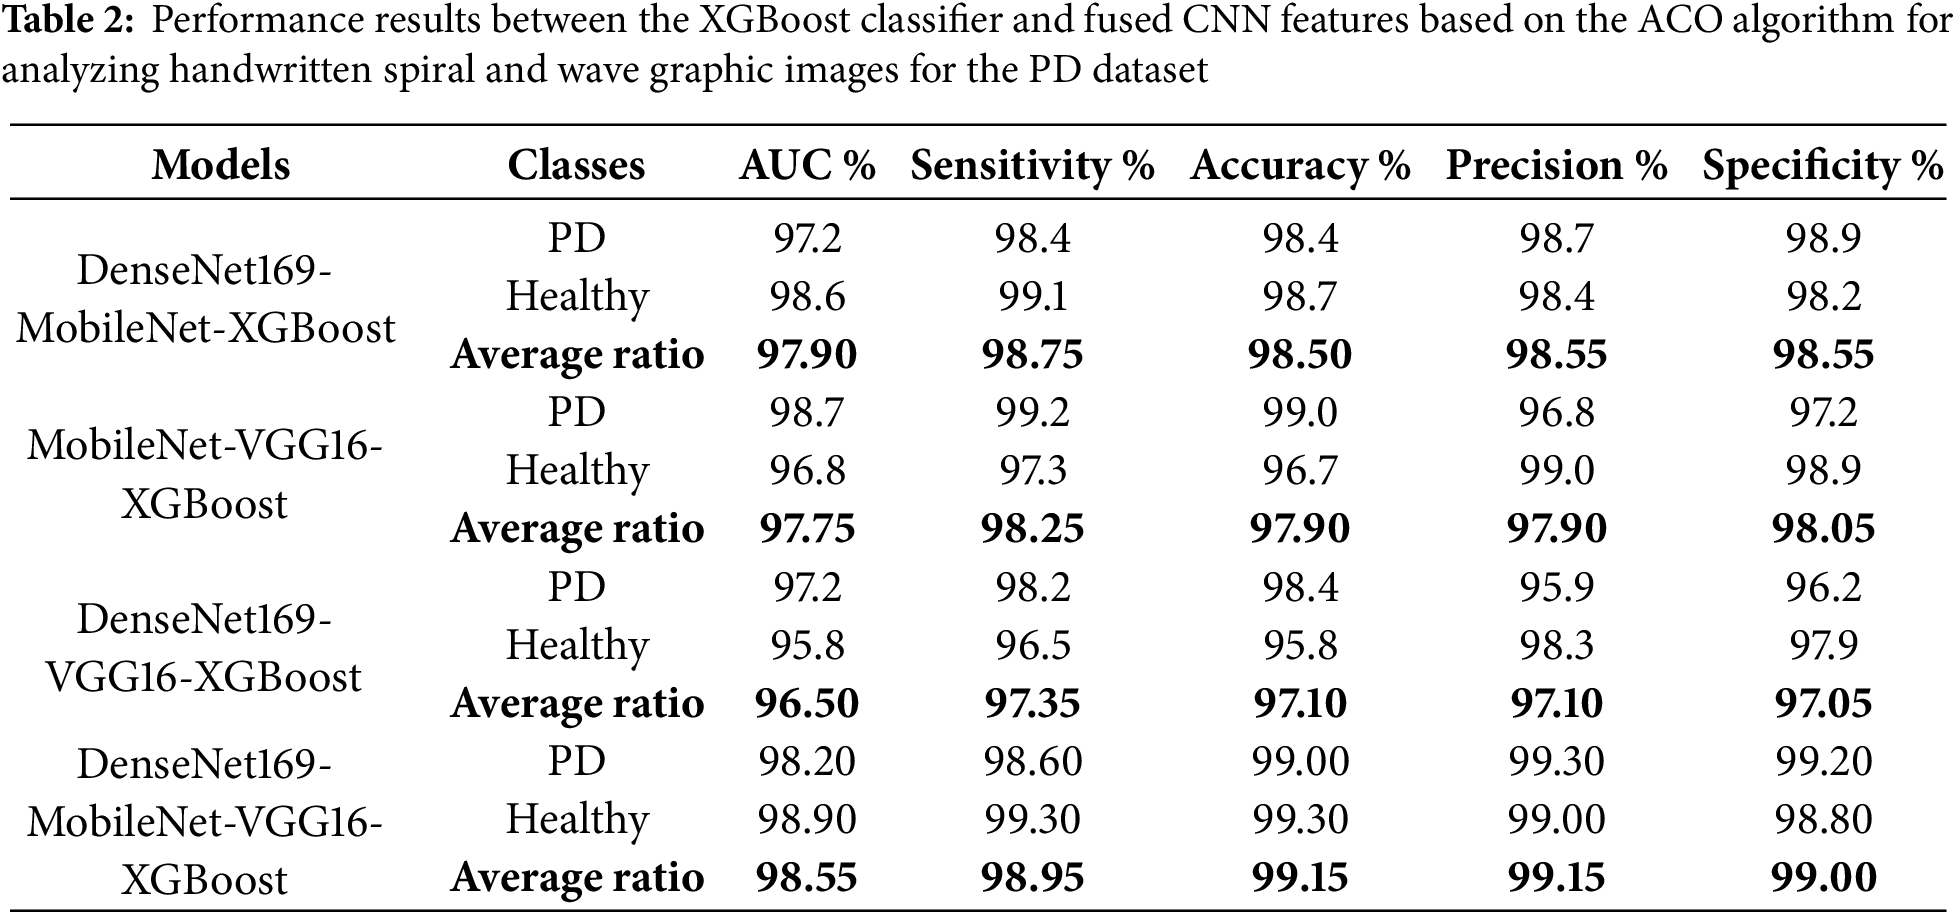
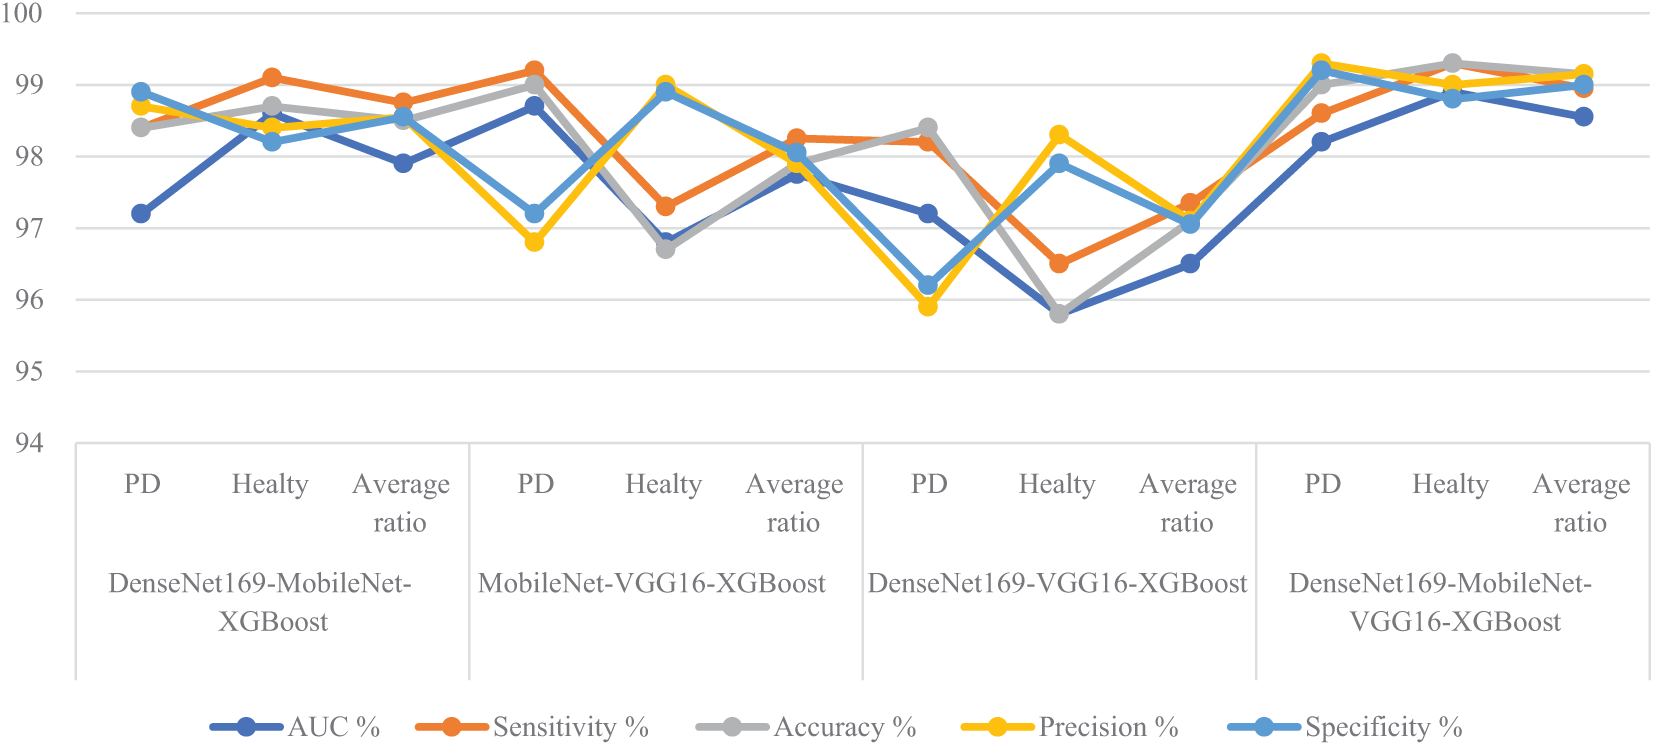
Figure 5: Display of performance results between XGBoost classifier and fused CNN features with ACO for analyzing handwritten spiral and wave graphic images for the PD dataset
Fig. 6 displays the confusion matrix of the hybrid systems. It shows the accuracy achieved by the system. In general, the DenseNet169-MobileNet-XGBoost model showed an accuracy of 98.4% for the PD and 98.7% for the healthy class. The MobileNet-VGG16-XGBoost model achieved an accuracy of 99% for the PD class and 96.7% for the healthy class. The DenseNet169-VGG16-XGBoost model showed an accuracy of 98.4% for the PD class and 95.8% for the healthy class. The DenseNet169-MobileNet-VGG16-XGBoost model had an accuracy of 99% for the PD class and 99.3% for the healthy class.
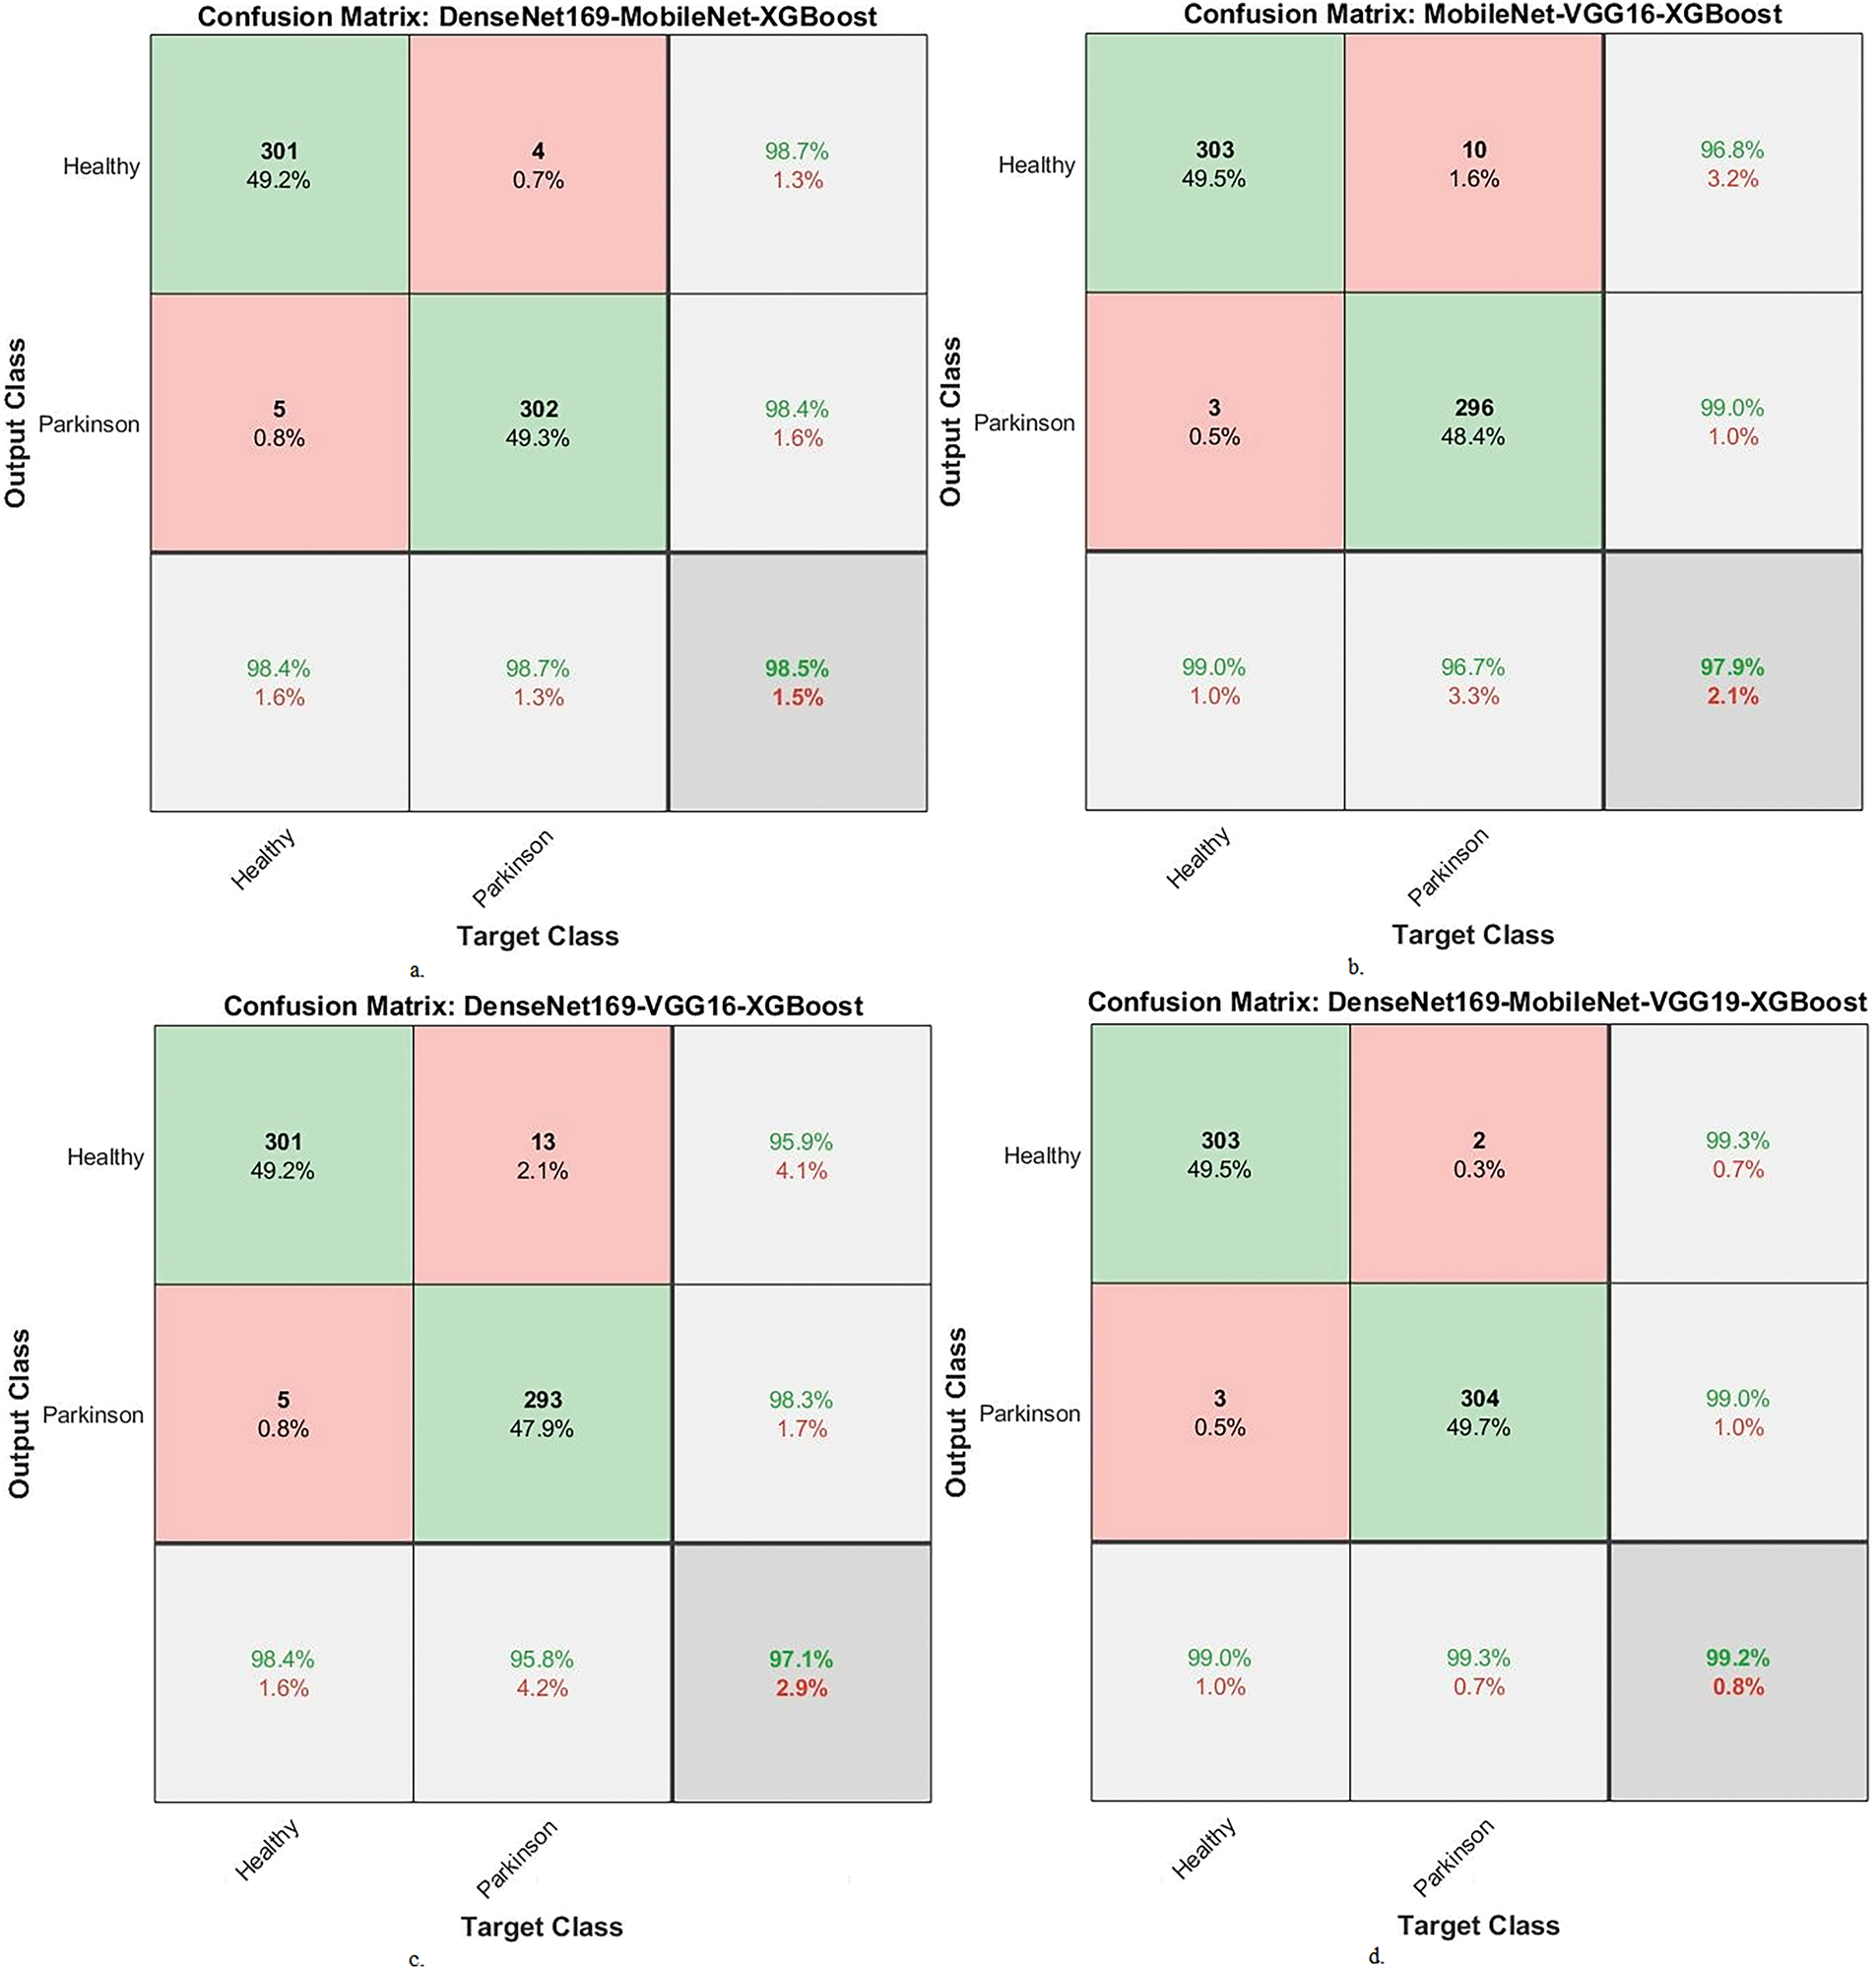
Figure 6: Display a confusion matrix of results between XGBoost and fused CNN features with ACO to analyze handwritten spiral and wave graphic images for the PD dataset. a. DenseNet169-MobileNet-XGBoost, b. MobileNet-VGG16-XGBoost, c. DenseNet169-VGG16-XGBoost and d. DenseNet169-MobileNet-VGG16-XGBoost
Table 3 and Fig. 7 summarize the results of the RF classifier with fused features from multiple CNN models with ACO algorithm to analyze handwritten spiral and wave graphic images for the PD dataset. Among the investigated models, the DenseNet169-MobileNet-VGG16-RF hybrid approach exhibited superior diagnostic performance, outperforming the other configurations. Specifically, the DenseNet169-MobileNet-VGG16-RF reached remarkable results, with an AUC of 99%, sensitivity of 99.6%, accuracy of 99.3%, precision of 99.35%, and specificity of 99.65%. This outstanding performance can be attributed to the effective fusion of complementary features extracted from multiple CNNs and the robust classification capabilities of the RF algorithm, further enhanced by the ACO algorithm’s intelligent feature selection process. DenseNet169-MobileNet-RF reached an AUC of 97.7%, sensitivity of 98.5%, accuracy of 98.7%, precision of 98.7%, and specificity of 98.75%. The MobileNet-VGG16-RF reached an AUC of 97.15%, sensitivity of 97.95%, accuracy of 98%, precision of 98%, and specificity of 98.35%. The DenseNet169-VGG16-RF reached an AUC of 96.65%, sensitivity of 97.6%, accuracy of 97.4%, precision of 97.4%, and specificity of 97.85%.
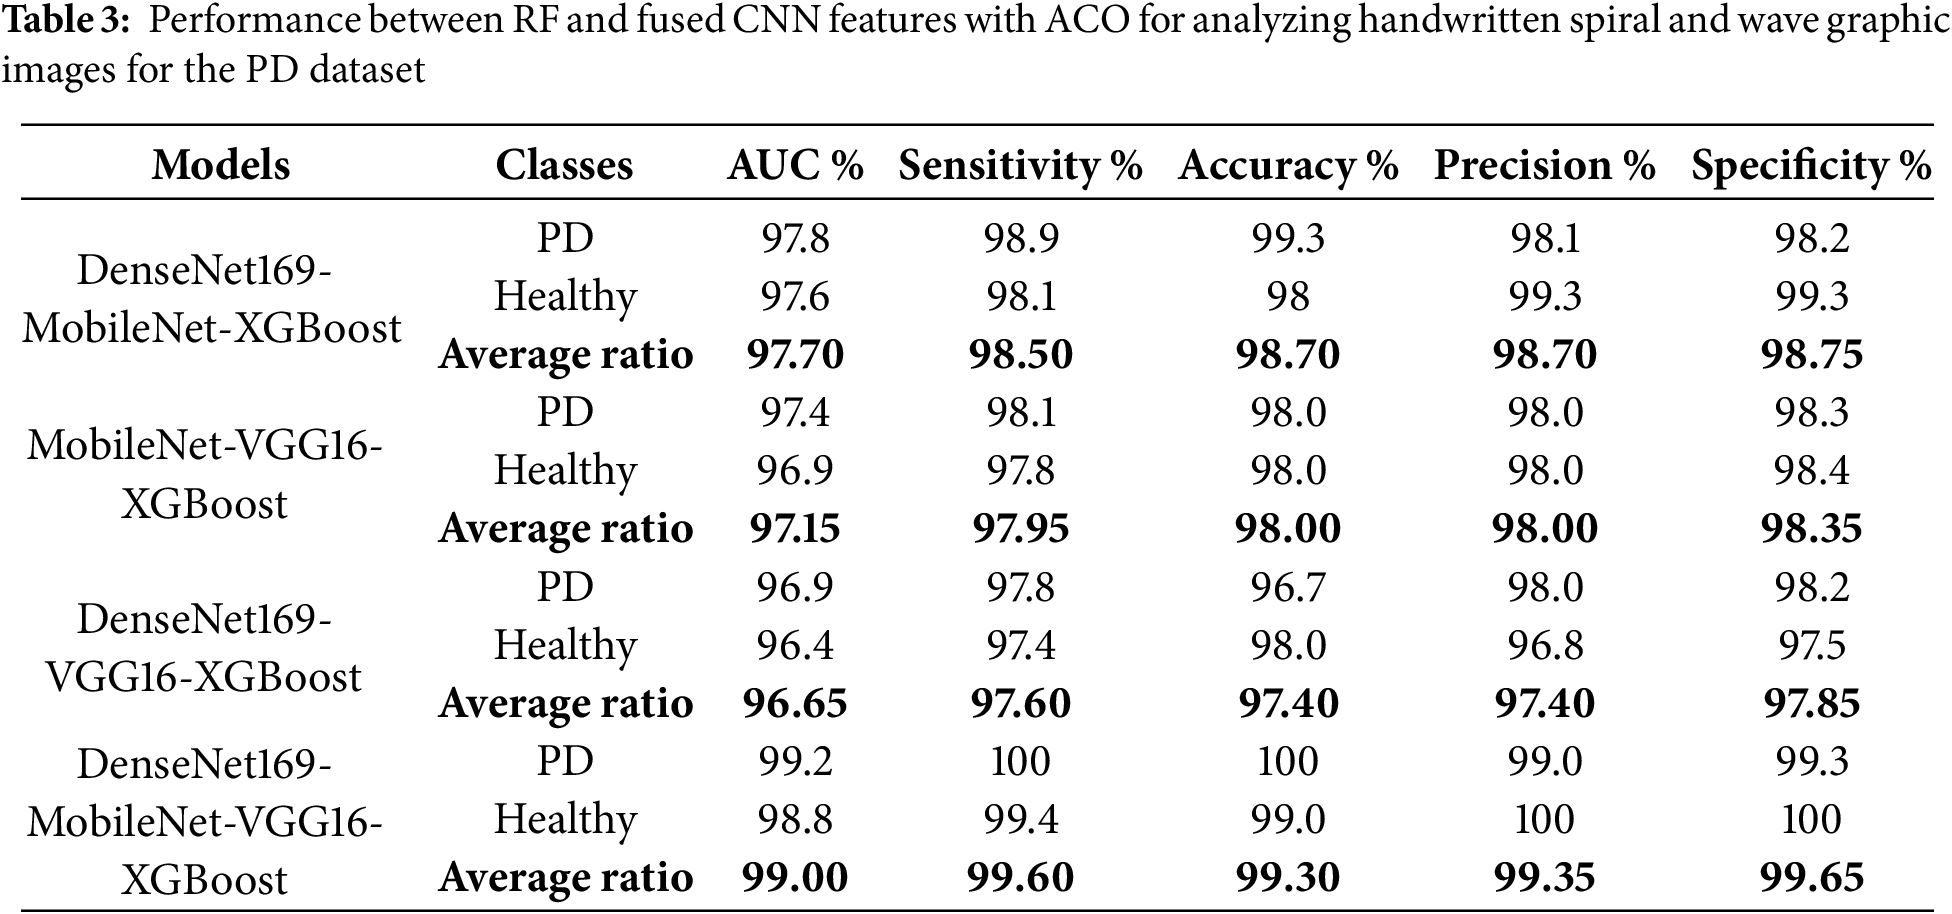
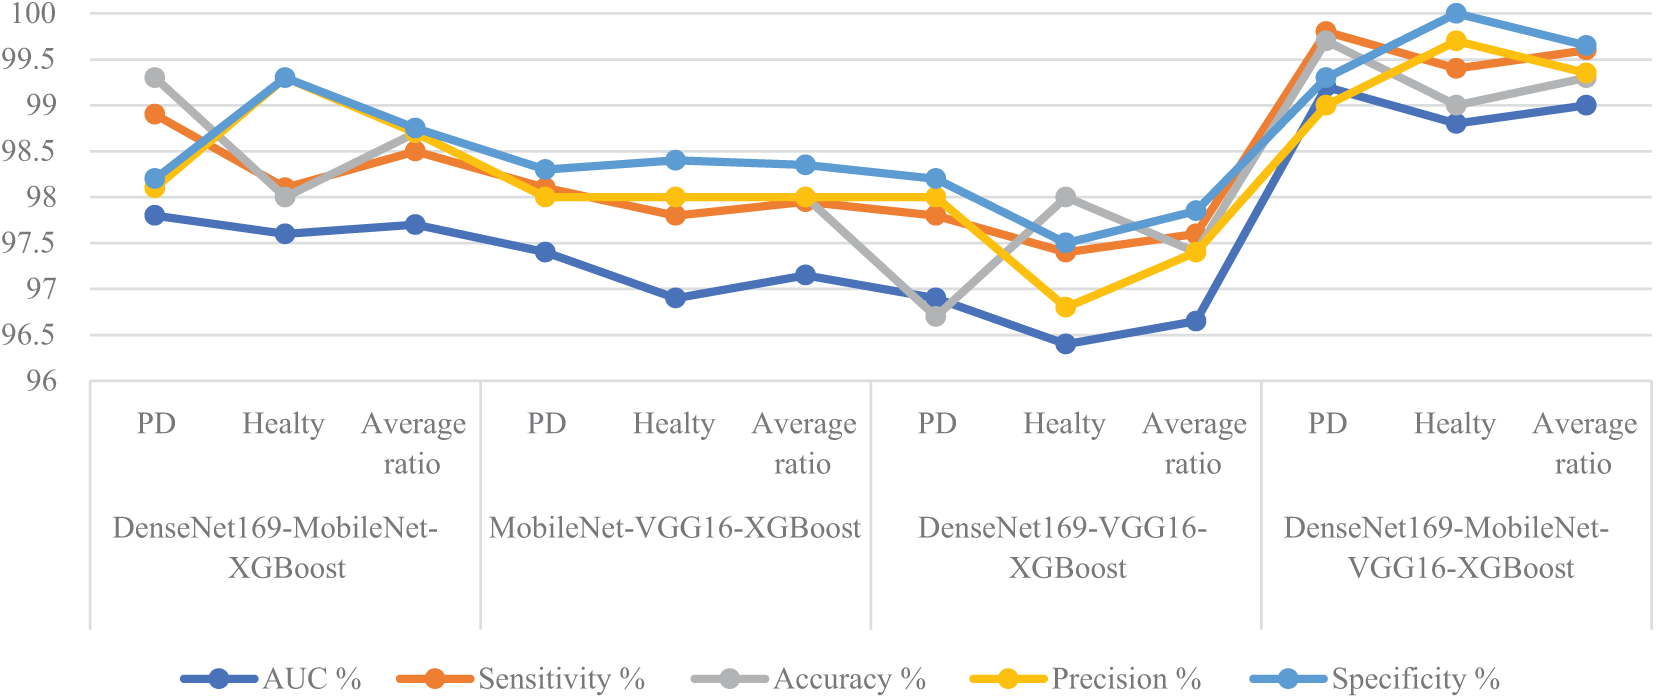
Figure 7: Display of performance between RF and fused CNN features with ACO for analyzing handwritten spiral and wave graphic images for PD
Fig. 8 displays the confusion matrix of the hybrid systems. The DenseNet169-MobileNet-RF model showed an accuracy of 99.3% for the PD class and 98% for the healthy class. The MobileNet-VGG16-RF achieved an accuracy of 98% for the PD class and 98% for the healthy class. DenseNet169-VGG16-RF showed an accuracy of 96.7% for the PD class and 98% for the healthy class. DenseNet169-MobileNet-VGG16-RF reached an accuracy of 99.7% for the PD class and 99% for the healthy class.
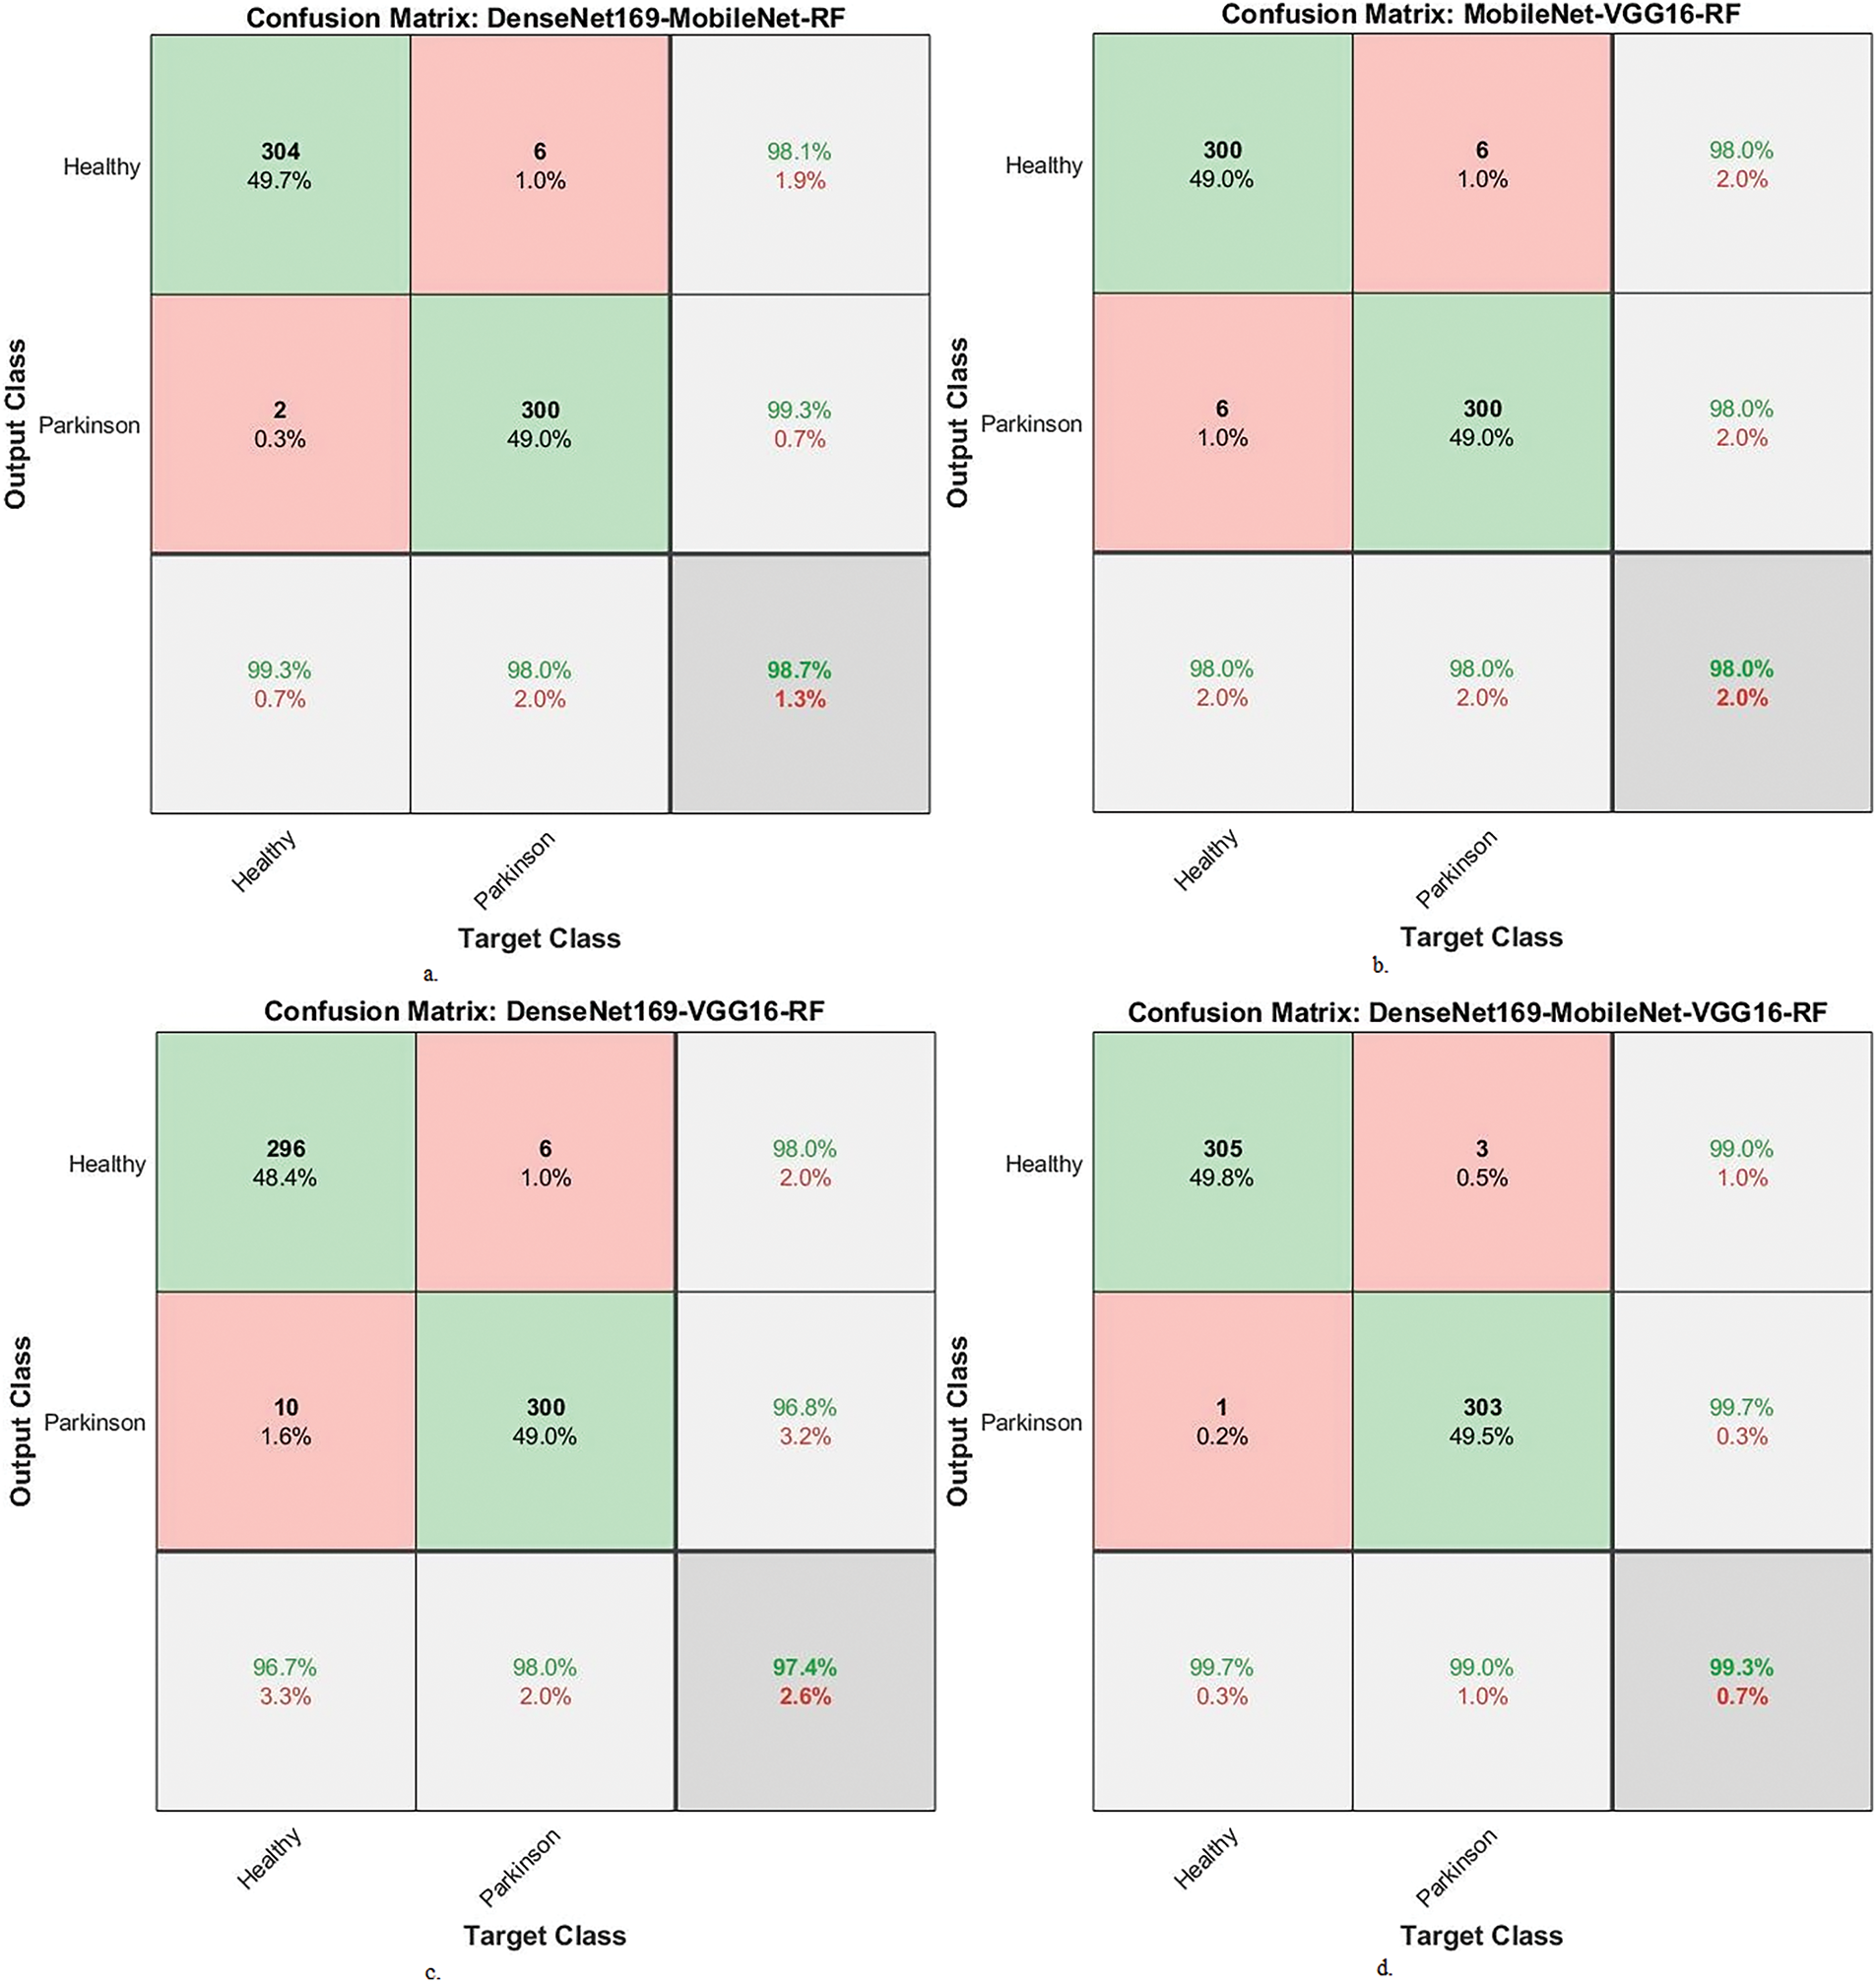
Figure 8: Display confusion matrix of performance between RF and fused CNN features with ACO for analyzing handwritten spiral and wave graphic images for PD. a. DenseNet169-MobileNet-RF, b. MobileNet-VGG16-RF, c. DenseNet169-VGG16-RF and d. DenseNet169-MobileNet-VGG16-RF
4.5 Results of Machine Learning Classifiers with Multi-CNN Based on the MESbS Algorithm
The section presents the results of the hybrid systems by XGBoost and RF classifiers with fused features from several CNN with MESbS algorithm to analyze handwritten spiral and wave graphical images for the PD. The graphics were passed through two filters, Average and Laplacian, to enhance the handwritten graphic images. ROI (handwriting drawings) were segmented images using the GVF algorithm. ROI was fed to DenseNet169, MobileNet, and VGG16 to extract features and save them in feature vectors. The feature vectors of several CNNs were sequentially integrated as follows: DenseNet169-MobileNet, MobileNet-VGG16, DenseNet169-VGG16, and DenseNet169-MobileNet-VGG16. Fused features were preserved from many CNNs, but they were high dimensional and contained redundant features. Therefore, the fused feature vectors were passed to the MESbS algorithm to select the features that were strongly associated with the target feature. The fused and selected feature vectors were passed to XGBoost and RF classifiers to classify them with high accuracy.
Table 4 and Fig. 9 summarize the performance results of the XGBoost classifier with fused features from multiple CNN models based on the MESbS algorithm to analyze handwritten spiral and wave graphic images for the PD dataset. These results pertain to analyzing handwritten spiral and wave graphic images from the PD dataset. Among the investigated configurations, the DenseNet169-MobileNet-VGG16-XGBoost model exhibited superior diagnostic performance, outperforming the other hybrid systems. The DenseNet169-MobileNet-VGG16-XGBoost model achieved an AUC of 97.7%, a sensitivity of 98.5%, an accuracy of 98.2%, a precision of 98.2%, and a specificity of 98.8%. The DenseNet169-MobileNet-XGBoost model achieved an AUC of 97.7%, a sensitivity of 98.5%, an accuracy of 98.2%, a precision of 98.2%, and a specificity of 98.8%. The MobileNet-VGG16-XGBoost model achieved an AUC of 97.05%, a sensitivity of 97.9%, an accuracy of 97.5%, a precision of 97.55%, and a specificity of 97.8%. The DenseNet169-VGG16-XGBoost model achieved an AUC of 95.4%, a sensitivity of 96.3%, an accuracy of 96.6%, a precision of 96.55%, and a specificity of 96.6%.
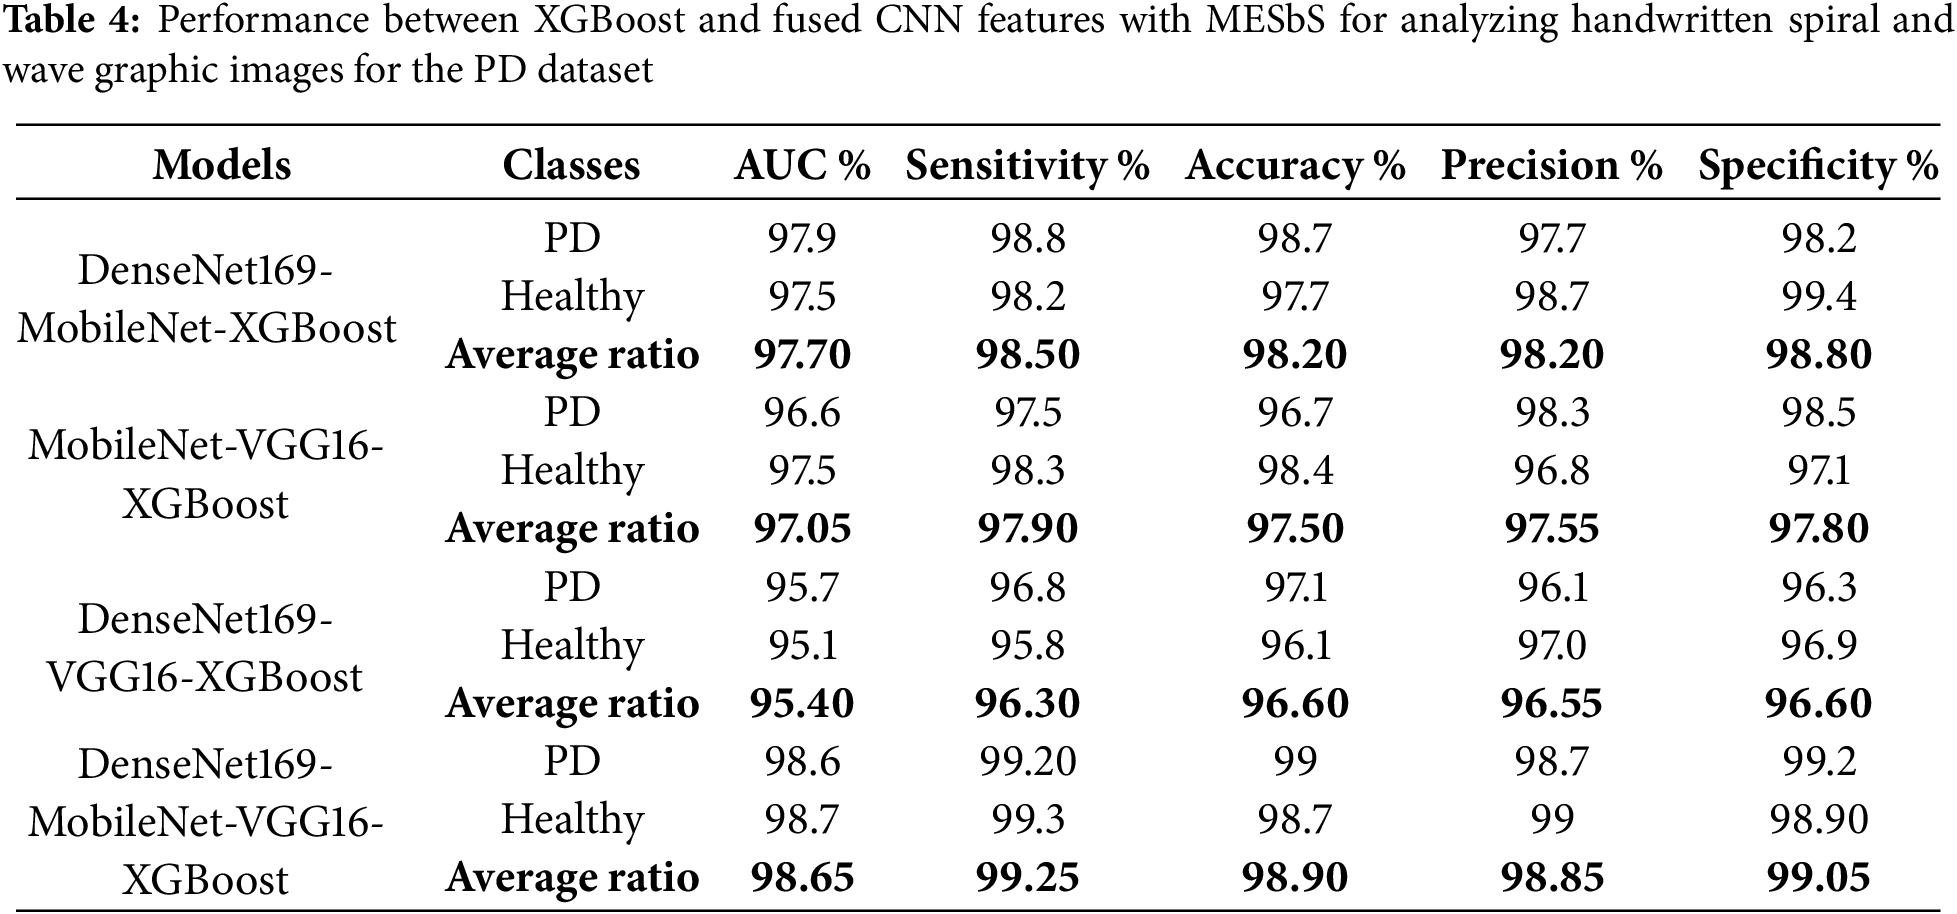
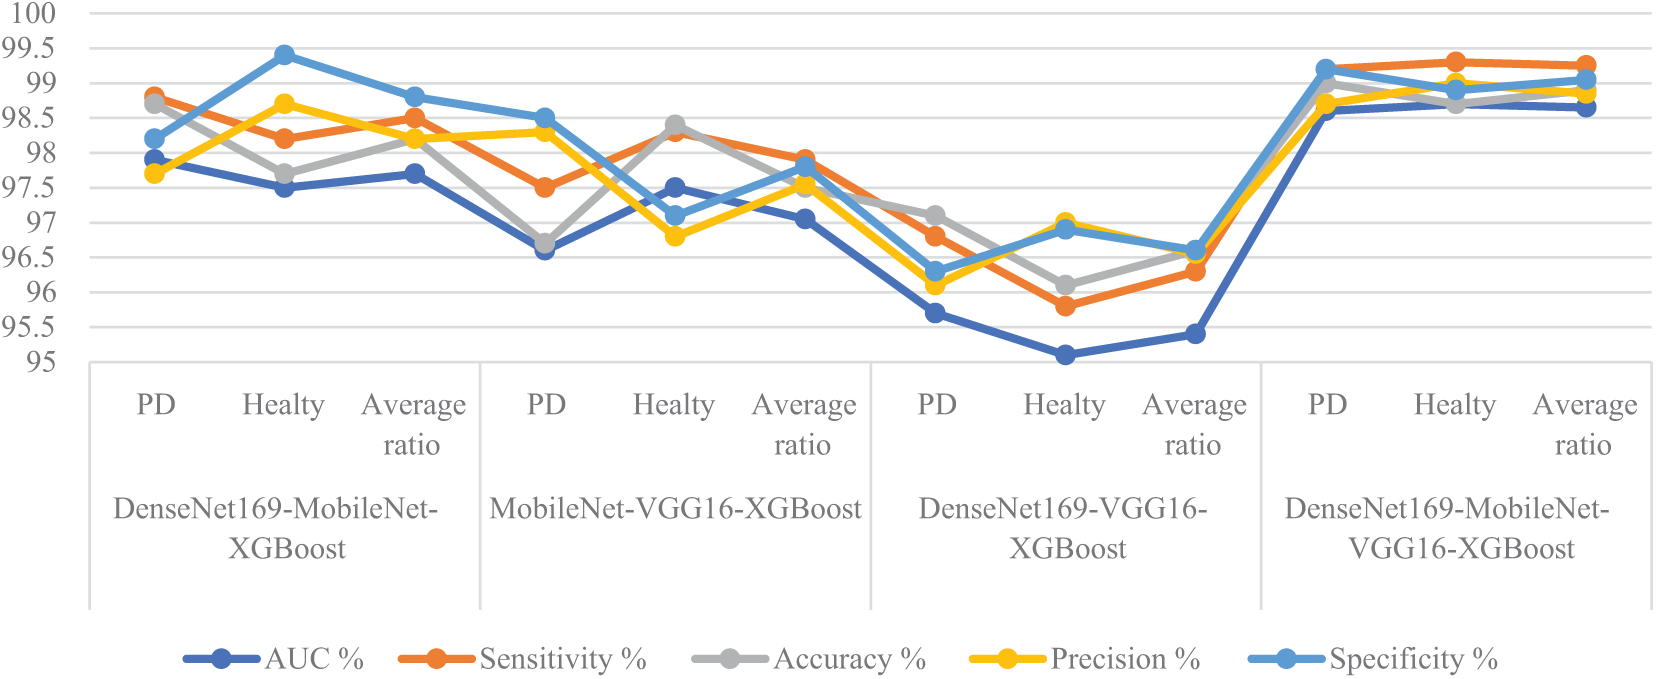
Figure 9: Display of performance between XGBoost classifier and fused CNN features with MESbS algorithm for analyzing handwritten spiral and wave graphic images for PD dataset
Fig. 10 displays the confusion matrix of the hybrid systems. The DenseNet169-MobileNet-XGBoost model reached an accuracy of 98.7% for the PD class and 97.7% for the healthy class. The MobileNet-VGG16-XGBoost model achieved an accuracy of 96.7% for the PD class and 98.4% for the healthy class. The DenseNet169-VGG16-XGBoost model showed an accuracy of 97.1% for the PD class and 96.1% for the healthy class. The DenseNet169-MobileNet-VGG16-XGBoost model provided an accuracy of 99% for the PD class and 98.7% for the healthy class.
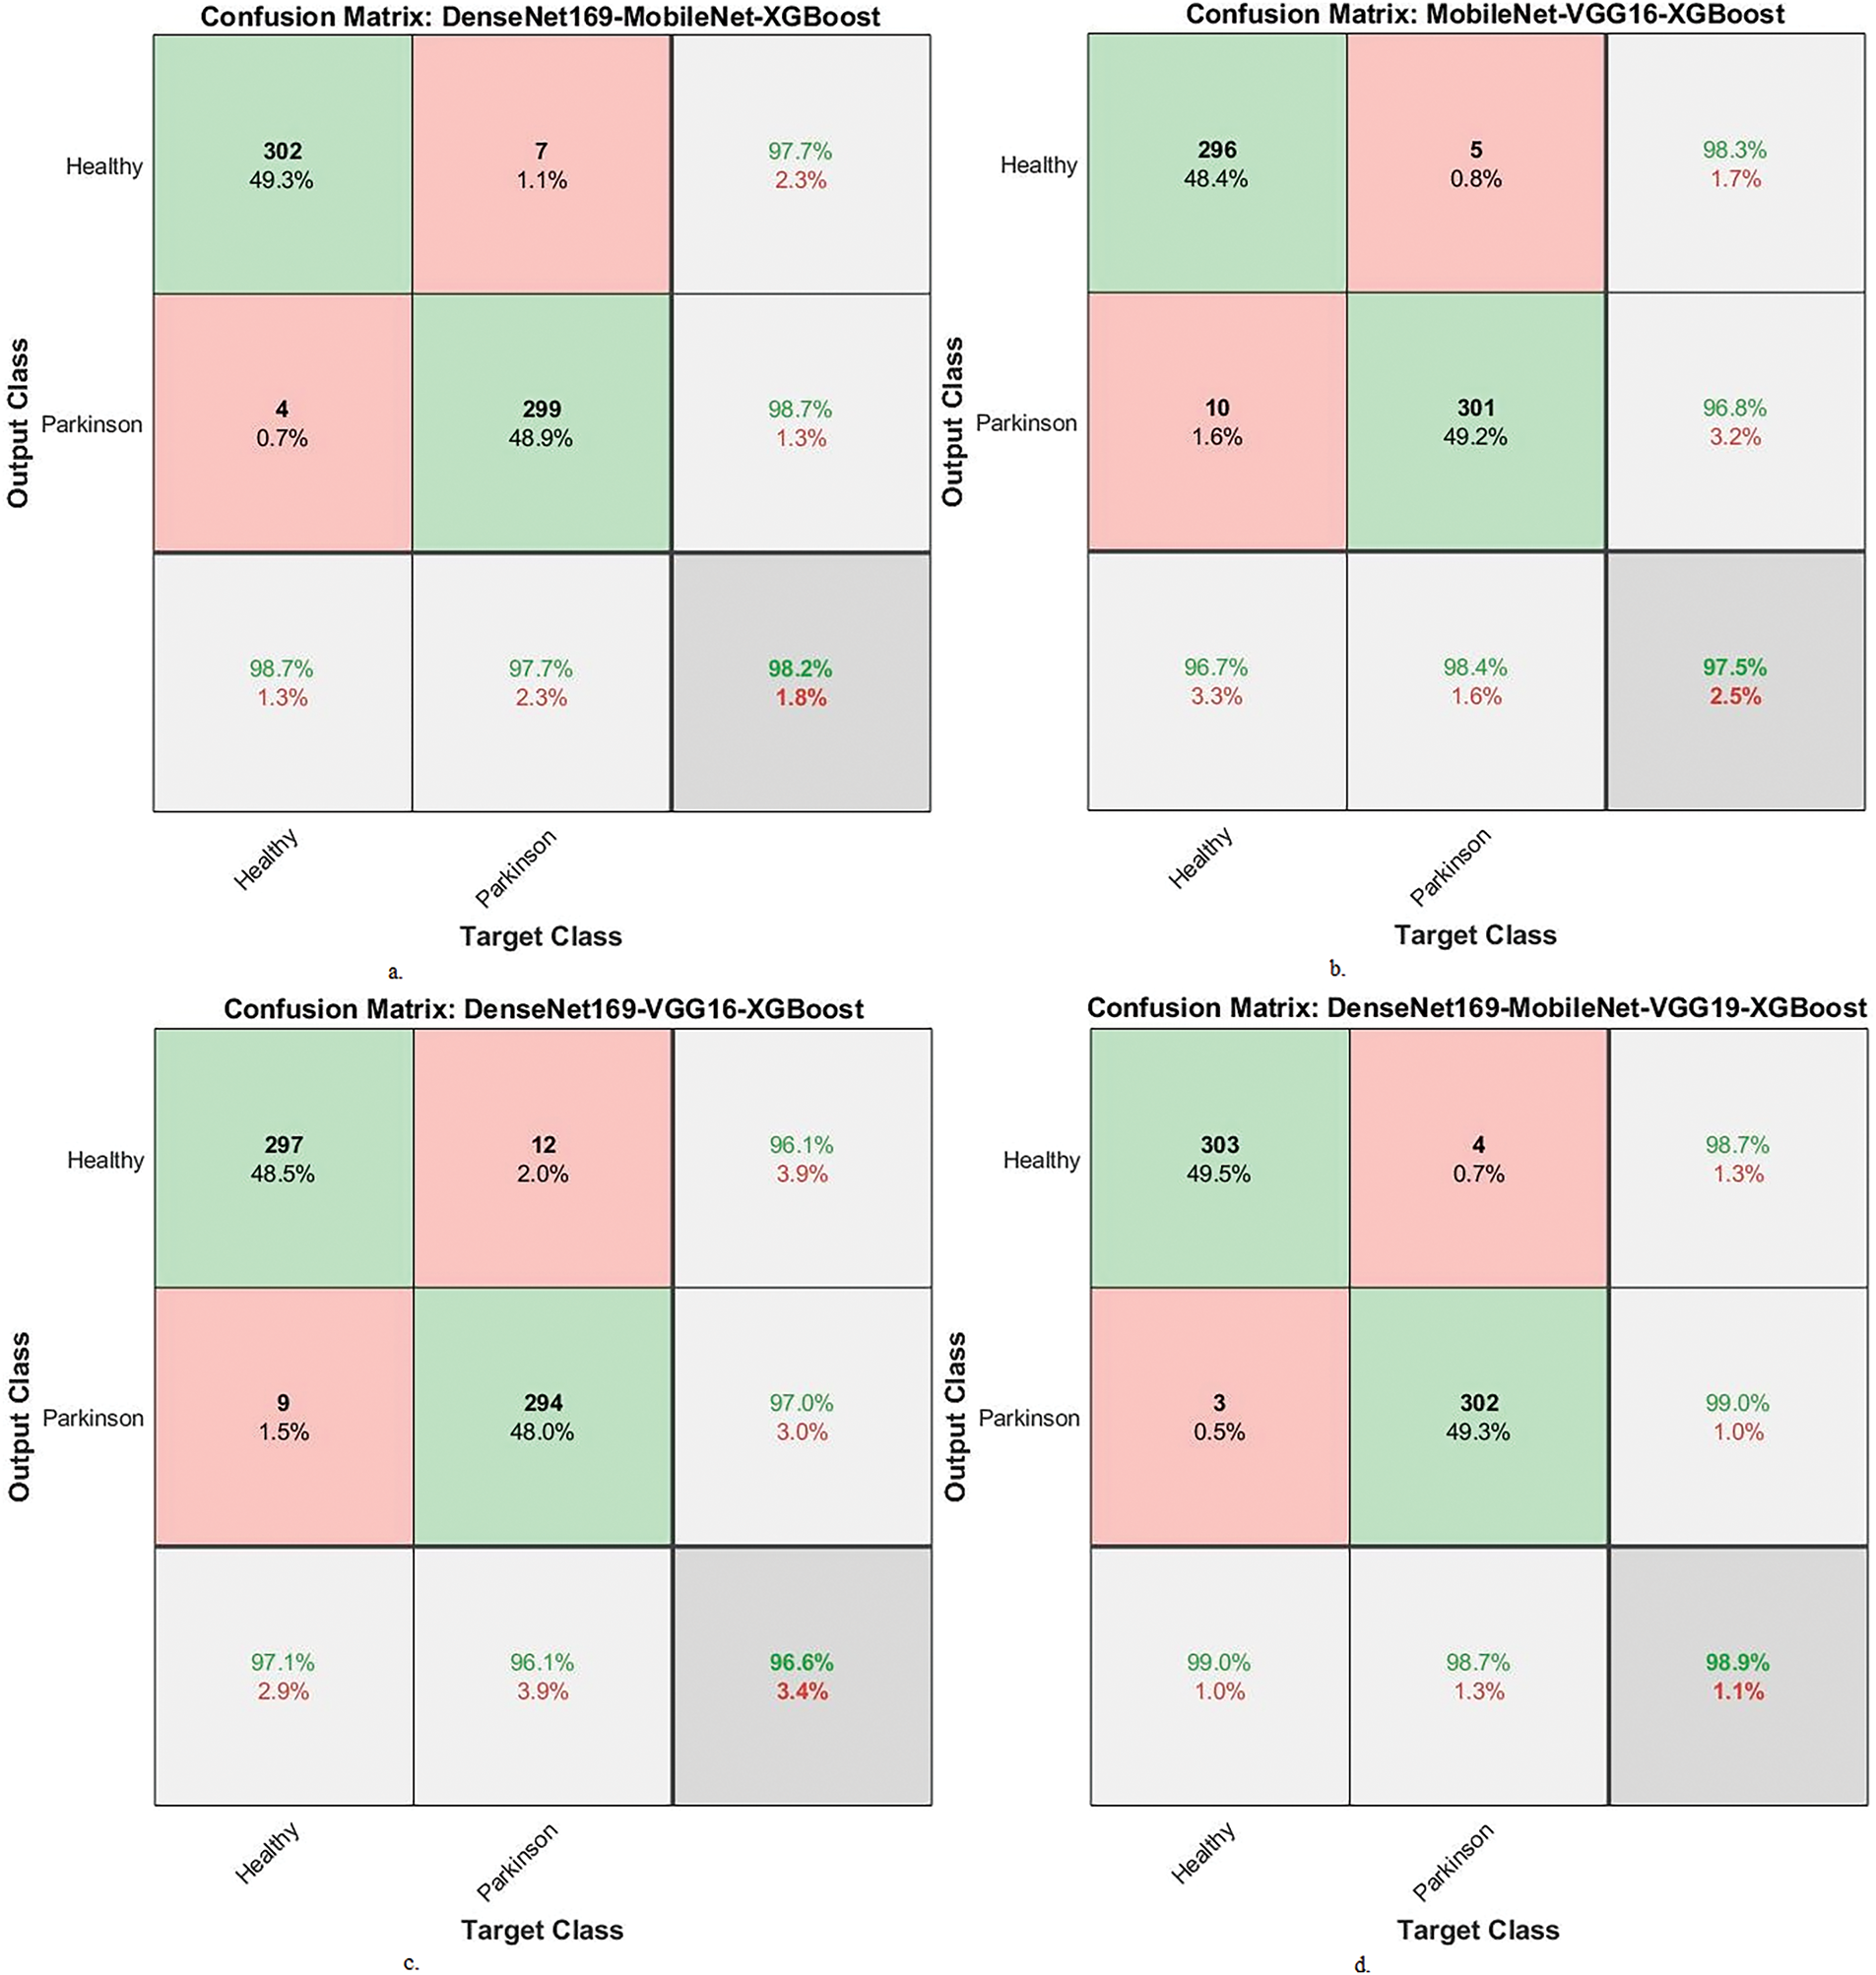
Figure 10: Confusion matrix of results between XGBoost and fused CNN features with MESbS algorithm for analyzing handwritten spiral and wave graphic images for PD dataset. a. DenseNet169-MobileNet-XGBoost, b. MobileNet-VGG16-XGBoost, c. DenseNet169-VGG16-XGBoost and d. DenseNet169-MobileNet-VGG16-XGBoost
Table 5 and Fig. 11 summarize the performance results of the RF classifier with fused features from multiple CNN models based on the MESbS algorithm to analyze handwritten spiral and wave graphic images for the PD dataset. Among the investigated models, the DenseNet169-MobileNet-VGG16-RF model exhibited superior diagnostic performance, outperforming the other hybrid approaches. The DenseNet169-MobileNet-VGG16-RF model achieved remarkable results, with an AUC of 98.45%, sensitivity of 99.05%, 99% accuracy, 99% precision, and specificity of 99.15%. This outstanding performance is due to the effective combination of the three features of multiple CNN models, the powerful classification capabilities of the RF algorithm, and the powerful feature selection process of the MESbS algorithm. The DenseNet169-MobileNet-RF reached an AUC of 97.2%, sensitivity of 98%, accuracy of 98.4%, precision of 98.4%, and specificity of 98.35%. The MobileNet-VGG16-RF reached an AUC of 97.2%, sensitivity of 98%, accuracy of 97.7%, precision of 97.7%, and specificity of 98.3%. DenseNet169-VGG16-RF reached an AUC of 96.2%, sensitivity of 96.95%, accuracy of 96.9%, precision of 96.9%, and specificity of 97.3%.
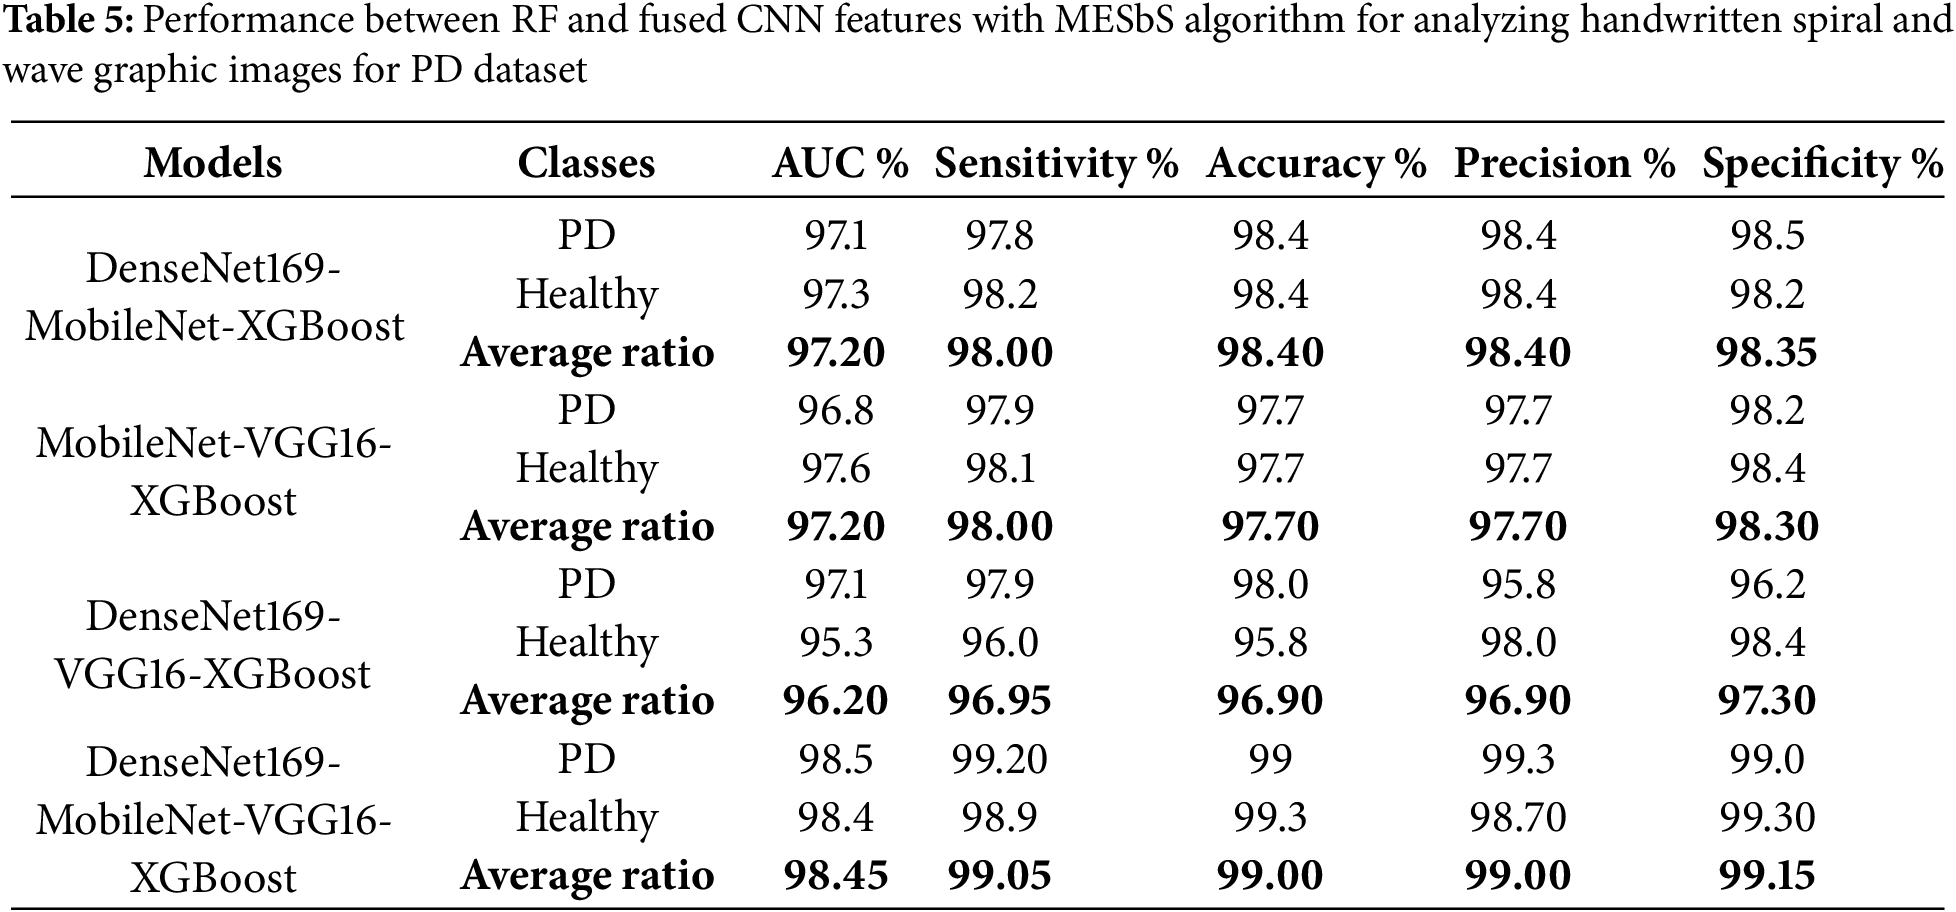
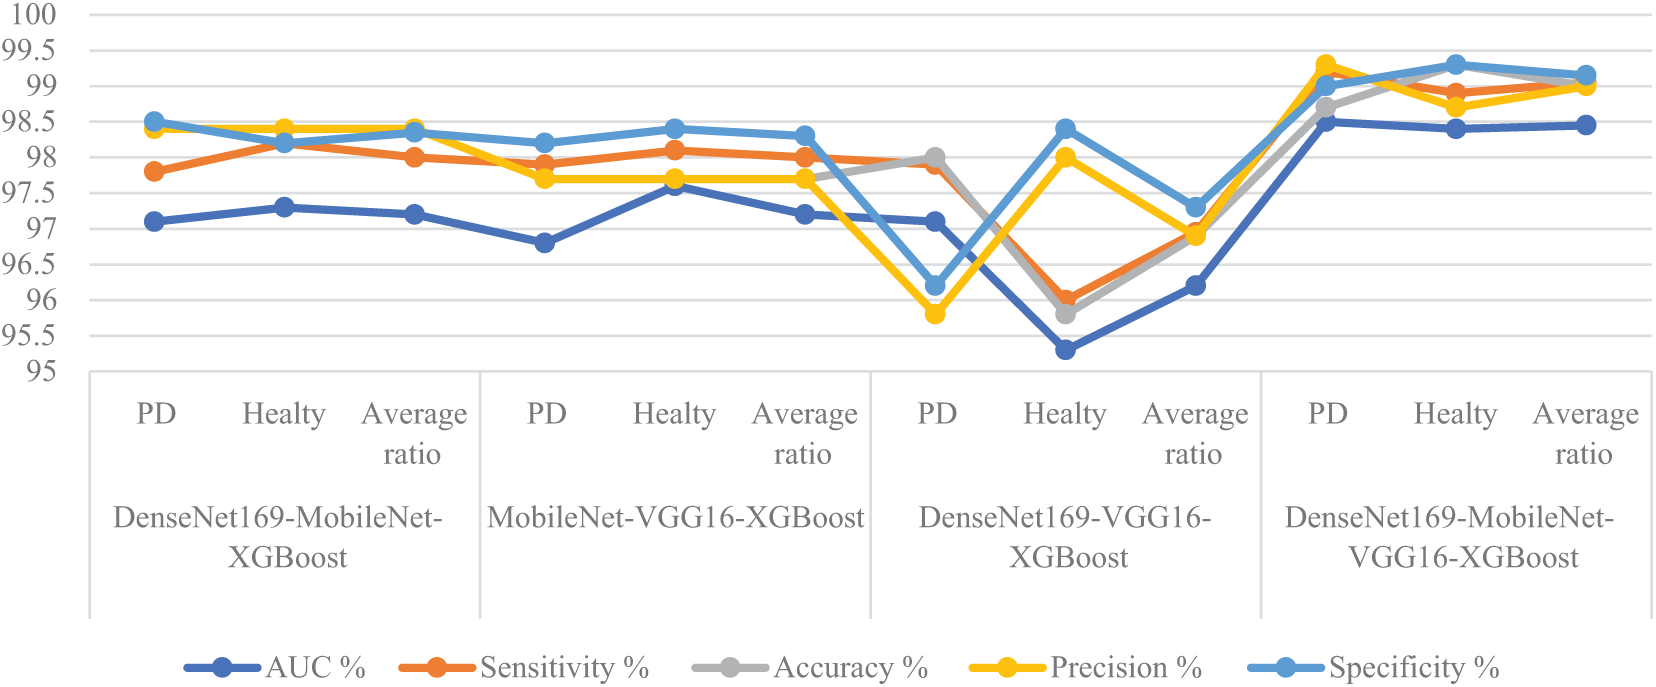
Figure 11: Display of performance between RF and fused CNN features with MESbS for analyzing handwritten spiral and wave graphic images for the PD dataset
Fig. 12 displays the confusion matrix of the hybrid systems. DenseNet169-MobileNet-RF showed an accuracy of 98.4% for the PD class and 98.4% for the healthy class. The MobileNet-VGG16-RF achieved an accuracy of 97.7% for the PD class and 97.7% for the healthy class. The DenseNet169-VGG16-RF showed an accuracy of 98% for the PD class and 95.8% for the healthy class. The DenseNet169-MobileNet-VGG16-RF had an accuracy of 98.7% for the PD class and 99.3% for the healthy class.
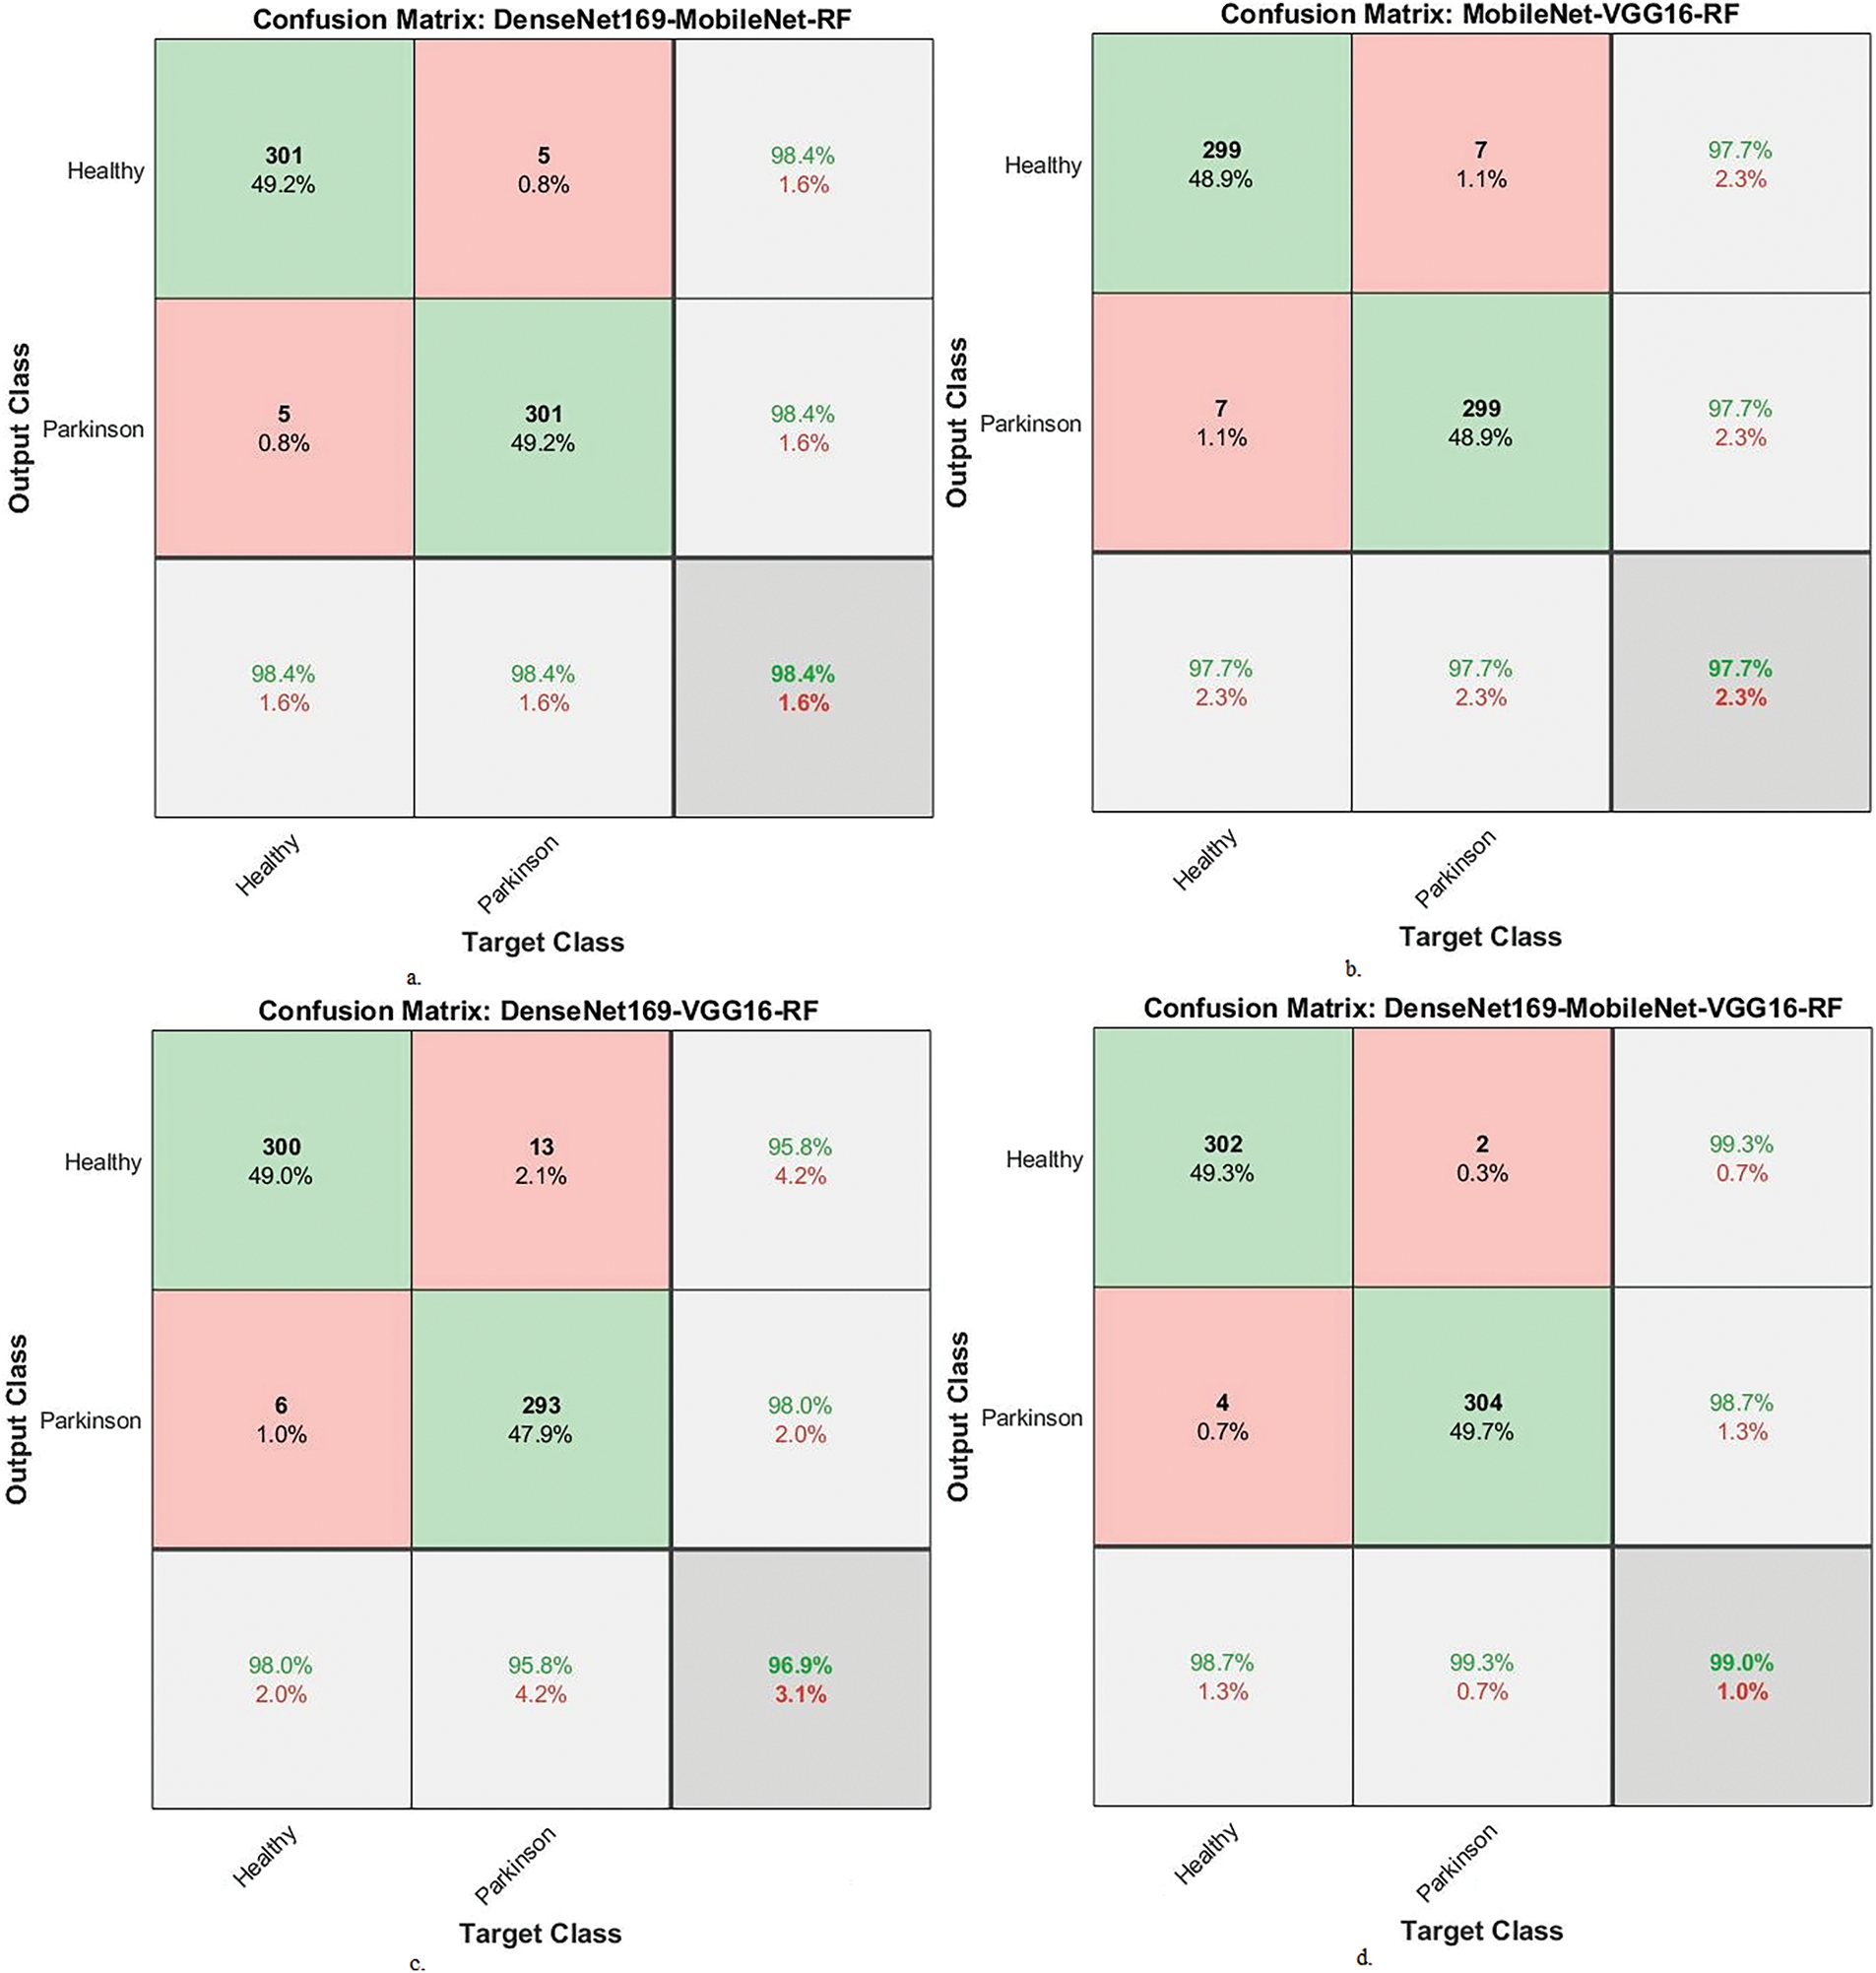
Figure 12: Confusion matrix of performance between RF and fused CNN features with MESbS for analyzing handwritten spiral and wave graphic images for PD. a. DenseNet169-MobileNet-RF, b. MobileNet-VGG16-RF, c. DenseNet169-VGG16-RF and d. DenseNet169-MobileNet-VGG16-RF
5 Discussion and Comparison of the Performance of Hybrid Systems
The development of hybrid systems that combine XGBoost and RF classifiers with fused features of CNN with ACO and MESbS feature selection algorithms are superior systems for analyzing handwritten spiral and wave graphic images of PD patients. The systems take advantage of the strengths of XGBoost classifiers, RF classifiers, and CNN models to extract deep and precise features that are difficult to extract by traditional algorithms. Combining features from multiple CNN models forms high-dimensional feature maps, which can lead to overfitting, computational complexity, and decreased model interpretability. Therefore, ACO and MESbS algorithms play a crucial role in identifying the features that are related to the target features and are informative while eliminating redundant or irrelevant features. After selecting the most critical features, the hybrid system improves in terms of classification with high accuracy, generalization of models, and improvement of computational efficiency. Handwritten spiral and wave drawings provide a valuable tool for patients with PD because they reflect the complex motor patterns associated with the disease. The proposed hybrid system improves the fine-grained and deep feature extraction capabilities of CNN models, which capture variations and nuances in hand drawings that will otherwise be difficult to measure manually. The hybrid system’s XGBoost and RF classifiers enable efficient learning of complex relationships and patterns found in CNN-fused features, improving accuracy in tasks such as PD diagnosis.
This study achieved the best performance by an RF classifier with fused features for DenseNet169-MobileNet-VG16 models and the ACO algorithm for feature selection. This hybrid model showed an AUC of 99%, sensitivity of 99.6%, accuracy of 99.3%, precision of 99.35%, and specificity of 99.65% in analyzing the PD dataset’s handwritten spiral and wave graphic images. However, the XGBoost classifier with fused features for DenseNet169-MobileNet-VGG16 models and the ACO algorithm for feature selection showed an AUC of 99%, sensitivity of 99.6%, accuracy of 99.3%, precision of 99.35%, and specificity of 99.65%. These superior results demonstrate the effectiveness and efficiency of hybrid systems with fused CNN features for analyzing handwritten spiral and wave graphic images on a PD dataset.
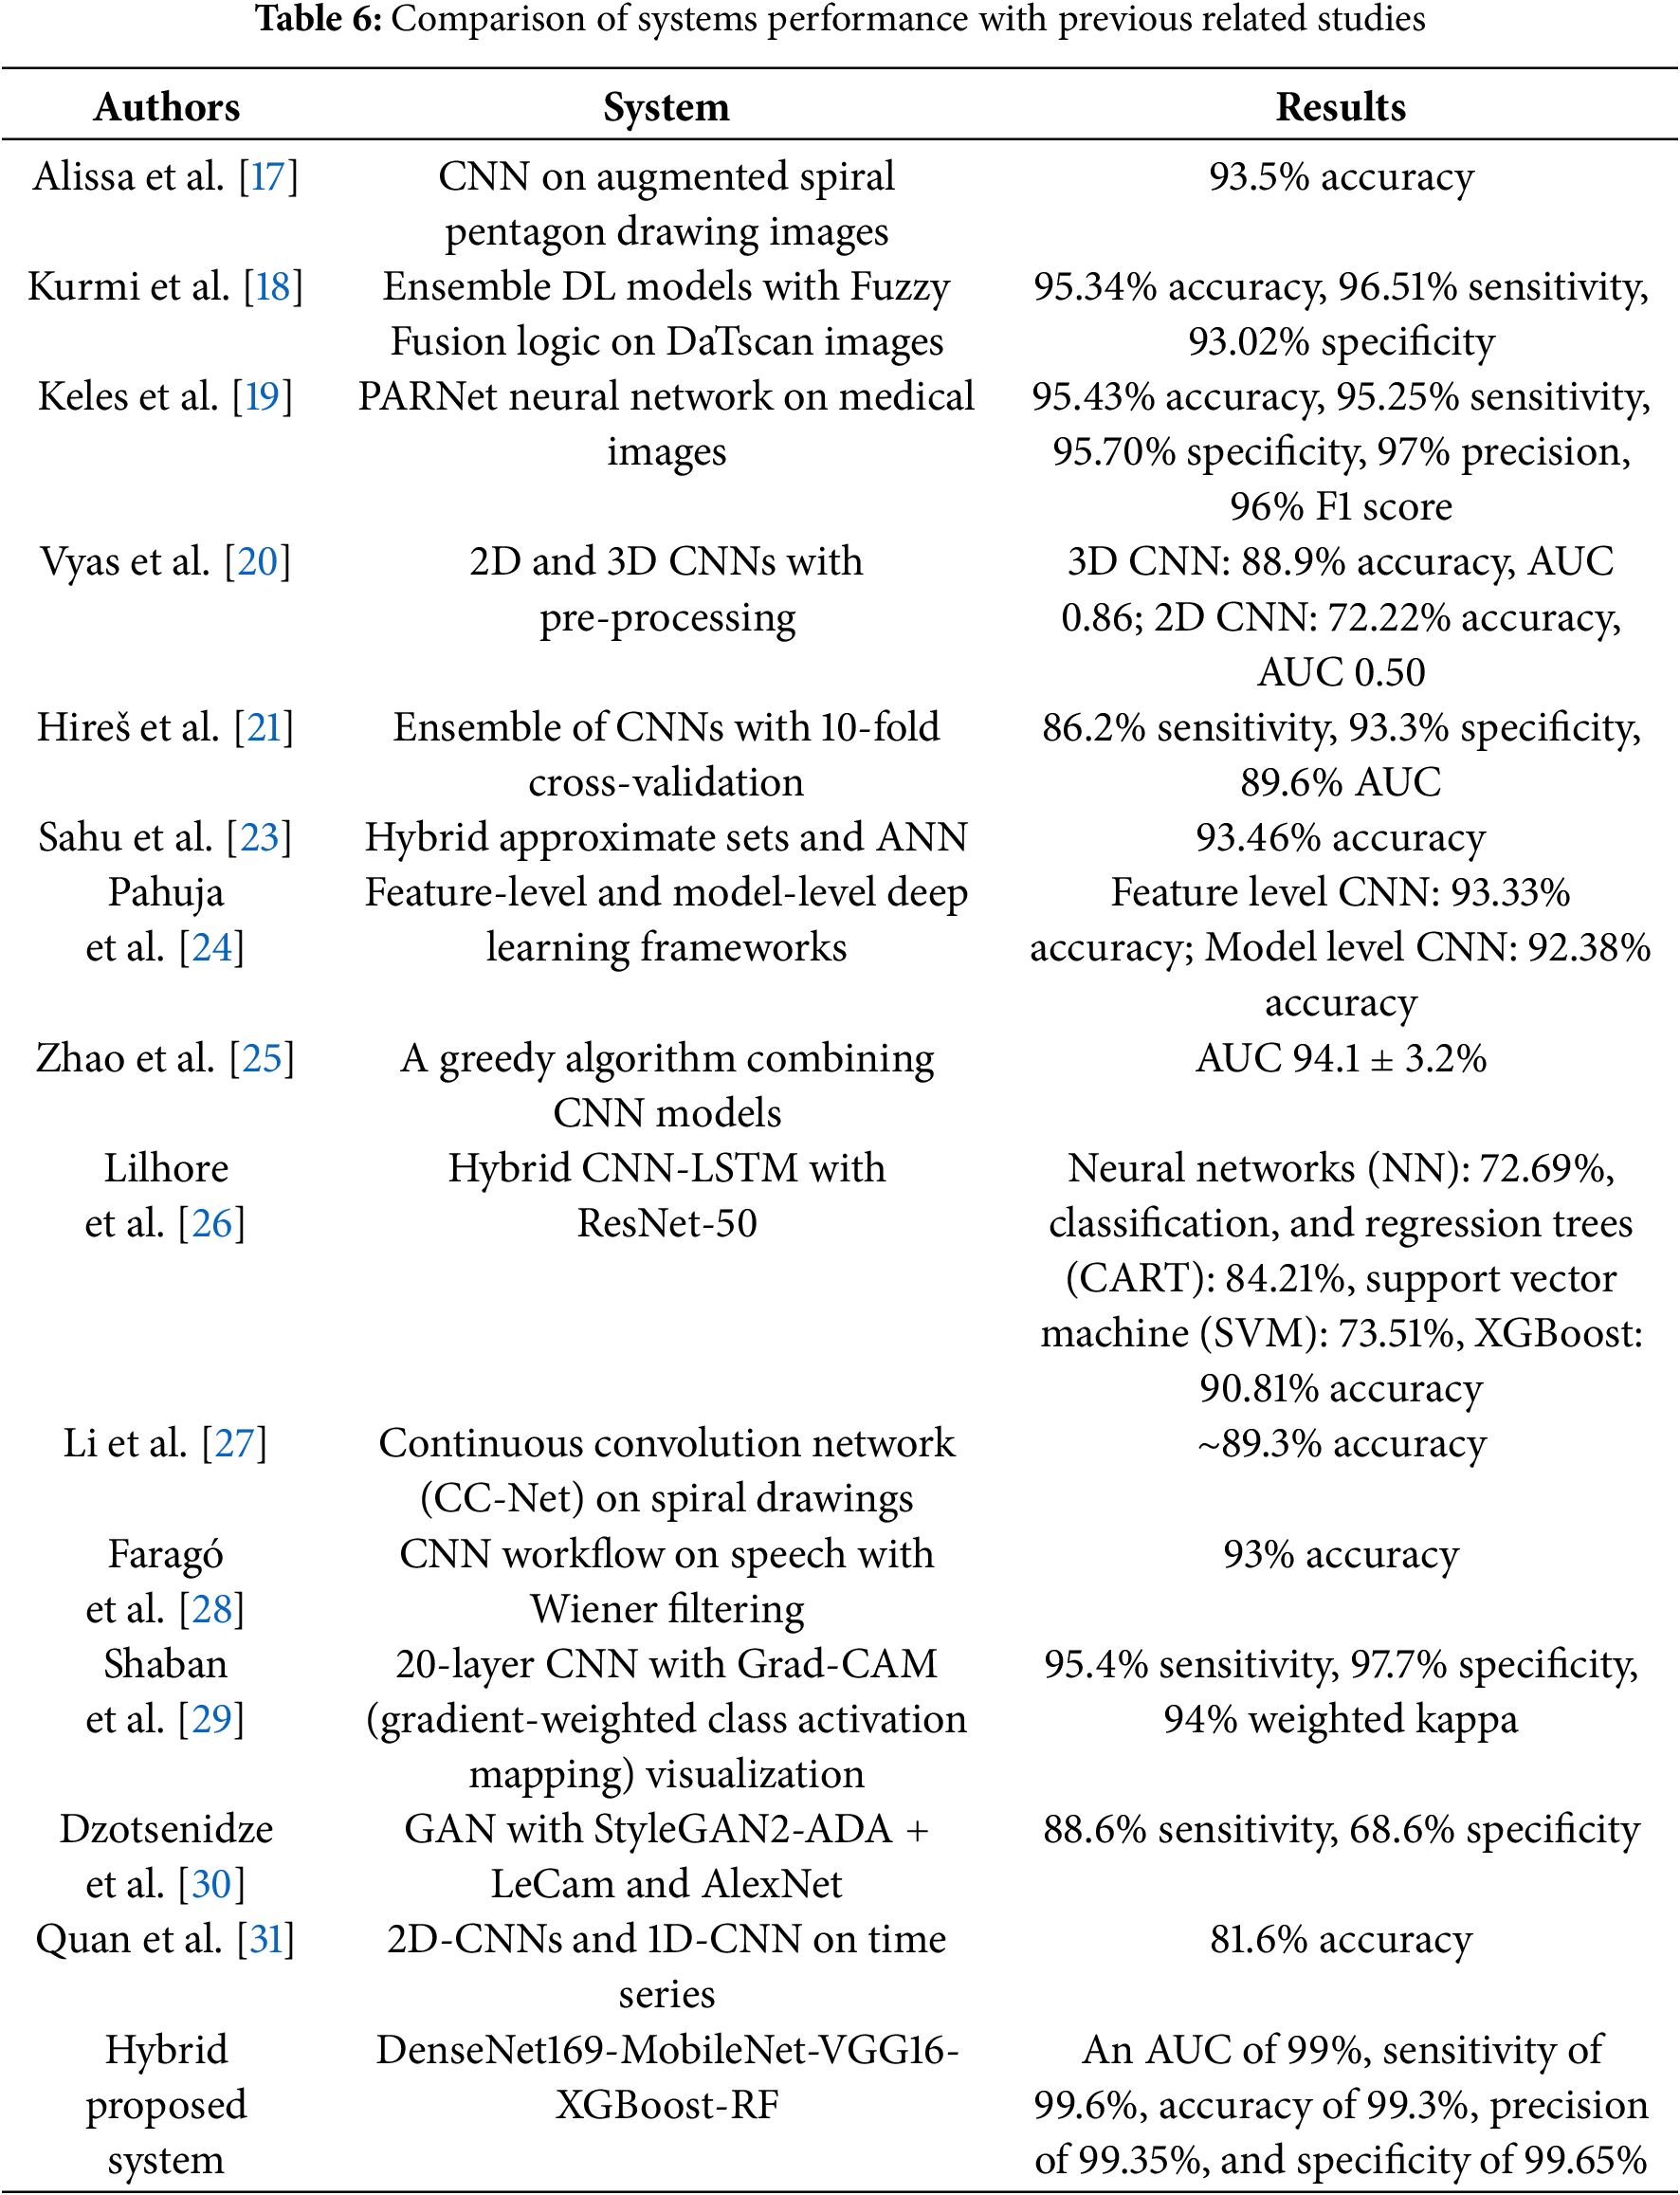
Table 6 shows that the proposed hybrid systems integrating features of multiple CNN models and enhanced feature selection techniques achieved superior performance compared to previous studies in PD diagnosis. The proposed hybrid systems outperformed all systems in previous studies, which used machine learning algorithms and individual or ensemble deep learning models without extensive feature fusion and feature selection strategies. The fusion of features from three CNNs and selection by the ACO algorithm contributed to superior diagnostic accuracy.
Accordingly, this study emphasizes that while the original dataset contains 204 images, the augmentation process significantly enhances the diversity and robustness of the proposed model. Augmentation is a widely accepted technique in AI-based medical research, as it simulates real-world variations by introducing transformations such as rotation, scaling, and noise injection. These variations effectively mimic the natural diversity in handwriting samples seen across patients with varying PD symptoms. In addition, the proposed methodology incorporates advanced enhancement techniques, including the average filter for noise reduction and the Laplacian filter for edge detection. This ensures that the extracted features remain highly relevant for classification, improving the model’s ability to detect tremor-induced irregularities in spiral and wave drawings. In addition, the GVF algorithm refines the segmentation process, accurately isolating handwritten patterns and further enhancing the generalization potential of the proposed approach. Another key factor supporting generalization is deep feature extraction via CNNs. CNNs are inherently designed to learn hierarchical features, making them strong against variations in input data. Integrating pre-trained CNN models ensures that learned features are transferable to new, unseen samples, improving adaptability throughout different patient populations. Although real-world variability is always a challenge in medical AI applications, this study follows a rigorous methodology that strengthens the dataset and optimally prepares the model for real-world scenarios.
Early diagnosis with AI improves the quality of life of patients and reduces the burden on healthcare providers. This study developed several hybrid systems between machine learning classifiers and CNN models based on feature selection algorithms to analyze handwritten spiral and wave graphic images for the PD dataset. The spiral and wave graphics images were enhanced by two successive filters, the average and the Laplacian. Upon image enhancement, the images were segmented to isolate ROI using the GVF algorithm. ROI was fed to CNN models to extract fine and deep feature maps. The fine features of the CNN models were sequentially integrated for the following models: DenseNet169-MobileNet, MobileNet-VGG16, DenseNet169-VGG16, and DenseNet169-MobileNet-VGG16. After integrating the features of several CNN models, redundant features were formed. Therefore, the ACO and MESbS methods were applied to preserve the strongly associated features and delete the repetitive and weakly associated features. Finally, fused and improved feature vectors were obtained, which were fed to the XGBoost and RF classifiers for high-accuracy classification. All systems achieved superior and accurate results for distinguishing people with PD from healthy controls. The RF classifier with the features of the DenseNet169-MobileNet-VGG16 with ACO method achieved an AUC of 99%, sensitivity of 99.6%, accuracy of 99.3%, precision of 99.35%, and specificity of 99.65%. Finally, the relatively small dataset’s limitation can impact the model’s ability to generalize to unseen data. Data augmentation techniques were applied to artificially increase the dataset size and improve model robustness to mitigate this issue.
Acknowledgement: None.
Funding Statement: The authors received no specific funding for this study.
Author Contributions: Conceptualization, Mohammed Al-Jabbar, Ebrahim Mohammed Senan, Mohammed Alshahrani, Eman A Alshari and Ibrahim Abunadi; methodology, Mohammed Al-Jabbar, Ebrahim Mohammed Senan, Sultan Ahmed Almalki, Mohammed Alshahrani, Ibrahim Abunadi and Eman A Alshari; software, Ebrahim Mohammed Senan, Mohammed Alshahrani, Eman A Alshari and Mohammed Al-Jabbar; validation, Ibrahim Abunadi, Mohammed Al-Jabbar, Ebrahim Mohammed Senan, Mohammed Alshahrani, Eman A Alshari and Sultan Ahmed Almalki; formal analysis, Mohammed Alshahrani, Ibrahim Abunadi, Mohammed Al-Jabbar and Ebrahim Mohammed Senan; investigation, Mohammed Al-Jabbar, Ebrahim Mohammed Senan, Sultan Ahmed Almalki, Mohammed Alshahrani and Eman A Alshari; resources, Mohammed Alshahrani, Ebrahim Mohammed Senan, Sultan Ahmed Almalki and Mohammed Al-Jabbar; data curation, Ebrahim Mohammed Senan, Mohammed Alshahrani, Ibrahim Abunadi, Eman A Alshari and Mohammed Al-Jabbar; writing—original draft preparation, Ebrahim Mohammed Senan; writing—review and editing, Mohammed Alshahrani, Mohammed Al-Jabbar and Eman A Alshari; visualization, Ebrahim Mohammed Senan, Mohammed Al-Jabbar, Ibrahim Abunadi, Mohammed Alshahrani and Eman A Alshari; supervision, Mohammed Alshahrani, Mohammed Al-Jabbar, Ebrahim Mohammed Senan and Sultan Ahmed Almalki; project administration, Mohammed Alshahrani, Ebrahim Mohammed Senan and Mohammed Al-Jabbar; funding acquisition, Mohammed Al-Jabbar, Mohammed Alshahrani and Sultan Ahmed Almalki. All authors reviewed the results and approved the final version of the manuscript.
Availability of Data and Materials: Data supporting the proposed systems for diagnosing Parkinson’s were obtained from the publicly available Internet at: https://www.kaggle.com/datasets/kmader/parkinsons-drawings/data (accessed on 14 April 2025).
Ethics Approval: Not applicable.
Conflicts of Interest: The authors declare no conflicts of interest to report regarding the present study.
References
1. Zeng R, Wang J, Zheng C, Jiang R, Tong S, Wu H, et al. Lack of causal associations of inflammatory bowel disease with Parkinson’s disease and other neurodegenerative disorders. Mov Disord. 2023;38(6):1082–8. doi:10.1002/mds.29386. [Google Scholar] [PubMed] [CrossRef]
2. Ameen G, Osama B. Modeling neural circuits in Parkinson’s disease. In: Handbook of neurodegenerative disorders. Singapore: Springer Nature Singapore; 2023. p. 1–37. doi:10.1007/978-981-19-3949-5_46-1. [Google Scholar] [CrossRef]
3. Koeglsperger T, Rumpf SL, Schließer P, Struebing FL, Brendel M, Levin J, et al. Neuropathology of incidental Lewy body & prodromal Parkinson’s disease. Mol Neurodegener. 2023;18(1):32. doi:10.1186/s13024-023-00622-7. [Google Scholar] [PubMed] [CrossRef]
4. Li HX, Zhang C, Zhang K, Liu YZ, Peng XX, Zong Q. Inflammatory bowel disease and risk of Parkinson’s disease: evidence from a meta-analysis of 14 studies involving more than 13.4 million individuals. Front Med. 2023;10:1137366. doi:10.3389/fmed.2023.1137366. [Google Scholar] [PubMed] [CrossRef]
5. Vaswani PA, Wilkinson JR. Parkinson’s disease and other movement disorders. In: Geriatric medicine. Cham, Switzerland: Springer International Publishing; 2024. p. 1073–96. doi:10.1007/978-3-030-74720-6_86. [Google Scholar] [CrossRef]
6. Aouraghe I, Khaissidi G, Mrabti M. A literature review of online handwriting analysis to detect Parkinson’s disease at an early stage. Multimed Tools Appl. 2023;82(8):11923–48. doi:10.1007/s11042-022-13759-2. [Google Scholar] [CrossRef]
7. Thakur M, Dhanalakshmi S, Kuresan H, Senthil R, Narayanamoorthi R, Lai KW. Automated restricted Boltzmann machine classifier for early diagnosis of Parkinson’s disease using digitized spiral drawings. J Ambient Intell Humaniz Comput. 2023;14(1):175–89. doi:10.1007/s12652-022-04361-3. [Google Scholar] [CrossRef]
8. Kwon SH, Park JK, Koh YH. A systematic review and meta-analysis on the effect of virtual reality-based rehabilitation for people with Parkinson’s disease. J Neuroeng Rehabil. 2023;20(1):94. doi:10.1186/s12984-023-01219-3. [Google Scholar] [PubMed] [CrossRef]
9. Gupta R, Kumari S, Senapati A, Ambasta RK, Kumar P. New era of artificial intelligence and machine learning-based detection, diagnosis, and therapeutics in Parkinson’s disease. Ageing Res Rev. 2023;90(22):102013. doi:10.1016/j.arr.2023.102013. [Google Scholar] [PubMed] [CrossRef]
10. Alalayah KM, Senan EM, Atlam HF, Ahmed IA, Shatnawi HSA. Automatic and early detection of Parkinson’s disease by analyzing acoustic signals using classification algorithms based on recursive feature elimination method. Diagnostics. 2023;13(11):1924. doi:10.3390/diagnostics13111924. [Google Scholar] [PubMed] [CrossRef]
11. Wang Y, He N, Zhang C, Zhang Y, Wang C, Huang P, et al. An automatic interpretable deep learning pipeline for accurate Parkinson’s disease diagnosis using quantitative susceptibility mapping and T1-weighted images. Hum Brain Mapp. 2023;44(12):4426–38. doi:10.1002/hbm.26399. [Google Scholar] [PubMed] [CrossRef]
12. Ayaz Z, Naz S, Khan NH, Razzak I, Imran M. Automated methods for diagnosis of Parkinson’s disease and predicting severity level. Neural Comput Appl. 2023;35(20):14499–534. doi:10.1007/s00521-021-06626-y. [Google Scholar] [CrossRef]
13. Maalej Z, Rejab FB, Nouira K. Deep learning for parkinson’s disease severity stage prediction using a new dataset. In: Bioinformatics and biomedical engineering. IWBBIO 2023. Cham, Switzerland: Springer; 2023. p. 110–23. doi:10.1007/978-3-031-34960-7_8/COVER. [Google Scholar] [CrossRef]
14. Ma YW, Chen JL, Chen YJ, Lai YH. Explainable deep learning architecture for early diagnosis of Parkinson’s disease. Soft Comput. 2023;27(5):2729–38. doi:10.1007/s00500-021-06170-w. [Google Scholar] [CrossRef]
15. Erdaş Ç.B, Sümer E. A fully automated approach involving neuroimaging and deep learning for Parkinson’s disease detection and severity prediction. PeerJ Comput Sci. 2023;9(12):e1485. doi:10.7717/peerj-cs.1485. [Google Scholar] [PubMed] [CrossRef]
16. Jyothika J, Rakshitha R, Bhavyasri B, Prasad CVSR. Parkinson disease detection using deep CNN model. Turk J Comput Math Educ (TURCOMAT). 2023;14(2):675–83. doi:10.17762/TURCOMAT.V14I2.13699. [Google Scholar] [CrossRef]
17. Alissa M, Lones MA, Cosgrove J, Alty JE, Jamieson S, Smith SL, et al. Parkinson’s disease diagnosis using convolutional neural networks and figure-copying tasks. Neural Comput Appl. 2022;34(2):1433–53. doi:10.1007/s00521-021-06469-7. [Google Scholar] [CrossRef]
18. Kurmi A, Biswas S, Sen S, Sinitca A, Kaplun D, Sarkar R. An ensemble of CNN models for Parkinson’s disease detection using DaTscan images. Diagnostics. 2022;12(5):1173. doi:10.3390/diagnostics12051173. [Google Scholar] [PubMed] [CrossRef]
19. Keles A, Keles A, Keles MB, Okatan A. PARNet: deep neural network for the diagnosis of Parkinson’s disease. Multimed Tools Appl. 2024;83(12):35781–93. doi:10.1007/s11042-023-16940-3. [Google Scholar] [CrossRef]
20. Vyas T, Yadav R, Solanki C, Darji R, Desai S, Tanwar S. Deep learning-based scheme to diagnose Parkinson’s disease. Expert Syst. 2022;39(3):e12739. doi:10.1111/exsy.12739. [Google Scholar] [CrossRef]
21. Hireš M, Gazda M, Drotár P, Pah ND, Motin MA, Kumar DK. Convolutional neural network ensemble for Parkinson’s disease detection from voice recordings. Comput Biol Med. 2022;141(8):105021. doi:10.1016/j.compbiomed.2021.105021. [Google Scholar] [PubMed] [CrossRef]
22. Vidya B, Sasikumar P. Parkinson’s disease diagnosis and stage prediction based on gait signal analysis using EMD and CNN-LSTM network. Eng Appl Artif Intell. 2022;114(1):105099. doi:10.1016/j.engappai.2022.105099. [Google Scholar] [CrossRef]
23. Sahu L, Sharma R, Sahu I, Das M, Sahu B, Kumar R. Efficient detection of Parkinson’s disease using deep learning techniques over medical data. Expert Syst. 2022;39(3):e12787. doi:10.1111/exsy.12787. [Google Scholar] [CrossRef]
24. Pahuja G, Prasad B. Deep learning architectures for Parkinson’s disease detection by using multi-modal features. Comput Biol Med. 2022;146(1):105610. doi:10.1016/j.compbiomed.2022.105610. [Google Scholar] [PubMed] [CrossRef]
25. Zhao H, Tsai CC, Zhou M, Liu Y, Chen YL, Huang F, et al. Deep learning based diagnosis of Parkinson’s disease using diffusion magnetic resonance imaging. Brain Imaging Behav. 2022;16(4):1749–60. doi:10.1007/s11682-022-00631-y. [Google Scholar] [PubMed] [CrossRef]
26. Lilhore UK, Dalal S, Faujdar N, Margala M, Chakrabarti P, Chakrabarti T, et al. Hybrid CNN-LSTM model with efficient hyperparameter tuning for prediction of Parkinson’s disease. Sci Rep. 2023;13(1):14605. doi:10.1038/s41598-023-41314-y. [Google Scholar] [PubMed] [CrossRef]
27. Li Z, Yang J, Wang Y, Cai M, Liu X, Lu K. Early diagnosis of Parkinson’s disease using continuous convolution network: handwriting recognition based on off-line hand drawing without template. J Biomed Inform. 2022;130(5):104085. doi:10.1016/j.jbi.2022.104085. [Google Scholar] [PubMed] [CrossRef]
28. Faragó P, Ștefănigă SA, Cordoş CG, Mihăilă LI, Hintea S, Peştean AS, et al. CNN-based identification of Parkinson’s disease from continuous speech in noisy environments. Bioengineering. 2023;10(5):531. doi:10.3390/bioengineering10050531. [Google Scholar] [PubMed] [CrossRef]
29. Shaban M, Amara AW. Resting-state electroencephalography based deep-learning for the detection of Parkinson’s disease. PLoS One. 2022;17(2):e0263159. doi:10.1371/journal.pone.0263159. [Google Scholar] [PubMed] [CrossRef]
30. Dzotsenidze E, Valla E, Nõmm S, Medijainen K, Taba P, Toomela A. Generative adversarial networks as a data augmentation tool for CNN-based Parkinson’s disease diagnostics. IFAC-PapersOnLine. 2022;55(29):108–13. doi:10.1016/j.ifacol.2022.10.240. [Google Scholar] [CrossRef]
31. Quan C, Ren K, Luo Z, Chen Z, Ling Y. End-to-end deep learning approach for Parkinson’s disease detection from speech signals. Biocybern Biomed Eng. 2022;42(2):556–74. doi:10.1016/j.bbe.2022.04.002. [Google Scholar] [CrossRef]
32. Zham P, Kumar DK, Dabnichki P, Poosapadi Arjunan S, Raghav S. Distinguishing different stages of Parkinson’s disease using composite index of speed and pen-pressure of sketching a spiral. Front Neurol. 2017;8:435. doi:10.3389/fneur.2017.00435. [Google Scholar] [PubMed] [CrossRef]
33. Parkinson’s drawings. [Internet]. [cited 2024 Mar 8]. Available from: https://www.kaggle.com/datasets/kmader/parkinsons-drawings/data. [Google Scholar]
34. Kansizoglou I, Tsintotas KA, Bratanov D, Gasteratos A. Drawing-aware Parkinson’s disease detection through hierarchical deep learning models. IEEE Access. 2025;13(1):21880–90. doi:10.1109/ACCESS.2025.3535232. [Google Scholar] [CrossRef]
35. Xu N, Wang W, Fulneček J, Kabot O, Mišák S, Wang L, et al. TBMF framework: a transformer-based multilevel filtering framework for PD detection. IEEE Trans Ind Electron. 2024;71(4):4098–107. doi:10.1109/TIE.2023.3274881. [Google Scholar] [CrossRef]
36. Shamsan A, Senan EM, Shatnawi HSA. Automatic classification of colour fundus images for prediction eye disease types based on hybrid features. Diagnostics. 2023;13(10):1706. doi:10.3390/diagnostics13101706. [Google Scholar] [PubMed] [CrossRef]
37. Khan SS, Khan M, Alharbi Y. Fast local Laplacian filter based on modified Laplacian through bilateral filter for coronary angiography medical imaging enhancement. Algorithms. 2023;16(12):531. doi:10.3390/a16120531. [Google Scholar] [CrossRef]
38. Bilun S, Hrechko M, Myshnova O, Prishlyak A. Structures of optimal discrete gradient vector fields on surface with one or two critical cells. arXiv:2303.07258. 2023. [Google Scholar]
39. Ramaiah A, Balasubramanian PD, Appathurai A, Muthukumaran NA. Detection of parkinson’s disease via clifford gradient-based recurrent neural network using multi-dimensional data. Revue Roumaine des Sciences Techniques—Serie Electrotechnique et Energetique. 2024;69(1):103–8. doi:10.59277/RRST-EE.2024.1.18. [Google Scholar] [CrossRef]
40. Kumari J, Behera SK, Sethy PK, Nanthaamornphong A. Enhanced Parkinson’s disease diagnosis via MRI analysis: integrating deep features from DenseNet201 with neural network techniques. Appl Comput Intell Soft Comput. 2024;2024(1):5582371. doi:10.1155/acis/5582371. [Google Scholar] [CrossRef]
41. Hosny M, Naeem MA, Zhu M, Gao W, Elshenhab AM, Fu Y. A deep learning-based model for automated STN localization using local field potentials in Parkinson’s disease. Soft Comput. 2025;29(4):2343–62. doi:10.1007/s00500-025-10497-z. [Google Scholar] [CrossRef]
42. Abdullah SM, Abbas T, Bashir MH, Ahmad Khaja I, Ahmad M, Soliman NF, et al. Deep transfer learning based Parkinson’s disease detection using optimized feature selection. IEEE Access. 2023;11(3):3511–24. doi:10.1109/ACCESS.2023.3233969. [Google Scholar] [CrossRef]
43. Valarmathi P, Suganya Y, Saranya KR, Shanmuga Priya S. Enhancing parkinson disease detection through feature based deep learning with autoencoders and neural networks. Sci Rep. 2025;15(1):8624. doi:10.1038/s41598-025-88293-w. [Google Scholar] [PubMed] [CrossRef]
44. Olayah F, Senan EM, Ahmed IA, Awaji B. Blood slide image analysis to classify WBC types for prediction haematology based on a hybrid model of CNN and handcrafted features. Diagnostics. 2023;13(11):1899. doi:10.3390/diagnostics13111899. [Google Scholar] [PubMed] [CrossRef]
45. Zhao Y, Liu Y, Li J, Wang X, Yang R, Lian C, et al. Global joint information extraction convolution neural network for Parkinson’s disease diagnosis. Expert Syst Appl. 2024;243(5):122837. doi:10.1016/j.eswa.2023.122837. [Google Scholar] [CrossRef]
46. Zhang T, Lin L, Xue Z. A voice feature extraction method based on fractional attribute topology for Parkinson’s disease detection. Expert Syst Appl. 2023;219(3):119650. doi:10.1016/j.eswa.2023.119650. [Google Scholar] [CrossRef]
47. Al-Jabbar M, Alshahrani M, Senan EM, Ahmed IA. Multi-method diagnosis of histopathological images for early detection of breast cancer based on hybrid and deep learning. Mathematics. 2023;11(6):1429. doi:10.3390/math11061429. [Google Scholar] [CrossRef]
48. Hanna EM, El Hasbani G, Azar D. Ant colony optimization for the identification of dysregulated gene subnetworks from expression data. BMC Bioinformatics. 2024;25(1):254. doi:10.1186/s12859-024-05871-x. [Google Scholar] [PubMed] [CrossRef]
49. Saheed YK, Abdulganiyu OH, Abdulsalam M, Mustapha M, Olivier MM, Majikumna KU. A hybrid ant colony optimization for Parkinson’s disease classification based on synthetic minority oversampling and adaptive synthetic techniques. In: 2024 5th International Conference on Data Analytics for Business and Industry (ICDABI); 2024 Oct 23–24; Bahrain, Zallaq. p. 16–23. doi:10.1109/ICDABI63787.2024.10800028. [Google Scholar] [CrossRef]
50. Krishna AY, Kiran KR, Sai NR, Sharma A, Praveen SP, Pandey J. Ant colony optimized XGBoost for early diabetes detection: a hybrid approach in machine learning. JISIoT. 2023;10(2):76–89. doi:10.54216/JISIoT.100207. [Google Scholar] [CrossRef]
51. Bibi A, Attique Khan M, Younus Javed M, Tariq U, Kang BG, Nam Y, et al. Skin lesion segmentation and classification using conventional and deep learning based framework. Comput Mater Contin. 2022;71(2):2477–95. doi:10.32604/cmc.2022.018917. [Google Scholar] [CrossRef]
52. Santos DF. Parkinson’s disease detection using XGBoost and machine learning. MedRxiv. 2023;10(5):573. doi:10.1101/2023.10.23.23297369. [Google Scholar] [CrossRef]
53. Karan B. Speech-based Parkinson’s disease prediction using XGBoost-based features selection and the stacked ensemble of classifiers. J Inst Eng Ind Ser B. 2023;104(2):475–83. doi:10.1007/s40031-022-00851-2. [Google Scholar] [CrossRef]
54. Rifqah Fahira N, Lawi A, Aqsha M. Early detection model of Parkinson’s disease using random forest method on voice frequency data. J Nat Sci Math Res. 2023;9(1):29–37. doi:10.21580/jnsmr.2023.9.1.13148. [Google Scholar] [CrossRef]
55. Hamdi M, Senan EM, Awaji B, Olayah F, Jadhav ME, Alalayah KM. Analysis of WSI images by hybrid systems with fusion features for early diagnosis of cervical cancer. Diagnostics. 2023;13(15):2538. doi:10.3390/diagnostics13152538. [Google Scholar] [PubMed] [CrossRef]
56. Ray A, Chaudhuri AK. A novel diagnosis system for Parkinson’s disease based on ensemble random forest. In: Data driven science for clinically actionable knowledge in diseases. Boca Raton, FL, USA: Chapman and Hall/CRC; 2023. p. 92–107. doi:10.1201/9781003292357-4. [Google Scholar] [CrossRef]
Cite This Article
 Copyright © 2025 The Author(s). Published by Tech Science Press.
This work is licensed under a Creative Commons Attribution 4.0 International License , which permits unrestricted use, distribution, and reproduction in any medium, provided the original work is properly cited.
 Downloads
 Citation Tools