
 Submit a Paper
 Propose a Special lssue
 Open Access
ARTICLE

A Novel Data-Annotated Label Collection and Deep-Learning Based Medical Image Segmentation in Reversible Data Hiding Domain
1 School of Computer Science, Nanjing University of Information Science & Technology, Nanjing, 210044, China
2 Engineering Research Center of Digital Forensics, Ministry of Education, Nanjing University of Information Science & Technology, Nanjing, 210044, China
3 Henan Key Laboratory of Cyberspace Situation Awareness, Zhengzhou, 450001, China
* Corresponding Author: Jinwei Wang. Email:
Computer Modeling in Engineering & Sciences 2025, 143(2), 1635-1660. https://doi.org/10.32604/cmes.2025.063992
Received 31 January 2025; Accepted 01 April 2025; Issue published 30 May 2025
 View Full Text
 Download PDF
Abstract
Medical image segmentation, i.e., labeling structures of interest in medical images, is crucial for disease diagnosis and treatment in radiology. In reversible data hiding in medical images (RDHMI), segmentation consists of only two regions: the focal and nonfocal regions. The focal region mainly contains information for diagnosis, while the nonfocal region serves as the monochrome background. The current traditional segmentation methods utilized in RDHMI are inaccurate for complex medical images, and manual segmentation is time-consuming, poorly reproducible, and operator-dependent. Implementing state-of-the-art deep learning (DL) models will facilitate key benefits, but the lack of domain-specific labels for existing medical datasets makes it impossible. To address this problem, this study provides labels of existing medical datasets based on a hybrid segmentation approach to facilitate the implementation of DL segmentation models in this domain. First, an initial segmentation based on a kernel is performed to analyze identified contour pixels before classifying pixels into focal and nonfocal regions. Then, several human expert raters evaluate and classify the generated labels into accurate and inaccurate labels. The inaccurate labels undergo manual segmentation by medical practitioners and are scored based on a hierarchical voting scheme before being assigned to the proposed dataset. To ensure reliability and integrity in the proposed dataset, we evaluate the accurate automated labels with manually segmented labels by medical practitioners using five assessment metrics: dice coefficient, Jaccard index, precision, recall, and accuracy. The experimental results show labels in the proposed dataset are consistent with the subjective judgment of human experts, with an average accuracy score of 94% and dice coefficient scores between 90%– 99%. The study further proposes a ResNet-UNet with concatenated spatial and channel squeeze and excitation (scSE) architecture for semantic segmentation to validate and illustrate the usefulness of the proposed dataset. The results demonstrate the superior performance of the proposed architecture in accurately separating the focal and nonfocal regions compared to state-of-the-art architectures. Dataset information is released under the following URL: (accessed on 31 March 2025).Keywords
Medical imaging has revolutionized general healthcare by providing critical insights into diagnosing, treating, and monitoring various diseases. Compiling medical images into datasets is vital in advancing this domain, especially in the age of deep learning, where the numerous benefits that enhance diagnostic accuracy, efficiency, and patient outcomes are realized. Datasets provide the framework for training and evaluating models, facilitating the development of automated tools for image analysis, such as classification, segmentation, tracking, registration, and detection [1]. Existing medical image datasets focus on specific clinical tasks that are not limited to identifying anatomical structure, disease monitoring, progression, guidance for interventional procedures, screening and preventive care, and functional and metabolic imaging. A survey of existing datasets shows no dataset with labels for RDHMI, and no firm conclusions are possible due to the inaccessibility of datasets in this domain.
In RDHMI, medical images are classified into two regions: the focal region (FR), the region of concentration containing information, and the nonfocal region (NFR), the monochrome background. The prime step in RDHMI methods is to separate these regions. Traditional segmentation methods such as region-based [2], threshold-based [3], support vector-based [4], and edge-based [5] are commonly used to classify pixels for segmentation. However, these methods are ineffective when applied to complex medical images with multiple organs or twisted contours. Gao et al. [6] adopted a manual segmentation approach to segment medical images and employed UNet 3+ [7] deep learning architecture to separate the focal and nonfocal regions. Like many other medical imaging practices, manual delineation of concentration regions is time-consuming and poorly reproducible, and segmentation shows operator-dependent results even among medical practitioners [8]. Although the Gao et al. approach proved encouraging, the limitations of manual segmentation restrict its extensive application since it is infeasible for large-scale datasets and author-dependent. Also, directly employing UNet 3+ in RDHMI without appropriate domain adaptation techniques may lead to feature mismatch and unstable predictions due to differences between its original training data and the new task. Shao et al. [9] investigate several studies on medical image segmentation to discuss how deep learning architectures significantly improve medical image segmentation compared to conventional methods. Jian et al. [10] proposed an enhanced UNet-based architecture and dynamic convolution to increase the accuracy rating of retinal blood vessel segmentation. Amrit et al. [11] proposed a customized UNet 3+ to segment medical images and embed encrypted watermarks based on the Galois field to balance imperceptibility and robustness with high security.
This paper presents a novel data-annotated label collection and deep-learning-based medical image segmentation in the RDHMI domain. The data-annotated label collection contains RDHMI domain-specific labels of existing medical datasets using a hybrid segmentation approach to facilitate the implementation of DL models in this domain. Hybrid segmentation consists of automated and manual segmentation approaches, combining the benefits of both methods while resolving their limitations to generate accurate labels. First, an improved traditional threshold segmentation method based on image local complexity using a
The main contributions of this paper can be summarized as follows:
1. In the existing segmentation methods, traditional segmentation is ineffective for many medical images, while manual segmentation is mainly operator-dependent. To address these problems, an improved threshold segmentation method based on image local complexity using a
2. A dataset of RDHMI domain-specific labels from existing medical image datasets for DL models is built for the first time. In addition, the collection combines automated and manual segmentation approaches to segment medical images. The ground truth labels in the proposed dataset are consistent with the subjective judgment of human experts, providing confidence for DL model training, feature selection, and optimization in the RDHMI domain.
3. We review state-of-the-art deep learning architectures and attention mechanisms for medical image segmentation based on popularity and performance. We evaluate their performances when employed for semantic segmentation in the RDHMI domain.
4. We propose a deep learning architecture composed of the UNet, residual networks, and scSE attention blocks. To the best of our knowledge, this is the first study on deep learning implementation in the RDHMI domain.
5. We perform several experiments using the proposed dataset to validate the significance of the proposed RDHMI dataset and the deep learning architecture. Experimental results demonstrate the superior performance of our proposed ResNet-UNet with concatenated scSE architecture over state-of-the-art deep learning architectures.
The remainder of this paper is organized as follows: Section 2 introduces the datasets used in the proposed RDHMI dataset and related deep learning architectures for semantic segmentation. Section 3 provides an extensive overview of the proposed RDHMI dataset and ResNet-UNet with concatenated scSE architecture. The experimental setup and discussions are presented in Section 4, and the paper is concluded in Section 5.
2.1 Medical Image Datasets and Challenges
Existing medical image datasets employ different modalities for medical image representation. The first medical image dataset made public is generally considered the visible human project created by the U.S. national library of medicine (NLM) in 1995. The development of medical imaging modalities began with X-radiation (X-ray) [15] and has evolved to different modalities such as three-dimensional (3D) computed tomography (CT), endoscopy, magnetic resonance imaging (MRI), nuclear medicine, optical coherence tomography (OCT), and ultrasound. A survey in [1] showed that from 2013 to 2020, medical image datasets predominantly focused on the brain, eye, heart, and lung. The annotations in these datasets and challenges were primarily for classification, detection, and segmentation. We discuss popular existing medical image datasets and challenges targeted by most existing RDHMI methods.
2.1.1 Brain–Datasets and Challenges
The human brain primarily comprises neurons and glial cells (cerebrum, cerebellum, brainstem), which support and protect neurons. The brain acts as the control center of the human body and processes sensory information for thinking, memory, decision-making, and emotions. The primary processing of brain-related images is clinically critical for diagnosis, treatment, and other brain-related analysis tasks. Existing datasets focus on segmentation, generation, registration, and tractography. With segmentation attracting much attention, several datasets and challenges have been released for brain diseases such as Alzheimer’s disease [16], cerebral aneurysm [17], cerebral ischemia [18], glioma [19], intracerebral hemorrhage [20], and multiple sclerosis [21]. We identified the open access series of imaging studies OASIS-1 [22], OASIS-2 [23], and OASIS-3 [24] datasets, which is a collection of neuroimaging and clinical data aimed at advancing research in brain health and diseases, particularly Alzheimer’s disease as part of the selected brain-related dataset for the proposed RDHMI dataset. The series OASIS-1, OASIS-2, and OASIS-3 were released in 2007, 2012, and 2018, respectively, with over 25,000 citations after its release. OASIS-1 contains cross-sectional MRI data from 416 subjects aged 18–96 years, including T1-weighted MRI scans, demographic information, clinical dementia rating (CDR), and mini-mental state examination (MMSE) scores. OASIS-2 contains longitudinal MRI data from 150 subjects aged 60-96, including T1-weighted MRI scans, demographic information, CDR, MMSE scores, and other cognitive assessments. Lastly, OASIS-3 contains longitudinal multimodal data from over 1000 subjects, including T1-weighted MRI, T2-weighted MRI, functional MRI (fMRI), and positron emission tomography (PET) scans, along with extensive clinical assessments and biomarker data (e.g., cerebrospinal fluid measurements). Generally, the OASIS datasets offer unique strengths in advancing the understanding and treatment of brain aging and neurodegenerative diseases, catering to different aspects of neuroimaging research and contributing significantly to the scientific community.
2.1.2 Eye–Datasets and Challenges
Like the human brain, the human eye is a complex sensory organ with several interconnected structures, such as the cornea, iris, pupil, lens, retina, and optic nerve responsible for vision. For eye imaging, existing eye-related datasets and challenges use fundus photography [25], and OCT [26]. Fundus photography is a new modality that is safe for evaluating the eye and locating retinal lesions to provide details on eye blood vessels and optic discs. However, it is unsuitable for diagnosing microangioma and planning retinal lasers for photocoagulation treatment. Diverse datasets and challenges in these modalities have been released for core diseases such as cataracts [27], glaucoma [28], macular degeneration [29], and diabetic retinopathy [30]. The analysis tasks in eye imaging range from classification to segmentation and detection. Datasets on diabetic retinopathy detection (DRD) have gained much interest in eye-related analysis tasks. The DRD dataset [30] was released in 2015 (over 300 citations) and contains a collection of high-resolution retinal fundus images classified into five categories based on the severity of diabetic retinopathy: no retinopathy, mild, moderate, severe, and proliferative retinopathy. The classification contains the interior surface of the eye, including the retina, optic disc, and posterior pole. The DRD dataset is highly relevant to diagnosing and classifying retinal diseases. The DRD is selected as part of the eye-related dataset for the proposed RDHMI dataset.
2.1.3 Heart–Datasets and Challenges
The human brain and eye are categorized in the head section, while the lung and heart are placed in the chest and abdomen section. The human heart is a muscular organ with four chambers: two upper atria and two lower ventricles and valves. The heart serves as the central pump of the cardiovascular system, circulating oxygen-rich blood throughout the body and removing waste products. Datasets and challenges released are CT, MR, and ultrasound modalities and focus on diseases such as cardiomyopathy and heart failure [31], arrhythmias [32], and valvular heart disease [33] for classification, segmentation of chambers and valves, tracking, registration, and regression. Although the current modalities effectively provide details of the heart tissues graphically, the continuous heartbeat blurs images, making analysis tasks challenging, especially for ultrasound images, which have a dynamic nature. We review the Sunnybrook cardiac data (SCD) dataset [34] released in 2009 (over 200 citations), a collection of cardiac MRI scans from 45 patients, including both cine MRIs (dynamic sequences capturing heart motion) and still images. The SCD dataset covers a range of cardiac conditions with patient data conditions such as healthy, hypertrophic cardiomyopathy, dilated cardiomyopathy, and heart failure with infarction. We include the SCD dataset in the heart-related dataset for the proposed RDHMI dataset.
2.1.4 Lung–Datasets and Challenges
As the heart pumps blood to circulate the body, the lung is responsible for respiration, facilitating oxygen and carbon dioxide alternating between the air and the bloodstream. The anatomy of the lung is made of the bronchi and bronchioles, alveoli, diaphragm, and intercostal muscles. Several datasets and challenges have been created for lung imaging for similar analysis tasks such as classification, segmentation, tracking, registration, and regression. Medical imaging datasets and challenges have been released for lung diseases such as asthma [35], pneumonia [36], pulmonary embolism [37], and lung cancer [38]. During the COVID-19 epidemic, several datasets were released for classification tasks to diagnose COVID-19-related lesions, such as ground-glass opacity, air-containing space, and pleural effusion. We employ the lung image database consortium image collection (LIDC-IDRI) [39] in the lung-related dataset for the proposed RDHMI dataset. The LIDC-IDRI is a comprehensive dataset of thoracic CT modality scans released in 2011 (over 1500 citations) for lung cancer detection and diagnosis. The collection is categorized into 3 mm
2.1.5 Others–Datasets and Challenges
In the proposed RDHMI dataset, other datasets and challenges were reviewed to cover different parts of the human body. The international skin imaging collaboration (ISIC) archive [40] is a pivotal resource in dermatology, primarily focusing on skin diseases such as melanoma, basal, and squamous cell carcinoma. The ISIC archive was released in 2016, and over 100,000 dermoscopic images and annotations provided details for lesion classification, detection, and segmentation. The brain tumor segmentation (BRATS) [41] challenge addressed the need for accurate and automated brain tumor segmentation methods, which play a vital role in diagnosing, treating, and monitoring brain cancer patients. The challenge has evolved over the years since its beginning in 2012. We employ the 2012 edition, which focuses on the segmentation of gliomas represented in the T1-weighted MRI, T1-weighted MRI with contrast enhancement (T1c), T2-weighted MRI, fluid-attenuated inversion recovery (FLAIR) MRI in the RDHMI dataset. The medical segmentation decathlon (MSD) [42] is a benchmarking challenge focused on accurately segmenting different organs and diseases. The MSD comprises ten tasks: brain tumor segmentation, heart, liver, hippocampus, prostate, lung, pancreas, hepatic vessel, spleen, and colon, represented in MRI and CT modalities. Since its release in 2018, MSD has fostered the development of more generalizable and robust segmentation methods in clinical settings. We employed the brain tumor (MSD-1), hippocampal (MSD-4), spleen (MSD 9), and colon (MSD-10) tasks in the proposed RDHMI dataset. The combined healthy abdominal organ segmentation (CHAOS) challenge [43] is a benchmark designed to facilitate reliable segmentation of abdominal organs from multi-modality imaging datasets, including CT and MRI. The CHAOS challenge focused on liver, kidneys, and spleen organ segmentation.
2.2 Deep Learning Architectures
This subsection presents the reviewed state-of-the-art deep learning architectures and attention mechanisms selected for experimentation in this study. As mentioned earlier, the criteria for selection prioritizes popularity (measured by the number of citations), the clarity of the intuition behind the architecture, and their seamless fit into the RDHMI domain.
UNet [12] remains the most recognized architecture for medical image segmentation. Due to limited access to medical images, the architecture offers methodologies to leverage data augmentations to utilize the few available data efficiently. It comprises a contracting (encoder) path that captures context and a symmetric expansive (decoder) path that guarantees precise localization. The encoder path imitates a standard convolutional network architecture with repeated two
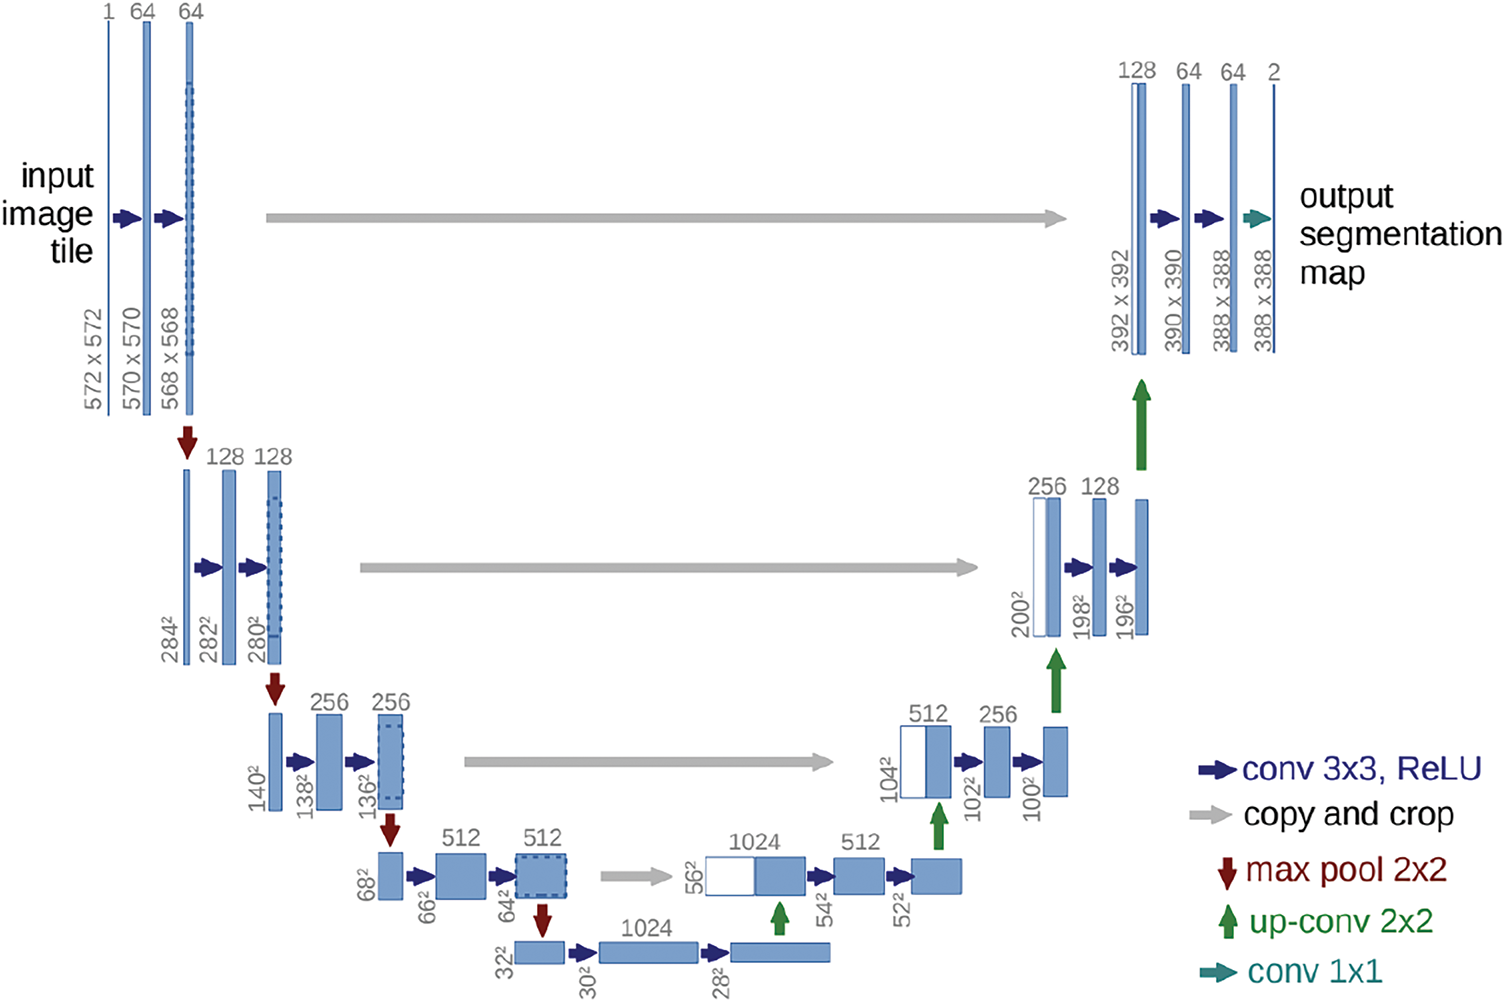
Figure 1: Graphical illustration of UNet
UNet 3+ [7], a full-scale connected UNet with deep supervision, uses feature maps at complete scales for accurate segmentation. The full-scale connections convert the inter-connection between the encoder-decoder and the intra-connection between the decoder-subnetworks to integrate low-level features with high-level semantics from different scale feature maps. The deep supervision learns hierarchical representations from the complete scale aggregated feature maps. Each layer in the expansive path combines smaller and same-scale feature maps from the encoder and larger-scale feature maps from the decoder to capture fine-grained details and coarse-grained semantics. Unlike UNet, UNet 3+ uses a chain of intra-decoder skip connections to transfer high-level semantic information from larger-scale decoder layers and a set of inter-encoder-decoder skip connections to transmit low-level features from small-scale encoder layers using bilinear interpolation. Moreover, the deep supervision approach in UNet 3+ generates a side output from each decoder stage to be supervised by the ground truth. The classification-guided module (CGM) is an extra classification task designed to predict the existence of organs in input images. The original study proposes a hybrid loss consisting of focal loss, structural similarity index loss, and Jaccard loss to capture large-scale, delicate structures with distinct boundaries. The UNet 3+ architecture is shown in Fig. 2.
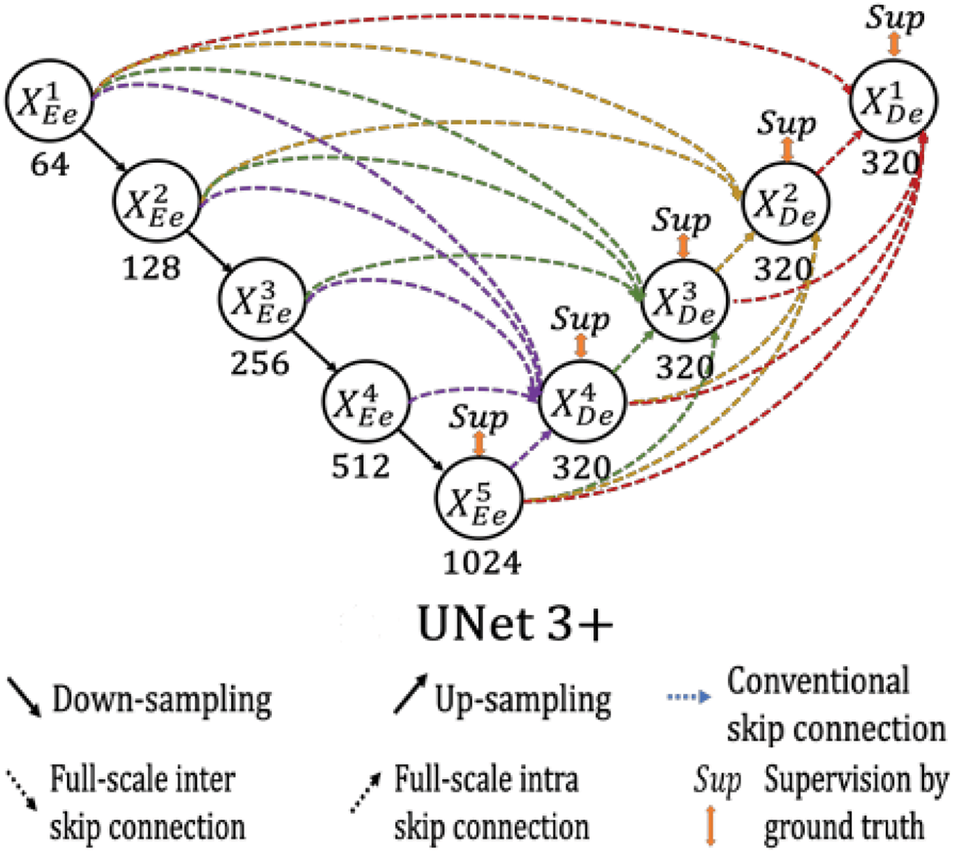
Figure 2: Graphical illustration of UNet 3+
Attention UNet [44], based on the UNet architecture, is the first use case of the soft-attention technique in a feedforward architecture to focus on target structures of different shapes and solve multi-scale problems. It introduces a grid-based attention gate (AG) model that allows attention coefficients to focus on local regions and suppress irrelevant portions while highlighting relevant salient features passing through the skip connections. The attention coefficient is a computed summed high-level and low-level feature, followed by non-linearity and grid resampling using trilinear interpolation. The attention gates guide the network in learning different target structures of various shapes and sizes to eliminate reliance on explicit external localization modules of cascaded convolutional neural networks (CNN). Additionally, the attention gate filters the neuron activations to update model parameters in shallower layers during the forward and backward pass based on relevant spatial regions. Fig. 3 shows the Attention UNet and AG schematic.
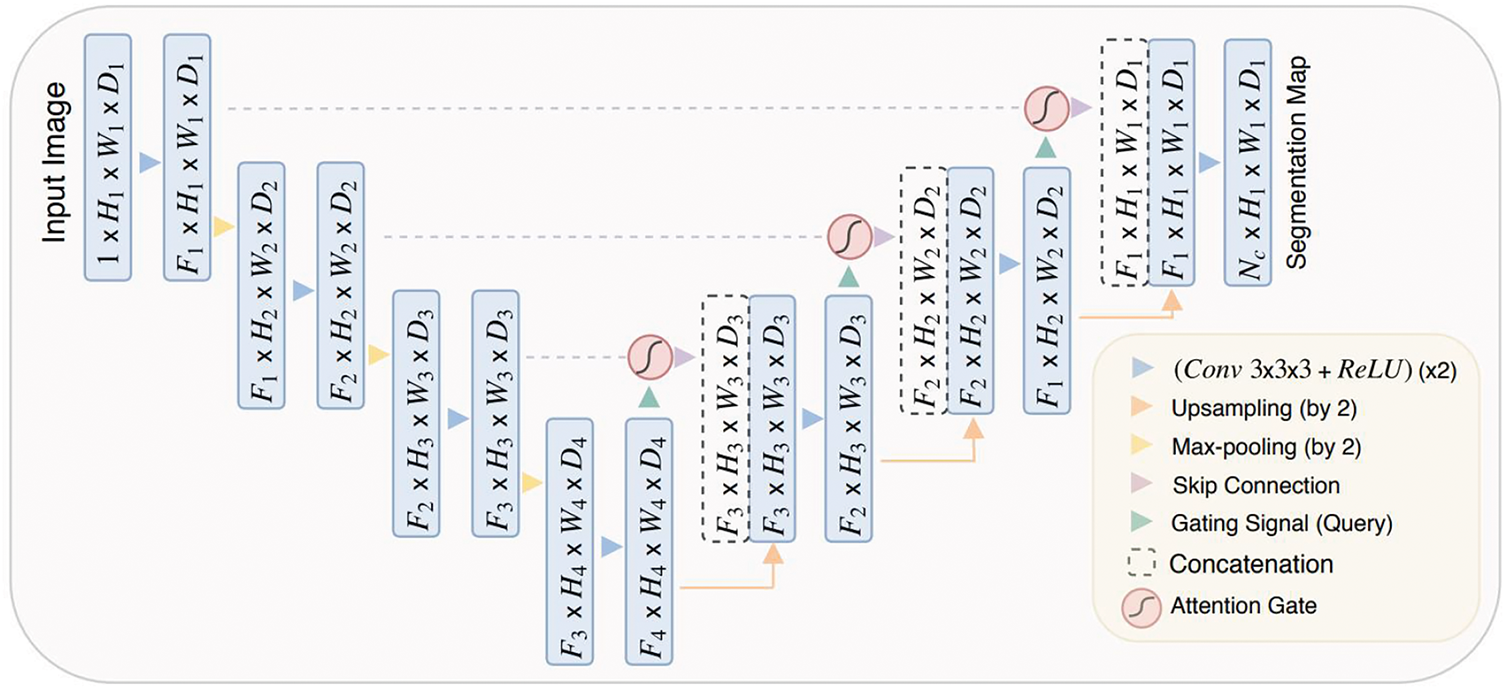
Figure 3: Graphical illustration of Attention UNet
2.2.4 Dual Attention Network (DANet)
DANet [45] is a correlation-based attention network that integrates local features with global dependencies to capture contextual relationships. It solves intra-class problems by appending the position attention module (PAM) and channel attention module (CAM) on top of a dilated fully convolutional network (FCN) to capture the semantic interdependencies in spatial and channel dimensions, respectively. The PAM sums feature at each position by a weighted sum of features across all positions based on feature similarities, regardless of distance. Similar to the PAM, the CAM integrates corresponding features among all channel maps. The network sums output PAM and CAM to assign higher weights to positions with feature similarities in the spatial or channel dimensions and vice versa. DANet uses ResNet as a backbone to feed learned features into parallel PAM and CAM. Then, new features of spatial and channel long-range contextual information are generated by generating spatial and channel attention matrices to model the relationship between any two pixels of the features, multiplying the attention matrix and original features, and performing element-wise sum operation. Finally, the PAM and CAM outputs are combined for prediction. Fig. 4 shows the illustration of DANet.
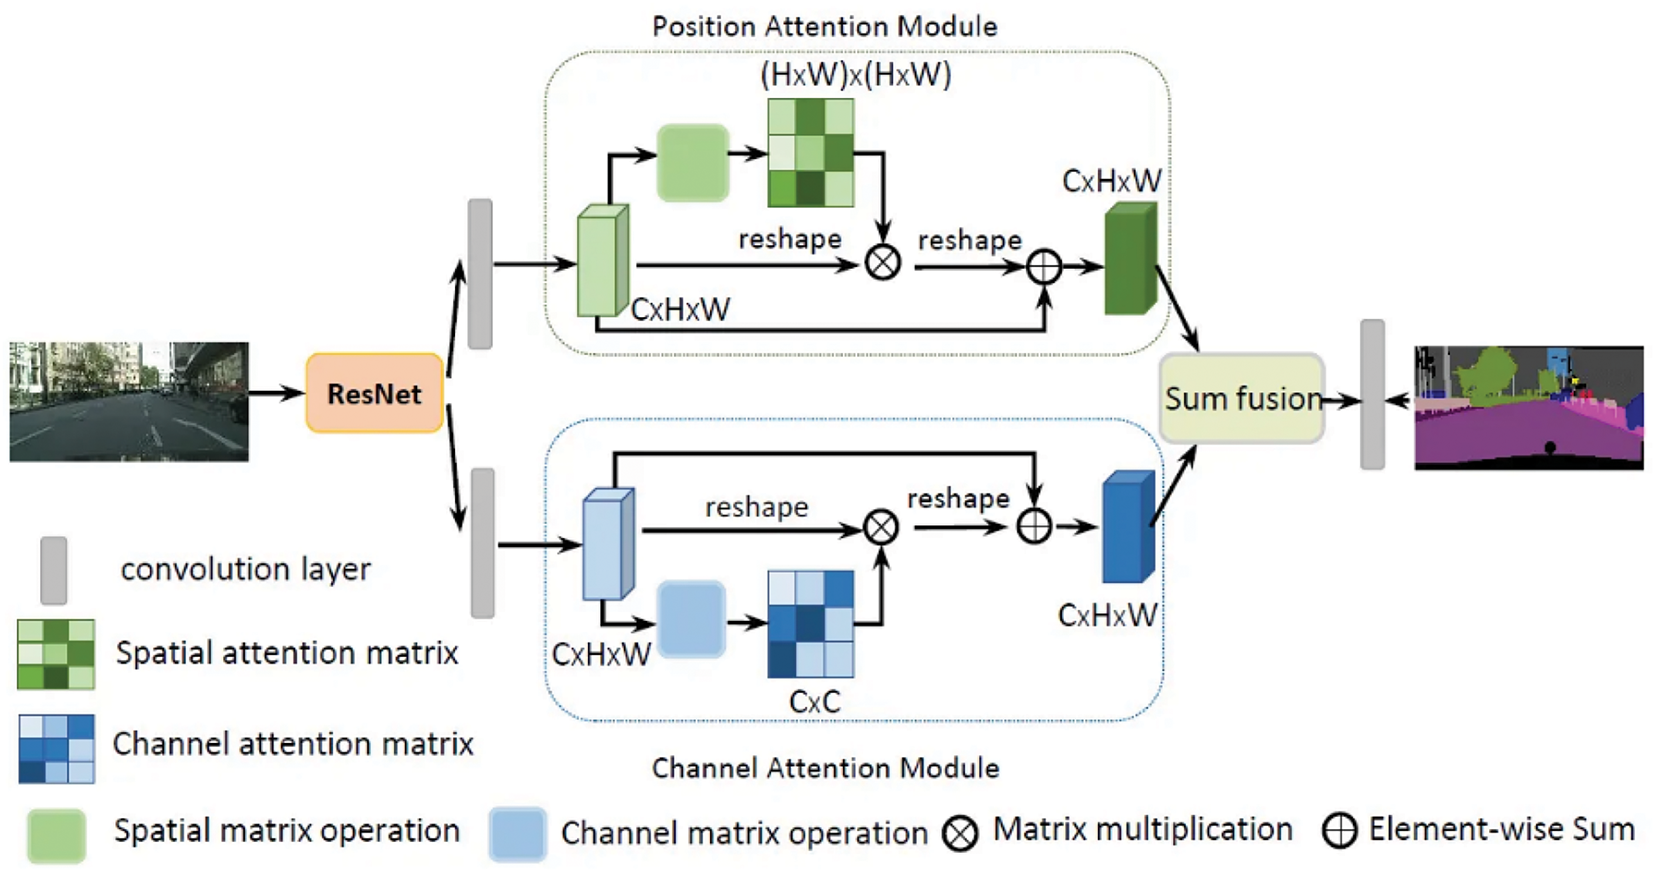
Figure 4: Graphical illustration of DANet
In this section, we provide an overview of the proposed RDHMI dataset. The current collection contains about 20,000 generated labels from existing public medical image datasets and challenges between 2007 and 2020. We present details of each reviewed dataset and challenges. Figs. 5 and 6 illustrate the dataset creation steps and taxonomy, respectively.
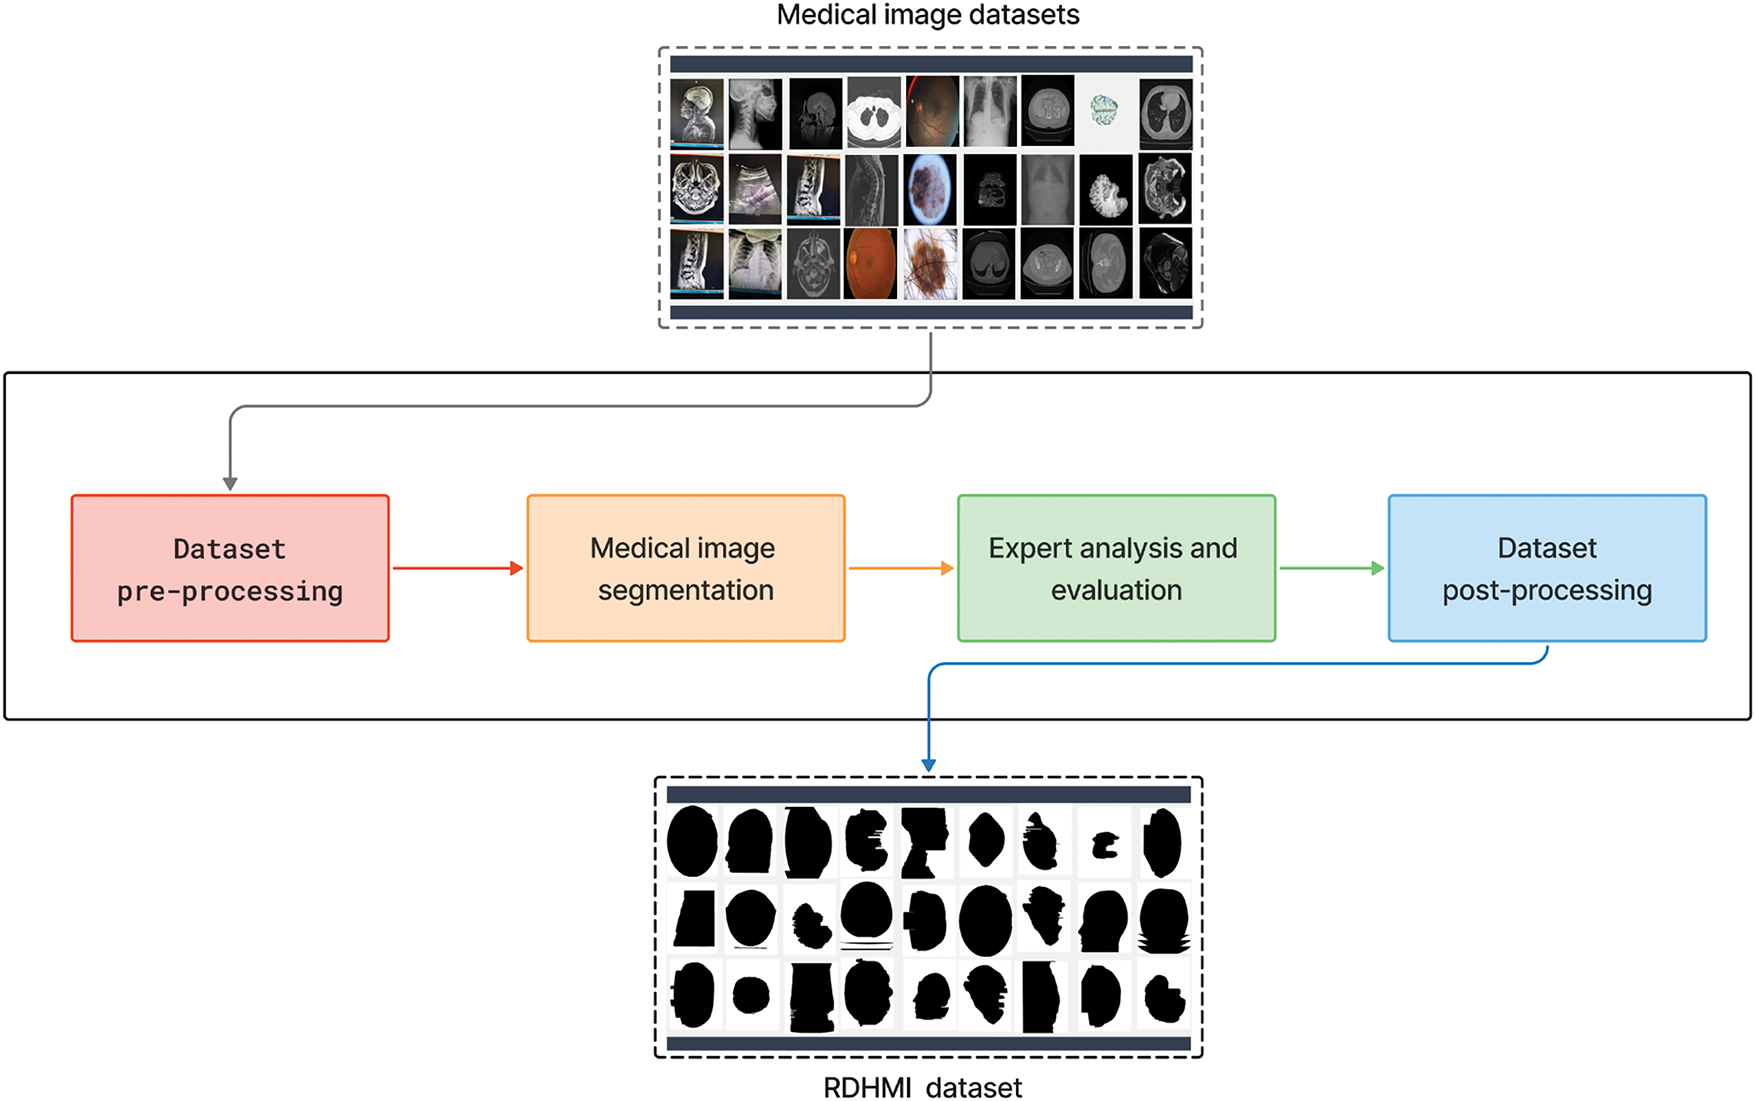
Figure 5: Overview of proposed RDHMI dataset development steps
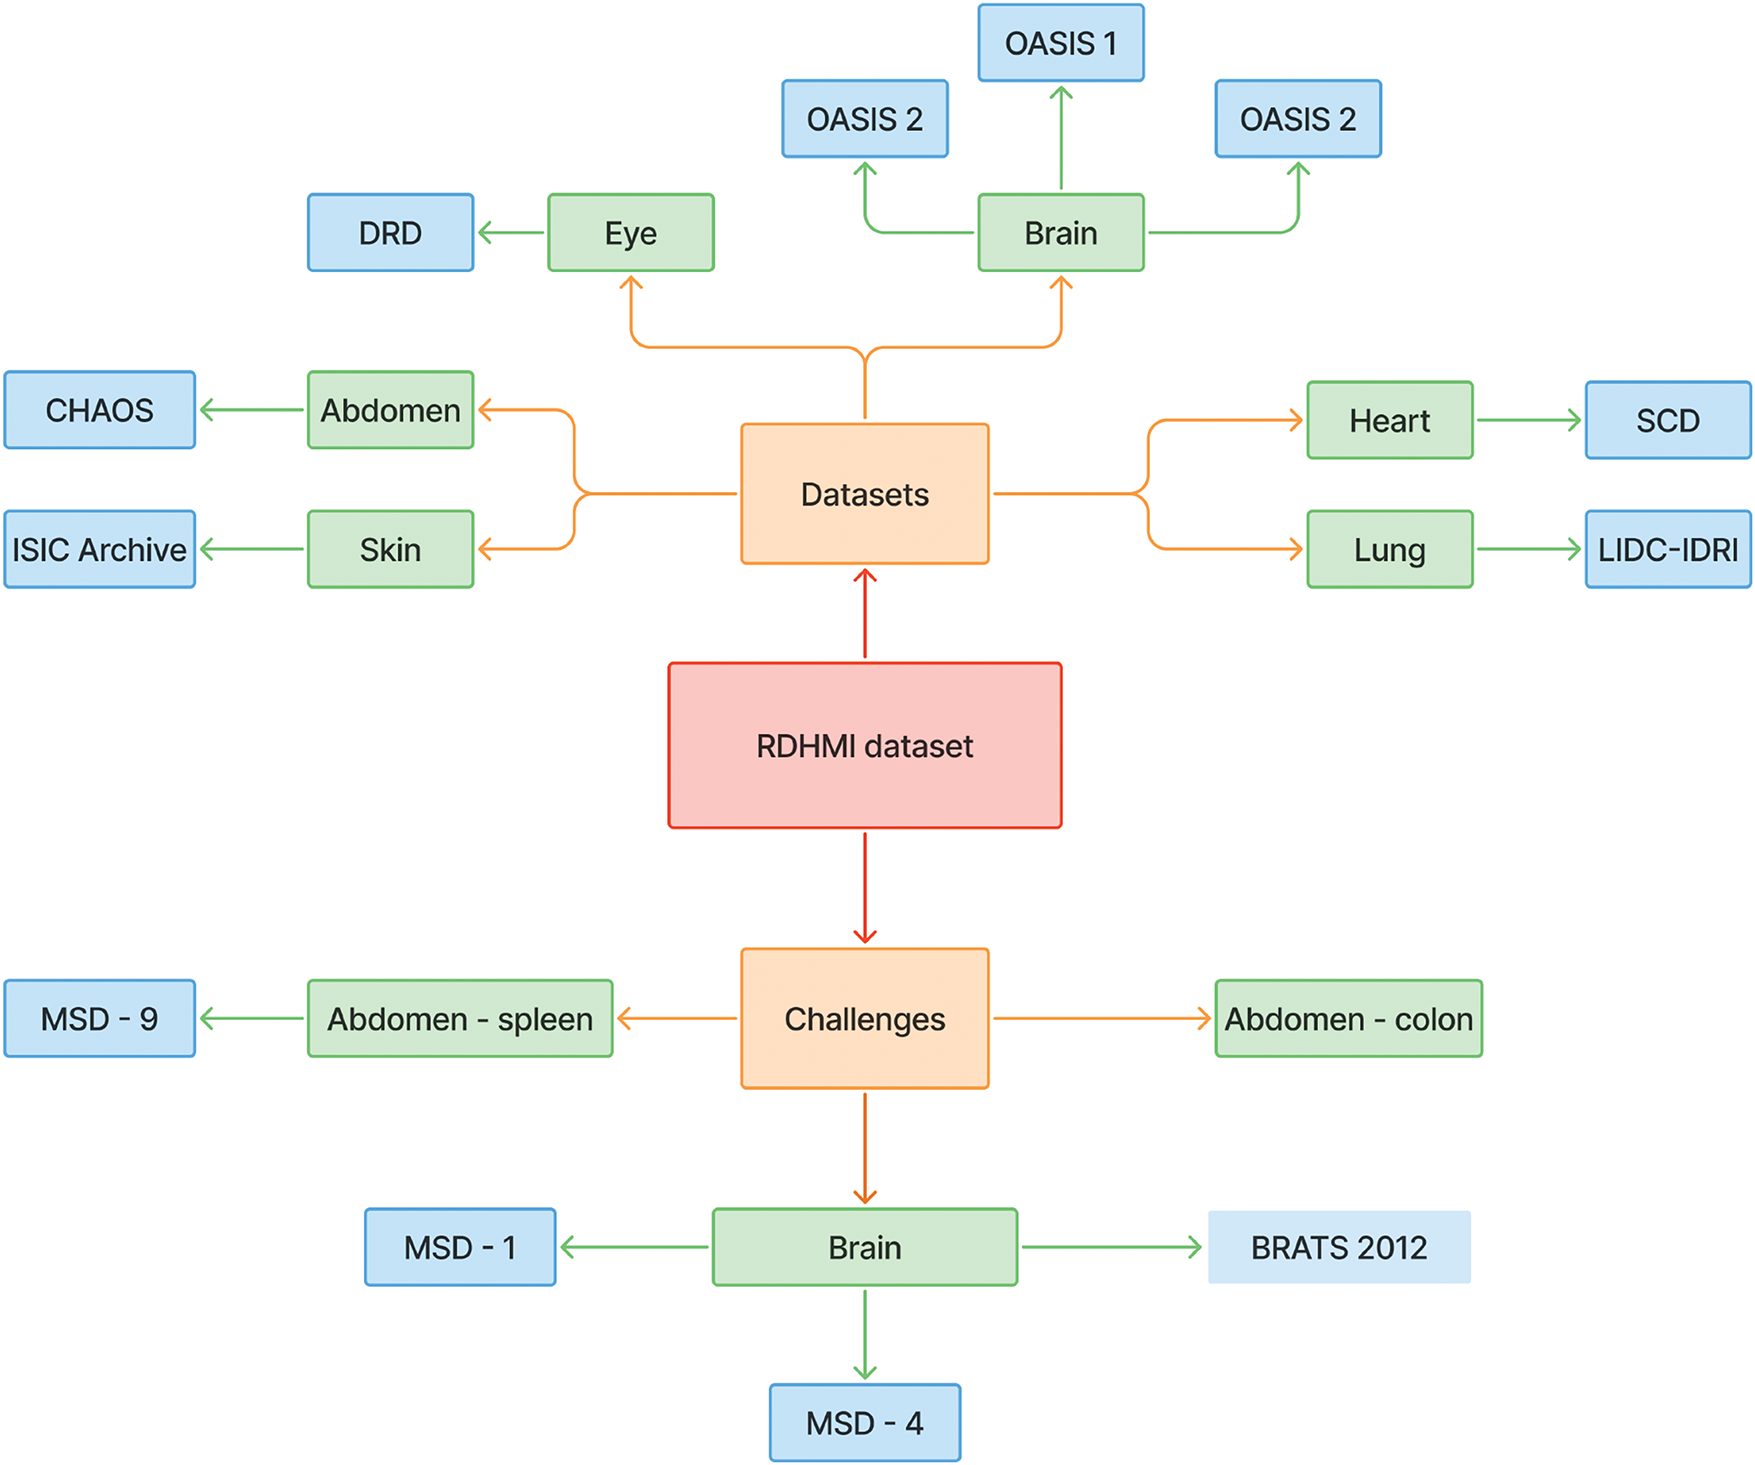
Figure 6: A taxonomy of all reviewed datasets and challenges
The medical images used in this dataset are from publicly released medical image datasets and challenges. We geared towards public datasets and challenges due to their accessibility and lack of distribution license. The details of the reviewed datasets and challenges are presented in Table 1. Different pre-processing schemes were performed to unify the structure and format of the medical images. The typical standard formats for the datasets were the neuroimaging informatics technology initiative (NiFTI), digital imaging and communications in medicine (DICOM), and high dynamic range (HDR). Data diversity was ensured as several datasets and challenges of diverse focus, modalities, and tasks were reviewed.
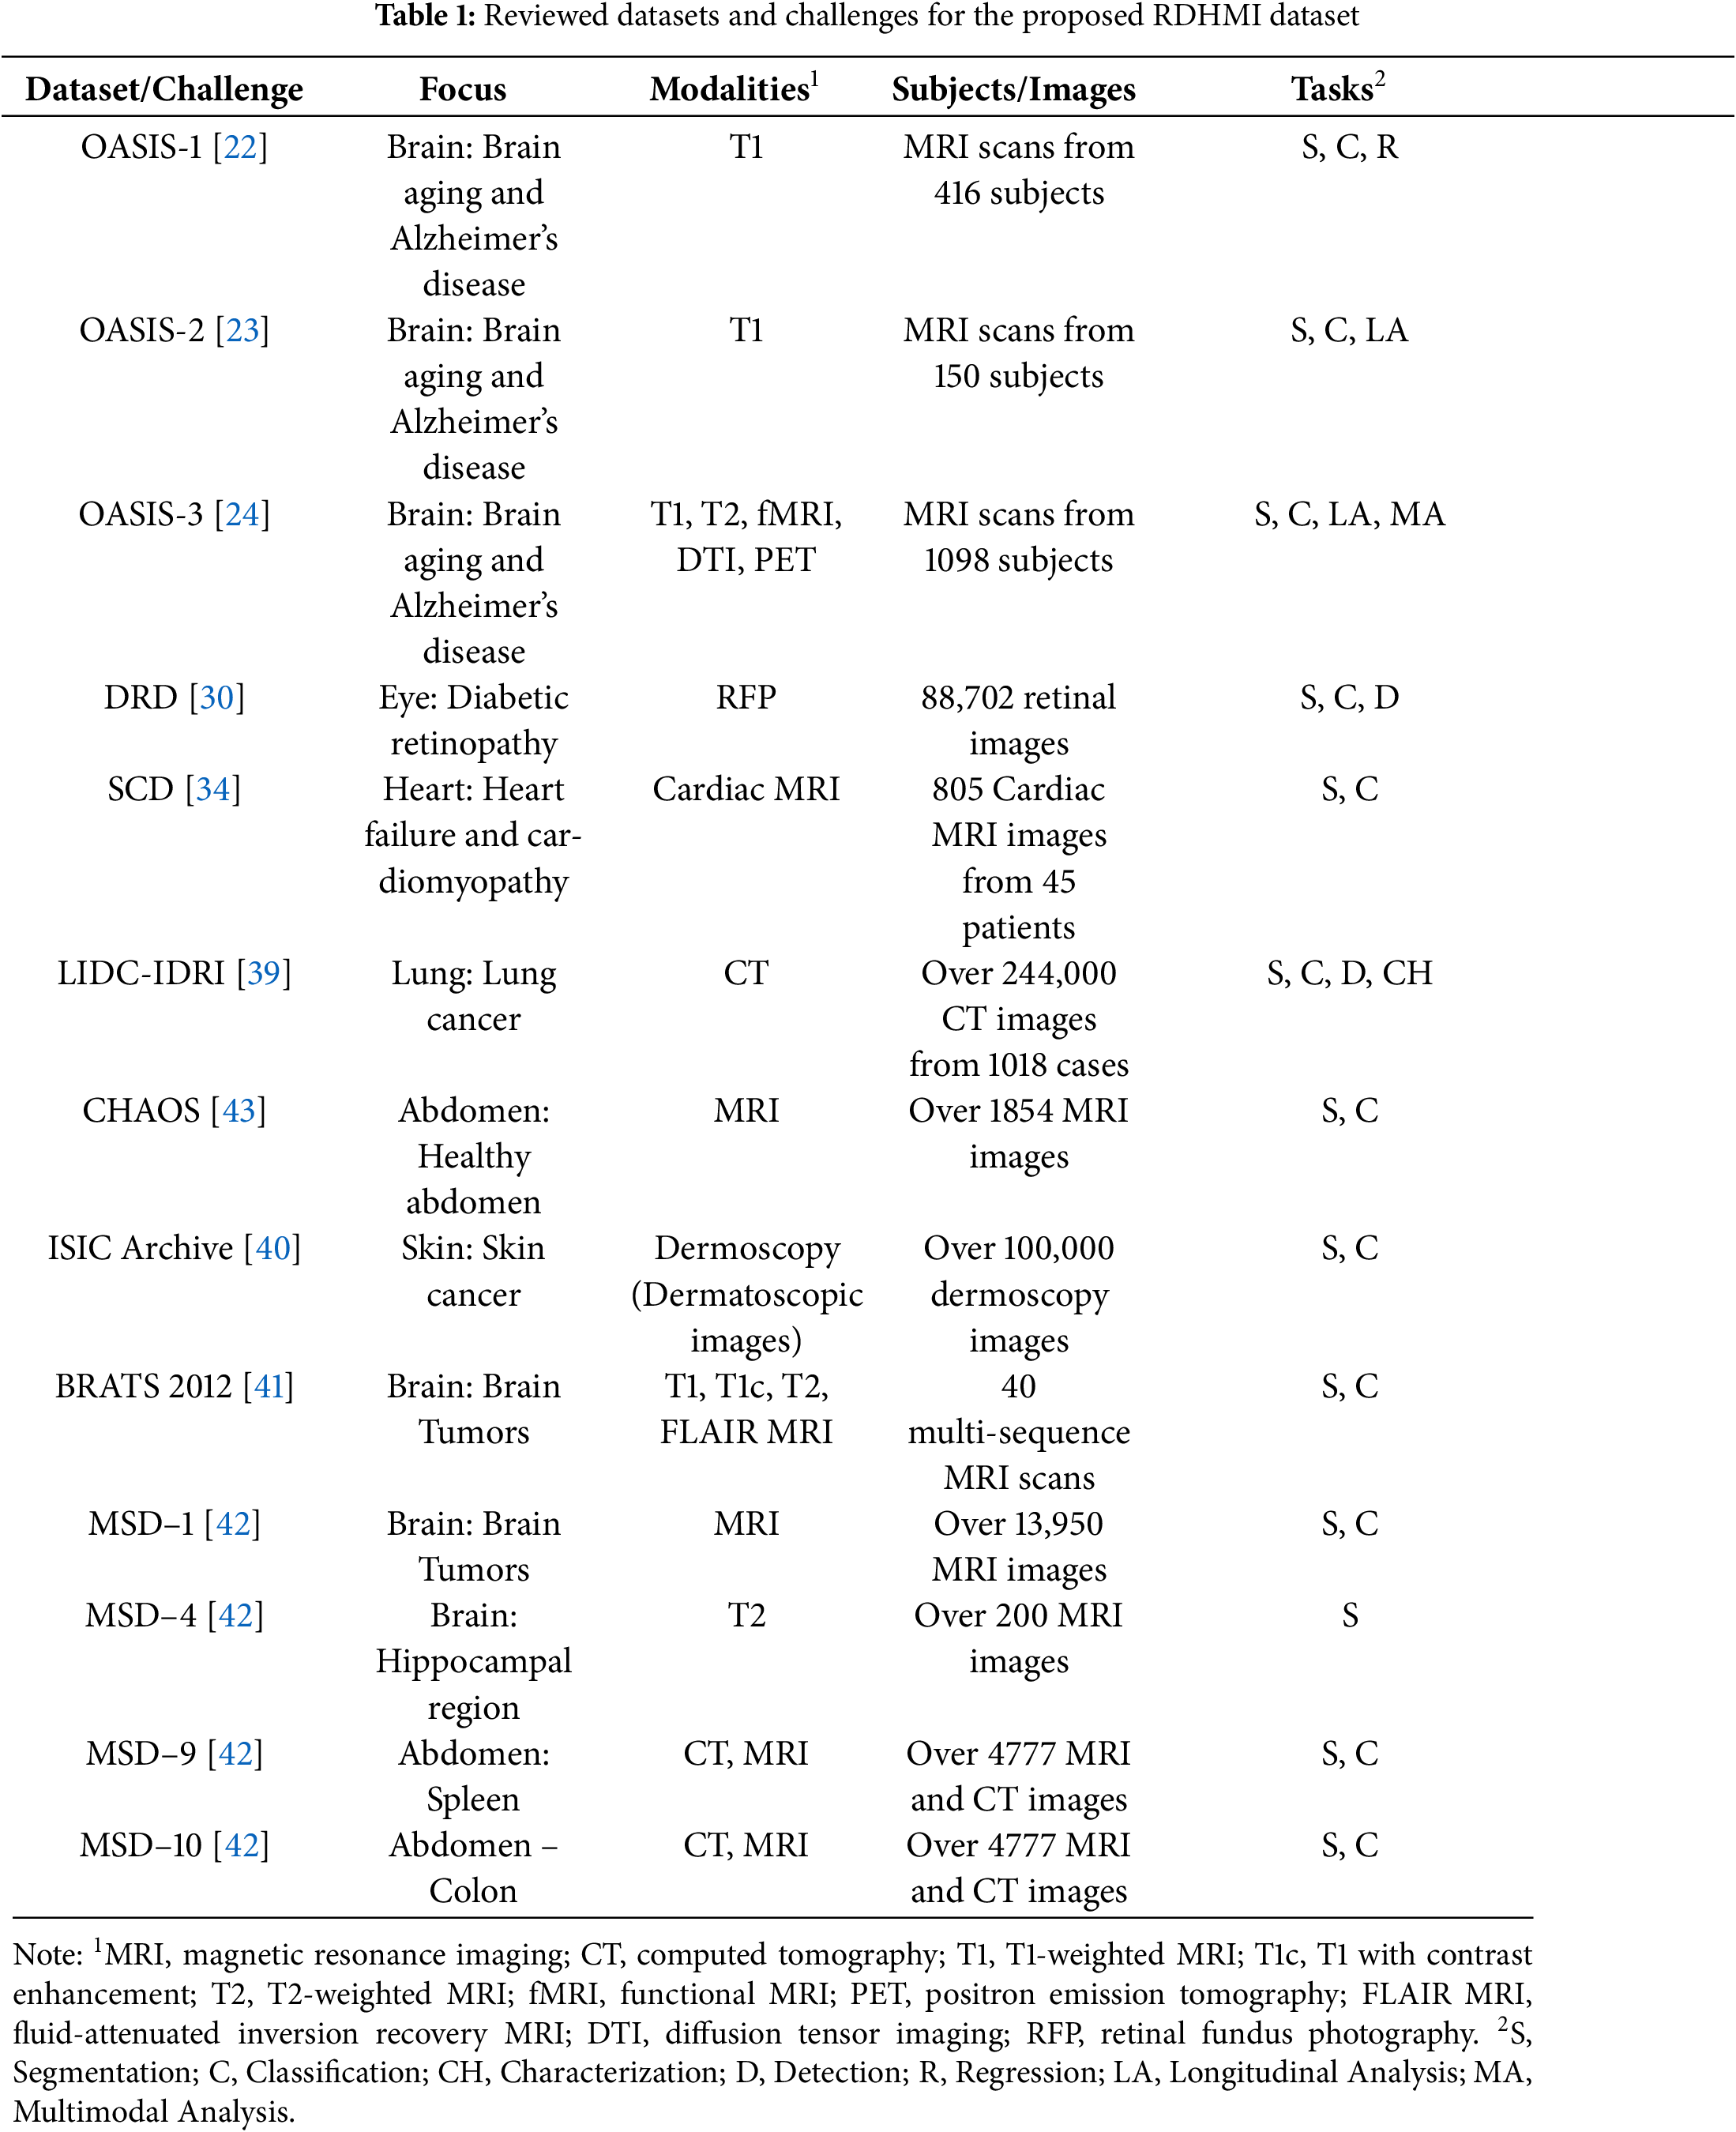
The proposed dataset covers images for diverse diseases, modalities, tasks, and resolutions to achieve vast applicability. The images represent diseases relating to the abdomen (spleen, colon), brain disorders, tumors and lesions (Alzheimer’s disease, brain aging, gliomas, and multiple sclerosis), eye (diabetic retinopathy), heart (heart failure and cardiomyopathy), lung (lung cancer, pulmonary nodules), and skin (angiomas, dermatofibroma, melanoma, nevus). Medical image modalities, including CT, MRI, PET, dermoscopy, and retinal fundus photography, were identified as the main modalities. However, features of each in different forms were explored (e.g., cardiac MRI, diffusion tensor imaging (DTI), fluid-attenuated inversion recovery (FLAIR) MRI, functional MRI (fMRI), T1-weighted MRI, and T2-weighted MRI). The common tasks among the reviewed datasets and challenges were classification, segmentation, detection, and multimodal analysis. The in-plane image resolution ranges from
3.1.3 Pre-Processing, Image Segmentation, and Post-Processing
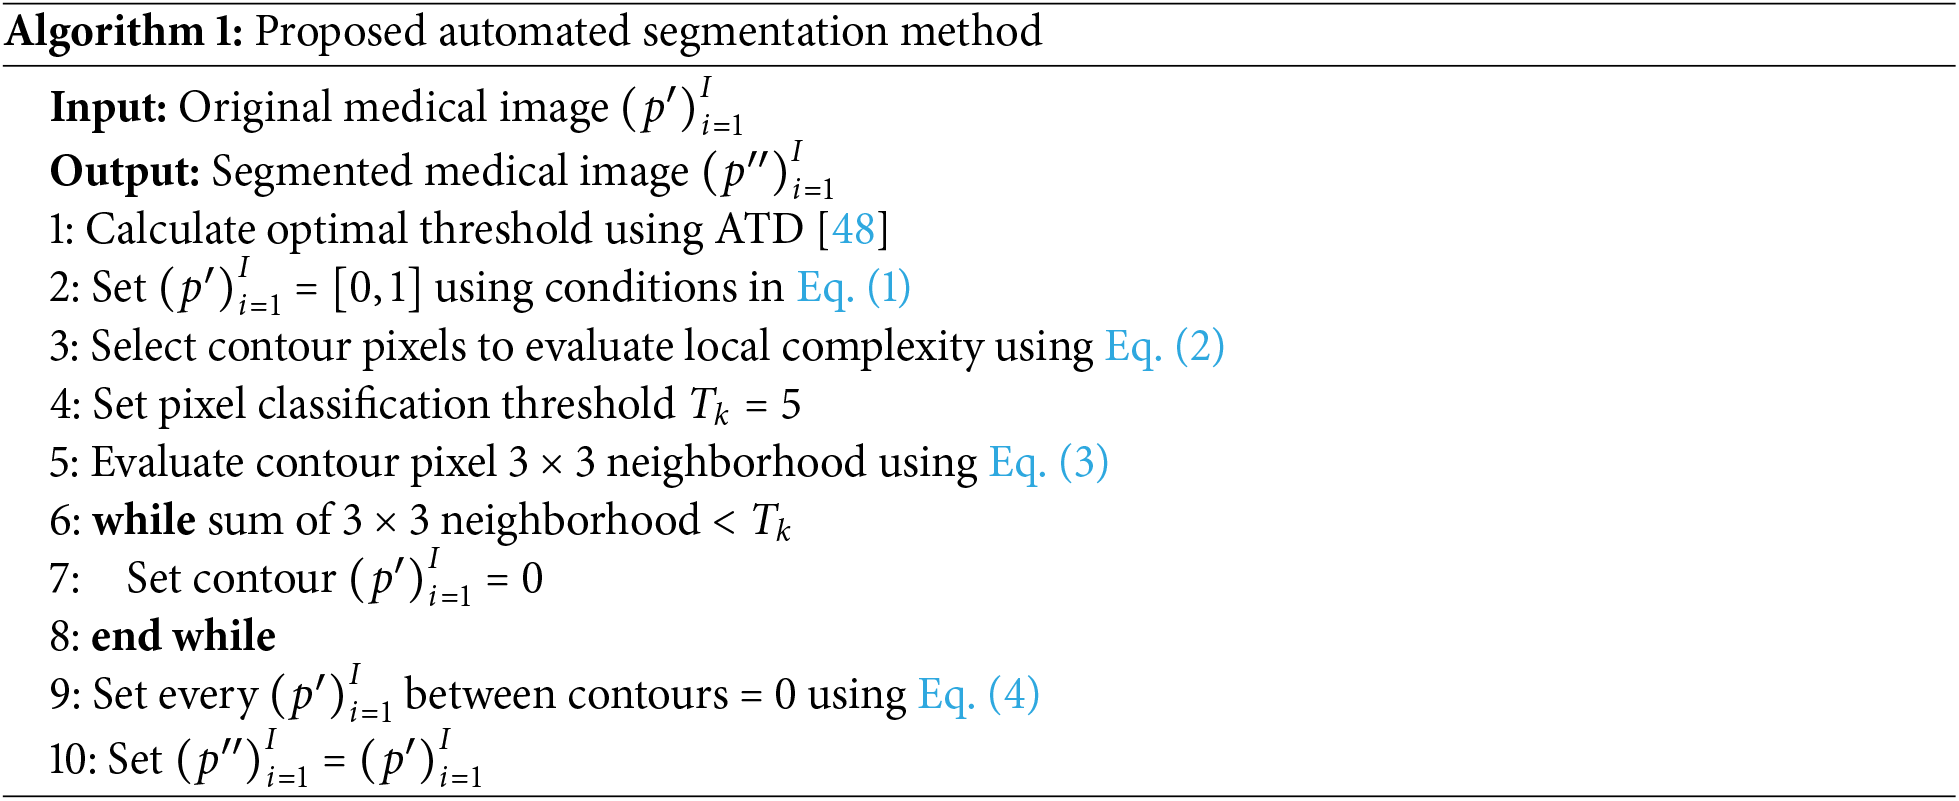
As shown in Fig. 5, the development steps include dataset pre-processing, medical image segmentation, expert analysis and evaluation, and dataset post-processing. In the data pre-processing step, the medical images from the existing medical image datasets were converted from the original NiFTI, DICOM, and HDR modalities to portable network graphics (PNG) image formats. The PNG format was adopted due to its lossless compression feature, transparency, and considerable file size support. The medical images were renamed to slice numbers according to the number of slides in the axial view of the original dataset. The segmentation step comprises a hybrid of automated and manual segmentation approaches. As an initial segmentation step, we perform an improved threshold-based segmentation that uses a
The four main segmentation methods in the RDHMI domain are region-based, threshold-based, support vector-based, and edge-based traditional methods. Deep learning segmentation methods are not prevalent due to the unavailability of domain-specific labels. The threshold-based approach is the most effective among the traditional segmentation methods as it calculates an optimal threshold between the lower and higher grey levels to segment images [46]. Existing works mainly adopt the well-known Otsu threshold segmentation method [47] to select the optimal threshold. Although the Otsu threshold method usually works, it performs poorly in medical images when the focal region has blurred edges. We adopt the adaptable threshold detector (ATD) [48] method to determine the optimal threshold (
where
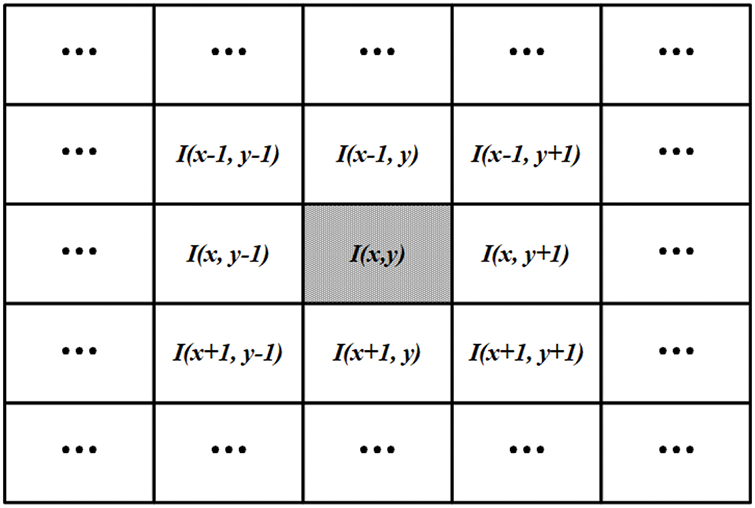
Figure 7: The proposed
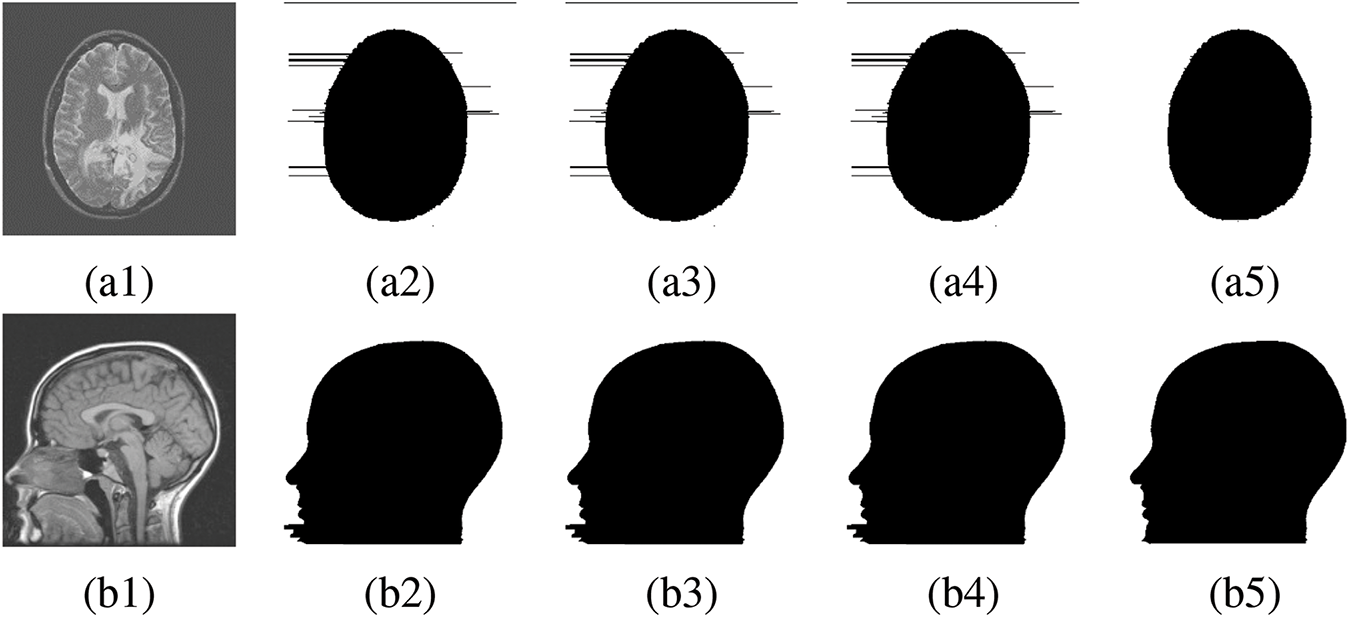
Figure 8: FR and NFR segmentation between existing works and proposed approach. (a1), (b1) Original medical image, (a2), (b2) Segmentation by [46], (a3), (b3) Segmentation by [49], (a4), (b4) Segmentation by [50], (a5), (b5) Segmentation by proposed method
3.2 Proposed Deep-Learning Architecture
The state-of-the-art deep learning architectures discussed in Section 2.2 are primarily for segmenting specific cells, tissues, organs, or multi-class segmentation in literature. Given that they were trained on different datasets and demonstrated effective performance for these particular tasks, directly applying them to the RDHMI domain may suggest poor outcomes. Therefore, we propose a deep-learning architecture trained specifically for semantic segmentation in the RDHMI domain: ResNet-UNet with concatenated spatial and channel squeeze and excitation architecture, which combines the residual learning in residual networks (ResNet), hierarchical feature extraction and skip connections of UNet, and adaptive spatial and channel-wise feature recalibration in SE attention blocks. With UNet as the backbone, we replace the normal convolutions in the contracting path with custom ResNet convolutional blocks of two 3
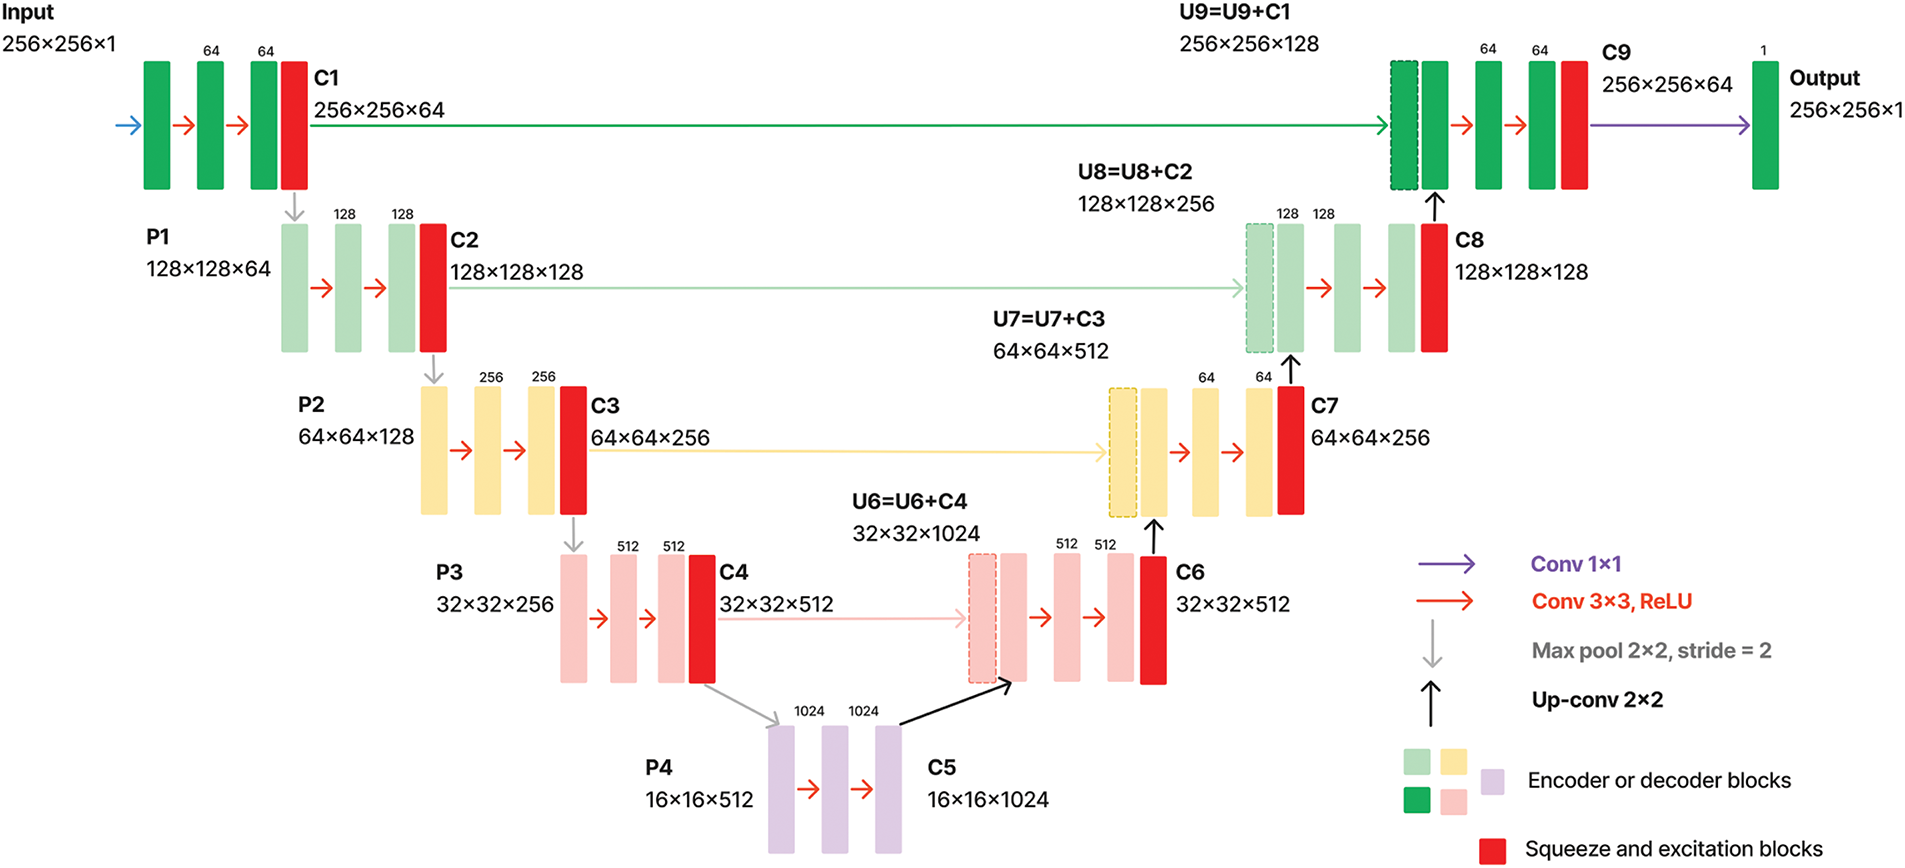
Figure 9: Schematic of proposed architecture
4 Experimentation and Discussions
4.1 Experimental Analysis of Proposed Dataset
In this section, labels generated from the automated segmentation that are classified as accurate labels by expert raters are further evaluated using five segmentation metrics: dice coefficient (dice similarity index), Jaccard index (intersection over union), precision (positive predictive value), recall (sensitivity or true positive rate), and accuracy [51]. We randomly select ten accurate automated labels from each reviewed dataset and challenge them to submit for manual segmentation by medical practitioners to perform the experiments. As mentioned, only inaccurate labels identified in the development stage are reported for manual segmentation. However, manual segmentations were later performed on the randomly selected accurate labels for comparisons. This section is organized as follows:
• We compare the accurate automated and manually segmented labels and evaluate their similarities using the segmentation metrics. Fig. 10 shows samples of medical images with their automated and manually segmented labels, and a box plot representation of experimental results is presented in Fig. 11.
• We discuss the challenges and limitations of the proposed RDHMI dataset.
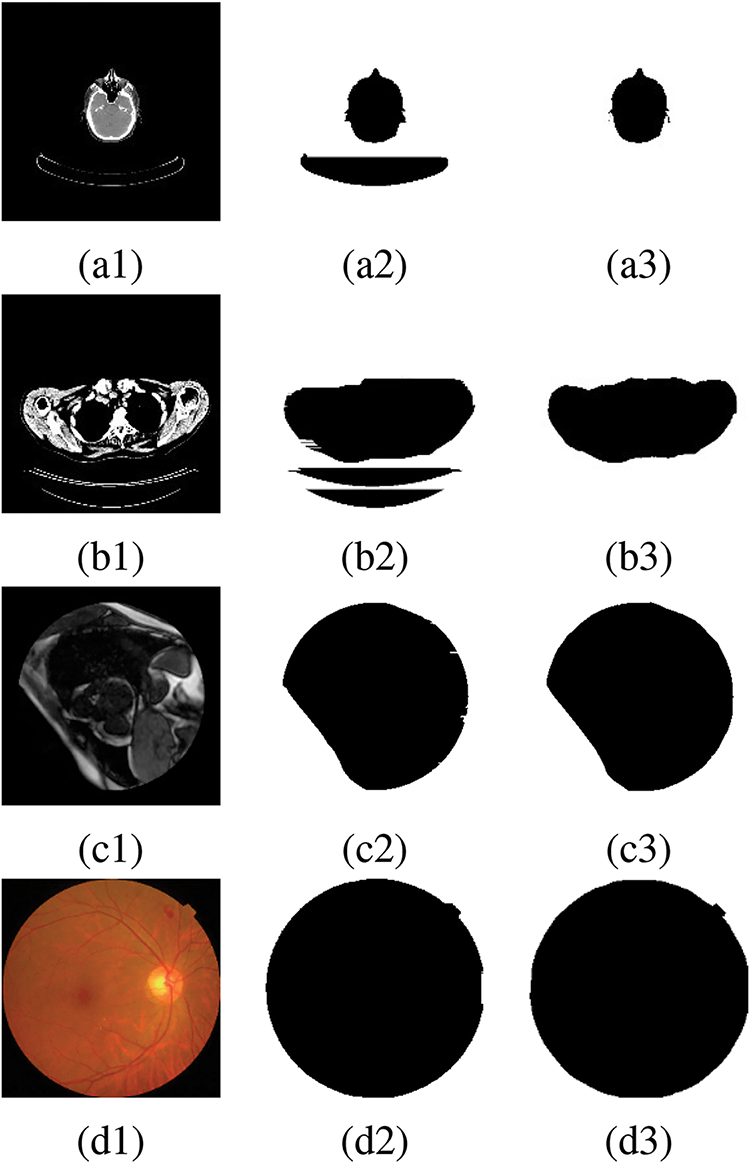
Figure 10: Original medical images with automated and manually segmented labels, (a1), (b1), (c1), (d1) Original medical images, (a2), (b2) Inaccurate automated segmented labels, (c2), (d2) Accurate automated segmented labels, (a3), (b3), (c3), (d3) Manually segmented labels
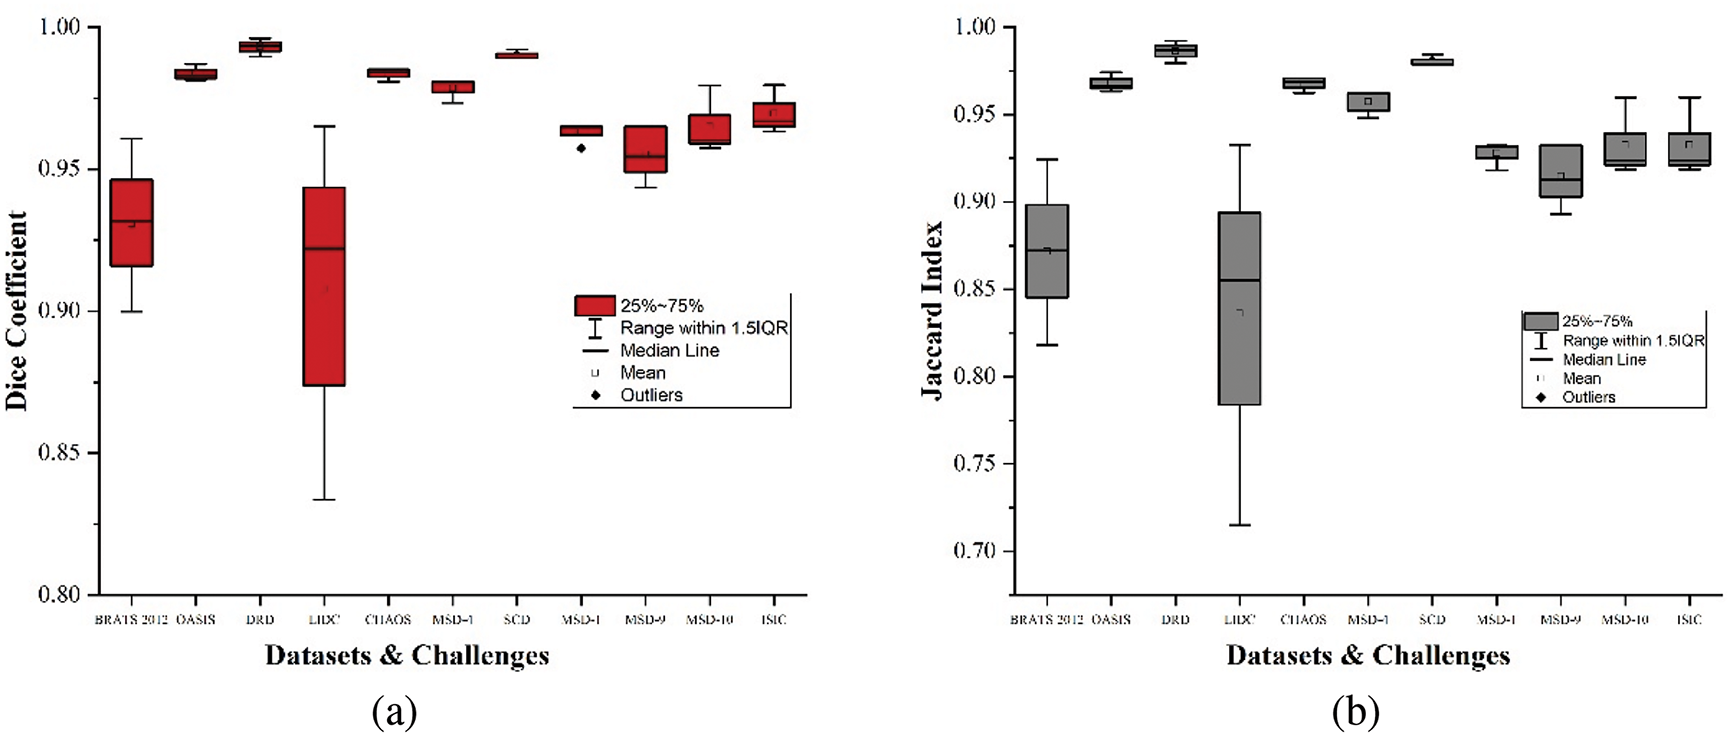
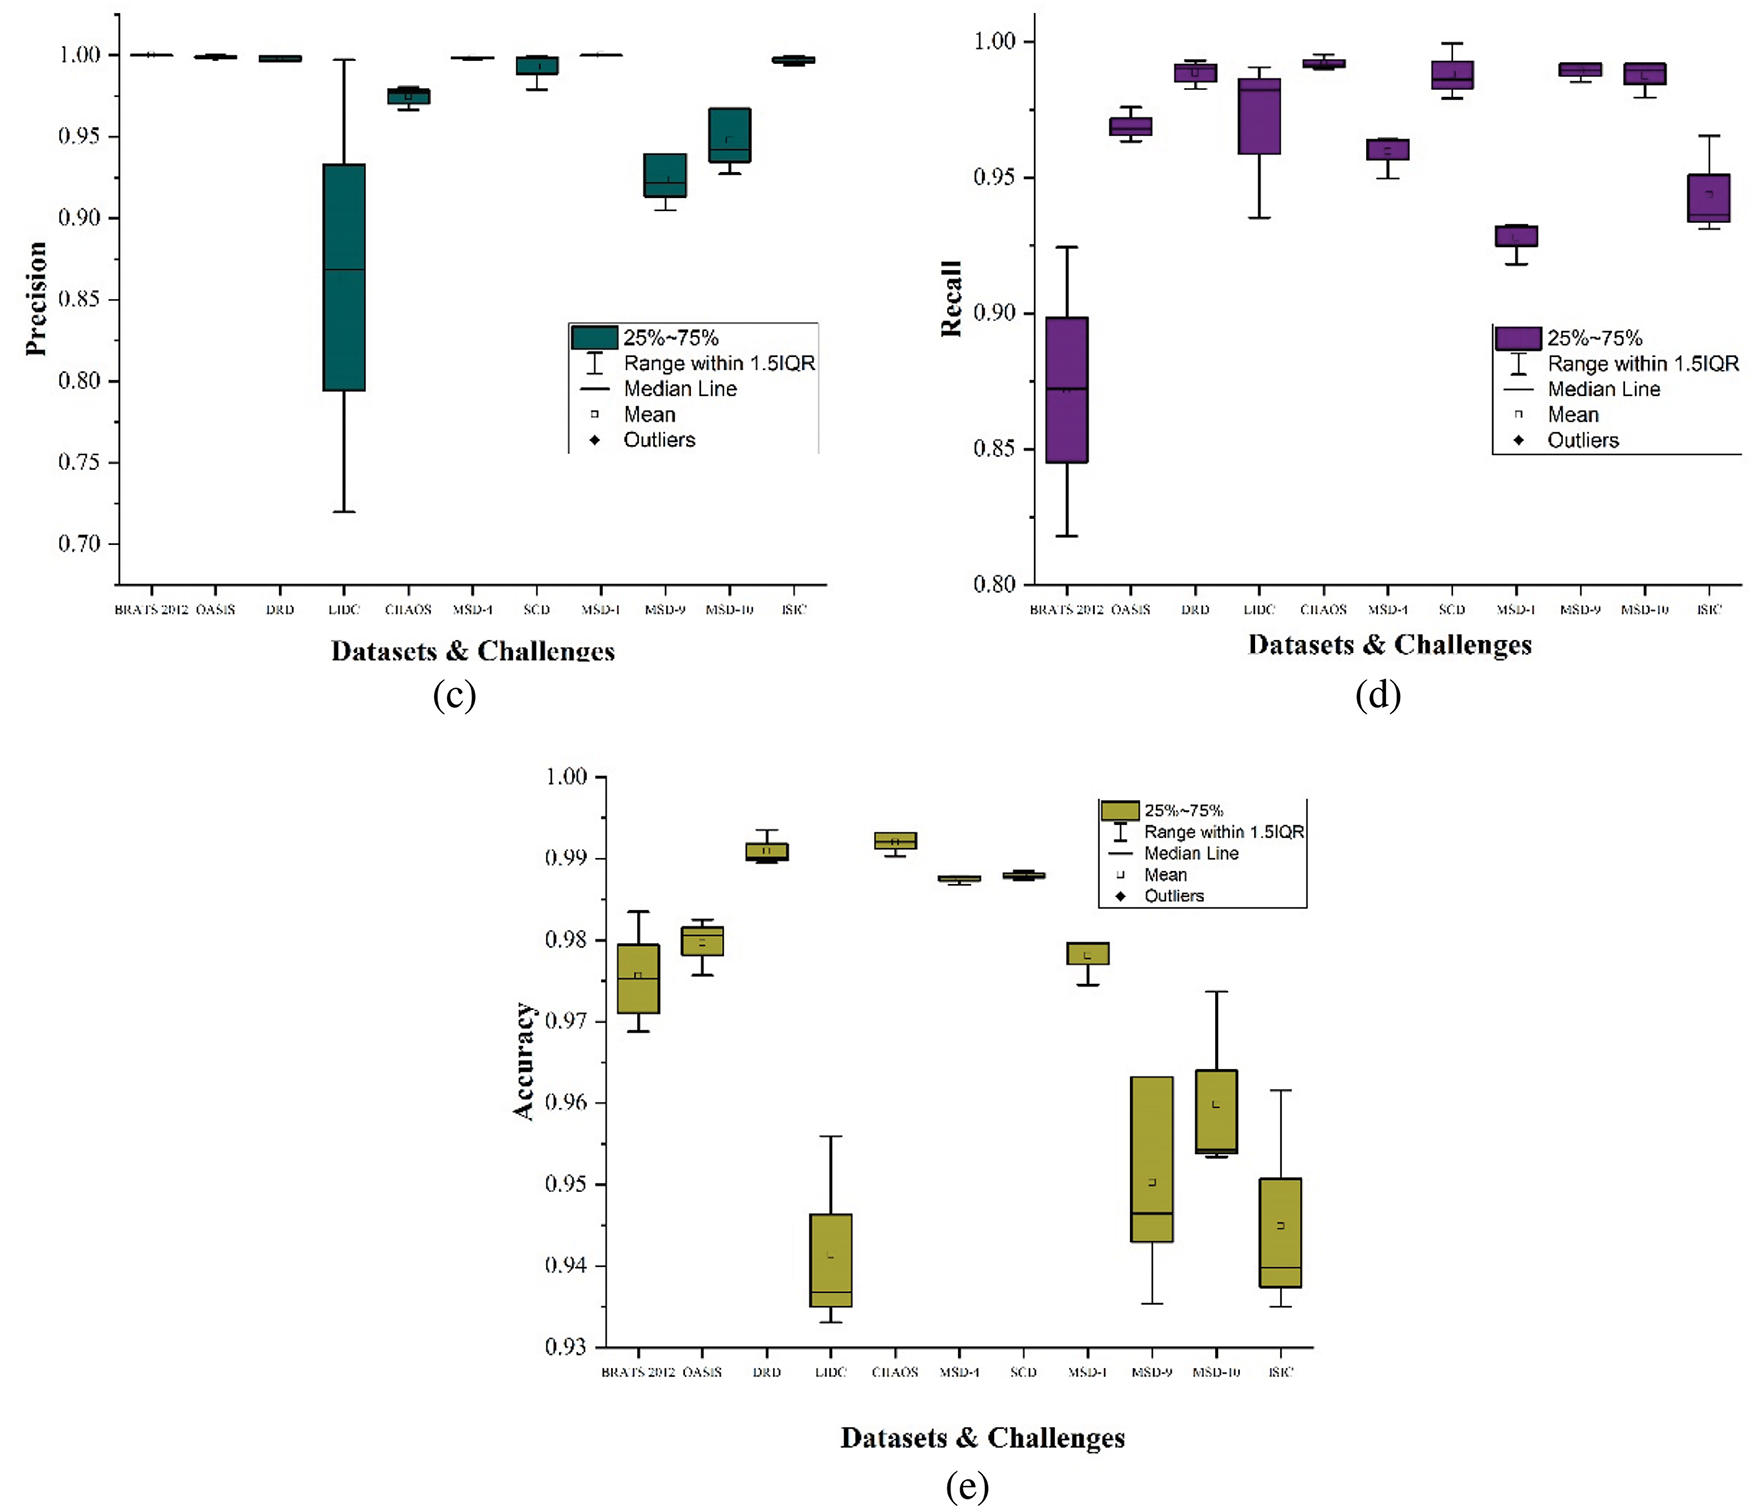
Figure 11: Box plots showing results of segmentation metrics, (a) Dice coefficient, (b) Jaccard index, (c) Precision, (d) Recall, (e) Accuracy
This subsection employs five segmentation assessment metrics to compare the accurate automated segmented labels against the manually segmented labels. We specify the manually segmented labels by medical practitioners as the actual ground truths (gt) while the automated labels remain the predicted labels (pred). Segmentation metrics are vital as they provide quantitative assessments of the delineated regions.
The dice score evaluates the degree of overlap between the pred and gt. Dice score measures their similarities to provide accuracy regarding their overlap in the range between 0 and 1, where 1 indicates perfect similarity. The formula for calculating dice coefficients is presented in Eq. (5).
where
Similar to the dice coefficient, the Jaccard index calculates the overlap between the
where
Precision evaluates the proportion of correctly predicted true positives among the predicted pixels classified as FR. Precision is functional when the cost of predicting false positives (NFR as FR) is high. The calculation for precision is presented in Eq. (7).
where TP and FP refer to the true and false positives, respectively. Precision ranges between 0 and 1, where 1 indicates that all predicted positives (pixels) are true positives. Moreover, high precision indicates a high confidence level in the positive predictions.
Recall evaluates the proportion of correctly predicted true positives among all predicted pixels considering false negatives (unclassified NFR). The recall is crucial when the cost of false negatives is high (i.e., not predicting NFR as NFR). Recall calculates the ability to identify all relevant instances (both FR and NFR). Recall calculation is shown in Eq. (8).
where TP and FN refer to the true positives and false negatives, respectively. Recall ranges between 0 and 1 where 1 indicates that all actual positives (FR) are correctly identified. Higher recall indicates that labels capture the most positive instances.
Accuracy calculates the proportion of correctly predicted observations (i.e., both true positives and true negatives) among all observations. It provides an overall measure of how many instances are correctly segmented. Eq. (9) shows the calculation for accuracy.
where TP and TN refer to the number of true positives and negatives, respectively. FP is the number of false positives, while FN denotes the number of false negatives. Accuracy provides a general measure of the labels from 0 to 1, with 1 indicating that all automated label pixels match the manual labels.
It should be noted that each of these metrics is applied per case and then averaged consistently over all cases. This way, the metrics penalize prediction errors in cases with fewer actual pixels considered FR. Generally, the accurate automated segmented labels maintain an average score above
Conversely, the LIDC dataset shows more variability in dice coefficient, Jaccard index, and precision, generally ranging from
The MSD-1 dataset results for all comparing metrics show a strong and consistent performance with scores tightly clustered around the upper quartiles and maximums of
It should be noted that across all the reviewed datasets and challenges, the evaluation results prove the trustworthiness and accuracy of the automated labels compared to the manually segmented ones, as shown in Fig. 11. Datasets like OASIS, DRD, and SCD show exceptionally high and consistent performance in dice coefficient and Jaccard index, while LIDC and MSD-9 exhibit more variability. The BRATS2012, DRD, OASIS, MSD-4, and MSD-1 show a near-perfect precision, indicating that the pixels classified as FR are consistent with the manual delineation by medical practitioners. The recall scores demonstrate the high performance in identifying true positives. Datasets like OASIS, DRD, CHAOS, SCD, MSD-9, and MSD-10 show high recall scores, effectively detecting true positives with minimal misses across diverse segmentation tasks. The accuracy scores across the reviewed datasets demonstrate that pixels relating to the focal and nonfocal regions are generally accurately classified for near-to-perfect segmentation.
Table 2 shows the average segmentation metrics results of the experiment for each reviewed dataset and challenges. OASIS-1, OASIS-2, and OASIS-3 were calculated and presented as OASIS for the average results in Table 2. We observe that the lowest score obtained by the accurate automated labels in the proposed dataset is above
4.1.2 Challenges and Limitations
The common challenges experienced in developing any medical image dataset were encountered in the development phase. However, we addressed them through quality control to the best of our efforts. The major challenge is data scarcity and acquisition. Unlike non-medical image datasets available on a larger scale, medical image datasets are typically smaller, with extreme acquisition limitations due to ownership by institutions, regulatory barriers, ethical concerns such as patient privacy, and legal issues. We select only public medical image datasets to address data scarcity and acquisition difficulties. Data annotation challenges such as subjectivity and biases in manual segmentation were experienced. However, we implement the hierarchical majority voting scheme initially proposed for the BRATS benchmark [41] to address this challenge (i.e., labels are classified as accurate or inaccurate upon consensus of at least half of the expert raters). There was no dataset imbalance due to the larger representation of pixels in the focal region, unlike specific cells or tissues. The computational cost associated with the automated segmentation was relatively high, demanding higher computational resources to induce scalability. Overcoming these technical, ethical, and logistical difficulties is essential to guarantee the quality of the dataset.
4.2 Experimental Analysis of Proposed Deep-Learning Architecture
4.2.1 Training Setup and Environment
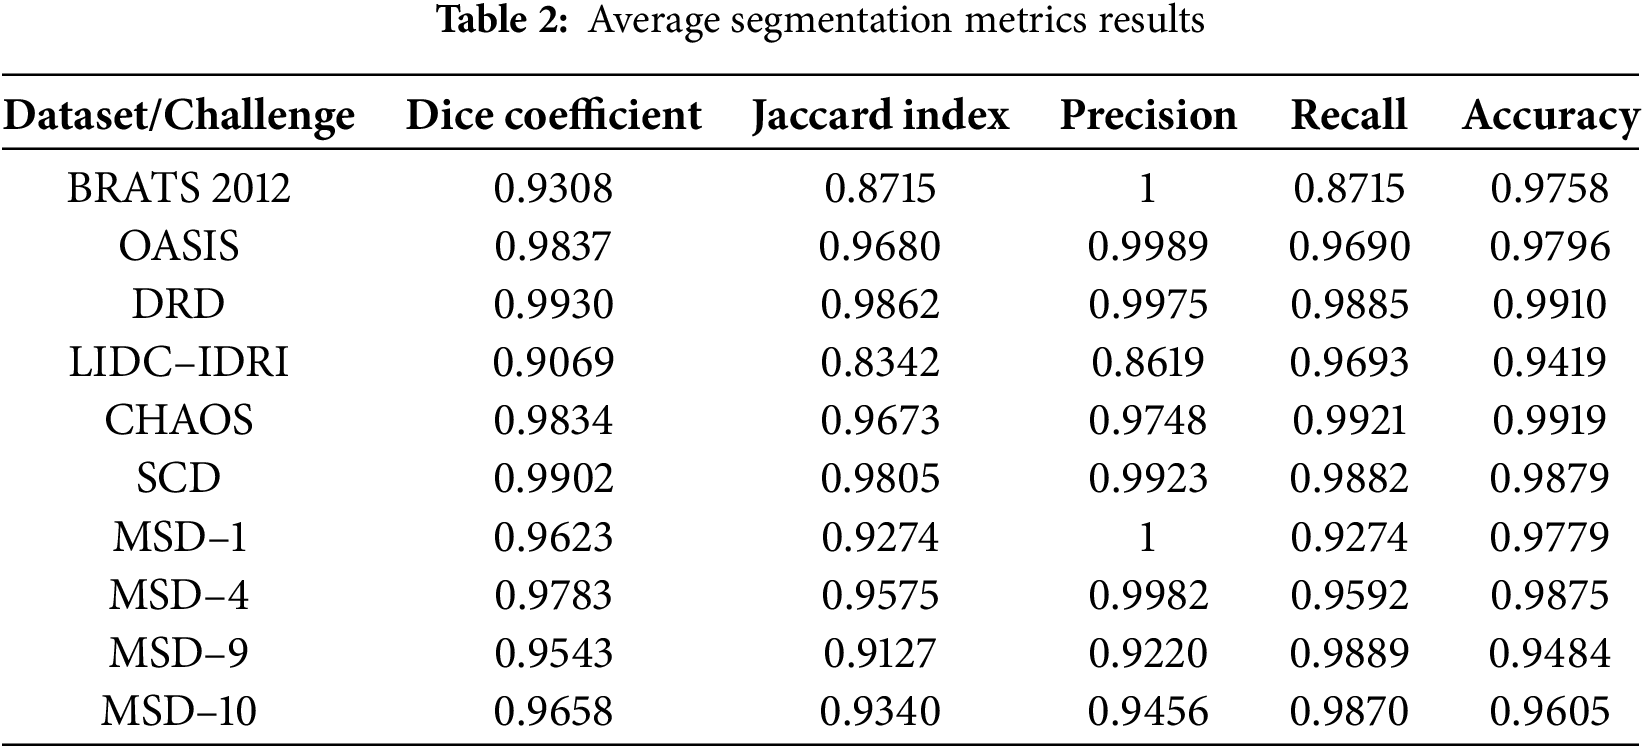
The experiments in this study are conducted in a Python environment using TensorFlow as the primary framework, running on a Windows 10 workstation. The workstation specifications are 16 GB of RAM, an Intel® CoreTM i7-8550U CPU @ 3.00 GHz (8 cores), and a GeForce MX130 GPU with 2048 MB of memory. The training, testing, and validation sets are restricted to 0.7, 0.1, and 0.2 probability distributions, respectively, according to the size of the proposed dataset in Section 3.1 and the available computational resources. After multiple experiments, we establish the hyperparameter values in Table 3 reflect the optimal value for each hyperparameter.
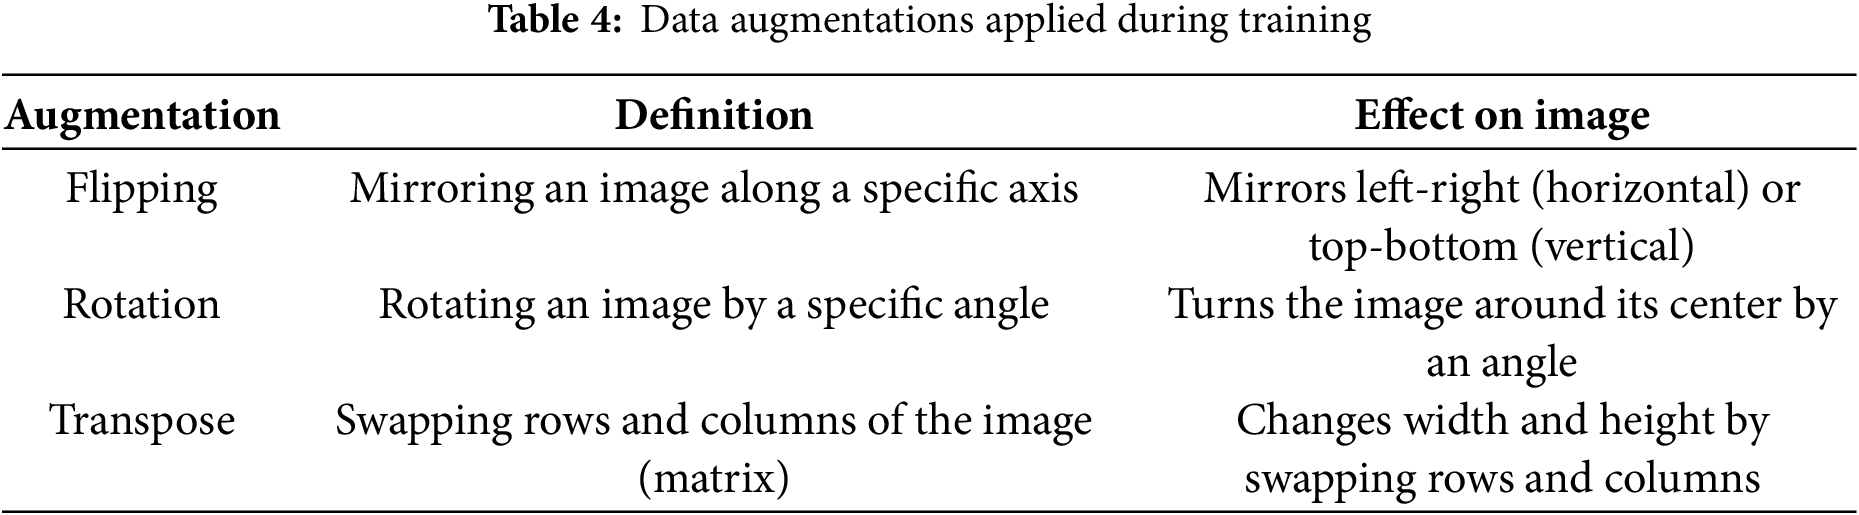
The proposed RDHMI dataset covers medical images of different diseases, modalities, tasks, and resolutions to achieve vast applicability and ensure diversity. However, we perform additional data augmentations during training to enhance robustness, model generalization, and convergence and reduce overfitting. We exclusively use spatial-level augmentations such as flipping, rotation, and transposition with 10% to 30% probability. The data augmentations carried out during experimentation are shown in Table 4.
The experimentation in this subsection aims to implement state-of-the-art deep learning architectures for semantic segmentation in the RDHMI domain, evaluate the performance of the proposed architecture against existing architectures, and validate the proposed RDHMI dataset. The performance assessment metrics discussed in Section 4.1.1 are employed to evaluate the performance of architectures. We select the Jaccard index as the evaluating metric during training because accuracy is not the perfect metric for semantic segmentation. The proposed architecture is compared with UNet, UNet 3+, Attention UNet, and DANet. Table 5 shows the experimental results of each architecture after training at 100 epochs.
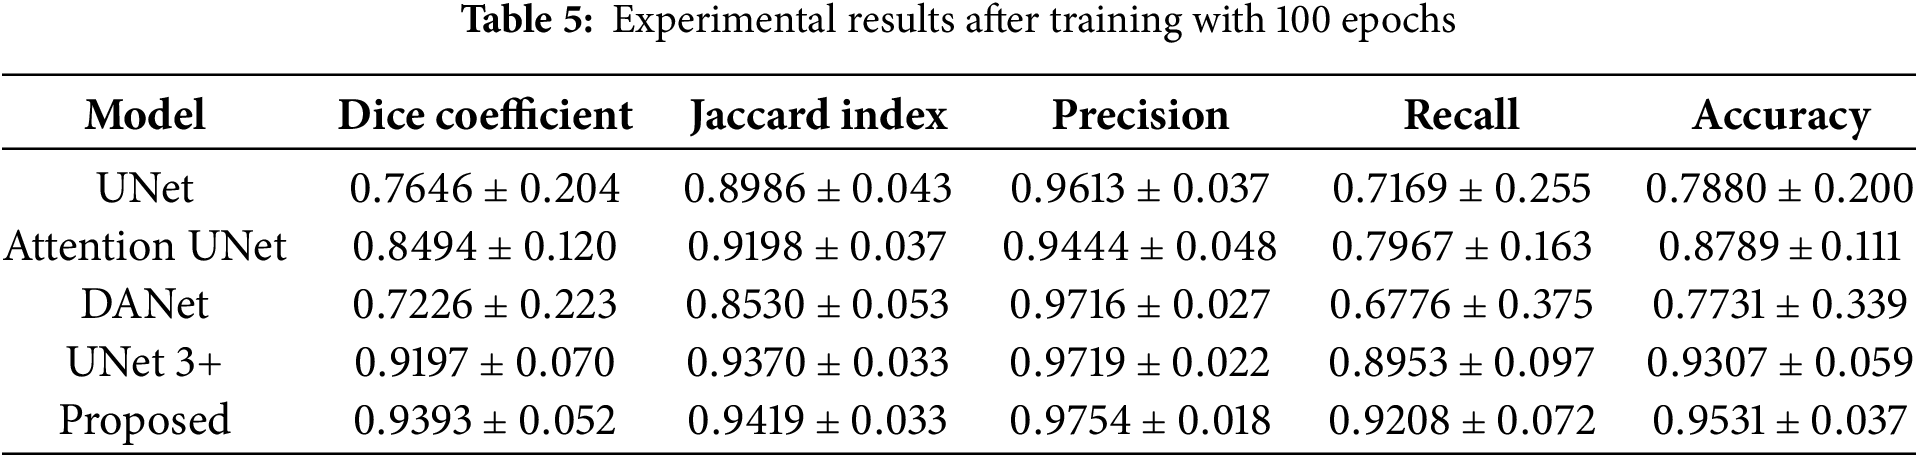
Generally, the proposed ResNet-UNet with concatenated scSE demonstrates superior performance over all the comparing architectures. In a hierarchical order of best-performing architecture, the architectures can be arranged as follows: the proposed ResNet-UNet with concatenated scSE, UNet 3+, Attention UNet, UNet, and DANet. Comparatively, DANet performs the worst among the architectures yet with a precision score of (
Fig. 12 shows the loss and Jaccard index evolution of the proposed ResNet-UNet with concatenated scSE. The training loss starts around
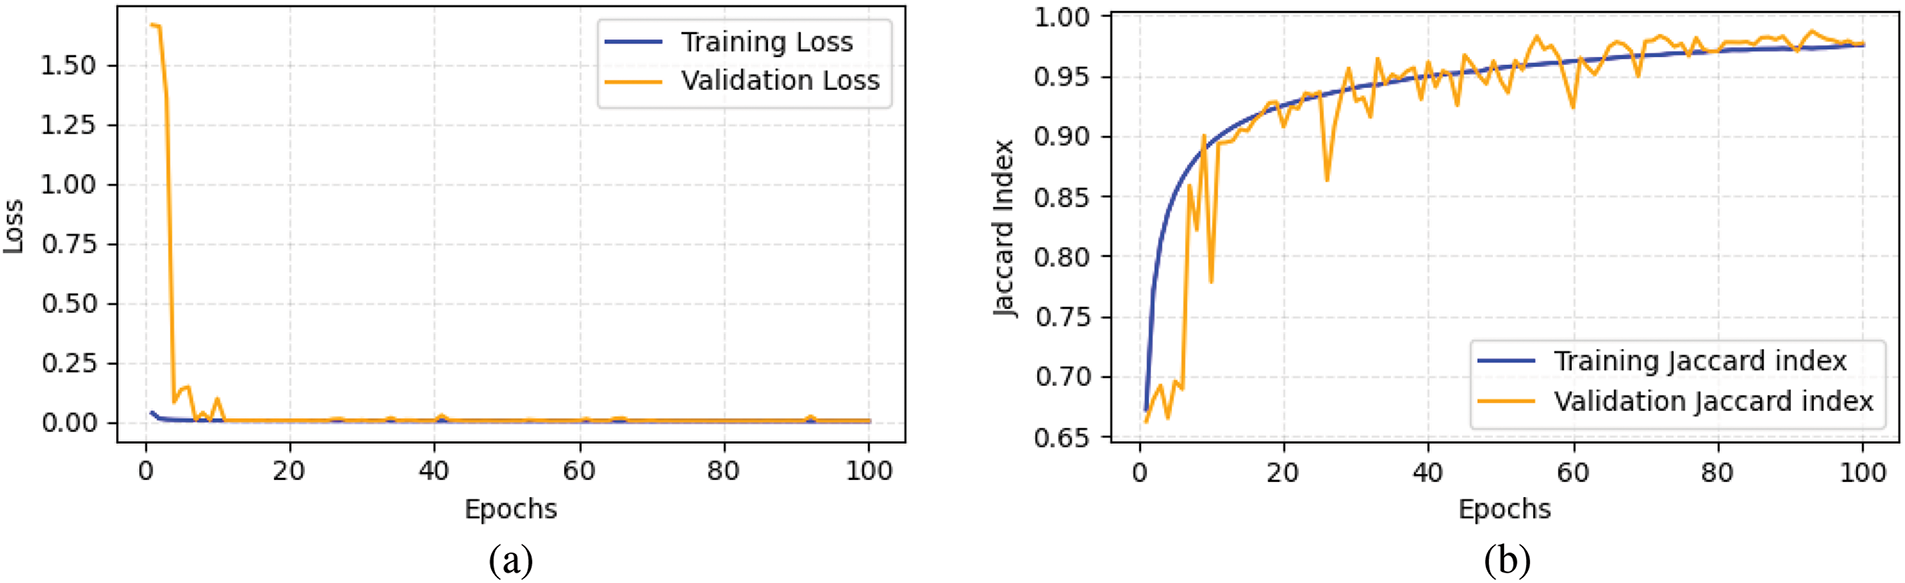
Figure 12: Metric evolution of proposed architecture, (a) Loss, (b) Jaccard index
4.3 Application in RDHMI Domain
In this subsection, we discuss the application of this study in real-life scenarios of embedding electronic patient records (EPR) in medical images. We investigate the impact of inaccurate labeling on the visual quality of medical images during data embedding. The study employs the embedding scheme in our previous reversible data hiding paper [52] to embed a payload size of 50,000 bits into the focal region based on accurate and inaccurate labels. Fig. 13 presents the embedded medical images with their respective labels. We observe the embedded image Fig. 13a3 generated based on the inaccurate label Fig. 13a2 is degraded with distortions in the NFR whereas, the embedded image Fig. 13b3 based on the accurate label Fig. 13b2 has better visual quality without any distortions. A detailed examination of the original medical image shows no visual irregularities in Fig. 13a1. However, due to the inaccurate label Fig. 13a2 used for data embedding, Fig. 13a3 contains distortions that degrade its visual perception. The critical nature of medical images requires eliminating any distortion during data embedding to preserve visual quality. This objective can be accomplished by ensuring accurate labeling of medical images.
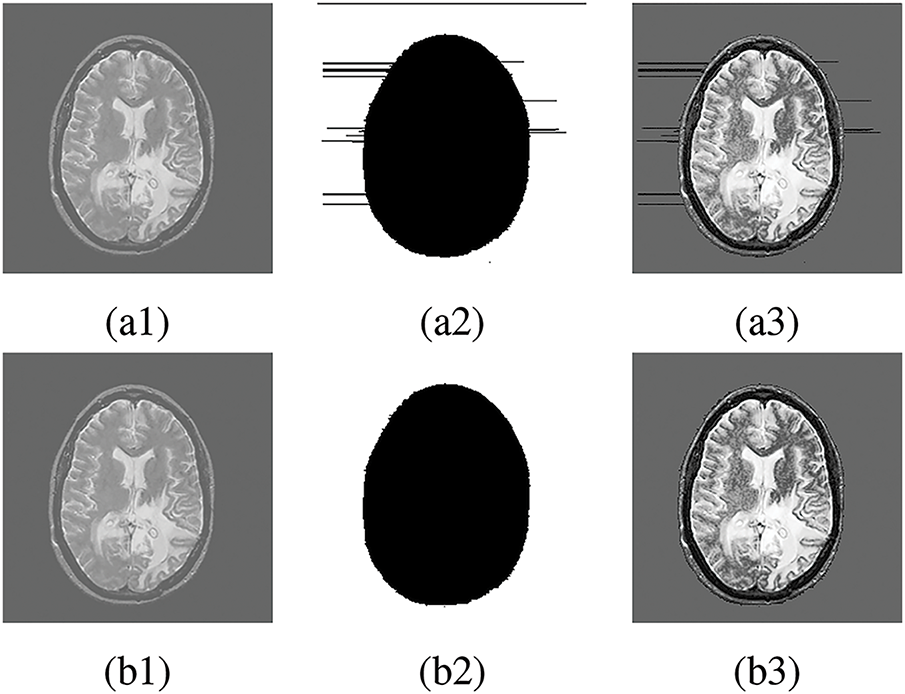
Figure 13: Data embedding in FR. (a1), (b1) Original medical image, (a2) Inaccurate label, (b2) Accurate label, (a3) Embedded image using inaccurate label, (b3) Embedded image using accurate label
This study presents a collection of RDHMI domain-specific labels for the first time to facilitate implementing deep learning segmentation architectures in the RDHMI domain. The data curation process comprised data collection, data pre-preprocessing, medical image segmentation, expert analysis and evaluation, and dataset post-processing. A hybrid automated and manual segmentation approach is proposed to segment medical images into focal and nonfocal regions accurately. The automated segmentation method analyzes the 3
Acknowledgement: The authors would like to express their gratitude to the editors and anonymous reviewers for their insightful suggestions.
Funding Statement: This work is supported by the National Natural Science Foundation of China (Grant Nos. 62072250, 61772281, 61702235, U1636117, U1804263, 62172435, 61872203 and 61802212), the Zhongyuan Science and Technology Innovation Leading Talent Project of China (Grant No. 214200510019), the Suqian Municipal Science and Technology Plan Project in 2020 (S202015), the Plan for Scientific Talent of Henan Province (Grant No. 2018JR0018), the Opening Project of Guangdong Provincial Key Laboratory of Information Security Technology (Grant No. 2020B1212060078), and the Priority Academic Program Development of Jiangsu Higher Education Institutions (PAPD) Fund.
Author Contributions: Lord Amoah: Conceptualization, Methodology, Software, Data curation, Visualization, Writing—original draft, Writing—review & editing. Jinwei Wang: Funding acquisition, Resources, Project administration, Supervision. Bernard-Marie Onzo: Conceptualization, Writing—review & editing. All authors reviewed the results and approved the final version of the manuscript.
Availability of Data and Materials: The dataset information of this study is released under the following URL: https://www.kaggle.com/lordamoah/datasets (accessed on 31 March 2025).
Ethics Approval: This study was conducted using existing public medical image datasets with all references cited.
Conflicts of Interest: The authors state that they have no known competing financial interests or personal ties that could have influenced the research presented in this paper.
References
1. Li J, Zhu G, Hua C, Feng M, Bennamoun B, Li P. A systematic collection of medical image datasets for deep learning. ACM Comput Surv. 2023;56(5):1–51. [Google Scholar]
2. Li J, Li X, Yang B, Sun X. Segmentation-based image copy-move forgery detection scheme. IEEE Trans Inform Forensic Secur. 2014;10(3):507–18. [Google Scholar]
3. Zheng Y, Jeon B, Xu D, Wu Q, Zhang H. Image segmentation by generalized hierarchical fuzzy C-means algorithm. J Intell Fuzzy Syst. 2015;28(2):961–73. [Google Scholar]
4. Gu B, Sheng VS. A robust regularization path algorithm for
5. Li L, Yao J, Tu J, Lu X, Li K, Liu Y. Edge-based split-and-merge superpixel segmentation. In: 2015 IEEE International Conference on Information and Automation; Lijiang, China: IEEE; 2015. p. 970–5. [Google Scholar]
6. Gao G, Zhang H, Xia Z, Luo X, Shi YQ. Reversible data hiding-based contrast enhancement with multi-group stretching for ROI of medical image. IEEE Trans Multimed. 2023;26:3909–23. [Google Scholar]
7. Huang H, Lin L, Tong R, Hu H, Zhang Q, Iwamoto Y. UNet 3+: a full-scale connected unet for medical image segmentation. In: ICASSP 2020-2020 IEEE International Conference on Acoustics, Speech and Signal Processing (ICASSP). Barcelona, Spain:IEEE; 2020. p. 1055–9. [Google Scholar]
8. Todorov MI, Paetzold JC, Schoppe O, Tetteh G, Shit S, Efremov V. Machine learning analysis of whole mouse brain vasculature. Nat Methods. 2020;17(4):442–9. doi:10.1038/s41592-020-0792-1. [Google Scholar] [PubMed] [CrossRef]
9. Shao J, Chen S, Zhou J, Zhu H, Wang Z, Brown M. Application of U-Net and optimized clustering in medical image segmentation: a review. Comput Model Eng Sci. 2023;136(3):2173–219. doi:10.32604/cmes.2023.025499. [Google Scholar] [CrossRef]
10. Jian M, Wu R, Fu L, Yang C. Dual-branch-UNnet: a dual-branch convolutional neural network for medical image segmentation. Comput Model Eng Sci. 2023;137(1):705–16. doi:10.32604/cmes.2023.027425. [Google Scholar] [CrossRef]
11. Amrit P, Singh K, Baranwal N, Singh A, Singh J, Zhou H. Deep learning-based segmentation for medical data hiding with Galois field. Neural Comput Appl. 2023.p. 1–16. [Google Scholar]
12. Ronneberger O, Fischer P, Brox T. U-net: convolutional networks for biomedical image segmentation. In: Medical Image Computing and Computer-Assisted Intervention—MICCAI 2015: 18th International Conference; 2015 Oct 5–9; Munich, Germany: Springer. p. 234–41. [Google Scholar]
13. He K, Zhang X, Ren S, Sun J. Deep residual learning for image recognition. In: 2016 computer vision and pattern recognition. Las Vegas, NV, USA; 2016. p. 770–8. [Google Scholar]
14. Ahmed M. Medical image segmentation using attention-based deep neural networks. 2020. [cited 2025 Mar 31]. Available from: https://www.diva-portal.org/smash/get/diva2:1477227/FULLTEXT01.pdf. [Google Scholar]
15. Laal M. Innovation process in medical imaging. Procedia-Soc Behav Sci. 2013;81:60–4. doi:10.1016/j.sbspro.2013.06.388. [Google Scholar] [CrossRef]
16. Aisen PS, Petersen RC, Donohue M, Weiner MW, Initiative ADN. Alzheimer’s disease neuroimaging initiative 2 clinical core: progress and plans. Alzheimer’s Dement. 2015;11(7):734–9. doi:10.1016/j.jalz.2015.05.005. [Google Scholar] [CrossRef]
17. Ivantsits M, Goubergrits L, Kuhnigk JM, Huellebrand M, Brüning J, Kossen T. Cerebral aneurysm detection and analysis challenge 2020 (CADA). In: Cerebral Aneurysm Detection and Analysis: First Challenge, CADA 2020; 2020 Oct 8; Lima, Peru: Springer; 2021. p. 3–17. [Google Scholar]
18. Maier O, Menze BH, Von der Gablentz J, Häni L, Heinrich MP, Liebrand M. ISLES 2015—a public evaluation benchmark for ischemic stroke lesion segmentation from multispectral MRI. Med Image Anal. 2017;35:250–69. doi:10.1016/j.media.2016.07.009. [Google Scholar] [PubMed] [CrossRef]
19. Akkus Z, Ali I, Sedlář J, Agrawal JP, Parney IF, Giannini C. Predicting deletion of chromosomal arms 1p/19q in low-grade gliomas from MR images using machine intelligence. J Digital Imaging. 2017;30:469–76. doi:10.1007/s10278-017-9984-3. [Google Scholar] [PubMed] [CrossRef]
20. Hssayeni MD, Croock MS, Salman AD, Al-Khafaji HF, Yahya ZA, Ghoraani B. Intracranial hemorrhage segmentation using a deep convolutional model. Data. 2020;5(1):14. doi:10.3390/data5010014. [Google Scholar] [CrossRef]
21. Commowick O, Istace A, Kain M, Laurent B, Leray F, Simon M. Objective evaluation of multiple sclerosis lesion segmentation using a data management and processing infrastructure. Sci Rep. 2018;8(1):13650. doi:10.1038/s41598-018-31911-7. [Google Scholar] [CrossRef]
22. Marcus DS, Fotenos AF, Csernansky JG, Morris JC, Buckner RL. Open access series of imaging studies: longitudinal MRI data in nondemented and demented older adults. J Cognitive Neurosci. 2010;22(12):2677–84. doi:10.1162/jocn.2009.21407. [Google Scholar] [PubMed] [CrossRef]
23. Marcus DS, Wang TH, Parker J, Csernansky JG, Morris JC, Buckner RL. Open Access Series of Imaging Studies (OASIScross-sectional MRI data in young, middle aged, nondemented, and demented older adults. J Cognitive Neurosci. 2007;19(9):1498–507. doi:10.1162/jocn.2007.19.9.1498. [Google Scholar] [CrossRef]
24. LaMontagne PJ, Benzinger TL, Morris JC, Keefe S, Hornbeck R, Xiong C. OASIS-3: longitudinal neuroimaging, clinical, and cognitive dataset for normal aging and Alzheimer disease. medRxiv. 2019. doi: 10.1101/2019.12.13.19014902. [Google Scholar] [CrossRef]
25. Fu H, Li F, Sun X, Cao X, Liao J, Orlando JI. Age challenge: angle closure glaucoma evaluation in anterior segment optical coherence tomography. Med Image Anal. 2020;66:101798. doi:10.1016/j.media.2020.101798. [Google Scholar] [CrossRef]
26. Bogunović H, Venhuizen F, Klimscha S, Apostolopoulos S, Bab-Hadiashar A, Bagci U. RETOUCH: the retinal OCT fluid detection and segmentation benchmark and challenge. IEEE Trans Med Imaging. 2019;38(8):1858–74. doi:10.1109/TMI.2019.2901398. [Google Scholar] [PubMed] [CrossRef]
27. Grammatikopoulou M, Flouty E, Kadkhodamohammadi A, Quellec G, Chow A, Nehme J. CaDIS: cataract dataset for image segmentation. arXiv:1906.11586. 2019. [Google Scholar]
28. Orlando JI, Fu H, Breda JB, Van Keer K, Bathula DR, Diaz-Pinto A. Refuge challenge: a unified framework for evaluating automated methods for glaucoma assessment from fundus photographs. Med Image Anal. 2020;59:101570. doi:10.1016/j.media.2019.101570. [Google Scholar] [CrossRef]
29. Quellec G, Lamard M, Conze PH, Massin P, Cochener B. Automatic detection of rare pathologies in fundus photographs using few-shot learning. Med Image Anal. 2020;61:101660. doi:10.1016/j.media.2020.101660. [Google Scholar] [CrossRef]
30. Sudha V, Priyanka K, Kannathal TS, Monisha S. Diabetic retinopathy detection. Int J Eng Adv Technol. 2020;9(4):1022–6. doi:10.35940/ijeat.D7786.049420. [Google Scholar] [CrossRef]
31. Johnson AE, Pollard TJ, Shen L, Lehman LWH, Feng M, Ghassemi M. MIMIC-III, a freely accessible critical care database. Sci Data. 2016;3(1):1–9. doi:10.1038/sdata.2016.35. [Google Scholar] [CrossRef]
32. Clifford GD, Liu C, Moody B, Li-wei HL, Silva I, Li Q. AF classification from a short single lead ECG recording: the PhysioNet/computing in cardiology challenge 2017. In: 2017 Computing in Cardiology (CinC); IEEE; 2017. p. 1–4. [Google Scholar]
33. Leclerc S, Smistad E, Pedrosa J, Østvik A, Cervenansky F, Espinosa F. Deep learning for segmentation using an open large-scale dataset in 2D echocardiography. IEEE Trans Med Imaging. 2019;38(9):2198–210. doi:10.1109/TMI.2019.2900516. [Google Scholar] [PubMed] [CrossRef]
34. Radau P, Lu Y, Connelly K, Paul G, Dick AJ, Wright GA. Evaluation framework for algorithms segmenting short axis cardiac MRI. MIDAS J. 2009. [Google Scholar]
35. Woodruff PG, Modrek B, Choy DF, Jia G, Abbas AR, Ellwanger A. T-helper type 2-driven inflammation defines major subphenotypes of asthma. Am J Respir Crit Care Med. 2009;180(5):388–95. doi:10.1164/rccm.200903-0392OC. [Google Scholar] [CrossRef]
36. Shih G, Wu CC, Halabi SS, Kohli MD, Prevedello LM, Cook TS. Augmenting the national institutes of health chest radiograph dataset with expert annotations of possible pneumonia. Radiol: Artif Intell. 2019;1(1):e180041. doi:10.1148/ryai.2019180041. [Google Scholar] [PubMed] [CrossRef]
37. Setio AAA, Traverso A, De Bel T, Berens MS, Van Den Bogaard C, Cerello P. Validation, comparison, and combination of algorithms for automatic detection of pulmonary nodules in computed tomography images: the LUNA16 challenge. Med Image Anal. 2017;42:1–13. doi:10.1016/j.media.2017.06.015. [Google Scholar] [CrossRef]
38. Irvin J, Rajpurkar P, Ko M, Yu Y, Ciurea-Ilcus S, Chute C. Chexpert: a large chest radiograph dataset with uncertainty labels and expert comparison. Proc AAAI Conf Artif Intell. 2019;33:590–7. doi:10.1609/aaai.v33i01.3301590. [Google Scholar] [CrossRef]
39. Armato IIISG, McLennan G, Bidaut L, McNitt-Gray MF, Meyer CR, Reeves AP. The lung image database consortium (LIDC) and image database resource initiative (IDRIa completed reference database of lung nodules on CT scans. Med Phys. 2011;38(2):915–31. doi:10.1118/1.3528204. [Google Scholar] [PubMed] [CrossRef]
40. Codella N, Rotemberg V, Tschandl P, Celebi ME, Dusza S, Gutman D. Skin lesion analysis toward melanoma detection 2018: a challenge hosted by the international skin imaging collaboration (ISIC). arXiv:1902.03368. 2019. [Google Scholar]
41. Menze BH, Jakab A, Bauer S, Kalpathy-Cramer J, Farahani K, Kirby J. The multimodal brain tumor image segmentation benchmark (BRATS). IEEE Trans Med Imaging. 2014;34(10):1993–2024. doi:10.1109/TMI.2014.2377694. [Google Scholar] [CrossRef]
42. Antonelli M, Reinke A, Bakas S, Farahani K, Kopp-Schneider A, Landman BA. The medical segmentation decathlon. Nat Commun. 2022;13(1):4128. doi:10.1038/s41467-022-30695-9. [Google Scholar] [CrossRef]
43. Kavur AE, Gezer NS, Barış M, Aslan S, Conze PH, Groza V. CHAOS challenge-combined (CT-MR) healthy abdominal organ segmentation. Med Image Anal. 2021;69:101950. doi:10.1016/j.media.2020.101950. [Google Scholar] [PubMed] [CrossRef]
44. Oktay O, Schlemper J, Folgoc LL, Lee M, Heinrich M, Misawa K. Attention U-Net: learning where to look for the pancreas. arXiv:1804.03999. 2018. [Google Scholar]
45. Fu J, Liu J, Tian H, Li Y, Bao Y, Fang Z. Dual attention network for scene segmentation. arXiv:1809.02983. 2019. [Google Scholar]
46. Gao G, Tong S, Xia Z, Wu B, Xu L, Zhao Z. Reversible data hiding with automatic contrast enhancement for medical images. Signal Process. 2021;178:107817. doi:10.1016/j.sigpro.2020.107817. [Google Scholar] [CrossRef]
47. Gao G, Wan X, Yao S, Cui Z, Zhou C, Sun X. Reversible data hiding with contrast enhancement and tamper localization for medical images. Inform Sci. 2017;385:250–65. doi:10.1016/j.ins.2017.01.009. [Google Scholar] [CrossRef]
48. Pai PY, Chang CC, Chan YK, Tsai MH. An adaptable threshold detector. Inform Sci. 2011;181(8):1463–83. doi:10.1016/j.ins.2010.12.007. [Google Scholar] [CrossRef]
49. Yang Y, Zhang W, Liang D, Yu N. A ROI-based high capacity reversible data hiding scheme with contrast enhancement for medical images. Multimed Tools Appl. 2018;77:18043–65. doi:10.1007/s11042-017-4444-0. [Google Scholar] [CrossRef]
50. Shi M, Yang Y, Meng J, Zhang W. Reversible data hiding with enhancing contrast and preserving brightness in medical image. J Inf Secur Appl. 2022;70:103324. doi:10.1016/j.jisa.2022.103324. [Google Scholar] [CrossRef]
51. Bilic P, Christ P, Li HB, Vorontsov E, Ben-Cohen A, Kaissis G. The liver tumor segmentation benchmark (LiTS). Med Image Anal. 2023;84:102680. doi:10.1016/j.media.2022.102680. [Google Scholar] [PubMed] [CrossRef]
52. Gao G, Amoah L. Automatic contrast enhancement with reversible data hiding using bi-histogram shifting. J Inf Secur Appl. 2022;68:103223. doi:10.1016/j.jisa.2022.103223. [Google Scholar] [CrossRef]
Cite This Article
 Copyright © 2025 The Author(s). Published by Tech Science Press.
This work is licensed under a Creative Commons Attribution 4.0 International License , which permits unrestricted use, distribution, and reproduction in any medium, provided the original work is properly cited.
 Downloads
 Citation Tools