
 Submit a Paper
 Propose a Special lssue
 Open Access
ARTICLE

Enhancing Post-Quantum Information Security: A Novel Two-Dimensional Chaotic System for Quantum Image Encryption
Informatics and Computer Systems Department, College of Computer Science, King Khalid University, Abha, 61421, Saudi Arabia
* Corresponding Author: Fatima Asiri. Email:
(This article belongs to the Special Issue: Emerging Technologies in Information Security )
Computer Modeling in Engineering & Sciences 2025, 143(2), 2053-2077. https://doi.org/10.32604/cmes.2025.064348
Received 12 February 2025; Accepted 09 April 2025; Issue published 30 May 2025
 View Full Text
 Download PDF
Abstract
Ensuring information security in the quantum era is a growing challenge due to advancements in cryptographic attacks and the emergence of quantum computing. To address these concerns, this paper presents the mathematical and computer modeling of a novel two-dimensional (2D) chaotic system for secure key generation in quantum image encryption (QIE). The proposed map employs trigonometric perturbations in conjunction with rational-saturation functions and hence, named as Trigonometric-Rational-Saturation (TRS) map. Through rigorous mathematical analysis and computational simulations, the map is extensively evaluated for bifurcation behaviour, chaotic trajectories, and Lyapunov exponents. The security evaluation validates the map’s non-linearity, unpredictability, and sensitive dependence on initial conditions. In addition, the proposed TRS map has further been tested by integrating it in a QIE scheme. The QIE scheme first quantum-encodes the classic image using the Novel Enhanced Quantum Representation (NEQR) technique, the TRS map is used for the generation of secure diffusion key, which is XOR-ed with the quantum-ready image to obtain the encrypted images. The security evaluation of the QIE scheme demonstrates superior security of the encrypted images in terms of statistical security attacks and also against Differential attacks. The encrypted images exhibit zero correlation and maximum entropy with demonstrating strong resilience due to 99.62% and 33.47% results for Number of Pixels Change Rate (NPCR) and Unified Average Changing Intensity (UACI). The results validate the effectiveness of TRS-based quantum encryption scheme in securing digital images against emerging quantum threats, making it suitable for secure image encryption in IoT and edge-based applications.Keywords
With the rapid advancements in digital technologies and the increasing severity of cybersecurity threats, robust encryption mechanisms are critically important for securing sensitive information [1,2]. The abundance of interconnected systems, such as IoT and cloud computing, a huge volume of digital data is generated and transmitted over unsecure networks. Image data is among the most generated and transmitted data types in IoT devices [3], as it holds importance in various modern applications including, but not limited to, medical imaging, remote sensing, surveillance, and big data [4]. The sensitive nature of image data in conjunction with the inherent susceptibility of IoT networks, call for robust security mechanisms to protect the information in images against unauthorized access, tampering, and cyber-attacks [5,6]. The field of cryptography—image encryption resolves these security concerns by hiding the information in digital images [7]. The existing encryption techniques, such as Rivest–Shamir–Adleman (RSA) and Eliptic Curve Cryptography (ECC) will not prove to be effective against quantum computation attacks, where these algorithms can be broken easily using Shorr’s algorithm [8]. Therefore, this paper intends to develop a secure post-quantum image encryption scheme that addresses the quantum threats in the post quantum era.
Quantum image encryption (QIE) has proved to be a promising solution for the post-quantum security of digital images, especially in IoT devices [9]. QIE employs quantum mechanics principles that make these schemes highly secure against quantum computational attacks [10]. Recently, chaos has been used in conjunction with QIE schemes to enhance their non-linearity and unpredictability. Chaotic systems are extremely beneficial in cryptographic algorithms due to their characteristics of being unpredictable, and sensitive to initial condition [11]. Chaotic maps serve as pseudorandom number generators (PRNG) in cryptographic algorithms, and hence, are preferred for applications, such as key generation. Recently, chaotic maps have extensively been used in image encryption algorithms [12,13]. The tradition chaotic maps possess limited chaotic range and bifurcation behaviour. Hence, there is a need to design new chaotic maps that have improved chaotic properties, large chaotic range, and highly chaotic bifurcation pattern. While many continuous chaotic systems (e.g., Lorenz or Chen) have been studied, discrete chaotic maps are particularly advantageous for digital implementations. They involve iterating a function at integer time steps, such that
To address the aforementioned concerns, this paper presents mathematical and computer modeling of a novel two-dimensional Trigonometric-Rational-Saturation (TRS) chaotic map, which has been extensively evaluated by performing computation simulations for key parameters, such as chaotic trajectories, bifurcation behaviour, and Lyapunov Exponents. Moreover, the designed chaotic map is integrated in a QIE to evaluate its effectiveness and security applications. The important contributions put forth by this paper are: (a) Design and security evaluation of a novel two-dimensional TRS chaotic map, which is utilised for secure key generation in image encryption applications, and (b) The integration and testing of the proposed TRS chaotic map in a Quantum Image Encryption scheme to validate its effectiveness and level of security.
2.1 Chaotic Maps for Image Encryption
Recently, a lot of chaotic maps have been designed to secure image encryption schemes, especially due to to their inherent characteristics, such as unpredictability, sensitive dependence on initial conditions, aperiodicity, and spheroidicity, for example, a cosine-modulated polynomial chaotic map has been designed and evaluated in [14]. The presented one dimensional map enhances the chaotic properties while maintaining structural simplicity. The results demonstrate that the presented map achieved high level of non-linearity, unpredictability, and sensitivity to initial conditions. Similarly, a sine-cosine chaotic map (SCCM) has been presented in [15]. This map involves integration of deoxyribonucleic acid (DNA) encoding to further enhance the non-linearity and unpredictability of the map. Besides, chaotic maps have also been utilised in image encryption algorithms, for example, multiple chaotic maps have been utilised in a confusion-diffusion encryption scheme in [16]. The maps improve the security of the presented encryption system and protect the encrypted images from several cyber-attacks. In an attempt to improve the chaotic range of the chaotic maps, a logistic-quadratic chaotic map has been presented in [17]. The map boasts expanded chaotic range, large key space and focuses on maintaining the computational efficiency. Researchers have also developed higher dimensional chaotic map, for example, three-dimensional chaotic maps and an umbrella chaotic system have been presented in [18], and [19], respectively. Both maps improve the encryption performance of proposed schemes in terms of correlation disruption and entropy maximisation. Moreover, other discrete systems have also been explored for image encryption. For instance, the Degn–Harrison map [20] was originally proposed to study bacterial respiration oscillations but is has shown to exhibit a range of complex bifurcation behaviours. Its use in ring-star network topologies and image encryption highlights its potential for secure data transmission, illustrating how chemical or biological models with chaotic dynamics can be adapted for cryptographic purposes. In addition, various studies have also been conducted on the cryptanalysis of image encryption schemes, for instance, a recent paper reveals that a scheme [21], which adopts quantum chaos and DNA coding, suffers from the existence of an equivalent key and vulnerable DNA substitution steps. Similarly, the scheme in [22], combining a Hill cipher variant with one-dimensional chaotic maps, fails to withstand chosen-plaintext/ciphertext attacks in under a second for standard images. These findings necessitate the need of secure chaos-based encryption algorithms.
2.2 Chaos-Based Quantum Image Encryption Techniques
Recent literature suggests an increased interest in the design and development of encryption schemes that are quantum resistant. Several papers can be found that present advancements in quantum image encryption, for example, a chaos-based dual-phase confusion-diffusion quantum image encryption scheme has been presented in [23]. The presented scheme integrates qubit and pixel level transformations to enhance the resilience against differential and data loss attacks. The results demonstrate improved randomness and diffusion properties in the encrypted images. Similarly, a QIE scheme involving cellular automata is proposed in [24]. The presented scheme benefits from various chaotic maps to improve the security of the encrypted images. The authors claim the proposed scheme is highly resistant to statistical attacks. Furthermore, another scheme utilises quantum bits-level scrambling and feedback diffusion methods to protect images in [25]. The authors also present a two-dimensional (2D) cross-chaotic map for the proposed QIE. Results demonstrate improved diffusion at bit level and improved key sensitivity due to the proposed map. Similarly, a three-dimensional chaotic map has been proposed and evaluated in [26] for a QIE scheme that involves controlled qubit scrambling. The method boasts achieving high-security while maintaining low-computational complexity. Additionally, in an attempt to secure digital images against destructive attacks, Arnold quantum transformations in conjunction with four-dimensional chaotic maps have been presented in [27]. The presented scheme exhibited strong encryption performance with improved key space and non-linearity. Similarly, quantum logistic chaos has been applied on flexible quantum representation images (FRQI)-based quantum images. The presented scheme is also compressive sensing and exhibits strong resistance against statistical and differential attacks.
3 The Proposed Novel 2D TRS Chaotic Map
3.1 Mathematical Modeling and Design of the Map
A two-dimensional discrete-time system can be represented by the iteration of a state vector
where
3.1.1 Definition of the TRS Map
In this work, a Trigonometric-Rational-Saturation (TRS) map has been proposed, which is defined component-wise by:
where
• Trigonometric Perturbation:
• Rational Saturation:
ensuring the map does not diverge and has inherent “saturation”-like behavior.
Hence, combining trigonometric non-linearity and rational saturation, with a modulo operation, enhances the map’s chaotic characteristics and keeps the trajectory within the unit square
3.1.2 Fixed Points and Stability
A fixed point
Solving these equations analytically can be challenging due to the non-linear and mod 1 terms. Typically, one resorts to numerical methods to locate fixed points for given parameters.
Local stability around a point
Then the Jacobian matrix at
In order to derive the Jacobian matrix of the proposed 2D map, we begin by individually computing the partial derivatives of its components. Consider the map functions
Because the term
and thus
Next, we differentiate
To complete the Jacobian, we consider
On the other hand, the derivative with respect to
and therefore
By gathering these results, we form the Jacobian matrix
where
Local Stability Criterion
For a fixed point
If any eigenvalue
3.2 Remarks on Parameter Selection
For chaos-based applications (e.g., encryption), the parameters
1.
2. The map remains in
3. The generated sequence
Empirical parameter tuning, alongside the above theoretical and numerical checks, helps find parameter sets that maximize cryptographic strength and complexity.
3.3 Concluding Remarks on TRS Map Design
The proposed 2D TRS map:
• Preserves Boundedness: Thanks to both the trigonometric and rational saturation terms, the states remain confined within the unit square.
• Exhibits High Non-Linearity: The mixture of sine and cosine functions, rational transformations, and the mod 1 operation increases unpredictability.
• Facilitates Chaotic Trajectories: By proper parameter selection, the map attains high Lyapunov exponents, strong sensitivity to initial conditions, and aperiodic trajectories.
Consequently, it is a promising candidate for pseudorandom number generation and chaos-based encryption algorithms requiring strong cryptographic security and unpredictability.
3.4 Computational Simulation for Chaotic Trajectory Analysis
The chaotic trajectory of the system is the sequence of iterations
where:
The chaotic behaviour of the TRS map, including the 2D and 3D trajectories are depicted in Figs. 1 and 2, respectively. Chaotic behaviour of the TRS map has also been compared with the trajectories of the logistic, sine, and tent maps. It is evident from the results that chaotic behaviour of the proposed map is highly non-linear and unpredictable as compared to those of the traditional maps in comparison.
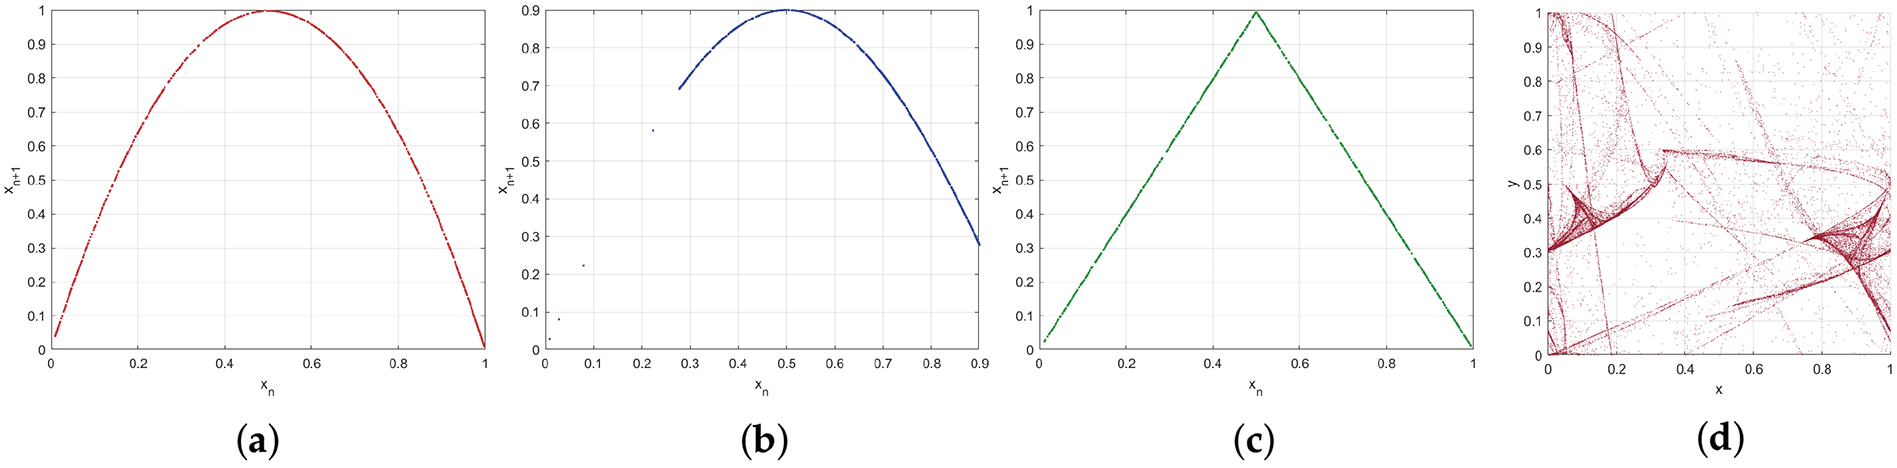
Figure 1: Visualization of chaotic dynamics through two-dimensional (2D) trajectory plots. (a) The conventional iterative ‘Logistic’ map. (b) The conventional trigonometric ‘Sine’ map. (c) The conventional piecewise-linear Tent chaotic map (d) The proposed TRS map, illustrating distinct non-linear behaviours

Figure 2: Visualization of chaotic dynamics through three-dimensional (3D) trajectory plots. (a) The conventional iterative ‘Logistic’ map. (b) The conventional trigonometric ‘Sine’ map. (c) The conventional piecewise-linear Tent chaotic map (d) The proposed TRS map, illustrating distinct non-linear behaviours
3.5 Sensitivity Analysis to Initial Conditions
The designed chaotic map has been subjected to sensitivity analysis to initial conditions. The map has been tested for a very minute change in its initial conditions, i.e., on the order of
Both trajectories are iterated for
Fig. 3 shows the evolution of the Euclidean distance

Figure 3: Sensitivity analysis to initial conditions. (a) Chaotic trajectory divergence (log scale) for two trajectories whose initial conditions differ by
4 Computational Simulation for Lyapunov Exponent Analysis
The Lyapunov exponent (LE) is the parameter that determines the sensitivity of the designed map is to its initial conditions. The sensitivity of the map to its initial conditions is directly proportional to the value of the LE. For the proposed TRS chaotic map, the system’s evolution is given by:
where
where
The Lyapunov exponents are numerically estimated by iterating the system and averaging the logarithm of the eigenvalues’ magnitudes. Fig. 4d illustrates the largest Lyapunov exponent (LLE) of the TRS chaotic map as a function of parameter

Figure 4: Sensitivity to initial conditions depicted by the Lyapunov exponent plots. (a) The conventional iterative ‘Logistic’ map. (b) The conventional trigonometric ‘Sine’ map. (c) The conventional piecewise-linear Tent chaotic map (d) The proposed TRS map
To highlight the superiority of the TRS chaotic map, its Lyapunov behaviour is compared to well-known 1D chaotic maps as shown in Fig. 4. The plots demonstrate that the TRS map, with its high-dimensional chaotic attractors, offers significantly greater unpredictability. Moreover, as the TRS map demonstrates consistently high Lyapunov exponents, indicative of strong sensitive dependence on initial conditions. The maps in comparison have smaller Lyapunov exponents, resulting in less sensitive dependence on initial conditions.
5 Computational Simulation for Bifurcation Analysis
Bifurcation analysis is a crucial tool for understanding the dynamical behaviour of chaotic systems as control parameters vary. In a chaotic system, bifurcations indicate the transition from periodic to chaotic behaviour, revealing the complex structure of attractors. The proposed TRS chaotic map is analysed through one-dimensional and three-dimensional bifurcation diagrams, confirming its ability to exhibit complex dynamical transitions. A bifurcation occurs when a small variation in a control parameter causes a qualitative change in the attractor’s behaviour. The bifurcation pattern of the TRS map for all four control parameters is depicted in Fig. 5.

Figure 5: Bifurcation pattern of the TRS chaotic map. The bifurcation structure is obtained by sweeping the respective parameter over the range of
Unlike classical chaotic maps, the bifurcation patterns in TRS are highly dense, reflecting the strong ergodicity and complexity of the attractor structure as shown in Fig. 6. The chaotic maps in comparison exhibit limited bifurcation complexity. In contrast, the TRS chaotic map shows highly dense bifurcation points, ensuring greater randomness, persistent chaos over a broad parameter range, eliminating sensitivity to specific parameter tuning, interacting chaotic attractors in the 3D bifurcation analysis, revealing complex multi-dimensional state-space transitions. Moreover, Fig. 7 shows 3D bifurcation diagrams, where the long-term behaviour of the system is plotted against two variables, revealing the interaction between different chaotic states.

Figure 6: The comparison of the bifurcation pattern of the TRS map with the well known maps. (a) The conventional iterative ‘Logistic’ map. (b) The conventional trigonometric ‘Sine’ map. (c) The conventional piecewise-linear Tent chaotic map (d) The proposed TRS map

Figure 7: 3D bifurcation diagrams of the TRS chaotic map, obtained by sweeping the respective parameter over the range
NIST SP 800-22 Randomness Evaluation
To evaluate the randomness of the pseudorandom sequences generated by the proposed TRS map, the NIST SP 800-22 tests have been conducted. The test procedure, results, and discussion is entailed as follows:
1. Sequence Generation: The TRS map has been iterated for
2. NIST Statistical Tests: The 15 tests in the NIST SP 800-22 suite, i.e., Frequency (Monobit), Block Frequency, Runs, Longest Runs, Rank, Discrete Fourier Transform, Non-Overlapping Templates, Overlapping Templates, Universal, Approximate Entropy, Random Excursions, Random Excursions Variant, Serial, and Linear Complexity have been applied on the generated pseudorandom sequences.
All tests returned
• Frequency (Monobit) and Block Frequency Tests: The ratio of 0 to 1s, both across the entire sequence and within fixed-size blocks, stayed within the expected uniform range. Typical
• Runs and Longest Runs Tests: Consecutive 0 or 1s did not deviate from the theoretical random-run distribution; numerical outcomes yielded
• Rank Test: By examining the linear independence of sub-blocks, this test revealed near full-rank matrices with
• Discrete Fourier Transform (Spectral) Test: No significant periodicities were observed;
• Non-Overlapping and Overlapping Template Tests: Across different template lengths, these tests reported average
• Approximate Entropy and Universal Tests: Results demonstrated high randomness and low compressibility, with
• Serial, Linear Complexity, and Random Excursions Tests: Further evaluations (e.g., checking adjacency relations, assessing polynomial complexities, and analyzing random walks) yielded median
All NIST SP 800-22 tests produced
6 Application to Quantum Image Encryption
In this section, a quantum-ready image encryption scheme that leverages the NEQR quantum image representation and the TRS chaotic map-based diffusion mechanism to achieve high-security image encryption is presented. The encryption process is stepwise and systematic, ensuring robustness against cryptographic attacks. The encryption scheme is given in Fig. 8 comprising the following steps in sequence:
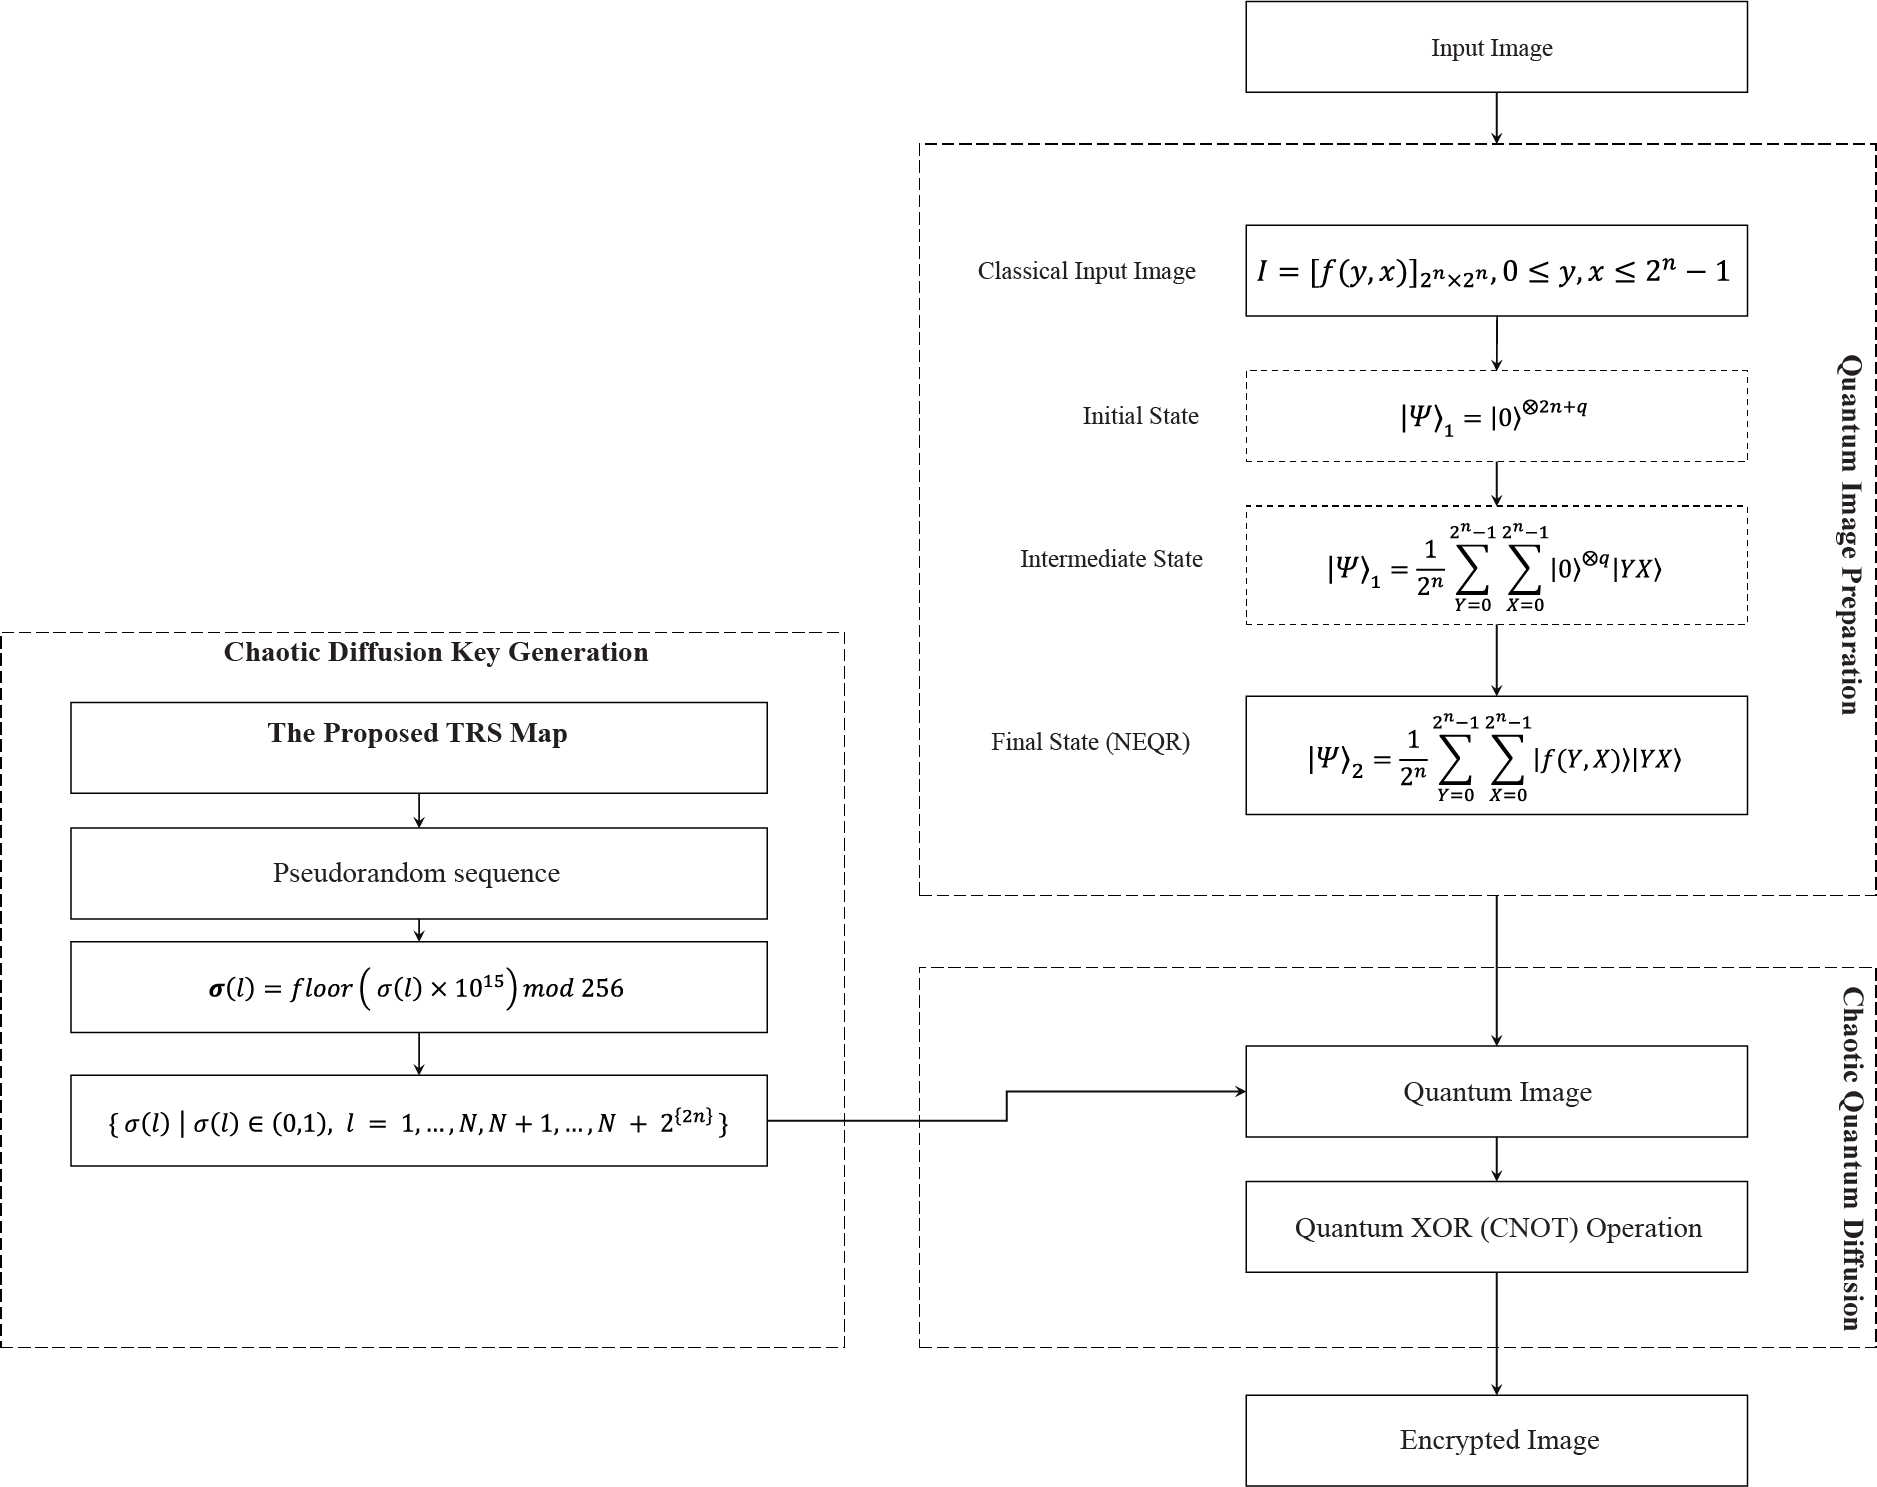
Figure 8: The quantum image encryption scheme to evaluate the TRS map
6.1 Step 1: Quantum-Ready Image Representation via NEQR
Given a greyscale imageI of size
where
A sample representation of a

Figure 9: Representation of quantum images using NEQR. (a) A

Figure 10: Quantum circuit for quantum image preparation—NEQR
6.2 Step 2: Chaotic Sequence Generation via TRS Map
To generate a pseudo-random sequence, the TRS chaotic map is utilized. The 2D TRS chaotic system evolves as:
The map is iterated for
6.3 Step 3: Diffusion Key Matrix Generation
The diffusion key matrix is a
where
is used for pixel-wise diffusion.
6.4 Step 4: Quantum XOR-Based Diffusion
The final encryption is performed via applying bit-XOR (CNOT) operation [29] performed between the quantum-ready image matrix
Expanding the quantum state representation, we obtain:
Simplifying further gives:
Where each encrypted pixel is computed as follows:
The operation in above equation ensures effective diffusion across all pixels and introduces additional layer of security. The quantum circuit for the chaotic diffusion process is given in Fig. 11.

Figure 11: Quantum circuit for chaotic diffusion process
Since the proposed encryption scheme is based on a symmetric keys, the decryption follows steps that invert the encryption operations. We assume the receiver has the correct initial parameters
1. The recipient starts with the cipher image. Each pixel is stored in an 8-qubit amplitude.
2. Using the symmetric keys, i.e., the control parameters
3. The encryption relies on a bitwise (quantum) XOR operation between the quantum-ready plaintext and the chaotic key, the inverse operation is also a bitwise XOR (CNOT). In other words,
where
4. Finally, the decrypted quantum image
5. Upon completion of these steps, the decrypted (plain) image is successfully restored.
7 Security Evaluation, Results and Discussion
Extensive security evaluation has been conducted for the proposed QIE scheme employing the TRS map including histograms, correlation, and differential attacks. The encryption outcomes, presented in Fig. 12, illustrate that the encrypted images effectively conceal all information. All simulation experiments were conducted on an HP ProBook 450 G8 laptop. The system is equipped with an Intel® CoreTM i7 processor (11th Generation), 16 GB of RAM, and runs a 64-bit operating system. This hardware configuration was sufficient to handle the iterative nature of our TRS map generation an d quantum encoding simulations, thus demonstrating the feasibility of the proposed encryption scheme on standard consumer-grade equipment.

Figure 12: Visual security analysis of the proposed QIE scheme. (a)–(e) Plain test images. (f)–(j) The final encrypted images. (k)–(o) The lossless decrypted images
A crucial test for evaluating the security of an encryption scheme is the histogram analysis, which assesses how much distributed are the pixel intensities in the encrypted image. A well-secured encryption method should produce uniform histograms, where pixel values are evenly distributed across the full greyscale range. For the input plaintext image
In this equation,
The histograms of the plaintext and ciphertext images are shown in Fig. 13. The results demonstrate that the proposed scheme successfully disrupts statistical patterns, making it resistant to histogram-based attacks.
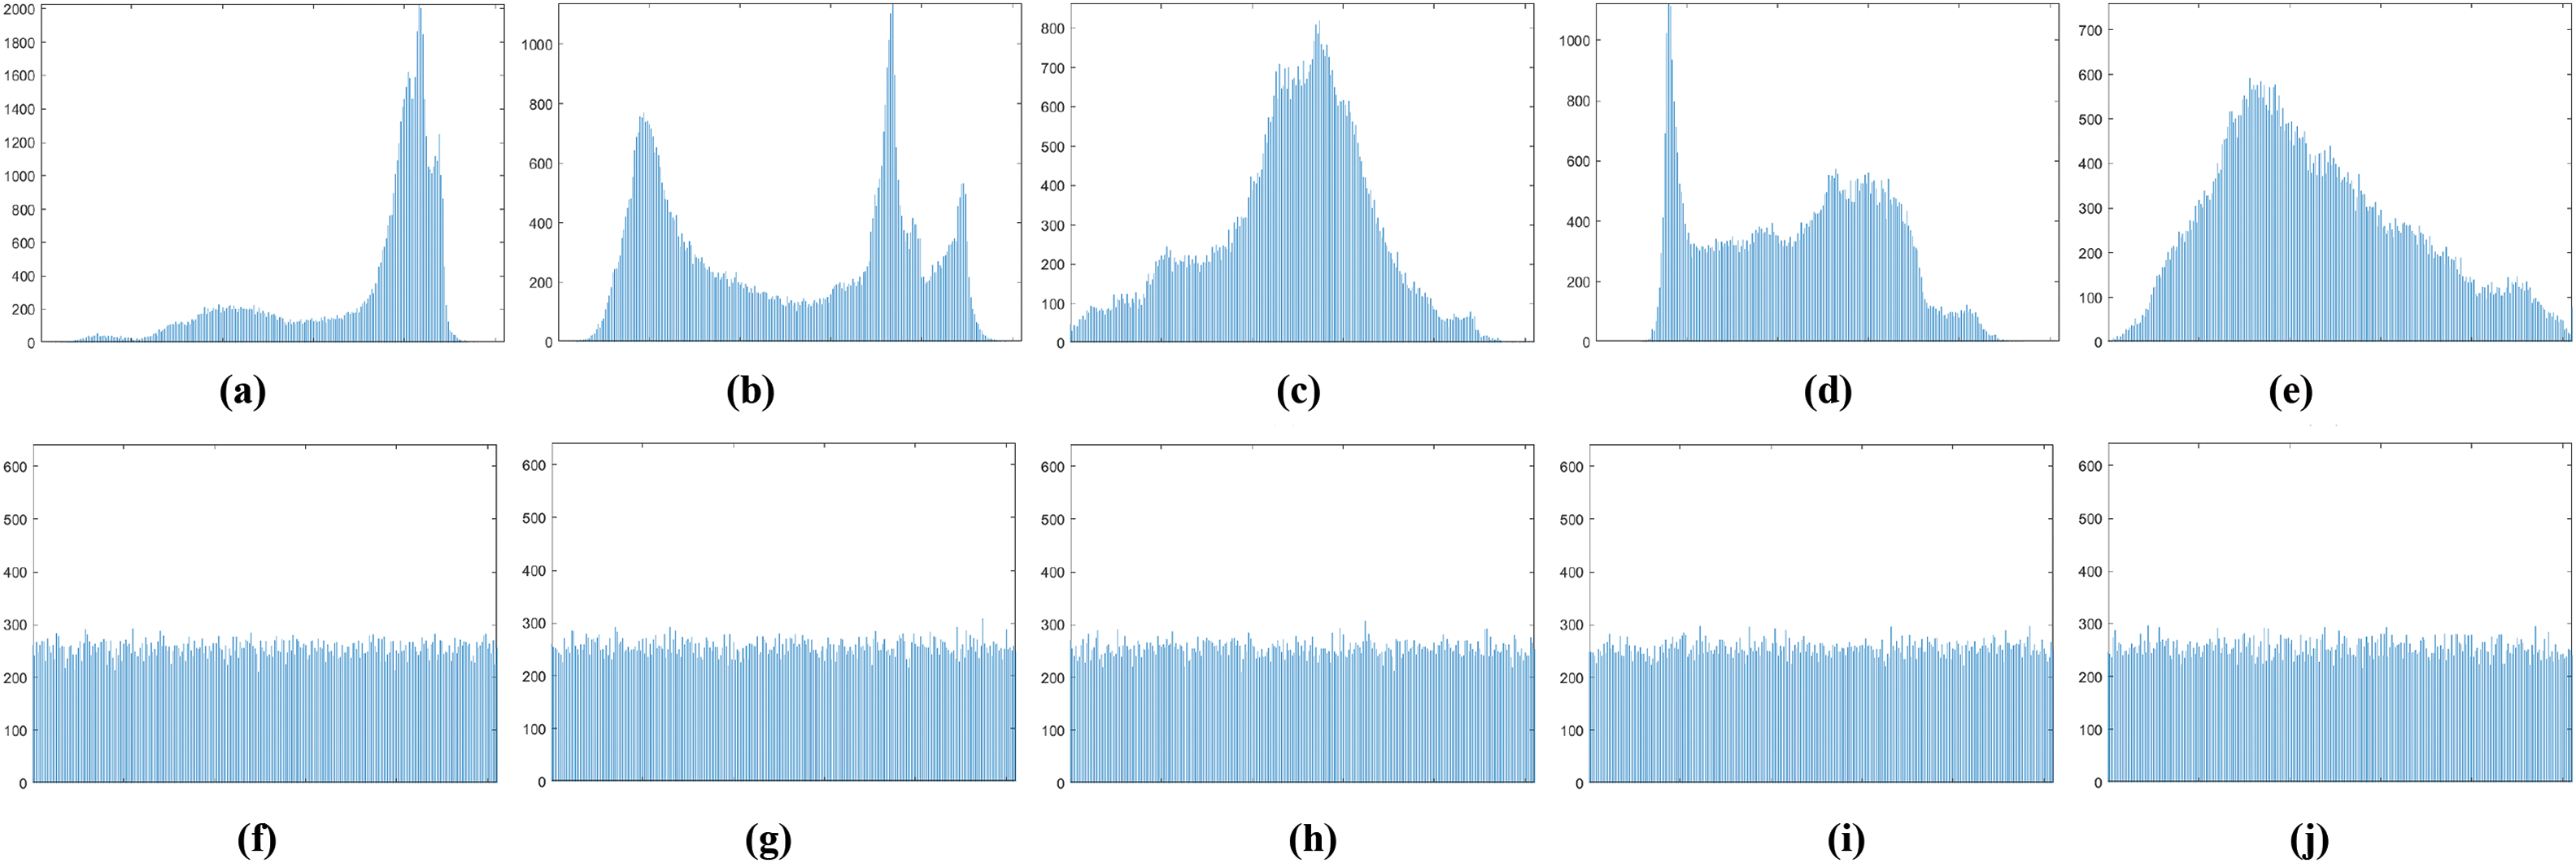
Figure 13: The histograms of the original and encrypted images. (a)–(e) Plain test images. (f)–(j) Final encrypted images
A fundamental requirement for a secure image encryption scheme is that the ciphertext pixels exhibit no correlation with their adjacent pixels. In plaintext images, neighbouring pixels are highly correlated due to the structural redundancy in natural images. However, in an ideal encryption scheme, this correlation should be minimized, approaching zero. The correlation coefficient between two adjacent pixels,
where:
is the expectation of pixel intensities, and
is the variance of the pixel values. The ideal encrypted image should satisfy:
The correlation coefficients have been computed in three orientations: horizontal, vertical, and diagonal. The results for the plaintext and encrypted images are summarized in Table 1. The results confirm that the encrypted images achieve near-zero correlation, indicating strong decorrelation.

Scatter Plot Analysis
A visual confirmation of decorrelation is provided through correlation coefficient scatter plots, shown in Fig. 14. The scatter plots illustrate that plaintext images displays a highly concentrated structure, indicating strong correlation among neighbouring pixels, while the encrypted images exhibit efficient scattering with a randomized distribution, confirming strong decorrelation.

Figure 14: Evaluation of correlation properties in the proposed encryption scheme. Dark red plots represent the correlation coefficients of original images, while light red plots correspond to encrypted images. (a)–(e) Horizontal correlation analysis, (f)–(j) Vertical correlation assessment, and (k)–(o) Diagonal correlation evaluation
7.3 Differential Attack Analysis
A secure image encryption scheme must be highly sensitive to small changes in the plaintext. This property ensures that even a single-bit modification in the original image leads to significant changes in the ciphertext, making it resistant to differential attacks. To evaluate sensitivity, an experiment is conducted where a greyscale plaintext image is encrypted twice. The original plaintext image I is encrypted, producing ciphertext
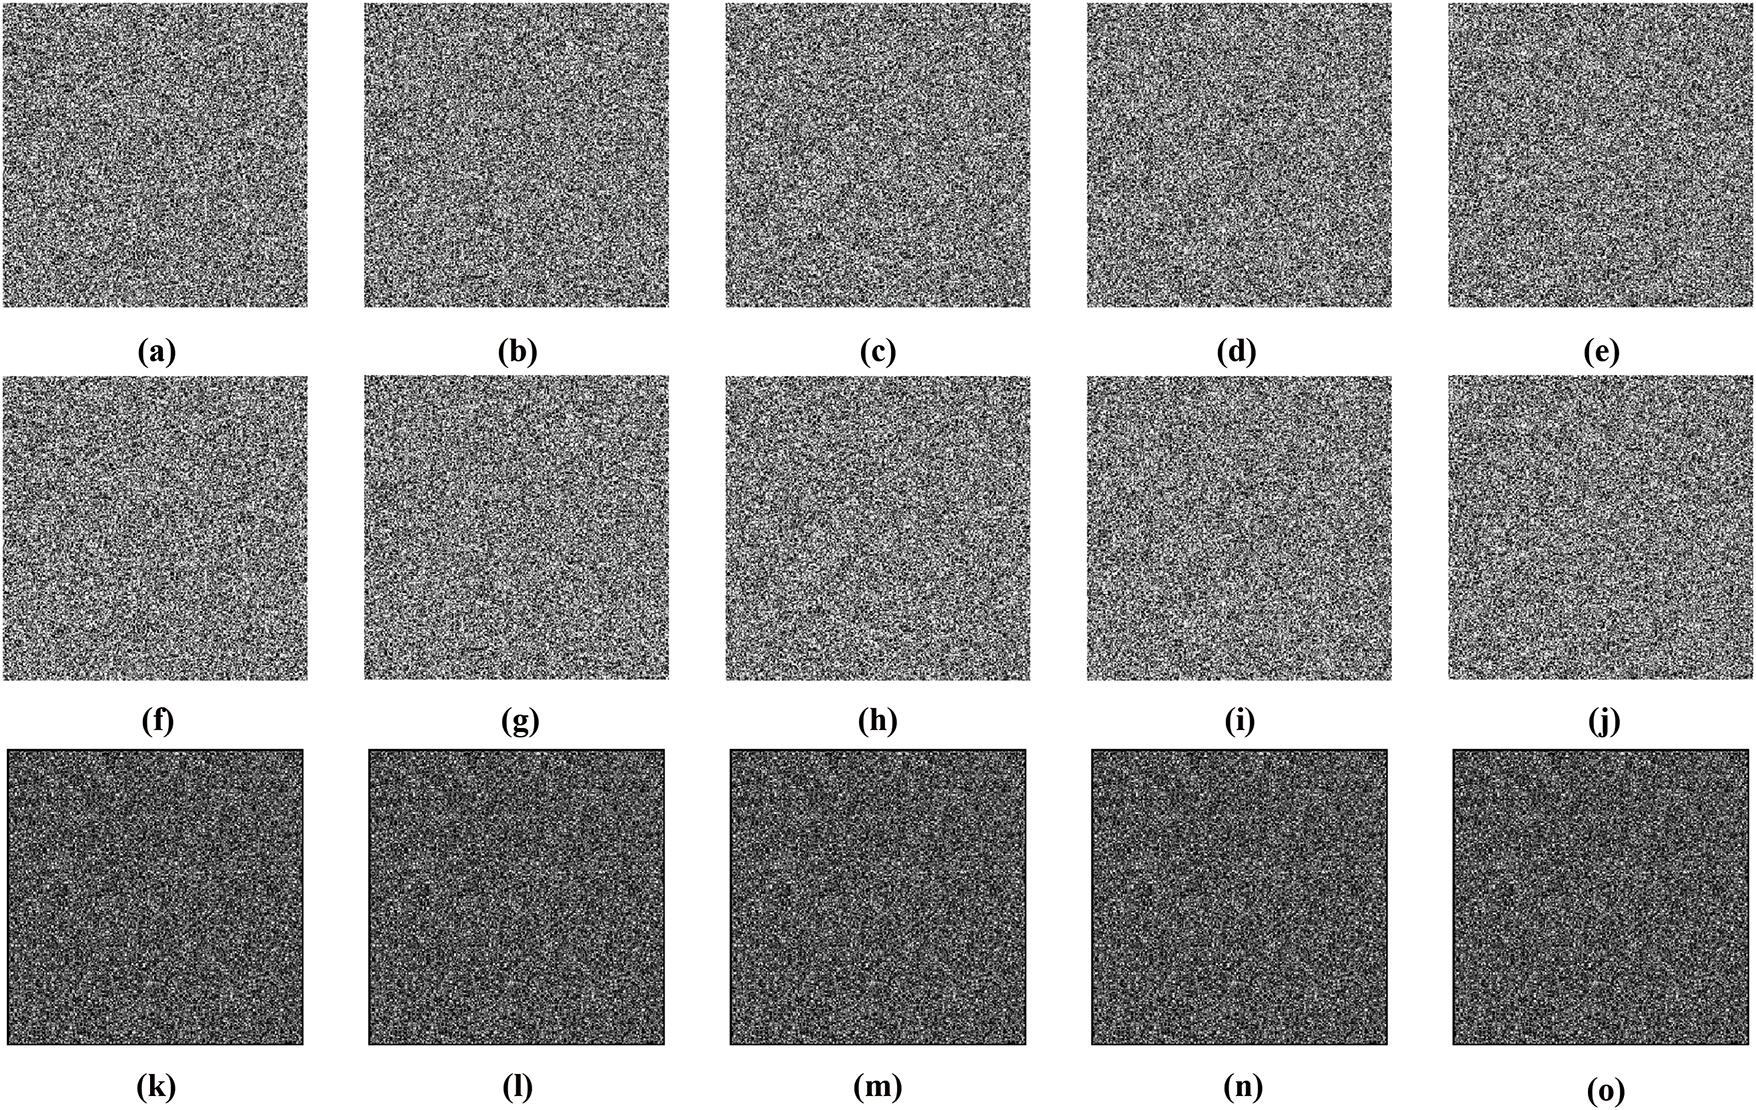
Figure 15: Differential attack results. (a)–(e) Original encrypted images. (f)–(j) Encrypted images of 1-bit changed plain images (k)–(o) Difference between the original and 1-bit changed encypted images
The difference images in Fig. 15 show widespread pixel changes, confirming that even a minute modification in the plaintext results in a drastically different ciphertext, ensuring strong security against differential attacks.
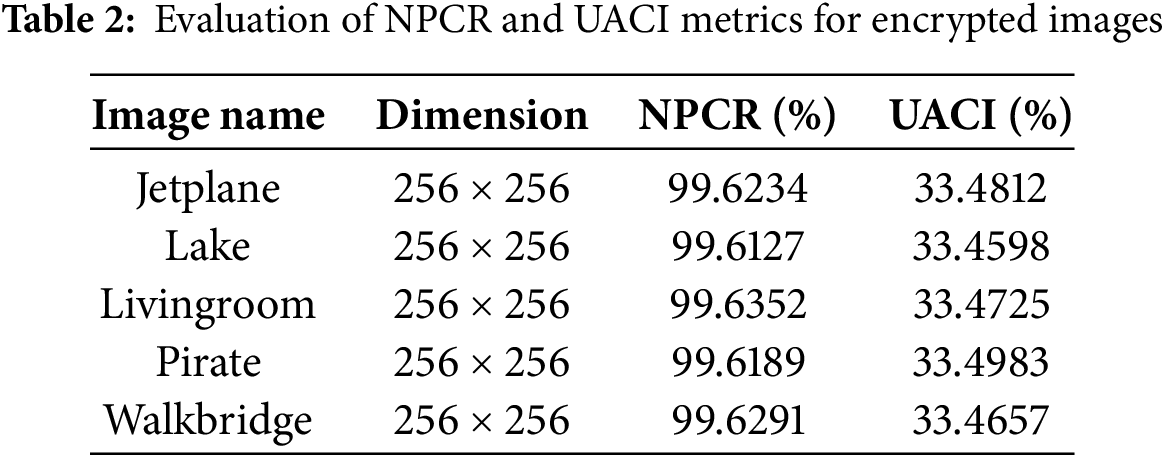
NPCR and UACI Evaluation
To quantitatively evaluate the differential security, two key metrics are used. Number of Pixels Change Rate (NPCR) measures the percentage of pixels that change when a single-bit modification occurs in the plaintext and the Unified Average Changing Intensity (UACI) measures the average intensity difference between two ciphertexts resulting from a slight plaintext change. The NPCR is computed as:
where:
Similarly, UACI is defined as:
The computed NPCR and UACI values are summarized in Table 2, demonstrating near-ideal security performance. The results confirm that the NPCR value is close to 100%, indicating that almost every pixel is altered when the plaintext changes slightly. The UACI value is close to 33%, aligning with the theoretical ideal for a highly efficient encryption scheme.
7.4 Noise and Data Loss Resilience Analysis
The proposed encryption scheme has been evaluated for noise and data loss attacks. The noise resilience is tested by inducing salt and pepper noise in the encrypted images. Noise densities of 5%, 10%, and 15% were induced in the encrypted images and undergone the decryption process to evaluate the effect of noise attacks. It can be seen in Fig. 16 that the original images were successfully recovered with minimal data loss.

Figure 16: Resilience to noise attacks. (a) Encrypted image with 5% induced noise. (b) Encrypted image with 10% induced noise. (c) Encrypted image with 15% induced noise. (d) to (f) Successfully decrypted images with minimal loss
In addition, to evaluate the resilience of the proposed scheme of data loss attacks, different portions of encrypted images were clipped/occluded with occlusion areas of 10%, 20%, and 30%. When passed through the decryption process, the original images were successfully recovered with minimal data loss as evident in Fig. 17.
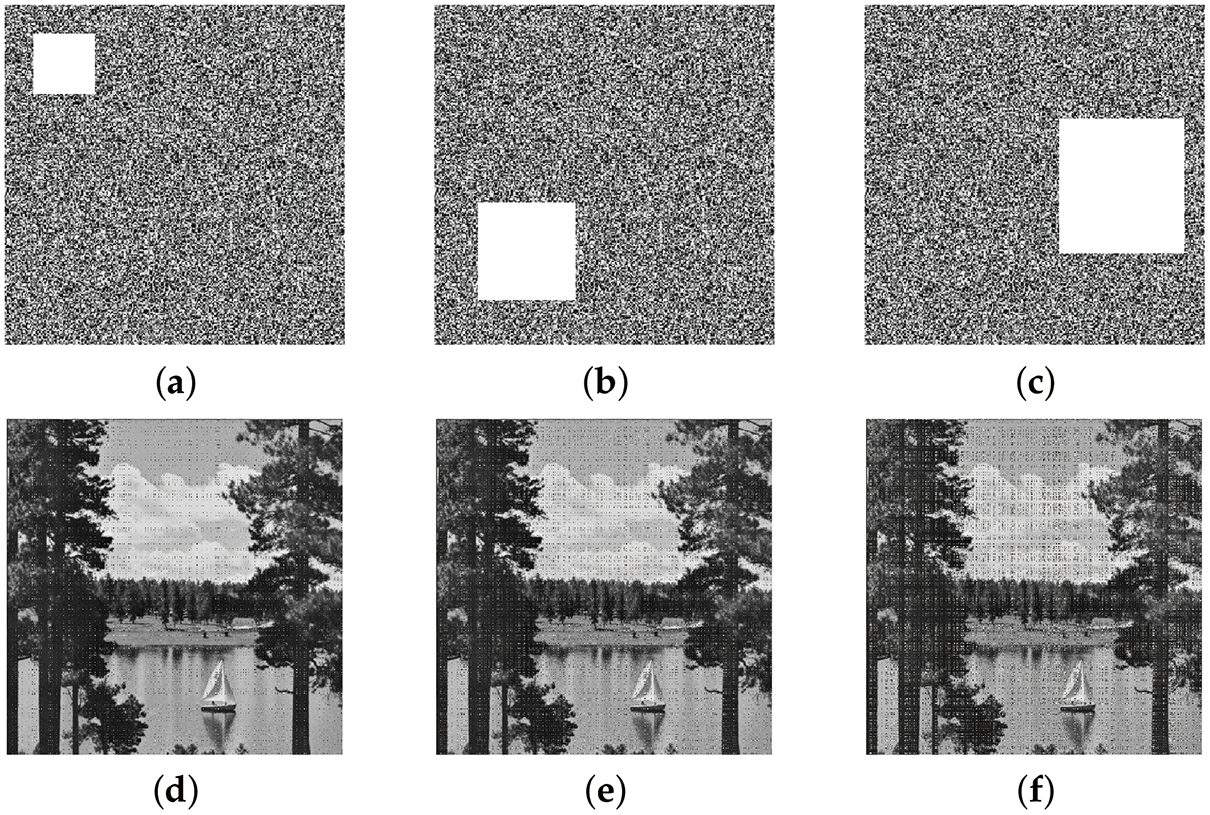
Figure 17: Resilience to data loss attacks. (a) Encrypted image with 10% data loss. (b) Encrypted image with 20% data loss. (c) Encrypted image with 30% data loss. (d) to (f) Successfully decrypted images with minimal loss
Entropy estimates the amount of randomness in an encrypted image. A higher entropy value indicates better diffusion and confusion, making it harder for an attacker to predict pixel distributions. For a 256-level greyscale image, the ideal entropy value is close to 8, ensuring that the ciphertext exhibits maximum randomness. The Shannon entropy H of an encrypted image
where
Here,
To validate the security of the encryption scheme, entropy values are calculated for several standard greyscale test images. The results are presented in Table 3. The ideal entropy values confirm the strong randomness and unpredictability of the encrypted images.

The chi-square test helps in determining the difference between observed and expected distributions. In the context of image encryption, it helps in verifying whether an encrypted image’s pixel intensities are uniformly distributed or not. To perform this test, the observed frequency
The chi-square statistic is then calculated as follows:
A high chi-square value represents showing uniform randomness, demonstrating that the encryption scheme effectively destroys patterns. On the other hand, a low chi-square value indicates a structured and non-random distribution. The results in Table 4 show that the original images exhibit very large

7.7 Complexity Analysis of the Proposed Quantum Encryption Scheme
The overall complexity of the proposed scheme for a a grayscale image of size
Summing the overhead of each step confirms that the entire encryption process is dominated by
7.8 Discussion and Quantum Attack Resistance
An important aspect of the proposed TRS-based scheme is its resilience against known quantum attacks. Benefiting from quantum mechanics the proposed scheme intends to with stands quantum attacks such as: (a) Grover’s algorithm, which can exponentially expedite classical brute-force key searches by providing a quadratic speed-up. However, in chaotic-map-based cryptosystems as ours, the key is derived from extremely sensitive initial seeds
Most of the existing post-quantum cryptographic techniques, such as lattice-based or code-based cryptography, rely on structured mathematical problems believed to be intractable for quantum computers. In contrast, our approach uses a chaotic map, which is independent from traditional number-theoretic assumptions. While certain high-dimensional chaotic maps or hybrid systems may equal or surpass the chaos level of TRS, they can become more computationally intensive. By focusing on a two-dimensional TRS design, we balance parameter complexity and computational feasibility.
Furthermore, the proposed TRS-based quantum image encryption scheme has been designed with IoT and edge computing constraints in mind. These environments typically feature low-power processors (e.g., ARM Cortex or MIPS) and constrained memory resources. Moreover, the TRS map’s operations can be efficiently realized in either single-precision floating-point or fixed-point. For devices that lack hardware floating-point support, optimized lookup tables or approximations (e.g., CORDIC for sine and cosine) can further reduce computational overhead. When run on slightly more capable edge devices (e.g., Raspberry Pi), the diffusion and NEQR encoding steps can be parallelized across multiple cores. Because each pixel’s chaotic key is computed independently, thread-level parallelism can often achieve near-linear speed-ups. Hence, the TRS map can be integrated into constrained hardware systems while maintaining robust cryptographic properties, making it suitable for real-world deployment in edge-based applications.
This paper presented the design and modeling of a novel Trigonometric-Rational-Saturation (TRS) chaotic map and applied it to quantum image encryption. The TRS map-based quantum encryption scheme proved to be effective in securing digital images from cyber attacks. The TRS map demonstrated strong chaotic properties, which have been validated through bifurcation analysis, Lyapunov exponents, and phase-space trajectories. Its high Lyapunov exponent confirmed its suitability for cryptographic applications. In addition, a quantum-ready encryption scheme was utilised using NEQR encoding and a chaotic diffusion key matrix derived from the TRS map. Security analysis showed uniform histograms, near-zero correlation (
Acknowledgement: The authors extend their appreciation to the Deanship of Research and Graduate Studies at King Khalid University for funding this work through Large Group Project under grant number (RGP.2/556/45).
Funding Statement: This work is funded by Deanship of Research and Graduate Studies at King Khalid University. The authors extend their appreciation to the Deanship of Research and Graduate Studies at King Khalid University for funding this work through Large Group Project under grant number (RGP.2/556/45).
Author Contributions: The authors confirm contribution to the paper as follows: Conceptualization, Fatima Asiri and Wajdan Al Malwi; methodology, Fatima Asiri and Wajdan Al Malwi; software, Fatima Asiri and Wajdan Al Malwi; investigation, Fatima Asiri and Wajdan Al Malwi; writing—original draft preparation, Fatima Asiri and Wajdan Al Malwi; writing—review and editing, Fatima Asiri and Wajdan Al Malwi. All authors reviewed the results and approved the final version of the manuscript.
Availability of Data and Materials: The data that support the findings of this study are available from the Corresponding Author, F.A., upon reasonable request.
Ethics Approval: Not applicable.
Conflicts of Interest: The authors declare no conflicts of interest to report regarding the present study.
References
1. Malik A, Ali M, S. Alsubaei F, Ahmed N, Kumar H. A color image encryption scheme based on singular values and chaos. Comput Model Eng Sci. 2023;137(1):965–99. doi:10.32604/cmes.2023.022493. [Google Scholar] [CrossRef]
2. Ibrahim RW, Natiq H, Alkhayyat A, Kadhim Farhan A, M. G. Al-Saidi N, Baleanu D. Image encryption algorithm based on new fractional beta chaotic maps. Comput Model Eng Sci. 2022;132(1):119–31. doi:10.32604/cmes.2022.018343. [Google Scholar] [CrossRef]
3. Ali H, Khan MS, Driss M, Ahmad J, Buchanan WJ, Pitropakis N. CellSecure: securing image data in industrial internet-of-things via cellular automata and chaos-based encryption. In: 2023 IEEE 98th Vehicular Technology Conference (VTC2023-Fall); 2023; Hong Kong, China. p. 1–6. [Google Scholar]
4. Lin Y, Xie Z, Chen T, Cheng X, Wen H. Image privacy protection scheme based on high-quality reconstruction DCT compression and nonlinear dynamics. Expert Syst Appl. 2024;257(5):124891. doi:10.1016/j.eswa.2024.124891. [Google Scholar] [CrossRef]
5. El-kafrawy P, Aboghazalah M, M. Ahmed A, Torkey H, El-Sayed A. An efficient encryption and compression of sensed IoT medical images using auto-encoder. Comput Model Eng Sci. 2023;134(2):909–26. doi:10.32604/cmes.2022.021713. [Google Scholar] [CrossRef]
6. Khan MS, Ahmad J, Ali H, Pitropakis N, Al-Dubai A, Ghaleb B, et al. SRSS: a new chaos-based single-round single s-box image encryption scheme for highly auto-correlated data. In: 2023 International Conference on Engineering and Emerging Technologies (ICEET); 2023; Istanbul, Turkey. p. 1–6. [Google Scholar]
7. Alqahtani F. AI-powered image security: utilizing autoencoders for advanced medical image encryption. Comput Model Eng Sci. 2024;141(2):1709–24. doi:10.32604/cmes.2024.054976. [Google Scholar] [CrossRef]
8. Singh B, Ahateshaam M, Lahiri A, Sagar AK. Future of cryptography in the era of quantum computing. In: International Conference on Electrical and Electronics Engineering 2023; 2023; Istanbul, Turkey. p. 13–31. [Google Scholar]
9. Wang J, Geng YC, Han L, Liu JQ. Quantum image encryption algorithm based on quantum key image. Int J Theor Phys. 2019;58(1):308–22. doi:10.1007/s10773-018-3932-y. [Google Scholar] [CrossRef]
10. Sahu SK, Mazumdar K. State-of-the-art analysis of quantum cryptography: applications and future prospects. Front Phys. 2024;12:1456491. doi:10.3389/fphy.2024.1456491. [Google Scholar] [CrossRef]
11. Zhang B, Liu L. Chaos-based image encryption: review, application, and challenges. Mathematics. 2023;11(11):2585. doi:10.3390/math11112585. [Google Scholar] [CrossRef]
12. Ullah S, Liu X, Waheed A, Zhang S, Li S. Novel grayscale image encryption based on 4D fractional-order hyperchaotic system, 2D Henon map and knight tour algorithm. Phys Scr. 2024;99(9):095248. doi:10.1088/1402-4896/ad6d0e. [Google Scholar] [CrossRef]
13. Ullah S, Liu X, Waheed A, Zhang S. Provably secure color image encryption algorithm based on FO 4D-HCS and ACM. Soft Comput. 2024;28(21–22):12879–96. doi:10.1007/s00500-024-10319-8. [Google Scholar] [CrossRef]
14. Khan MS, Ahmad J, Al-Dubai A, Pitropakis N, Driss M, Buchanan WJ. A novel cosine-modulated-polynomial chaotic map to strengthen image encryption algorithms in IoT environments. Procedia Comput Sci. 2024;246:4214–23. doi:10.1016/j.procs.2024.09.261. [Google Scholar] [CrossRef]
15. Liang Q, Zhu C. A new one-dimensional chaotic map for image encryption scheme based on random DNA coding. Opt Laser Technol. 2023;160(9):109033. doi:10.1016/j.optlastec.2022.109033. [Google Scholar] [CrossRef]
16. Elkandoz MT, Alexan W. Image encryption based on a combination of multiple chaotic maps. Multimed Tools Appl. 2022;81(18):25497–518. doi:10.1007/s11042-022-12595-8. [Google Scholar] [CrossRef]
17. Khairullah MK, Alkahtani AA, Bin Baharuddin MZ, Al-Jubari AM. Designing 1D chaotic maps for fast chaotic image encryption. Electronics. 2021;10(17):2116. doi:10.3390/electronics10172116. [Google Scholar] [CrossRef]
18. Sachin, Singh P. A novel chaotic Umbrella map and its application to image encryption. Opt Quantum Electron. 2022;54(5):266. doi:10.1007/s11082-022-03646-3. [Google Scholar] [CrossRef]
19. Bouteghrine B, Tanougast C, Sadoudi S. Novel image encryption algorithm based on new 3-d chaos map. Multimed Tools Appl. 2021;80(17):25583–605. doi:10.1007/s11042-021-10773-8. [Google Scholar] [CrossRef]
20. Vismaya V, Muni SS, Panda AK, Mondal B. Degn-Harrison map: dynamical and network behaviours with applications in image encryption. Chaos, Solit Fractals. 2025;192(3):115987. doi:10.1016/j.chaos.2024.115987. [Google Scholar] [CrossRef]
21. Wen H, Lin Y. Cryptanalysis of an image encryption algorithm using quantum chaotic map and DNA coding. Expert Syst Appl. 2024;237(14):121514. doi:10.1016/j.eswa.2023.121514. [Google Scholar] [CrossRef]
22. Wen H, Lin Y, Yang L, Chen R. Cryptanalysis of an image encryption scheme using variant Hill cipher and chaos. Expert Syst Appl. 2024;250(1):123748. doi:10.1016/j.eswa.2024.123748. [Google Scholar] [CrossRef]
23. Shahbaz Khan M, Ahmad J, Al-Dubai A, Pitropakis N, Ghaleb B, Ullah A, et al. Chaotic quantum encryption to secure image data in post quantum consumer technology. IEEE Trans Consum Electron. 2024;70(4):7087–101. doi:10.1109/TCE.2024.3415411. [Google Scholar] [CrossRef]
24. Mohamed NAES, El-Sayed H, Youssif A. Mixed multi-chaos quantum image encryption scheme based on quantum cellular automata (QCA). Fractal Fract. 2023;7(10):734. doi:10.3390/fractalfract7100734. [Google Scholar] [CrossRef]
25. Hu M, Li J, Di X. Quantum image encryption scheme based on 2D Sine2–Logistic chaotic map. Nonlinear Dyn. 2023;111(3):2815–39. doi:10.1007/s11071-022-07942-1. [Google Scholar] [CrossRef]
26. Verma V, Kumar S. Quantum image encryption algorithm based on 3D-BNM chaotic map. Nonlinear Dyn. 2025;113(4):3829–55. doi:10.1007/s11071-024-10403-6. [Google Scholar] [CrossRef]
27. Liu XD, Chen QH, Zhao RS, Liu GZ, Guan S, Wu LL, et al. Quantum image encryption algorithm based on four-dimensional chaos. Front Phys. 2024;12:1230294. doi:10.3389/fphy.2024.1230294. [Google Scholar] [CrossRef]
28. Zhang Y, Lu K, Gao Y, Wang M. NEQR: a novel enhanced quantum representation of digital images. Quantum Inf Process. 2013;12(8):2833–60. doi:10.1007/s11128-013-0567-z. [Google Scholar] [CrossRef]
29. Liu X, Xiao D, Liu C. Three-level quantum image encryption based on Arnold transform and logistic map. Quantum Inf Process. 2021;20(1):1–22. doi:10.1007/s11128-020-02952-7. [Google Scholar] [CrossRef]
30. Liu X, Xiao D, Liu C. Double quantum image encryption based on arnold transform and qubit random rotation. Entropy. 2018;20(11):867. doi:10.3390/e20110867. [Google Scholar] [PubMed] [CrossRef]
31. Li HS, Li C, Chen X, Hy Xia. Quantum image encryption algorithm based on NASS. Int J Theor Phys. 2018;57(12):3745–60. doi:10.1007/s10773-018-3887-z. [Google Scholar] [CrossRef]
Cite This Article
 Copyright © 2025 The Author(s). Published by Tech Science Press.
This work is licensed under a Creative Commons Attribution 4.0 International License , which permits unrestricted use, distribution, and reproduction in any medium, provided the original work is properly cited.
 Downloads
 Citation Tools