
 Submit a Paper
 Propose a Special lssue
 Open Access
ARTICLE

Lightweight Deep Learning Model and Novel Dataset for Restoring Damaged Barcodes and QR Codes in Logistics Applications
1 TEM R&D Center, İDOSB, Orhanlı, İstanbul, 34956, Türkiye
2 Applied Technology Division, William Penn University, 201 W Trueblood Ave, Oskaloosa, IA 52577, USA
* Corresponding Author: Haluk Kucuk. Email:
(This article belongs to the Special Issue: Data-Driven Artificial Intelligence and Machine Learning in Computational Modelling for Engineering and Applied Sciences)
Computer Modeling in Engineering & Sciences 2025, 143(3), 3557-3581. https://doi.org/10.32604/cmes.2025.064733
Received 22 February 2025; Accepted 23 May 2025; Issue published 30 June 2025
 View Full Text
 Download PDF
Abstract
This study introduces a lightweight deep learning model and a novel synthetic dataset designed to restore damaged one-dimensional (1D) barcodes and Quick Response (QR) codes, addressing critical challenges in logistics operations. The proposed solution leverages an efficient Pix2Pix-based framework, a type of conditional Generative Adversarial Network (GAN) optimized for image-to-image translation tasks, enabling the recovery of degraded barcodes and QR codes with minimal computational overhead. A core contribution of this work is the development of a synthetic dataset that simulates realistic damage scenarios frequently encountered in logistics environments, such as low contrast, misalignment, physical wear, and environmental interference. By training on this diverse and realistic dataset, the model demonstrates exceptional performance in restoring readability and decoding accuracy. The lightweight architecture, featuring a U-Net-based encoder-decoder with separable convolutions, ensures computational efficiency, making the approach suitable for real-time deployment on embedded and resource-constrained devices commonly used in logistics systems. Experimental results reveal significant improvements: QR code decoding ratios increased from 14% to 99% on training data and from 15% to 68% on validation data, while 1D barcode decoding ratios improved from 7% to 73% on training data and from 9% to 44% on validation data. By providing a robust, resource-efficient solution for restoring damaged barcodes and QR codes, this study offers practical advancements for enhancing the reliability of automated scanning systems in logistics operations, particularly under challenging conditions.Keywords
The history of 1D barcodes dates back to the late 1940s when Bernard Silver and Norman Joseph Woodland conceptualized encoding information with lines and spaces, leading to the first patent in 1952 [1]. The breakthrough came in 1973 with the adoption of the Universal Product Code (UPC) in the retail industry, revolutionizing inventory tracking and checkout processes. Meanwhile, the QR code, a type of 2D barcode, was invented in 1994 by Denso Wave, a subsidiary of Toyota, to improve manufacturing efficiency by allowing for more data storage and faster readability [2]. While 1D barcodes remain widely used in various industries, QR codes have gained popularity for their ability to store complex information and their versatility in applications such as marketing and mobile payments.
1D barcodes are machine-readable patterns applied to products, packaging or parts, representing data in the widths and spaces of parallel lines [3,4]. These codes were developed primarily for tracking products throughout their lifecycle in logistics and automation [5]. Conversely, QR codes are two-dimensional (2D) barcodes that store information both vertically and horizontally, thus providing significantly more data storage capacity than 1D barcodes [6,7]. This improved storage capacity has enabled QR codes to be used to store information such as addresses and URLs, making them popular with users of camera smartphones.
Both 1D barcodes and QR codes play a crucial role in effectively communicating data, allowing businesses across various industries to automate processes and increase efficiency. Especially in the logistics sector, these codes are widely used to track the movement of products from production to the final consumer. The use of barcodes in these capacities increases accuracy, traceability, and sorting capabilities.
Logistics companies can use 1D barcodes and QR codes embedded in products or packaging for comprehensive, real-time product tracking that increases supply chain efficiency and transparency. The proliferation of smartphones has made QR codes even more important in various industries in recent years, especially in automotive and commercial marketing applications [6]. This is because more people have a barcode reader in their pocket, giving businesses a unique opportunity to enhance their advertising strategies by driving users directly to their brand website and moving them further down the conversion funnel.
There are a number of reasons why barcodes can become unreadable, and these reasons usually have to do with issues with the barcode itself or the technology used to read it.
Low contrast: Barcode readers rely on distinguishing light and dark elements of a barcode. Insufficient contrast, caused by dark barcodes on dark backgrounds, light barcodes on reflective surfaces, printing inconsistencies, substrate variations, or poor lighting, hinders readability [8].
Quiet zone violations: The quiet zone is a clear area around a barcode that must be free of obstructions. Encroachment into this zone prevents accurate barcode interpretation.
Print or mark inconsistency: Inconsistent printing or marking, due to poor ink distribution, uneven pressure, or improper equipment settings, leads to readability issues like low contrast and quiet zone violations.
Improper reading position: Accurate barcode decoding requires the reader to be correctly positioned regarding focal distance, scan angle, and orientation. Misalignment or improper positioning can prevent barcode reading [9,10].
Barcode damage or distortion: Handling, transport, or harsh environments can damage barcodes, causing readability issues. Damage includes scratches, smudges, tears, fading, or contamination by substances [4,11].
Blurring: Blurring from camera shake, incorrect focus, or object/scanner movement during image capture impairs barcode readability [12].
Low resolution: Low-resolution images from inappropriate sensors or cameras make it difficult for readers to distinguish barcode elements, especially for small barcodes [3,13].
Lighting: Poor lighting conditions, including glare, shadows, or uneven illumination, create challenges for barcode readers in interpreting the code [3,13].
Various traditional approaches are employed to repair or restore damaged barcodes and QR codes.
Using error correction codes: Some barcodes, such as QR codes and Data Matrix codes, include built-in redundancy to maintain readability even when damaged. QR codes offer four levels of error correction (Low, Medium, High, and Quadrant), which can be utilized by barcode readers like the Dynamsoft Barcode Reader to recover data from damaged codes. The highest level of correction can recover up to 30% of data bytes. Similarly, Data Matrix codes use Reed-Solomon error correction, enabling data recovery from codes that are up to 50% damaged [8].
Image processing techniques: Various image processing techniques are employed to enhance the quality of barcode images and improve recognition. These techniques include filtering, contrast balancing, image rotation, and binarization. The Radon method can rotate skewed barcode images, while the Otsu segmentation method can separate the barcode from the original image [14].
Using symbol reconstruction technology: Symbol reconstruction technology enables barcode readers to recover data from damaged or corrupted barcodes [8]. This method uses an algorithm to combine discontinuous symbol data from multiple scan lines, merging the missing code fragments of partially hidden or rotated symbols into a single, complete scanline that can then be deciphered by the reader.
Traditional barcode readers face difficulties in reading low-quality barcodes, especially those that are blurry, damaged or distorted [3,8]. Deep learning (DL) based systems are promising for overcoming these limitations and improving barcode recognition accuracy and speed [15,16]. DL plays a crucial role in two fundamental stages of barcode recognition: barcode detection and barcode image restoration.
Various deep learning methods and models are effective for restoring barcode and QR code images, including GANs, CNNs, RNNs, and autoencoders.
GANs are powerful deep learning models widely used in image restoration, deblurring, and denoising tasks, as highlighted in recent studies [16–18]. GANs consist of two networks, a generator and a discriminator, that work together to produce realistic images [19]. The generator attempts to create a clean image from a corrupted one, while the discriminator tries to distinguish between the generated image and a real image. GANs are particularly effective at restoring QR codes with motion blur [12]. For instance, DeblurGAN-v2, trained on noisy and sharp image pairs, has been successfully used to deblur barcode images. Additionally, GANs have been employed in QR code repair, leveraging their image-generating capabilities to synthesize missing regions with plausible content, based on the original image [18].
Convolutional Neural Networks (CNNs) are a widely used deep learning models, especially for image recognition and classification tasks [10,17,20]. They are effective at recognizing features and patterns in images, making them suitable for barcode and QR code restoration [19]. CNNs have been employed for various image restoration tasks, including noise removal [6], deblurring [6,19], and super resolution [13]. Researchers have used a CNN-based framework to address QR code blurring issues, as well as to remove shadows and white noise [21]. CNNs have also been used to convert low-resolution QR codes into decipherable images [22]. Additionally, deep CNNs have been integrated into autoencoders, a type of neural network designed to create clean images from corrupted barcode images [6].
Recurrent Neural Networks (RNNs) are particularly effective at removing motion blur from barcodes in video frames because they can capture patterns and dependencies in sequential data [10,12]. This capability is especially useful in video processing, where motion blur is a gradual degradation that often occurs over multiple frames. The structure of RNNs allows them to store information from previous frames and use that information when processing the current frame, making them well-suited for restoring images with motion blur.
This study presents a resource-efficient deep learning model aimed at restoring damaged barcodes and QR codes by leveraging the Pix2Pix framework, a type of conditional GAN. Pix2Pix [23] is particularly suited for this task as it excels in image-to-image translation, learning to map damaged barcode images to their restored versions. The model employs a U-Net architecture with 2D separable convolutions, optimizing the balance between detailed feature restoration and computational efficiency, making it ideal for embedded systems. Central to our approach is the development of a highly realistic synthetic dataset that mimics severe damage scenarios frequently observed in logistics. Our dataset generation pipeline incorporates diverse augmentation techniques to replicate issues such as low contrast, misalignment, physical damage, and environmental interference. The remainder of the study includes the presentation and discussion of results.
Pix2Pix is a type of Conditional GAN specifically designed for image-to-image translation tasks. The idea behind Pix2Pix is to train a model to learn the mapping from an input image to an output image. Unlike traditional GANs, which generate images from random noise, Pix2Pix transforms an image from one domain into a corresponding image in another domain. This makes it particularly useful for tasks such as generating realistic images from sketches, converting daytime scenes to nighttime scenes, or transforming satellite images into maps.
The training process involves feeding pairs of images into the network: an input image from the source domain and its corresponding target image from the target domain. The generator network learns to create realistic output images, while the discriminator network learns to distinguish between real target images and generated ones. During the training stage, the generator and discriminator networks are fed through an adversarial type of training process. Here the generator strives to produce images that are indistinguishable from real ones, while the discriminator endeavors to differentiate between real and generated images. Through this adversarial training modality, the generator progressively enhances its capability to generate realistic output images.
Pix2Pix has been applied to a range of image-to-image translation tasks, such as generating lifelike street scenes from sketches, converting satellite images into maps, and even transforming sketches into photographs. Its performance has showcased remarkable outcomes, yielding high-quality, visually convincing images.
Pix2Pix for barcode image restoration: Barcode image restoration is an image-to-image translation task. In this context, Pix2Pix is a suitable model because it specializes in transforming an input image into an output image with desired characteristics. For barcode restoration specifically, the input images might be damaged or degraded barcode images, while the output images would ideally be clean and legible versions of those barcodes. During training, Pix2Pix model learns to capture the underlying patterns and structures in the barcode images, enabling it to generate high-quality restored images when presented with new, unseen damaged barcode inputs. The versatility of Pix2Pix in learning a wide range of features can be summarized as follows:
Complex mapping: Pix2Pix excels at learning complex mappings between different domains. For barcode image restoration, it needs to understand the relationship between damaged or degraded barcode images and their clean versions. This involves capturing the intricate patterns and structures specific to barcode images, which Pix2Pix can effectively learn through its training process.
Conditional generation: Pix2Pix is a conditional GAN, meaning it generates output images based on input images. For barcode image restoration, this means that given a damaged or partially obscured barcode image as input, Pix2Pix can produce a restored version as output. The conditional nature of Pix2Pix allows it to leverage the contextual information in the input image to guide the restoration process effectively.
High-quality results: Pix2Pix has demonstrated the ability to produce high-quality, visually realistic images in various image-to-image translation tasks. This is crucial for barcode image restoration, as the goal is to produce clean and legible barcode images that accurately represent the encoded information. Pix2Pix’s capability to generate visually plausible outputs helps ensure that the restored barcode images are both readable and faithful to the original data.
Flexibility and adaptability: Pix2Pix is a flexible framework that can be adapted to various image restoration tasks by training it on appropriate datasets. Barcode images come in multiple formats and may suffer from different types of damage or degradation. By training Pix2Pix on a diverse dataset of damaged barcode images paired with their corresponding clean versions, the model can learn to handle a wide range of restoration scenarios and produce accurate results.
In the logistics application, a parcel moves along a conveyor belt with a camera fixed above it. The camera captures an image of the scene, which is then sent to the processing and decoding pipeline. We developed a platform with a conveyor belt and an overhead camera to enable live testing of the proposed algorithm (Fig. 1).
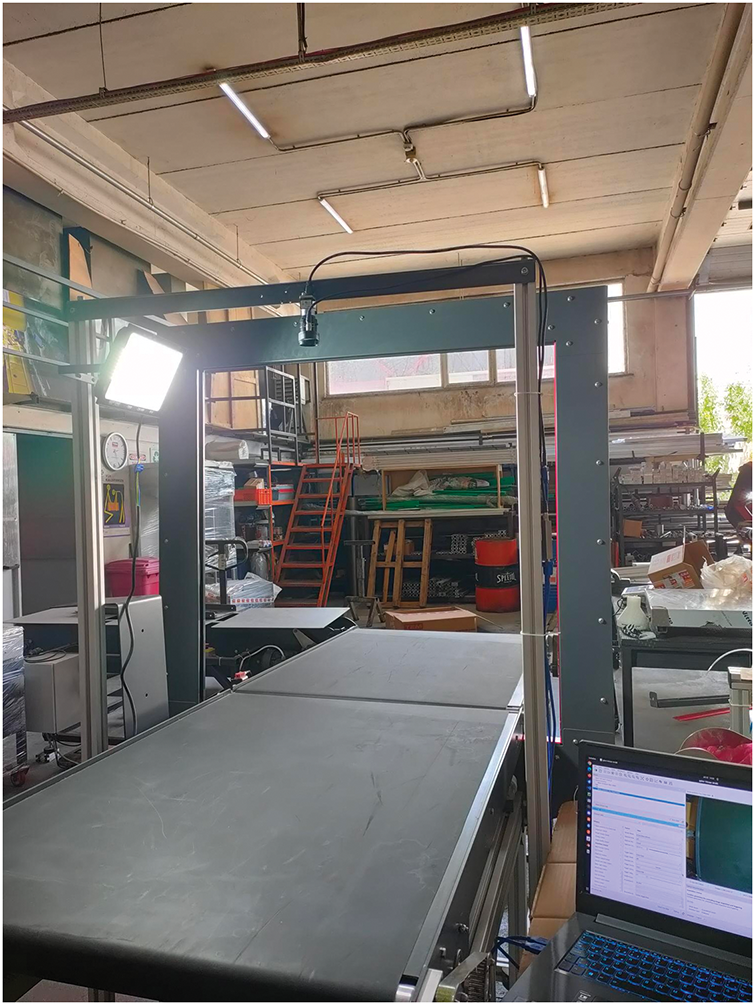
Figure 1: Conveyor belt with an overhead camera
The processing pipeline consists of several stages (Fig. 2):
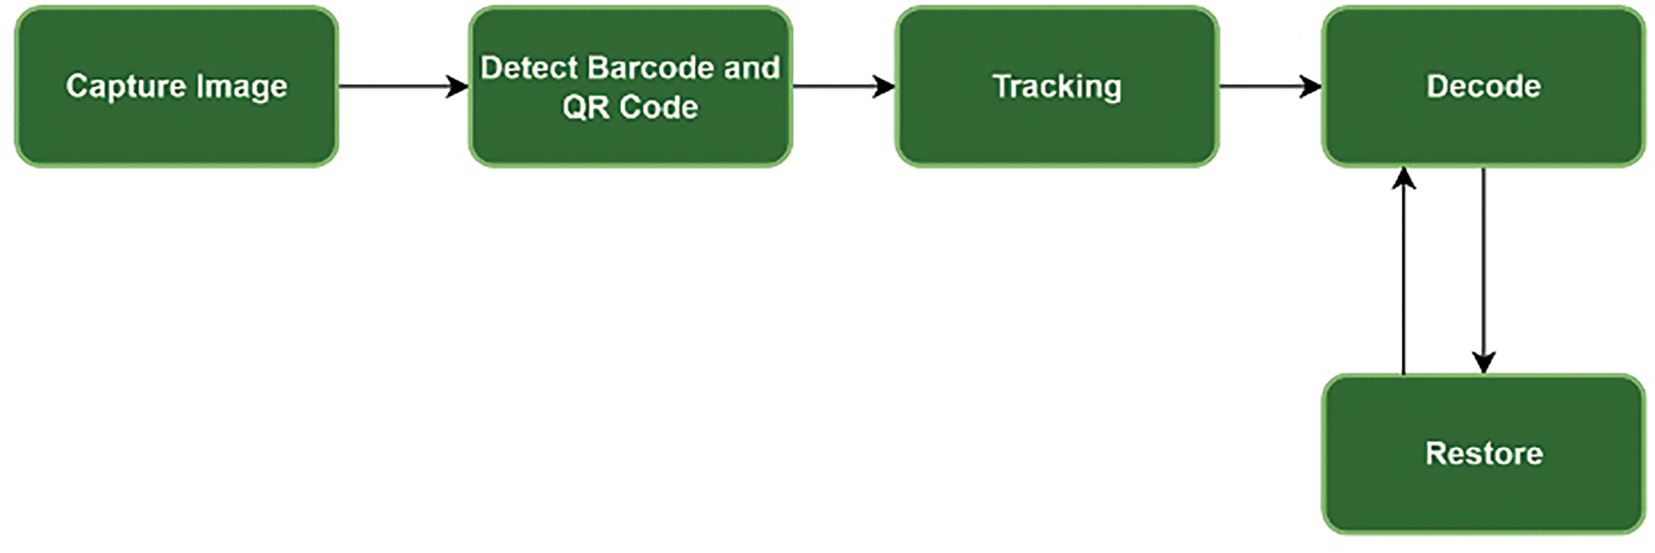
Figure 2: Barcode detection and decoding pipeline
1. Barcode Detection: We used YOLO v8 to detect barcodes or QR codes from the captured images.
2. Tracking: A Kalman tracker was employed to track the detected barcodes.
3. Image Processing:
○ Each detected barcode area was cropped from the image and sent to the decoding stage.
○ If the image could not be decoded, it was first sent to the restoration stage and then to the decoding stage after restoration.
For decoding, we used a common library called ZBar. For image restoration, we utilized our trained deep learning model.
2.3 Generator and Discriminator Architecture
The U-Net architecture designed for barcode image restoration processes input images of size 256 × 256 pixels with three color channels (RGB), resulting in an input shape of (256, 256, 3). This choice of input size is a balance between maintaining sufficient resolution to capture barcode details and managing computational efficiency (Fig. 3a).
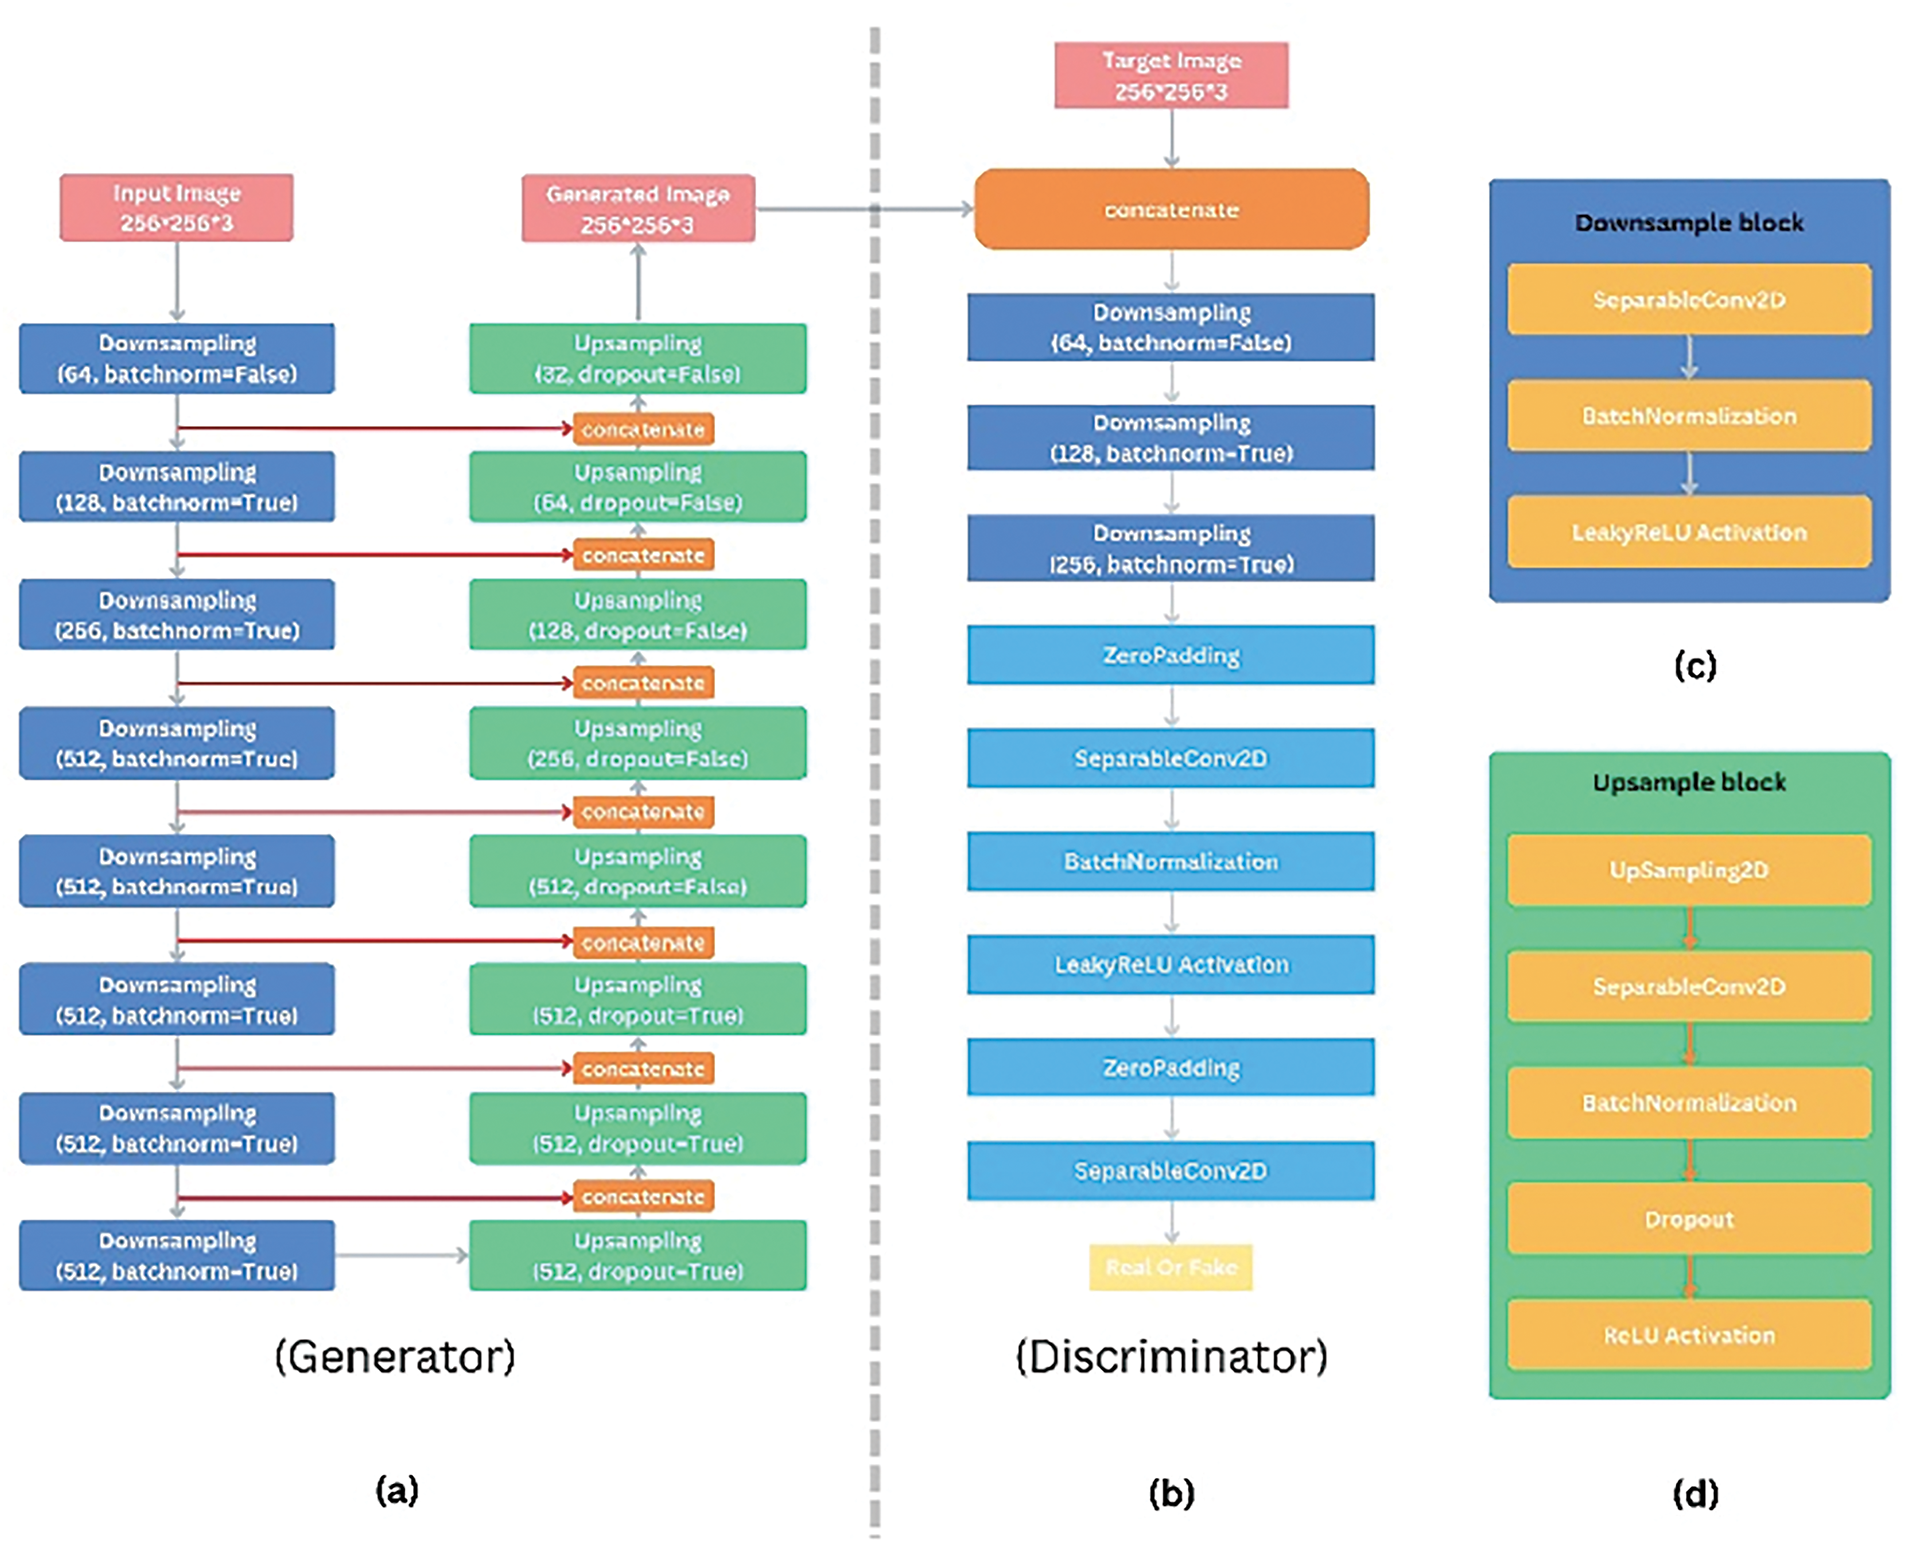
Figure 3: Model architecture
The model features a symmetric encoder-decoder structure. In the encoder (downsampling path), the model employs a series of 2D separable convolution layers with strides of 2, paired with Leaky Rectified Linear Unit activations (Fig. 3c).
This process progressively reduces the spatial dimensions while increasing the number of filters. The specific sequence of filter sizes used in the encoder typically follows a pattern of doubling the number of filters at each downsampling step, starting from a relatively low number and increasing to capture more complex features as the spatial dimensions decrease. Our design can be outlined as follows:
• The first 2D separable convolution utilizes 64 filters.
• The second 2D separable convolution layer increases to 128 filters.
• The third 2D separable convolution layer further increases to 256 filters.
• The fourth 2D separable convolution layer employs 512 filters.
• The fifth to eighth 2D separable convolution layers maintains 512 filters, capturing intricate details as the spatial dimensions are progressively reduced.
In the decoder (upsampling path), 2D upsampling layer followed by 2D separable convolution layer and Rectified Linear Unit activations are utilized to upsample the feature maps back to the original image size (Fig. 3d).
The number of filters in the decoder typically mirrors those in the encoder, decreasing as the spatial dimensions increase:
• The first to fourth layers in the decoder use 2D upsampling followed by 2D separable convolution layer with 512 filters.
• The fifth layer reduces to 256 filters.
• The sixth layer reduces further to 128 filters.
• The seventh layer reduces to 64 filters.
• The final layer restores the output back to the original image depth of 3 filters (for the RGB channels).
These design choices, including the input size and the filter configuration, ensure that the U-Net can effectively capture and restore detailed features in barcode images, preserving their readability and accuracy. Essential to this architecture are the skip connections, which link corresponding layers in the encoder and decoder. These connections concatenate the high-resolution feature maps from the encoder directly to the decoder layers, ensuring that fine details are preserved and effectively incorporated into the restored barcode image.
Using 2D separable convolution offers significant benefits by reducing the computational load and the number of parameters. This is achieved by decomposing a standard convolution into depthwise and pointwise convolutions, resulting in a more efficient and faster model. This approach is particularly advantageous for embedded systems with limited processing power and memory. The reduced computational complexity and memory usage make 2D separable convolution highly suitable for real-time applications on embedded devices, such as mobile and IoT devices, ensuring energy efficiency and faster inference times. Using a 2D upsampling layer followed by a 2D separable convolution layer significantly reduces computational load and parameters, leading to faster inference times. It produces smoother outputs with fewer artifacts, preserving fine details crucial for barcode readability. This thoughtful design enables the U-Net to produce clear, accurate restorations of barcode images while maintaining the integrity and readability of the barcodes, even on resource-constrained platforms.
The discriminator model for the barcode image restoration task is designed to distinguish between real and restored barcode images, ensuring the generator produces high-quality outputs. The architecture starts with two input layers: ‘input_image’ and ‘target_image’, both with shapes of ‘(256, 256, 3)’ (Fig. 3b).
These inputs are concatenated along the channel axis, resulting in a combined shape of ‘(256, 256, 6)’. The concatenated input is then passed through a series of sequential blocks. Each of these blocks comprises 2D convolution layers with strides of 2 and Leaky Rectified Linear Unit activations, which effectively downsample the feature maps, reducing their spatial dimensions while increasing the depth. Specifically, these blocks transform the input shape from ‘(256, 256, 6)’ to ‘(128, 128, 64)’, then to ‘(64, 64, 128)’, and finally to ‘(32, 32, 256)’.
Following these downsampling blocks, the architecture includes a 2D input Zero-padding layer to maintain the spatial dimensions required for subsequent convolutions. The padded feature maps are then processed by a 2D convolution layer, further refining the features and producing output shapes of ‘(31, 31, 512)’. This layer is followed by a Leaky Rectified Linear Unit activation function, which introduces non-linearity and helps stabilize the training. Another 2D input Zero-padding layer and a 2D convolution layer continue to refine the features, culminating in a final output shape of ‘(30, 30, 1)’. This final layer represents the discriminator’s prediction, indicating whether the input barcode image pair is real or restored. This detailed architecture allows the discriminator to effectively differentiate between genuine and generated images, driving the generator towards producing more accurate and high-quality restorations.
Deep learning models for restoring barcode and QR code images can utilize several types of loss functions, such as Mean square error [12], Perceptual loss [12], Style loss [24], Total variation [24], Barcode-specific structural loss [24], Cross-entropy [25], Adversarial loss [12,16,26] each addressing different visual features of the damaged codes.
Pix2Pix is a conditional Generative Adversarial Network (cGAN) composed of two primary components: a generator and a discriminator. Its training is guided by two key loss functions:
Generator Loss: The generator aims to produce images that are both realistic and closely match the target images. Its loss function combines two components:
∘ Adversarial Loss (GAN Loss): Encourages the generator to produce images that can fool the discriminator (Eq. (1)). This is typically computed using binary cross-entropy, comparing the discriminator’s output on generated images against the label “real”:
Here x is the input image, G is the generator function, D is the discriminator function, E is the expected value.
∘ Reconstruction Loss (L1 Loss): Measures the pixel-wise difference between the generated image and the ground truth (Eq. (2)), helping preserve the content and structure of the image:
where y is the target image.
∘ Total Generator Loss: A weighted sum of both losses (Eq. (3)):
where λ is the loss weight.
Discriminator Loss: The discriminator learns to differentiate between real and generated images, conditioned on the input
It is trained using binary cross-entropy to penalize incorrect classifications (Eq. (4)):
In this work, the reconstruction loss has been extended to incorporate a combination of multiple loss functions, rather than relying solely on the L1 loss.
The loss function of the traditional Pix2Pix algorithm seeks to minimize a combination of adversarial loss and mean absolute error (MAE), which quantifies the discrepancy between the target and output images. In our proposed algorithm, however, we go beyond relying solely on adversarial loss and MAE. We have introduced additional components: the Structural Similarity Index (SSIM) and Focused Mean Absolute Error. SSIM estimates the similarity between the target and output images by measuring the mean intensity of the two images to quantify the perceived quality.
Focused Mean Absolute Error (FMAE): To guide the model in prioritizing the restoration of crucial regions within barcodes and QR codes, a specialized loss component, FMAE, has been introduced. This loss emphasizes image areas containing useful information, guiding the model to more accurately reconstruct these critical regions. The process begins with the ground truth (target) image of a barcode or QR code. To identify the region of interest (ROI), the image is first converted to grayscale and inverted to highlight the barcode area (Fig. 4). A binary threshold is then applied, producing a binary image in which the relevant region appears white, effectively separating it from the background. To refine this binary mask, morphological dilation is applied. This operation expands the white regions and connects nearby features, ensuring that the full structure of the barcode or QR code is captured. The resulting mask defines the ROI with high precision. Using this mask, the corresponding regions in both the predicted and ground truth images are extracted through bitwise operations. This isolates the informative area and excludes the background, allowing error computation to focus solely on the regions that matter. Within this masked region, metrics such as MAE and Mean Squared Error (MSE) are calculated, providing a targeted assessment of model performance. The focused error is then incorporated into the overall loss function, increasing the influence of the ROI during training. This approach leads to higher restoration quality in the most crucial parts of the image where decodability is essential.
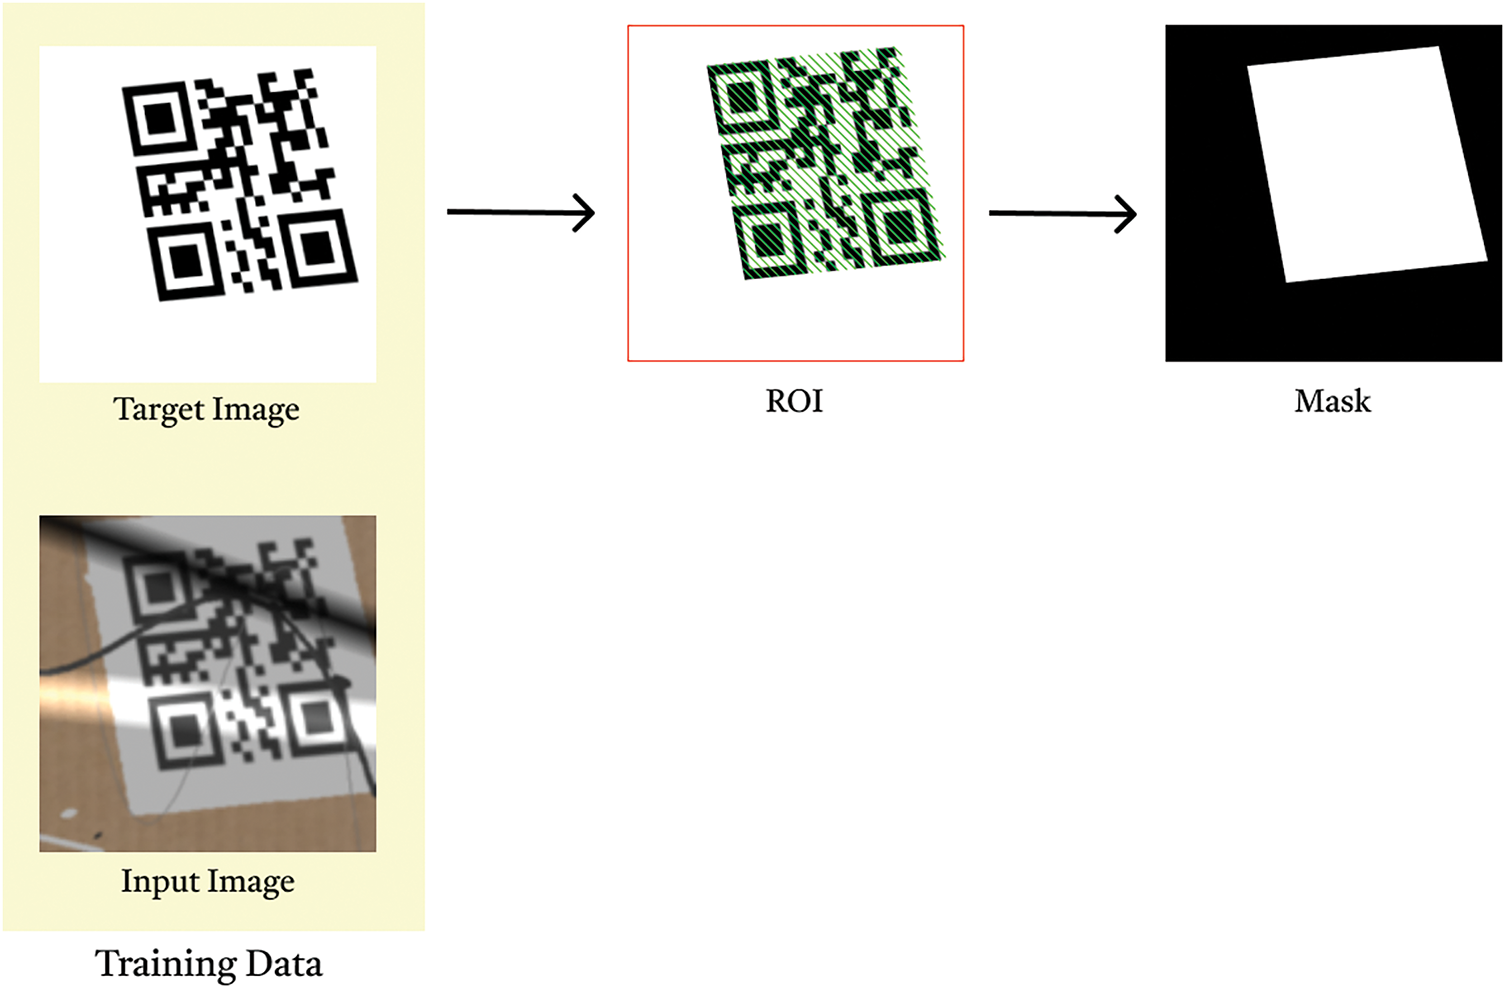
Figure 4: ROI detection and mask generation
The mean absolute error calculates only for the areas in the images covered by the barcode or QR code, emphasizing accuracy in these critical regions. The composite loss function then becomes “loss = MAE + FMAE + LSSIM”.
Here y is the true image and ŷ is the predicted image by the network model. Both y and ŷ are matrices of the same size (r, c), where r is the number of rows and c is the number of columns in the image matrix. Then the MAE loss function is described as in Eq. (5):
where
The FMAE loss function calculates the mean absolute error over a specific region of interest (ROI) in the image, as defined by a binary mask. This mask highlights the area where the loss should be computed, ignoring the rest of the image.
FMAE incorporates a binary mask M of the same size (r, c) as the image matrix, where Mij = 1 indicates a pixel (i, j) part of the ROI, and Mij = 0 indicates that it is not a part of the ROI (Eq. (6)). FMAE loss function is described as:
Given two images x and y of similar size r × c, the SSIM is calculated using the following Eq. (7):
Here C1 and C2 are constants used to stabilize the division with weak denominator values and are defined as in Eq. (8):
where L is the dynamic range of the pixel values, such as 255 for 8-bit grayscale images. K1 and K2 are small constants, for instance, K1 = 0.01 and K2 = 0.03.
The loss function associated with SSIM is described as in Eq. (9):
2.5 Dataset Generation Pipeline
Real datasets contain images of real-world barcodes under varying conditions. For example, one study used 3900 barcode images collected in logistics warehouse environments with industrial cameras to create a realistic dataset [13]. Similarly, researchers have created datasets consisting of barcode images captured with smartphone cameras [15]. Using these real-world datasets enhances the ability of trained models to handle various real-world perturbations. However, collecting and labeling real datasets can be time-consuming and costly, and extreme damage scenarios might not necessarily be encompassed, making them impractical for a wider range of applications.
Synthetic Datasets on the other hand address the limitations of real datasets, researchers often turn to algorithmically generated datasets. Using Python’s QR code library [11,18,24], it is possible to create a wide variety of barcode styles with desired error correction levels, code versions, and image sizes. This approach helps create a diverse dataset, preventing trained models from overfitting to specific barcode styles. By adding artificial distortions, synthetic datasets can be created to mimic real-world conditions, such as noise, blur, shadows, and whitening [21,22]. For example, one study used sigmoid and 2D Gaussian functions to simulate realistic shadow and whitening effects, respectively [21]. This technique allows trained models to improve their ability to cope with varying levels of distortion intensity.
Some studies have utilized the GOPRO dataset, which is widely used in image restoration tasks [12,17]. These datasets often contain images that mimic realistic blur effects, such as camera motion blur, making them suitable for training models for barcode and QR code image restoration. While creating synthetic datasets is often more cost-effective and efficient, they may not perfectly capture all the characteristics and variations of real-world data. As a result, many research efforts adopt a hybrid approach that offers the best of both worlds [15]. These hybrid datasets incorporate real-world barcode images and Python’s QR code library extracts [11,18,24], combined with synthetic distortions added using OpenCV and Pillow (PIL) libraries [16], resulting in more robust and generalizable deep learning models.
The quality and relevance of the dataset significantly impact the performance of trained deep learning models. Datasets should reflect the real-world scenarios the model is intended for. Using a combination of real and synthetic data leverages the advantages of both approaches. Real data provides authentic samples, while synthetic data allows for controlled introduction of specific degradations and variations, enhancing the model’s robustness. Synthetic datasets offer a cost-effective and efficient way to generate large amounts of data [15,27], although they may not fully reflect all the characteristics of real-world data [28]. As a result, the ideal training dataset for deep learning models is a combination of both real and synthetic data. This approach allows for the creation of a diverse and large dataset that comprehensively addresses real-world conditions while also covering a wide range of perturbation levels and difficulties.
The effectiveness of a deep learning model is significantly influenced by the quality and realism of its training data. For our barcode image restoration model tailored to logistics applications, the emphasis has been on generating a highly realistic synthetic dataset that simulates extreme cases of barcode and QR code damage commonly encountered in logistics operations.
Various studies have identified common causes of unreadable barcodes, including issues such as low contrast, quiet zone violations, improper reading positions, print inconsistencies, and physical damage or distortion. This comprehensive understanding guided our augmentation strategy, ensuring that our synthetic dataset accurately reflects real-world scenarios.
The pipeline begins with generating random strings, which are then encoded into the desired barcode or QR code format. To mimic real-life conditions, each image contains a single barcode occupying a significant portion of the frame, similar to images from previous detection stages.
In this study, a wide range of augmentation techniques were applied to create realistic representations of damaged barcodes:
● Geometric transformations:
○Random horizontal and vertical flip: To simulate mirrored images.
○ Random 3D re-projection: Adjusting perspective to mimic viewing angles.
○ Random rotation: Up to 180 degrees to represent tilted images.
○ Random zoom out: To include surrounding context.
○ Random shift: To simulate misaligned captures.
●Background alterations:
○ Random background color changes: To reflect various lighting conditions.
○ Random background texture changes: To include different surfaces.
●Physical damage simulations:
○ Adding random curve and straight lines: To simulate scratches or scribbles.
○ Adding blobs: To mimic stains or blotches.
○ Adding text: To represent overlaid information or labels.
○ Adding glare and shadows: To simulate light reflections and obstructions.
●Image quality modifications:
○ Random color saturation and brightness changes: To simulate varying lighting conditions.
○ Random blur: To mimic out-of-focus images.
○ Adding gaussian noise: To represent sensor noise.
○ Random intensity range changes: To simulate contrast variations.
○ Random resolution reduction: To mimic low-quality images.
The augmentations are controlled by parameters and probabilities defined in a JSON settings file (Table 1). These settings ensure a diverse range of augmentations, primarily focusing on extreme cases to robustly train the model.
Here two distinct groups of datasets were generated-one for 1D barcodes and another for QR codes. The dataset sizes are as follows:
• 1D Barcode Training set: 10,000 samples
• 1D Barcode Validation set: 600 samples
• QR Code Training set: 11,000 samples
• QR Code Validation set: 700 samples
This pipeline ensures the generation of a highly realistic and diverse synthetic dataset, essential for training a robust barcode image restoration model capable of handling a wide range of real-world damages and distortions.
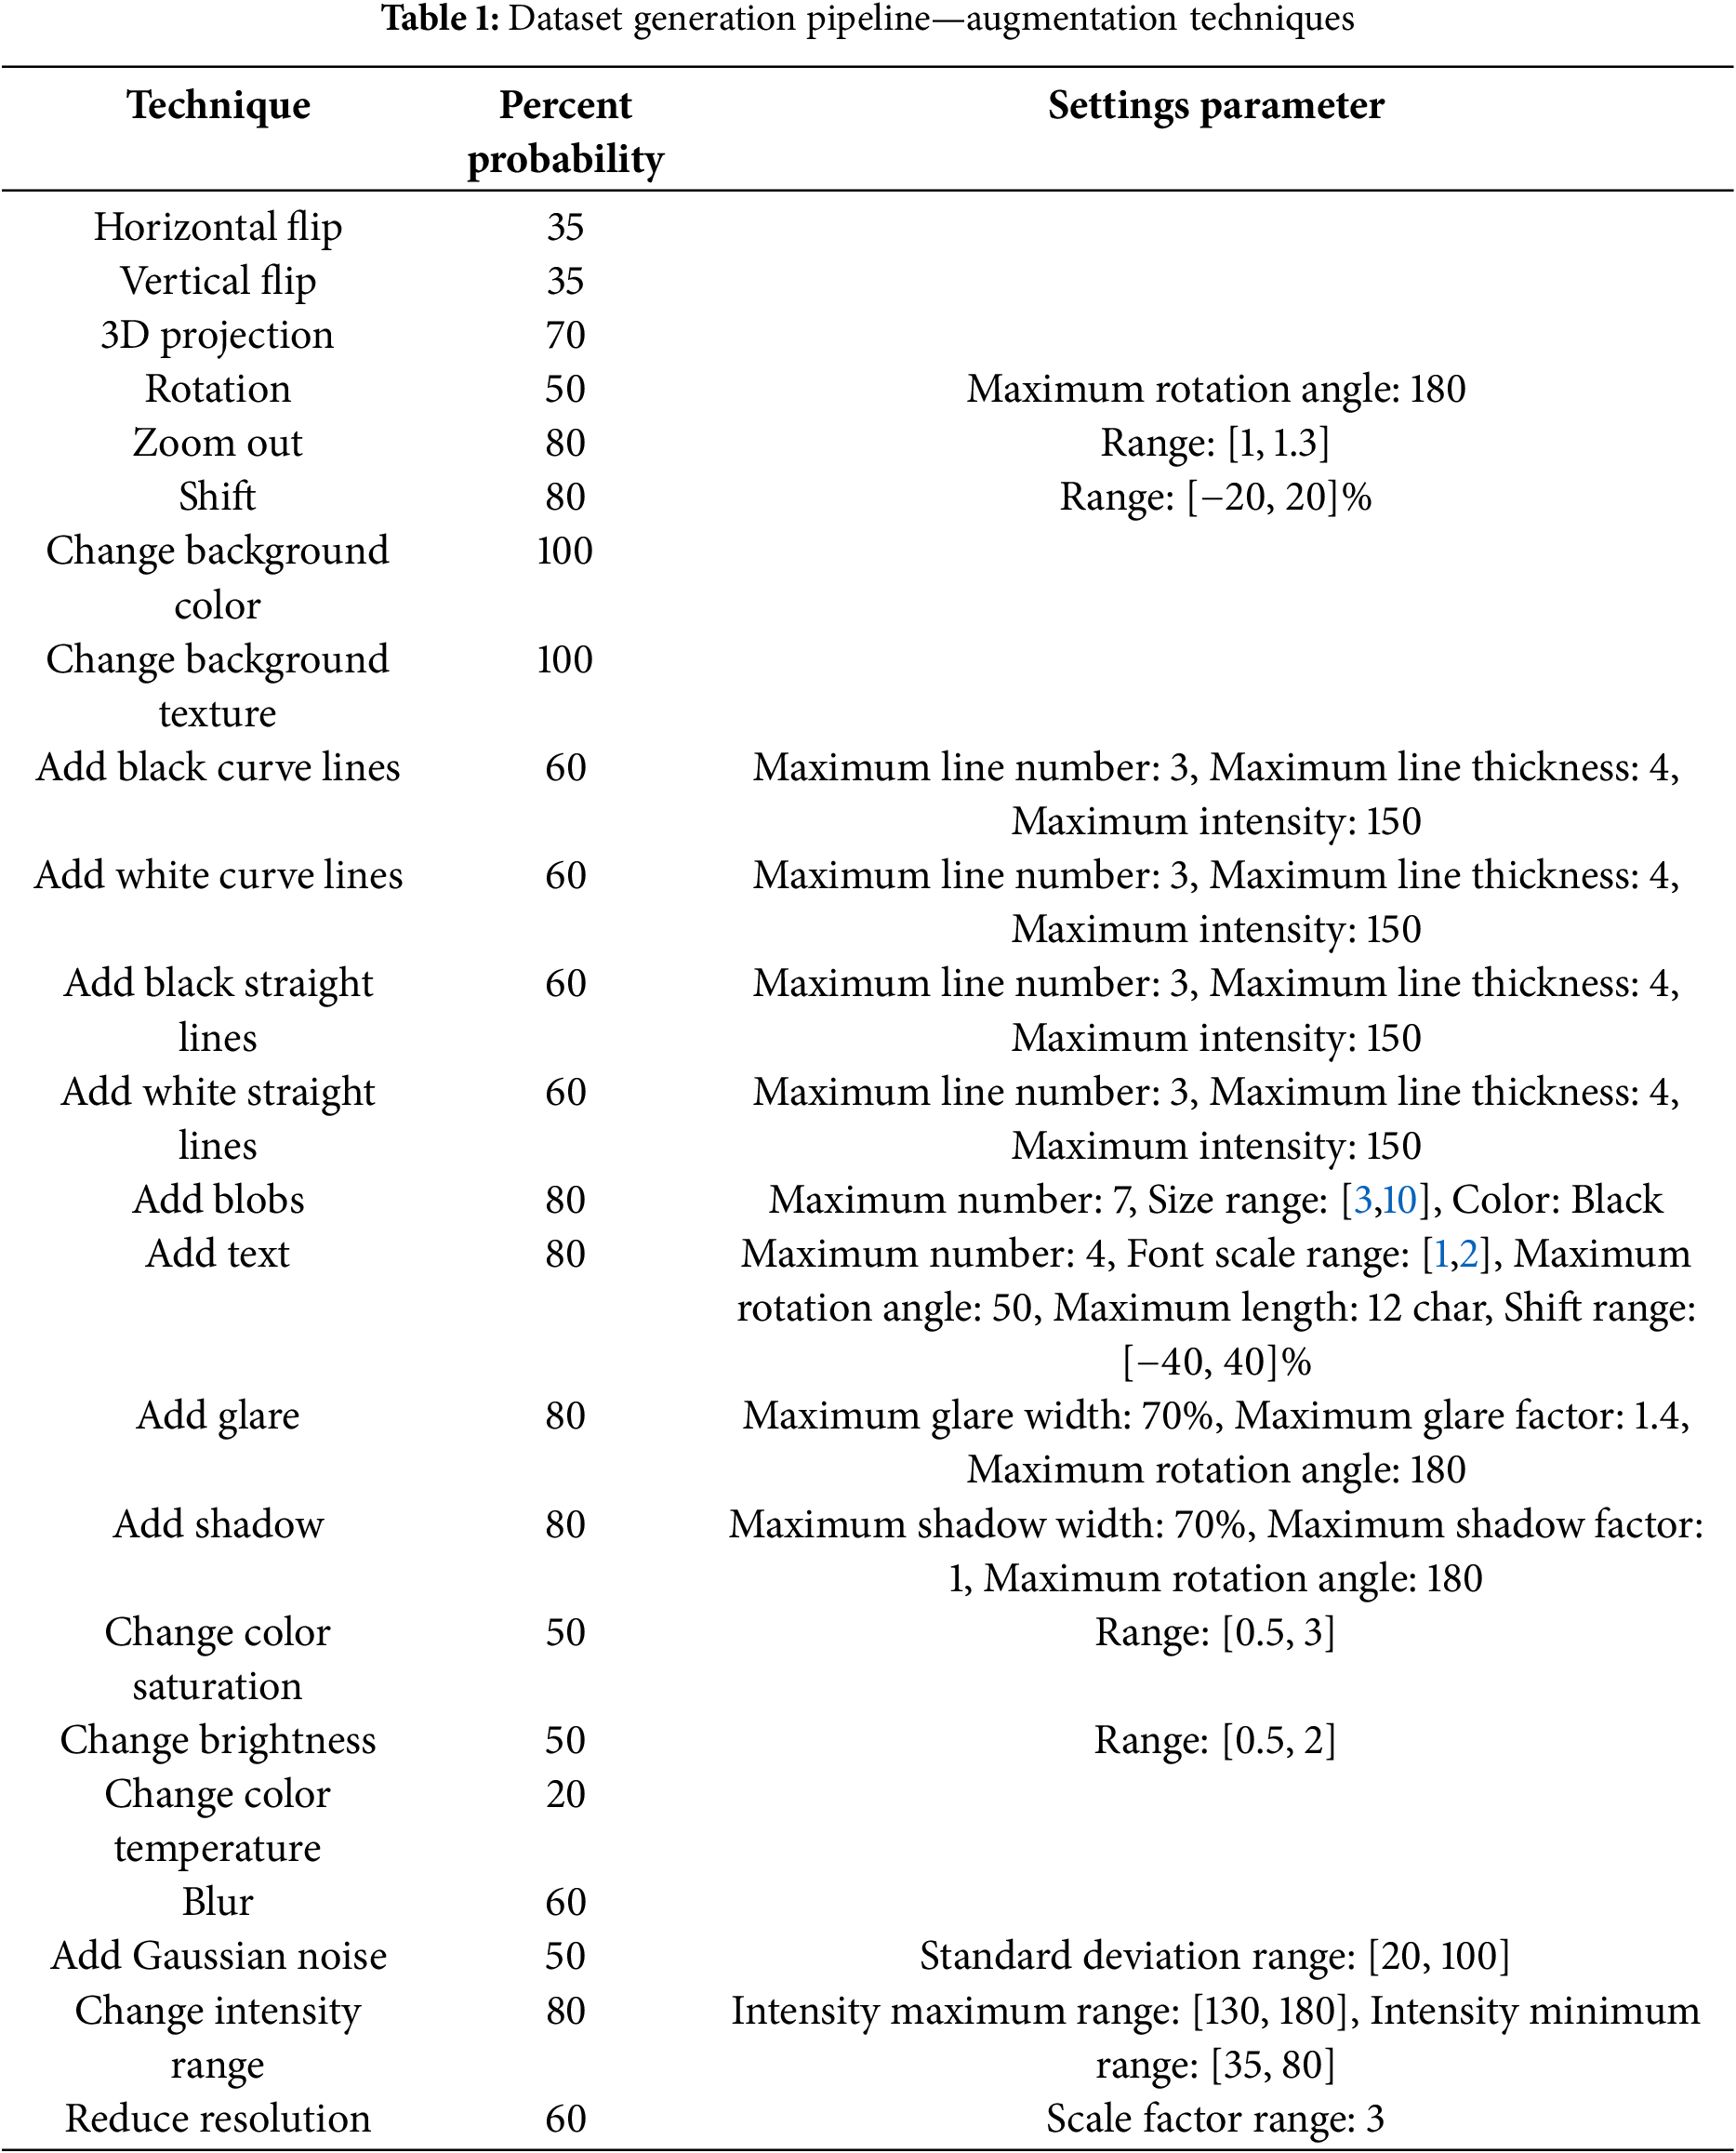
Below are some sample images showcasing the generated damaged 1D barcodes (Fig. 5) and QR codes (Fig. 6).
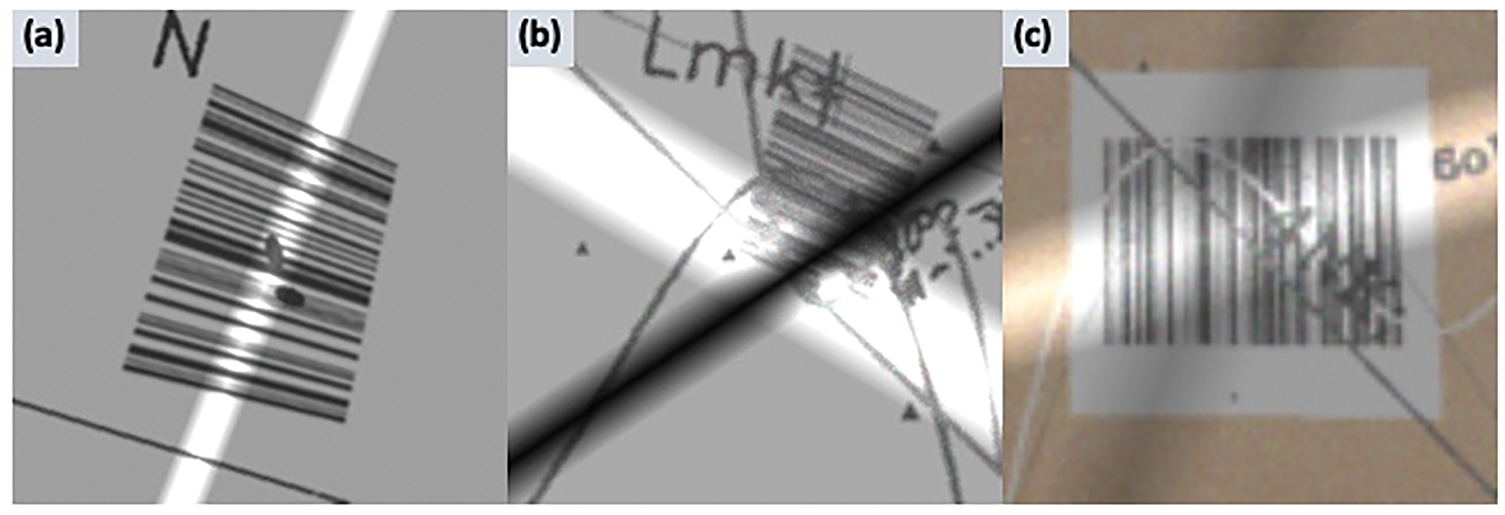
Figure 5: Damaged 1D barcode images generated through random variations and degrees of fault augmentations. (a) Sample 1, (b) sample 2, (c) sample 3
Figure 6: Damaged QR code images generated through random variations and degrees of fault augmentations. (a) Sample 1, (b) sample 2, (c) sample 3
3 Experimental Setup and Results
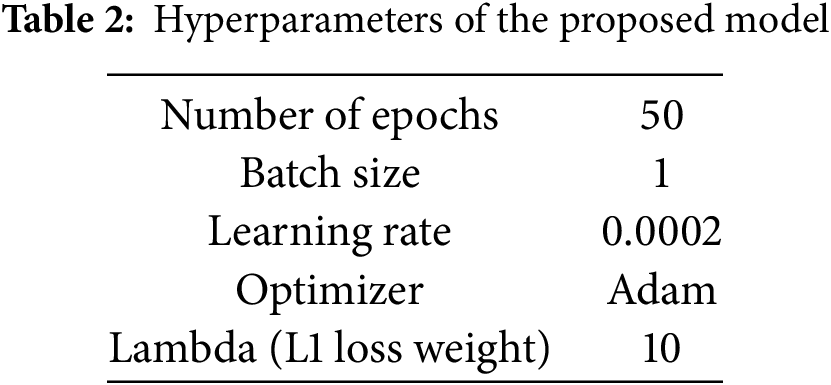
Two separate models were trained independently: one for QR code restoration and the other for 1D barcode restoration. Each model was trained from scratch on its respective dataset using the same set of hyperparameters (Table 2).
For both models, the training process exhibited consistent behavior. The generator and discriminator losses stabilized after approximately 40 epochs, indicating convergence. Additionally, the validation loss closely followed the training loss, suggesting that both models generalized well to unseen data and did not overfit.
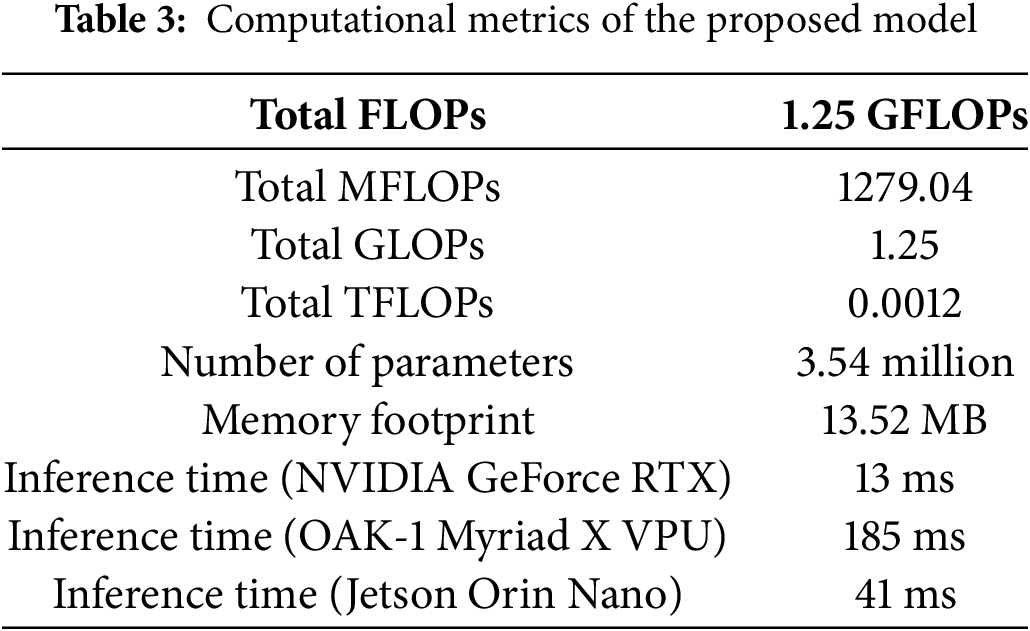
The computational metrics of the proposed model demonstrate its efficiency and effectiveness in performing complex tasks, even when tested on an NVIDIA GeForce RTX 2080 Ti GPU with TensorFlow and without any additional optimization strategies. The model requires a total of 1.25 GFLOPs, reflecting a relatively low computational cost for its operations (Table 3). It consists of 3.54 million parameters, balancing model complexity and performance. The memory footprint is modest at 13.52 MB, indicating that the model is lightweight and suitable for deployment in memory-constrained environments. Additionally, the inference time is just 13 ms, enabling real-time or near-real-time performance in practical applications, such as logistics, that require instant barcode and QR code scanning.
The model was evaluated on both 1D barcodes and QR codes using a custom synthetic dataset that simulates various types of damage commonly encountered in logistics. The primary evaluation metric for this study is the decodability rate, which measures the ability of the restored image to be accurately decoded by a barcode reader. This metric is crucial, as it directly affects the usability of the restored barcode in real-world scenarios. While other metrics, such as MAE, MSE, SSIM, and Peak Signal-to-Noise Ratio (PSNR), provide insights into the similarity between the restored and original images, decodability is the most critical, as even small errors in key areas of the barcode can render it unreadable.
The model’s performance was evaluated using several key metrics: MAE, MSE, FMAE, Focused Mean Squared Error (FMSE), SSIM, and PSNR. Each metric offers a unique perspective on the quality of the restored images, providing a comprehensive assessment of the model’s effectiveness.
Mean absolute error (MAE): Measures the average absolute difference between the original and restored images, with a lower value indicating better performance.
Mean squared error (MSE): Provides a measure of the squared differences between the original and restored images, with lower values indicating higher restoration quality.
Focused MAE (FMAE) and Focused MSE (FMSE): These metrics are calculated specifically over the barcode areas, highlighting accuracy in the most critical regions of the image.
Structural similarity index (SSIM): Assesses the similarity between the original and restored images in terms of structure and luminance, with values closer to 1 indicating greater similarity.
Peak signal-to-noise ratio (PSNR): Evaluates the quality of the restored images by measuring the ratio between the maximum possible signal power and the power of the corrupting noise, with higher values indicating better quality.
The 1D Barcode Training initially had a low decodability percentage of only 7%, indicating that most of the barcodes were unreadable or difficult to decode (Table 4). However, after applying a restoration process, the decodability significantly increased to 73%. This improvement of 66% demonstrates the effectiveness of the restoration methods in enhancing the readability and accuracy of barcode decoding in the dataset.
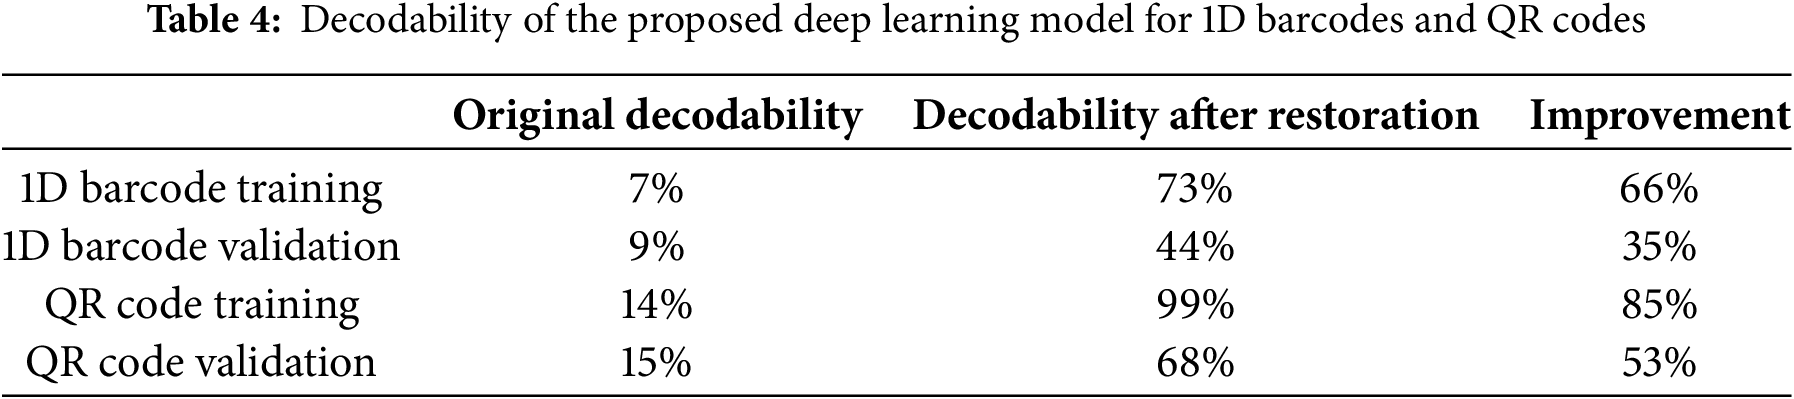
The 1D Barcode validation results show a notable improvement in decodability after restoration efforts. Initially, the barcodes had a decodability percentage of just 9%, indicating that a vast majority were difficult to read accurately (Table 4). After applying restoration techniques, the decodability increased to 44%, marking a 35% improvement.
The QR code training dataset experienced a significant improvement in decodability after restoration efforts (Table 4). Initially, the decodability percentage was a mere 14%, indicating that most QR codes were challenging to decode accurately. After applying restoration techniques, the decodability dramatically increased to 99%, representing an 85% improvement.
The QR code validation results highlight a considerable improvement in decodability after the restoration process was applied (Table 4). Initially, the decodability percentage was only 15%, indicating that a majority of the QR codes were difficult to decode successfully. After undergoing restoration, the decodability increased to 68%, reflecting a 53% improvement.
The deep learning model’s validation performance on the barcode dataset, consisting of 600 samples, demonstrates its ability to generalize, though with slightly lower accuracy than in training (Table 5). The model achieved an average MAE of 0.019 and a MSE of 0.005, while the focused errors were somewhat higher, with a MAE focused average of 0.064 and MSE focused average of 0.016. The SSIM average was 0.97, with an SSIM error average of 0.028, indicating that the restored barcodes are generally similar to the original ones, albeit with minor discrepancies. The PSNR average stood at 32.80, signifying good reconstruction quality, though slightly lower than in the training phase.
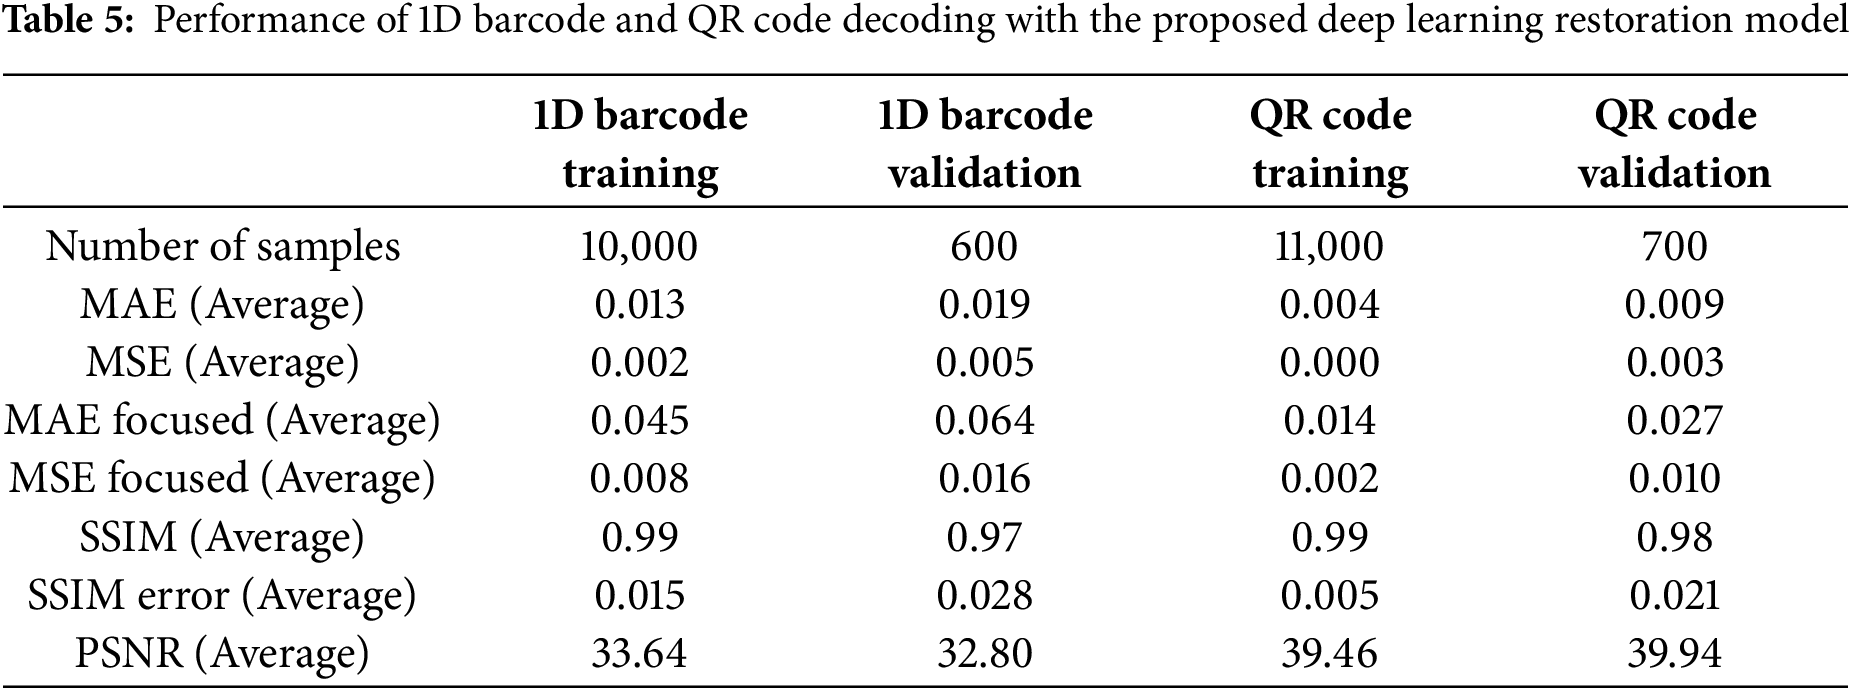
For the QR code train dataset, comprising 11,000 samples, the deep learning model exhibited outstanding performance in enhancing the quality and readability of QR codes (Table 5). The model achieved an impressively low average MAE of 0.004 and a near-zero MSE of 0.001, with slightly higher focused errors (MAE focused average of 0.014 and MSE focused average of 0.002). The high SSIM average of 0.99 and a very low SSIM error average of 0.005 demonstrate that the restored QR codes are nearly identical to the original ones. Additionally, the model achieved an excellent PSNR average of 39.46, indicating superior reconstruction quality.
The deep learning model’s validation performance on the QR code dataset, consisting of 700 samples, indicates robust generalization capability, though with some decline compared to the training phase (Table 5). The model achieved an average MAE of 0.009 and a MSE of 0.003, while the focused errors were slightly higher, with a MAE focused average of 0.027 and MSE focused average of 0.010. SSIM average was 0.98, with an SSIM error average of 0.021, reflecting high similarity between the restored and original QR codes but with some minor deviations. PSNR average was 39.94, suggesting excellent reconstruction quality, even slightly surpassing the training phase in this regard.
3.3.3 Visual Examples and Qualitative Results
The results for the two models developed for 1D barcode and QR codes were impressive, with both models effectively cleaning the images. Sample inputs of damaged barcodes, the expected targets, and the predicted output images, along with MAE rates, are presented in the following Figs. 7 and 8. Deep learning-based decoding of 1D barcode examples resulted in MAE rates ranging from 1.6% to 2.6%, while SSIM were between 96% and 98% (Fig. 7).
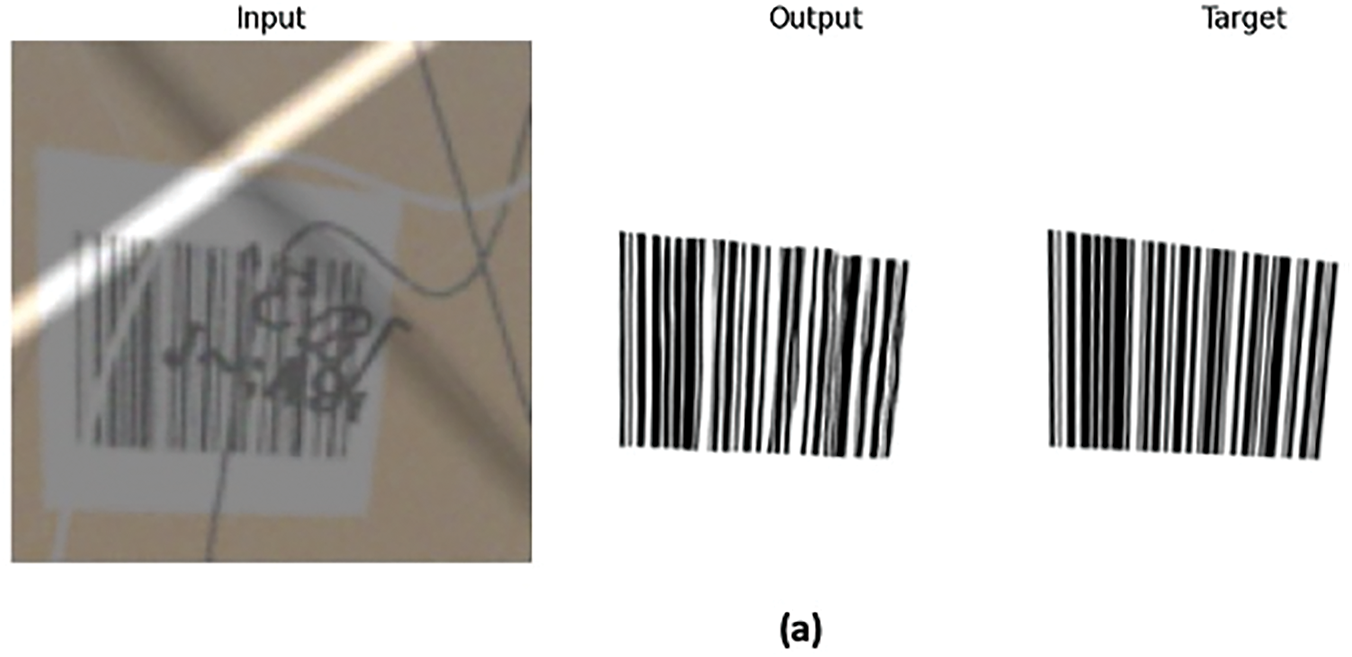
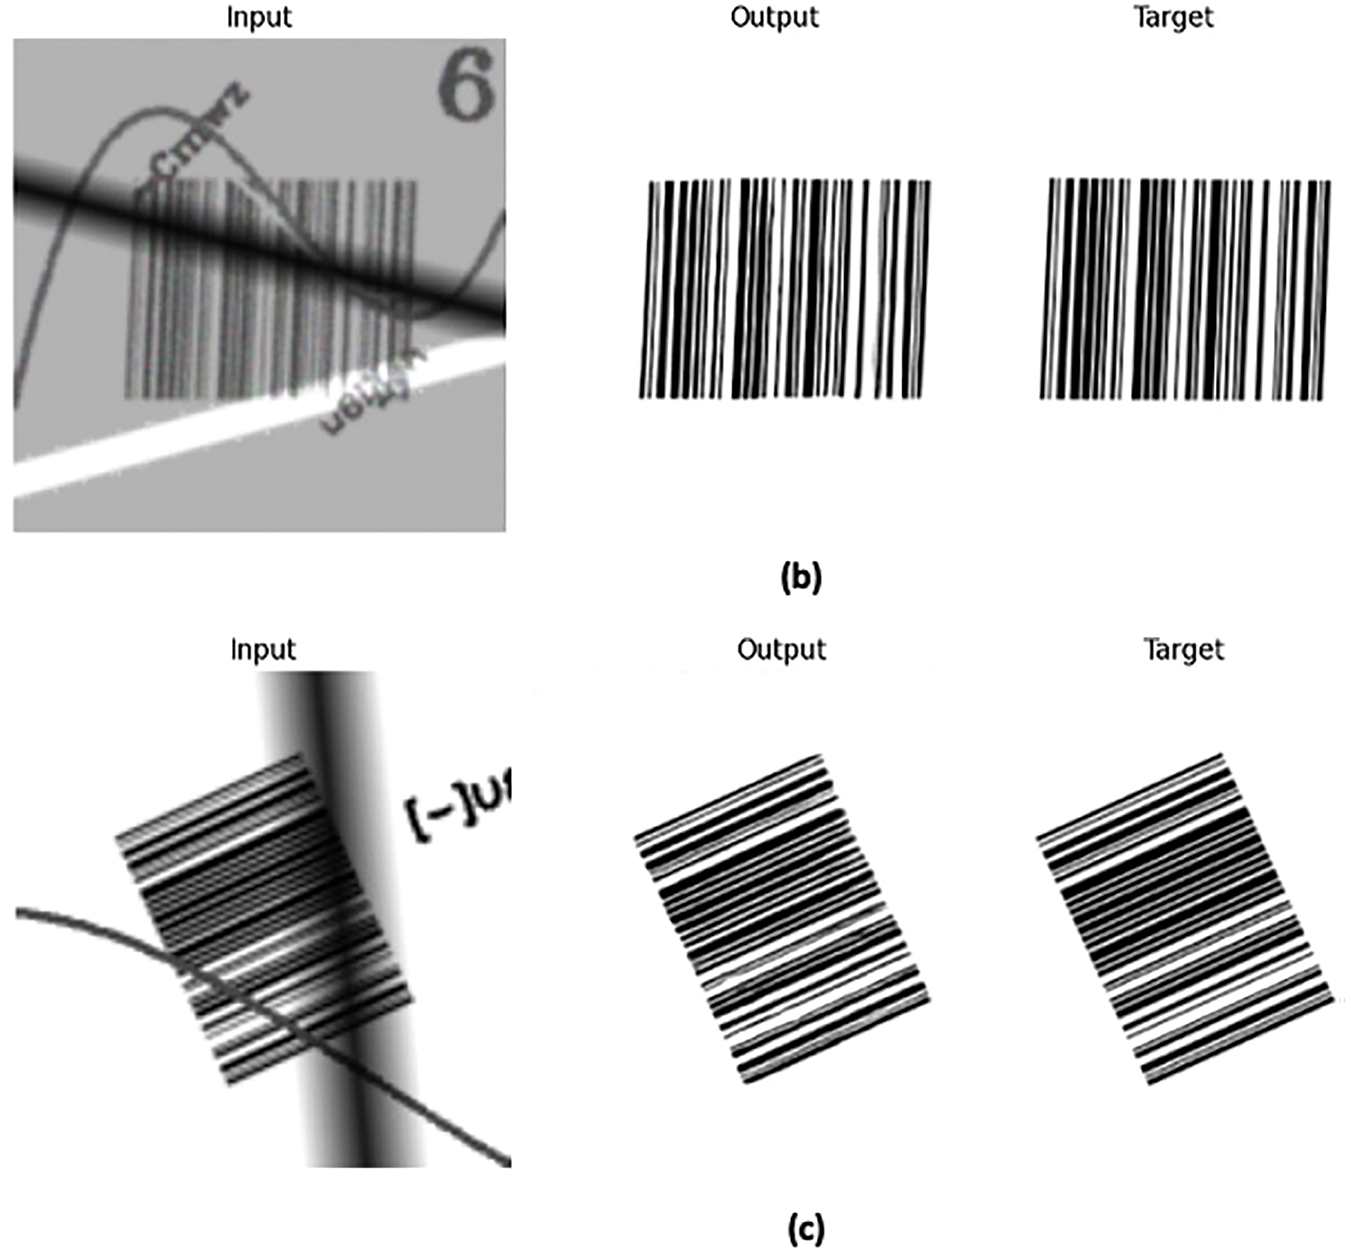
Figure 7: Application of deep learning for decoding 1D Barcodes and associated MAE rates. (a) MAE = 0.026, SSIM = 0.96 (b) MAE = 0.023, SSIM = 0.97 (c) MAE = 0.016, SSIM = 0.98
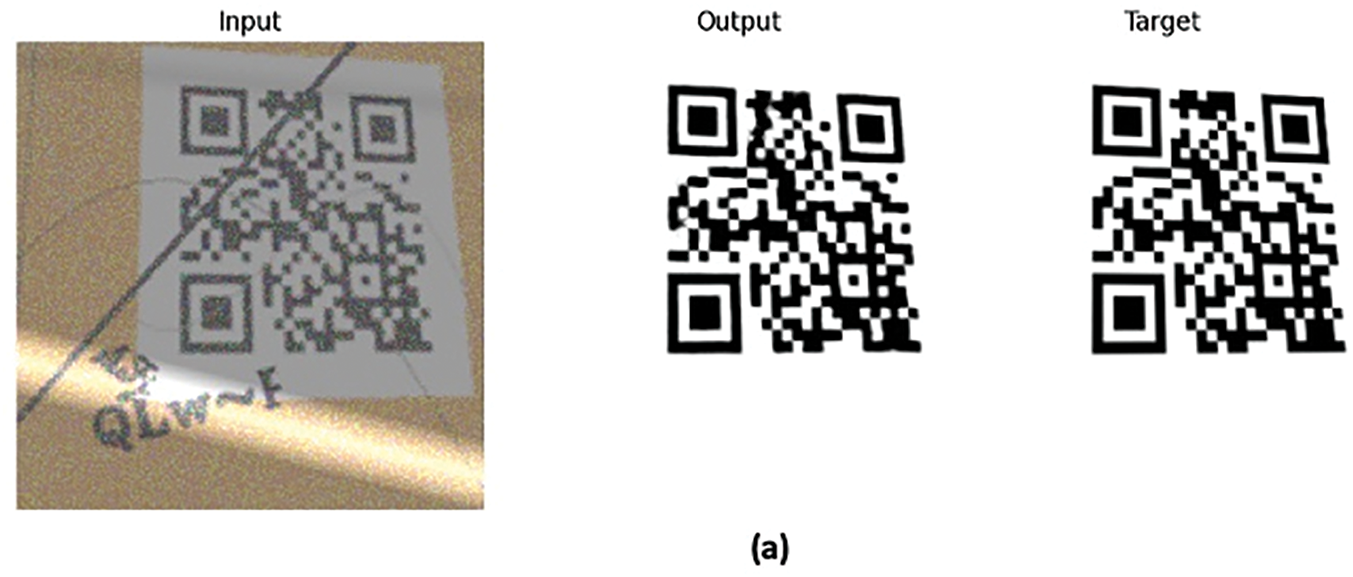
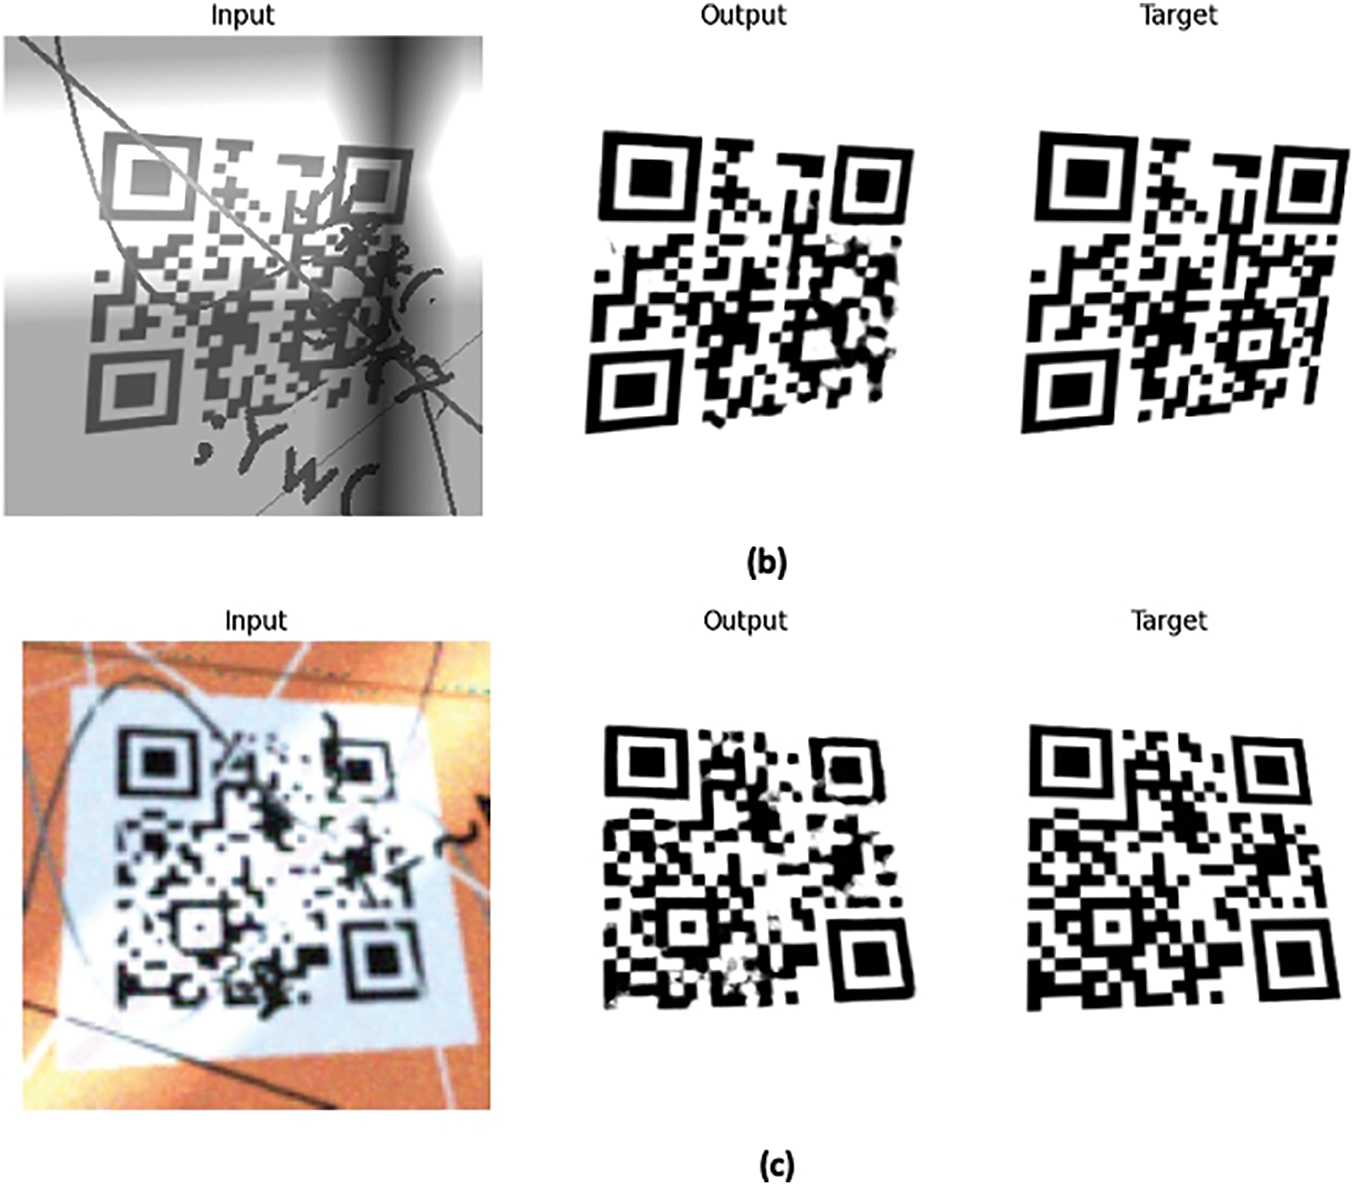
Figure 8: Application of deep learning for decoding QR codes and associated Mean Absolute Error rates. (a) MAE = 0.013, SSIM = 0.98, (b) MAE = 0.018, SSIM = 0.96, (c) MAE = 0.032, SSIM = 0.93
Deep learning-based decoding of QR code examples produced MAE rates ranging from 1.3% to 3.2%, with SSIM ranging from 93% to 98% (Fig. 8).
To evaluate improvements in decodability, a real-world dataset was created. Random barcodes and QR codes were printed and intentionally damaged using manual methods. For simplicity, three damage techniques were employed:
• Writing over the codes
• Scratching the codes
• Applying paint blobs
These methods were designed to make the codes initially undecodable
Images of the damaged codes were captured using an OAK-1 camera, with 30 images collected for each type (barcode and QR code). These images were then used to test the performance of the proposed restoration model. The results demonstrated a substantial improvement in decodability:
QR codes: decodability increased from 0% to 90%.
Barcodes: decodability increased from 0% to 73%.
The accompanying figure presents example images from the dataset alongside their restored counterparts, highlighting the effectiveness of the model (Fig. 9).
Figure 9: Real-time demonstration of 1D barcode and QR code restoration: (a) barcode input, (b) barcode restored, (c) QR code input, (d) QR code restored
4.1 Visual Metrics and Decodability
Overall, the proposed model demonstrates strong performance in restoring damaged barcode and QR code images. Clear improvements are observed across all evaluated metrics on both the training and validation datasets. Notably, the model achieves low MAE and FMAE, reflecting accurate restoration in both general image areas and barcode-specific regions. Most importantly, decodability, the primary objective of this work, shows substantial improvement following restoration, particularly on the training data.
When comparing training and validation results, MAE and FMAE values remain relatively close, though the validation values are consistently higher. This indicates that the model generalizes well in terms of visual reconstruction, albeit with slightly better performance on the training data. However, the decodability results reveal a more significant disparity. For instance, QR code decodability increases from 14% to 99% on the training set, but only from 15% to 68% on the validation set. A similar trend is observed for 1D barcodes. At first glance, this discrepancy might suggest overfitting. However, this is not the case. Both the training and validation datasets were generated using the same augmentation pipeline and parameters, with no intentional distributional differences. Therefore, the performance gap cannot be attributed to dataset mismatch or conventional overfitting. Instead, it underscores a more fundamental challenge: visual similarity does not necessarily ensure functional decodability.
Even when restored images appear visually accurate, as indicated by low MAE or high SSIM, they may still be undecodable if minor errors occur in structurally critical regions, such as alignment patterns, timing lines, or quiet zones. These elements are essential for successful decoding, and even slight distortions imperceptible to the human eye can disrupt machine readability. This sensitivity explains why decodability often lags behind traditional visual metrics and highlights the need for evaluation methods that extend beyond general image quality. This insight also exposes a limitation in prior research. Most existing studies on barcode and QR code restoration report metrics such as SSIM, PSNR, or MAE, which assess visual similarity but do not capture actual decodability. Consequently, models may appear to generalize well while failing in practical scenarios where machine readability is critical. By prioritizing decodability as a core evaluation metric, this study provides a more realistic and application-oriented assessment of restoration performance.
To better align visual quality with decoding success, future work could integrate decodability directly into the loss function, either by introducing a decoding-aware term or by assigning greater weight to structurally critical regions. One promising strategy involves explicitly identifying key areas, such as alignment patterns, timing lines, and quiet zones, and applying a targeted loss to those regions. A complementary approach would enhance the data augmentation pipeline by more frequently introducing damage to these sensitive areas during training. This would encourage the model to focus on restoring the components most essential for decodability, thereby narrowing the gap between visual quality and functional performance. Collectively, these insights underscore both the strengths of the proposed model and the inherent challenges in achieving full decodability in real-world scenarios, laying a foundation for future advancements in barcode restoration systems.
4.2 Generalization to Real-World Scenarios
A key aspect of the evaluation on the real-world dataset is that the restoration model was trained exclusively on synthetically generated data. Despite this, it performed remarkably well on real-world damaged codes, achieving high decodability rates on the test set. This demonstrates strong generalization capabilities, as the model successfully transferred knowledge from synthetic distortions to complex, real-life damage patterns it had never encountered during training. The higher recovery rate observed for QR codes can be attributed to their structural redundancy and built-in error correction, which complement the restoration model and enhance overall readability. While 1D barcodes are more susceptible to damage due to their simpler design, they still showed substantial improvements, albeit to a slightly lesser degree. These findings validate the effectiveness of using synthetic data for training, especially when collecting real-world data is costly or time-consuming. Moreover, they highlight the practical potential of such models in real-world scenarios where physical codes are frequently exposed to wear and tear-such as in logistics, manufacturing, retail, and outdoor labeling. Overall, the results underscore that a model trained solely on synthetic damage can successfully restore real-world visual codes, reducing data loss and improving robustness in everyday applications.
4.3 Limitations and Future Directions
The current training process employs a loss function designed to optimize visual similarity between the generated output and the ground truth image. While this effectively guides the model toward producing visually accurate reconstructions, it does not directly account for decodability; the ability of the restored code to be successfully read by a scanner. As a result, even when the model achieves high similarity scores, such as SSIM or MAE, the output may still fail to decode if critical regions of the QR code or barcode are not accurately restored. This underscores an important distinction: visual similarity does not always equate to functional performance. Certain small but essential regions, such as alignment patterns, timing patterns, or quiet zones are particularly sensitive to distortion, and even minor errors in these areas can render the entire code unreadable. To overcome this limitation, future work could incorporate decodability directly into the loss function, either by introducing a decoding-aware term or by assigning greater weight to critical structural regions. One potential strategy involves identifying these key areas and applying a focused loss, akin to a region-based attention mechanism. A complementary approach would be to enhance the data augmentation pipeline by more frequently introducing damage to these sensitive regions during training. This would encourage the model to learn how to restore the parts of the code that have the greatest impact on decodability.
5 Comparison with Previous Works
To the best of our knowledge, there are no existing models in the literature that directly address the specific problem we tackle: restoring heavily damaged barcodes and QR codes to improve decodability in real-world logistics scenarios. Most prior work focuses on general image restoration tasks, such as denoising, deblurring, or super-resolution or targets barcode deblurring under controlled conditions. These approaches were developed with different objectives and evaluated on datasets that differ significantly from our study in terms of content, damage severity, and practical context. Due to these fundamental differences in both the task and evaluation setup, retraining or directly comparing against these models would not yield meaningful insights. However, for reference and to provide broader context, results from two representative studies in the field are summarized in the following Table 6.
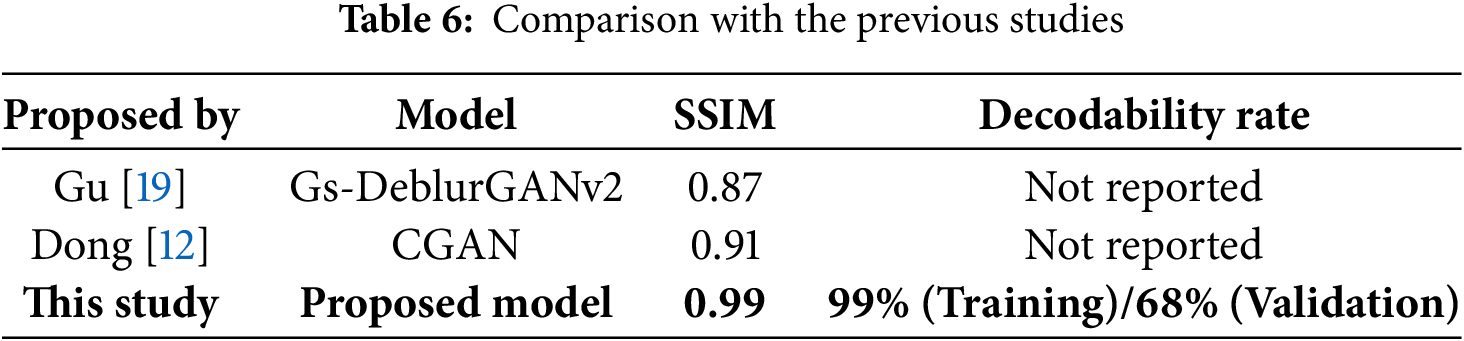
While these models exhibit strong performance in terms of SSIM, they do not report decodability; a key metric for our application. In contrast, our proposed model not only achieves a high SSIM score but also demonstrates a robust decodability rate, which is particularly noteworthy given the severity of damage present in our dataset.
This study tackles the practical challenge of restoring damaged barcodes and QR codes, a common issue in logistics and automation systems where code readability directly impacts operational efficiency. To address this, we propose a lightweight deep learning model based on the Pix2Pix framework, trained on a comprehensive synthetic dataset designed to simulate a wide range of realistic damage scenarios.
The model achieved substantial improvements in decodability, boosting QR code readability from 14% to 99% on the training set and from 15% to 68% on the validation set. For 1D barcodes, decoding accuracy increased from 7% to 73% on training data and from 9% to 44% on validation data. These results highlight the model’s ability to deliver both visually and functionally restored codes while maintaining a lightweight design, making it well-suited for real-time deployment in embedded logistics systems.
A key contribution of this work is the development of a lightweight deep learning model capable of efficiently restoring damaged barcodes and QR codes, making it suitable for real-time, embedded applications. Additional contributions include the creation of a realistic synthetic dataset that replicates a wide range of severe damage scenarios, the use of region-focused loss functions such as FMAE to emphasize structurally critical areas, and the introduction of decodability as a primary evaluation metric. Together, these elements enable the model to deliver strong restoration performance and generalize effectively to real-world data, despite being trained exclusively on synthetic inputs.
The model’s strong performance on real-world damaged codes confirms the effectiveness of the synthetic dataset design. However, a noticeable gap remains between training and validation decodability, reflecting the high sensitivity of decoding algorithms to subtle distortions. This highlights the need for restoration models that move beyond visual similarity and explicitly optimize for decoding success.
The main limitation of this study is that the model is not explicitly optimized for decodability. While the loss function incorporates focused visual metrics such as FMAE to emphasize structurally important regions, it lacks a decoding-aware component. As a result, minor visual inaccuracies in critical areas can still lead to decoding failures. Another limitation is the exclusive reliance on synthetic data for training. Although the synthetic dataset was designed to be diverse and realistic, it may not fully capture the complexity and unpredictability of real-world barcode damage.
Future research should explore decoding-aware loss functions, region-sensitive optimization techniques, and more advanced augmentation strategies that simulate targeted damage to high-impact regions. Expanding real-world testing and incorporating decoding feedback into the training loop could further enhance the model’s generalization and reliability.
In summary, this work presents a practical and effective foundation for barcode and QR code restoration under realistic conditions, paving the way for more decoding-focused, deployable solutions in logistics and other application domains.
Acknowledgement: The authors extend their heartfelt gratitude to Doç. Dr. Kenan Istanbullu, CEO of TEM, for his invaluable guidance and unwavering support throughout the project. They also wish to thank Prof. Dr. Ovunc Polat, the TUBITAK project referee, for his insightful feedback and diligent oversight during the progress evaluations.
Funding Statement: This work was supported by the Scientific and Technological Research Council of Turkey (TÜBİTAK) through the Industrial R&D Projects Grant Program (TEYDEB) under Project No. 3211077 (grant recipient: Metin Kahraman). For more information, please visit the sponsor’s website: https://www.tubitak.gov.tr/ (accessed on 22 May 2025).
Author Contributions: The authors confirm their contributions to the paper as follows: study conception and design: Tarek Muallim, Haluk Kucuk; data collection and dataset creation: Tarek Muallim; data curation and preprocessing: Tarek Muallim, Muhammet Bareket; software development and model training: Tarek Muallim; analysis and interpretation of results: Tarek Muallim; experimentation: Muhammet Bareket, Metin Kahraman; validation and methodology: Muhammet Bareket; visualization: Haluk Kucuk; draft manuscript preparation: Haluk Kucuk; review and editing: Tarek Muallim, Muhammet Bareket; manuscript formatting and submission: Tarek Muallim, Haluk Kucuk; supervision, project administration, and funding acquisition: Metin Kahraman. All authors reviewed the results and approved the final version of the manuscript.
Availability of Data and Materials: Due to company copyright restrictions, the complete dataset generation pipeline and the trained models cannot be shared. However, a subset of the training dataset will be made publicly available on the Kaggle website.
Ethics Approval: Not applicable. This study did not involve the use of human participants or animal subjects.
Conflicts of Interest: The authors declare no conflicts of interest to report regarding the present study.
References
1. Ayres RU. The history and future of technology: can technology save humanity from extinction? Cham, Switzerland: Springer Nature; 2021. [Google Scholar]
2. Aktaş C. The evolution and emergence of QR codes. Newcastle, UK: Cambridge Scholars Publishing; 2017. [Google Scholar]
3. Introduction to industrial barcode reading. [Internet]. [cited 2025 May 22]. Available from: https://www.cognex.com/what-is/industrial-barcode-reading. [Google Scholar]
4. Chen W, Li Q, Tang X, Pan Q. A digital watermarking method for medical images resistant to print-scan based on QR code. Multimed Tools Appl. 2024;83(17):52197–218. doi:10.1007/s11042-023-17155-2. [Google Scholar] [CrossRef]
5. Kocaoglu B. Data collection technologies in logistics. In: Logistics information systems: digital transformation and supply chain applications in the 4.0 era. Cham, Switzerland: Springer Nature; 2024. p. 181–217. [Google Scholar]
6. Latha YM, Rao BS. Advanced denoising model for QR code images using hough transformation and convolutional neural networks. Trait Signal. 2023;40(3):1243–9. [Google Scholar]
7. Varallyai L. From barcode to QR code applications. J Agric Inform. 2012;3(2):9–17. [Google Scholar]
8. Kato H, Tan KT, Chai D. Barcodes for mobile devices. Cambridge, UK: Cambridge University Press; 2010. [Google Scholar]
9. Zamberletti A, Ignazio G, Simone A. Robust angle invariant 1D barcode detection. In: 2013 2nd IAPR Asian Conference on Pattern Recognition. 2013 Nov 5–8; Okinawa, Japan. p. 160–4. doi:10.1109/ACPR.2013.17. [Google Scholar] [CrossRef]
10. Sharif A, Jia J, Zhang J, Zhai G. Joint barcode and text orientation detection model for unmanned retail system. In: IEEE International Symposium on Circuits and Systems (ISCAS); 2020 Oct 12–14; Seville, Spain. p. 1–5. doi:10.1109/ISCAS45731.2020.9180932. [Google Scholar] [CrossRef]
11. Kumabuchi K, Kobayashi H. Proposal of a new approach using deep learning for QR code embedding. In: Proceedings of the 20th International Conference on Informatics in Control, Automation and Robotics (ICINCO); 2023 Nov 13–15; Rome, Italy. p. 342–5. doi:10.5220/0012238900003543. [Google Scholar] [CrossRef]
12. Dong H, Liu H, Li M, Ren F, Xie F. An algorithm for the recognition of motion-blurred QR codes based on generative adversarial networks and attention mechanisms. Int J Comput Int Sys. 2024;17(83):3–17. doi:10.1007/s44196-024-00450-7. [Google Scholar] [CrossRef]
13. Cui X, Sun T, Deng S, Xie Y, Deng L, Chen B. Unsupervised barcode image reconstruction based on knowledge distillation. In: Proceedings of the 3rd International Conference on Advanced Information Science and System; 2021 Nov 26–28; Sanya, China. p. 1–6. doi:10.1145/3503047.3503073. [Google Scholar] [CrossRef]
14. Vo DD, Nguyen DT, Nguyen HT, Ngo VB. Barcode image restoration for recognition of product information. Eur J Eng Tech Res. 2019;4(9):93–100. doi:10.24018/ejeng.2019.4.9.1522. [Google Scholar] [CrossRef]
15. Wudhikarn R, Charoenkwan P, Malang K. Deep learning in barcode recognition: a systematic literature review. IEEE Access. 2022;10(10):8049–72. doi:10.1109/access.2022.3143033. [Google Scholar] [CrossRef]
16. Wang C, Guevara N, Caragea D. Using deep learning to improve detection and decoding of barcodes. In: IEEE International Conference on Image Processing (ICIP); 2022 Oct 16–19; Bordeaux, France. p. 1576–80. doi:10.1109/ICIP46576.2022.9897371. [Google Scholar] [CrossRef]
17. Su J, Xu B, Yin H. A survey of deep learning approaches to image restoration. Neurocomputing. 2022;487(1):46–65. doi:10.1016/j.neucom.2022.02.046. [Google Scholar] [CrossRef]
18. Zheng J, Zhao R, Lin Z, Liu S, Zhu R, Zhang Z, et al. EHFP-GAN: edge-enhanced hierarchical feature pyramid network for damaged QR code reconstruction. Math. 2023;11(20):4349. doi:10.3390/math11204349. [Google Scholar] [CrossRef]
19. Gu W, Sun K, Jiang Z, Sun L. Gs-DeblurGANv2: a QR code deblurring algorithm based on lightweight network structure. Multimedia Syst. 2024;30(2):87. doi:10.1007/s00530-024-01292-1. [Google Scholar] [CrossRef]
20. Jin J, Wang K, Wang W. Research on restoration algorithm of two-dimensional degraded image based on deep learning. In: 2020 IEEE 5th Information Technology and Mechatronics Engineering Conference (ITOEC); 2020 Jun 12–14; Chongqing, China. p. 1144–8. doi:10.1109/ITOEC49072.2020.9141717. [Google Scholar] [CrossRef]
21. Ishikawa Y, Okazaki S, Ohta M. A method for removing shadows and white-outs on QR code images by deep learning. In: 2023 IEEE 12th Global Conference on Consumer Electronics (GCCE); 2023 Oct 10–13; Nara, Japan. p. 126–7. doi:10.1109/GCCE59613.2023.10315668. [Google Scholar] [CrossRef]
22. Okazaki S, Ohta M. QR code image refinement by deep learning. In: 2022 IEEE 11th Global Conference on Consumer Electronics (GCCE); 2022 Oct 18–21; Osaka, Japan. p. 726–7. doi:10.1109/GCCE56475.2022.10014313. [Google Scholar] [CrossRef]
23. Isola P, Zhu JY, Zhou T, Efros AA. Image-to-image translation with conditional adversarial networks. In: Proceedings of the 2017 IEEE Conference on Computer Vision and Pattern Recognition; 2017 Jul 21–26; Honolulu, HI, USA. p. 1125–34. doi:10.1109/CVPR.2017.632. [Google Scholar] [CrossRef]
24. Yi J, Chen J. Enhancement of two-dimensional barcode restoration based on recurrent feature reasoning and structural fusion attention mechanism. Electronics. 2024;13(10):1873. doi:10.3390/electronics13101873. [Google Scholar] [CrossRef]
25. Song K, Liu N, Gao Z, Zhang J, Zhai G, Zhang XP. Deep restoration of invisible QR code from TPVM display. In: IEEE International Conference on Multimedia & Expo Workshops (ICMEW); 2020 Jul 6–10; London, UK, pp. 1–6. doi:10.1109/ICMEW46912.2020.9105961. [Google Scholar] [CrossRef]
26. Zhai L, Wang Y, Cui S, Zhou Y. A comprehensive review of deep learning-based real-world image restoration. IEEE Access. 2023;11:21049–67. doi:10.1109/access.2023.3250616. [Google Scholar] [CrossRef]
27. Manettas C, Nikolakis N, Alexopoulos K. Synthetic datasets for deep learning in computer-vision assisted tasks in manufacturing. Proc CIRP. 2021;103(1):237–42. doi:10.1016/j.procir.2021.10.038. [Google Scholar] [CrossRef]
28. De Melo CM, Torralba A, Guibas L, DiCarlo J, Chellappa R, Hodgins J. Next-generation deep learning based on simulators and synthetic data. Trends Cogn Sci. 2022;26(2):174–87. doi:10.1016/j.tics.2021.11.008. [Google Scholar] [PubMed] [CrossRef]
Cite This Article
 Copyright © 2025 The Author(s). Published by Tech Science Press.
This work is licensed under a Creative Commons Attribution 4.0 International License , which permits unrestricted use, distribution, and reproduction in any medium, provided the original work is properly cited.
 Downloads
 Citation Tools