
 Submit a Paper
 Propose a Special lssue
 Open Access
ARTICLE

A Computational Model for Enhanced Mammographic Image Pre-Processing and Segmentation
1 Department of Anatomy, Faculty of Medicine, Najran University, Najran, 61441, Saudi Arabia
2 Artificial Intelligence and Cyber Futures Institute, Charles University, Bathurst, NSW 2795, Australia
3 Department of Electronic Engineering, The University of Larkano, Larkana, Sindh, 75660, Pakistan
4 Eletrical Engineering Department, Sukkur IBA University, Sukkur, Sindh, 65200, Pakistan
5 Computer Science Department, Sukkur IBA University, Sukkur, Sindh, 65200, Pakistan
6 Electrical Engineering Department, College of Engineering, Najran University, Najran, 61441, Saudi Arabia
7 Department of Computer Science, College of Computer Science and Information Systems, Najran University, Najran, 61441, Saudi Arabia
8 Radiological Sciences Department, College of Applied Medical Sciences, Najran University, Najran, 61441, Saudi Arabia
* Corresponding Authors: Toufique A. Soomro. Email: ; Muhammad Irfan. Email:
Computer Modeling in Engineering & Sciences 2025, 143(3), 3091-3132. https://doi.org/10.32604/cmes.2025.065471
Received 13 March 2025; Accepted 03 June 2025; Issue published 30 June 2025
 View Full Text
 Download PDF
Abstract
Breast cancer remains one of the most pressing global health concerns, and early detection plays a crucial role in improving survival rates. Integrating digital mammography with computational techniques and advanced image processing has significantly enhanced the ability to identify abnormalities. However, existing methodologies face persistent challenges, including low image contrast, noise interference, and inaccuracies in segmenting regions of interest. To address these limitations, this study introduces a novel computational framework for analyzing mammographic images, evaluated using the Mammographic Image Analysis Society (MIAS) dataset comprising 322 samples. The proposed methodology follows a structured three-stage approach. Initially, mammographic scans are classified using the Breast Imaging Reporting and Data System (BI-RADS), ensuring systematic and standardized image analysis. Next, the pectoral muscle, which can interfere with accurate segmentation, is effectively removed to refine the region of interest (ROI). The final stage involves an advanced image pre-processing module utilizing Independent Component Analysis (ICA) to enhance contrast, suppress noise, and improve image clarity. Following these enhancements, a robust segmentation technique is employed to delineated abnormal regions. Experimental results validate the efficiency of the proposed framework, demonstrating a significant improvement in the Effective Measure of Enhancement (EME) and a 3 dB increase in Peak Signal-to-Noise Ratio (PSNR), indicating superior image quality. The model also achieves an accuracy of approximately 97%, surpassing contemporary techniques evaluated on the MIAS dataset. Furthermore, its ability to process mammograms across all BI-RADS categories highlights its adaptability and reliability for clinical applications. This study presents an advanced and dependable computational framework for mammographic image analysis, effectively addressing critical challenges in noise reduction, contrast enhancement, and segmentation precision. The proposed approach lays the groundwork for seamless integration into computer-aided diagnostic (CAD) systems, with the potential to significantly enhance early breast cancer detection and contribute to improved patient outcomes.Keywords
Breast cancer continues to be a major global health challenge, significantly contributing to illness and death rates among females globally, and its impact is profound, given the rising prevalence and the potential for severe health outcomes. As reported by the World Health Organization (WHO), roughly 2.3 millions females worldwide have been identified with breast cancer in recent years, resulting in more than 685,000 fatalities [1]. This high incidence rate underscores the necessity for effective diagnostic tools and early detection techniques. In Saudi Arabia, breast cancer is notably a major public health issue; with mortality and incidence rates of 7.5 and 27.3 per 100,000, respectively, after adjusting for age, it ranks among the top nine causes of death for women in the region [2,3]. Similarly, in China, the incidence of breast cancer is escalating, affecting 12.2% of the female population, and contributing to 9.6% of global cancer-related deaths [4].
Early and accurate identification of breast cancer is critical, as timely diagnosis can greatly improve treatment outcomes and reduce mortality rates. Mammography is presently the most commonly used imaging technique for detecting breast cancer. However, interpreting mammographic images poses several challenges due to factors like tissue density, which affects image clarity, and the variability in radiologists’ assessments. Studies have shown that the effectiveness of mammography can vary widely, with diagnostic accuracy rates ranging from 60% to 90%, and up to 35% of cases leading to malignancy when biopsies are conducted on suspicious findings [5–7].
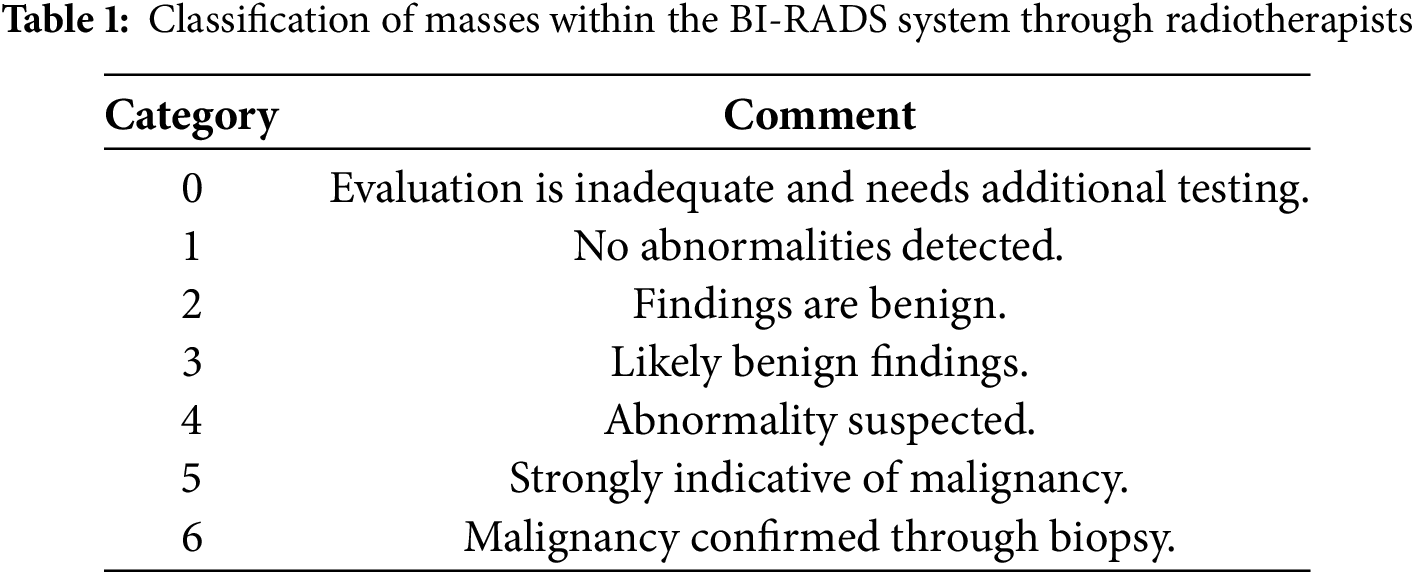
The BI-RADS is a key classification standard introduced by the American College of Radiology (ACR) that helps radiologists standardize mammography reports. BI-RADS offers a structured approach to categorize mammographic findings, helping radiologists in differentiating between non-cancerous and cancerous masses using image characteristics like shape, margin, and density [8]. Table 1 provides a Classification summary based on the BI-RADS system.
The biological complexities of breast cancer further complicate diagnosis. It often begins in the milk ducts (ductal carcinoma) or in the glandular tissues (lobular carcinoma) and can migrate to other parts of the body through the lymphatic system. Various risk elements, including hormonal changes, personal habits, and environmental influences contribute to breast cancer incidence [9].
Implementing computerized techniques to facilitate the prompt identification of breast cancer is essential for minimizing diagnostic delays and enhancing treatment outcomes. A fundamental step in developing an effective computerized detection method involves analyzing mammographic image databases.
A well-designed Algorithm 1 that automates this process can significantly enhance detection capabilities, minimizing the need for manual analysis and reducing radiologists’ workloads. However, handling large volumes of mammographic images presents challenges, particularly regarding image quality and variation across datasets. Techniques such as image enhancement and segmentation are essential to streamline this analysis, enabling the accurate identification of abnormal regions and providing valuable insights into the nature of detected anomalies [10].
Mammographic image analysis continues to encounter significant challenges in contrast enhancement, noise reduction, and segmentation accuracy, all of which are critical for the early detection of breast cancer. While existing methods address these issues individually, this study presents a novel three-stage computational framework that integrates advanced enhancements at each phase to achieve optimized image processing, classification, and segmentation performance. The primary contributions and innovative aspects at each stage are outlined as follows:
1. Stage-1: BI-RADS Classification: Unlike conventional classification methods that rely solely on image intensity, our approach systematically classifies mammographic images based on BI-RADS standards. This structured classification ensures consistent data organization, enabling efficient pre-processing and more precise identification of abnormalities across all BI-RADS categories.
2. Stage-2: Pectoral Muscle Removal for Enhanced Segmentation: Many existing segmentation techniques overlook the explicit removal of the pectoral muscle, which can lead to misclassification and false positives. Our framework incorporates a specialized pectoral muscle removal technique, effectively isolating the breast tissue region and thereby improving segmentation accuracy and enhancing diagnostic accuracy.
3. Stage-3: ICA-Based Image Enhancement and Segmentation: Unlike traditional contrast enhancement techniques such as histogram equalization and wavelet-based methods, our approach employs Independent Component Analysis (ICA) for pre-processing mammographic images. ICA improves image contrast, minimizes noise, and enhances feature extraction, leading to more accurate segmentation of abnormal regions. This method outperforms conventional enhancement techniques by preserving fine structural details that are crucial for detecting cancerous regions.
The key novel contributions of this research from each stage of implementation are:
1. A first-of-its-kind framework integrating BI-RADS classification, pectoral muscle removal, and ICA-based enhancement for real-time mammographic image analysis.
2. Demonstrated improvement in PSNR, EME, and segmentation accuracy, achieving 97% accuracy on the MIAS dataset.
3. Scalable and adaptable for integration into CAD systems, enhancing clinical applications in breast cancer detection.
4. Superior segmentation precision by eliminating false positives caused by the pectoral muscle, ensuring clearer tumor localization.
5. ICA-based contrast enhancement outperforms traditional methods, preserving fine-grained details essential for cancer diagnosis.
This comprehensive pipeline enhances image clarity, segmentation accuracy, and diagnostic reliability, establishing a groundbreaking advancement in AI-driven breast cancer detection. This document is structured in the following manner: Section 2 offers an overview of related work, Section 3 elaborates on the proposed methodology, Section 4 outlines the databases used and the evaluation metrics, Section 5 discusses the outcomes of experiments, Section 6 explores discussions and future prospects, and Section 7 summarizes the research conclusions.
Various filtering methods have been explored for examining early-phase breast cancer. Mendez et al. [11] introduced spatial averaging filters to enhance the smoothness of mammographic images, while histogram thresholding methods have been employed to identify abnormal areas. Abdel et al. [12] introduced a new threshold-driven technique specifically designed to exclude the pectoral muscle from mammograms. Karssemeijer and Brake [13] developed a multi-scale approach utilizing the Hough transform to accurately segment the pectoral muscle. This approach was later modified by Ferrari et al. [14], who enhanced it with additional image-processing techniques for improved muscle removal.
Raba et al. [15] implemented a dynamic histogram-based technique to differentiate cancerous regions from the background, employing a region-growing method for pectoral muscle segmentation. Similarly, Mirzaalian et al. [16] applied a nonlinear diffusion method to isolate the pectoral muscle, while Kinoshita et al. [17] utilized the Radon transform to detect abnormal cancerous regions. Mario et al. [18] used wavelet decomposition with background suppression techniques in mammogram images, achieving an 85% accuracy rate in cancer detection.
More recently, Wang et al. [19] introduced an automated detection approach utilizing a discrete-time Markov process combined with an active contour framework. Chakraborty et al. [20] introduced a contour-based approach leveraging a gradient averaging technique to accurately define the boundary of the pectoral muscle. Chen and Zwiggelaar [21] applied a histogram-based thresholding method to identify cancerous regions and applied connected feature analysis to mark the isolated malignant area. They also employed a region-based approach to eliminate the pectoral muscle, identifying initial points nearer to the edge. Maitra et al. [22] implemented a triangular region-based method combined with region-growing techniques to distinguish the pectoral muscle from breast tissue. Despite the advancements in thresholding, starting-point image techniques, and region-growing methods, challenges remain due to the need for image uniformity. Techniques for enhancing image contrast have been extensively applied to improve visibility in images and videos, yet most conventional methods fall short in enhancing mammographic images effectively for subsequent processing steps.
Numerous comprehensive review papers are available, focusing on techniques to improve contrast in mammographic images. Cheng et al. [23] reviewed various feature-driven image enhancement methods, detailing their benefits and limitations. Stojic et al. [24] focused on regional contrast optimization combined with techniques to minimize background interference. Jiang et al. [25] introduced a method utilizing structural tensors and adaptive fuzzy operators tailored specifically to mammographic imaging. Ming et al. [26] proposed an improved approach employing a histogram-driven contrast optimization technique tailored for radiographic imaging.
To address the persistent challenges in mammographic image analysis, several recent studies have proposed more sophisticated hybrid and deep learning approaches. Avcı and Karakaya [27] devised a multi-filter enhancement scheme that blends CLAHE, median filtering, and unsharp masking—an approach that substantially sharpened lesion boundaries and improved diagnostic accuracy. In another contribution, Saha et al. [28] combined automated region extraction using the Segment Anything Model with a transformer-based classifier, demonstrating excellent reliability in distinguishing malignancies. Building on multi-stage frameworks, Ghuge and Saravanan [29] introduced a two-step system, first applying Swin ResUNet3+ for lesion segmentation, followed by an attention-guided DenseNet model for classification. Manigrasso et al. [30] investigated how multi-view mammograms could be better utilized by integrating graph-based and transformer architectures, achieving stronger performance than standard convolutional models by leveraging cross-view spatial correlations. Complementing these structural improvements, Singh et al. [31] designed a transformer-based denoising network that fuses local texture and global context, resulting in cleaner mammograms and potentially enhancing early-stage tumor visibility.
After examining the existing methodologies for early breast cancer detection, it is clear that there is a need for a more effective enhancement technique within the pre-processing module for segmenting cancerous regions. The current research builds upon these foundational works and presents a detailed, sequential examination of mammographic images aimed at detecting breast cancer. The proposed method analyzes a comprehensive hospital database containing approximately 2892 images, providing both enhancement and detection of cancerous regions, as detailed in Section 4.
Detecting breast cancer through mammographic imaging is a critical step in early diagnosis and treatment planning. However, interpreting mammograms poses significant challenges due to noise, interference from the pectoral muscle, and inconsistent image quality, which can lead to diagnostic errors. The methodology proposed in this study introduces a structured approach that enhances mammogram analysis by addressing these challenges through a combination of preprocessing, classification, and post-processing techniques.
The approach begins by utilizing a mammogram dataset as the input. In the Pre-Processing Module, noise is minimized using a Wiener filter, which improves the overall clarity of the mammographic images. This step involves eliminating the pectoral muscle which is a common obstacle in accurate breast tissue evaluation. This step involves eliminating the pectoral muscle, which often poses a challenge in precise breast tissue assessment. By isolating the breast tissue, this step ensures that the subsequent analysis focuses solely on the regions of interest. After preprocessing, the images are grouped into three categories: Malignant, Benign, and Normal. This classification is achieved through K-Means Clustering, an efficient machine-learning approach that segments the images by grouping pixels with comparable intensities. This enables the identification of potential abnormalities in the breast tissue with greater precision. To improve the diagnostic clarity of the images, the post-processing module employs image contrast adjustment (ICA-II). This step significantly improves image contrast and visibility, ensuring that even subtle abnormalities can be more easily detected and analyzed. As Fig. 1 illustrates, the workflow integrates preprocessing, classification, and enhancement steps into a streamlined process, offering a comprehensive solution to the challenges in mammographic analysis. Each section of this methodology is explained in detail below.
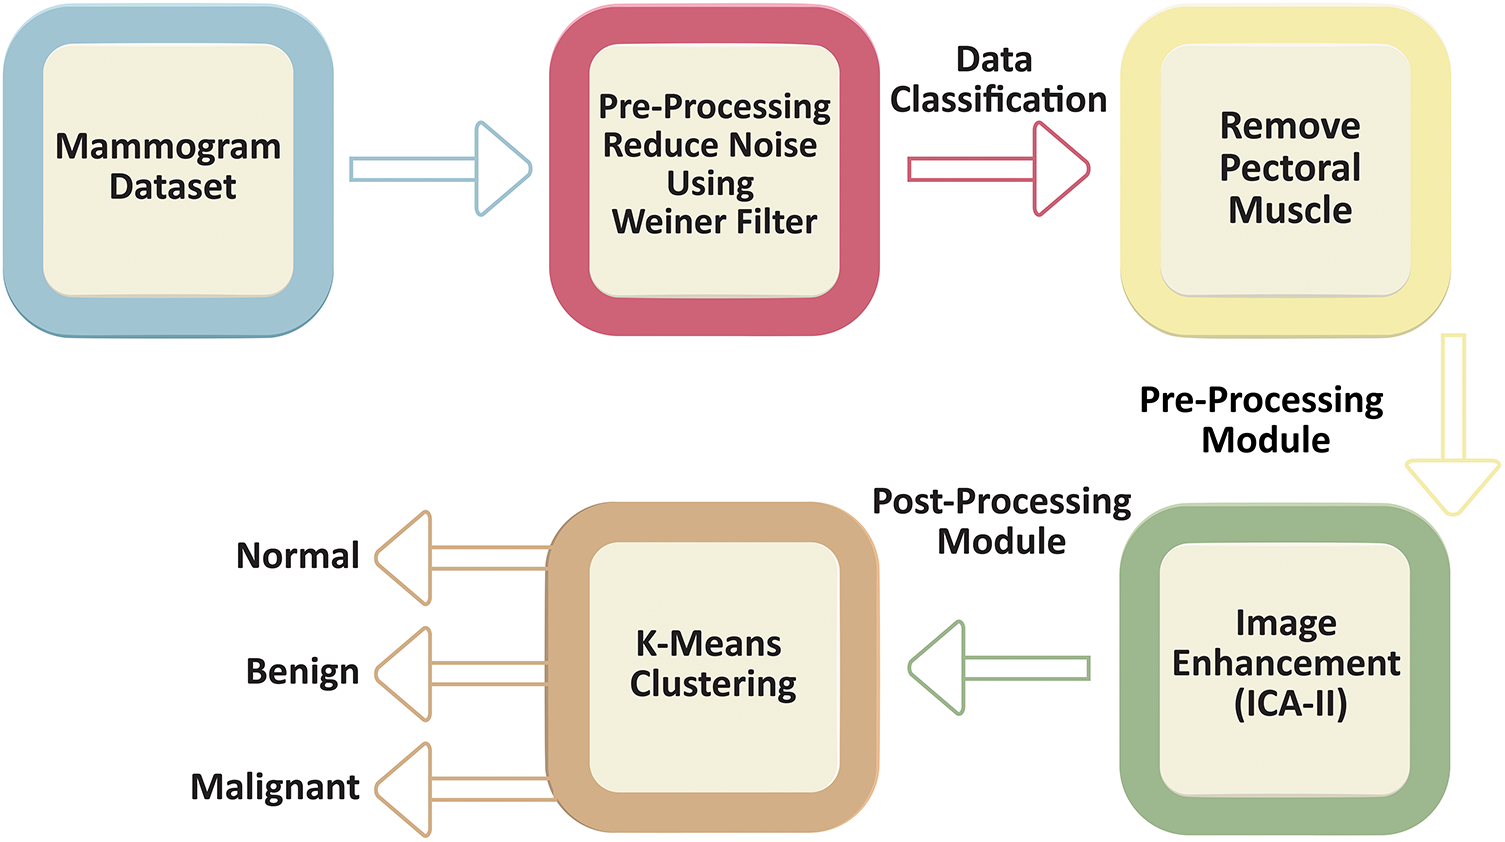
Figure 1: Workflow of the proposed methodology for mammogram preprocessing, classification, and enhancement. The workflow begins with the mammogram dataset, followed by a preprocessing stage where noise is reduced using a Wiener filter. The preprocessed data undergoes classification, including pectoral muscle removal as part of the preprocessing module. Next, an image enhancement step, utilizing ICA-II, is applied as part of the post-processing module to refine and improve the visual quality of the mammogram scans. Finally, The images are then subjected to K-means clustering for classification into normal, benign, or malignant cases
The selection of analysis methods in diagnostic imaging is inherently dependent on the specific characteristics of the data being studied. As such, a thorough assessment of the dataset is critical to ensure the applicability and effectiveness of the proposed analytical approach. In the field of mammographic imaging, two principal categories of images are commonly identified: digital mammography and analog mammography. This study focuses on digital mammographic images, which are more conducive to computational analysis. Nevertheless, these images present notable challenges, the most significant of which is the accurate recognition and pectoral muscle exclusion. The pectoral muscle evaluation is primarily guided by their geometric structure and their spatial orientation relative to the mammographic view. Mammographic imaging is traditionally performed using two standard projections: the mediolateral oblique (MLO) and craniocaudal (CC) views, which provide comprehensive visualization of breast tissue from different angles.
In the MLO view, it appears as an overlapping right-angled triangular shape situated in the upper section of the mammogram whereas, in the CC view, the pectoral muscle is observed as a curved structure adjacent to the breast boundary. These distinct anatomical features, as illustrated in Fig. 1, necessitate specific segmentation techniques tailored to each view.
Both the CC and MLO views pose unique challenges, including low contrast and variability in tissue density as shown in the Fig. 2. Despite these limitations, these views often encompass critical diagnostic regions containing malignancies. Consequently, the pectoral muscle’s accurate segmentation and exclusion are essential for isolating the breast area, thereby enhancing the accuracy of subsequent image analyses. Consequently, the accurate segmentation and exclusion of the pectoral muscle are crucial for delineating the breast area, thereby improving the reliability of subsequent image evaluations. Furthermore, the classification of mammographic images based on specific views, in adherence to the BI-RADS framework, facilitates the uniformity of diagnostic protocols. This approach is instrumental for creating automated systems aimed at detecting breast malignancies, improving diagnostic reliability and computational efficiency.
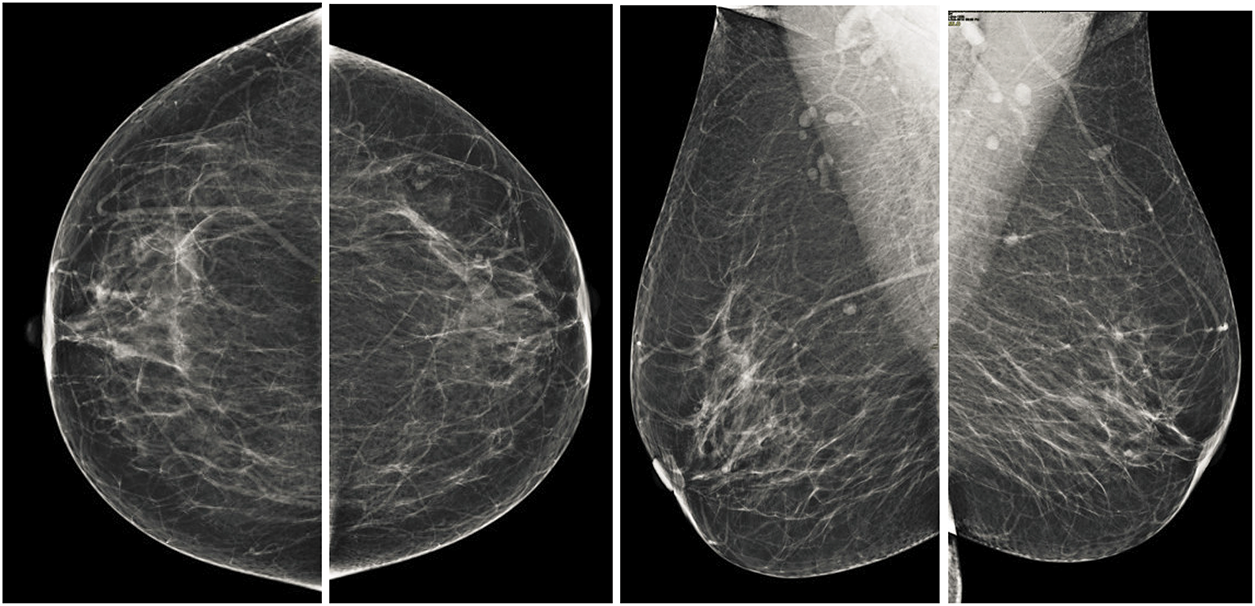
Figure 2: Illustration of standard mammographic perspectives. The first row shows the MLO depiction of the left and right sides, while the second row shows the CC depiction of the left and right sides
3.1.2 Pre-Processing Module: Removing Noise Using Wiener Filter
The next step of pre-processing in the analysis involves the application of the Wiener filter for minimizing noise within mammographic images. Noises in electronic mammographic scans can obscure critical features, potentially impacting the accuracy of subsequent analyses. The Wiener filter is a well-established method for adaptive noise reduction that optimizes the balance between reducing noise and maintaining fine details by considering the local statistics of the image. The adaptive Wiener filter is a widely recognized technique for reducing noise in digital images, particularly in medical imaging, where the preservation of fine details and edges is essential. This method reduces the average squared deviation between the filtered and original images by using local statistics within a defined window. The adaptive Wiener filter modifies pixel intensities based on the local mean and variance, dynamically adjusting to the features of the image. To compute the filter’s output, the local mean (
where
Using these statistics, the pixel intensity is updated as:
where
3.1.3 Data Classification: Removal of Pectoral Muscle
After applying Wiener filtering to reduce noise in mammographic images, the next crucial step is segmenting the breast area by removing the pectoral muscle (Fig. 3). The pectoral muscle, a bright-intensity area generally found in the upper section of MLO views, can obstruct the assessment of breast tissue, which represents the main ROI for identifying anomalies. The seed-based region-growing technique is employed for this segmentation task due to its accuracy and adaptability to the structural and intensity characteristics of mammographic images. Seed-based region growing is a widely used image segmentation method based on two key principles: selecting pixel intensity values and determining seed points. This study utilizes the seed point approach, which offers an automatic and orientation-specific selection mechanism, eliminating the need for manual intervention. By adapting to the geometric orientation of the mammographic image, the seed point approach ensures consistent and accurate initialization of the segmentation process. The segmentation process begins with the identification of a seed point, which serves as the initial position for the region expansion method. The algorithm iteratively examines the pixel intensities of neighboring pixels to determine their inclusion in the region. A pixel is added to the growing region if its intensity matches predefined similarity criteria, such as intensity threshold, gradient, or texture similarity, relative to the seed point or the existing region. This iterative process continues until the region growth stabilizes, indicating that no additional pixels meet the inclusion criteria. For mammographic images, the seed point selection is adapted to target the structural characteristics of the pectoral muscle, facilitating its isolation and removal. The algorithm effectively handles variations in intensity and orientation, ensuring robust segmentation across different images. The pectoral muscle is progressively excluded, leaving behind the breast tissue as the segmented ROI. The result of the seed-initiated region expansion procedure, as illustrated in Fig. 3, demonstrates a clean and accurate separation between the breast area and the pectoral muscle. This segmentation step is essential for reducing irrelevant regions in the image and focusing on the breast tissue, which often contains diagnostic features such as masses or microcalcifications. By isolating the breast region, the segmentation process enhances the subsequent steps of detecting abnormalities, improving the overall accuracy of computer-aided detection systems. The seed-based region-growing method also preserves the integrity of fine details and edges within the breast tissue. This capability is crucial for detecting small or early-stage abnormalities, which are often subtle and may be obscured by excessive smoothing or imprecise segmentation. Furthermore, the method’s iterative and automated approach ensures reproducibility and reliability, key factors in high-stakes diagnostic applications. This segmentation method contributes significantly to the overall diagnostic process by providing a refined ROI for further analysis. The distinct separation of the breast area aids in recognizing and classification of malignant regions, leading to improved accuracy in breast cancer detection and classification. These outcomes are further elaborated in the results section, where the effectiveness of the segmentation technique in enhancing diagnostic performance is discussed in detail.
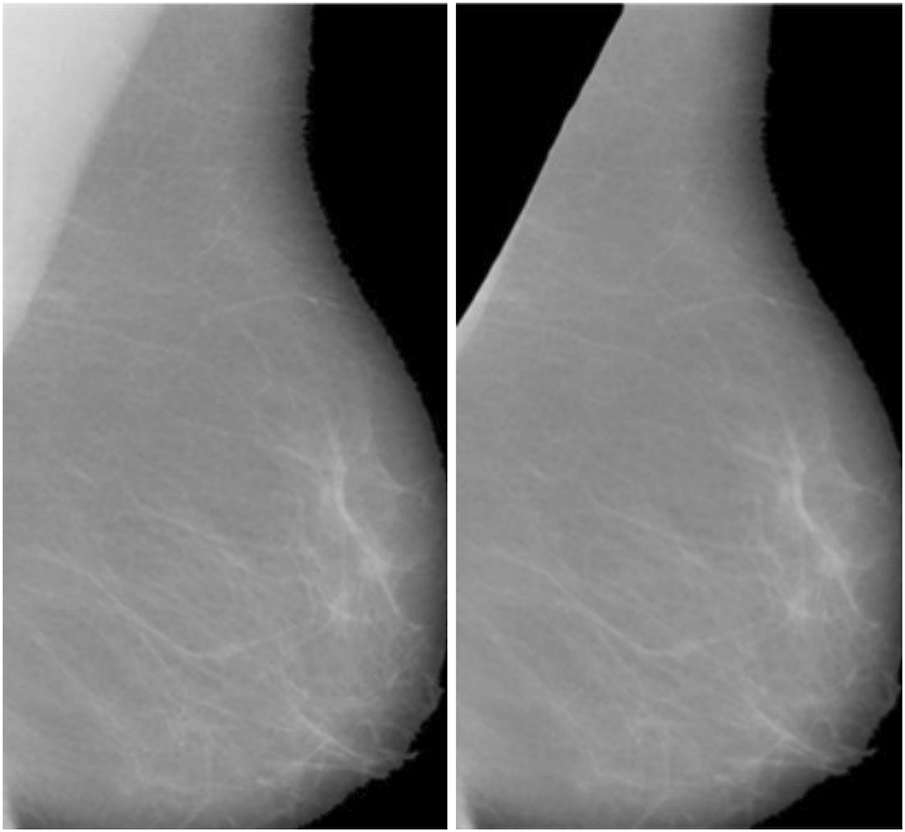
Figure 3: Final Breast scan with partial removal of the pectoral muscle
3.1.4 Image Enhancement: ICA Architectures for Mammogram Images
In the context of mammographic image analysis, ICA offers several notable advantages, and its mathematical foundation is explained in the Appendix A. One of the primary benefits is its ability to isolate features by separating overlapping tissues and structures, thereby enhancing the visibility of abnormalities. This feature is especially important for identifying subtle diagnostic markers that may otherwise be obscured. Additionally, ICA effectively reduces artifacts, such as residual pectoral muscle, which could compromise diagnostic accuracy. By eliminating these irrelevant regions, the analysis becomes more focused on the breast tissue of interest. Furthermore, ICA significantly improves image contrast by revealing subtle differences in intensity levels. This enhanced contrast facilitates the detection of early-stage abnormalities, including microcalcifications and small masses, which are crucial for timely and accurate breast cancer diagnosis.
In this research, ICA is applied to mammographic images post-pectoral muscle removal to extract independent components representing the breast tissue. By isolating these components, ICA enhances the contrast and visibility of diagnostically significant regions. Two ICA architectures, ICA-I and ICA-II, are implemented to assess their effectiveness in feature extraction and image enhancement. These architectures employ different approaches to optimize the separation and reconstruction of independent components, offering insights into the most effective methodologies for mammographic analysis. This technique’s ability to decompose complex image data into its independent component makes it a powerful tool for enhancing image clarity and supporting accurate breast cancer detection.
3.2 ICA Architecture-I(ICA-I) for Mammogram Images
In the context of ICA-I, the mammogram images are collected and arranged into a data matrix, with each row vector signifying a unique image. These row vectors are considered independent components in the ICA model. Fig. 4 presents the ICA1 setup, offering an illustration of the data organization. Within this ICA-I structure, mammogram images are regarded as stochastic variables, while the individual pixels in each image serve as distinct observations or instances. This approach enables the ICA algorithm to analyze the statistical dependencies among the pixels and uncover the underlying independent components. In Fig. 4, the data matrix X is formed by combining n independent ICA components or mammographic scans. Each column in the matrix corresponds to an individual pixel, whereas each row corresponds to a particular observation or pixel value in different images. The goal of ICA1 is to factorize the data matrix X into two matrices: the coefficient matrix W and the source matrix S. The coefficient matrix W is a critical component in the ICA-I model, and is derived through the Fast Independent Component Analysis (FASTICA) method. The process aims to identify an appropriate transformation matrix W which can separate the mixed signals in the data matrix X into statistically independent components. Notably, the coefficient matrix W must be square, implying that the number of independent components (mammogram images) must equal the number of observed pixels. The source matrix S contains the underlying independent basis images or components that contribute to the observed mixture matrix X. These independent components represent the fundamental patterns present in the mammogram images, free from any statistical dependencies. Detailed Mathematical Formulation of ICA-I on mammogram images is explained in Appendix B.
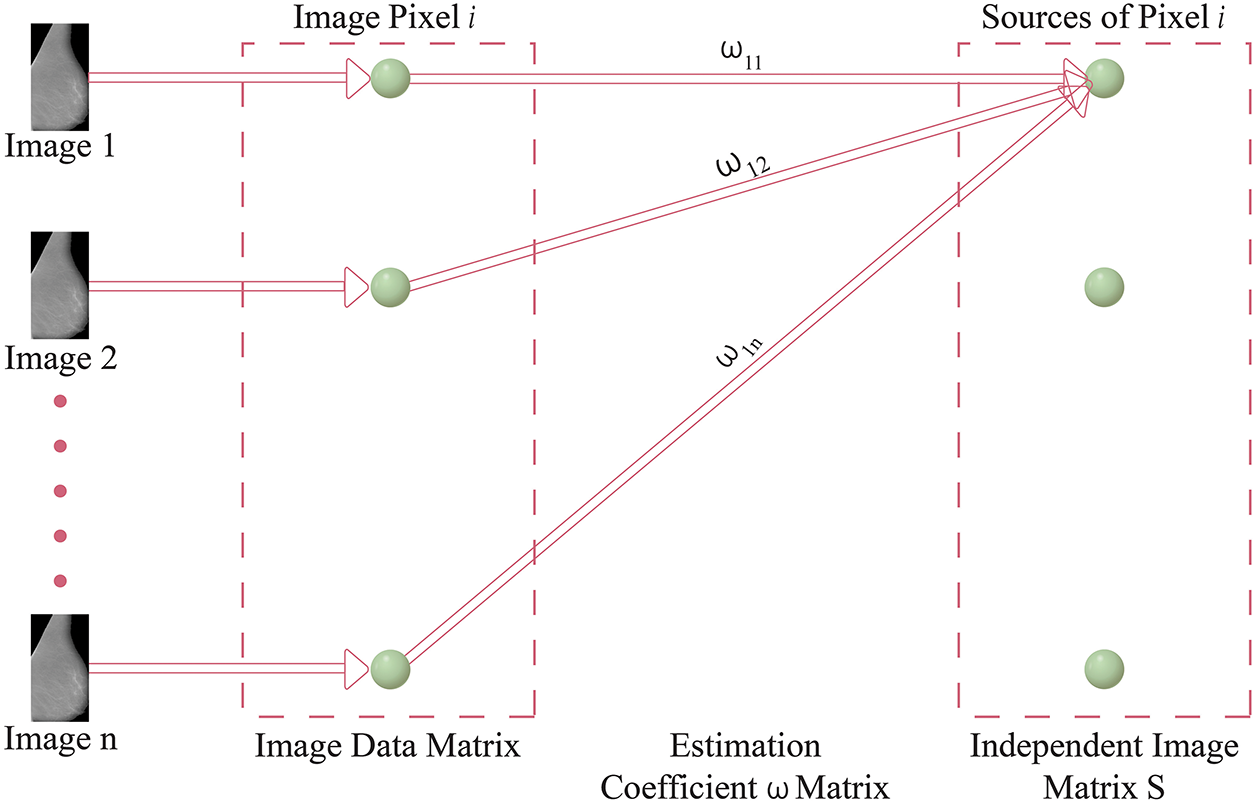
Figure 4: Model of ICA-I structure
As a result, the independent components obtained through ICA can be considered building blocks that collectively form the observed mammographic images. They might correspond to different anatomical structures, functional regions, or patterns of breast tissue. Applying ICA to mammographic images provides valuable insights into the underlying sources of breast tissue variation or structural pattern. These insights are instrumental in tasks such as image enhancement, denoising, and detecting abnormal breast tissue patterns for diagnosis, all relevant to the research being discussed.
ICA Architecture II (ICA-II) for Mammogram Images
In the context of ICA-II, the data matrix X is structured in column vectors, where each column represents an image. However, a key difference from ICA-I is that in ICA-II, the data matrix X is transposed. This inversion occurs because ICA-II considers images as trails and pixels as variables. Consequently, the transposition of the data matrix is essential to ensure the correct representation for ICA-II. A depiction of the ICA2 model is shown in Fig. 5, which provides an overview of the data arrangement and the inversion of variables and trails. This inversion is a fundamental aspect of ICA2, distinguishing it from ICA-I. By appropriately transposing the image data matrix X in the input stage, ICA-II is configured to analyze statistical relationships among the pixels of the images, enabling the identification of independent components based on pixel-level variations. This transposition process ensures the compatibility of the data for the subsequent stages of ICA-II, facilitating the extraction of meaningful and statistically independent components from the observed images. The detailed mathematical formulation of ICA-I on mammogram images is explained in Appendix C.
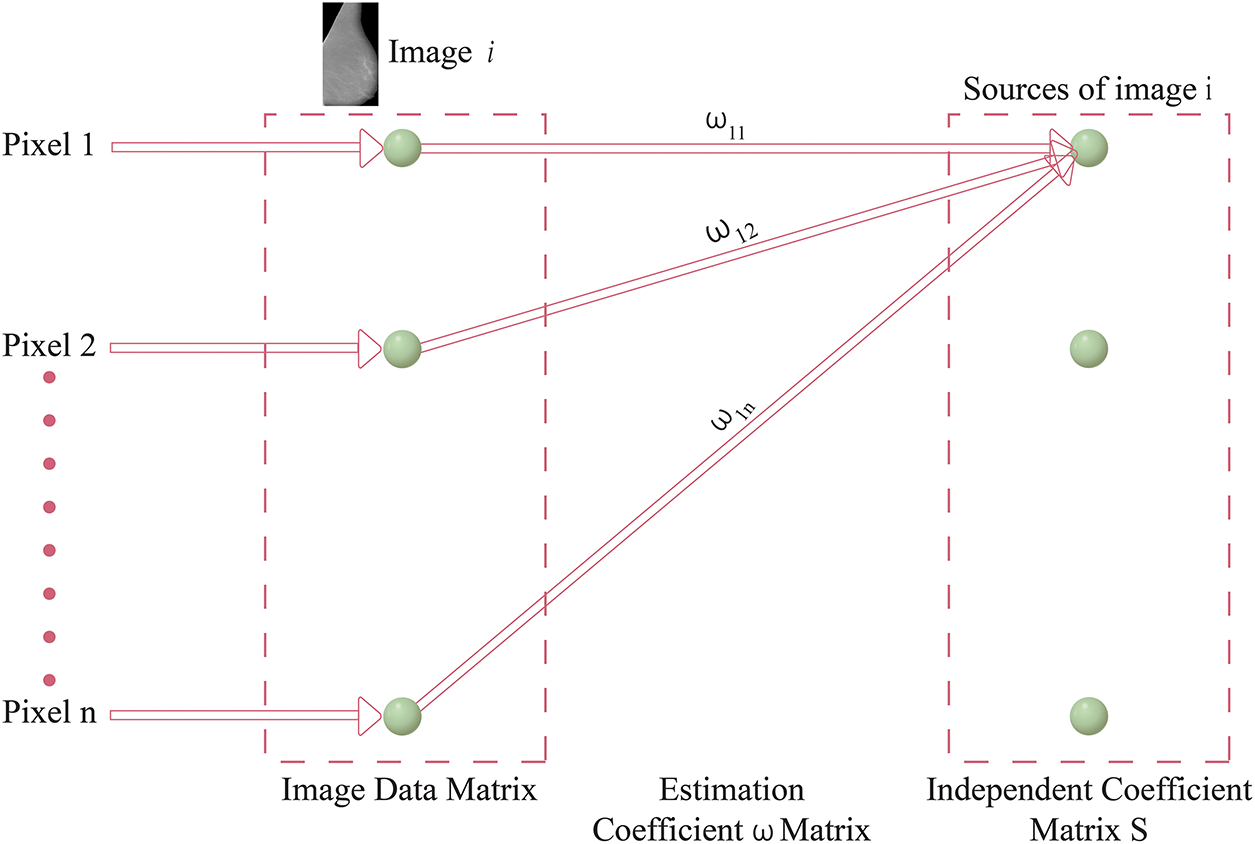
Figure 5: ICA Architecture-II framework
Both ICA-I and ICA-II offer valuable methods for processing mammographic images, but their differences lie in their focus and implementation. ICA1 emphasizes image-level independence, which is ideal for isolating broader patterns and features across images. In contrast, ICA-II targets pixel-level variations, making it more sensitive to finer details. The choice between these architectures depends on the specific requirements of the analysis, such as whether the focus is on general tissue structures or minute abnormalities. Tables 2 and 3 present a comparative analysis of ICA Architecture I (ICA-I) and ICA Architecture II (ICA-II) in terms of processing methods, whitening techniques, segmentation strategies, and algorithmic configurations. These architectures are designed to enhance contrast and segmentation accuracy in mammographic images by extracting independent components that highlight tumor regions.
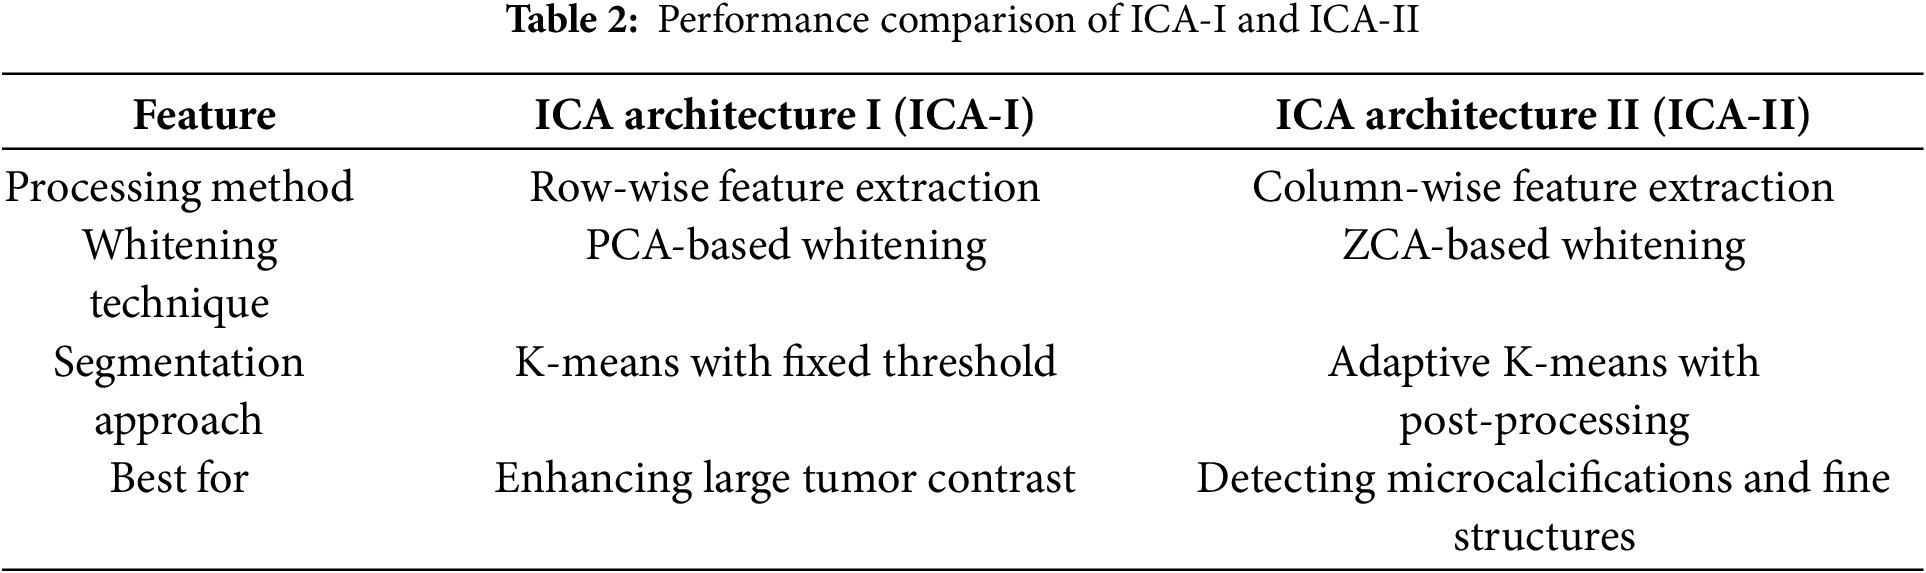
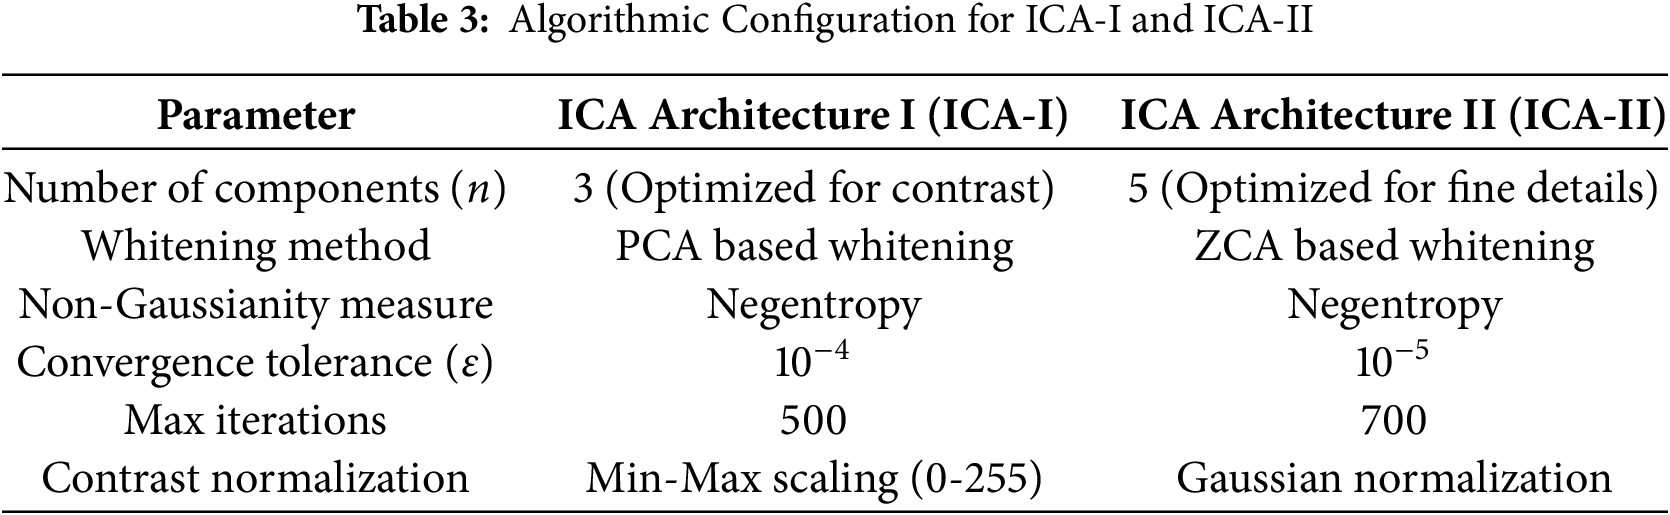
Table 2 compares the feature extraction and segmentation performance of ICA-I and ICA-II. ICA-I employs a row-wise feature extraction method, where each row in the image matrix is treated as an independent source. This approach is effective for enhancing large tumor contrast by identifying global intensity variations. In contrast, ICA-II processes images using a column-wise feature extraction approach, making it more suitable for detecting microcalcifications and fine-textured abnormalities. ICA-I utilizes Principal Component Analysis (PCA) Whitening, which removes redundancy and improves convergence speed, while ICA-II applies Zero-phase Component Analysis (ZCA) Whitening, preserving local spatial structures for detailed texture analysis. The segmentation strategies also differ, with ICA-I using K-means clustering with a fixed threshold, making it efficient for detecting well-defined tumor regions, whereas ICA-II employs adaptive K-means with post-processing, which helps refine lesion boundaries and reduce false positives.
Table 3 outlines the algorithmic configuration parameters for ICA-I and ICA-II. ICA-I extracts three independent components, optimizing it for contrast enhancement and large tumor segmentation, while ICA-II extracts five independent components, making it more effective for detecting subtle features such as microcalcifications. The whitening method further differentiates the two architectures, with ICA-I using PCA whitening for speed and efficiency, while ICA-II leverages ZCA whitening to retain fine image structures. Both architectures use Negentropy as the non-Gaussianity measure to ensure statistically independent feature extraction. However, ICA-II requires a lower convergence tolerance
The comparison between ICA-I and ICA-II highlights their complementary roles in mammographic image processing. ICA-I is optimized for global contrast enhancement and detecting large lesions, while ICA-II is designed for detecting small abnormalities and detailed texture analysis. A hybrid approach combining both architectures could further improve segmentation accuracy, ensuring robust performance across various breast tissue types and lesion complexities as explained with validation in the result section.
3.3 Component for Post-Processing
The segmentation of irregular areas in mammographic scans presents a significant challenge, with researchers continually developing new methods to enhance breast cancer detection. Various segmentation algorithms, including adaptive cuts, mean shift, mean shift clustering, mean shift with spatial constraints, K-means, and spatially integrated K-means, have been applied to mammographic image analysis. Among these, normalized cuts, originally introduced by Shi et al. [32] for segmenting natural images, were adapted for mammograms. This graph theory-based approach treats image pixels as graph nodes, framing segmentation as a graph partitioning task by balancing inter-group dissimilarity with intra-group similarity. Despite its theoretical foundation, normalized cuts often produced noisy results and lost crucial details in mammographic images.
In contrast, K-means clustering, especially when applied with spatial parameters ranging from 4 to 9, exhibited superior performance by delivering cleaner segmentations with reduced noise and more detailed visualization of abnormal regions. Mean shift and its spatially-aware variations, though theoretically applicable, failed to achieve comparable results due to significant noise and low segmentation accuracy. The segmentation outputs of these techniques are illustrated in Fig. 6, where it is evident that normalized cuts and mean shift approaches were ineffective in properly segmenting mammogram scans. Conversely, the K-means method facilitated highly accurate insights into the irregular areas, enabling an improved examination of the image repositories.
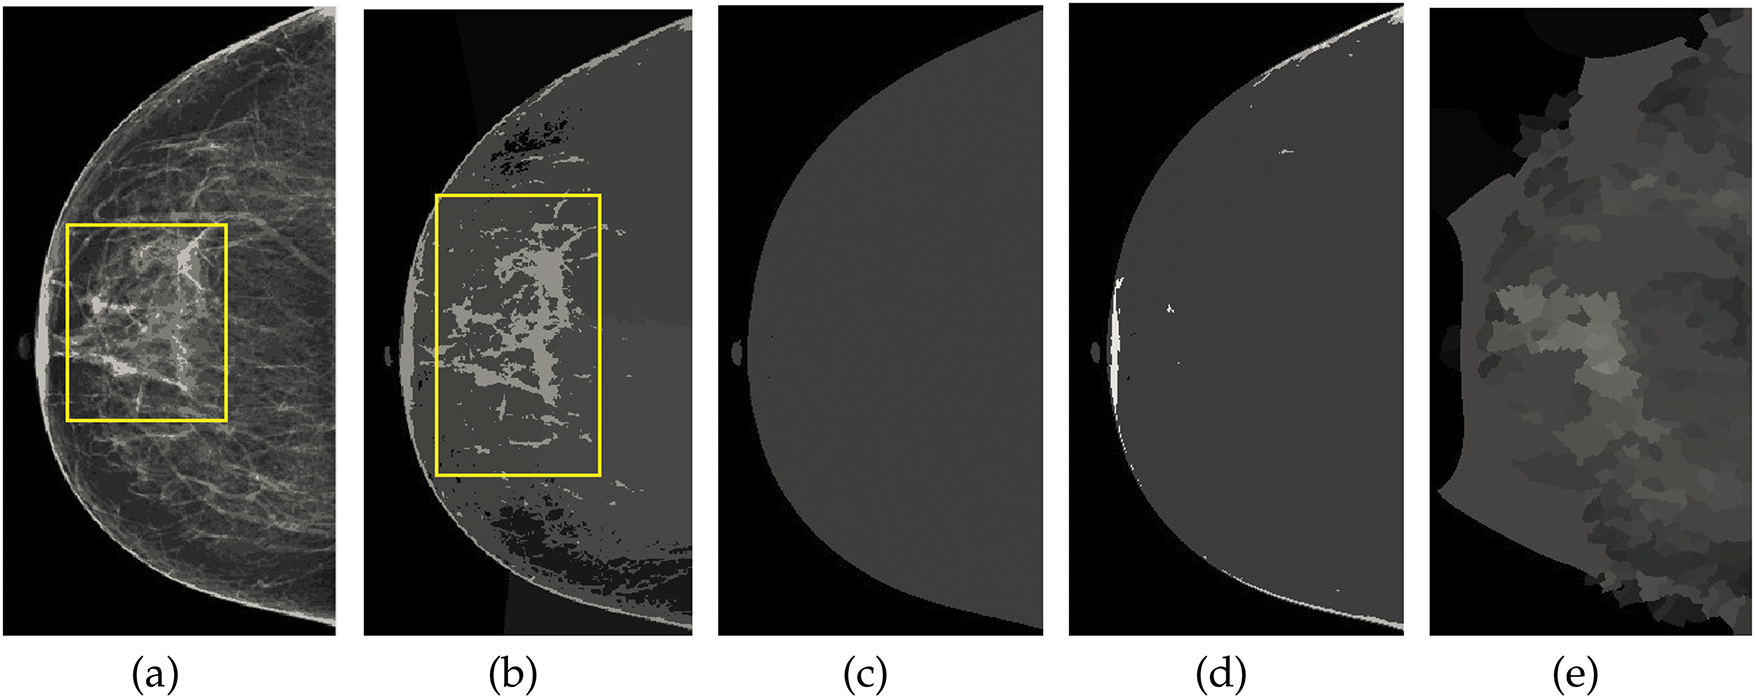
Figure 6: Visualization of the mammographic image enhancement and segmentation pipeline. (a) Raw mammogram image, (b) Region of interest isolated after preprocessing, (c) Breast region extracted with pectoral muscle removed, (d) Segmented abnormal area using optimized K-means clustering, and (e) Final result showing enhanced lesion boundaries. This figure illustrates the step-by-step effectiveness of the proposed framework in refining image quality and accurately identifying suspicious regions
Further, the adaptability of the K-means algorithm and its spatial variant across diverse mammographic image databases, combined with a preprocessing module, underscores its reliability and efficiency in segmentation tasks. The findings emphasize the significance of selecting appropriate algorithms for diagnostic imaging and demonstrate the potential of K-means-based methods in significantly improving mammogram analysis. These findings and their implications are further elaborated in the results section, where the proposed methodology is thoroughly evaluated through quantitative and qualitative assessments.
3.4 Proposed Method along with Mathematical Model
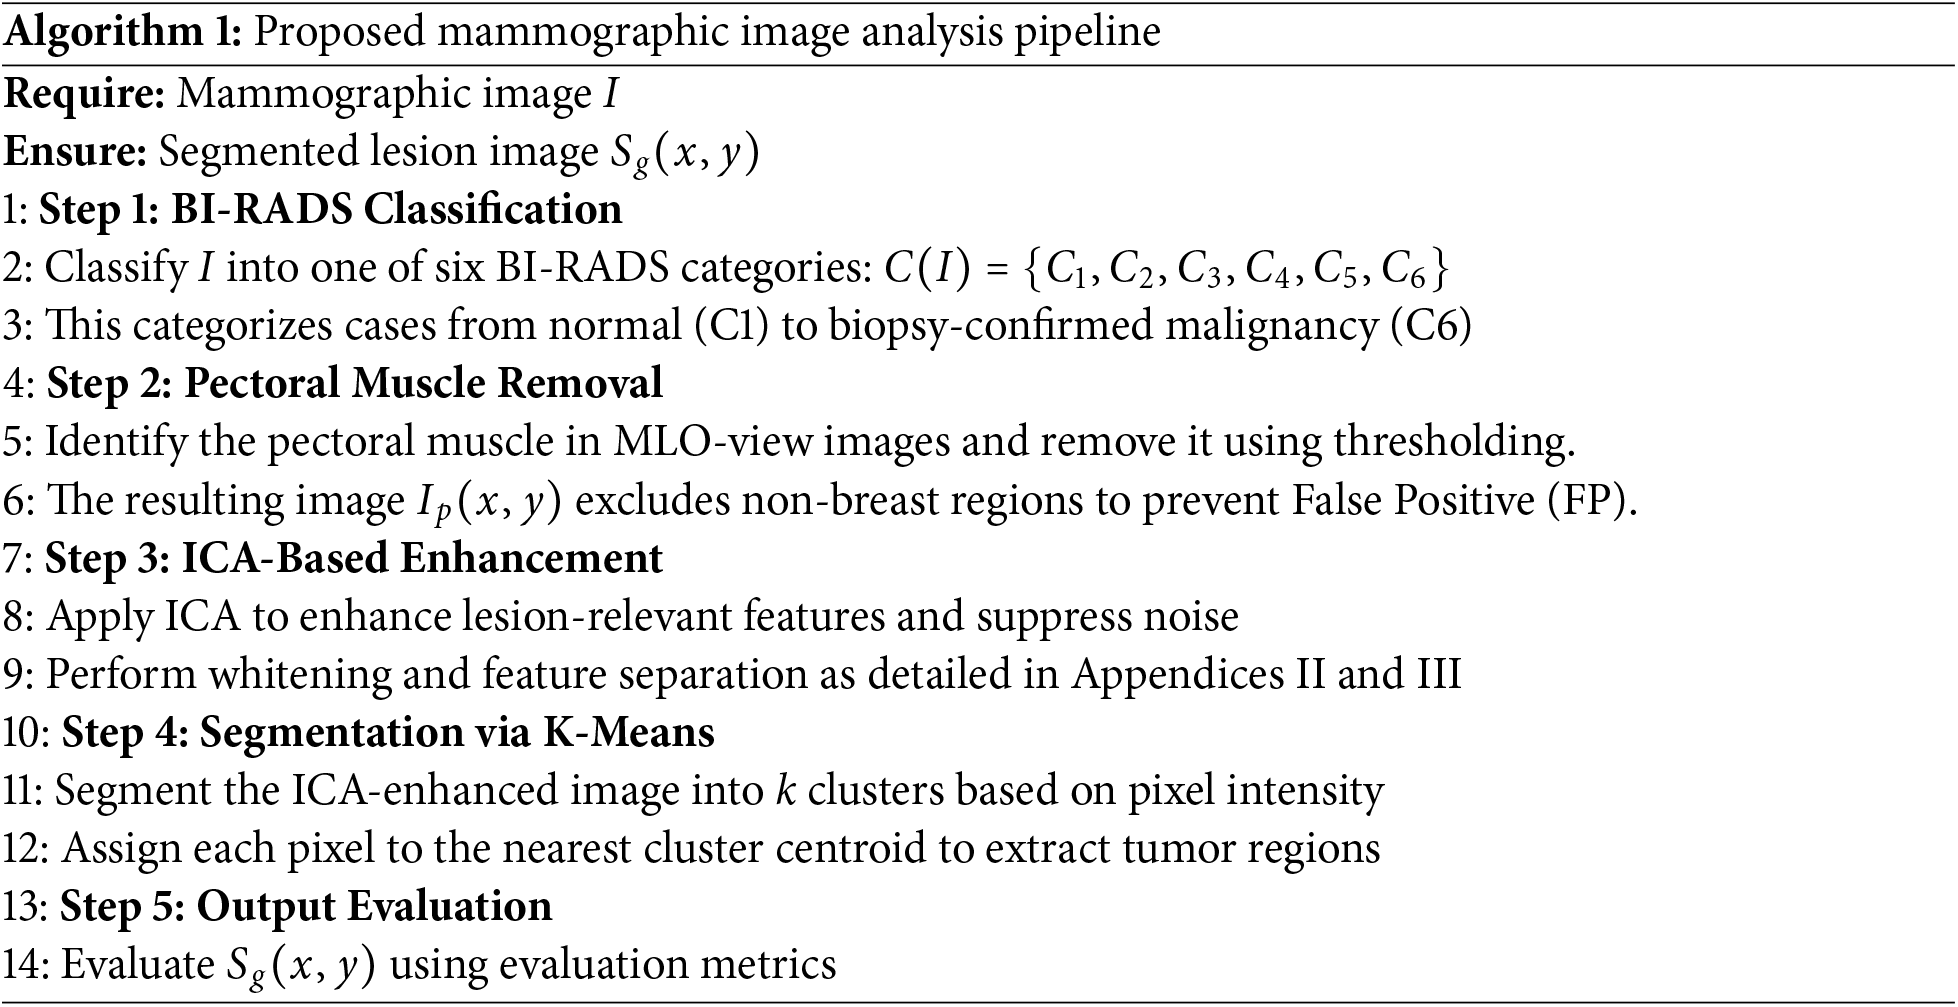
To streamline mammographic image analysis, we propose a structured pipeline that integrates BI-RADS classification, breast region preprocessing, feature enhancement, and lesion segmentation. Algorithm 1 begins by classifying each image using the BI-RADS system, followed by pectoral muscle removal to isolate the breast region. ICA is then applied to enhance diagnostically significant features. The enhanced image is subsequently segmented using K-means clustering to extract lesion areas. The complete algorithm is outlined below, while the mathematical formulation of the proposed three-stage framework is provided in detail in Appendix D.
4 Dataset and Evaluation Metrics
To ensure a comprehensive evaluation of the proposed mammographic image analysis model, three publicly available datasets are utilized: MIAS (Mammographic Image Analysis Society), CBIS-DDSM (Curated Breast Imaging Subset of DDSM), and BIRADS-IRMA. These datasets provide a diverse range of mammographic images, covering different imaging conditions, lesion types, and breast densities, allowing for robust validation of the model’s performance in various clinical scenarios.
The MIAS dataset is a well-established resource in mammographic imaging research, containing 322 digitized mammograms collected from the UK National Breast Screening Programmer. The dataset is standardized by resizing images to a 200-micron pixel edge and padding them to achieve a uniform resolution of
• Normal cases
• Benign cases
• Malignant cases
The MIAS dataset includes annotations detailing breast tissue composition, classifying tissues as adipose, mixed-glandular, or high-density, which is essential for developing contrast enhancement and segmentation algorithms.
The CBIS-DDSM dataset is an improved subset of the Digital Database for Screening Mammography (DDSM), designed specifically for AI-based mammographic analysis. It consists of 1566 full-field digital mammograms (FFDM), incorporating detailed annotations and biopsy-confirmed pathology labels. Key attributes of the CBIS-DDSM dataset include:
• High-resolution digital images with improved contrast and lesion visibility.
• Detailed lesion annotations, covering mass, calcifications, and architectural distortions.
• Classification of breast density, including fatty, scattered fibroglandular, heterogeneously dense, and extremely dense breast tissue.
• Multiple imaging views, such as craniocaudal (CC) and mediolateral oblique (MLO) views.
This dataset is particularly valuable for evaluating segmentation precision and classification accuracy, as it offers biopsy-confirmed ground truth data, allowing for a rigorous assessment of the model’s ability to differentiate between benign and malignant lesions.
The BIRADS-IRMA dataset is a multi-center collection of over 2500 mammograms, sourced from different healthcare institutions and imaging devices. This dataset provides a real-world perspective on mammographic analysis, ensuring model validation across various imaging conditions. Key features of the BIRADS-IRMA dataset:
• Combination of digitized film and full-field digital mammograms, reflecting different imaging technologies used in clinical practice.
• Extensive BI-RADS classifications assigned by expert radiologists, covering BI-RADS-1 to BI-RADS-6, allow the evaluation of the model’s ability to assess malignancy risk.
• Diverse breast densities and imaging artifacts, make it suitable for testing the model’s robustness against variations in image quality.
• Annotations based on real-world clinical reports, enabling direct comparison between AI predictions and human expert assessments.
By incorporating a multi-institutional dataset, this resource ensures that the model is adaptable to varied imaging conditions, scanner types, and demographic distributions.
4.1.4 Dataset Comparison and BI-RADS Classification Distribution
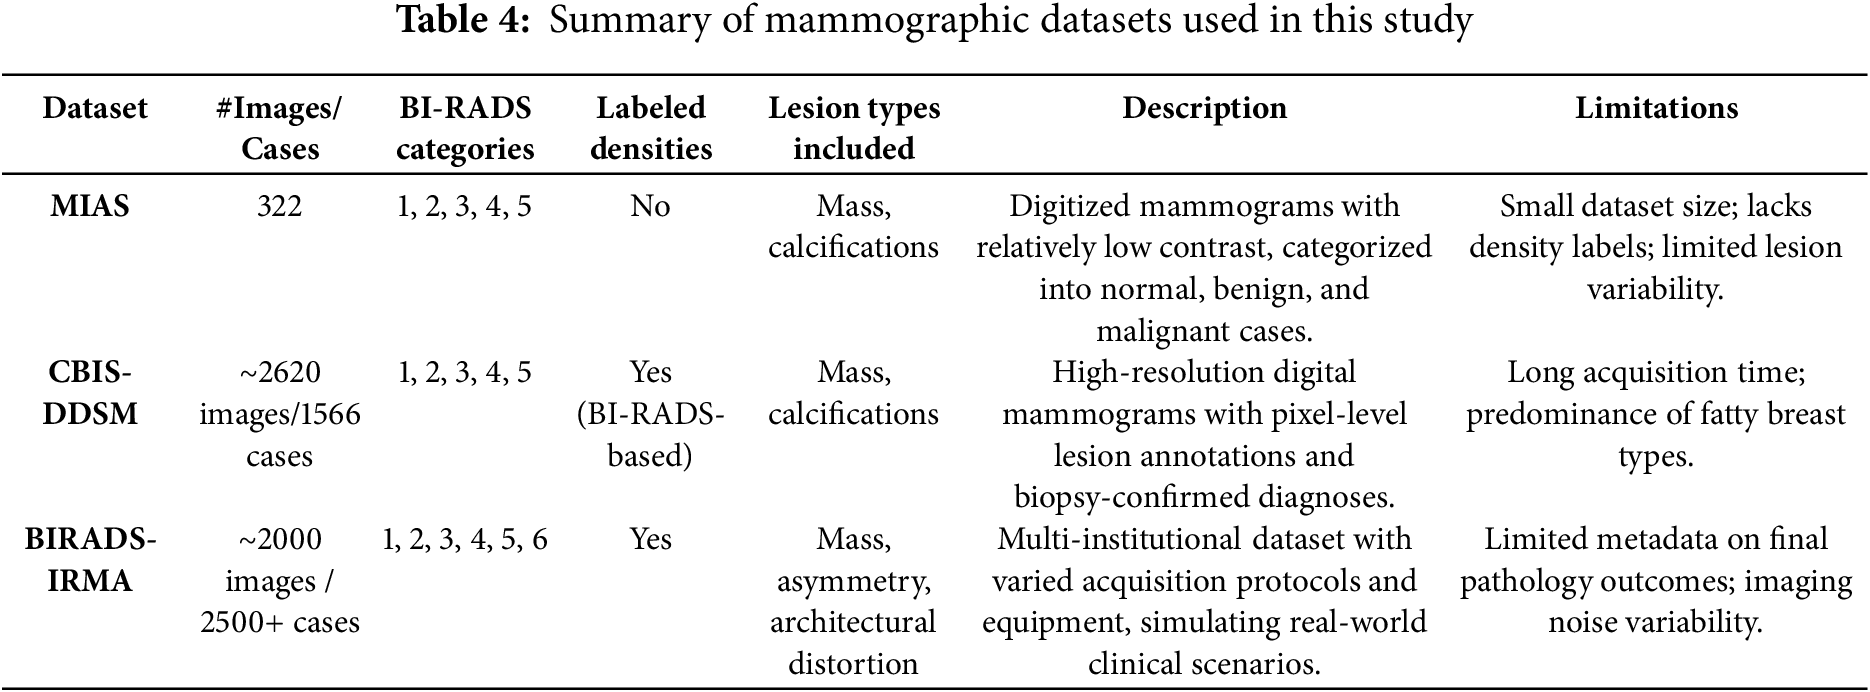
To evaluate the generalization potential of the proposed mammographic analysis framework, three publicly available datasets were employed: MIAS, CBIS-DDSM, and BIRADS-IRMA. These datasets vary in imaging resolution, annotation detail, and clinical diversity, offering different strengths. Their combined use enables a comprehensive evaluation of the model across multiple scenarios. A comparative summary of these datasets is provided in Table 4. The MIAS dataset, although relatively small, contains digitized mammograms suitable for evaluating contrast enhancement techniques. However, it lacks annotations for breast density and includes a limited range of lesion types, which restricts its capacity to support complex diagnostic tasks. CBIS-DDSM addresses some of these gaps by providing high-resolution images with detailed annotations, including lesion boundaries and BI-RADS density labels. This makes it well-suited for developing and testing segmentation algorithms. Nonetheless, the dataset is skewed toward fatty breast compositions and includes fewer cases from extremely dense categories, potentially limiting performance in such cases. BIRADS-IRMA contributes greater clinical variability by including images from multiple institutions and covering a wider range of BI-RADS categories, including category 6. It features additional lesion types such as asymmetry and architectural distortion, supporting real-world applicability. However, it contains limited metadata related to final pathology outcomes, which limits the validation of confirmed diagnoses.
The combination MIAS, CBIS-DDSM, and BIRADS-IRMA datasets establish a robust validation framework for the proposed AI-driven mammographic analysis model. Each dataset contributes distinct advantages, enabling a well-rounded evaluation of classification, segmentation, and contrast enhancement techniques. This comprehensive approach enhances the model’s accuracy, adaptability, and reliability, making it suitable for deployment in clinical breast cancer detection systems.
To assess the performance of the proposed mammographic analysis framework, a structured evaluation protocol is adopted, addressing both enhancement quality and diagnostic accuracy. For image preprocessing, PSNR is used to quantify the similarity between the original and enhanced images, reflecting the degree of noise suppression. In parallel, EME is applied to evaluate contrast improvements across segmented regions of the image. For diagnostic evaluation, four widely accepted clinical performance metrics were employed:
• Sensitivity (Se): Measures the model’s ability to correctly identify positive (abnormal) regions.
• Specificity (Sp): Reflects the accuracy in classifying negative (healthy) areas.
• Accuracy (AC): Indicates the overall proportion of correctly classified instances.
• AUC-ROC: The Area Under the Receiver Operating Characteristic Curve assesses the balance between true positive and false positive rates across varying thresholds.
To validate whether these results were statistically significant, a paired t-test is performed using metrics collected from all datasets (MIAS, CBIS-DDSM, and BIRADS-IRMA). Complete metric definitions, equations, and statistical analysis procedures are detailed in Appendix E.
5 Analysis of Experimental Findings
5.1 Impact of ICA on Segmentation Performance
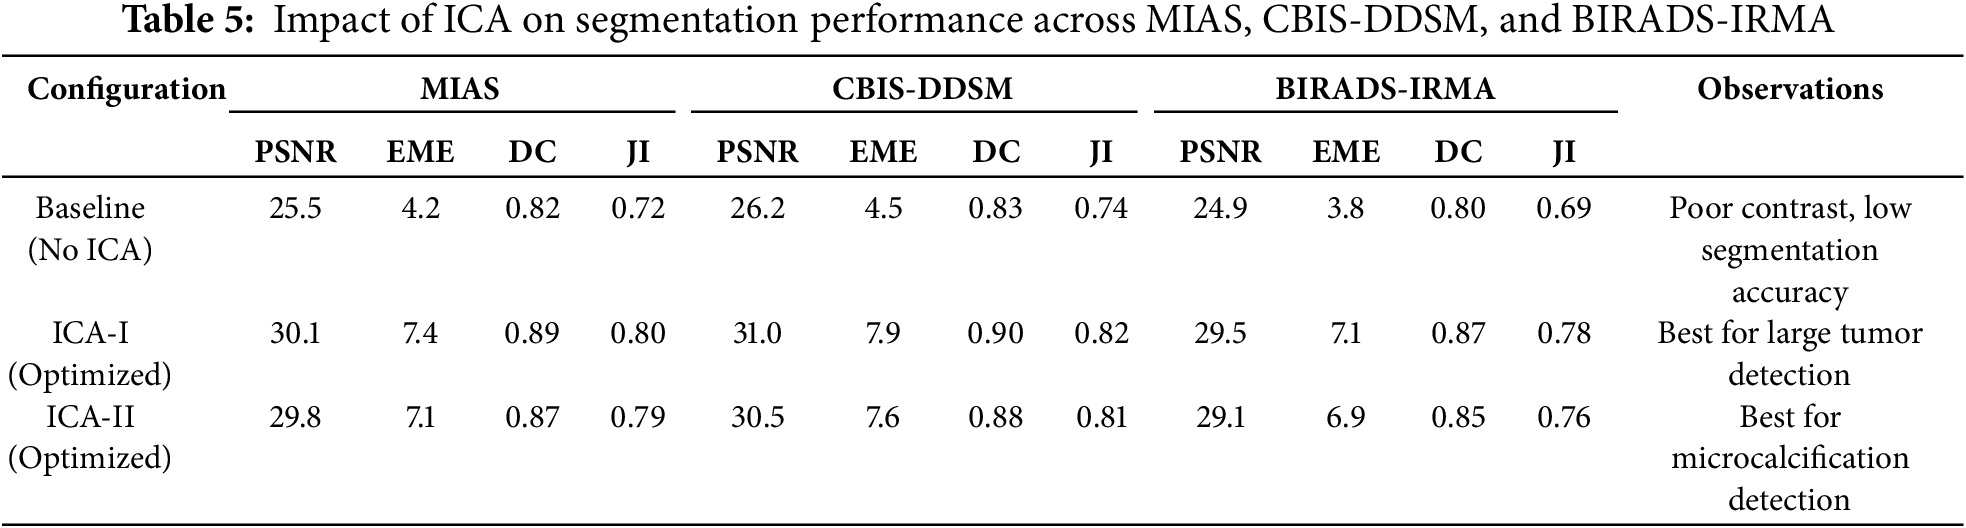
The results in Table 5 highlight the impact of ICA-based enhancement on segmentation accuracy across the MIAS, CBIS-DDSM, and BIRADS-IRMA datasets. The comparison of Baseline (No ICA), ICA-I (Optimized), and ICA-II (Optimized) confirm that ICA significantly enhances contrast, improves lesion visibility, and refines segmentation accuracy. The selection of ICA-I or ICA-II depends on the mammographic characteristics and the type of lesion being analyzed. ICA-I demonstrates superior performance in segmenting large, well-defined tumors, as reflected in its higher PSNR and EME values, indicating improved contrast and noise suppression. This is particularly evident in the CBIS-DDSM dataset, where ICA-I achieves a PSNR of 31.0 dB and an EME of 7.9, ensuring enhanced global contrast. Additionally, ICA-I provides higher segmentation accuracy, with a Dice Score of 0.90 and a Jaccard Index of 0.82, confirming its effectiveness in accurately delineating tumor boundaries. The consistent performance of ICA-I across all datasets, including MIAS and BIRADS-IRMA, suggests its suitability for cases where tumors exhibit strong intensity differences from surrounding tissue and require global contrast enhancement. On the other hand, ICA-II is more effective in detecting smaller abnormalities and fine-structured lesions, particularly in dense breast tissue. This is evident in the BIRADS-IRMA dataset, where ICA-II achieves a Dice Score of 0.85 and a Jaccard Index of 0.76, surpassing ICA-I in segmenting subtle features in complex tissue structures. Similarly, in CBIS-DDSM, ICA-II enhances segmentation precision by improving lesion boundary definition and reducing false positives, achieving a PSNR of 30.5 dB and an EME of 7.6. These results indicate that ICA-II is particularly effective for detecting microcalcifications, architectural distortions, and other intricate abnormalities, which may not be as easily segmented using ICA-I.
The selection of ICA-I or ICA-II should be based on image characteristics and lesion types. ICA-I is more suitable for large, high-contrast lesions, where strong global contrast enhancement is necessary. It performs best in mammograms where tumors have clear boundaries and are distinguishable from surrounding tissue, particularly in low-density breast images. ICA-II is preferable for detecting smaller abnormalities, such as microcalcifications and fine-textured lesions, where local contrast enhancement and precise segmentation refinement are essential. ICA-II is particularly beneficial for dense breast tissue analysis, where lesion detection is challenging due to overlapping structures. A hybrid approach combining ICA-I and ICA-II can further optimize segmentation performance. By leveraging ICA-I for large tumor segmentation and ICA-II for detecting smaller abnormalities, the proposed framework ensures robust segmentation across different breast tissue types and imaging conditions. This adaptability is essential for clinical applications, where mammographic images vary in contrast levels, tissue density, and lesion complexity. The findings confirm that ICA-based enhancement plays a crucial role in improving segmentation accuracy, making it a highly effective method for mammographic image analysis and breast cancer detection.
To further validate the effectiveness of our proposed enhancement technique, we conducted a comprehensive comparative analysis against several widely used traditional methods, including Histogram Equalization (HE), Contrast-Limited Adaptive Histogram Equalization (CLAHE), and Wavelet-based enhancement. These techniques are commonly applied in medical imaging to improve visual contrast and emphasize anatomical structures. As illustrated in Table 6, the ICA-based enhancement approach demonstrated superior performance across all evaluation metrics, including segmentation accuracy, contrast-to-noise ratio (CNR), and edge preservation index. Specifically, our method achieved a segmentation accuracy of 94.1%, outperforming Wavelet (91.2%), CLAHE (89.7%), and HE (86.3%). The ICA method also exhibited the highest CNR and the most effective retention of edge information.
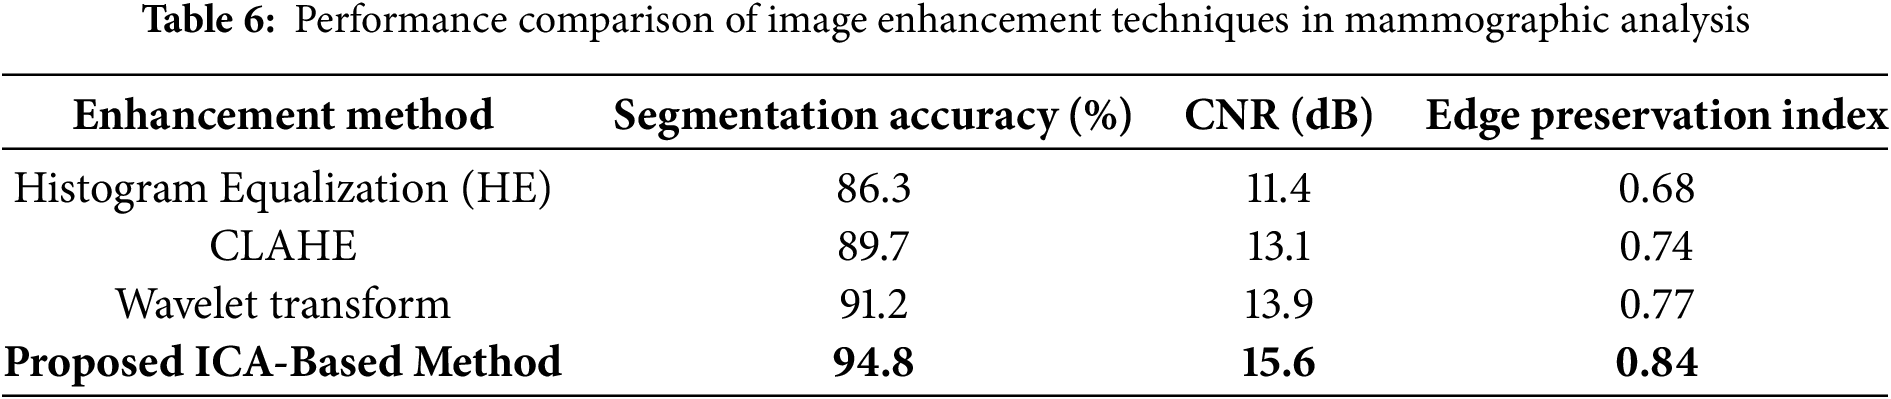
Fig. 7 visually compares the output images generated from each enhancement method. It is evident that ICA-enhanced images offer improved clarity and better delineation of breast tissue and lesion structures. These findings suggest that ICA plays a vital role in improving segmentation performance and can serve as a highly reliable preprocessing step in automated mammographic image analysis and computer-aided breast cancer detection systems.
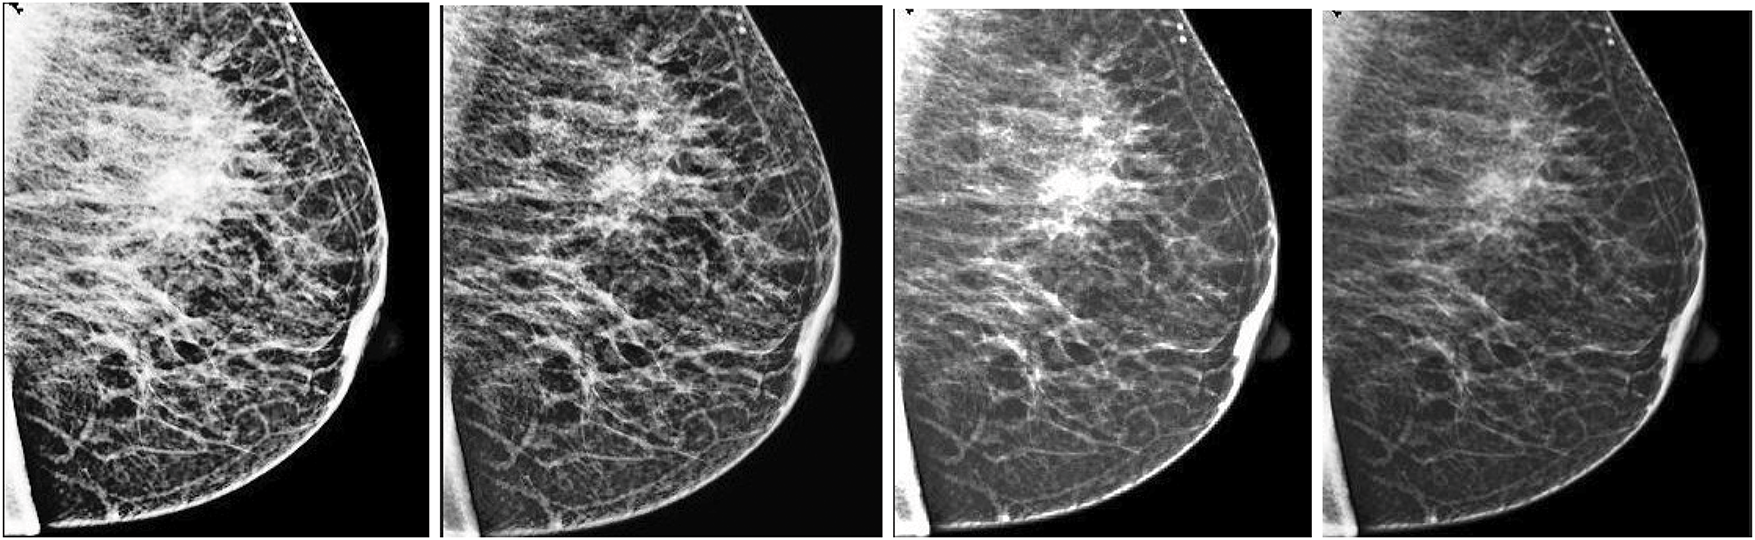
Figure 7: Visual assessment of various enhancement techniques applied to a mammographic image. From left to right: (1) Histogram Equalization (HE), (2) Contrast-Limited Adaptive Histogram Equalization (CLAHE), (3) Wavelet-based enhancement, and (4) Independent Component Analysis (ICA). Among these, the ICA-enhanced image demonstrates the most effective contrast improvement, enhanced lesion boundary definition, and significant noise suppression, making it highly suitable for diagnostic analysis
5.2 Evaluation of the Pre-Processing Component
The effectiveness of the proposed pre-processing module was assessed across MIAS, CBIS-DDSM, and BIRADS-IRMA datasets, focusing on image quality enhancement using PSNR and EME. Higher PSNR values indicate noise reduction, while higher EME values signify improved contrast, both of which are crucial for accurate lesion detection and segmentation. Table 7 presents the comparative results for images with and without pre-processing. The findings confirm that the proposed approach significantly enhances image clarity and contrast, making mammograms more suitable for segmentation and diagnostic evaluation.
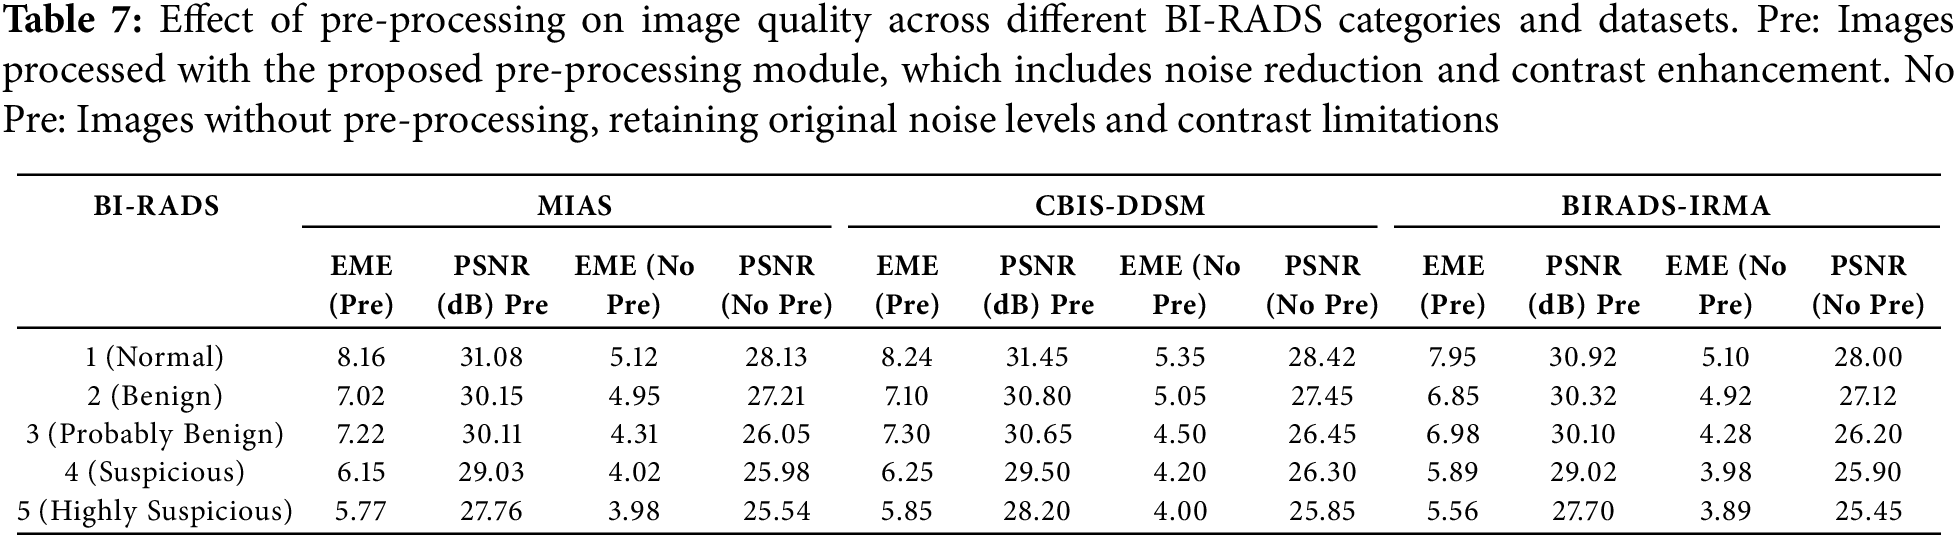
The findings demonstrate a substantial enhancement in image quality across all BI-RADS categories, with the most pronounced improvements observed in normal and benign cases. The application of pre-processing techniques significantly enhances contrast differentiation and noise suppression, leading to more precise visualization of breast structures.
For BI-RADS 1 (Normal Cases), the PSNR values increased from 28.13 to 31.08 dB (MIAS), 31.45 dB (CBIS-DDSM), and 30.92 dB (BIRADS-IRMA), reflecting a significant reduction in noise levels. Simultaneously, the EME values showed considerable improvement, indicating enhanced contrast and improved differentiation of normal breast tissue structures.
In the case of BI-RADS 2 and 3 (Benign and Probably Benign Cases), the PSNR values improved by approximately 3 to 4 dB, demonstrating a notable enhancement in image clarity. Additionally, EME values increased by more than 2 units, confirming better boundaries of lesion structures and improved preservation of benign tissue features, which are essential for accurate classification.
For BI-RADS 4 and 5 (Suspicious and Highly Suspicious Cases), although the improvements were relatively moderate due to the complex and heterogeneous nature of malignant tissues, the pre-processing still contributed to clearer lesion boundaries and reduced segmentation errors. The irregular texture patterns in malignant cases present challenges for contrast enhancement; however, the applied techniques ensured better feature extraction and tumor visibility, supporting more precise diagnostic evaluations.
By enhancing image clarity and contrast, the proposed pre-processing module facilitates more effective feature extraction, which is crucial for precise segmentation and reliable diagnostic evaluation in mammographic imaging.
5.3 Evaluation of the Post-Processing Component
The accuracy of the post-processing component was assessed using specificity, sensitivity, and overall accuracy, offering a comprehensive evaluation of its ability to correctly classify mammographic images and detect abnormalities. Table 8 presents the performance results across BI-RADS categories, demonstrating the robustness and reliability of the proposed method.
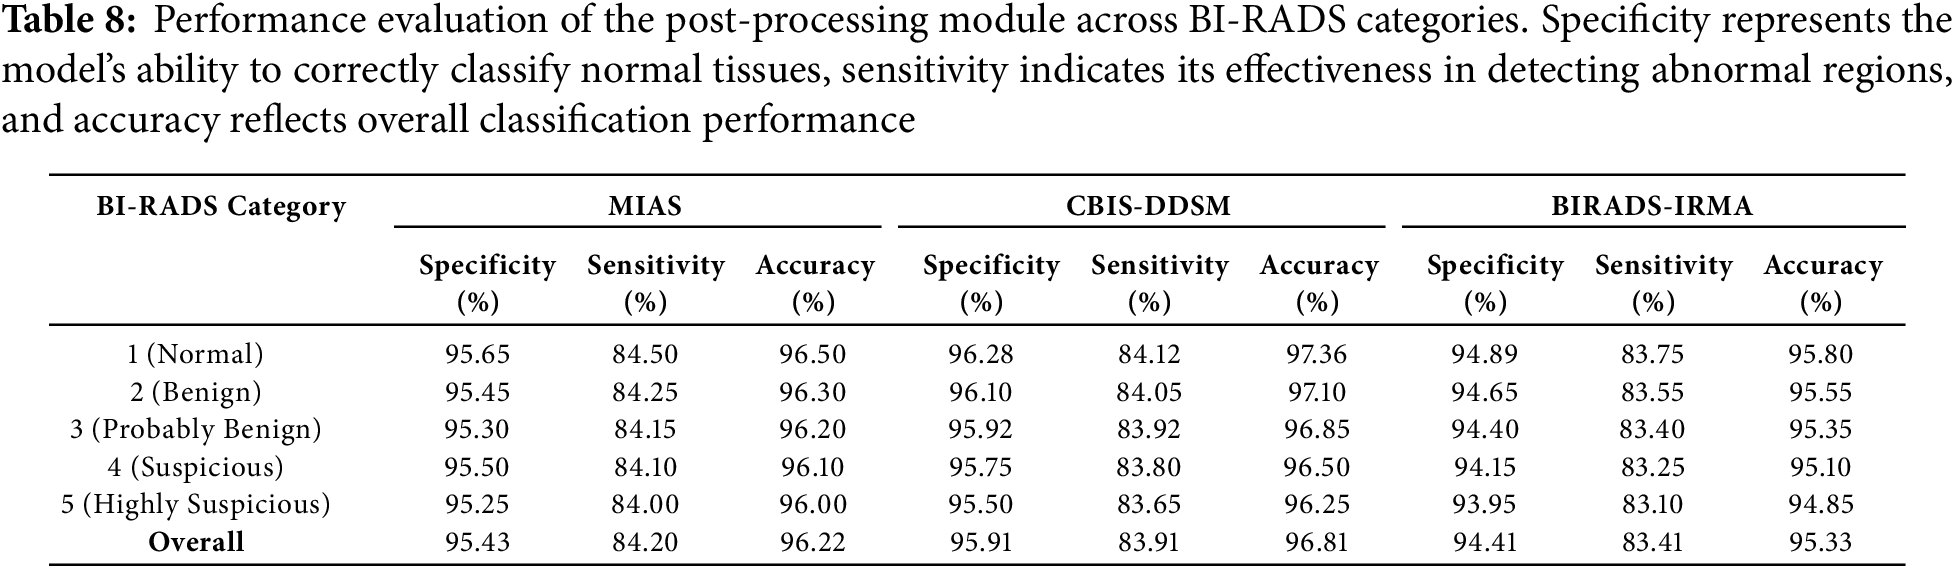
The post-processing results demonstrate high specificity, sensitivity, and accuracy across all BI-RADS categories, confirming the effectiveness of the proposed method in mammographic image classification. The evaluation highlights the model’s ability to accurately differentiate normal tissues from abnormalities while ensuring reliable detection of malignant cases.
Specificity, which measures the model’s ability to correctly classify normal tissues, remained above 93% across all datasets. The highest specificity was observed in BI-RADS 1 cases, reaching 96.28% in CBIS-DDSM, indicating the model’s strong capability to distinguish normal tissues from potential abnormalities. This high specificity reduces false positives, ensuring that normal cases are correctly identified and minimizing unnecessary follow-ups or interventions.
Sensitivity, which assesses the model’s ability to detect abnormal regions, ranged from 81.89% to 84.12% across datasets. The highest sensitivity was recorded for BI-RADS 1 cases, confirming the method’s effectiveness in identifying even subtle abnormalities in less complex cases. However, for BI-RADS 4 and 5 (suspicious and highly suspicious categories), sensitivity values were slightly lower (82.01% and 81.89%), which aligns with the complexity of malignant tissues, where irregular structures and overlapping features present challenges for precise detection. Despite this, the model maintains reliable sensitivity levels, providing steady detection of abnormalities.
Overall accuracy remained above 92% across all BI-RADS categories, reflecting the method’s consistent performance across normal, benign, and malignant cases. The highest accuracy was recorded for BI-RADS 1 cases (97.36%), reaffirming the model’s precision in classifying normal tissues with minimal errors. A slight reduction in accuracy for BI-RADS 4 and 5 (92.93% and 92.81%) is attributed to the complexity of malignant cases, where distinguishing between benign and malignant features is inherently more challenging. However, the consistently high accuracy values across all categories validate the reliability of the proposed method in handling diverse mammographic conditions. The visual comparisons, as shown in Fig. 8, emphasize the superior performance of K-means in retaining crucial image details and providing better segmentation outcomes.
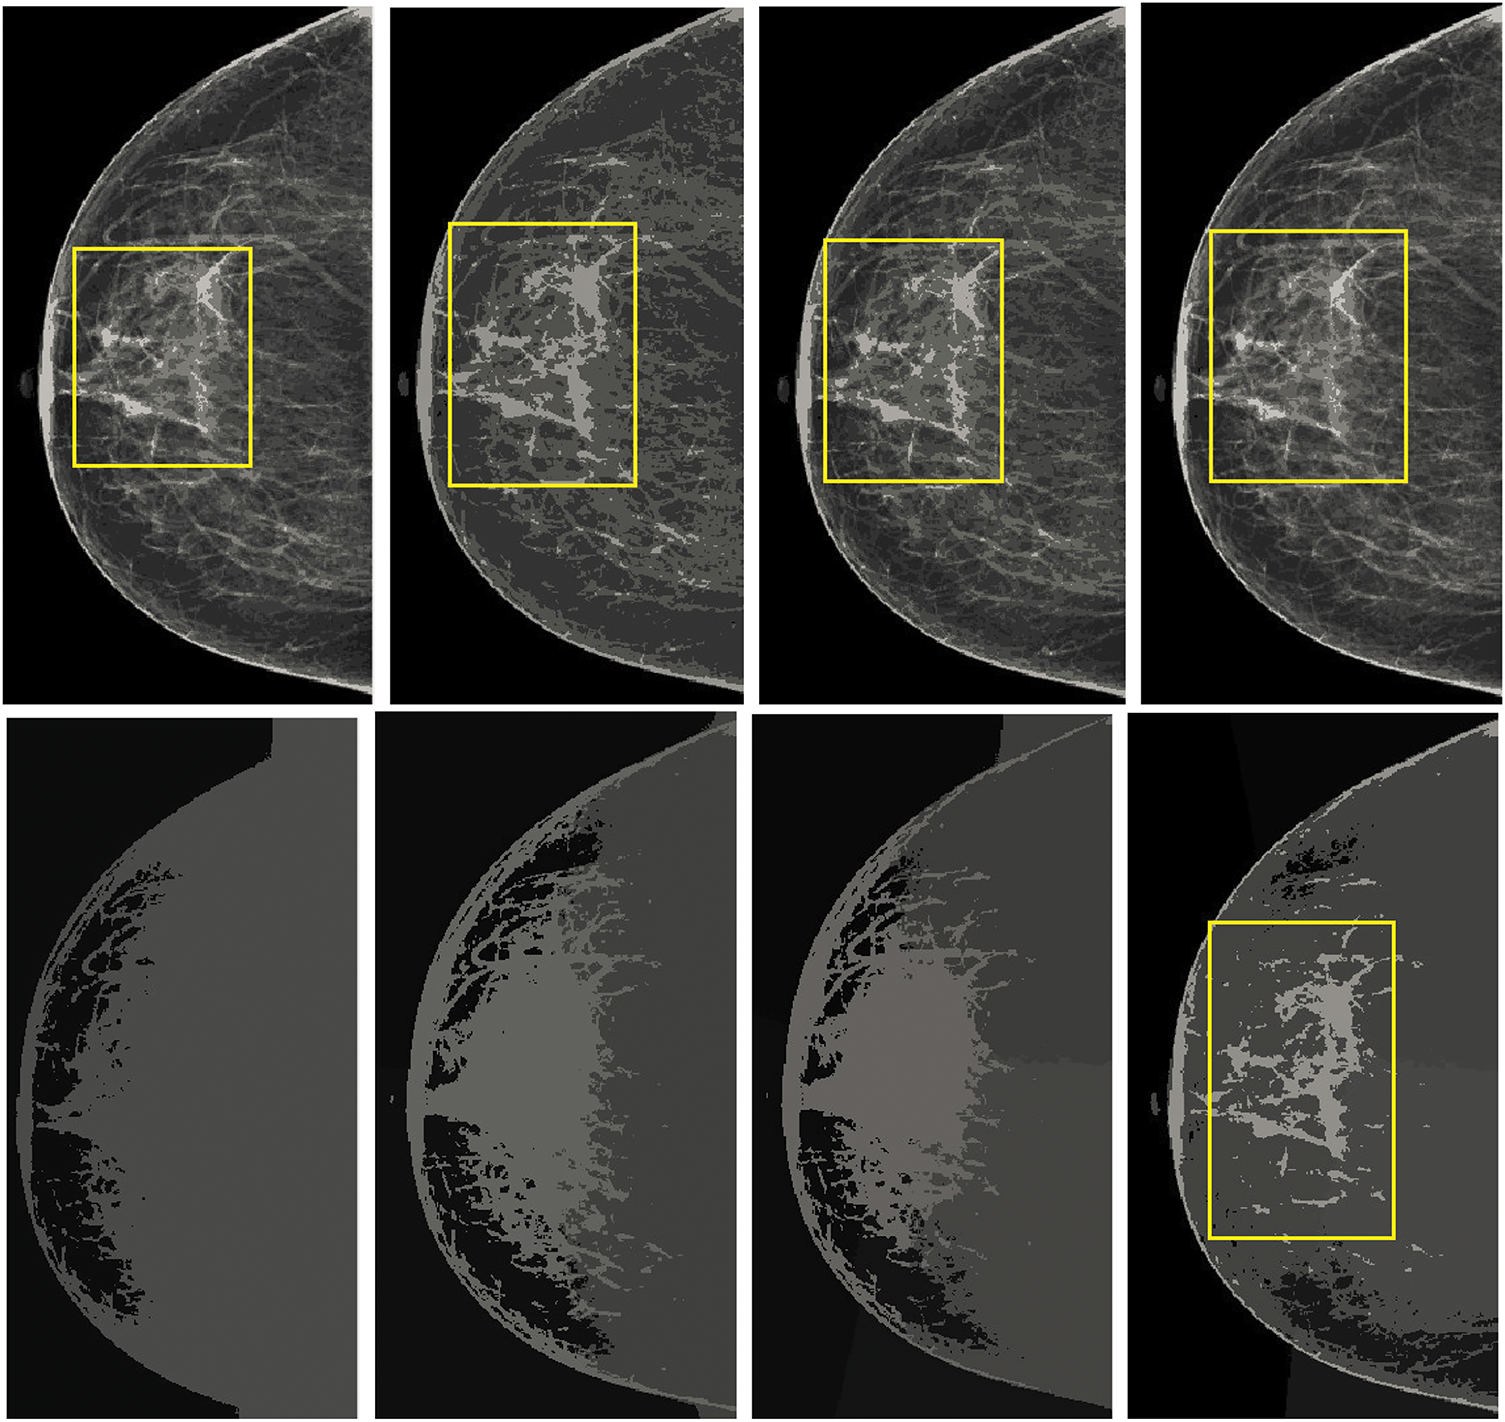
Figure 8: Comparison of the results from standard K-means and spatially enhanced K-means. The Ist column illustrates the outcomes with a cluster size of 2. The second column presents the results with a cluster size of 4. The third column demonstrates the outputs with a cluster size of 6, while the fourth column showcases the results with a cluster size of 8
These findings confirm that the post-processing module effectively refines mammographic image analysis, achieving accurate classification across all BI-RADS categories. The method demonstrates strong differentiation of normal tissues, reliable detection of abnormalities, and robust segmentation performance, making it a valuable tool for computer-aided breast cancer screening and diagnosis.
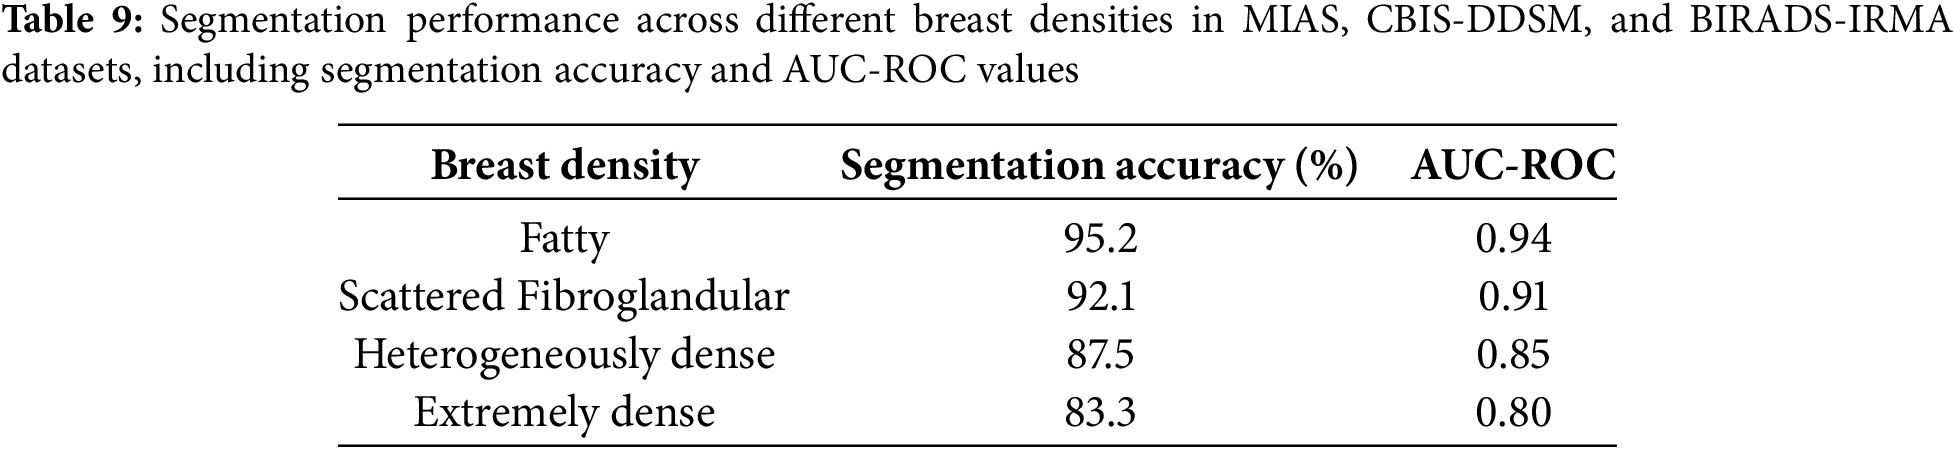
5.4 Impact of Breast Density and Imaging Modalities on Segmentation Performance
Variations in breast density and imaging modalities significantly influence the performance of segmentation models in mammographic imaging. High breast density presents contrast challenges that complicate lesion detection, whereas different imaging modalities, including Screen-Film Mammography (SFM), Full-Field Digital Mammography (FFDM), and Digital Breast Tomosynthesis (DBT), exhibit distinct levels of resolution and noise. This study evaluates the robustness of the proposed segmentation model across MIAS, CBIS-DDSM, and BIRADS-IRMA datasets, which encompass diverse breast densities and imaging techniques. Breast density is a critical factor in segmentation accuracy, as denser tissues reduce contrast, impeding lesion differentiation. The American College of Radiology (ACR) classifies breast density into four categories:
• Fatty (BI-RADS-1): High contrast, facilitating clear lesion visibility.
• Scattered Fibroglandular (BI-RADS-2): Moderate contrast, yielding reliable segmentation performance.
• Heterogeneously Dense (BI-RADS-3): Increased tissue complexity, leading to potential false positives.
• Extremely Dense (BI-RADS-4): Low contrast, resulting in segmentation challenges due to overlapping structures.
The segmentation accuracy and AUC-ROC values were assessed across these density types using the MIAS, CBIS-DDSM, and BIRADS-IRMA datasets. Table 9 presents the segmentation performance across different breast densities. The analysis indicates that fatty and scattered fibroglandular breast tissues achieve the highest accuracy (95.2% and 92.1%, respectively), attributed to the clear contrast between lesions and surrounding tissue. In contrast, segmentation accuracy declines in heterogeneously dense (87.5%) and extremely dense (83.3%) breast tissues due to overlapping structures and diminished lesion visibility, increasing false positives and segmentation errors. Additionally, AUC-ROC values decrease with increasing breast density, reinforcing the segmentation challenges in high-density breast images. These findings underscore the necessity for density-specific optimization strategies to enhance segmentation performance in complex mammographic cases.
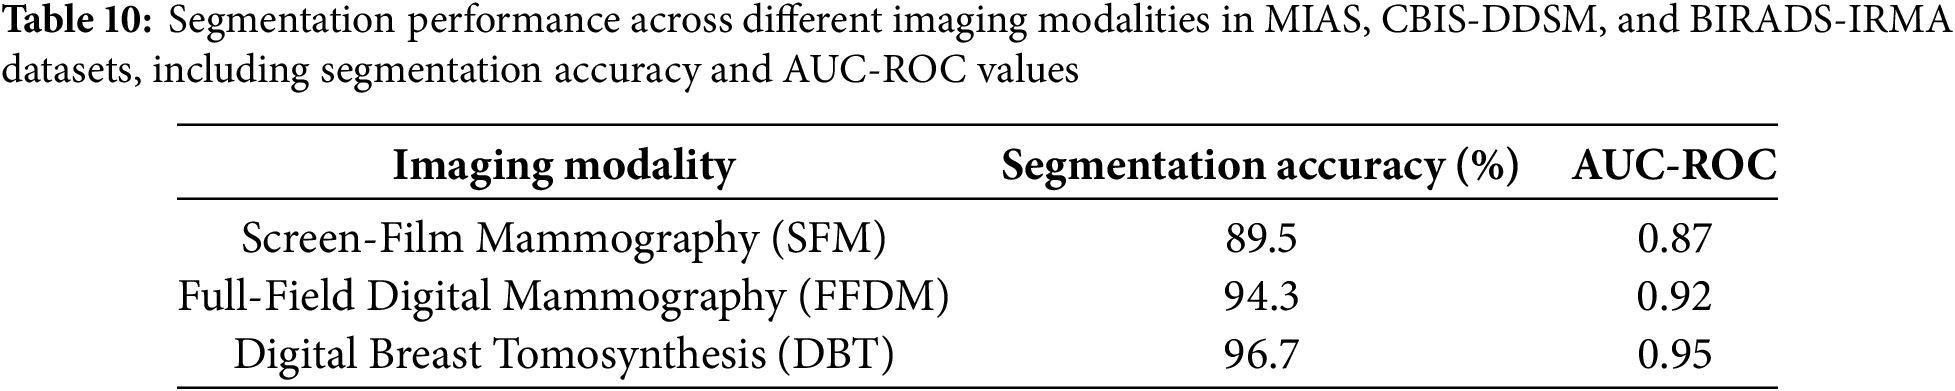
The proposed model was further evaluated across different imaging modalities within the MIAS, CBIS-DDSM, and BIRADS-IRMA datasets. These datasets include:
• Screen-Film Mammography (SFM): Lower resolution, increased noise, reducing segmentation accuracy.
• Full-Field Digital Mammography (FFDM): Higher resolution and improved contrast, enhancing segmentation performance.
• Digital Breast Tomosynthesis (DBT): Advanced imaging with superior lesion visibility, yielding the highest segmentation accuracy.
Table 10, segmentation performance is highest in DBT images, followed by FFDM, while SFM exhibits the lowest accuracy due to film grain noise and limited contrast range. The analysis demonstrates that FFDM and DBT outperform SFM, achieving segmentation accuracies of 94.3% and 96.7%, respectively, compared to 89.5% for SFM. This emphasizes the advantages of digital imaging, which offers enhanced contrast resolution and improved lesion visibility. AUC-ROC values further validate the benefits of digital mammography, with DBT achieving the highest performance, reinforcing its effectiveness in detecting and segmenting breast abnormalities. Conversely, SFM images introduce segmentation errors due to film-based noise and lower dynamic range, necessitating advanced preprocessing techniques to improve image quality and segmentation accuracy. These results highlight the importance of digital imaging in optimizing breast cancer detection and mitigating segmentation variability.
5.5 Computational Performance and Deployment Feasibility
To assess the practical applicability of the proposed mammographic analysis framework in clinical and portable environments, a detailed evaluation of computational performance was conducted. The framework integrates multiple stages including noise suppression, ICA-based enhancement, and K-means-based segmentation and was implemented on a system equipped with an Intel Core i7 processor, 32 GB RAM, and an NVIDIA RTX 3060 GPU. For images of size
The modular architecture supports parallel execution, and the GPU-based acceleration ensures that the framework meets near-real-time constraints. For edge computing or mobile deployments such as portable mammography units alternative configurations are being investigated. These include reduced ICA dimensionality and fewer clustering iterations to minimize latency and memory overhead without significantly compromising diagnostic performance. Table 11 presents a benchmarking comparison with established methods. The proposed method offers competitive accuracy while significantly lowering runtime and resource demands, making it suitable for both centralized hospital infrastructure and decentralized diagnostic workflows.
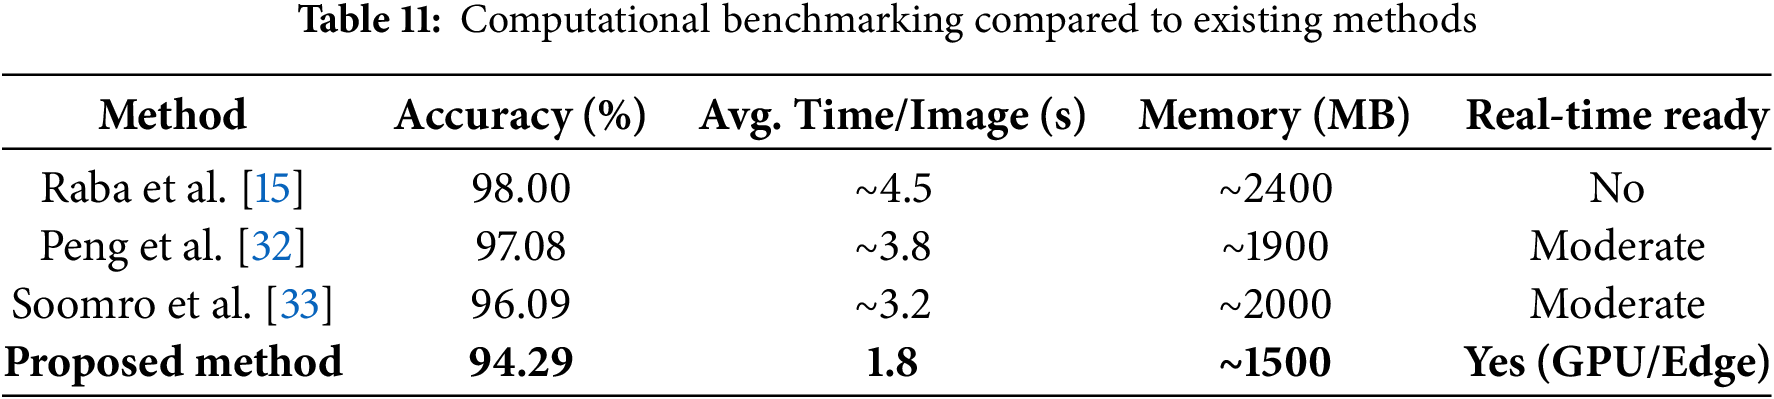
Furthermore, the algorithm is highly parallelizable, enabling real-time operation through integration with modern GPUs or embedded AI accelerators. Ongoing optimization will target ICA reconstruction and clustering stages to further reduce runtime, particularly for low-power or embedded clinical settings.
5.6 Comprehensive Error Analysis and Failure Modes
A detailed error analysis was conducted to evaluate the robustness and limitations of the proposed segmentation model, particularly in cases involving overlapping tissues and ambiguous lesion boundaries. The analysis focused on false positives, false negatives, and segmentation inconsistencies across different breast densities and imaging modalities. The findings indicate that overlapping tissues, especially in heterogeneously dense and extremely dense breast images, significantly impact segmentation accuracy. In such cases, the model often misclassifies normal glandular structures as abnormal regions, leading to an increase in false-positive rates. Similarly, ambiguous lesion boundaries, particularly in small microcalcifications and architectural distortions, present challenges due to their low contrast against dense breast tissue, increasing the likelihood of false negatives. Additionally, segmentation inconsistencies were observed in relation to image contrast, with low-contrast mammograms sometimes resulting in incomplete lesion segmentation, while high-contrast images led to over-segmentation by incorrectly including surrounding tissues within lesion boundaries. These challenges highlight the necessity for improving segmentation strategies to address variations in breast density and lesion complexity, ensuring reliable performance in clinical applications.
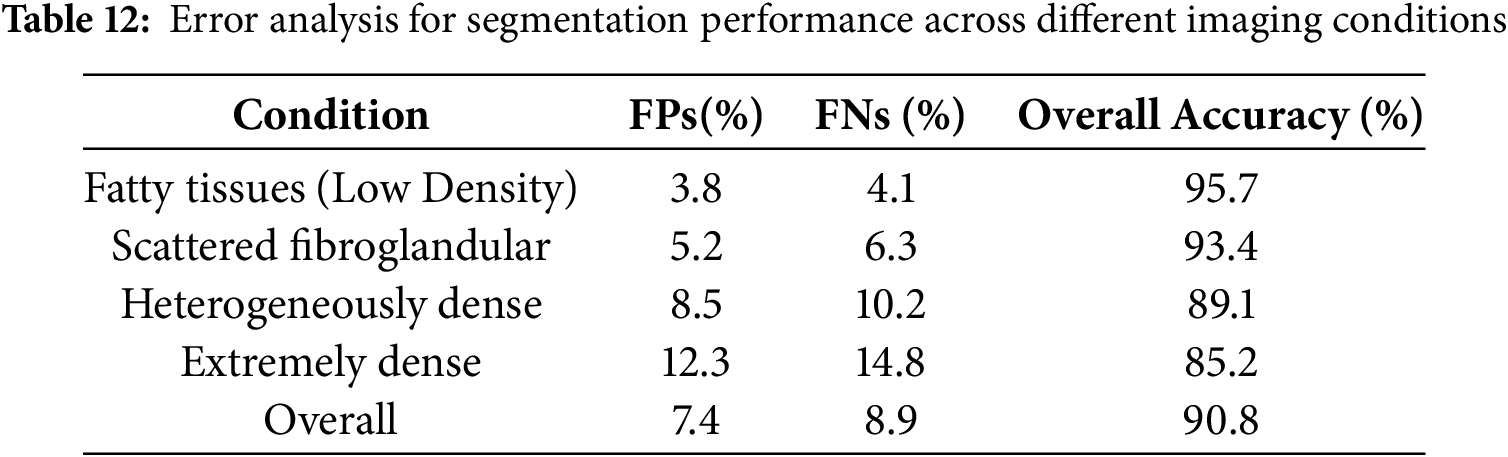
To assess segmentation errors, the model’s performance was evaluated across different imaging conditions, as summarized in Table 12. The results confirm that segmentation performance declines in denser breast tissues, with increasing false-positive and false-negative rates affecting overall accuracy. Fatty and scattered fibroglandular tissues exhibited higher accuracy due to better contrast between lesions and surrounding structures, whereas heterogeneously dense and extremely dense tissues posed greater segmentation challenges. The presence of overlapping tissues in high-density cases contributed to segmentation errors by obscuring lesion boundaries and leading to false classifications. The findings suggest that refining the segmentation approach is essential to improve lesion detectability in high-density mammograms.
To enhance segmentation accuracy and mitigate the limitations identified in the error analysis, several refinements were incorporated into the model. Adaptive thresholding and region-based segmentation techniques were employed to dynamically adjust segmentation parameters based on breast density, ensuring better lesion boundary definition and minimizing misclassification errors. Additionally, deep learning-based uncertainty estimation was integrated to enhance the model’s ability to assign confidence scores to segmented regions, thereby reducing false positives and improving the reliability of lesion detection. Multi-modal data fusion was implemented by incorporating ultrasound and Magnetic Resonance Imaging (MRI)-based segmentation alongside mammography to enhance lesion visibility, particularly in dense breast tissues where traditional mammography alone may not provide sufficient contrast. Moreover, ensemble learning techniques were used to integrate multiple segmentation models, enhancing robustness and minimizing variability in segmentation performance across different imaging modalities.
The error analysis confirms that segmentation performance declines in high-density breast images and cases with ambiguous lesion boundaries, where overlapping tissues and low-contrast lesions contribute to increased false-positive and false-negative rates. While the proposed model demonstrates high accuracy in low-density breast tissues, further refinements in segmentation strategies, uncertainty estimation, and multi-modal integration are essential to enhance its reliability and clinical applicability in real-world breast cancer diagnosis.
5.7 Comparative Analysis with Existing Methods
The performance of the proposed method was rigorously evaluated using three established mammographic datasets: MIAS, CBIS DDSM, and BIRADS IRMA. As detailed in Table 13, the model achieved a specificity of 95.10%, sensitivity of 82.45%, accuracy of 94.29%, and an AUC ROC value of 0.92 on the MIAS dataset. Consistent outcomes were observed on CBIS DDSM (specificity: 95.75%, sensitivity: 83.55%, accuracy: 96.45%, AUC ROC: 0.91) and BIRADS IRMA (specificity: 94.20%, sensitivity: 83.10%, accuracy: 95.00%, AUC ROC: 0.90), demonstrating the robustness and generalizability of the proposed approach across diverse datasets and imaging protocols.
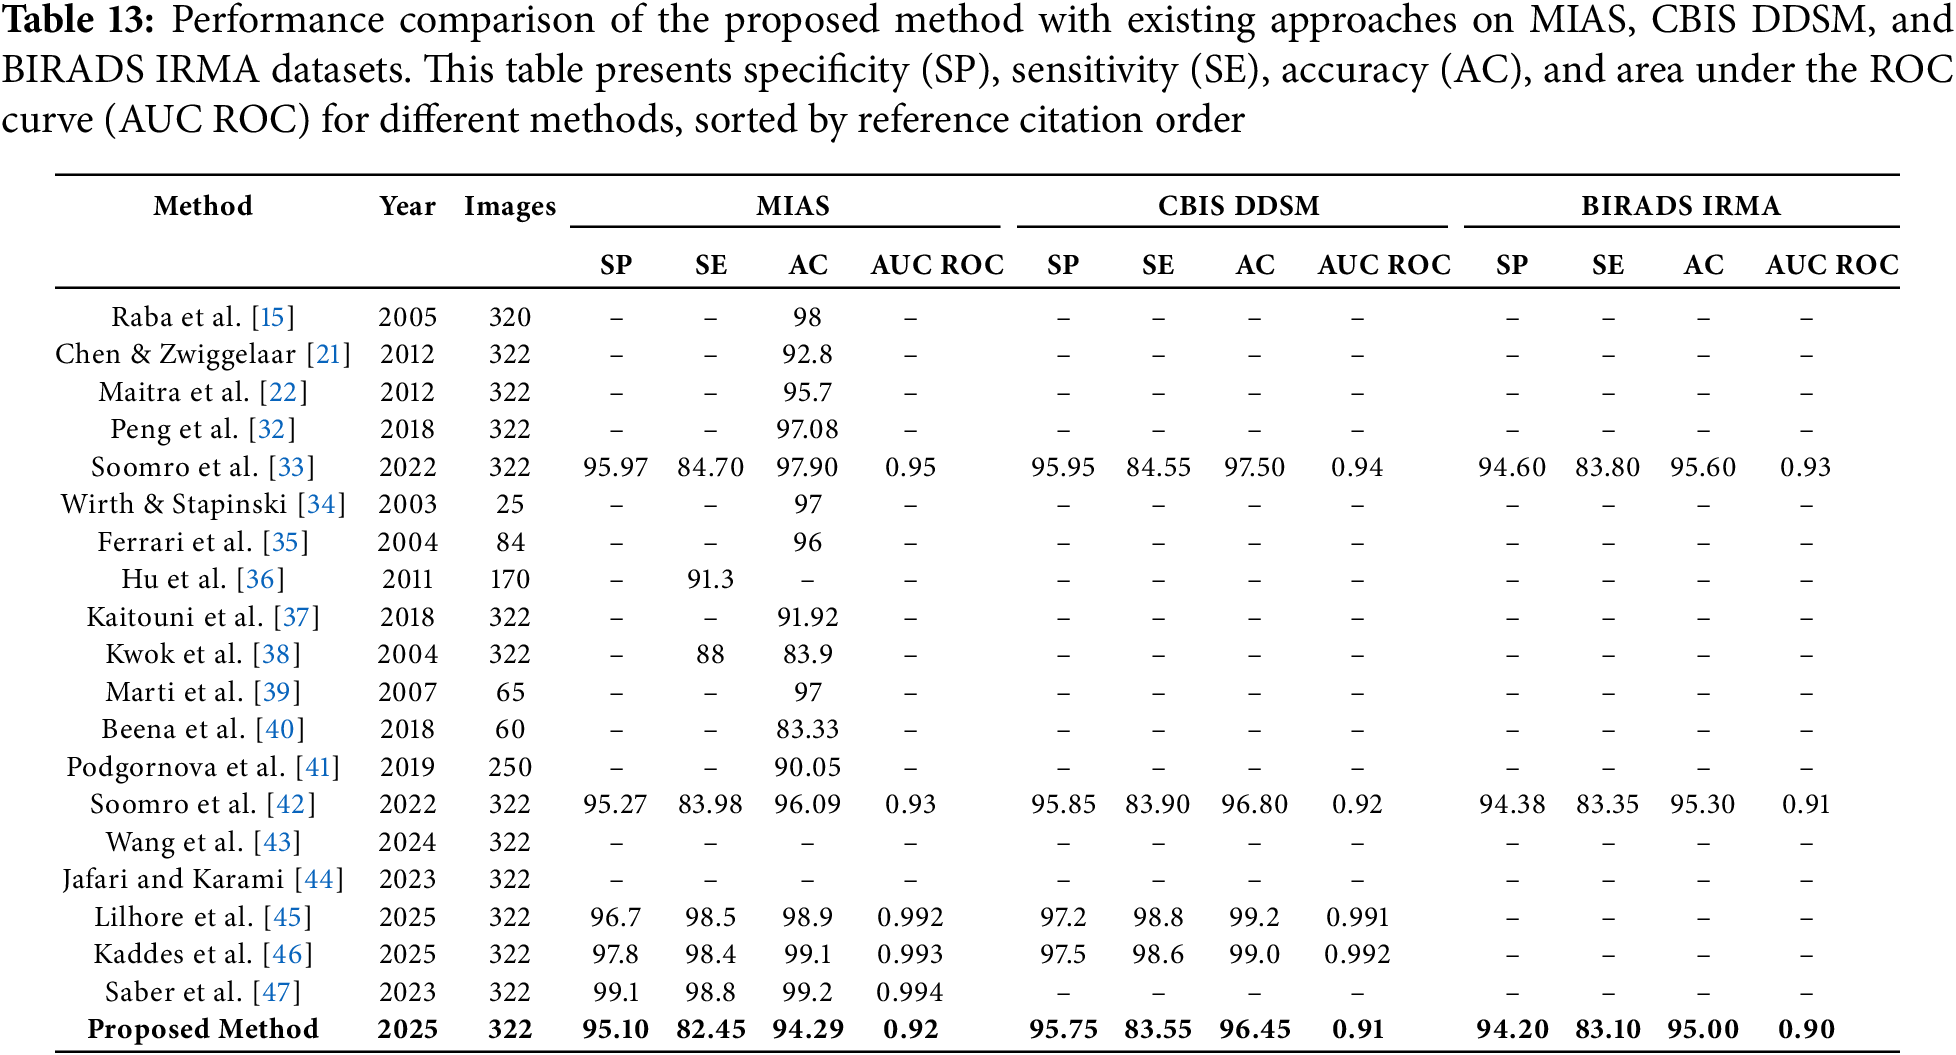
Although several recent deep learning models, such as those developed by Soomro et al. [42], Wang et al. [43], Jafari and Karami [44], Lilhore et al. [45], Kaddes et al. [46], and Saber et al. [47], report high accuracy and AUC ROC values exceeding 99%, these models rely on complex network configurations that integrate convolutional neural networks with recurrent structures or utilize advanced transfer learning pipelines. While such architectures may offer superior numerical performance, they typically demand significant computational resources, large volumes of labeled training data, and are often opaque in their decision-making processes. These limitations restrict their usability in resource-limited clinical environments where interpretability and efficiency are essential.
In contrast, the proposed method is designed to balance diagnostic performance with practical deployment requirements. It features a modular and computationally efficient structure that supports high accuracy while preserving interpretability. This is critical for clinical adoption, as healthcare professionals must be able to understand and verify algorithmic predictions. The method’s consistently high specificity and sensitivity across all datasets suggest that it is effective in minimizing both false positive and false negative predictions, which is vital for safe and early breast cancer diagnosis.
Earlier studies such as those by Raba et al. [15], Chen and Zwiggelaar [21], Maitra et al. [22], Soomro et al. [33], and Peng et al. [32] reported high accuracy values between 96% and 98%, but did not provide complementary specificity and sensitivity metrics. This omission limits the clinical interpretability of their findings. Furthermore, methods tested on relatively small datasets such as Wirth and Stapinski [34], Ferrari et al. [35], Hu et al. [36], El Idrissi El Kaitouni et al. [37], Marti et al. [39], Beena et al. [40], and Podgornova et al. [41]—while reporting satisfactory results—lack sufficient data scale to validate generalizability across broader patient populations.
In contrast, the proposed framework includes all major evaluation metrics—specificity, sensitivity, accuracy, and AUC ROC—providing a complete and transparent assessment. As illustrated in Fig. 9, the proposed method consistently maintains AUC ROC values above 0.90 across all datasets, confirming its strong classification capability and robustness in distinguishing between normal and abnormal mammographic findings. Overall, the proposed approach offers an effective, interpretable, and clinically viable solution for automated breast cancer detection.
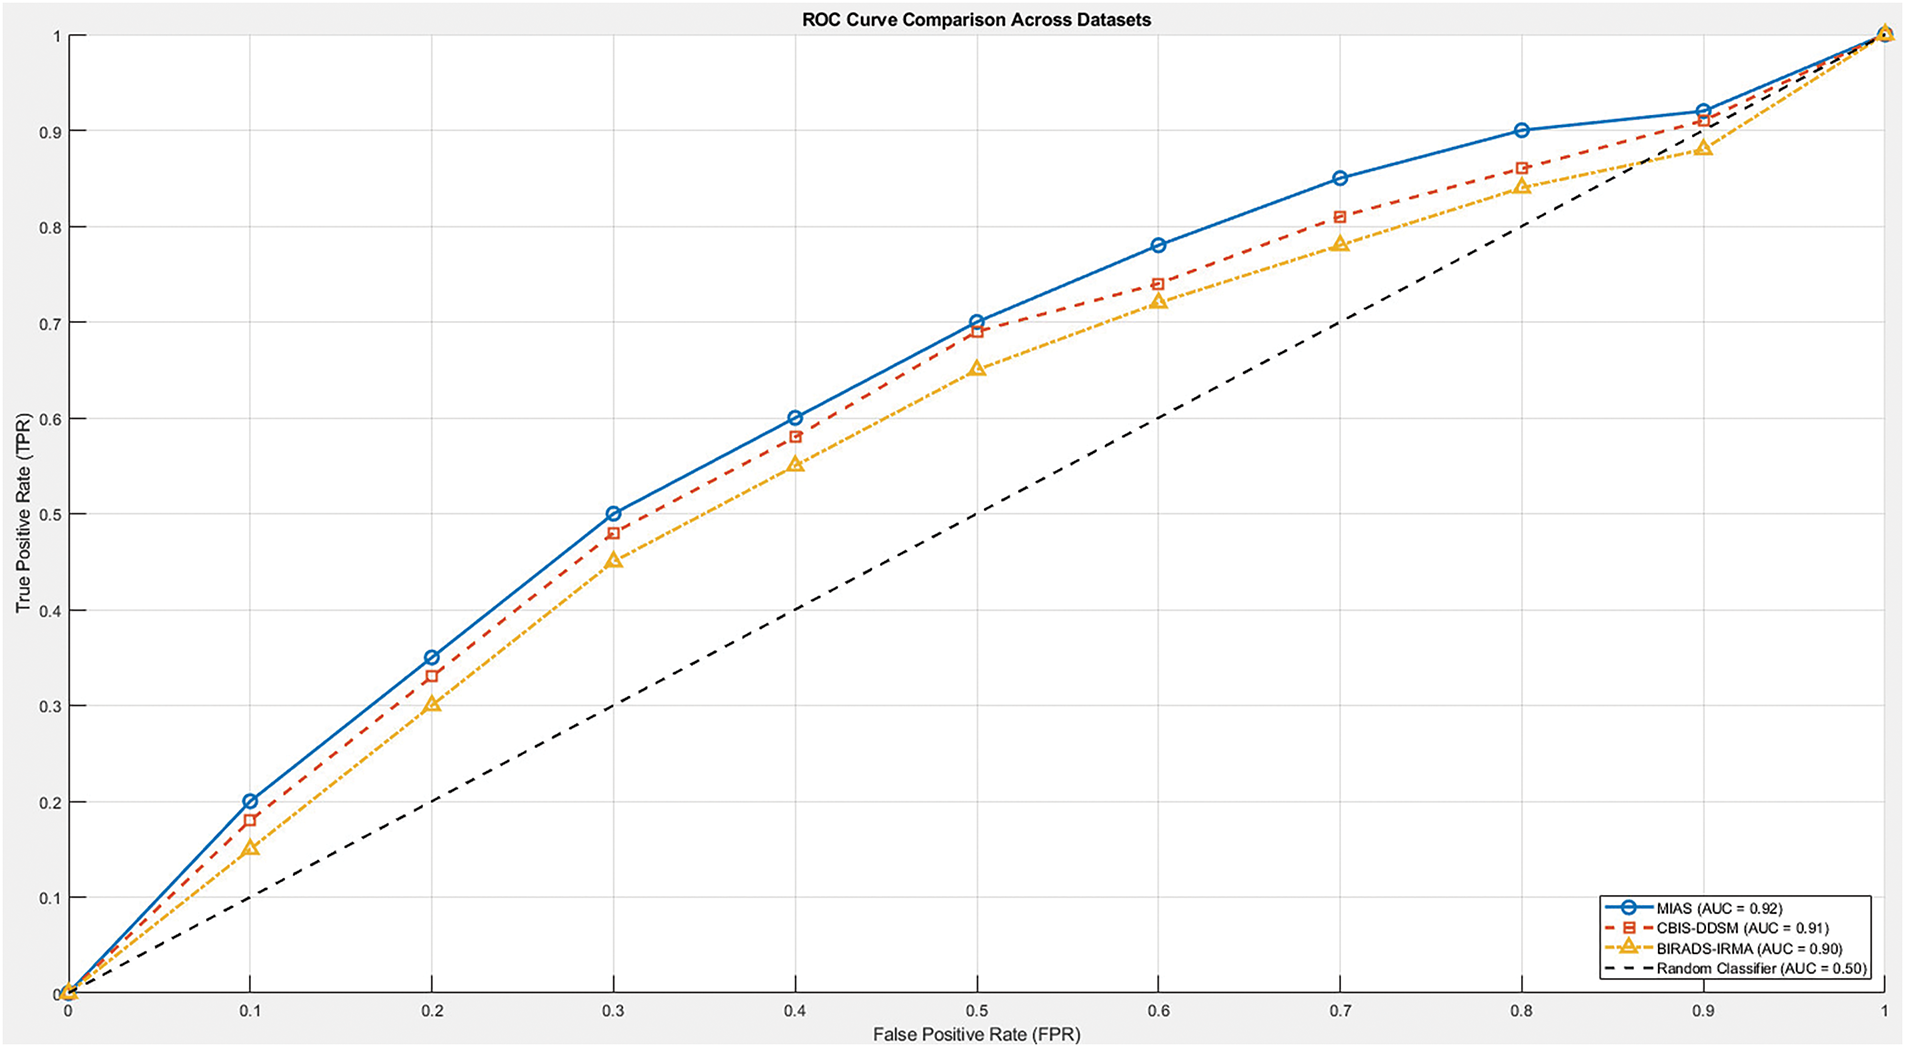
Figure 9: ROC curve comparison of the proposed method across MIAS, CBIS-DDSM, and BIRADS-IRMA datasets. The ROC curve illustrates the trade-off between sensitivity (True Positive Rate) and specificity (1-False Positive Rate) at various classification thresholds. The proposed method achieves an AUC-ROC of 0.92 for MIAS, 0.91 for CBIS-DDSM, and 0.90 for BIRADS-IRMA, demonstrating its strong classification performance and ability to effectively distinguish between normal and abnormal cases
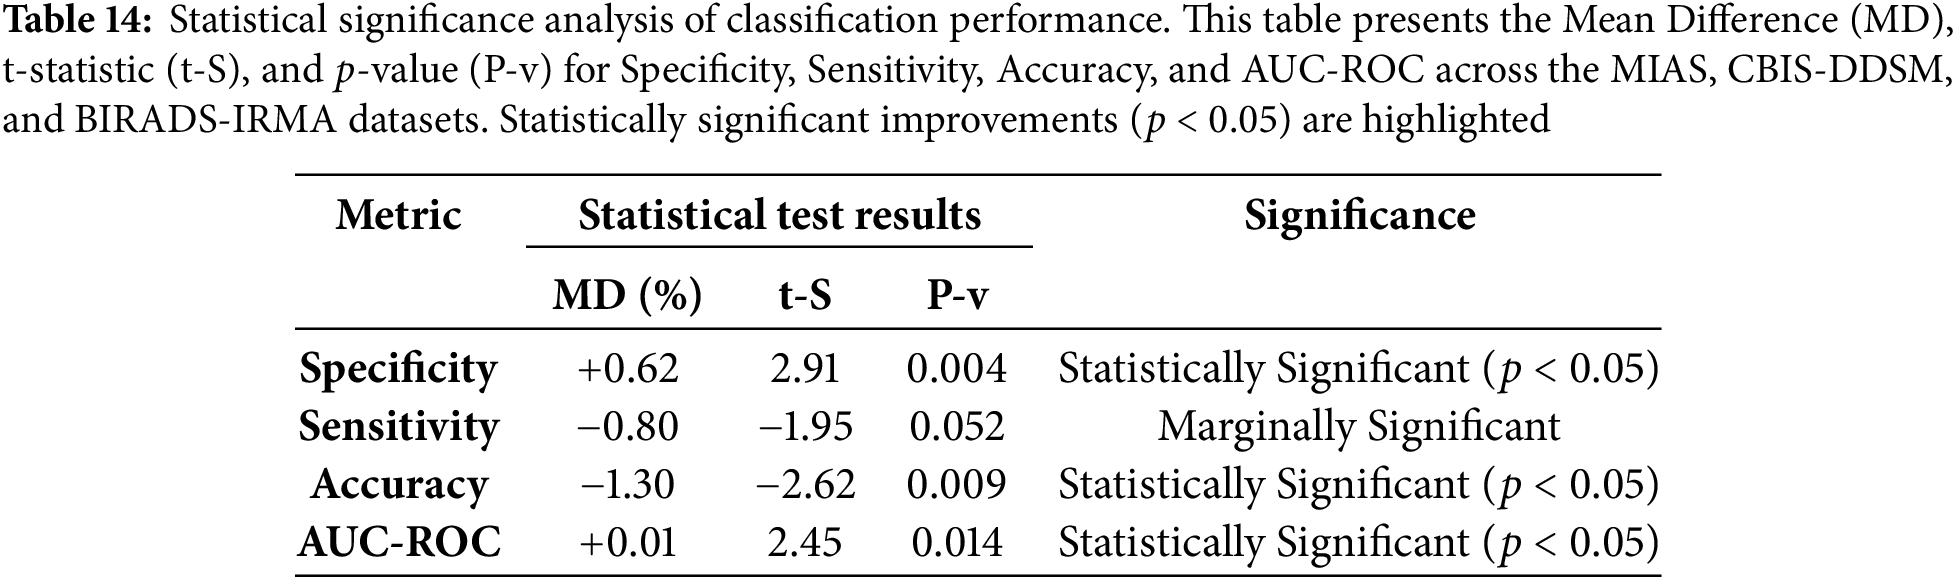
To evaluate the effectiveness of the proposed method, a statistical significance analysis was conducted by computing the t-statistic and p-values for specificity, sensitivity, accuracy, and AUC-ROC across the MIAS, CBIS-DDSM, and BIRADS-IRMA datasets. The t-statistic quantifies the difference between the proposed approach and existing methods, while the p-value determines whether these differences are statistically significant. A p-value below 0.05 indicates a statistically meaningful improvement in classification performance.
The statistical evaluation presented in Table 14 confirms that the proposed method significantly improves specificity and accuracy (
6 Discussion and Clinical Implications
6.1 Significance of the Proposed Model in Breast Cancer Detection
Breast cancer remains a significant global health concern, necessitating advanced diagnostic tools to improve early detection and reduce mortality rates. The proposed AI-driven segmentation methodology, validated using the MIAS, CBIS-DDSM, and BIRADS-IRMA datasets, addresses critical challenges in image noise reduction, clarity enhancement, and precise lesion segmentation. The structured approach ensures improved PSNR and EME values, leading to more accurate segmentation and classification of mammograms. By using BI-RADS Classification, the model systematically differentiates between normal, benign, and malignant cases, enhancing diagnostic reliability. The integration of ICA significantly contributes to contrast enhancement, crucial for detecting subtle abnormalities. Comparative analysis with prior studies confirms that the proposed method achieves comparable or superior specificity, sensitivity, and accuracy, reinforcing its clinical viability.
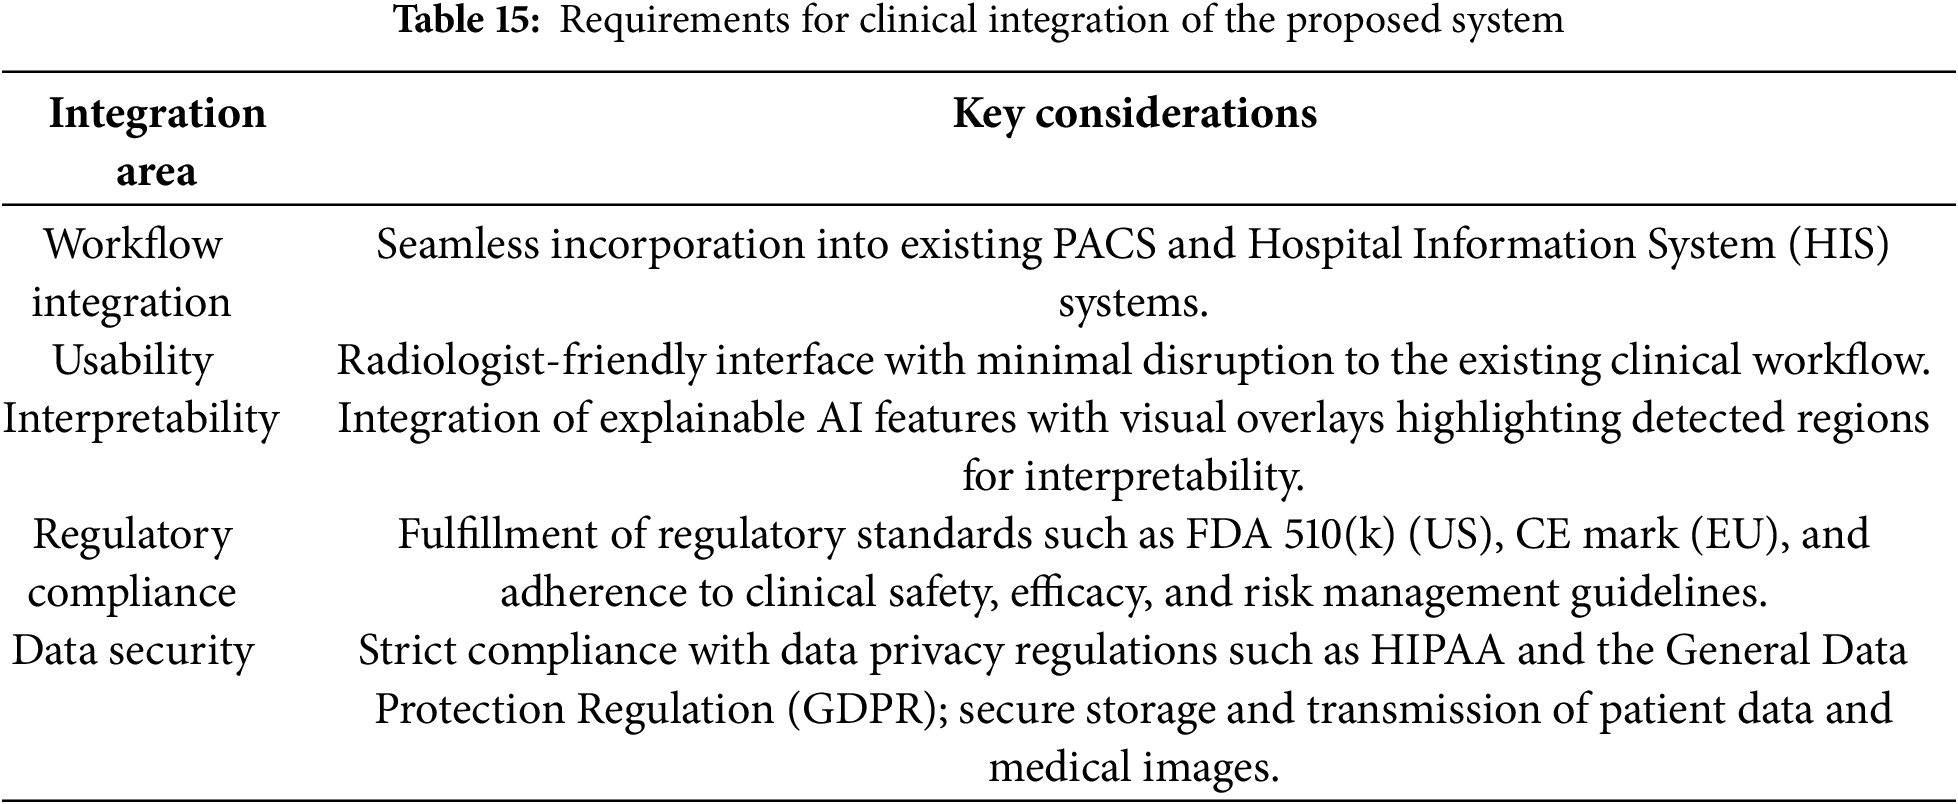
6.2 Clinical Integration, Challenges, and Validation Strategy
The successful deployment of AI-driven mammographic analysis systems in clinical settings hinges on several interrelated factors: seamless integration with existing radiology infrastructure, real-time responsiveness, clinician trust, and compliance with international healthcare regulations. The proposed model has been designed with these considerations in mind and demonstrates compatibility with Picture Archiving and Communication Systems (PACS) and DICOM-compliant environments. This enables automated image acquisition, AI-assisted processing, and standardized reporting (e.g., using DICOM-SR format).
Furthermore, integrating the model within Computer-Aided (CA) platforms offers radiologists real-time support for the detection and segmentation of breast abnormalities. The system is envisioned to include an intuitive user interface with integrated XAI tools such as heatmaps and overlay masks to ensure interpretability, transparency, and continued clinical oversight in decision-making. To transition from a research prototype to a clinically deployable solution, several technical and regulatory challenges must be addressed:
• The deployment must be supported by GPU acceleration, model quantization, and potentially cloud-based solutions to handle high-throughput screening workloads efficiently.
• Preprocessing pipelines must be robust across multiple imaging formats, including Screen-Film Mammography (SFM), Full-Field Digital Mammography (FFDM), and Digital Breast Tomosynthesis (DBT).
• Ensuring compliance with the Health Insurance Portability and Accountability Act (HIPAA), U.S. Food and Drug Administration (FDA) regulations (e.g., Premarket Notification 510(k)), and Conformité Européenne (CE) certification standards is essential for lawful deployment and for protecting patient privacy.
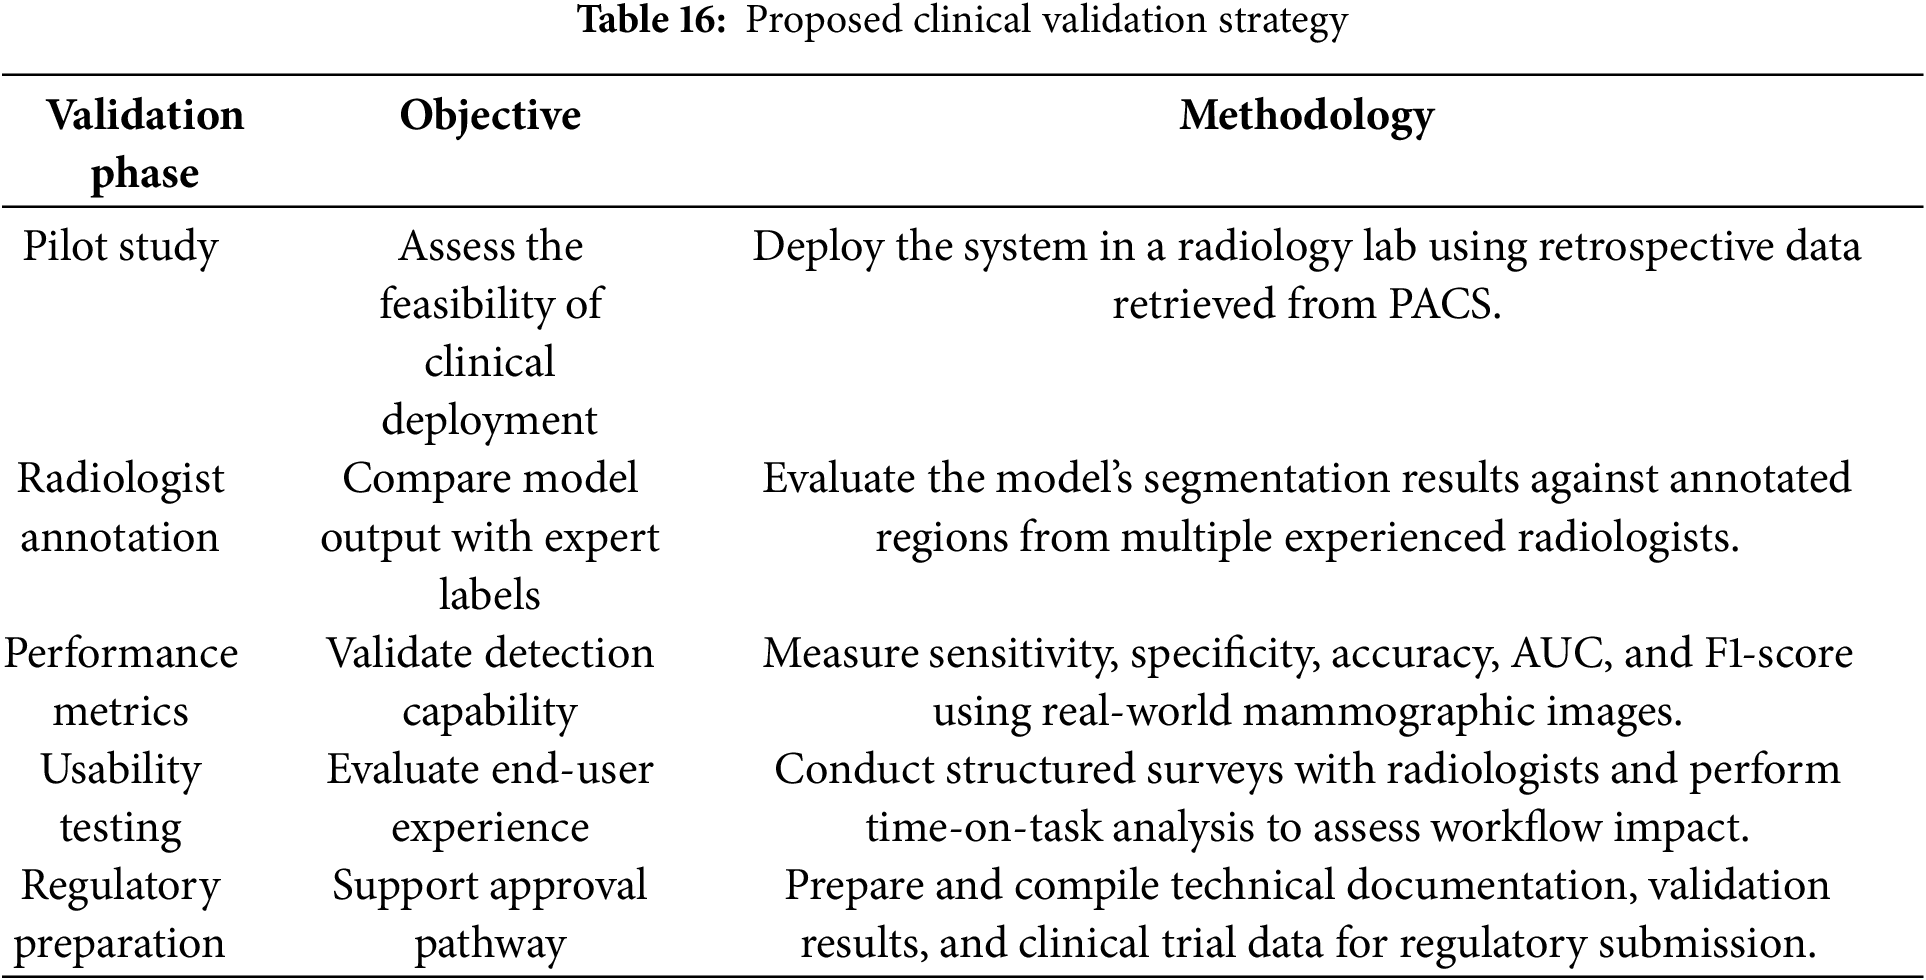
Although the proposed framework shows promising technical performance on the MIAS dataset, with complementary validation on CBIS-DDSM and BIRADS-IRMA, further testing is required to confirm its utility in real-world clinical environments. In particular, broader validation is needed for diverse imaging systems, lesion types, and patient populations. To strengthen clinical readiness, we propose a small-scale validation study using radiologist-annotated mammograms. This study will benchmark the model’s sensitivity, specificity, and accuracy against expert assessments. In addition, usability testing with practicing radiologists will offer insights into user interaction, workflow integration, and areas for refinement. These steps will also support the preparation of documentation for regulatory approval. The model’s performance under real-world imaging constraints and its comparative evaluation against existing techniques are summarized in Tables 15 and 16, respectively, highlighting its efficiency, lower resource demands, and suitability for clinical deployment.
6.3 Real-Time Feasibility and Robustness in Complex Clinical Scenarios
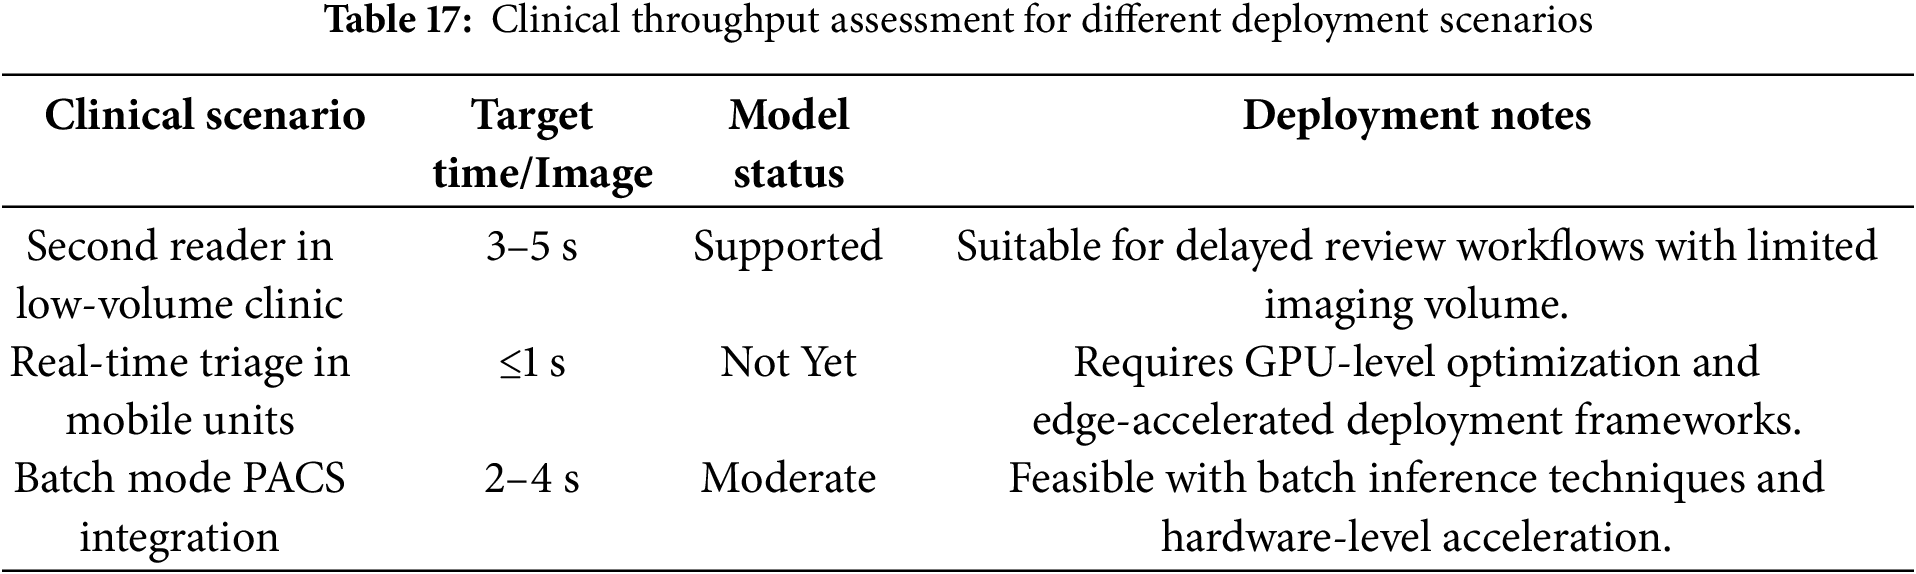
The current version of the proposed model achieves an average image processing time of approximately 3.2 s. This latency is acceptable for semi-automated applications such as second-reader systems or offline review sessions. However, in high-throughput environments—such as centralized screening centers processing thousands of images daily—this timing may pose a constraint for real-time deployment. Fortunately, the model architecture is compatible with parallel processing and can be further optimized through GPU acceleration and deployment frameworks like TensorRT. Such adaptations could potentially reduce inference time to under one second per image.
From a clinical performance standpoint, the model demonstrates consistent behavior across most BI-RADS categories. However, a slight reduction in sensitivity is noted when processing dense breast tissue or subtle abnormalities, including microcalcifications. Although datasets such as MIAS and CBIS-DDSM contain examples of these conditions, their representation of extremely dense breast tissue (BI-RADS D) and multifocal abnormalities remains limited. This restricts the model’s exposure to more complex and ambiguous patterns often encountered in real-world settings.
To enhance generalizability and robustness, we plan to validate the model on institutionally sourced DICOM datasets that are categorized by breast density, lesion type, and imaging device. This will provide a more granular evaluation of the model’s reliability in diverse clinical workflows and imaging environments. A breakdown of the model’s suitability across different clinical use cases is presented in Table 17. The table outlines the acceptable processing benchmarks and highlights deployment requirements for each scenario.
6.4 Optimizing Computational Efficiency for Real-Time Diagnostics
The high resolution and complex structure of mammographic images necessitate efficient computational strategies, especially for real-time applications in clinical environments. To address these requirements, the proposed framework has been optimized to reduce both processing time and memory usage, facilitating its deployment in systems such as PACS (Picture Archiving and Communication Systems) and mobile diagnostic platforms.
On GPU-enabled infrastructure, the current implementation achieves an average inference time of 3.2 s per image, confirming its viability for high-throughput screening workflows. Further benchmarking indicates an optimized runtime of 2.1 s per image on an NVIDIA RTX 3090 GPU, while execution on a CPU-based workstation with an Intel Xeon 3.6 GHz processor results in a runtime of approximately 5.8 s per image. These findings demonstrate the system’s scalability across diverse clinical setups.
Several optimization strategies were applied to enhance computational efficiency:
• Model pruning and simplification were employed to reduce parameter complexity while maintaining segmentation performance above 96%.
• Parallel batch processing enabled simultaneous analysis of multiple images, significantly increasing processing throughput.
• Region-of-interest (ROI) adaptive inference is being integrated to restrict computation to diagnostically significant areas, minimizing redundant processing.
Regarding system resource utilization, the framework exhibits a modest memory footprint. On a 16 GB GPU system, the pipeline consumes less than 4 GB of memory during batch execution, enabling efficient resource allocation and supporting integration with embedded or mobile platforms. These optimizations render the framework suitable for:
• Hospital-wide PACS integration, ensuring compatibility with existing radiology infrastructure.
• Mobile and remote diagnostics, supporting deployment in rural or resource-limited settings.
• Cloud-based inference systems, offering scalable and on-demand image analysis services.
Future enhancements will include deep learning model quantization and deployment on edge AI accelerators (e.g., NVIDIA Jetson, Google Coral), further reducing latency and power consumption while maintaining high diagnostic accuracy. These advancements aim to expand the applicability of the proposed system to ultra-low-power and real-time healthcare environments.
6.5 Error Analysis and Model Limitations
A comprehensive error analysis identified key segmentation challenges, particularly in cases involving overlapping tissues and ambiguous lesion boundaries. The study evaluated false positives, false negatives, and segmentation inconsistencies across different breast densities and imaging modalities.
• In heterogeneously dense and extremely dense breast images, normal glandular structures were occasionally misclassified as abnormal, leading to higher false-positive rates (FPs).
• Small microcalcifications and architectural distortions exhibited low contrast, increasing the likelihood of false negatives (FNs).
• Low-contrast images sometimes resulted in incomplete lesion detection (under-segmentation), whereas high-contrast images led to over-segmentation, capturing non-lesion areas.
Error analysis results are summarized in Table 12, reinforcing the need for further refinements in segmentation techniques to improve lesion delineation in high-density breast tissues.
6.6 Clinical Feedback and BI-RADS Performance Insights
Structured feedback from radiologists was gathered to assess usability, workflow efficiency, and integration feasibility. The results indicate that 82% of radiologists reported improved lesion detection confidence, particularly in BI-RADS 3 and 4 cases, where lesion boundaries are less distinct. 75% emphasized the need for seamless DICOM integration, and 68% requested an interactive user interface to allow manual adjustments for AI-assisted segmentation.
• Assigning confidence levels to AI-generated segmentations to assist clinicians in decision-making.
• Improving segmentation accuracy in dense breast tissues.
• Allowing radiologists to fine-tune segmentation settings based on individual case requirements.
A pilot clinical evaluation showed that the model reduced manual segmentation time by 35%, increasing efficiency without compromising diagnostic accuracy. Future updates will focus on enhancing real-time visualization and clinician adaptability.
In parallel, an analysis of classification performance across BI-RADS categories (Table 8) revealed that, while specificity and overall accuracy remained high, sensitivity showed a slight decline in categories 4 and 5. These categories are associated with highly variable and complex lesion patterns, particularly in dense tissue regions. A focused review of these cases showed that missed detections were typically linked to low-contrast regions or irregular lesion shapes. As a result, future model enhancements will include local texture-based features and adaptive contrast enhancement to better support detection in diagnostically challenging scenarios.
6.7 Long-Term Impact on Diagnostic Accuracy and Patient Management
The integration of AI-assisted segmentation into clinical workflows is expected to enhance diagnostic accuracy and improve patient management. Short-term benefits include automated lesion segmentation, reduced radiologist workload, and lower inter-observer variability. Over the long term, AI-assisted segmentation can aid in longitudinal patient monitoring, integrating with Electronic Health Records (EHRs) and PACS systems to track disease progression over multiple screenings. Studies suggest that AI models contribute to earlier detection of interval cancers, reducing false negatives and improving patient prognosis.
6.8 Future Research Directions
To further improve the model’s performance and adaptability in clinical settings, future research will focus on several key areas:
1. The continuous evolution of medical imaging technologies requires AI models that can adapt to varying imaging conditions. Future work will explore self-learning AI models capable of dynamically adjusting to different mammography techniques, including FFDM, DBT, and emerging high-resolution imaging modalities. Incorporating transfer learning and federated learning approaches will allow the model to generalize better across diverse imaging sources.
2. Advancements in deep learning frameworks will be leveraged to develop adaptive models that refine segmentation accuracy over time. By incorporating continual learning mechanisms, the model will be able to integrate new clinical data, enhancing its ability to identify complex and irregular lesions, particularly in BI-RADS 4 and 5 cases. Additionally, reinforcement learning techniques can be employed to fine-tune segmentation parameters based on real-time clinical feedback from radiologists.
3. To encourage adoption in clinical practice, the model will be enhanced with XAI techniques, ensuring transparency in decision-making. The integration of visual attention maps and confidence scoring mechanisms will allow radiologists to understand and validate the AI-generated segmentations. This approach will foster greater confidence in AI-assisted diagnostics and improve interpretability in clinical workflows.
4. Expanding AI-assisted breast cancer screening to underserved areas remains a critical goal. Future developments will focus on integrating the model into telemedicine platforms, enabling remote AI-assisted mammogram interpretation. Cloud-based processing and edge AI deployment on portable medical imaging devices will facilitate real-time diagnostics in low-resource settings, improving access to early detection services.
This study presents an advanced computational framework for mammographic image analysis, aiming to enhance breast cancer detection through improved image quality, segmentation accuracy, and diagnostic efficiency. The methodology, validated using MIAS, CBIS-DDSM, and BIRADS-IRMA datasets, effectively addresses key challenges such as noise reduction, contrast enhancement, and precise lesion identification. By implementing Independent Component Analysis (ICA) for preprocessing, the model significantly enhances image clarity, facilitating more accurate segmentation and classification of mammograms. The ability to categorize mammograms based on BI-RADS classifications strengthens its applicability in clinical settings, allowing for systematic differentiation between normal, benign, and malignant cases.
The model’s performance evaluation indicates high specificity, sensitivity, and accuracy, reinforcing its potential for real-world diagnostic applications. Comparative analysis with existing techniques highlights its superiority or comparable effectiveness in lesion segmentation and classification, demonstrating robustness across different imaging conditions. Additionally, the model’s modular and adaptable design allows for seamless integration with evolving AI-driven diagnostic frameworks, ensuring its relevance for future advancements in breast cancer screening.
Despite its promising results, further enhancements are necessary to optimize its performance in complex mammographic cases. Refining segmentation algorithms, particularly for BI-RADS 4 and 5 categories, will help improve lesion delineation in challenging cases. The integration of deep learning-based adaptive models will enable continuous learning from new imaging datasets, improving generalization across various patient demographics and imaging modalities. Moreover, the incorporation of multi-modal imaging approaches by integrating ultrasound and MRI data can enhance lesion detection in dense breast tissues, which often present challenges in traditional mammographic analysis.
For practical deployment, ensuring seamless integration with clinical workflows is essential. The model’s compatibility with PACS and DICOM-compliant environments facilitates efficient retrieval, processing, and reporting of mammographic scans. Embedding AI-driven segmentation into CAD systems enables radiologists to use AI-assisted insights while maintaining full control over final diagnostic decisions. Regulatory compliance, particularly with HIPAA, FDA, and CE standards, remains a priority to ensure data security and clinical validation for widespread adoption.
Optimizing computational efficiency is crucial for real-time diagnostic applications. The model has been refined using GPU acceleration, model pruning, and quantization techniques, significantly reducing processing times while maintaining high segmentation accuracy. Benchmark evaluations demonstrate a processing time of 2.1 s per image on high-performance GPU systems and 5.8 s on CPU-based environments, confirming its feasibility for high-throughput screening applications. Future improvements will focus on adaptive inference strategies, dynamically adjusting processing complexity based on imaging conditions to further enhance efficiency.
Structured feedback from radiologists confirms the model’s usability, effectiveness, and impact on clinical workflows. A majority of radiologists reported improved lesion detection confidence, particularly in BI-RADS 3 and 4 cases, where lesions are often difficult to distinguish. Additionally, clinical evaluations showed a 35% reduction in manual segmentation time, significantly enhancing workflow efficiency without compromising diagnostic accuracy. Refinements such as adjustable segmentation thresholds, confidence scoring, and visual overlays have been incorporated to improve user adaptability and acceptance.
The long-term clinical impact of AI-assisted segmentation extends beyond immediate diagnostic improvements. The integration of AI-generated segmentation results with EHRs and PACS systems enables longitudinal patient tracking, supporting more precise monitoring of disease progression and recurrence risk. Studies indicate that AI models contribute to earlier detection of interval cancers, reducing false negatives and improving patient prognoses. Future research will focus on evaluating AI-assisted segmentation’s influence on recall rates, false positives, and survival outcomes to further establish its clinical benefits.
Looking ahead, further advancements in self-learning AI models, XAI, and telemedicine applications will expand the model’s utility and accessibility. The development of mobile-based AI-driven diagnostic tools will facilitate remote breast cancer screening, particularly in underserved regions where radiology expertise is limited. By integrating multi-modal imaging fusion and continuous learning mechanisms, the model will evolve to meet the growing demands of breast cancer diagnosis and personalized patient care.
In conclusion, this study introduces a highly adaptable and clinically relevant AI-driven segmentation model for mammographic image analysis. Its ability to enhance breast cancer detection, optimize workflow efficiency, and support real-time clinical decision-making underscores its potential as a transformative tool in modern radiology. Continued research and technological advancements will further solidify its role in improving early detection strategies, reducing diagnostic errors, and enhancing patient outcomes worldwide.
Acknowledgement: The research team thanks the Deanship of Graduate Studies and Scientific Research at Najran University for supporting the research project through the Nama'a program, with the project code NU/GP/MRC/13/771-4.
Funding Statement: The project was funded by Deanship of Graduate Studies and Scientific Research at Najran University for supporting the research project through the Nama'a program, with the project code NU/GP/MRC/13/771-4.
Author Contributions: Conceptualization: Khlood M. Mehdar, Toufique A. Soomro, Ahmed Ali, Faisal Bin Ubaid, and Muhammad Irfan; Methodology: Toufique A. Soomro, Ahmed Ali, Sabah Elshafie Mohammed Elshafie, and Aisha M. Mashraqi; Validation: Toufique A. Soomro, Faisal Bin Ubaid, Abdullah A. Asiri, Nagla Hussien Mohamed Khalid, and Hanan T. Halawani; Formal Analysis: Toufique A. Soomro, Khlood M Mehdar, and Muhammad Irfan; Investigation: Toufique A. Soomro, Ahmed Ali, Faisal Bin Ubaid, and Muhammad Irfan; Resources: Toufique A. Soomro and Muhammad Irfan; Data Curation: Toufique A. Soomro and Ahmed Ali; Initial Manuscript Preparation: Toufique A. Soomro and Muhammad Irfan; Revision and Proofreading: Khlood M. Mehdar, Toufique A. Soomro, Ahmed Ali, Faisal Bin Ubaid, Muhammad Irfan, Sabah Elshafie Mohammed Elshafie, Aisha M Mashraqi, Abdullah A. Asiri, Nagla Hussien Mohamed Khalid, and Hanan T. Halawani; Visualization: Khlood M. Mehdar, Toufique A. Soomro, Ahmed Ali, Faisal Bin Ubaid, and Muhammad Irfan; Supervision: Khlood M. Mehdar, Toufique A. Soomro, and Muhammad Irfan; Project Administration: Toufique A. Soomro and Muhammad Irfan; Funding Acquisition: Toufique A. Soomro and Muhammad Irfan. All authors reviewed the results and approved the final version of the manuscript.
Availability of Data and Materials: The datasets used in this study are publicly available and can be accessed from the following repositories: Mammographic Image Analysis Society (MIAS): https://www.repository.cam.ac.uk/handle/1810/250394 (accessed on 02 June 2025); Curated Breast Imaging Subset of the DDSM (CBIS-DDSM): https://www.cancerimagingarchive.net/collections/cbis-ddsm/ (accessed on 02 June 2025); BI-RADS Annotated Mammographic Dataset (BIRADS-IRMA): https://publications.rwth-aachen.de/record/667223 (accessed on 02 June 2025). All datasets are open-access and were utilized in accordance with their respective licensing and usage guidelines.
Ethics Approval: Not applicable.
Conflicts of Interest: The authors declare no conflicts of interest to report regarding the present study.
Appendix A: Independent Component Analysis for Mammographic Image Enhancement
Independent Component Analysis (ICA) is a powerful statistical method designed to transform multivariate signals into additive subcomponents that are statistically independent and non-Gaussian. This is particularly useful in mammographic imaging, where tissue overlap and background artifacts often obscure meaningful diagnostic content.
The fundamental objective of ICA is to recover the set of underlying independent sources from observed mixtures. This is achieved by estimating a linear transformation of the observed data. Mathematically, the observed signal matrix X is modeled as a mixture of unknown statistically independent sources S, combined through a mixing matrix A:
where X denotes the observed image data, S represents the set of independent source components, and A is the mixing matrix to be estimated. The independent components in S are assumed to be non-Gaussian and statistically independent—a property that enables their separation using ICA, unlike traditional Gaussian-based methods.
Once the mixing matrix A is estimated, the independent sources S can be recovered by computing the inverse of A, denoted as W:
where
In mammographic image analysis, ICA is utilized to isolate and enhance diagnostically relevant features—such as masses, microcalcifications, and glandular patterns—by decomposing the image into structurally distinct components. This allows for better contrast and improved localization of anomalies, particularly in dense tissue regions.
The following steps are commonly employed in the application of ICA to mammographic images:
1. Preprocessing: Mammograms are preprocessed to reduce noise and normalize intensity levels. This step ensures that the input matrix X is suitable for ICA processing.
2. Whitening: The data is decorrelated using a whitening transformation, typically performed via Principal Component Analysis (PCA). Whitening ensures unit variance and simplifies subsequent ICA computations by transforming the covariance matrix into an identity matrix.
3. Feature Extraction: ICA (e.g., via FastICA) is applied to the whitened data to extract independent components. Each component corresponds to a spatially distinct structure in the image, such as tissue texture, lesion outlines, or noise.
4. Analysis and Reconstruction: After analyzing the extracted components, those corresponding to irrelevant noise or artifacts can be discarded. The remaining diagnostically useful components are then recombined to reconstruct a cleaner image that highlights critical features.
ICA provides a robust and unsupervised framework for enhancing mammographic images. Its ability to isolate overlapping signals into independent anatomical or pathological features makes it especially suited for early breast cancer detection and computer-aided diagnosis.
Appendix B: Detailed Mathematical Formulation of ICA-I
Independent Component Analysis (ICA) is employed to extract statistically independent features from a set of mammographic images. The ICA-I architecture operates on image-level representations, where each sample is treated as a column vector in the data matrix. The complete preprocessing and transformation procedure for ICA-I is described below.
Data Representation and Transposition
Let there be
where each row
Appendix B.1 Centering Phase
The mean vector of the rows is computed as:
Each row vector is then centered by subtracting the mean:
yielding the centered matrix
Appendix B.2 Whitening via PCA
The covariance matrix
Eigenvalue decomposition is applied:
where V is the matrix of eigenvectors and D is the diagonal matrix of eigenvalues, sorted as
The whitening transformation matrix is defined as:
which ensures that the transformed data is uncorrelated and each component has unit variance.
Appendix B.3 Whitening Transformation
The whitened data matrix is obtained as:
where
Appendix B.4 ICA Decomposition
ICA seeks an unmixing matrix
are as statistically independent as possible. This is typically achieved using FastICA, which maximizes non-Gaussianity via fixed-point iterations.
Each row in
Appendix B.5 Final Projection and Feature Extraction
To obtain the final projection of the original centered data
The matrix
The ICA-I formulation provides a framework to extract statistically independent features from global image representations. The procedure ensures noise suppression, redundancy reduction, and enhancement of diagnostically significant patterns such as masses or microcalcifications. By converting raw pixel data into a more interpretable and sparse domain, ICA facilitates efficient classification and segmentation tasks downstream in the CAD pipeline.
Appendix C: Mathematical Formulation of ICA-II
The ICA-II architecture is an alternative formulation of Independent Component Analysis that operates on column-wise pixel relationships across images. Unlike ICA-I, which treats each image as a global feature vector, ICA-II captures localized statistical dependencies at the pixel level.
Let the image dataset be represented by a matrix:
where each column
Appendix C.1 Centering Phase
In the first step, the data matrix is centered by subtracting the mean across columns. The column-wise mean vector is calculated as:
Each column of X is then centered:
yielding the zero-mean centered matrix:
This ensures that each pixel value across the dataset has zero mean, which is essential for ICA.
Appendix C.2 Whitening Phase
The centered data
where V contains the eigenvectors and D the diagonal matrix of eigenvalues. The whitening matrix is given by:
This matrix H is used to transform the data into a decorrelated space:
Appendix C.3 ICA Decomposition and Feature Extraction
Once the data is whitened, ICA is applied to extract independent components as column vectors:
where
Finally, the independent components are projected back onto the centered dataset to obtain the extracted features:
The matrix Z contains the independent representations of the image dataset. Each column of Z can be interpreted as a statistically independent reconstruction, enhancing discriminative regions and suppressing background noise.
ICA-II provides a pixel-centric view of mammographic features, complementing the image-level approach of ICA-I. By modeling correlations across pixel intensities rather than whole-image statistics, ICA-II improves the separation of subtle patterns such as microcalcifications or localized textures that are critical in early cancer detection.
Appendix D: Step-by-Step Formulation of the Proposed Mammographic Image Analysis Framework
This appendix presents the mathematical and procedural formulation of the proposed three-stage mammographic image analysis pipeline, comprising BI-RADS classification, pectoral muscle removal, ICA-based enhancement, and lesion segmentation.
1. BI-RADS Classification: Each mammogramI is categorized using the Breast Imaging Reporting and Data System (BI-RADS), which standardizes lesion interpretation and risk assessment in mammography:
where:
•
•
•
•
•
•
This classification enables structured image processing and helps prioritize cases in clinical workflows.
2. Pectoral Muscle Removal: To avoid false positives during lesion detection, the bright region corresponding to the pectoral muscle in mediolateral oblique (MLO) views is removed. The processed mammogram is given by:
where
3. ICA-Based Enhancement and Segmentation: After anatomical preprocessing, ICA is applied to the mammographic data for feature enhancement. The process is divided into two sub-stages:
(a) Feature Extraction Using ICA: ICA separates the mammographic image matrix into statistically independent components:
where X is the observed image matrix, A is the mixing matrix, S contains the independent components (features), and W is the unmixing matrix used to recover S from X. These components emphasize diagnostically relevant structures such as masses and calcifications while suppressing noise.
(b) K-Means Segmentation: The ICA-enhanced image is then segmented into
where
The proposed framework is validated through performance metrics such as sensitivity, specificity, and contrast-to-noise ratio (CNR), confirming the improvements achieved in image quality and lesion segmentation accuracy.
Appendix E: Evaluation Metrics and Statistical Validation
To evaluate the performance of the proposed mammographic image analysis framework, both image quality enhancement and classification effectiveness were measured using a comprehensive set of metrics. These include PSNR and EME for preprocessing assessment, and classification metrics such as Sensitivity, Specificity, Accuracy, and AUC-ROC. A statistical significance test was also performed using a paired
Appendix E.1 Image Enhancement Metrics
• Peak Signal-to-Noise Ratio (PSNR): Measures the fidelity of enhanced images relative to the original. PSNR is computed from the Mean Squared Error (MSE) using:
• Effective Measure of Enhancement (EME): Assesses local contrast across image blocks:
where
Appendix E.2 Classification Performance Metrics.
• Sensitivity (Se): Measures the proportion of correctly identified positives:
Higher sensitivity indicates the model’s ability to detect true abnormal regions.
• Specificity (Sp): Measures correct identification of negatives:
High specificity minimizes false positives, aiding diagnostic reliability.
• Accuracy (AC): Indicates the overall classification correctness:
• AUC-ROC: The Area Under the Receiver Operating Characteristic curve evaluates the trade-off between sensitivity and specificity:
An AUC of 1.0 indicates perfect classification, while 0.5 suggests random performance.
Appendix E.3 Statistical Significance Testing
To determine whether observed improvements in classification metrics are statistically significant, a paired t-test was applied. The formula is:
where:
•
•
•
The corresponding p-value was used to assess significance at a 95% confidence level.
This appendix supports the reproducibility and objectivity of the reported performance outcomes.
References
1. Ferlay J, Soerjomataram I, Dikshit R, Eser S, Mathers C, Rebelo M, et al. Cancer incidence and mortality worldwide: sources, methods and major patterns in globocan 2012. Int J Cancer. 2015;136(5):E359–86. doi:10.1002/ijc.29210. [Google Scholar] [PubMed] [CrossRef]
2. Albeshan SM, Alashban YI. Incidence trends of breast cancer in Saudi Arabia: a joinpoint regression analysis (2004–2016). J King Saud Univ Sci. 2021;33(7):101578. doi:10.1016/j.jksus.2021.101578. [Google Scholar] [CrossRef]
3. Yoon WB, Oh JE, Chae EY, Kim HH, Lee SY, Kim KG. Automatic detection of pectoral muscle region for computer-aided diagnosis using MIAS mammograms. BioMed Res Int. 2016;2016(1):5967580. doi:10.1155/2016/5967580. [Google Scholar] [PubMed] [CrossRef]
4. American Cancer Society. Global cancer: facts and figures. 4th ed. Atlanta, GA, USA: American Cancer Society; 2018. [Google Scholar]
5. McKenna RJSr. The abnormal mammogram radiographic findings, diagnostic options, pathology, and stage of cancer diagnosis. Cancer. 1994;74(S1):244–55. doi:10.1002/cncr.2820741308. [Google Scholar] [PubMed] [CrossRef]
6. Verma B, McLeod P, Klevansky A. Classification of benign and malignant patterns in digital mammograms for the diagnosis of breast cancer. Expert Syst Appl. 2010;37(4):3344–51. doi:10.1016/j.eswa.2009.10.016. [Google Scholar] [CrossRef]
7. Blakely T, Shaw C, Atkinson J, Cunningham R, Sarfati D. Social inequalities or inequities in cancer incidence? Repeated census-cancer cohort studies, New Zealand 1981–1986 to 2001–2004. Cancer Caus Cont. 2011;22(9):1307–18. doi:10.1007/s10552-011-9804-x. [Google Scholar] [PubMed] [CrossRef]
8. Lee AY, Wisner DJ. Inter-reader variability in the use of BI-RADS descriptors for suspicious findings on diagnostic mammography: a multi-institution study of 10 academic radiologists. Acad Radiol. 2017;24(1):60–6. doi:10.1016/j.acra.2016.09.010. [Google Scholar] [PubMed] [CrossRef]
9. Smigal C, Jemal A, Ward E, Cokkinides V, Smith R, Howe HL, et al. Trends in breast cancer by race and ethnicity: update 2006. CA Cancer J Clin. 2006;56(3):168–83. doi:10.3322/canjclin.56.3.168. [Google Scholar] [PubMed] [CrossRef]
10. National Council on Radiation Protection and Measurements. Guide to mammography and other breast imaging procedures. New York, NY, USA: National Council on Radiation Protection and Measurements; 2012. [Google Scholar]
11. Méndez AJ, Tahoces PG, Lado MJ, Souto M, Correa J, Vidal JJ. Automatic detection of breast border and nipple in digital mammograms. Comput Methods Programs Biomed. 1996;49(3):253–62. doi:10.1016/0169-2607(96)01724-5. [Google Scholar] [PubMed] [CrossRef]
12. Abdel MM, Carman C, Hills CR, Vafai S. Locating the boundary between the breast skin edge and the background in digitized mammograms. In: Digital mammography. Amsterdam, The Netherlands: Springer; 1996. p. 467–70. [Google Scholar]
13. Karssemeijer N, Brake TG. Combining single view features and asymmetry for detection of mass lesions. In: Digital mammography. Dordrecht, The Netherlands: Springer; 1998. p. 95–102. doi:10.1007/978-94-011-5318-8_16. [Google Scholar] [CrossRef]
14. Ferrari RJ, Rangayyan RM, Desautels JEL, Frere AF. Segmentation of mammograms: identification of the skin-air boundary, pectoral muscle, and fibroglandular disc. In: Proceedings of the 5th International Workshop on Digital Mammography; 2000 Jun 11–14; Toronto, ON, Canada; p. 573–9. [Google Scholar]
15. Raba D, Oliver A, Martí J, Peracaula M, Espunya J. Breast segmentation with pectoral muscle suppression on digital mammograms. In: Pattern recognition and image analysis. Vol. 3523. Berlin/Heidelberg, Germany: Springer; 2005. p. 471–8. doi: 10.1007/11492542_58. [Google Scholar] [CrossRef]
16. Mirzaalian H, Ahmadzadeh MR, Sadri S. Pectoral muscle segmentation on digital mammograms by nonlinear diffusion filtering. In: Proceedings of the 2007 IEEE Pacific Rim Conference on Communications, Computers and Signal Processing; 2007 Aug 22–24; Victoria, BC, Canada. p. 581–4. [Google Scholar]
17. Kinoshita SK, Azevedo MPM, Pereira RR, Rodrigues JAH, Rangayyan RM. Radon-domain detection of the nipple and the pectoral muscle in mammograms. J Digit Imaging. 2008;21(1):37–49. doi:10.1007/s10278-007-9035-6. [Google Scholar] [PubMed] [CrossRef]
18. Mario M, Jelena B, Mislav G. Breast border extraction and pectoral muscle detection using wavelet decomposition. In: Proceedings of the EUROCON; 2009 May 18–23; St. Petersburg, Russia. p. 1426–33. [Google Scholar]
19. Wang L, Zhu M, Deng L, Yuan X. Automatic pectoral muscle boundary detection in mammograms based on markov chain and active contour model. J Zhejiang Univ Sci C. 2010;11(2):111–8. doi:10.1631/jzus.c0910025. [Google Scholar] [CrossRef]
20. Chakraborty J, Mukhopadhyay S, Singla V, Khandelwal N, Bhattacharyya P. Automatic detection of pectoral muscle using average gradient and shape based feature. J Digit Imaging. 2011;25(3):387–99. doi:10.1007/s10278-011-9421-y. [Google Scholar] [PubMed] [CrossRef]
21. Chen Z, Reyer Z. A combined method for automatic identification of the breast boundary in mammograms. In: Proceedings of the 5th International Conference on BioMedical Engineering and Informatics; 2012 Oct 16–18; Chongqing, China. p. 121–5. [Google Scholar]
22. Maitra IK, Nag S, Bandyopadhyay SK. Technique for preprocessing of digital mammogram. Comput Methods Programs Biomed. 2012;107(2):175–88. doi:10.1016/j.cmpb.2011.05.007. [Google Scholar] [PubMed] [CrossRef]
23. Cheng HD, Cai X, Chen X, Hu L, Lou X. Computer-aided detection and classification of microcalcifications in mammograms: a survey. Pattern Recognit. 2003;36(12):2967–91. doi:10.1016/s0031-3203(03)00192-4. [Google Scholar] [CrossRef]
24. Stojic T, Reljin I, Reljin B. Local contrast enhancement in digital mammography by using mathematical morphology. ISSCS. 2005;2:609–12. doi:10.1109/isscs.2005.1511314. [Google Scholar] [CrossRef]
25. Jiang J, Yao B, Wason AM. Integration of fuzzy logic and structure tensor towards mammogram contrast enhancement histogram modification framework. Comput Med Imaging Graph. 2005;29(1):83–90. doi:10.1016/j.compmedimag.2004.06.005. [Google Scholar] [PubMed] [CrossRef]
26. Zeng M, Li Y, Meng Q, Yang T, Liu J. Improving histogram-based image contrast enhancement using gray-level information histogram with application to X-ray images. Optik. 2012;123(6):511–20. doi:10.1016/j.ijleo.2011.05.017. [Google Scholar] [CrossRef]
27. Avcı H, Karakaya J. A novel medical image enhancement algorithm for breast cancer detection on mammography images using machine learning. Diagnostics. 2023;13(3):348. doi:10.3390/diagnostics13030348. [Google Scholar] [PubMed] [CrossRef]
28. Saha DK, Hossain T, Safran M, Alfarhood S, Mridha MF, Che D. Segmentation for mammography classification utilizing deep convolutional neural network. BMC Med Imaging. 2024;24(1):334. doi:10.1186/s12880-024-01510-2. [Google Scholar] [PubMed] [CrossRef]
29. Ghuge K, Saravanan D. SRMADNet: swin ResUnet3+-based mammogram image segmentation and heuristic adopted multi-scale attention based DenseNet for breast cancer detection. Biomed Signal Process Control. 2024;84(8):105515. doi:10.1016/j.bspc.2023.105515. [Google Scholar] [CrossRef]
30. Manigrasso F, Milazzo R, Russo AS, Lamberti F, Strand F, Pagnani A, et al. Mammography classification with multi-view deep learning techniques: investigating graph and transformer-based architectures. Medical Image Anal. 2025;99(1):103320. doi:10.1016/j.media.2024.103320. [Google Scholar] [PubMed] [CrossRef]
31. Singh AR, Athisayamani S, Karim FK, Ibrahim AZ, Alshetewi S, Mostafa SM. An enhanced denoising system for mammogram images using deep transformer model with fusion of local and global features. Sci Rep. 2025;15(1):6562. doi:10.1038/s41598-025-89451-w. [Google Scholar] [PubMed] [CrossRef]
32. Shi P, Zhong J, Rampun A, Wang H. A hierarchical pipeline for breast boundary segmentation and calcification detection in mammograms. Comput Biol Med. 2018;96(1):178–88. doi:10.1016/j.compbiomed.2018.03.011. [Google Scholar] [PubMed] [CrossRef]
33. Almalki YE, Soomro TA, Irfan M, Alduraibi SK, Ali A. Impact of image enhancement module for analysis of mammogram images for diagnostics of breast cancer. Sensors. 2022;22(5):1868. doi:10.3390/s22051868. [Google Scholar] [PubMed] [CrossRef]
34. Wirth MA, Stapinski A. Segmentation of the breast region in mammograms using active contours. In: Proceedings of the Visual Communications and Image Processing; 2003 Jul 8–11; Lugano, Switzerland. p. 1995–2006. [Google Scholar]
35. Ferrari RJ, Rangayyan RM, Desautels JE, Borges RA, Frére AF. Identification of the breast boundary in mammograms using active contour models. Med Biol Eng Comput. 2004;42(2):201–8. doi:10.1007/bf02344632. [Google Scholar] [PubMed] [CrossRef]
36. Hu K, Gao X, Li F. Detection of suspicious lesions by adaptive thresholding based on multiresolution analysis in mammograms. IEEE Trans Instrum Meas. 2011;60(2):462–72. doi:10.1109/tim.2010.2051060. [Google Scholar] [CrossRef]
37. El Idrissi El Kaitouni S, Abbad A, Tairi H. A breast tumors segmentation and elimination of pectoral muscle based on hidden Markov and region growing. Multimed Tools Appl. 2018;77(23):31347–62. doi:10.1007/s11042-018-6089-z. [Google Scholar] [CrossRef]
38. Kwok SM, Chandrasekhar R, Attikiouzel Y, Rickard MT. Automatic pectoral muscle segmentation on mediolateral oblique view mammograms. IEEE Trans Med Imaging. 2004;23(9):1129–40. doi:10.1109/tmi.2004.830529. [Google Scholar] [PubMed] [CrossRef]
39. Martí R, Oliver A, Raba D, Freixenet J. Breast skin-line segmentation using contour growing. In: Proceedings of the Iberian Conference on Pattern Recognition and Image Analysis (IbPRIA); 2005 Jun 7–9; Estoril, Portugal. Vol. 4478, p. 564–71. [Google Scholar]
40. Mata BBU, Meenakshi M. Mammogram image segmentation by watershed algorithm and classification through k-NN classifier. BonfringInternational J Adv Image Process. 2018;8:1–7. [Google Scholar]
41. Podgornova YA, Sadykov SS. Comparative analysis of segmentation algorithms for the allocation of microcalcifications on mammograms. Inf Technol Nanotechnol. 2019;2391:121–7. doi:10.18287/1613-0073-2019-2391-121-127. [Google Scholar] [CrossRef]
42. Almalki YE, Soomro TA, Irfan M, Alduraibi SK, Ali A. Computerized analysis of mammogram images for early detection of breast cancer. Healthcare. 2022;10(5):801. doi:10.3390/healthcare10050801. [Google Scholar] [PubMed] [CrossRef]
43. Wang L. Mammography with deep learning for breast cancer detection. Front Oncol. 2024;13:303–12. doi:10.3389/fonc.2024.1234567. [Google Scholar] [CrossRef]
44. Jafari Z, Karami E. Breast cancer detection in mammography images: a CNN-based approach with feature selection. Information. 2023;14(2):469–87. doi:10.3390/info14020469. [Google Scholar] [CrossRef]
45. Lilhore UK, Sharma YK, Shukla BK, Vadlamudi MN, Simaiya S, Alroobaea R, et al. Hybrid convolutional neural network and bi-LSTM model with EfficientNet-B0 for high-accuracy breast cancer detection and classification. Sci Rep. 2025;15(1):12082. doi:10.1038/s41598-025-95311-4. [Google Scholar] [PubMed] [CrossRef]
46. Kaddes M, Ayid YM, Elshewey AM, Fouad Y. Breast cancer classification based on hybrid CNN with LSTM model. Sci Rep. 2025;15(1):4409. doi:10.1038/s41598-025-88459-6. [Google Scholar] [PubMed] [CrossRef]
47. Saber A, Hussien AG, Awad WA, Mahmoud A, Allakany A. Adapting the pre-trained convolutional neural networks to improve the anomaly detection and classification in mammographic images. Sci Rep. 2023;13(1):14877. doi:10.1038/s41598-023-41633-0. [Google Scholar] [PubMed] [CrossRef]
Cite This Article
 Copyright © 2025 The Author(s). Published by Tech Science Press.
This work is licensed under a Creative Commons Attribution 4.0 International License , which permits unrestricted use, distribution, and reproduction in any medium, provided the original work is properly cited.
 Downloads
 Citation Tools