
 Submit a Paper
 Propose a Special lssue
 Open Access
ARTICLE

Transmission Facility Detection with Feature-Attention Multi-Scale Robustness Network and Generative Adversarial Network
1 Department of Mechanical Convergence Engineering, Hanyang University, 222 Wangsimni-ro, Seongdong-gu, Seoul, 04763, Republic of Korea
2 School of Mechanical Engineering, Hanyang University, 222 Wangsimni-ro, Seongdong-gu, Seoul, 04763, Republic of Korea
3 Power Transmission Laboratory, KEPCO Research Institute, Korea Electric Power Corporation, Daejeon, 105 Munji-ro, Yuseong-gu, Daejeon, Seoul, 34056, Republic of Korea
* Corresponding Authors: Ki-Yong Oh. Email: ; Min Ku Kim. Email:
(This article belongs to the Special Issue: Data-Driven and Physics-Informed Machine Learning for Digital Twin, Surrogate Modeling, and Model Discovery, with An Emphasis on Industrial Applications)
Computer Modeling in Engineering & Sciences 2025, 144(1), 1013-1044. https://doi.org/10.32604/cmes.2025.066447
Received 09 April 2025; Accepted 26 June 2025; Issue published 31 July 2025
 View Full Text
 Download PDF
Abstract
This paper proposes an automated detection framework for transmission facilities using a feature-attention multi-scale robustness network (FAMSR-Net) with high-fidelity virtual images. The proposed framework exhibits three key characteristics. First, virtual images of the transmission facilities generated using StyleGAN2-ADA are co-trained with real images. This enables the neural network to learn various features of transmission facilities to improve the detection performance. Second, the convolutional block attention module is deployed in FAMSR-Net to effectively extract features from images and construct multi-dimensional feature maps, enabling the neural network to perform precise object detection in various environments. Third, an effective bounding box optimization method called Scylla-IoU is deployed on FAMSR-Net, considering the intersection over union, center point distance, angle, and shape of the bounding box. This enables the detection of power facilities of various sizes accurately. Extensive experiments demonstrated that FAMSR-Net outperforms other neural networks in detecting power facilities. FAMSR-Net also achieved the highest detection accuracy when virtual images of the transmission facilities were co-trained in the training phase. The proposed framework is effective for the scheduled operation and maintenance of transmission facilities because an optical camera is currently the most promising tool for unmanned aerial vehicles. This ultimately contributes to improved inspection efficiency, reduced maintenance risks, and more reliable power delivery across extensive transmission facilities.Keywords
Electricity is a key source of energy that supports technological advancement in modern societies. Stable supply is essential for addressing the growing electricity demand, particularly with the advent of artificial intelligence, which is a core technology of the Fourth Industrial Revolution [1]. Stable electricity supply can be achieved by incorporating proactive maintenance of transmission facilities, as damages and faults to these facilities might result in large-scale power outages and serious incidents such as blackouts [1,2]. Hence, effective inspection strategies for transmission facilities are essential to prevent these issues and ensure a stable electricity supply.
Conventionally, the inspection of transmission facilities is carried out manually by electricians who must climb transmission towers to examine equipment with specialized tools. This labor-intensive process not only demands considerable manpower and expertise but also exposes workers to a range of hazards, including the risk of falling from significant heights and potential electric shock from high-voltage power lines [3]. Moreover, the efficiency of inspections depends on the expertise of the workers. These limitations have motivated automated inspection methods incorporating unmanned aerial vehicles (UAVs) equipped with noncontact sensors [4]. UAV-based approaches not only reduce the safety risks for workers but also enhance the speed and accuracy of inspections, ultimately leading to more reliable maintenance and overall operational efficiency (Fig. 1). However, inspection images of transmission facilities captured by UAVs often include background interference or various obstacles because transmission facilities are located in diverse terrains [5], thereby reducing the accuracy of automated detection. Overcoming these limitations is vital for ensuring reliable inspection and maintenance of the power infrastructure. Conventional computer vision approaches have been studied to effectively separate the background and objects, including color segmentation [6,7], the Hough transform [8], and texture features [9]. These methods contribute to improving the detection accuracy and inspection efficiency for noncontact sensors deployed on UAVs [10,11]. However, these approaches still have limitations when detecting objects in complex backgrounds, because they can only recognize a limited range of features within an image. As a result, their accuracy may decrease when dealing with cluttered or highly varied scenes, underscoring the need for more robust algorithms capable of handling diverse visual conditions [12].

Figure 1: A UAV-based automated framework for transmission facilities inspection
Deep learning-based object detection has been studied to address the limitations of conventional computer vision approaches, offering significant flexibility and adaptability across various backgrounds [13]. Object detection with convolutional neural networks (CNNs) is the most effective because the architecture of CNNs effectively extracts the features of power facilities from images [14]. This neural network can also handle complex backgrounds and varying environmental conditions, ultimately leading to more accurate and robust detection outcomes. This neural network includes you look only once (YOLO) [15], single-shot multi-box detector (SSD) [16], and Faster R-CNN [17]. Specifically, YOLO v3 addresses a multi-feature fusion and mapping module to enhance the insulator detection accuracy in complex backgrounds [18]. YOLO v5 uses a dynamic weight allocation architecture to enhance the learning capability of complex images of insulators [19]. SSD employs coarse and specific fine-tuning to effectively detect insulators in aerial images [20]. Faster R-CNN improves the object detection performance via integration with the U-Net architecture to perform global detection and local segmentation, effectively identifying insulators in complex backgrounds [21]. These studies suggest that deep neural networks used for object detection may improve the detection performance of power facilities. However, these approaches remain challenging to detect small and structurally complex transmission facilities, including lightning arresters, spacers, Stockbridge dampers (SB dampers), and marker balls, because previous studies have primarily focused on insulator detection, limiting their applicability to other types of facilities. These approaches also encounter difficulties in reliably identifying insulators under various environmental conditions, particularly when the training datasets lack sufficient diversity in insulator states, including different defect types, contamination, and aging conditions [22]. These limitations imply that alternatives are required to supplement the diversity of power-facility images in various environments.
Several studies have focused on generative adversarial networks (GANs) to overcome the limitations of diversity in image sets and improve the detection performance of power facilities [23]. A hybrid GAN combining a super-resolution GAN and a deep convolutional GAN (DCGAN) was proposed to generate virtual insulator images [24]. Co-training virtual images with real images demonstrated that a hybrid GAN enhanced the insulator detection performance of the YOLO v3. CycleGAN was also proposed for generating diverse virtual insulator images. The virtual images generated from this neural network improved the insulator detection performances when training YOLO v4 and YOLO v5 [25,26]. A DCGAN was also proposed to generate virtual insulator images. Co-training virtual images generated from the DCGAN with real images enhances the detection performance of SSD and Faster R-CNN in identifying insulators [27]. However, the virtual images generated in these studies are of low quality because the number of insulator images trained using the GAN is limited, resulting in insufficient representation of diverse defects and realistic environmental conditions [28]. These studies also have the limitation of not effectively improving the detection performance of neural networks, because they focus more on increasing the quantity and diversity of images rather than on improving the architecture of the neural network. These limitations indicate the need for a new GAN model that can generate high-quality images from limited input data while incorporating architectural improvements for more robust object detection.
To enhance the performance of neural networks in object detection, the bounding boxes should be accurately inferred by defining the location, size, and classification of the objects. Various methods have been proposed for optimizing the bounding boxes by considering the intersection over union (IoU), a metric widely employed to quantitatively measure the degree of overlap between predicted and ground-truth bounding boxes, thereby enabling improved optimization of object localization, size estimation, and classification accuracy [29]. Specifically, a Generalized-IoU was proposed by employing the smallest enclosing box C, which contains both the ground truth and predicted bounding boxes, to address the gradient vanishing problem between the predicted and ground truth bounding boxes [30]. A Distance-IoU was proposed by considering the center coordinates of the ground truth and predicted bounding boxes to enhance the convergence speed and accuracy [31]. Moreover, Complete-IoU was proposed, considering the aspect ratio between the predicted and ground truth bounding boxes to improve training stability and ensure accurate object detection [32]. However, these methods have limitations when detecting objects with varying sizes, because the size of the bounding box is a relative value that changes depending on the size of the objects, leading to unstable detection performance for small or elongated objects [33]. These limitations indicate that a new method is required for bounding box optimization to enhance the detection performance of neural networks and improve their robustness to object sizes.
To address these limitations, this study proposes a new framework with a feature-attention multi-size robustness network (FAMSR-Net) and high-fidelity virtual images. The key contributions of the proposed framework are as follows:
• FAMSR-Net employs a convolutional block attention module (CBAM) to improve the detection accuracy of transmission facilities in various environments. The CBAM fusing channel and spatial attention modules contribute to emphasizing one-dimensional features and highlighting two-dimensional features.
• FAMSR-Net also employs Scylla-IoU (SIoU) bounding box optimization to enhance the robustness of power facilities of various sizes, specifically incorporating angle loss to align the predicted and ground truth bounding boxes, distance loss to minimize the center distance, shape loss to match the predicted bounding box size to the ground truth, and IoU to calculate their intersection area.
• High-fidelity virtual transmission facility images were co-trained by addressing StyleGAN2-ADA to provide sufficient images for various environments. Modulation and demodulation were addressed in StyleGAN2-ADA to maintain correlations among feature maps, while adaptive discriminator augmentation and invertible distribution transformation were also applied in StyleGAN2-ADA to enable high-quality image generation from a limited number of inputs. The input skip connections and residual architectures in StyleGAN2-ADA helped minimize information loss in the feature maps.
• Extensive validation with various measured and public image sets demonstrated that FAMSR-Net accurately detects transmission facilities. A systematic analysis further confirmed that FAMSR-Net achieves the best detection performance when virtual transmission facility images are co-trained with real images, indicating that the proposed framework is both accurate and robust.
The remainder of this paper is organized as follows. Section 2 introduces the neural network for generating virtual images and various methods aimed at improving the performance of FAMSR-Net. Section 3 explains the image set used in the experiments and the evaluation metrics, and Section 4 analyzes the effectiveness of FAMSR-Net and virtual images based on the experimental results. Finally, Section 5 presents the conclusions of this study and suggests directions for future research.
The proposed framework comprises two phases to detect transmission facilities with high accuracy (Fig. 2). First, image argumentation is executed with real transmission facility images (① in Fig. 2). Specifically, StyleGAN2-ADA generates virtual images based on real images to reflect realistic conditions using diverse colors, shapes, and other variations [34]. This augmentation not only increases the quantity of training data but also improves the robustness of the network when detecting facilities under various scenarios. Second, all real and virtual images are trained through the feature-attention multi-size robustness network (FAMSR-Net), incorporating CBAM and SIoU (② in Fig. 2). Specifically, CBAM sequentially applies channel and spatial attention mechanisms to emphasize significant features, enabling the proposed neural network to focus on key elements [35]. SIoU further improves the accuracy of bounding box localization by considering the angle, shape, distance, and IoU of the bounding box [33]. This characteristic of the SIoU promotes the convergence of network training and enhances the detection performance for transmission facilities of varying sizes. Note that these features, that is, the CBAM and SIoU, are different from the architecture of the original YOLO v7. Hence, FAMSR-Net outperforms the other object detection networks in terms of detection accuracy and robustness. The features of each phase are described in detail in the following subsections.

Figure 2: Detection method for transmission facilities with feature-attention multi-size robustness network and generative adversarial network
This study uses StyleGAN2-ADA for virtual image generation because it has the advantages of distinguishing and controlling various characteristics, maintaining correlations between feature maps, and stably generating high-quality images even with limited data [34,36,37]. Specifically, the StyleGAN2-ADA employs a mapping mechanism (① in Fig. 3), a modulation and demodulation architecture in the generator (the blue dashed-line box in Fig. 3), adaptive discriminator augmentation (ADA, ④ in Fig. 3), and invertible distribution transformation (IDT, ⑤ in Fig. 3) in the discriminator. This subsection presents details of these characteristics.

Figure 3: The architecture of StyleGAN2-ADA; A: Transformation matrix that generates a style from W; B: Noise operation;
First, the StyleGAN2-ADA introduces a mapping mechanism (① in Fig. 3) that transforms the latent space Z into W. The latent space Z used by the conventional Progressive Growing of GANs (PGGAN) [38] for image generation follows a Gaussian distribution and tends to be nonlinearly entangled with the data distribution [36]. This makes it difficult for the neural network to distinguish features clearly, and attempts to adjust one specific feature can unintentionally alter other unrelated features. For example, adding a beard feature alone could also change unrelated features such as gender or hairstyle when generating an image of a man. The mapping process transforms the latent space W into a more linear and less entangled space than Z, enabling clearer distinction and control of various features [36].
Second, the generator (the blue dashed-line box in Fig. 3) addresses the architecture of modulation and demodulation for virtual image generation (② in Fig. 3). First, modulation and demodulation adjust the weight
where
This equation represents demodulation, where the
where
The discriminator executes ADA (④ in Fig. 3) and IDT (⑤ in Fig. 3) before evaluating the images. First, the ADA augments both real and virtual images through rotation, cropping, filtering, and color transformation. This characteristic of ADA overcomes the limitations of feature extraction caused by limited data and resolves the overfitting issues of the discriminator, because ADA generates diverse data during the training process. ADA also enhances the stability of the neural network during training, thereby preventing the collapse of learning. Second, IDT is used to reduce the occurrence of abnormal images, because excessively augmented images may decrease the similarity between real and virtual data during the training phase. For example, assuming a normal orientation of
2.2 Feature-Attention Multi-Scale Robustness Network
This study proposes a FAMSR-Net comprising three phases: backbone, neck, and head (Fig. 4). Each phase integrates various modules of a neural network to enhance the performance of object detection, including the CBAM (Fig. 4b) and SIoU (① at the pink box in Fig. 4a). Hence, FAMSR-Net effectively distinguishes objects of interest from the background and provides robust object detection for power facilities of different sizes in diverse environments.


Figure 4: The architecture of the object-attention multi-scale detection network (FAMSR-Net); (a) The process of the FAMSR-Net; (b) The architecture of CBAM
First, the backbone (green box in Fig. 4a) extracts diverse features from the input image by addressing the multi-scale architecture with an Efficient Layer Aggregation Network (ELAN) [40] (green block in Fig. 4a). ELAN comprises multiple Convolution Batch Normalization SiLU activation function module (CBS) blocks with kernel sizes of
Second, the neck (orange box in Fig. 4a) strengthens the feature maps from the backbone by addressing several modules, including PANet, SPPCSPC (spatial pyramid pooling cross-stage partial connections), ELAN-H, the re-parameterized convolution block, and CBAM. PANet (purple dashed-line box in Fig. 4a) is an improved version of Feature Pyramid Network (FPN) that minimizes information loss [41,42], because it adds a bottom-up path to FPN (sky-blue dashed-line box in Fig. 4a), enabling information from the lowest feature map to reach the final feature map through a shortcut path (red arrow in Fig. 4a). SPPCSPC (cyan block in Fig. 4a) combines spatial pyramid pooling (SPP) and cross-stage partial connections (CSPC) to utilize multi-scale spatial features and perform six concatenation processes. Specifically, SPP processes input data through max pooling three times with kernel sizes
where
where
Specifically, the input feature map
Third, the head (pink box in Fig. 4a) detects the objects of interest by addressing the SIoU with the input of the enhanced feature map
where
where
where
where
3.1 Data Acquisition and Collection
This subsection describes the four image sets used in this study. These image sets aim to help the proposed network train various features of images through realistic scenarios and diverse augmentation examples, while enhancing the detection performance of the proposed network under various conditions, such as object scales, class types, and backgrounds. Detailed information for all image sets is presented in Table 1.

The first set included images from the transmission facilities. This image set was utilized for FAMSR-Net training and generating virtual images of transmission facilities through StyleGAN2-ADA, with the generated virtual images expanding the training and validation sets. Specifically, a custom UAV from the Korean Electric Power Corporation (KEPCO) recorded these images following the procedure in [43,44]. The UAV maintained a 30 m safe distance due to strong magnetic fields [45] and was equipped with an SPMY FDR-AX-100 (Sony, Japan) camera, capturing 1920 × 1080 and 1440 × 1080 images. In particular, 1920 × 1080 images were collected at 12 locations, including Asan-Yesan and Shinseosan-Shinanseong, while 1440 × 1080 images were obtained at Daeduck-Duckjin, resulting in 24,171 transmission-facility images (Fig. 5a). Images of the transmission facilities were then labeled into six classes for training the FAMSR-Net, including insulators, lightning arresters, SB dampers, spacers, towers, and marker balls (① to ⑥ in Fig. 5a). Detailed information regarding each class in the image set is presented in Table 1.
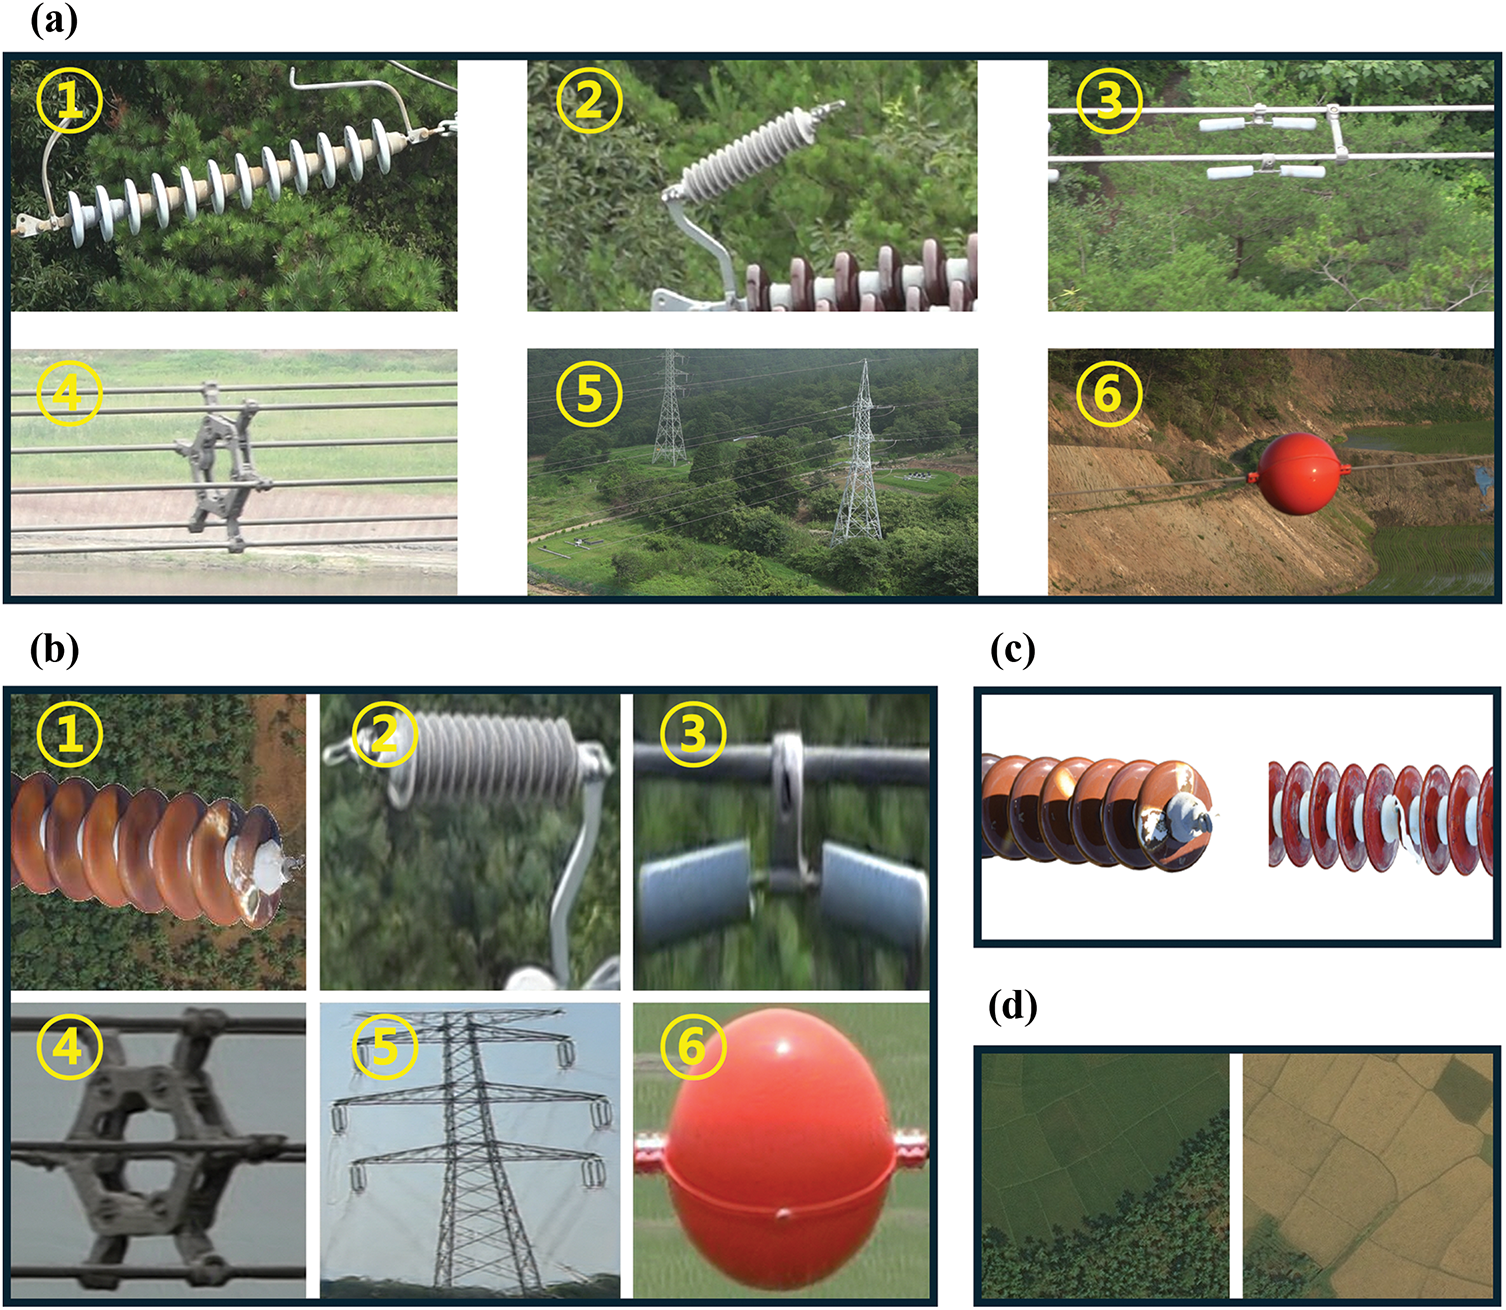

Figure 5: Example images from four datasets used in this study; (a) real images of transmission facilities; (a-①) insulator; (a-②) lightening arrester; (a-③) SB damper; (a-④) marker ball; (a-⑤) tower; (a-⑥) spacer; (b) virtual images of transmission facilities; (b-①) fault insulator; (b-②) lightening arrester; (b-③) SB damper; (b-④) marker ball; (b-⑤) tower; (b-⑥) spacer; (c) real images of fault insulators; (d) aerial images of forests; (e) images of PASCAL VOC2012; (e-①) aero plane; (e-②) bus; (e-③) dog
The second image set included fault insulator images provided by the Electric Power Research Institute (EPRI) (Fig. 5c) [46]. This image set is utilized to generate virtual faulty insulator images through StyleGAN2-ADA, aiming to effectively account for the various features of insulators in fault situations. Note that this image set was originally constructed for research aimed at improving the efficiency of transmission facility operation and maintenance, and training machine learning models capable of fault detection. Hence, this image set includes various types of fault insulators collected from a UAV equipped with cameras or photographs taken by operators [46]. Note that this image set was utilized to generate virtual fault insulator images in this study because the more diverse the available insulator images, the more effectively the proposed network can learn various features. Specifically, this image comprises 1600 photos of contaminated or damaged faulty insulators in high resolution, including
The third image set comprises forest aerial images recorded by satellites (Fig. 5d) [47]. The image set was originally constructed to support research on rural land development and environmental protection. Hence, this image set included various land-cover terrains and agricultural areas, including farms, orchards, forests, and fields. Note that this image set is utilized as the background image in this study when generating virtual fault insulator images (① in Fig. 5b), aiming to make the virtual fault insulator images resemble the environment of real images, because power transmission facilities are generally installed in rural areas. The proposed network uses virtual images with these backgrounds for training, implying that it can detect insulators more accurately in various environments. This image set comprises 5108 images, including forests and fields, with all images having a resolution of
The fourth image set was PASCAL VOC2012 (Fig. 5e) [48]. This image set was used to enhance and verify the robustness and generalization capability of the proposed neural network across various classes, resolutions, and backgrounds. This image set comprises photos captured from diverse backgrounds, including indoor and outdoor environments as well as urban and natural scenes, aimed at advancing research in various computer vision fields, including object detection, classification, and segmentation [48]. The image set includes 20 object classes such as airplanes, buses, and dogs (① to ③ in Fig. 5c), with a variety of image resolutions, including
3.2 Generating Virtual Images for Transmission Facilities
This subsection presents the detailed procedure for generating virtual images for transmission facilities. Virtual images generated for power transmission facilities include faults and normal conditions. Specifically, virtual images for the insulator include fault images, whereas the virtual images for other facilities only include normal images because most faults of power transmission lines originate from insulators, suggesting that the FAMSR-Net needs to learn various conditions of insulators to secure robustness in object detection [49]. Note that the image set of the transmission facilities contains a large number of normal insulator images compared to the fault insulator images, as listed in Table 1. This imbalance in the image set resulted in a decrease in the object detection accuracy of FAMSR-Net across various insulator conditions. Hence, generating virtual faulty insulator images was prioritized to address these issues. Virtual images of all the transmission facilities were generated using StyleGAN2-ADA. Three Tesla V100 (32 GB) graphics processing units (GPUs) with two Intel Xeon Gold 5220R central processing units were used to generate virtual images through StyleGAN2-ADA; the batch size of StyleGAN2-ADA was set to 48, a multiple of the three GPUs, to enable efficient data distribution. The number of real images used to generate the virtual images is listed in Table 2.

StyleGAN2-ADA, comprising a generator and a discriminator, was constructed to generate virtual images. First, eight MLP layers transform the 512-dimensional latent vector Z into a 512-dimensional linear latent space W. The latent space W contains various features that are utilized by the generator when generating virtual images. Specifically, the generator extracts various features from the latent space W and dynamically adjusts the convolution weights of the feature maps through modulation and demodulation, effectively embedding the extracted features into the feature maps. The generator comprised upsampling layers with
Next, the virtual images for the insulator and lightning arrester underwent modification processes (Fig. 6) because these virtual images lacked characteristics such as orientation, unlike real images. Virtual images of other transmission facilities (③ to ⑥ in Fig. 6b) did not undergo such modification processes because other transmission facilities had backgrounds such as real images and remained fixed in directional orientation in real-world environments. Specifically, virtual images for the insulator were rotated at angles of
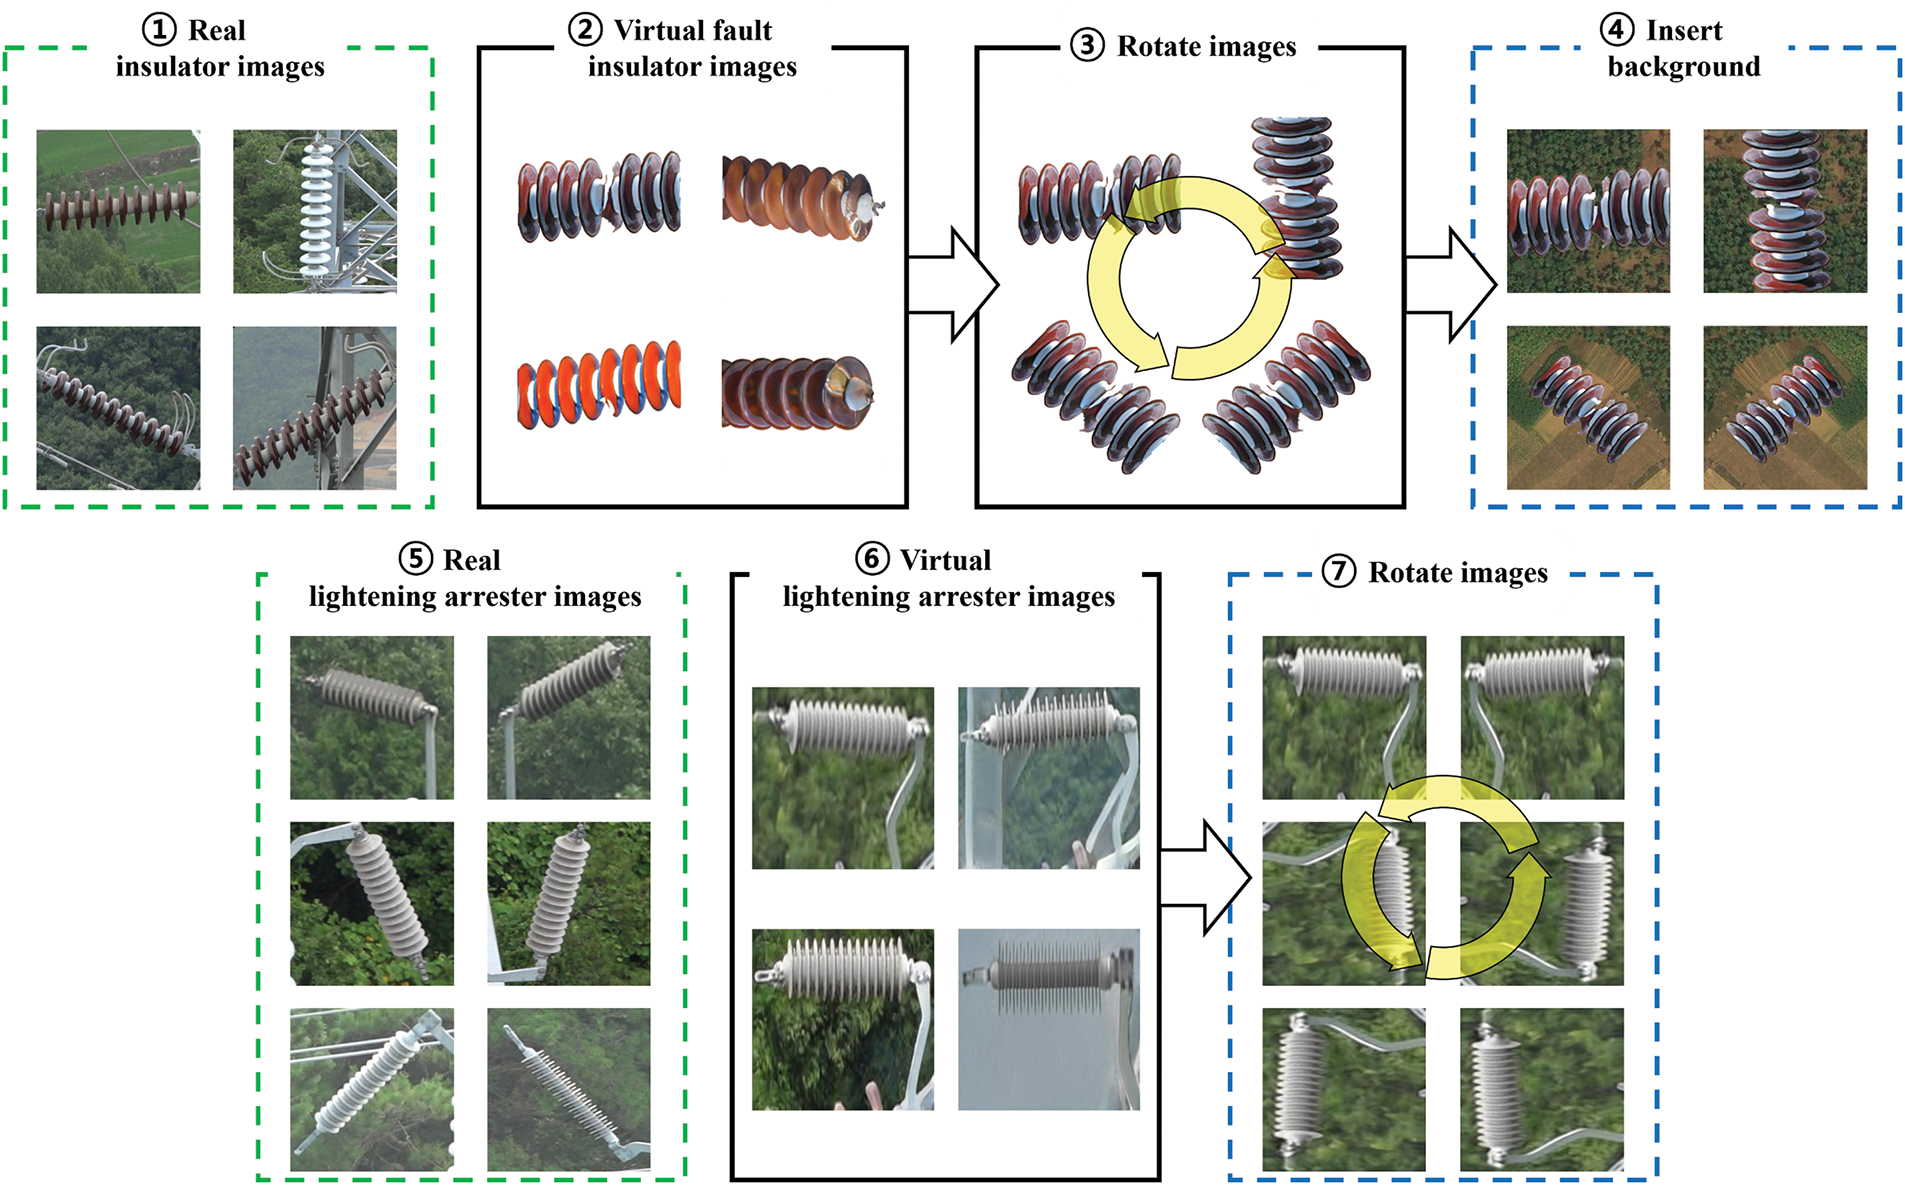
Figure 6: Modification processes of virtual images
3.3 Construction of the FAMSR-Net
This subsection presents the construction of FAMSR-Net. Three Tesla V100 (32 GB) GPUs with two Intel Xeon Gold 5220R CPUs were used for the training, validation, and testing of FAMSR-Net. The resolution of the input images was adjusted to
The architecture of FAMSR-Net comprises a CNN-based backbone, neck, and head. First, the backbone comprised downsampling layers with two kernels of
The image set of transmission facilities, comprising only real images, was divided into 16,920 (70%), 4834 (20%), and 2417 (10%) images, whereas the image set with additional virtual transmission facility images was divided into 25,718 (73.1%), 7033 (20%), and 2417 (6.9%) images for training, validation, and testing, respectively. The image set of PASCAL VOC2012 was also divided into 11,987 (70%), 3425 (20%), and 1713 (10%) images for comparing the performance of the FAMSR-Net with other neural networks. The training and validation image sets were used for hyperparameter optimization through Bayesian optimization (BO), whereas the test image set was used to evaluate the accuracy and robustness of FAMSR-Net. BO was used because it can converge in a shorter time and easily find the global minimum compared to other optimization methods such as grid search and genetic search [50,51]. Specifically, BO randomly selects hyperparameter combinations in the initial stage to evaluate the performance of these combinations, and then uses a Gaussian process to model the distribution of the objective function, enabling exploration of the optimal hyperparameter combination. BO was examined to optimally tune the learning rate, momentum, and weight decay, ensuring that these hyperparameters were adjusted to maximize mean Average Precision (mAP). The initial range of hyperparameters optimized through BO was selected based on preliminary experiments and prior domain knowledge (Table 3). A suitably small learning rate helps maintain a balance between convergence speed and stability, a high momentum value sustains training momentum without causing excessive oscillations, and an appropriate level of weight decay provides sufficient regularization to mitigate overfitting without overly constraining the model parameters. This optimization procedure ensures the best performance of FAMSR-Net. The optimized hyperparameters are presented in Table 3. Note that YOLO v7 and YOLO v7 with CBAM (YOLO v7-CBAM) were also trained and optimized using BO for comparative studies. The batch size of FAMSR-Net was set to 63, which is a multiple of the three GPUs, to efficiently distribute the images across the GPUs.

This subsection presents the evaluation metrics for the performance comparison. First, the Fréchet inception distance (FID) is used to compare the results of the virtual images [52]. This metric calculates the difference between real and virtual images based on the data distribution as follows:
where
Second, the mAP was used to evaluate the detection performance of the neural networks. Note that mAP was calculated by increasing the IoU thresholds from 0.5 to 0.95 with increments of 0.05. This metric comprehensively considers various thresholds to accurately reflect the overall detection performance of a neural network, as follows:
where
where
4.1 Fidelity Evaluation of Virtual Images
This subsection evaluates the fidelity of virtual images generated using StyleGAN2-ADA. A comparative study was also conducted using StyleGAN1 and StyleGAN2, in which StyleGAN2-ADA outperformed StyleGAN1 and StyleGAN2 in generating virtual images. StyleGAN1 employs adaptive instance normalization (AdaIN) because it is effective in controlling the features of feature maps [36]. Specifically, this method normalizes the entire feature map using its mean and standard deviation of the feature map, along with the vector and bias derived from the latent space W. StyleGAN2 employs a modulation-and-demodulation architecture because it is effective in controlling feature maps [37]. StyleGAN2 also addresses the input skip connection architecture of the generator and the residual architecture of the discriminator to minimize feature loss [37].
The FID values of the three neural networks are listed in Table 4. Interestingly, StyleGAN2-ADA and StyleGAN2 exhibited lower FID values than StyleGAN1. Specifically, those of StyleGAN1, StyleGAN2, and StyleGAN2-ADA were 73.9, 61.1, and 24.0, respectively, suggesting that virtual images generated by StyleGAN2 and StyleGAN2-ADA show significant improvements in issues including noise, blotches, and corrupted shapes, which are observed in the virtual images generated by StyleGAN1 (Fig. 7). This analysis also implies that the architecture of modulation and demodulation in StyleGAN2-ADA and StyleGAN2 is more effective than AdaIN in StyleGAN1, because the architecture of modulation and demodulation effectively extracts distinct features from real images. The input skip connection architecture and residual architecture addressed in StyleGAN2-ADA and StyleGAN2 may also contribute to improving the fidelity of virtual images because these architectures are effective in preventing feature loss during training. A comparative study between StyleGAN2-ADA and StyleGAN2 showed that StyleGAN2-ADA is better than StyleGAN2 at generating virtual images because StyleGAN2-ADA has a lower FID than StyleGAN2. Specifically, the mean FID of StyleGAN2-ADA was 24.0, representing a reduction of 37.1 in FID compared with StyleGAN2. This analysis implied that the issue of distorted shapes in the virtual images generated by StyleGAN2 was also resolved in StyleGAN2-ADA (Fig. 7). This analysis suggests that the ADA and IDT addressed in StyleGAN2-ADA are effective in generating high-quality and high-fidelity virtual images, even with a limited number of input images, because the ADA and IDT effectively increase feature diversity while reducing overfitting during virtual image generation. Hence, StyleGAN2-ADA is the most effective among the three neural networks for generating virtual images in transmission facilities.


Figure 7: The virtual image results for (a) StyleGAN1; (b) StyleGAN2; (c) StyleGAN2-ADA
Interestingly, the virtual images for the SB damper achieved the lowest FID among those generated using StyleGAN2-ADA. This result implies that extracting distinct features from the SB damper is easier than extracting distinct features from other classes, because the SB damper features a simple shape of two connected dampers. A large number of input images for the SB dampers also contributes to training the neural network by effectively learning the features. The FID of the virtual insulator images was the second lowest, although the insulators had complex and bumpy shapes. The high fidelity of virtual images originates from two sources. First, the absence of a background in the input images for the insulators contributes to the high fidelity of virtual images, because there is no need to consider the background during virtual image generation, and the neural network focuses more on learning insulators, effectively reflecting the features of the insulators in the virtual images. Second, the high resolution of input images for insulators is required because the input images of the insulator have a higher resolution than the input images of other transmission facilities, allowing the neural network to effectively learn the detailed features of the insulator. By contrast, the FID of the virtual images for the spacers was the largest among the virtual images generated by StyleGAN2-ADA. This low fidelity originates from the fact that spacers have two types of 4-conductor or 6-conductor types in real images, depending on the voltage of the transmission line. Note that the two types of spacers increase the complexity when extracting distinct features from images of the spacer, in consideration of the limited number of images of the spacers. The FID of the virtual images for the marker balls was the second largest because the number of input images for the marker balls was smaller than the average number of input images for the transmission facilities. This comprehensive analysis suggests that a large number of input images and their high resolution of input images contribute to enhancing the fidelity of virtual images, whereas the complex shape and diversity of input images disturb the extraction of the features of input images to generate virtual images.
4.2 Detection Performance of the FAMSR-Net
This subsection evaluates the detection performance of FAMSR-Net by comparing the mAP of FAMSR-Net with those of YOLO v7 and YOLO v7 with CBAM (YOLO v7-CBAM). The performance analysis of these networks was conducted using only real images of transmission facilities and using both real and virtual images together (Table 5). The mAP graph of these networks was also analyzed based on the use of only real images of transmission facilities and the use of both real and virtual images (Figs. 8 and 9). The detection accuracies of the three neural networks were also analyzed using the PASCAL VOC2012 image set to confirm the superiority of the proposed neural network over the YOLO series. Note that FAMSR-Net addresses CBAM and SIoU bounding box optimization to effectively learn object features and enhance the detection performance for objects of various sizes.


Figure 8: The mAP graph of the three networks when trained only on real transmission facility images; (a) Insulator; (b) Lightening arrester; (c) SB damper; (d) Spacer, (e) Tower; (f) Marker ball

Figure 9: The mAP graph of the three networks when co-trained on real and virtual transmission facility images; (a) Insulator; (b) Lightening arrester; (c) SB damper; (d) Spacer, (e) Tower; (f) Marker ball
First, the YOLO v7-CBAM and the FAMSR-Net demonstrated a 1.5% and 1.9% improvement in mAP for detecting transmission facilities compared with the YOLO v7 (Table 5). This analysis indicates that the CBAM addressed in both FAMSR-Net and YOLO v7-CBAM enhances the learning capability of neural networks, because the proposed neural network emphasizes the key features of objects and their locations on the feature map through the channel and spatial attention modules. Especially, the AP for lightning arresters significantly increased by 2.4% and 3.9% with the YOLO v7-CBAM and the FAMSR-Net compared with the YOLO v7. This significant enhancement suggests that CBAM is effective in detecting objects exposed to large portions of the background, because images including lightning arresters generally contain large portions of the background, including support structures. The architecture of the CBAM also contributes to detecting objects with complex shapes and small objects, because the AP for insulators, which have the most complex shapes among transmission facilities, as well as for smaller objects, including spacers, SB dampers, and marker balls, improves by more than 1% in both the YOLO v7-CBAM and the FAMSR-Net compared with the YOLO v7. The mAP graph also demonstrates that the detection performance of the network improves when CBAM is applied (Fig. 8). Note that detecting spacers, SB dampers, and marker balls is challenging because their mean bounding box sizes are 1609, 1865, and 2878, respectively, which are smaller than the mean bounding box size of transmission facilities (4791) (Table 6). The detection accuracy of the PASCAL VOC2012 image set also supports this hypothesis; the YOLO v7-CBAM and the FAMSR-Net improve the mAP by 1.4% and 1.9% compared with the YOLO v7, respectively, confirming the effectiveness of the CBAM (Table 7).


Second, FAMSR-Net outperforms YOLO v7-CBAM, indicating that the architecture of the SIoU addressed in FAMSR-Net contributes to improving the neural network’s performance in detecting objects of various sizes. This analysis also suggests that the SIoU is more robust than the CIoU addressed in YOLO v7-CBAM and YOLO v7, because the SIoU accounts for angle loss, distance loss, and shape loss instead of relying on relative aspect ratio values. Specifically, the mAP of classes with a large coefficient of variation improved in the FAMSR-Net compared with the YOLOv7-CBAM, with lightning arresters showing the highest improvement of 1.5% (Table 5). The mAP graph also indicates that the detection performance of the network improves when SIoU is applied (Fig. 8). This result supports the hypothesis that the SIoU employs robustness for object detection with various sizes when the coefficient of variation for a bounding box size is low, because the coefficient of variation for the bounding box size of the lightning arrester is 1.34 (Table 6). However, the mAP of the spacer decreased by 0.4% in the FAMSR-Net compared to the YOLOv7-CBAM. This result indicates that the contribution of the SIoU is small for sizes with very low variations, because the spacer has the lowest coefficient of variation in the bounding box size among the transmission facilities (Table 6). The detection accuracy of the FAMSR-Net on the PASCAL VOC2012 image set further supports the hypothesis that the SIoU makes FAMSR-Net robust against various sizes of objects, because FAMSR-Net achieves a 0.5% higher mAP than that of YOLO v7-CBAM on the PASCAL VOC2012 image set (Table 7).
Third, the detection accuracy of all three neural networks improved when virtual transmission facility images were incorporated into the training process. Specifically, the improvements in YOLO v7, YOLO v7-CBAM, and FAMSR-Net were 1.8%, 0.5%, and 0.4%, respectively, when training both real and virtual images, suggesting that high-fidelity virtual images contribute to enhancing the detection accuracy of three neural networks (Table 5). The mAP graph also shows that the detection performance of the network improves when virtual images are used for training (Fig. 9). Interestingly, the AP of both the tower and marker ball increased by more than 0.6% in all three neural networks when virtual images were incorporated into the training process, indicating that virtual images would be effective for training neural networks on a small number of objects because the number of marker balls in the real images was the lowest and that of towers was the second lowest (Table 1). The virtual images also enhanced the detection accuracy of the neural networks for complex shapes, such as the insulators, because the AP of the insulator for all three neural networks increased by more than 0.4%. Furthermore, virtual images were effective in object detection in complex environments because the neural networks that trained on both real and virtual images accurately detected insulators obscured by towers and backgrounds (in Fig. 10e–g). In contrast, the neural networks trained only on real images tend to either redundantly detect or fail to detect insulators in the same scenarios (in Fig. 10b–d). However, the addition of virtual images yielded a 1.2% decrease in the AP of the FAMSR-Net for lightning arresters compared to that using only real images. This result indicates that the extensive backgrounds present in the virtual lightning arrester images negatively affect the detection performance of FAMSR-Net, because the backgrounds of the virtual arrester images are monotonous and decrease the robustness in diverse environments. These backgrounds also act as noise during the network training process, reducing the detection performance of FAMSR-Net for lightning arresters.

Figure 10: (a) Input image and detection results for transmission facilities using (b) YOLO v7; (c) YOLO v7 with CBAM; (d) FAMSR-Net; (e) YOLO v7 with virtual images. (f) YOLO v7 with CBAM and virtual images; (g) FAMSR-Net with virtual images
4.3 Superiority Compared to Other Neural Networks
This subsection evaluates the detection performance of FAMSR-Net by comparing its mAP with those of other neural networks, including Faster R-CNN [17], RefineDet [53], Deformable Detection Transformer (DETR) [54], and Co-DETR [55], in the sense that these networks are widely used in object detection owing to their superior performances. Faster R-CNN is a two-stage detector that sequentially performs region proposal and classification. Specifically, the region proposal network in Faster R-CNN addresses anchor boxes of varying sizes and aspect ratios to generate region proposals for bounding boxes on the feature map [56]. RefineDet is a one-stage detector that simultaneously performs region proposal and classification, thereby enabling fast and accurate object detection. RefineDet features an architecture comprising an anchor refinement module (ARM), transfer connection block (TCB), and object detection module (ODM) to achieve accurate yet fast performances [53]. Deformable DETR is a one-stage detector that performs object localization and classification simultaneously using a transformer-based architecture with deformable attention. This neural network integrates deformable attention modules (DAM) in both the encoder and decoder to focus on a small set of key sampling points around a reference, significantly reducing computational complexity and accelerating training convergence. Note that Deformable DETR inherently supports multi-scale feature aggregation without using FPNs and thereby enhances performance through iterative bounding box refinement and a two-stage variant where region proposals are generated and refined for improved accuracy [54]. Co-DETR is also a one-stage detector that performs region proposals and classification simultaneously, comprising a transformer-based encoder-decoder architecture. Specifically, Co-DETR applies a DAM to the encoder to selectively learn information from relevant regions and employs multiple auxiliary heads in the decoder to infer object locations and classes [54,55].
The mAP of the five neural networks is listed in Table 8. The mAP was calculated with the test image set of the transmission facilities. Remarkably, FAMSR-Net outperforms other neural networks for all objects of interest for power facilities. Specifically, FAMSR-Net achieved a 23.9% improvement in mAP compared to that of Faster R-CNN. This improvement suggests that the architecture of PANet in FAMSR-Net would effectively extract feature maps by minimizing the loss of feature maps in the training phase, because the PANet facilitates effective integration of multi-level features and thereby enables the neural network to retain essential details that are critical for detecting small or partially hidden components. Furthermore, the bottom-up path aggregation and a shortcut path in PANet contribute to preserving fine-grained features from lower layers, which are often lost in conventional top-down architectures. This characteristic is particularly beneficial for identifying small transmission facilities. The FAMSR-Net achieved a 10.3% higher mAP compared to that of RefineDet. This result indicates that the FAMSR-Net effectively addresses information across multi-scale information because the ELAN deployed in the FAMSR-Net effectively extracts multi-scale information from feature maps through multiple paths, and the SPPCSPC of the FAMSR-Net also properly handles multi-scale spatial information through multiple paths. These modules work in a complementary manner to enhance the representation of objects with varying sizes and spatial characteristics, which is particularly beneficial for detecting small or complicated structured components in transmission facilities. Therefore, the architecture of FAMSR-Net, which utilizes ELAN and SPPCSPC, enables more accurate detection of transmission facilities with complex structures through robust feature extraction and refined spatial context modeling. In contrast, the architecture of RefineDet tends to simplify multi-scale feature extraction, resulting in relatively lower detection performance. FAMSR-Net also demonstrated a 7.3% improvement in mAP over Deformable DETR. This result indicates that the CBAM of FAMSR-Net enhances the feature map information more effectively than the DAM of Deformable DETR. This analysis suggests that the architecture of the CBAM extracts both key features and localization information from the feature map, whereas DAM enhances only selective region information from the feature map. This result also demonstrates that CBAM would be advantageous for detecting small or occluded objects, which are commonly shown in transmission facilities. Additionally, the integration of channel and spatial attention in CBAM contributes to more robust representations by explicitly reinforcing informative channels and spatial positions across the entire feature map. This integrated approach contrasts with DAM’s limited attention strategy, validating CBAM’s superior capability in capturing object details, essential for precise detection in complex operational environments. FAMSR-Net also achieved a 1.2% higher mAP compared to that of Co-DETR. This result suggests that the SIoU deployed on FAMSR-Net would exhibit greater robustness to object sizes than the Generalized-IoU (GIoU) employed on the multiple auxiliary heads of Co-DETR, because the GIoU only considers the intersection ratio and area difference between the ground truth and predicted bounding boxes, without considering the center distance or directional alignment between the ground truth and predicted bounding boxes [30]. The SIoU addresses geometric alignment and angle, enabling more precise and robust localization, particularly in complex scenes with diverse orientations and partially occluded components. The SIoU also provides more efficient and accurate performance than the approach of Co-DETR, which iteratively refines bounding boxes through multiple auxiliary heads based on GIoU. This systematic analysis finally confirms that the proposed architecture contributes to constructing effective feature maps in FAMSR-Net and thereby enhances detection accuracy for power facilities of interest.

The Frames Per Second (FPS) of the five neural networks is listed in Table 8. Overall, FAMSR-Net exhibited a reasonable inference speed, even though the accuracy of object detection was the highest. Specifically, the FPS of FAMSR-Net increased by 1.6 times compared to that of Faster R-CNN, although the accuracy of FAMSR-Net was approximately 1.5 times compared to that of Faster R-CNN. This result suggests that the deep and wide architecture of FAMSR-Net efficiently extracts multi-scale information from feature maps, whereas the shallow architecture of the Faster R-CNN struggles to extract information from feature maps. This result also demonstrates that depth and architectural complexity in FAMSR-Net are well balanced to maintain efficiency without severely compromising processing time. The FPS of FAMSR-Net was 17.5, which is lower than that of RefineDET. This result also implies that the architecture of FAMSR-Net is deeper and wider than that of RefineDet, because FAMSR-Net includes a diverse architecture, including ELAN, ELAN-H, SPPCSPC, CBAM, and PANet, whereas RefineDet has a simpler architecture with ARM, TCB, and ODM connected. Nevertheless, the gap in FPS between FAMSR-Net and RefineDet was only 2.5, showing that the enhanced accuracy did not come at a substantial cost in inference speed. Remarkably, the FPS of FAMSR-Net was 3.4 times higher than that of Deformable DETR and 6.2 times higher than that of Co-DETR. This result suggests that deploying a transformer architecture to a one-stage detector would slow down the inference speed compared to a conventional one-stage detector, because the transformer architecture deployed on Deformable DETR and Co-DETR requires substantial computational costs and memory [55]. This result also confirms that FAMSR-Net strikes a better balance between accuracy and speed, especially compared to transformer-based neural networks that often sacrifice inference time.
In summary, FAMSR-Net enables accurate real-time inference for object detection in environments with complex and diverse objects, because this neural network demonstrates the best detection performance among the five neural networks while showing no significant difference in FPS compared with RefineDET, the fastest neural network.
This study proposes a new neural network for fault inspection of transmission facilities. The proposed framework exhibits three key characteristics. First, StyleGAN2-ADA was utilized to generate virtual images of the transmission facilities to support neural network training. Specifically, StyleGAN2-ADA generates high-quality virtual images even with limited input images through the ADA and IDT. Second, CBAM was deployed in FAMSR-Net to improve the detection performance by enhancing the key information of the feature maps. Specifically, CBAM enhances the one- and two-dimensional information of feature maps through the channel and spatial attention modules. Third, SIoU was employed in FAMSR-Net to improve the robustness of the neural network for object localization of various sizes. Specifically, SIoU improves the robustness to bounding box sizes by considering the angle loss, distance loss, shape loss, and intersection area. The BO is further utilized for hyperparameter optimization of the neural network. Extensive experimental validation demonstrates that FAMSR-Net outperforms other neural networks, and the detection performance of FAMSR-Net for transmission facilities is maximized when virtual transmission facility images are co-trained. Hence, the proposed framework is effective for fault inspection of power transmission facilities considering their diverse environments. Future research should include minimizing the background noise to improve detection performance of the neural network and utilizing a high-resolution camera with automatic zoom to more accurately detect distant transmission facilities because the proposed framework has limitations in detection accuracy when objects are distant, obscured by background interference, or visually unclear.
Acknowledgement: The authors would like to thank the Korea Electric Power Corporation, the National Fire Agency of Korea, and the Ministry of the Interior and Safety of Korea for their support.
Funding Statement: This research was supported by the Korea Electric Power Corporation (R22TA14, Development of Drone System for Diagnosis of Porcelain Insulators in Overhead Transmission Lines), the National Fire Agency of Korea (RS-2024-00408270, Fire Hazard Analysis and Fire Safety Standards Development for Transportation and Storage Stage of Reuse Battery), and the Ministry of the Interior and Safety of Korea (RS-2024-00408982, Development of Intelligent Fire Detection and Sprinkler Facility Technology Reflecting the Characteristics of Logistics Facilities).
Author Contributions: The authors confirm their contributions to the paper as follows: Yunho Na: Conceptualization, Data curation, Formal analysis, Methodology, Software, Validation, Visualization, Writing—original draft; Munsu Jeon: Data curation, Formal analysis, Validation; Seungmin Joo: Data curation, Methodology, Validation; Junsoo Kim: Data curation, Investigation, Validation; Ki-Yong Oh: Conceptualization, Data curation, Methodology, Project administration, Supervision, Resources, Validation, Writing—original draft; Min Ku Kim: Data curation, Supervision, Resources, Writing—original draft; Joon-Young Park: Data curation, Funding acquisition, Resources. All authors reviewed the results and approved the final version of the manuscript.
Availability of Data and Materials: Fault insulator images dataset is publicly available in IEEE DataPort at https://ieee-dataport.org/competitions/insulator-defect-detection (accessed on 25 June 2025). Forest aerial images dataset is publicly available in Kaggle at https://www.kaggle.com/datasets/quadeer15sh/augmented-forest-segmentation (accessed on 25 June 2025). PASCAL VOC2012 dataset is publicly available in PASCAL Visual Object Classes Homepage at http://host.robots.ox.ac.uk/pascal/VOC/voc2012/index.html (accessed on 25 June 2025). Real and virtual transmission facilities images data is not available due to commercial restrictions.
Ethics Approval: Not applicable.
Conflicts of Interest: The authors declare no conflicts of interest to report regarding the present study.
References
1. Yu C, Liu Y, Zhang W, Zhang X, Zhang Y, Jiang X. Foreign objects identification of transmission line based on improved YOLOv7. IEEE Access. 2023;11:51997–2008. doi:10.1109/ACCESS.2023.3277954. [Google Scholar] [CrossRef]
2. Chen Y, Liu H, Chen J, Hu J, Zheng E. Insu-YOLO: an insulator defect detection algorithm based on multiscale feature fusion. Electronics. 2023;12(15):3210. doi:10.3390/electronics12153210. [Google Scholar] [CrossRef]
3. Sampedro C, Martinez C, Chauhan A, Campoy P. A supervised approach to electric tower detection and classification for power line inspection. In: International Joint Conference on Neural Networks (IJCNN); 2014 Jul 6–11; Beijing, China. p. 1970–7. doi:10.1109/IJCNN.2014.6889836. [Google Scholar] [CrossRef]
4. Martinez C, Sampedro C, Chauhan A, Campoy P. Towards autonomous detection and tracking of electric towers for aerial power line inspection. In: 2014 International Conference on Unmanned Aircraft Systems (ICUAS); 2014 May 27–30; Orlando, FL, USA. p. 284–95. [Google Scholar]
5. Souza BJ, Stefenon SF, Singh G, Freire RZ. Hybrid-YOLO for classification of insulators defects in transmission lines based on UAV. Int J Electr Power Energy Syst. 2023;148:108982. doi:10.1016/j.ijepes.2023.108982. [Google Scholar] [CrossRef]
6. Liu Y, Liu D, Huang X, Li C. Insulator defect detection with deep learning: a survey. IET Generation Trans & Dist. 2023;17:3541–58. doi:10.1049/gtd2.12916. [Google Scholar] [CrossRef]
7. Zhai Y, Wang D, Zhang M, Wang J, Guo F. Fault detection of insulator based on saliency and adaptive morphology. Multimed Tool Appl. 2017;76:12051–64. doi:10.1007/s11042-016-3981-2. [Google Scholar] [CrossRef]
8. Zhai Y, Chen R, Yang Q, Li X, Zhao Z. Insulator fault detection based on spatial morphological features of aerial images. IEEE Access. 2018;6:35316–26. doi:10.1109/ACCESS.2018.2846293. [Google Scholar] [CrossRef]
9. Wu Q, An J, Lin B. A texture segmentation algorithm based on PCA and global minimization active contour model for aerial insulator images. IEEE J Sel Top Appl Earth Obs Remote Sens. 2012;5:1509–18. doi:10.1109/JSTARS.2012.2197672. [Google Scholar] [CrossRef]
10. Zou M, Liu Y, Fu M, Li C, Zhou Z, Meng H, et al. Combining spectral and texture feature of UAV image with plant height to improve LAI estimation of winter wheat at jointing stage. Front Plant Sci. 2024;14:1272049. doi:10.3389/fpls.2023.1272049. [Google Scholar] [PubMed] [CrossRef]
11. Silva RRda, Escarpinati MC, Backes Aé R. Sugarcane crop line detection from UAV images using genetic algorithm and Radon transform. Signal, Image Video Process. 2021;15:1723–30. doi:10.1007/s11760-021-01908-3. [Google Scholar] [CrossRef]
12. Oberweger M, Wendel A, Bischof H. Visual recognition and fault detection for power line insulators. In: 19th Computer Vision Winter Workshop; 2014 Feb 3–5; Krtiny, Czech Republic. p. 1–8. [Google Scholar]
13. Tao X, Zhang D, Wang Z, Liu X, Zhang H, Xu D. Detection of power line insulator defects using aerial images analyzed with convolutional neural networks. IEEE Trans Syst Man Cybern Syst. 2020;50:1486–98. doi:10.1109/TSMC.2018.2871750. [Google Scholar] [CrossRef]
14. O’Shea K. An introduction to convolutional neural networks. arXiv:1511.08458. 2015. [Google Scholar]
15. Farhadi A, Redmon J. Yolov3: an incremental improvement. In: Computer vision and pattern recognition 1804. Berlin/Heidelberg, Germany: Springer; 2018. [Google Scholar]
16. Liu W, Anguelov D, Erhan D, Szegedy C, Reed S, Fu CY, et al. SSD: single shot multibox detector. In: Comput Vis–ECCV 2016. Proceedings of the 14th European Conference; 2016 Oct 11–14; Amsterdam, The Netherlands. p. 21–37. [Google Scholar]
17. Girshick R. Fast r-cnn; 2015. arXiv:1504.08083. [Google Scholar]
18. Liu C, Wu Y, Liu J, Sun Z. Improved YOLOv3 network for insulator detection in aerial images with diverse background interference. Electronics. 2021;10(7):771. doi:10.3390/electronics10070771. [Google Scholar] [CrossRef]
19. Li Y, Zou G, Zou H, Zhou C, An S. Insulators and defect detection based on the improved focal loss function. Appl Sci. 2022;12:10529. doi:10.3390/app122010529. [Google Scholar] [CrossRef]
20. Miao X, Liu X, Chen J, Zhuang S, Fan J, Jiang H. Insulator detection in aerial images for transmission line inspection using single shot multibox detector. IEEE Access. 2019;7:9945–56. doi:10.1109/ACCESS.2019.2891123. [Google Scholar] [CrossRef]
21. Li X, Su H, Liu G. Insulator defect recognition based on global detection and local segmentation. IEEE Access. 2020;8:59934–46. doi:10.1109/ACCESS.2020.2982288. [Google Scholar] [CrossRef]
22. Luo L, Hsu W, Wang S. Data augmentation using generative adversarial networks for electrical insulator anomaly detection. In: Proceedings of the 2020 2nd International Conference on Management Science and Industrial Engineering; 2020 Apr 7–9; Osaka, Japan. 2020 Apr 7–9. p. 231–6. doi:10.1145/3396743.3396790. [Google Scholar] [CrossRef]
23. Goodfellow I, Pouget-Abadie J, Mirza M, Xu B, Warde-Farley D, Ozair S, et al. Generative adversarial nets. Adv Neural Inf Process Syst. 2014;27:139–44. doi:10.1145/3422622. [Google Scholar] [CrossRef]
24. Akella R, Gunturi SK, Sarkar D. Enhancing power line insulator health monitoring with a hybrid generative adversarial network and YOLO3 solution. Tsinghua Sci Technol. 2024;29:1796–809. doi:10.26599/TST.2023.9010137. [Google Scholar] [CrossRef]
25. Li Y, Li J, Zhai Y, Meng P. Detection of self-explosive insulators in aerial images based on improved YOLO v4. J Phys Conf S. 2022;2320(1):012025. doi:10.1088/1742-6596/2320/1/012025. [Google Scholar] [CrossRef]
26. Ebadollahi S, Gill B, Khosravani H, Pour FM. Assessing the contamination intensity of Porcelain insulators using deep learning networks by UAV. In: 14th Annual Computing and Communication Workshop and Conference (CCWC); 2024 Jan 8–10; Las Vegas, NV, USA. p. 111–8. doi:10.1109/CCWC60891.2024.10427557. [Google Scholar] [CrossRef]
27. Lyu Y, Han Z, Zhong J, Li C, Liu Z. A generic anomaly detection of catenary support components based on generative adversarial networks. IEEE Trans Instrum Meas. 2020;69:2439–48. doi:10.1109/TIM.2019.2954757. [Google Scholar] [CrossRef]
28. Tseng HY, Jiang L, Liu C, Yang MH, Yang W. Regularizing generative adversarial networks under limited data. In: Proceedings of the IEEE/CVF Conference on Computer Vision and Pattern Recognition; 2021 Jun 20–25; Nashville, TN, USA. p. 7917–27. doi:10.1109/CVPR46437.2021.00783. [Google Scholar] [CrossRef]
29. Rahman MA, Wang Y. Optimizing intersection-over-union in deep neural networks for image segmentation. In: International Symposium on Visual Computing. Cham, Switzerland: Springer; 2016. p. 234–44. [Google Scholar]
30. Rezatofighi H, Tsoi N, Gwak J, Sadeghian A, Reid I, Savarese S. Generalized intersection over union: a metric and a loss for bounding box regression. In: Proceedings of the IEEE/CVF Conference on Computer Vision and Pattern Recognition; 2019 Jun 15–20; Long Beach, CA, USA. p. 658–66. doi:10.1109/CVPR.2019.00075. [Google Scholar] [CrossRef]
31. Zheng Z, Wang P, Liu W, Li J, Ye R, Ren D. Distance-IoU loss: faster and better learning for bounding box regression. AAAI. 2020;34(7):12993–3000. doi:10.1609/aaai.v34i07.6999. [Google Scholar] [CrossRef]
32. Zheng Z, Wang P, Ren D, Liu W, Ye R, Hu Q, et al. Enhancing geometric factors in model learning and inference for object detection and instance segmentation. IEEE Trans Cybern. 2022;52:8574–86. doi:10.1109/TCYB.2021.3095305. [Google Scholar] [PubMed] [CrossRef]
33. Gevorgyan Z. SIoU loss: more powerful learning for bounding box regression; 2022. arXiv:2205.12740. [Google Scholar]
34. Karras T, Aittala M, Hellsten J, Laine S, Lehtinen J, Aila T. Training generative adversarial networks with limited data. Adv Neural Inf Process Syst. 2020;33:12104–14. [Google Scholar]
35. Woo S, Park J, Lee JY, Kweon IS. Cbam: convolutional block attention module. In: Ferrari V, Hebert M, Sminchisescu C, Weiss Y, editors. Proceedings of the European Conference on Computer Vision (ECCV). Cham, Switzerland: Springer International Publishing; 2018. p. 3–19. doi:10.1007/978-3-030-01234-2_1. [Google Scholar] [CrossRef]
36. Karras T, Laine S, Aila T. A style-based generator architecture for generative adversarial networks. In: Proceedings of the IEEE/CVF Conference on Computer Vision and Pattern Recognition; 2019 Jun 15–20; Long Beach, CA, USA. p. 4401–10. [Google Scholar]
37. Karras T, Laine S, Aittala M, Hellsten J, Lehtinen J, Aila T. Analyzing and improving the image quality of stylegan. In: Proceedings of the IEEE/CVF Conference on Computer Vision and Pattern Recognition; 2020 Jun 13–19; Seattle, WA, USA. p. 8107–16. doi:10.1109/CVPR42600.2020.00813. [Google Scholar] [CrossRef]
38. Karras T. Progressive growing of GANs for improved quality, stability, and variation; 2017. arXiv:1710.10196. [Google Scholar]
39. Salimans T, Kingma DP. Weight normalization: a simple reparameterization to accelerate training of deep neural networks. Adv Neural Inf Process Syst. 2016;29. [Google Scholar]
40. Wang CY, Liao HYM, Yeh IH. Designing network design strategies through gradient path analysis; 2022. arXiv: 2211.04800. [Google Scholar]
41. Lin TY, Dollár P, Girshick R, He K, Hariharan B, Belongie S. Feature pyramid networks for object detection. In: Proceedings of the IEEE Conference on Computer Vision and Pattern Recognition; 2017 Jul 21–26; Honolulu, HI, USA. p. 936–44. doi:10.1109/CVPR.2017.106. [Google Scholar] [CrossRef]
42. Liu S, Qi L, Qin H, Shi J, Jia J. Path aggregation network for instance segmentation. In: Proceedings of the IEEE Conference on Computer Vision and Pattern Recognition; 2018 Jun 18–23; Salt Lake City, UT, USA. p. 8759–68. doi:10.1109/CVPR.2018.00913. [Google Scholar] [CrossRef]
43. Kim D, Kim S, Jeong S, Ham JW, Son S, Moon J, et al. Rotational multipyramid network with bounding-box transformation for object detection. Int J Intell Syst. 2021;36:5307–38. doi:10.1002/int.22513. [Google Scholar] [CrossRef]
44. Moon J, Jeon M, Jeong S, Oh KY. RoMP-transformer: rotational bounding box with multi-level feature pyramid transformer for object detection. Pattern Recognit. 2024;147:110067. doi:10.1016/j.patcog.2023.110067. [Google Scholar] [CrossRef]
45. Park JY, Kim ST, Lee JK, Ham JW, Oh KY. Method of operating a GIS-based autopilot drone to inspect ultrahigh voltage power lines and its field tests. J Field Robot. 2020;37:345–61. doi:10.1002/rob.21916. [Google Scholar] [CrossRef]
46. Lewis D, Kulkarni P. Insulator defect detection. IEEE DataPort; 2021. doi:10.21227/vkdw-x769. [Google Scholar] [CrossRef]
47. Shaikh Q. Forest aerial images for segmentation. Kaggle; 2018. [cited 2025 May 16]. Available from: https://www.kaggle.com/datasets/quadeer15sh/augmented-forest-segmentation. [Google Scholar]
48. Everingham M, Van Gool L, Williams CKI, Winn J, Zisserman A. The PASCAL visual object classes (VOC) challenge. Int J Comput Vis. 2010;88(2):303–38. doi:10.1007/s11263-009-0275-4. [Google Scholar] [CrossRef]
49. Michaelis C, Mitzkus B, Geirhos R, Rusak E, Bringmann O, Ecker AS, et al. Benchmarking robustness in object detection: Autonomous driving when winter is coming; 2019. arXiv:1907.07484. [Google Scholar]
50. Snoek J, Larochelle H, Adams RP. Practical bayesian optimization of machine learning algorithms. Adv Neural Inf Process Syst. 2012;25. [Google Scholar]
51. Frazier PI. A tutorial on Bayesian optimization; 2018. arXiv:1807.02811. [Google Scholar]
52. Heusel M, Ramsauer H, Unterthiner T, Nessler B, Hochreiter S. Gans trained by a two timescale update rule converge to a local Nash equilibrium. Adv Neural Inf Process Syst. 2017;30:25. doi:10.18034/ajase.v8i1.9. [Google Scholar] [CrossRef]
53. Zhang S, Wen L, Bian X, Lei Z, Li SZ. Single-shot refinement neural network for object detection. In: Proceedings of the IEEE Conference on Computer Vision and Pattern Recognition; 2018 Jun 18–23; Salt Lake City, UT, USA. p. 4203–12. doi:10.1109/CVPR.2018.00442. [Google Scholar] [CrossRef]
54. Zhu X, Su W, Lu L, Li B, Wang X, Dai J. Deformable detr: deformable transformers for end-to-end object detection; 2020. arXiv:2010.04159. [Google Scholar]
55. Zong Z, Song G, Liu Y. Detrs with collaborative hybrid assignments training. In: Proceedings of the IEEE/CVF International Conference on Computer Vision; 2023 Oct 1–6; Paris, France. p. 6725–35. doi:10.1109/ICCV51070.2023.00621. [Google Scholar] [CrossRef]
56. Ren S, He K, Girshick R, Sun J.Faster R-CNN. Towards real-time object detection with region proposal networks. IEEE Trans Pattern Anal Mach Intell. 2017;39:1137–49. doi:10.1109/TPAMI.2016.2577031. [Google Scholar] [CrossRef]
Cite This Article
 Copyright © 2025 The Author(s). Published by Tech Science Press.
This work is licensed under a Creative Commons Attribution 4.0 International License , which permits unrestricted use, distribution, and reproduction in any medium, provided the original work is properly cited.
 Downloads
 Citation Tools