
 Submit a Paper
 Propose a Special lssue
 Open Access
ARTICLE

Enhancing 3D U-Net with Residual and Squeeze-and-Excitation Attention Mechanisms for Improved Brain Tumor Segmentation in Multimodal MRI
1 International Ph.D. Program in Innovative Technology of Biomedical Engineering and Medical Devices, Ming Chi University of Technology, New Taipei City, 243303, Taiwan
2 Department of Computer Engineering, College of Computer and Information Sciences, King Saud University, P.O. Box 51178, Riyadh, 11543, Saudi Arabia
* Corresponding Author: Nisar Ahmad. Email:
(This article belongs to the Special Issue: Exploring the Impact of Artificial Intelligence on Healthcare: Insights into Data Management, Integration, and Ethical Considerations)
Computer Modeling in Engineering & Sciences 2025, 144(1), 1197-1224. https://doi.org/10.32604/cmes.2025.066580
Received 11 April 2025; Accepted 26 June 2025; Issue published 31 July 2025
 View Full Text
 Download PDF
Abstract
Accurate and efficient brain tumor segmentation is essential for early diagnosis, treatment planning, and clinical decision-making. However, the complex structure of brain anatomy and the heterogeneous nature of tumors present significant challenges for precise anomaly detection. While U-Net-based architectures have demonstrated strong performance in medical image segmentation, there remains room for improvement in feature extraction and localization accuracy. In this study, we propose a novel hybrid model designed to enhance 3D brain tumor segmentation. The architecture incorporates a 3D ResNet encoder known for mitigating the vanishing gradient problem and a 3D U-Net decoder. Additionally, to enhance the model’s generalization ability, Squeeze and Excitation attention mechanism is integrated. We introduce Gabor filter banks into the encoder to further strengthen the model’s ability to extract robust and transformation-invariant features from the complex and irregular shapes typical in medical imaging. This approach, which is not well explored in current U-Net-based segmentation frameworks, provides a unique advantage by enhancing texture-aware feature representation. Specifically, Gabor filters help extract distinctive low-level texture features, reducing the effects of texture interference and facilitating faster convergence during the early stages of training. Our model achieved Dice scores of 0.881, 0.846, and 0.819 for Whole Tumor (WT), Tumor Core (TC), and Enhancing Tumor (ET), respectively, on the BraTS 2020 dataset. Cross-validation on the BraTS 2021 dataset further confirmed the model’s robustness, yielding Dice score values of 0.887 for WT, 0.856 for TC, and 0.824 for ET. The proposed model outperforms several state-of-the-art existing models, particularly in accurately identifying small and complex tumor regions. Extensive evaluations suggest integrating advanced preprocessing with an attention-augmented hybrid architecture offers significant potential for reliable and clinically valuable brain tumor segmentation.Graphic Abstract
Keywords
Tumors in the brain result from uncontrolled cellular growth, which can interfere with neural processes and harm adjacent healthy tissues. Because the brain is essential for regulating bodily activities, such growths can greatly affect its functioning, making them some of the most critical health threats to individuals. The incidence of malignant brain tumors is currently high, impacting both individuals and society as a whole [1]. The most common type of brain tumor is glioma, which occurs in the brain and exhibits varying degrees of aggressiveness. Gliomas can present with different symptoms and affect different brain sub-regions. These sub-regions can be categorized into peritumoral edema, necrotic core, and enhancing and non-enhancing tumors [2]. Magnetic Resonance Imaging (MRI) sequences are highly beneficial while assessing gliomas as they provide complementary information [3]. Radiologists choose MRI scans for diagnosing and assessing brain tumors. Complementary MRI modalities are T1-weighted (T1), contrast-enhanced T1-weighted (T1CE), T2-weighted (T2) and Fluid Attenuated Inversion Recovery (FLAIR). These scans are acquired based on the repetition and excitation durations, allowing their use alongside additional information to identify different tumor subregions [4–6].
Identifying brain tumor sub-regions manually using MRI data is a subjective process that is time-consuming and prone to errors. Radiologists may face challenges distinguishing brain cell nuclei from the MRI image background, adding complexity to the medical interpretation [7]. The complex shapes and positions of brain tumors in multimodal images pose segmentation challenges in MRI scans, which makes tumor identification in brain MRI images challenging. However, accurate tumor segmentation and delineation are essential for diagnosing and characterizing brain tumors [8]. Accurate segmentation enables the extraction of qualitative and quantitative data, distinguishing between benign and malignant tumors. This information aids in tailoring optimal therapies for patients and assists healthcare providers in devising more effective treatment strategies. Simplifying image analysis and segmentation facilitates efficient tumor identification.
Given the complexity of tumor segmentation in MRI images, numerous algorithms and techniques, ranging from manual to fully automated approaches, have been developed to address this challenge. Automated segmentation of gliomas from multimodal MRI scans can assist in surgical planning and diagnosis for clinicians. Furthermore, it provides a reliable and consistent method for future tumor research and monitoring [9]. Computer-Aided Detection (CAD) systems, particularly those using deep learning and Convolutional Neural Networks (CNNs), have shown strong potential in brain tumor identification from MRI scans [10]. Studies have demonstrated that AI systems can surpass human performance in various medical imaging tasks, including segmentation and diagnosis [11]. CAD systems offer numerous benefits, including improving radiologists’ subjective judgment and accelerating the screening process. As in other medical imaging fields, machine learning and Artificial Intelligence (AI) play significant roles in CAD systems for brain tumor classification and identification. Various CAD methods have been proposed for diagnosing and categorizing brain tumors. Several CAD approaches have been presented in the literature for diagnosing and categorizing brain tumors.
The emerging deep learning techniques can address traditional machine learning methods’ limitations [12]. The capacity for self-learning may help create new imaging features that are beneficial for statistical brain MRI analysis. Numerous research studies have concentrated on utilizing CNNs for delineating brain tumors. Deep Convolutional Neural Networks (DCNNs) have proven to be capable of performing tasks such as segmenting brain tumors in both real-world and clinical image datasets [13]. U-Net [14] and Fully Convolutional Networks (FCN) [15] stand out as the most commonly employed DL-based methods for medical image segmentation. Among them, U-Net has proven to be the most effective in terms of performance. While U-Nets have demonstrated accuracy comparable to human performance in segmenting 2D images, their application to volumetric medical images requires treating 3D images as multiple 2D slices. This approach obstructs the capture of connections between adjacent slices. Consequently, several subsequent studies encourage volumetric extensions of the U-Net to achieve finer localization. The creator of the U-Net has proposed a practical solution to the volumetric segmentation challenge, known as 3D-U-Net [16], which replaces the U-Net’s 2D convolutions with their 3D counterparts.
Various advanced filtering methods have been utilized to extract meaningful image representations. Among them, deformable filters [17] improve the model’s capability to handle geometric transformations by adapting their shape to the input features. However, this flexibility comes at the cost of increased model complexity and higher computational demands during training. Another notable approach involves the application of rotating filters. For instance, Zhou et al. [18] proposed actively rotating filters that dynamically rotate during convolution, enabling the generation of feature maps that explicitly encode spatial position and orientation. Despite their innovation, these filters are more effective when applied to small and relatively simple filter configurations.
In computer vision and image processing, the Gabor filter [19] is one of the most renowned texture analysis and feature extraction mechanisms. A recent study [20] showed that the meaningful features extracted by the Gabor filter enhances the accuracy of the model and also help modulate learned representations, thereby expanding the network’s interpretability.
Many researchers have adapted attention mechanisms [21], initially developed in natural language processing (NLP), for machine vision tasks. This integration aims to enhance the capability of CNNs in the analysis of images, particularly for precision-demanding tasks such as segmenting brain tumor. In the complex task of predicting 3D medical image segmentation, it is essential to consider both local and global features. Hatamizadeh et al. [22] introduced the U-NET Transformer (UNETR), an innovative architecture that employed Transformers as encoders to learn sequential representations from input volumes. This design efficiently extracted global multiscale information while incorporating an effective “U-shaped” encoding and decoder system. SwinBTS [23] was a novel approach that combined transformers, CNN, and an encoder-decoder architecture for 3D medical image segmentation.
In dense prediction tasks like segmentation, capturing local and global information is highly significant. However, splitting images into patches overlooks local structures. This limitation is particularly significant in medical volumetric data, such as 3D MRI scans, where modeling local features across continuous slices (the depth dimension) is essential for accurate segmentation [24]. Therefore, an efficient model that can capture local and global features without overlooking the significant details in volumetric segmentation is indispensable. Traditional image segmentation approaches are restricted by their ability to detect highly precise objects.
As neural networks deepen, the vanishing gradient problem often arises during training, where the gradient norms in early layers diminish toward zero. In conventional U-Net architectures, down-sampling operations tend to suppress low-level features essential for accurate segmentation in favor of high-level semantic information. Consequently, important local and positional details are progressively lost in deeper layers due to successive convolutional and non-linear operations. Although incorporating residual layers in the encoder helps mitigate the vanishing gradient issue by enabling gradient flow through shortcut connections, this strategy alone is not sufficient to achieve optimal segmentation performance. The network must dynamically emphasize the most important features across different channels enhancing the model’s generalization ability. This is where the Squeeze-and-Excitation (SE) mechanism becomes essential. By recalibrating channel-wise feature responses, the SE mechanism enhances the network’s ability to emphasize significant features and suppress less important ones. This adaptive feature prioritization helps retain crucial spatial and contextual information, leading to more accurate segmentation results.
Incorporating the SE mechanism with Residual networks minimizes the vanishing gradient problem and improves the network’s capacity to generalize better by focusing on the most relevant features. This dual approach ensures that low-level and high-level features are effectively utilized, enhancing the model’s overall performance in brain tumor segmentation tasks.
Although prior studies have individually explored residual connections, attention mechanisms, or texture-based filtering in medical imaging, no previous study has combined a ResNet-based encoder, SE attention mechanisms with skip connections, and Gabor filtering into a unified 3D U-Net framework for brain tumor segmentation. This architecture is specifically designed address the complexity of tumor subregions delineation in 3D MRI, and our experimental results on the BraTS datasets confirm its effectiveness over conventional methods.
This novel study emphasizes the importance of addressing the vanishing gradient problem and the need for adaptive feature prioritization through integrating Residual Networks and SE attention mechanisms, ensuring enhanced generalization and improved accuracy in brain tumor segmentation. To address the limitations of current segmentation approaches, we propose a novel architecture named dSEAT-UNet, which integrates deep residual encoding, SE Attention, and a 3D UNet-based decoder for effective brain tumor segmentation in multimodal MRI scans.
To achieve accurate and efficient brain tumor segmentation, we have implemented the following steps, which represent significant contributions to this study,
• Conventional spectral techniques are integrated into the multimodal segmentation model to incorporate the feature maps by utilizing a fixed and optimized Gabor filter to mitigate the complexity of segmenting complex tumor shapes.
• A Hybrid 3D model is designed based on the residual encoder and U-Net decoder. The residual encoder effectively addresses the issue of vanishing gradients. Skip connections are employed to accelerate the training process.
• A Squeeze-and-Excitation based attention mechanism is introduced in the skip connections making the model automatically focus solely on significant features crucial for brain tumor segmentation.
• To address the class imbalance problem in brain tumor images, we incorporate a combined dice loss and focal loss in the total loss function.
• An in-depth comparison of the developed and evaluated hybrid 3D model is presented for Whole Tumor (WT), Tumor Core (TC), and Enhancing Tumor (ET) with the state-of-the-art brain tumor segmentation methods to highlight the model’s significantly improved performance.
This section contains related work that emphasizes the application of implementing CNN architectures in brain tumor segmentation and integrating the attention mechanisms in deep neural networks. The related work for both areas is separately presented in the following sections.
2.1 CNN Architectures in Brain Tumor Segmentation
In recent years, automated segmentation of brain tumors from multimodal MRI scans has gained significant attention within the healthcare imaging sector. Various advanced AI models have been proposed to mitigate the complexities regarding segmentation of brain tumors. One such approach, proposed by Raza et al. [25], introduced the dResU-Net model for 3D brain tumor segmentation. The dResU-Net architecture is based on the U-Net framework, enhanced with residual connections to improve segmentation accuracy. By leveraging multimodal MRI data, including T1, T1CE, T2, and FLAIR images, the model aims to provide robust brain tumor segmentation results. Incorporating residual connections enables efficient information flow and gradient propagation, facilitating the segmentation of complex brain tumor structures. While the dResU-Net architecture significantly advances brain tumor segmentation, ongoing research further explores novel deep-learning approaches and data augmentation techniques to improve segmentation accuracy and robustness.
Wang et al. [26] introduced the TransBTS architecture, which effectively integrates a transformer into a three-dimensional convolutional neural network structured around an encoding-decoding pipeline. Initially, a 3D convolutional backbone is employed to capture detailed local features and spatial representations. A transformer is fed with these extracted features extract global features. Subsequently, the decoder module combines these local and global features during upsampling to generate segmentation results. The experiments were conducted using the BraTS 2019 and 2020 datasets, demonstrating comparable performance.
Chen et al. [27] proposed a separable 3D U-Net architecture to overcome the limitations of traditional 2D CNNs, which often fail to fully capture the spatial context of volumetric data. To reduce memory consumption while preserving spatial information, their model replaces standard 3D convolutions with a sequence of two layers: a 2D convolution for extracting spatial features and a 1D convolution for capturing temporal dependencies. This approach efficiently processes 3D brain volumes by decomposing convolutions into three separate branches. Additionally, separable temporal convolutions were integrated into a residual inception framework. The model was independently trained on axial, sagittal, and coronal views, with the outputs from each orientation combined using a multi-view fusion strategy to boost performance. The effectiveness of this design was demonstrated through strong results on the BraTS 2018 test dataset. In segmentation tasks, capturing both local and global features is essential for accurate predictions. However, as the network depth increases, the gradients associated with low-level features such as edges, boundaries, and fine textures tend to vanish, reducing their influence during training. Maji et al. [28] presented a ResUNet model that incorporates attention mechanisms alongside a decoder guided by auxiliary features for brain tumor segmentation. This model guided the learning process at each decoder layer. Benefiting from attention mechanisms, the model focused on significant features rather than including all features, thereby reducing the introduction of noisy features into the decoder for segmentation mapping. The proposed model outperformed the other methods when evaluated on the BraTS 2019 dataset.
2.2 Integrating Attention Mechanism in CNN Architectures
Researchers suggest that integrating the attention mechanism into CNNs could enhance the expression of local features and improve regions’ segmentation performance. Similarly, some features are more important than others for accurate segmentation. Therefore, attention mechanisms have become valuable tools for highlighting the essential features while minimizing the impact of less important ones. Attention mechanisms have also demonstrated strong potential in broader decision-making applications beyond medical imaging. Kia [29] applied attention-guided deep learning to multi-criteria decision analysis, highlighting the effectiveness of attention modules in directing computational focus toward the most relevant information. This cross-domain success further supports the growing adoption of attention-based strategies in brain tumor segmentation tasks.
Zhang et al. [30] proposed the AResU-Net, a model designed to perform volumetric brain tumor segmentation. Their approach incorporated attention mechanisms and residual units into up and down-sampling layers. The enhancement was intended to strengthen local feature responsiveness in the process of down-sampling to improve feature restoration while increasing the resolution. Given the constraints in computational power, the evaluations were conducted using 2D images from two datasets i.e., BraTS 2017 and 2018. Cao et al. [31] introduced a novel architecture named MBANet, which incorporates a multi-branch attention mechanism into 3D CNNs. Building upon this approach, this study emphasizes the importance of integrating attention mechanisms into brain tumor segmentation networks. This integration aims to minimize the focus on irrelevant data while enhancing the precise identification of brain tumor regions. Akbar et al. [32] presented the modified U-Net method by integrating attention-based skip connections. Additionally, they developed the Multi-path Residual Attention Block (MRAB), which combines two deeply convolutional sequences linked with an attention block and a residual path. Zhang et al. [24] introduced an innovative brain tumor segmentation method that addresses the effect of using an attention mechanism. By leveraging the attention mechanism into U-Net, segmentation becomes more robust, enhances local feature expression, and improves medical image segmentation performance. Liu et al. [33] presented a lightweight 3D method integrating an attention mechanism. This feature enables the network to autonomously concentrate on the tumor region, thereby strengthening the correlation between the whole tumor and tumor core, resulting in improved segmentation accuracy. Li et al. [34] developed an intelligent method for brain tumor identification and classification from MRI data. Their approach includes a preprocessing step to remove image background and identify brain tissue, followed by a novel segmentation technique based on parallel CNNs to classify tumor types. Yuan et al. [35] implemented channel attention as an SE network to improve the efficiency of the T2T-ViT backbone to implement a transformer-based application for image classification.
This section presents details on the dataset used in the study, the preprocessing strategies applied, and the architectural design of the proposed model.
In this study, we used a benchmark dataset, i.e., BraTS (Brain Tumor Segmentation) 2020 [36–38], for training and testing the designed model. This multimodal BraTS 2020 dataset contains four channels (T1, T1CE, T2, and T2-FLAIR). Various image modalities and sequences are used in MRI scans for diagnosing brain tumors, including T1, T1CE, T2, and FLAIR. T1 predominantly evaluates healthy tissues, while T2 highlights tumor regions. T1 images are obtained through sagittal or axial 2D acquisitions with slice thicknesses ranging from 1 to 6 mm. T1CE, and T1 images acquired via 3D acquisitions featuring a voxel size of 1 mm isotropic. T2 images acquired through axial 2D acquisitions, with slice thicknesses varying from 2 to 6 mm. FLAIR contains T2-weighted FLAIR images acquired in axial, coronal, or sagittal 2D acquisitions, with slice thicknesses ranging from 2 to 6 mm. However, T1CE emphasizes tumor borders. FLAIR scans assist in distinguishing edema from Cerebrospinal Fluid (CSF) [39,40]. The mask contained four labels: i.e., Background, Edema (ED), Enhancing Tumor (ET) and Non-Enhancing Tumor (NET). BraTS 2020 dataset sample images are displayed in Fig. 1.
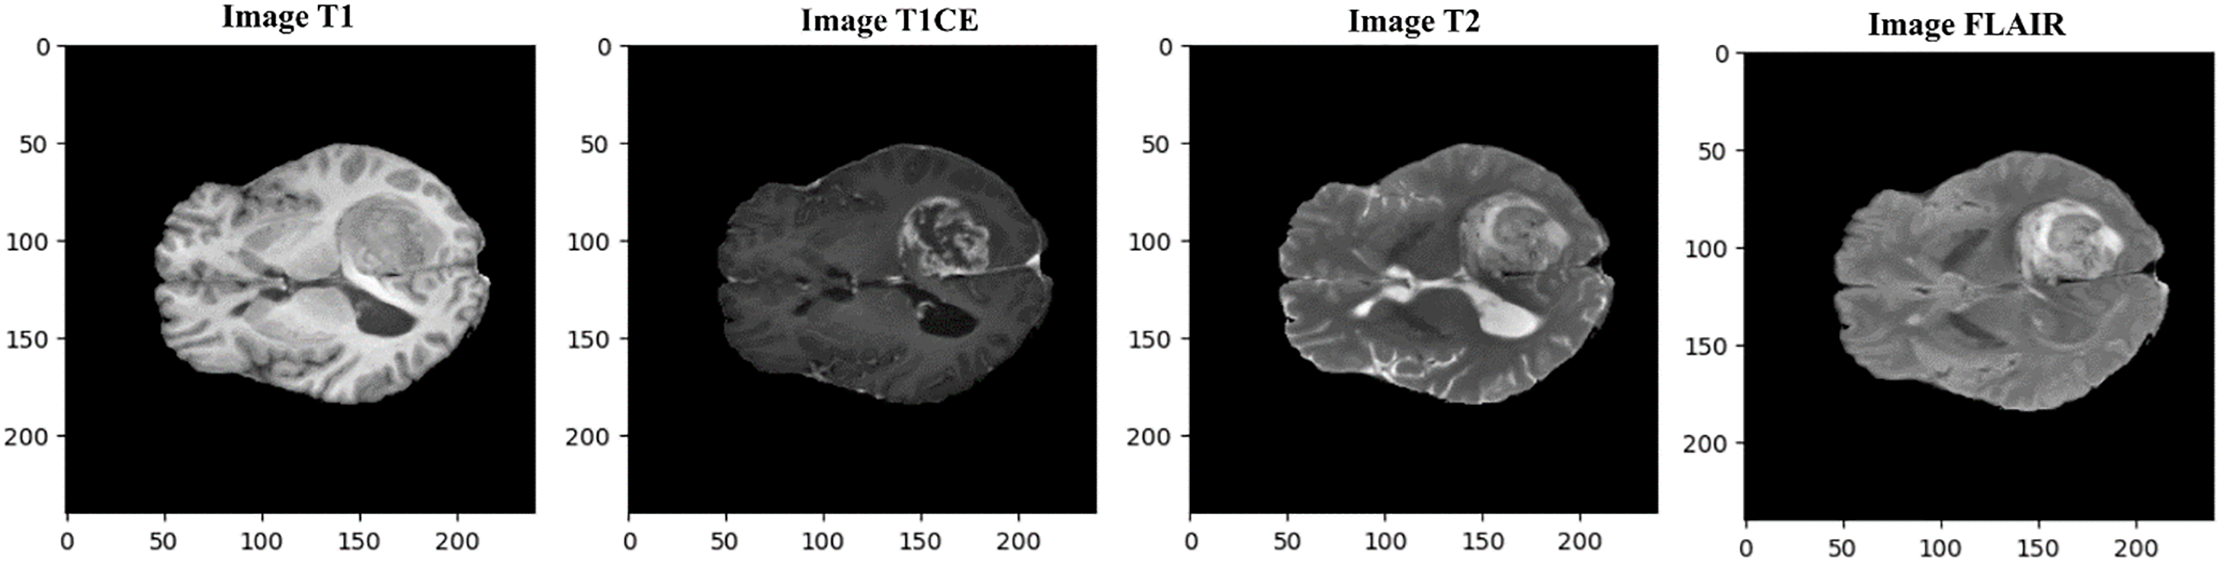
Figure 1: Multimodal dataset samples shown here are provided in the BraTS 2020 benchmark for four modalities, i.e., T1, T1CE, T2, and FLAIR (in actual dimensions)
Segmenting brain tumors in MRI is a difficult task due to the brain’s complex structure, different types of tissues, and varying image quality. Even though deep learning models can handle some noise, proper data preprocessing is still essential to enhance segmentation accuracy. We performed data preprocessing on the original BraTS 2020 dataset to make it suitable for the model. The following sections provide an explanation of these steps.
The BraTS 2020 dataset contains 369 images with a 240 × 240 × 155 resolution. The original dimensions of the BraTS2020 dataset are 240 × 240 × 155. Brain tumor sample images for all modalities and respective ground truth are presented in Fig. 2. In our analysis, we resized the images to 160 × 160 × 128. While some studies have resized the images to 128 × 128 × 128, we observed that this resolution did not cover the entire tumor in some cases. Therefore, we chose 160 × 160 × 128 to ensure better coverage of the tumor regions, improving our segmentation results’ accuracy, reliability, and analysis.
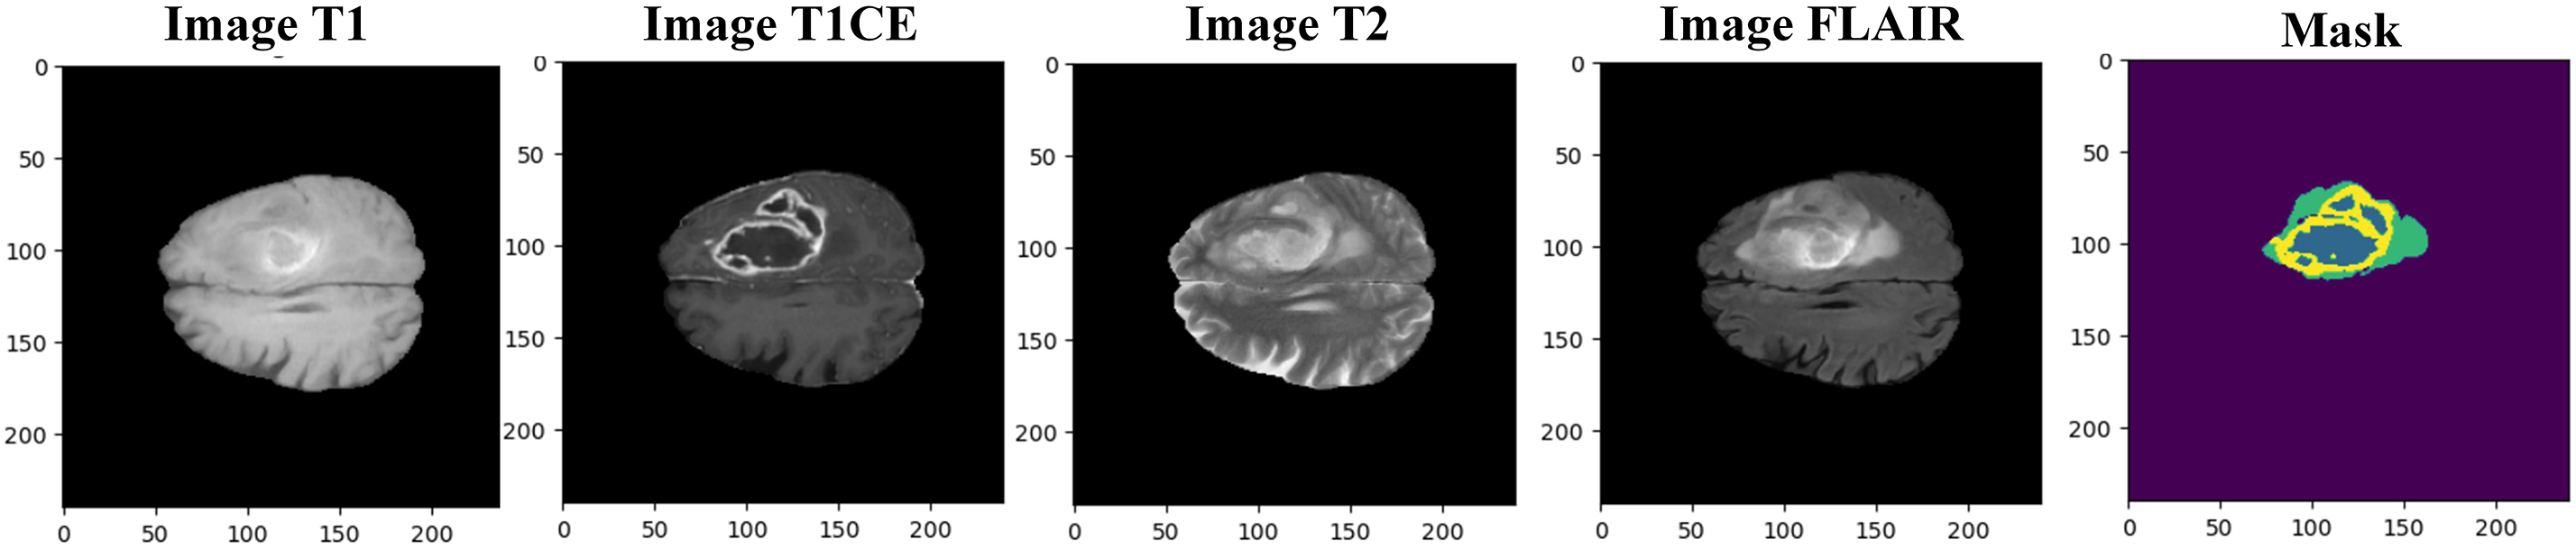
Figure 2: Samples of multimodal MRI BraTS 2020 images with segmentation mask (ground truth)
As shown in Fig. 1, there are extra pixels that should be resized to avoid computational overload. Finally, the dataset is resized to 160 × 160 × 128 pixels, which contains the required region of interest. Fig. 3 shows the resized dataset samples with channels and masks. The dataset is divided into 75% for training, 15% for validation, and 10% for testing.
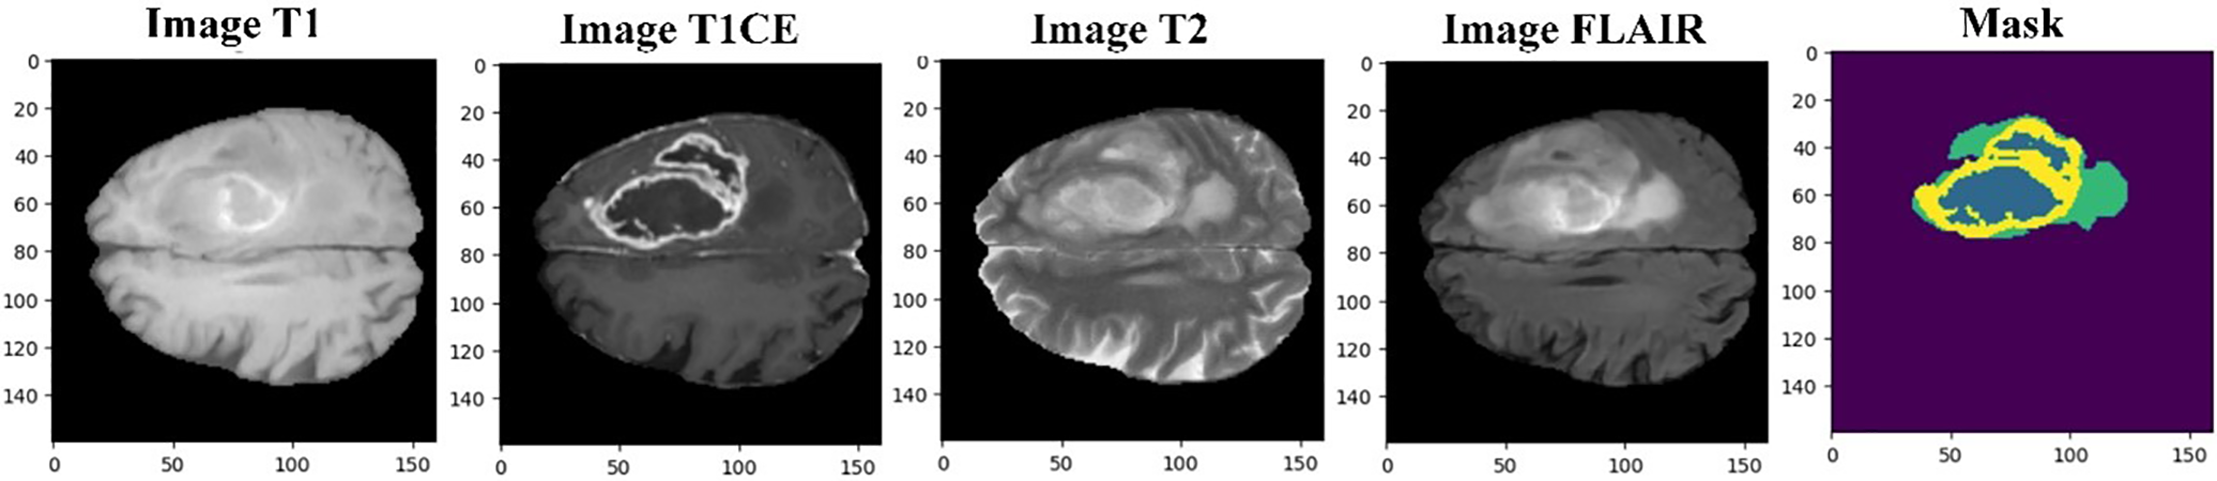
Figure 3: Resized BraTS 2020 sample MRI images with mask (ground truth)
We employed a min-max scaler, also called normalization, regarded as one of the simplest scaling techniques. Improper feature scaling can lead the model to give too much importance to features with larger numerical values, such as the second feature in this case. To avoid this, normalization is applied to transform the data into a standard range between 0 and 1 [41]. This process adjusts each minimum and maximum feature value, standardizing the distribution and preventing scale-related bias during training.
This normalization ensures fair comparisons between images and enables each pixel to contribute proportionally to the overall image, a critical step emphasized in recent segmentation frameworks that combine preprocessing with optimized model pipelines [42]. Image normalization is also performed to adjust the scaled pixel values to have mean and standard deviation values of 0 and 1. Mean values is subtracted from scaled value, the result is divided by standard deviation [20]. Normalization can be computed using the following Eq. (1).
where
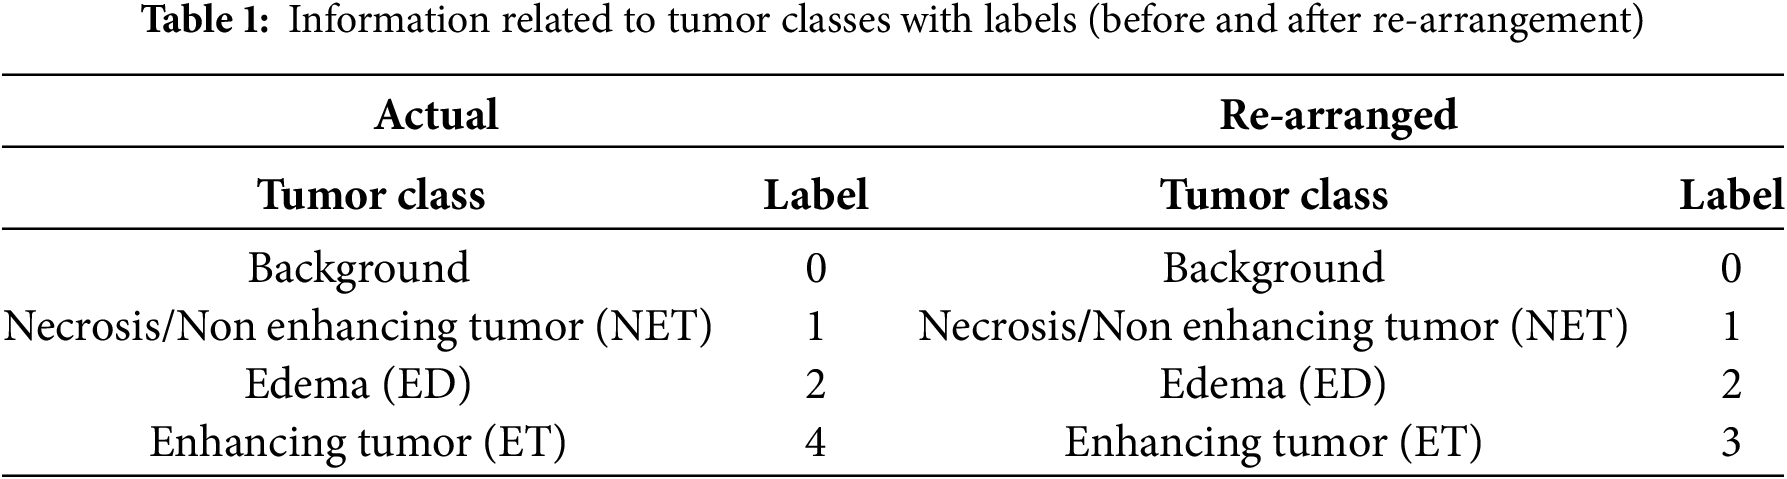
The BraTS 2020 dataset contains four main tumor classes with labels i–e, Background (Label 0), NET (Label 1), ED (Label 2), and ET (Label 4). Label 3 is missing; therefore, for better data handling, label four is reorganized as label 3, as Table 1 presents.
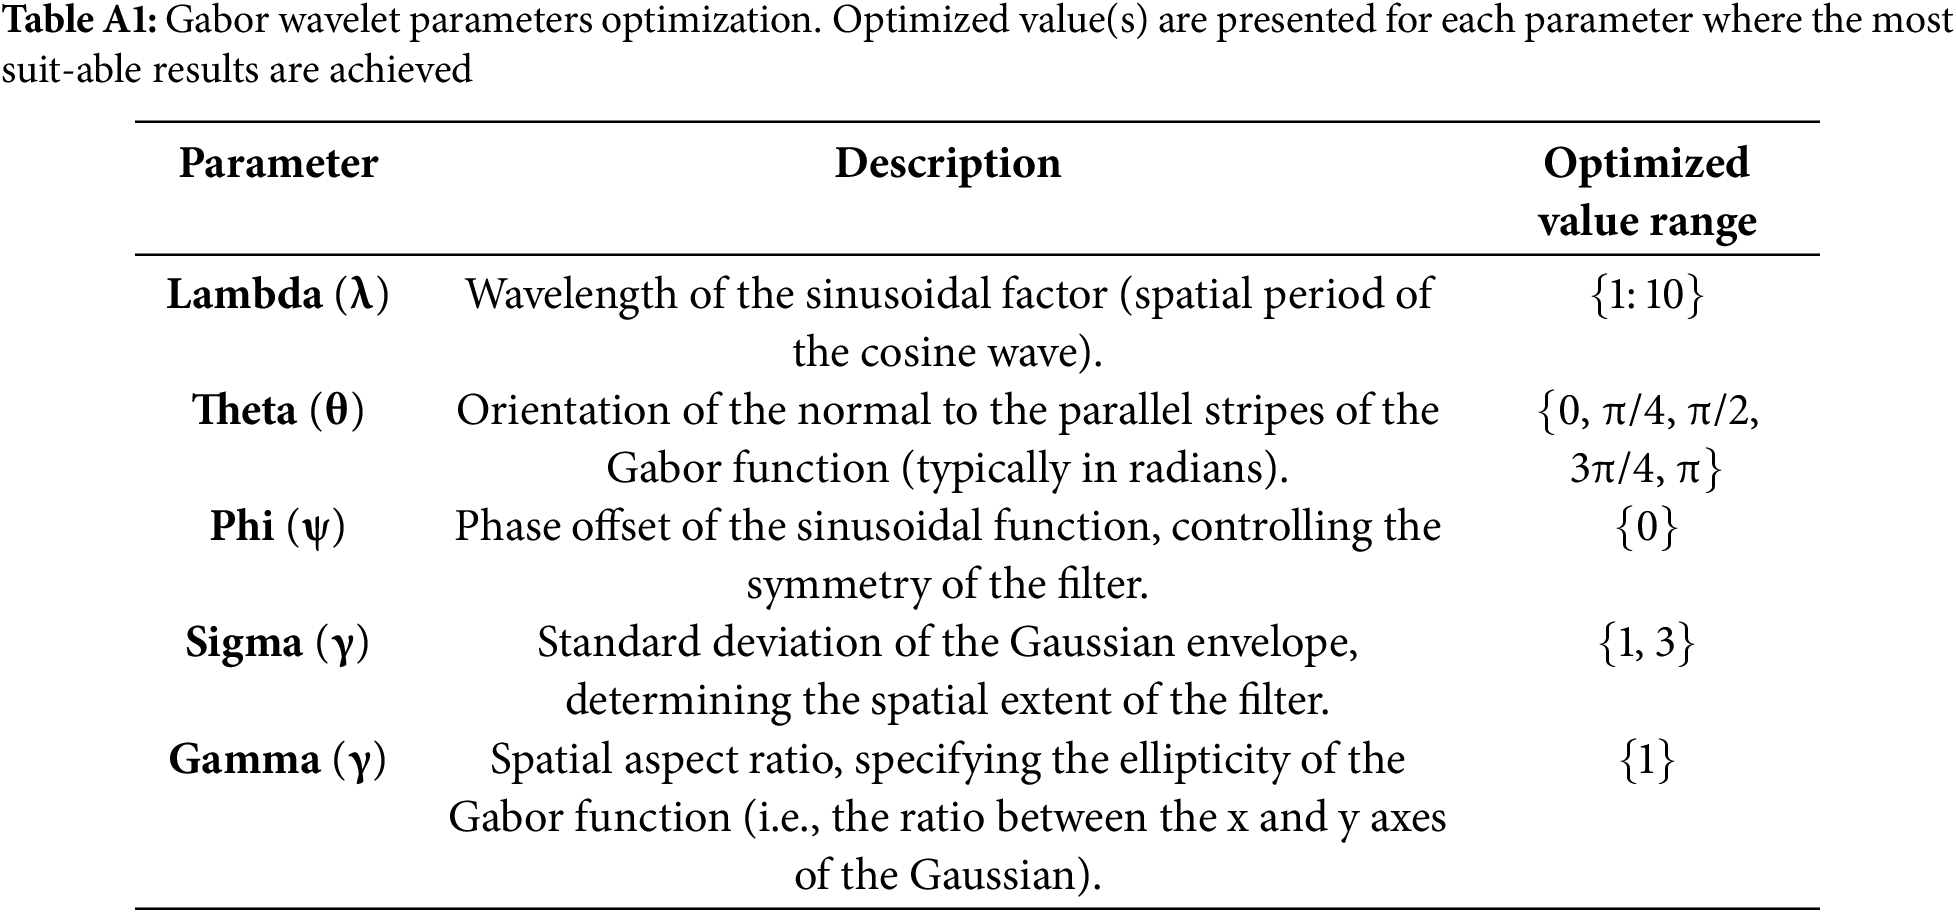
In computer vision, different ways of image filtering are used to show specific features in images. One such method is the Gabor filter, made from wave patterns with different frequencies and directions. These filters help capture details in images. Their functions can be explained using mathematical equations [43]. The mathematical formulation of the Gabor filter, including its equation, variable definitions, and parameter design considerations, is detailed in Appendix A.
Before application, the filter parameters, wavelength (λ), orientation (θ), phase offset (ψ), standard deviation (σ), and aspect ratio (γ), were empirically optimized. The selected value ranges and their functional roles are summarized in Table A1 (Appendix A).
For 3D brain tumor segmentation, we implemented a volumetric Gabor filter with a kernel size of (3, 3, 3). Sample slices of this 3D Gabor filter across the x, y, and z axes are illustrated in Fig. 4, showing how varying parameter combinations affect texture response. These are arranged in a 3 × 5 grid to visually demonstrate the diversity and directional sensitivity of the filter design.
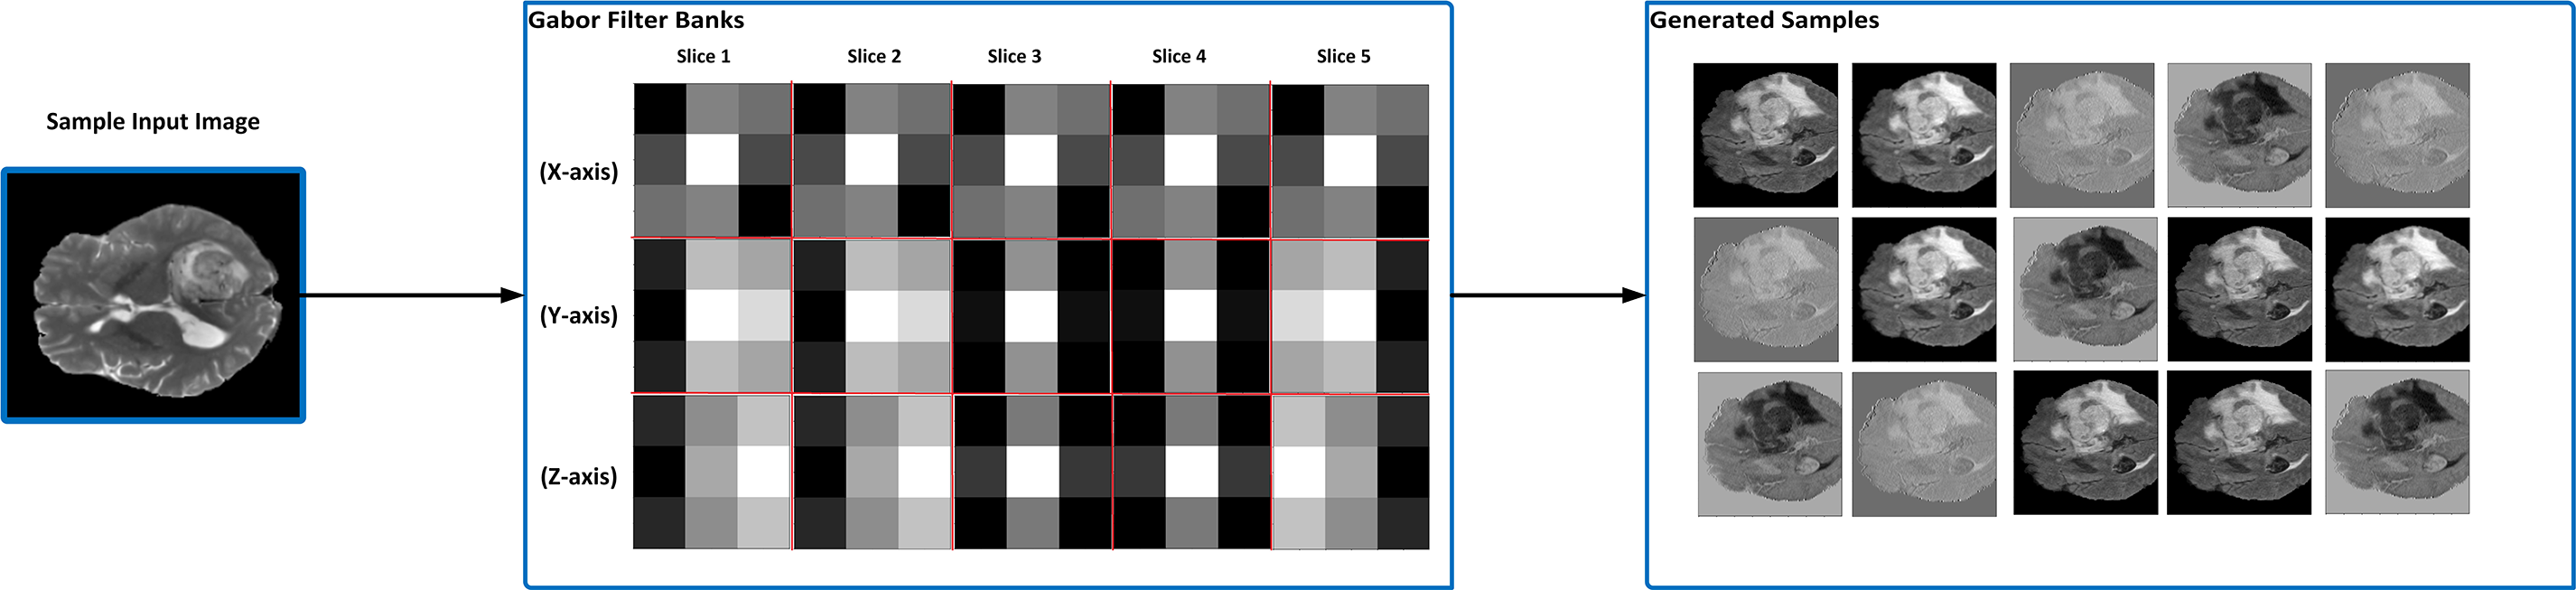
Figure 4: An illustration of when Gabor filter banks were applied to a sample input image and generated filtered sample images. After experimenting with different parameter values, the most suitable parameters are selected as optimization parameters
Gabor filters are widely acknowledged for their ability to identify spatial and frequency domain characteristics, making them a preferred tool in numerous pattern analysis tasks.
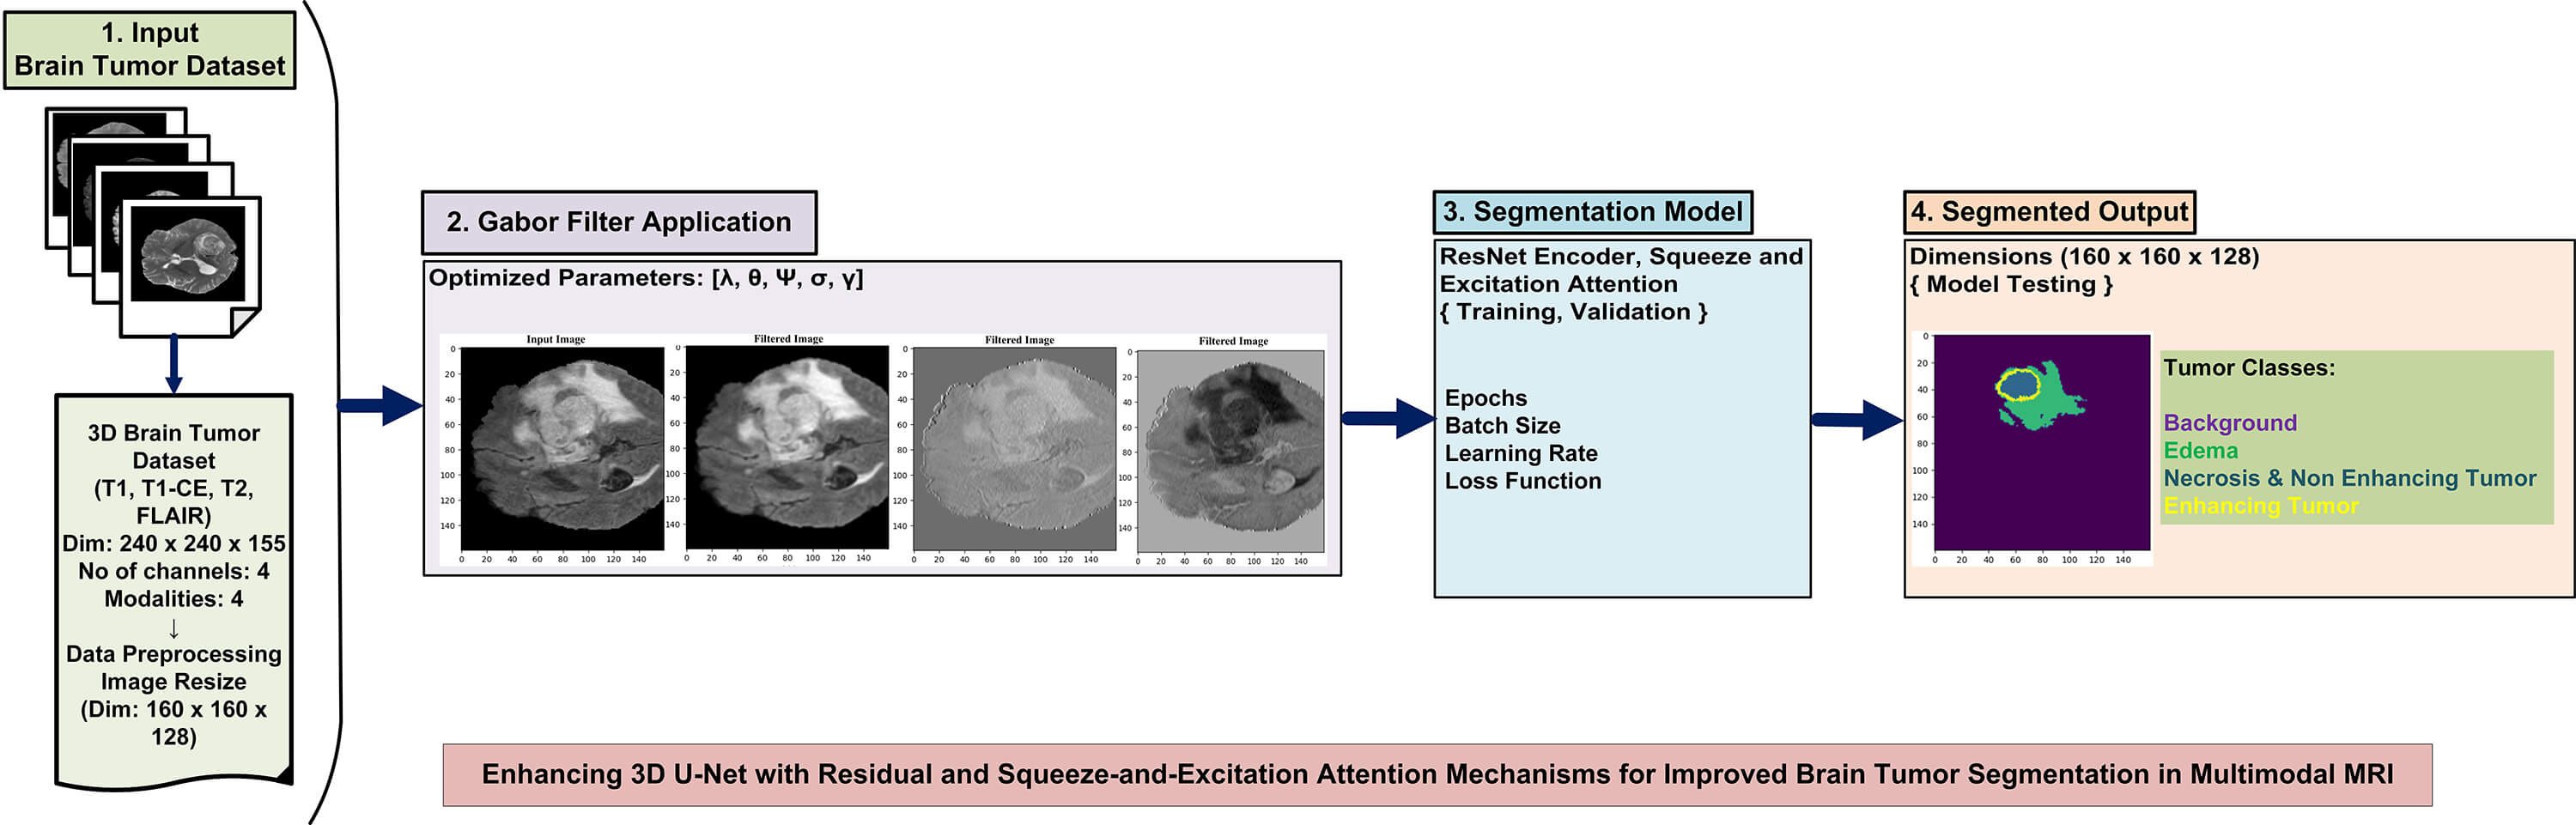
Fig. 5 illustrates the architecture of the system. The architecture displays the main modules of the system. In the first stage, the brain tumor dataset is preprocessed with the normalization method, min-max scaling, and dimensionality reduction following this, Gabor filter operations are applied to enhance spatial frequency features and improve texture representation in the MRI images. The enhanced images are then used to train the hybrid 3D model after tuning the appropriate hyperparameters. Finally, the trained model is tested on unseen MRI images, and the segmented brain tumor regions are produced in the output stage.
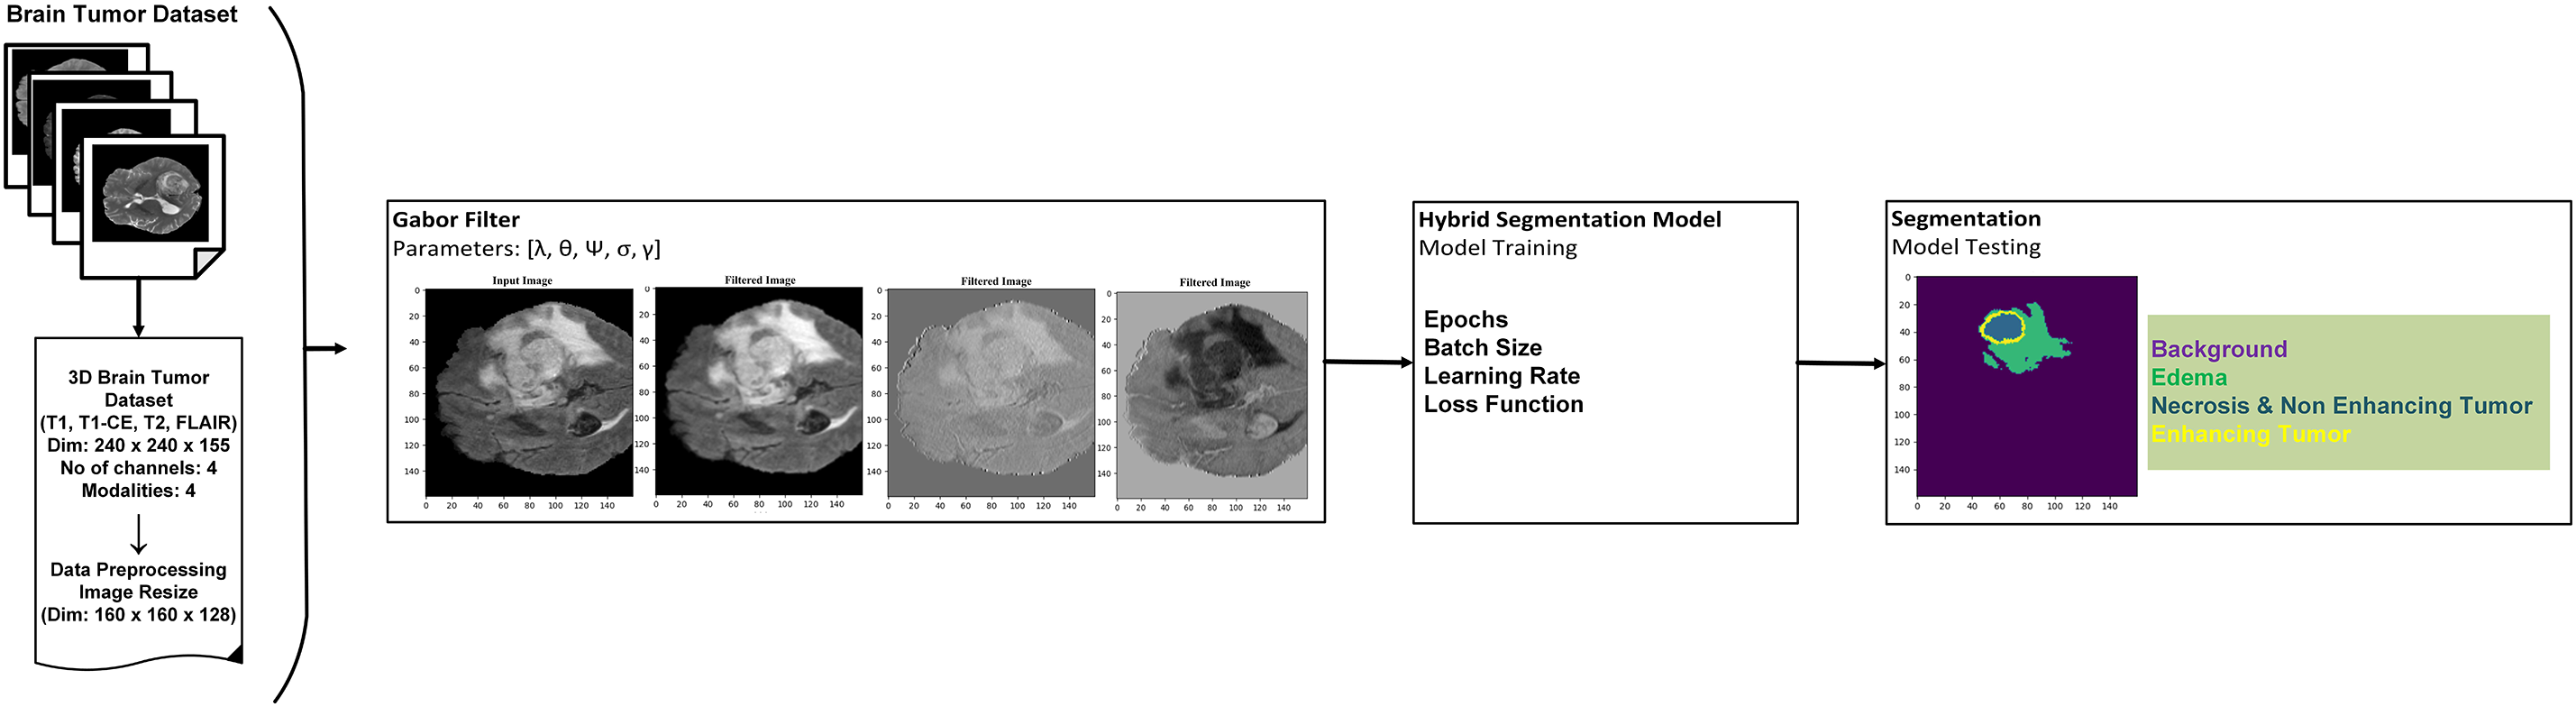
Figure 5: An overview of the system architecture: dataset preprocessing, implementation of Gabor filters, model integration, and illustration of tumor segmentation with tumor classes
The proposed dSEAT-UNet architecture for 3D brain tumor segmentation combines elements of a 3D ResNet encoder and a 3D U-Net decoder [17]. It resembles a typical U-Net with encoder and decoder sections interconnected through skip connections that incorporate SE attention. The model inputs a 4-channel 3D MRI scan, where each channel represents a different MRI modality: T1, T2, T1CE, and FLAIR. This image has dimensions of 160 × 160 × 128 voxels. ResNet-based encoder extracts features from this multi-modal data, reducing spatial resolution (160 × 160 × 128 to 16 × 16 × 8) while increasing feature map depth.
Residual connections and SE attention within the encoder boost feature learning and focus on informative channels. The complete model design is displayed in Fig. 6. The U-Net decoder utilizes transposed convolutions to expand feature maps (16 × 16 × 8 to 160 × 160 × 128) and incorporates skip connections for detailed segmentation. SE attention refines feature maps throughout the network, aiding in essential area classification.
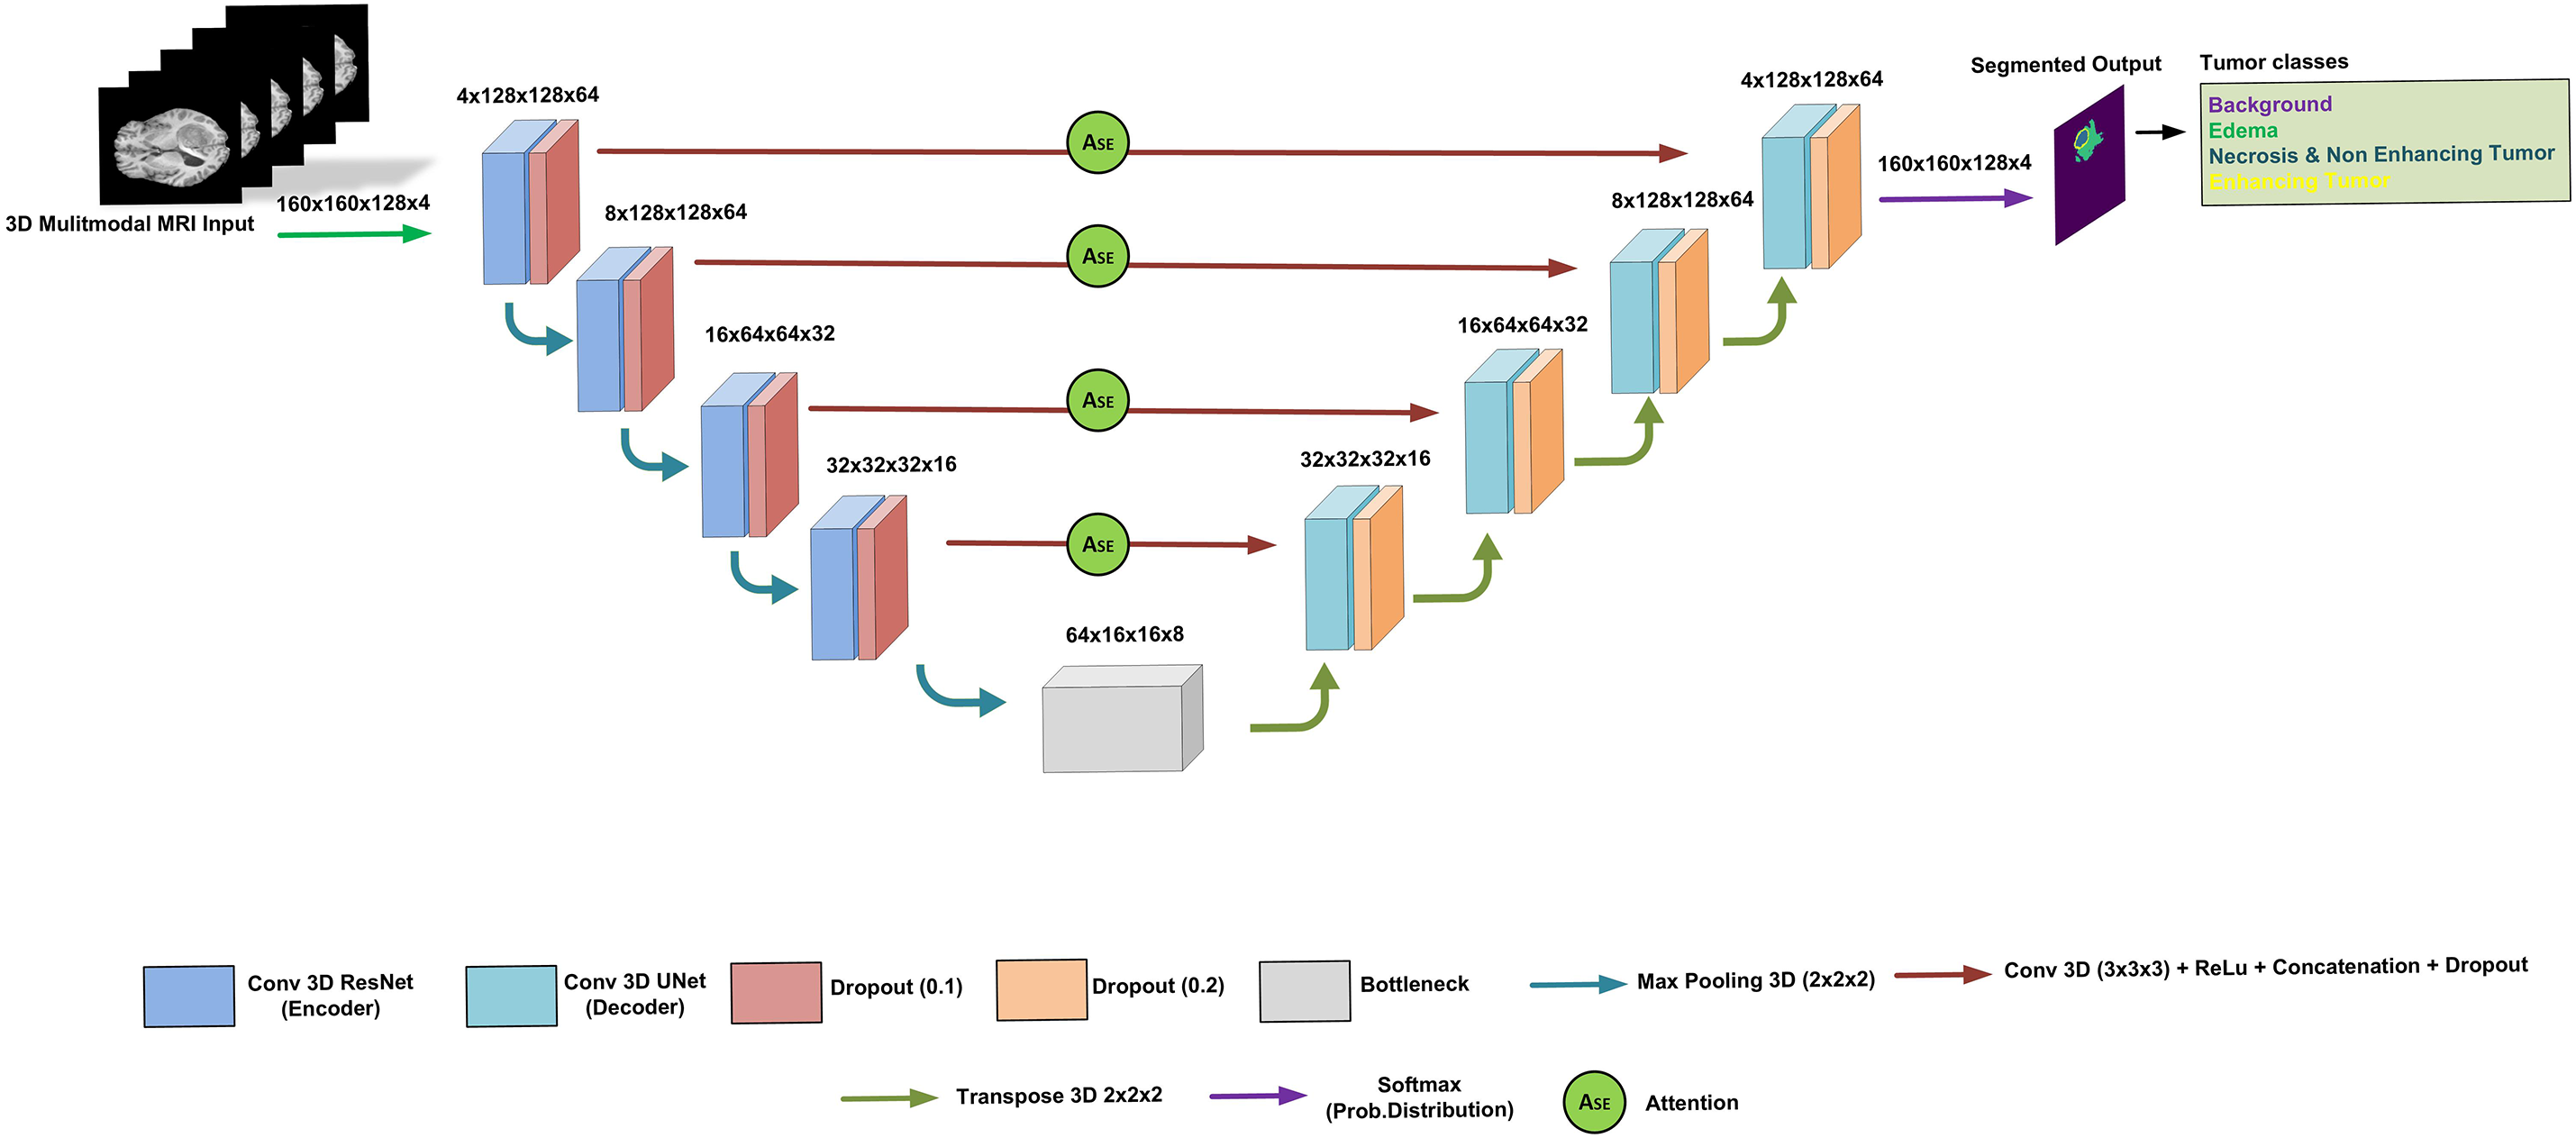
Figure 6: The proposed architecture of dSEAT-UNet
The final output is a segmented image classifying each voxel into one of four tumor classes:
• Background
• Necrosis/Non-enhancing tumor (NET)
• Edema (ED)
• Enhancing tumor (ET)
This hybrid approach leverages residual connections, SE attention, and skip connections for improved brain tumor segmentation.
3.4.1 3D ResNet Encoder and Feature Learning
In the 3D ResNet Encoder, we begin with a 3D convolutional layer to process the input data, utilizing 16 filters and a kernel size of (3, 3, 3). This initial layer extracts basic features from the input volume. The encoder consists of multiple residual stages, each containing residual blocks for feature extraction. In each stage, the number of filters is doubled to capture increasingly complex features. The residual blocks play a key role in hierarchical representations learning of the input data. Each block is composed of two 3D convolutional layers, each followed by a ReLU activation function, and then batch normalization. To improve computational efficiency, 3D max pooling with a kernel size of (2, 2, 2) is applied after each residual stage, reducing the spatial dimensions of the feature maps.
The feature learning part involves reducing the input data size using residual (ResNet) blocks. These blocks use a shortcut connection, which adds the original input to the output after passing through some layers. This shortcut helps improve training speed and accuracy without adding more parameters. As mentioned above, each ResNet block in the encoder has two convolution layers: activation function and batch normalization. Our design is based on four feature learning modules before feeding the features to the bottleneck module, as shown in Fig. 6. The operation of residual block [28,44] can be expressed in the following Eq. (2).
where
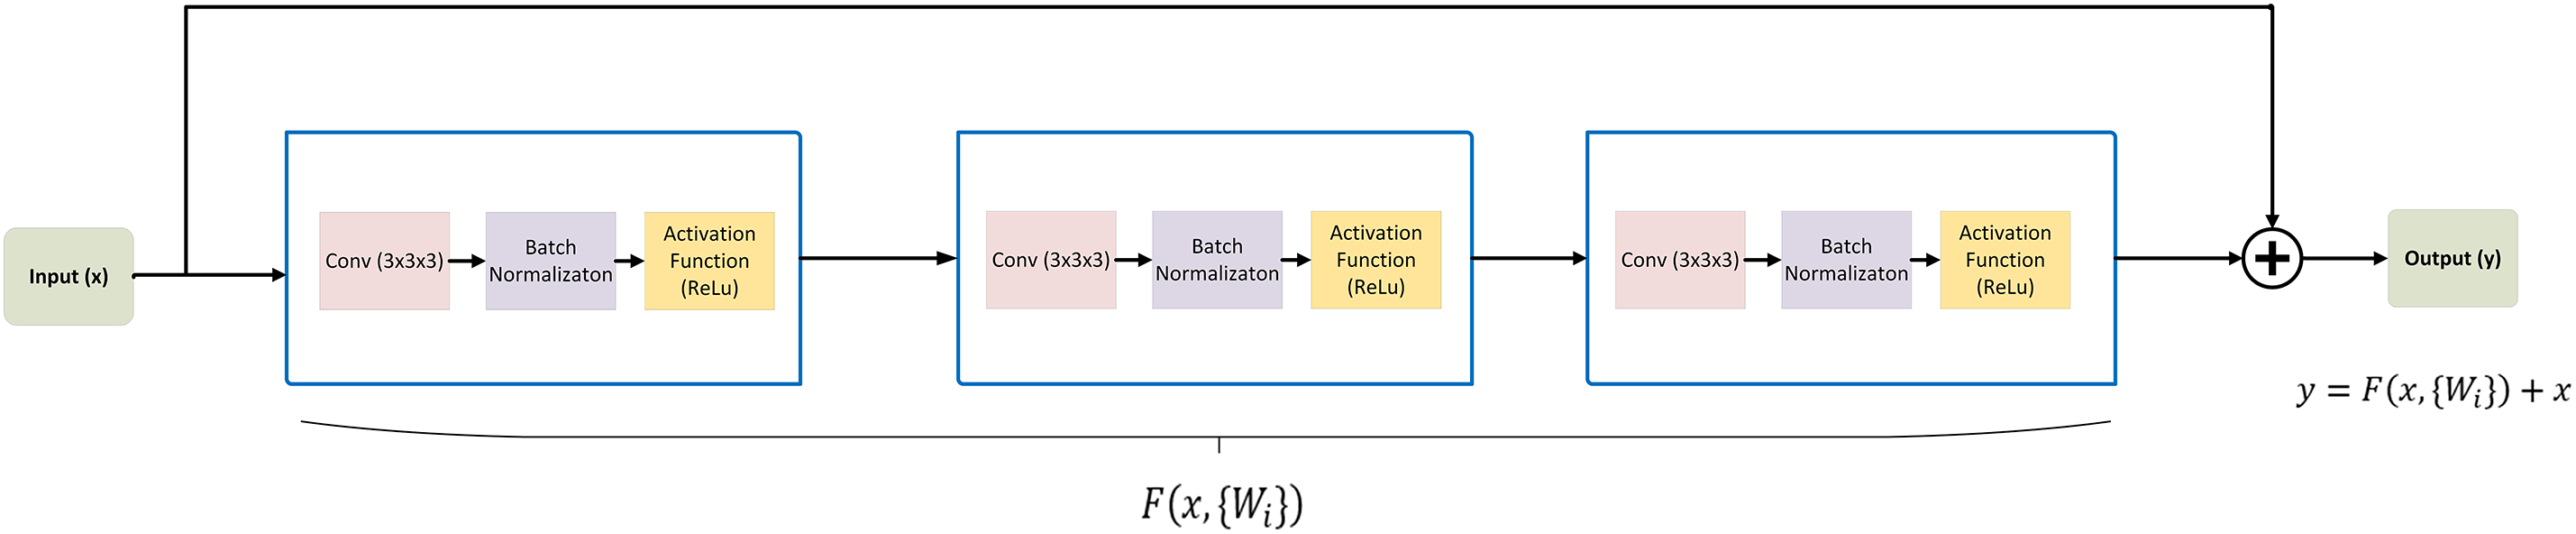
Figure 7: Residual block architecture: demonstrating the modules processing the input to generate the output
The 3D U-Net decoder, utilizes skip connections to combine low-level features from the encoder with high-level features from the decoder, facilitating precise localization and segmentation. We start the decoder with a contracting path comprising two 3D convolutional layers with ReLu activation and max pooling, followed by dropout regularization to prevent overfitting. The expansive path consists of transpose convolutional layers (Conv3DTranspose) to up-sample the feature maps and recover the spatial resolution lost during encoding. Skip connections are established between the corresponding encoder and decoder layers, allowing the model to access local and global features. Finally, output layer is based on a 3D convolutional layer with softmax activation, generating probability maps for each of four classes, i.e., Background, ED, NET, ET.
We integrated the SE attention mechanism into our model. This mechanism is known for its compact design and high efficiency and lightweight design. The SE block consists of two primary operations, i.e., squeeze and excitation.
As shown Fig. 8, in the initial phase, feature maps
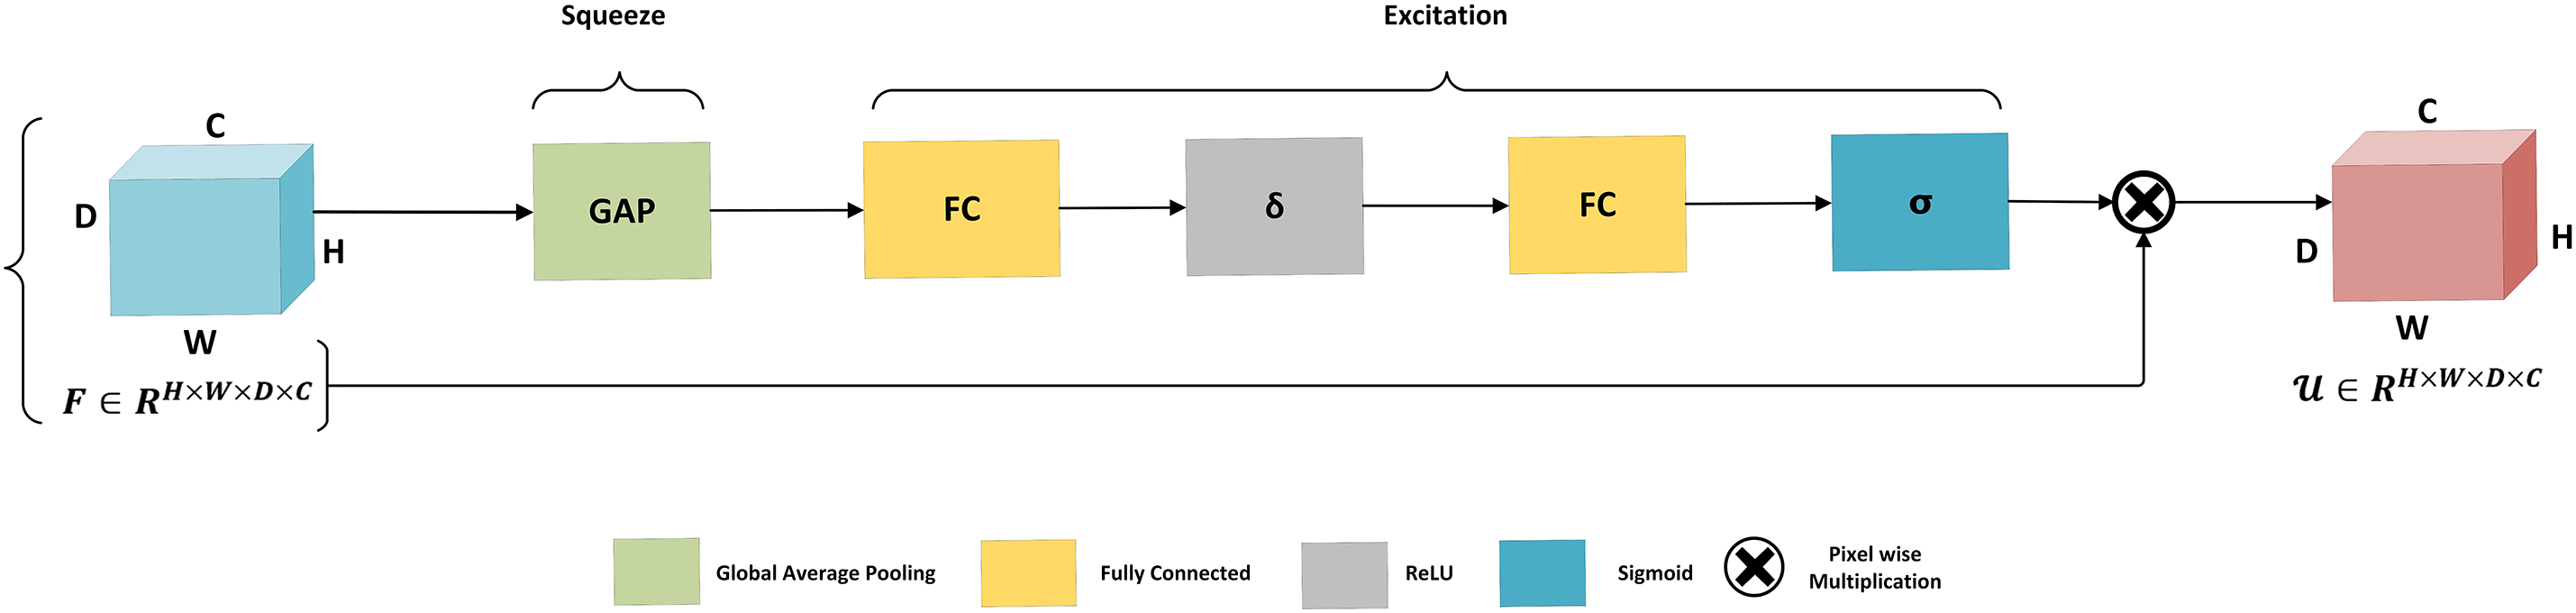
Figure 8: Architecture of squeeze and excitation mechanism. The global average pooling performs the squeeze operation to aggregate global information for each channel of the entire image. The squeeze operation is followed by the excitation phase, which is based on two fully connected layers connected with ReLU activation followed by the activation function sigmoid before scaling
In the excitation phase, the process begins with a fully connected layer that applies a reduction factor r, followed by a ReLU activation. This is then followed by an additional fully connected layer, with a sigmoid activation to generate the excitation output. Finally, a scaling operation integrates this refined channel information to enhance feature selectivity.
The hybrid model architecture effectively integrates the strengths of both ResNet and U-Net architectures, leveraging residual connections for feature extraction and skip connections for accurate segmentation. Combining these components, our model exhibits promising 3D brain tumor segmentation results. Additionally, we incorporated the SE mechanism, which is significant for improving the performance of the model. The SE mechanism dynamically recalibrates the feature maps, allowing the model to focus on the most informative features while suppressing less useful ones. This results in improved representation learning and better segmentation accuracy. Overall, enhanced with the SE mechanism, this hybrid architecture enables accurate and efficient brain tumors segmentation in 3D MRI images.
The value of the dropout rate is typically specified as a parameter when adding a dropout layer in a neural network model. In the designed model, the dropout rate is set to 0.1 for the contracting path (encoder) and 0.2 for the expansive path (decoder). This means that 10% of the input units will be randomly set to 0 during training in the contracting path and 20% in the expansive path. These dropout rates are chosen based on experimentation preventing overfitting and improving the generalization ability of the model.
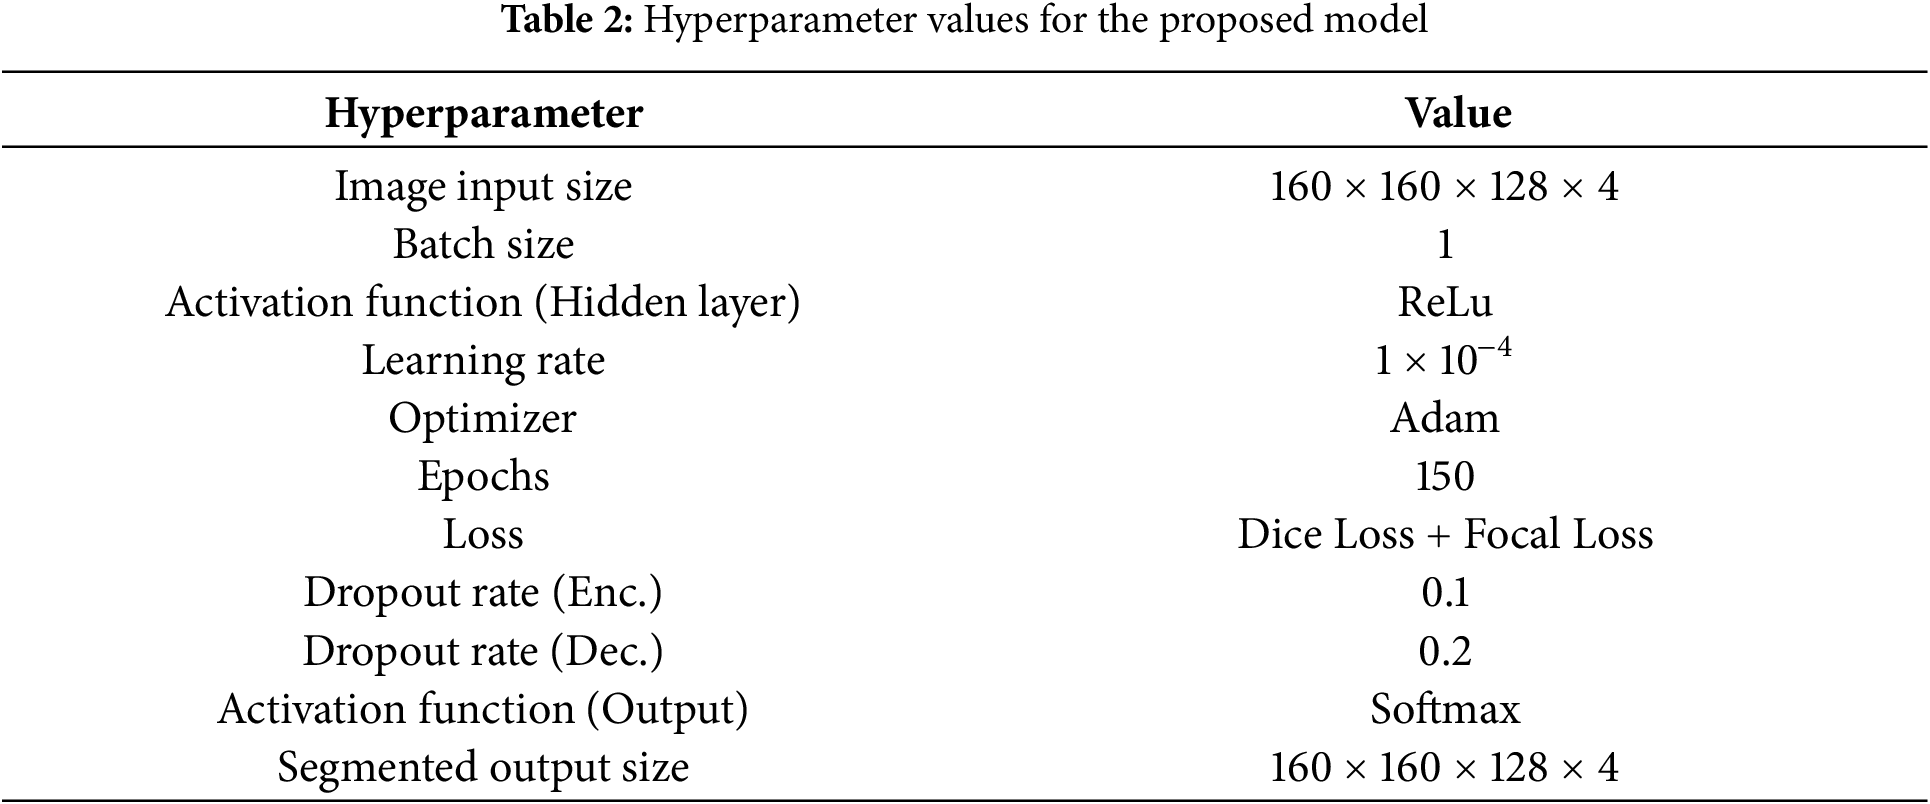
This study implements the model using the Keras library and TensorFlow 2.8.0. We designed the model using Python and executed the computations on NVIDIA RTX 3080 12GB GPU. For model training, Adam optimizer is selected with a learning rate of 0.0001. The selection of activation function and normalization techniques is ReLU and batch normalization, respectively. The model training is performed for 150 epochs. The image dimension is 160 × 160 × 128 to locate the tumor area properly. Initially, we tried to train the model on an actual dimension of 240 × 240 × 155, but it offers an intensive load on the GPU and halts the execution with GPU memory overflow errors. A batch size of 1 is selected to load the 3D images properly by considering the memory constraints of the GPU. In the encoder, a dropout of 0.1 is applied after the convolution operation, while in the decoder, a dropout of 0.2 is applied after each convolution operation. This configuration helps regularize the model and prevent overfitting during training. As the decoder is responsible for generating the final segmentation output, it typically has more parameters and may be prone to overfitting. Therefore, a higher dropout rate can help regularize the decoder’s parameters and prevent it from fitting noise in the training data too closely. Hyperparameter values are listed in Table 2.
Choosing the suitable loss function is highly important for deep learning models, especially when working on brain tumor segmentation. Latest research suggests that there is not a universal loss function that always works great for all segmentation tasks. Deep learning model’s performance also depends on selecting a suitable loss function [45]. Combined loss functions, integrating two or more types of losses, have become the most robust and effective in various situations [46]. Combining dice and focal loss allows the model to benefit from their complementary effects. We aim to mitigate the class imbalance by combining two loss functions, i.e., dice loss and focal loss. Together, they provide a robust training objective that enables the model to effectively learn from both majority and minority classes, leading to better segmentation results on imbalanced datasets like BraTS [47].
Using Eq. (3), we can calculate the dice loss for all tumor classes: Background, NET, ED, and ET.
where a and b represent predicted output and its mask, respectively. m is voxel representation, c is class, n denotes the total number of tumor classes, and ∈ is a negligible constant value used to avoid division by zero.
where a represents predicted output, b is the ground truth, c represents the class, and n is the total number of classes. Eq. (5) represents the combined loss used in this study.
where
In this study, the combined loss for each class is computed as a total loss by adding the dice loss and focal loss. This loss function ensures that the model focuses on the most critical parts of the tumor during segmentation, connecting the relevance of each tumor area with the network’s predictions. This helps the model prioritize the most clinically significant regions, vital for getting the best segmentation results.
Our study used the Dice Similarity Coefficient (DSC), sensitivity, and specificity measuring the model’s effectiveness. DSC is the most used evaluation metric in Brain Tumor Segmentation studies. The DSC calculates the overlapping between the segmentation and actual area in the segmentation range between 0 and 1. 0 represents no overlap, and 1 shows complete overlap between the actual and predicted tumor regions. Eq. (6) can be used to calculate the DSC.
where A and B represent predicted and ground truth values.
Sensitivity measures the proportion of actual tumor area that is correctly predicted. Specificity measures the proportion of actual healthy area that is correctly predicted as non-tumor. Both sensitivity and specificity can be calculated using Eqs. (7) and (8).
where the terms TP, TN, FP, and FN represent true positive, true negative, false positive, and false negative, respectively. Fig. 9 shows separate tumor classes and areas for better understanding when analyzing segmentation results.
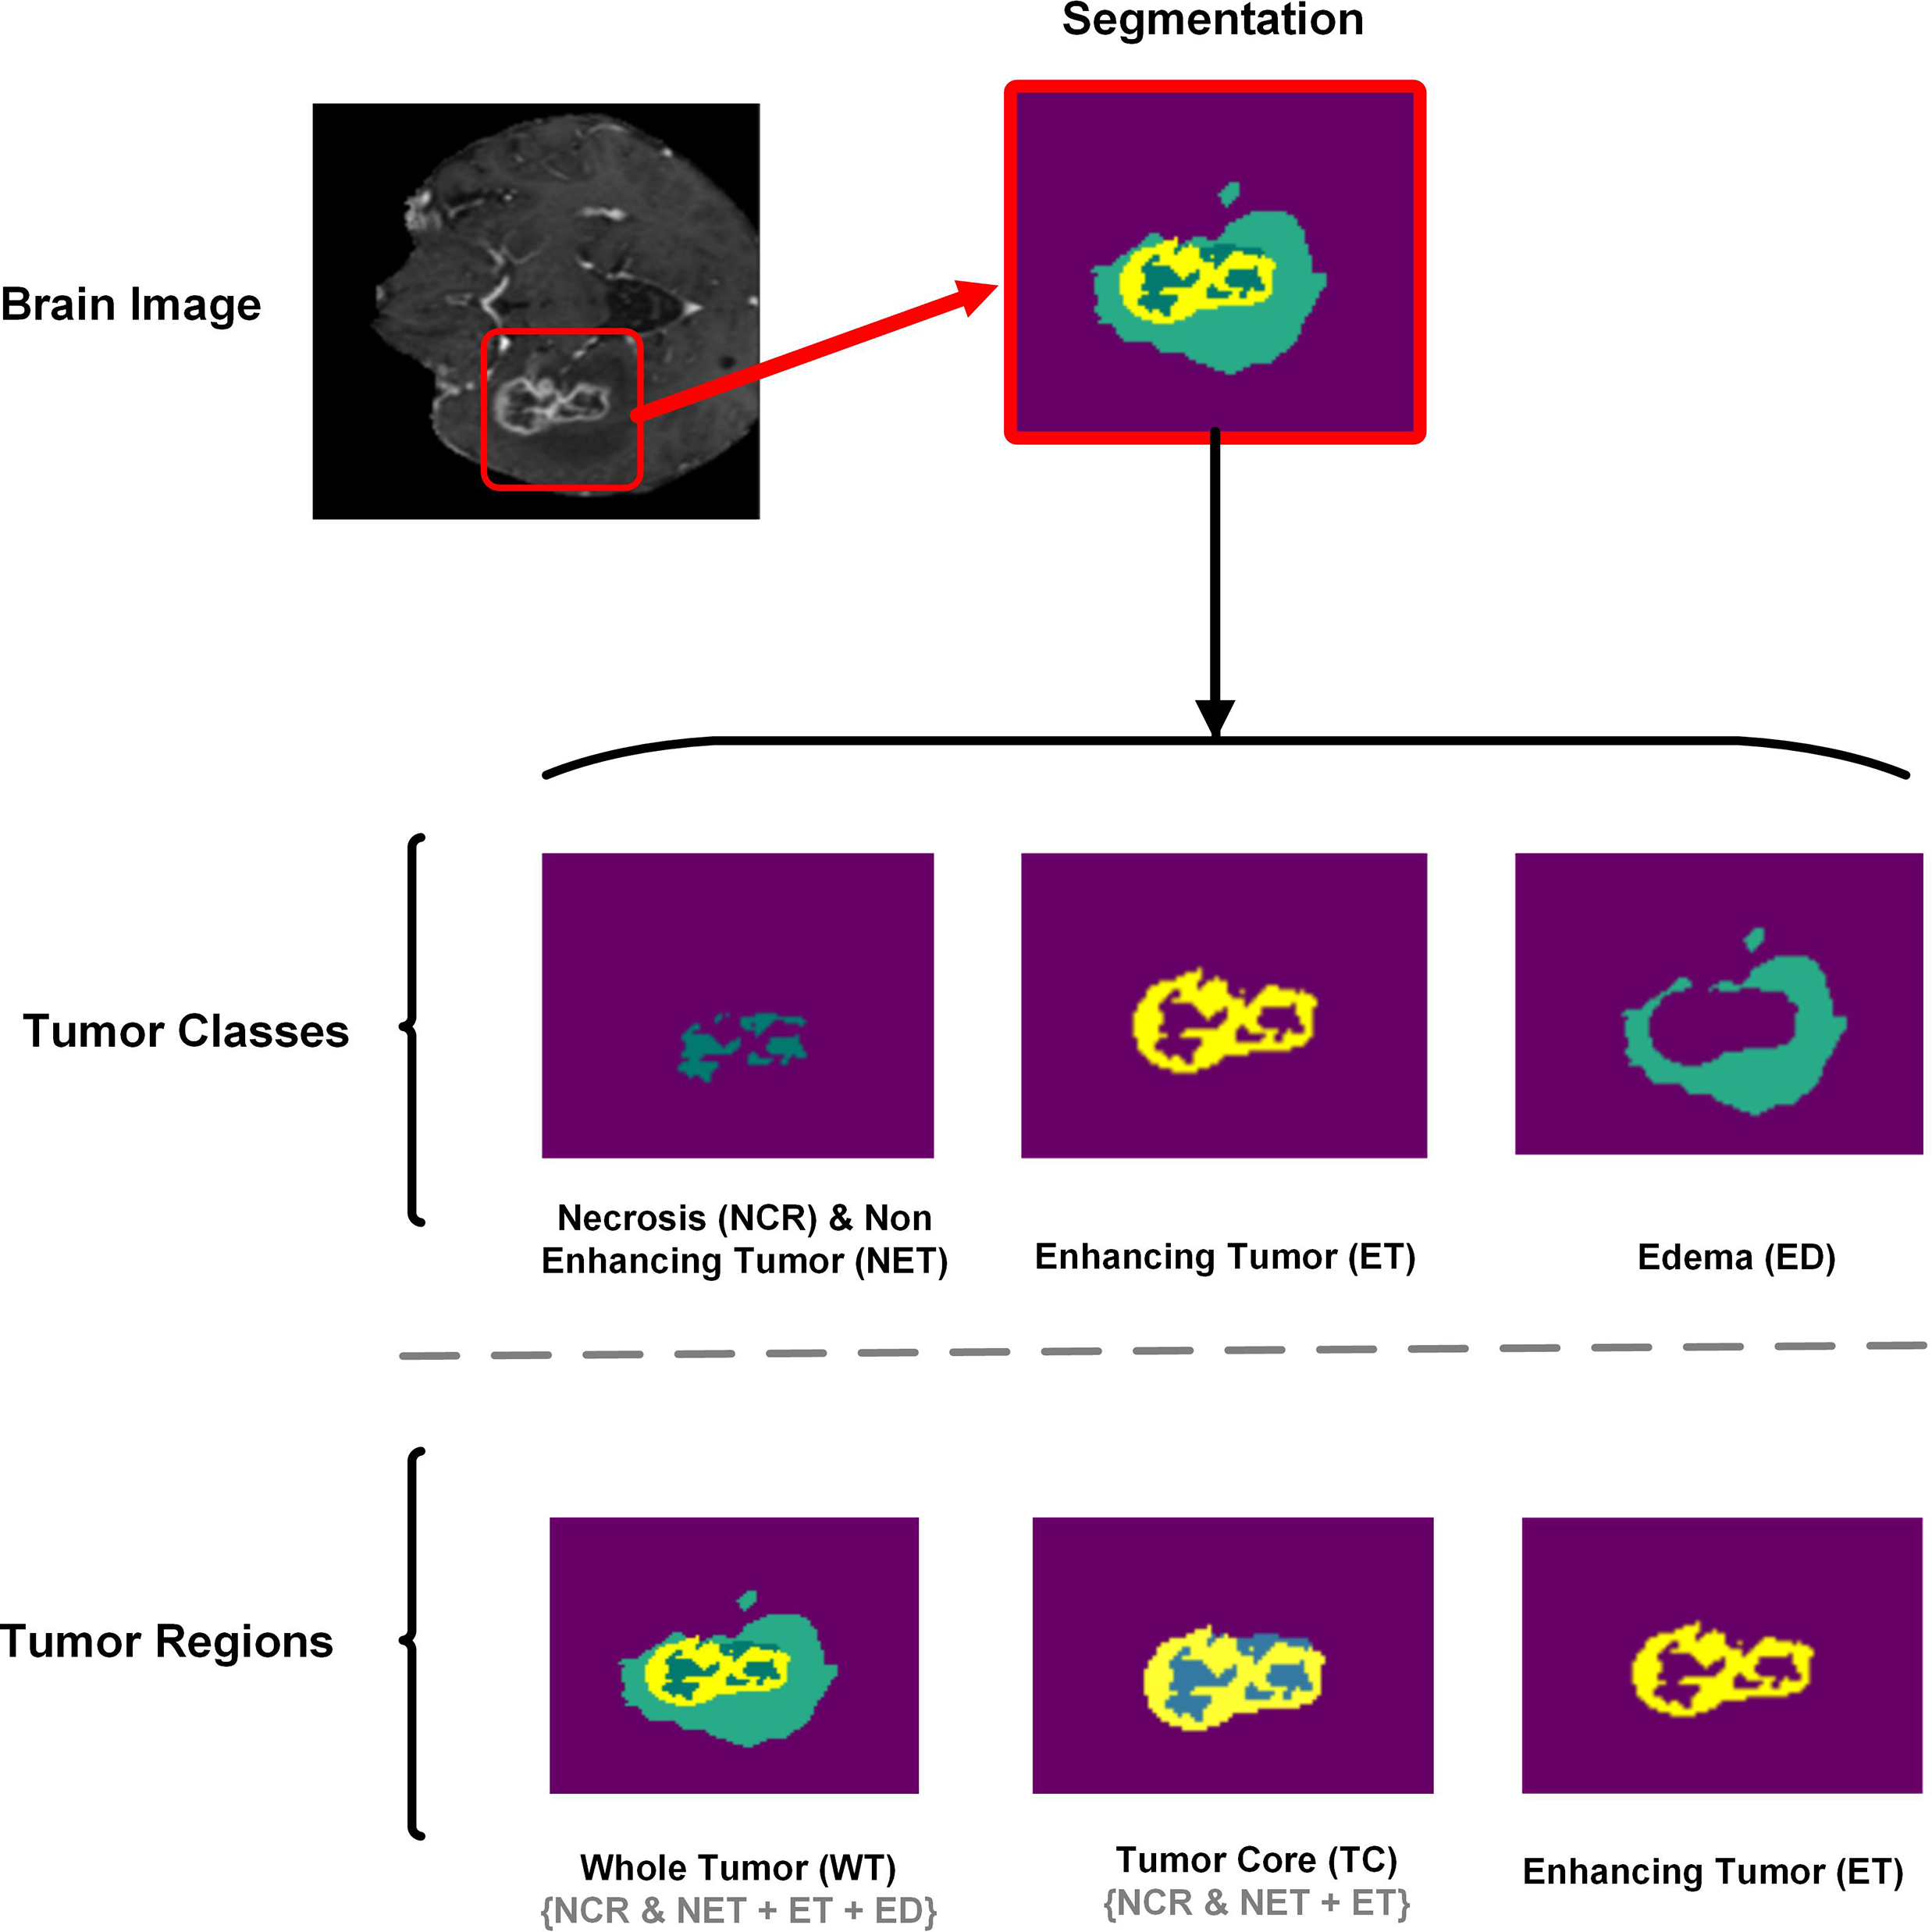
Figure 9: Brain tumor segmentation method depicting the tumor classes (NCR/NET, ET, ED) and tumor regions (WT, TC, ET). For better analyses and understanding of segmentation results, Tumor classes are separately displayed
dSEAT-UNet was trained, validated, and tested on the benchmark BraTS 2020 MRI dataset with a separation weightage of 75%, 15%, and 10% for training, validation, and testing, respectively. While testing the model performance on random test dataset samples, we observed that dSEAT-UNet accurately generated the 3D segmentation volumes with tumor classes. Prediction results show the model’s generalization ability. Results analysis for three tumor classes, i.e., WT, TC, and ET, show high similarity between ground truth and predictions. As shown in Fig. 9, tumor classes and regions are separately displayed for a better understanding of the segmentation results, highlighting the WT, TC, and ET tumor regions.
To optimize the performance of our proposed model, we conducted empirical hyperparameter tuning using a combination of grid search and validation-based selection. The learning rate was varied across a range from 1 × 10⁻³ to 1 × 10⁻⁵ and the optimal value of 1 × 10⁻⁴ was selected based on validation dice scores. Dropout rates were tested in the range of 0.0 to 0.3, with 0.1 and 0.2 providing the best balance between regularization and model capacity. The Adam optimizer was chosen due to its stable convergence behavior, and the ReLU activation function was selected after comparing it with GELU and LeakyReLU, as it provided slightly better performance and training stability. These hyperparameters were validated on a subset of the BraTS 2020 dataset to ensure generalization and stability before full-scale training. Training stability was monitored across epochs using validation loss and dice score to ensure smooth convergence and prevent overfitting.
The performance metrics, including dice score, specificity, and sensitivity, are computed and presented in Table 3. Fig. 10 displays the training and validation losses for each epoch, for 150 epochs, providing insight into the model’s learning progress and performance. In the initial stages, both training and validation losses decrease sharply, indicating effective learning and the ability of model to identify data patterns. As training progresses, loss continues to decrease consistently, reflecting the model’s ability to reduce error on the training data. Although the validation loss experiences some fluctuations, it generally trends downward, suggesting that the model is enhancing its ability to generalize to unseen data. The overall trend in validation loss highlights the ability of model to adapt and learn relevant data features, even though it faces typical challenges such as minor overfitting. The consistent decline in training loss and the ultimate stabilization of validation loss reflects the model’s robustness and efficiency in handling the training process over a long period.
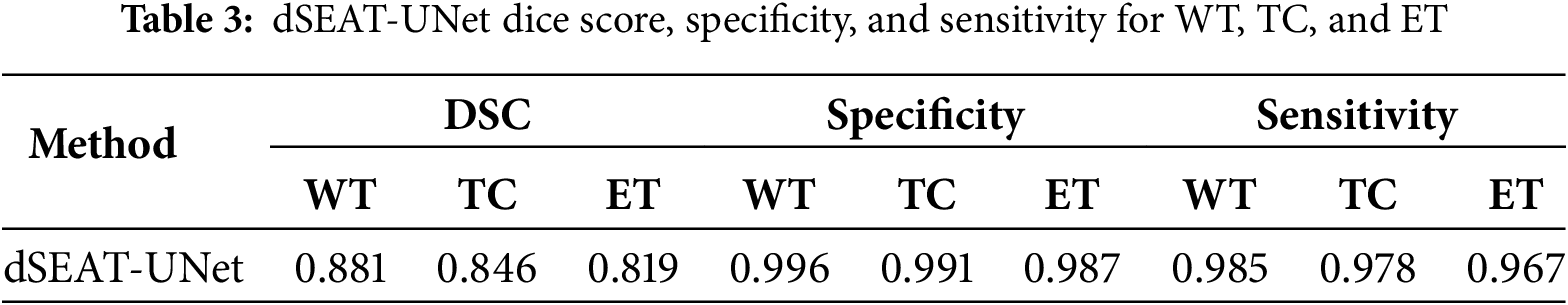
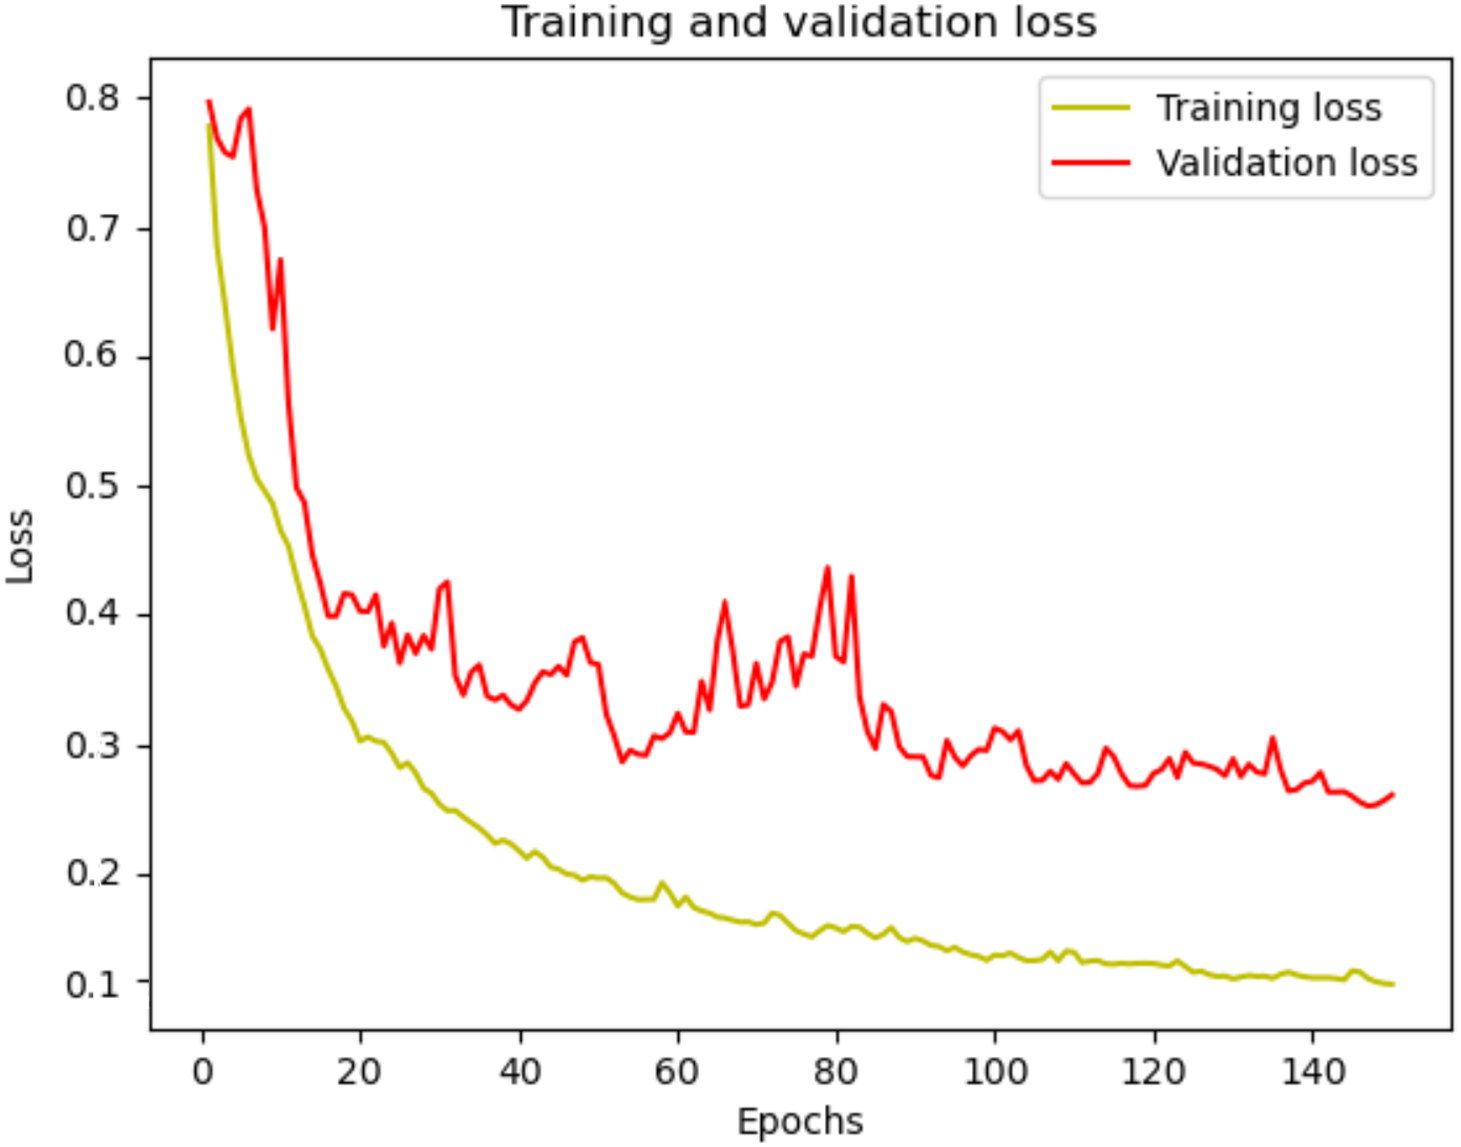
Figure 10: dSEAT-UNet training and validation loss
Fig. 11 presents a box plot displaying three tumor regions dice scores such as WT in blue, TC in green, and ET in purple. The box indicates the interquartile range, with the median value marked by the red line inside the box. The whiskers reach the minimum and maximum values within 1.5 times the interquartile range, and outliers are shown as separate dots. The plot shows that WT has the highest median dice score, followed by TC and ET, indicating better segmentation performance for WT than the other regions. The presence of outliers suggests variability in segmentation accuracy across different samples.
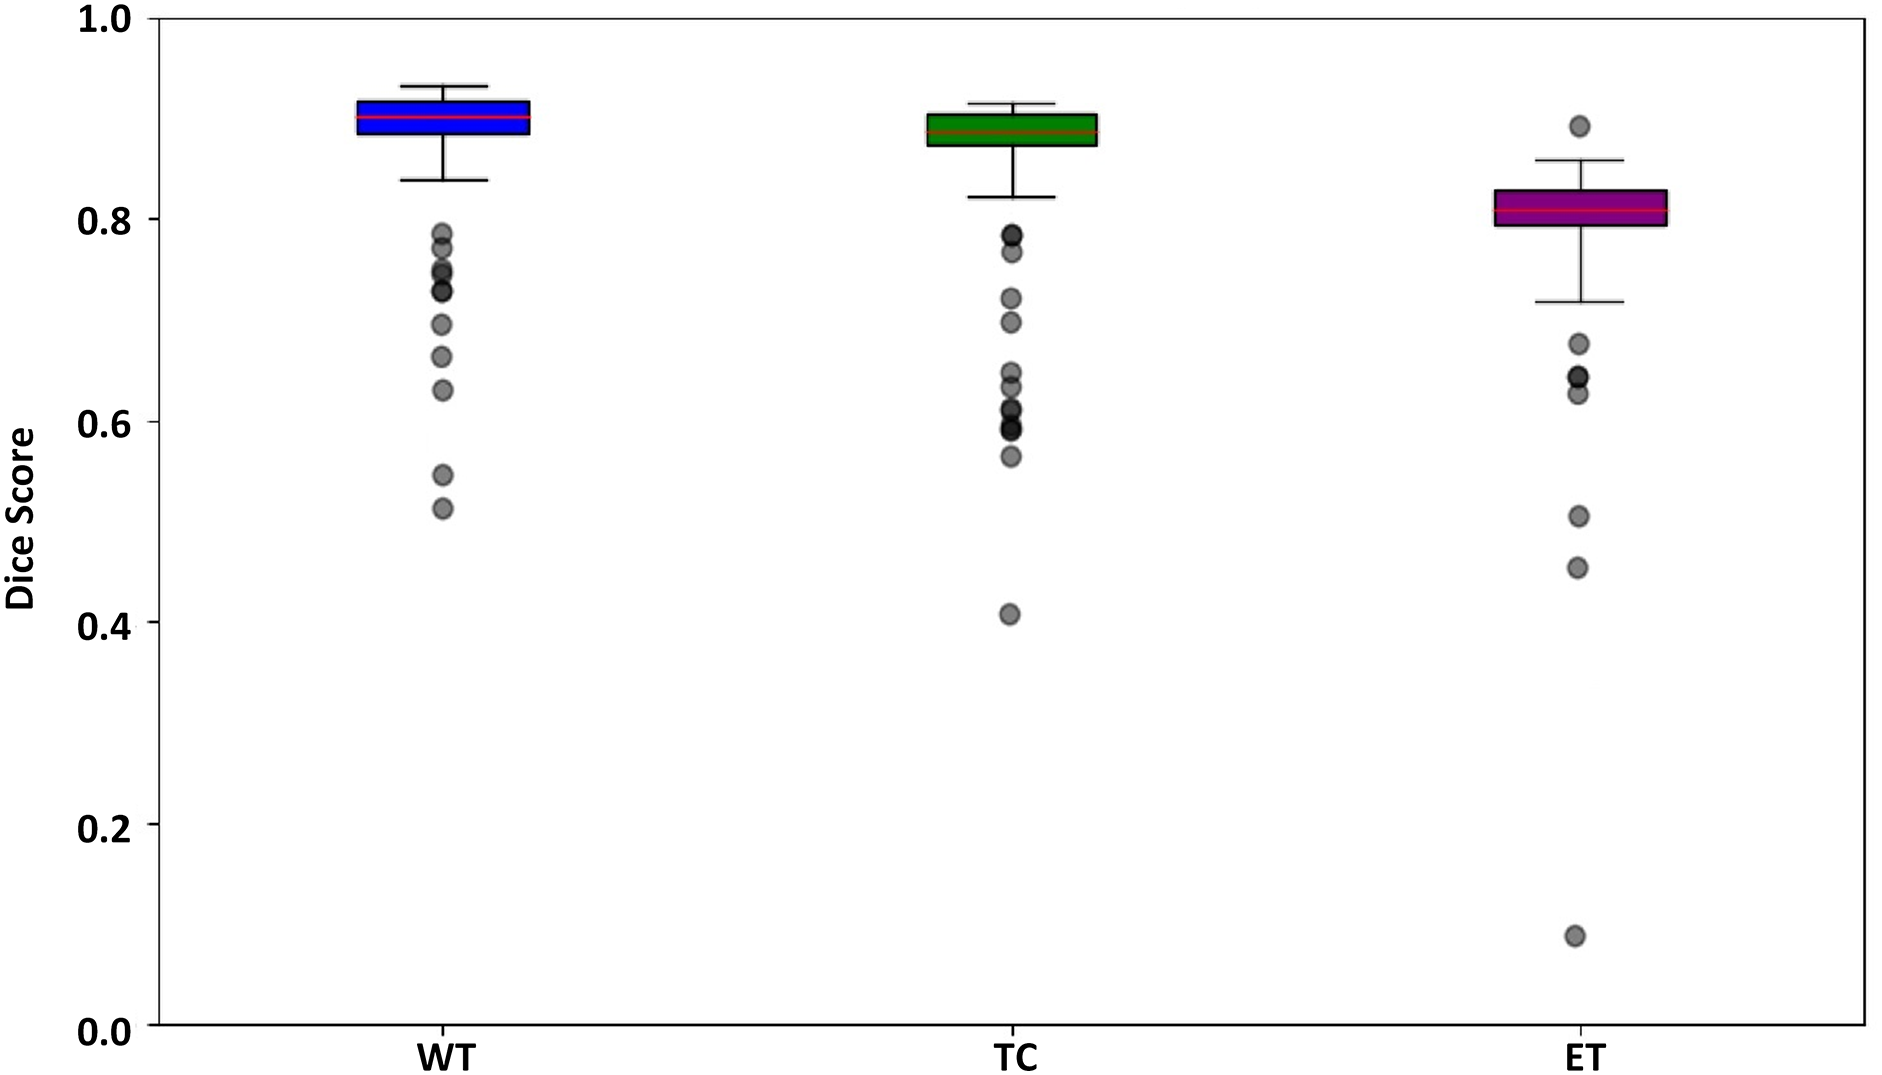
Figure 11: Box plot for the dSEAT-UNet dice score corresponding to WT, TC, and ET
5.1 Importance of Suitable Data Preprocessing Technique
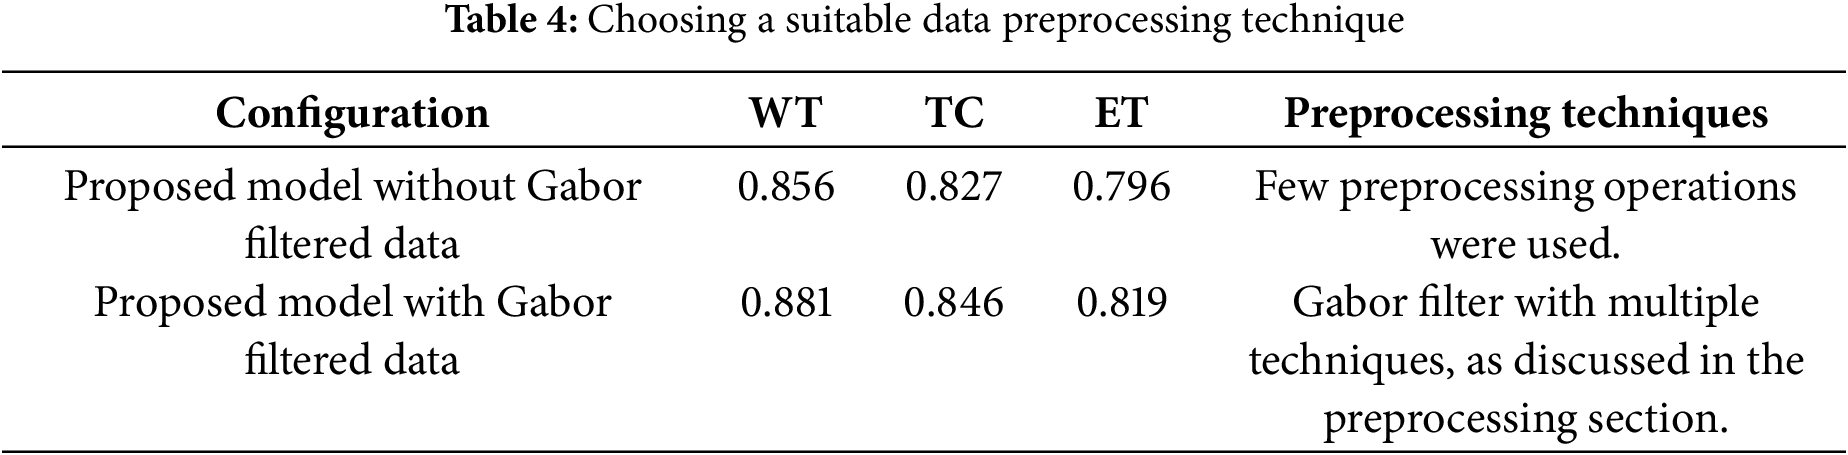
It is highly significant to highlight the importance of a suitable data preprocessing technique. One of the major factors other than designing a reliable and robust deep learning architecture is choosing a suitable data preprocessing technique. As mentioned in Section 3.3 about Gabor filter optimization, we observed notable improvement in the segmentation performance of the model. The performance of the proposed model is observed on both datasets, i.e., regular BraTS 2020 and filtered BraTS 2020 datasets. As shown in Table 4, it is evident that after selecting a suitable data preprocessing technique, the segmentation performance of the proposed model improved in segmenting all three tumor areas, i.e., WT, TC, and ET.
5.2 Comparison with State-of-the-Art Methods
We compared our dSEAT-UNet model with state-of-the-art methods on the BraTS 2020 dataset and presented an in-depth quantitative results analysis. Later, we also cross-verified the performance of our model on BraTS 2021 dataset samples. The following sections contain the proposed model’s evaluation on both datasets, i.e., BraTS 2020 and BraTS 2021.
5.2.1 Comparison with State-of-the-Art-Methods on the BraTS2020 Dataset
Segmenting brain tumors accurately is a complex task, particularly for regions like tumor core and enhancing tumor. Segmenting these smaller regions presents additional difficulties. To assess the performance of the proposed model, dSEAT-UNet, was compared with benchmark methods on BraTS2020 benchmark dataset. Our comparison is based on published results from these methods, which we referenced for a comprehensive analysis and comparison with our study. Our model outperformed most previously published studies, in terms of TC and ET segmentation performance, as shown in Table 5. The highest DSC values for each tumor class are highlighted in bold. Fig. 12 presents the segmentation results of the model on the BraTS 2020 dataset. The precision of any deep learning model completely lies in how precisely it segments the tumor regions, as it is significant in medical treatment. The segmentation results shown by our model for each tumor region show the accurate definition of boundaries, especially in the case of tumor core and enhancing tumor. Our model’s precision in detecting and segmenting tumor regions shows the model’s effectiveness and offers competitive performance compared to the state-of-the-art methods. Quantitative analysis from Table 5 shows that the study presented by Wang et al. [26] shows the highest dice score of 0.900 in segmenting whole tumor, exceeding our score of 0.881. However, our model achieved 2.9% (TC) and 2.9% (ET) gains over Wang et al.’s study [26]. Without using any postprocessing technique, our model surpasses all other studies regarding TC and ET with values of 0.846 and 0.819, respectively. Our model has 30.63 M parameters. Our model has fewer parameters than the state-of-the-art and the model by Wang et al. [26], which has 32.99 M parameters. There are 19.06 M parameters of the baseline 3D U-Net [17], and Raza et al.’s model [24] has 30.47 M parameters. Even though our model has 30.63 M parameters, our model has shown improved performance and obtained DSC of 0.881 for WT, 0.846 for TC, and 0.819 for ET.
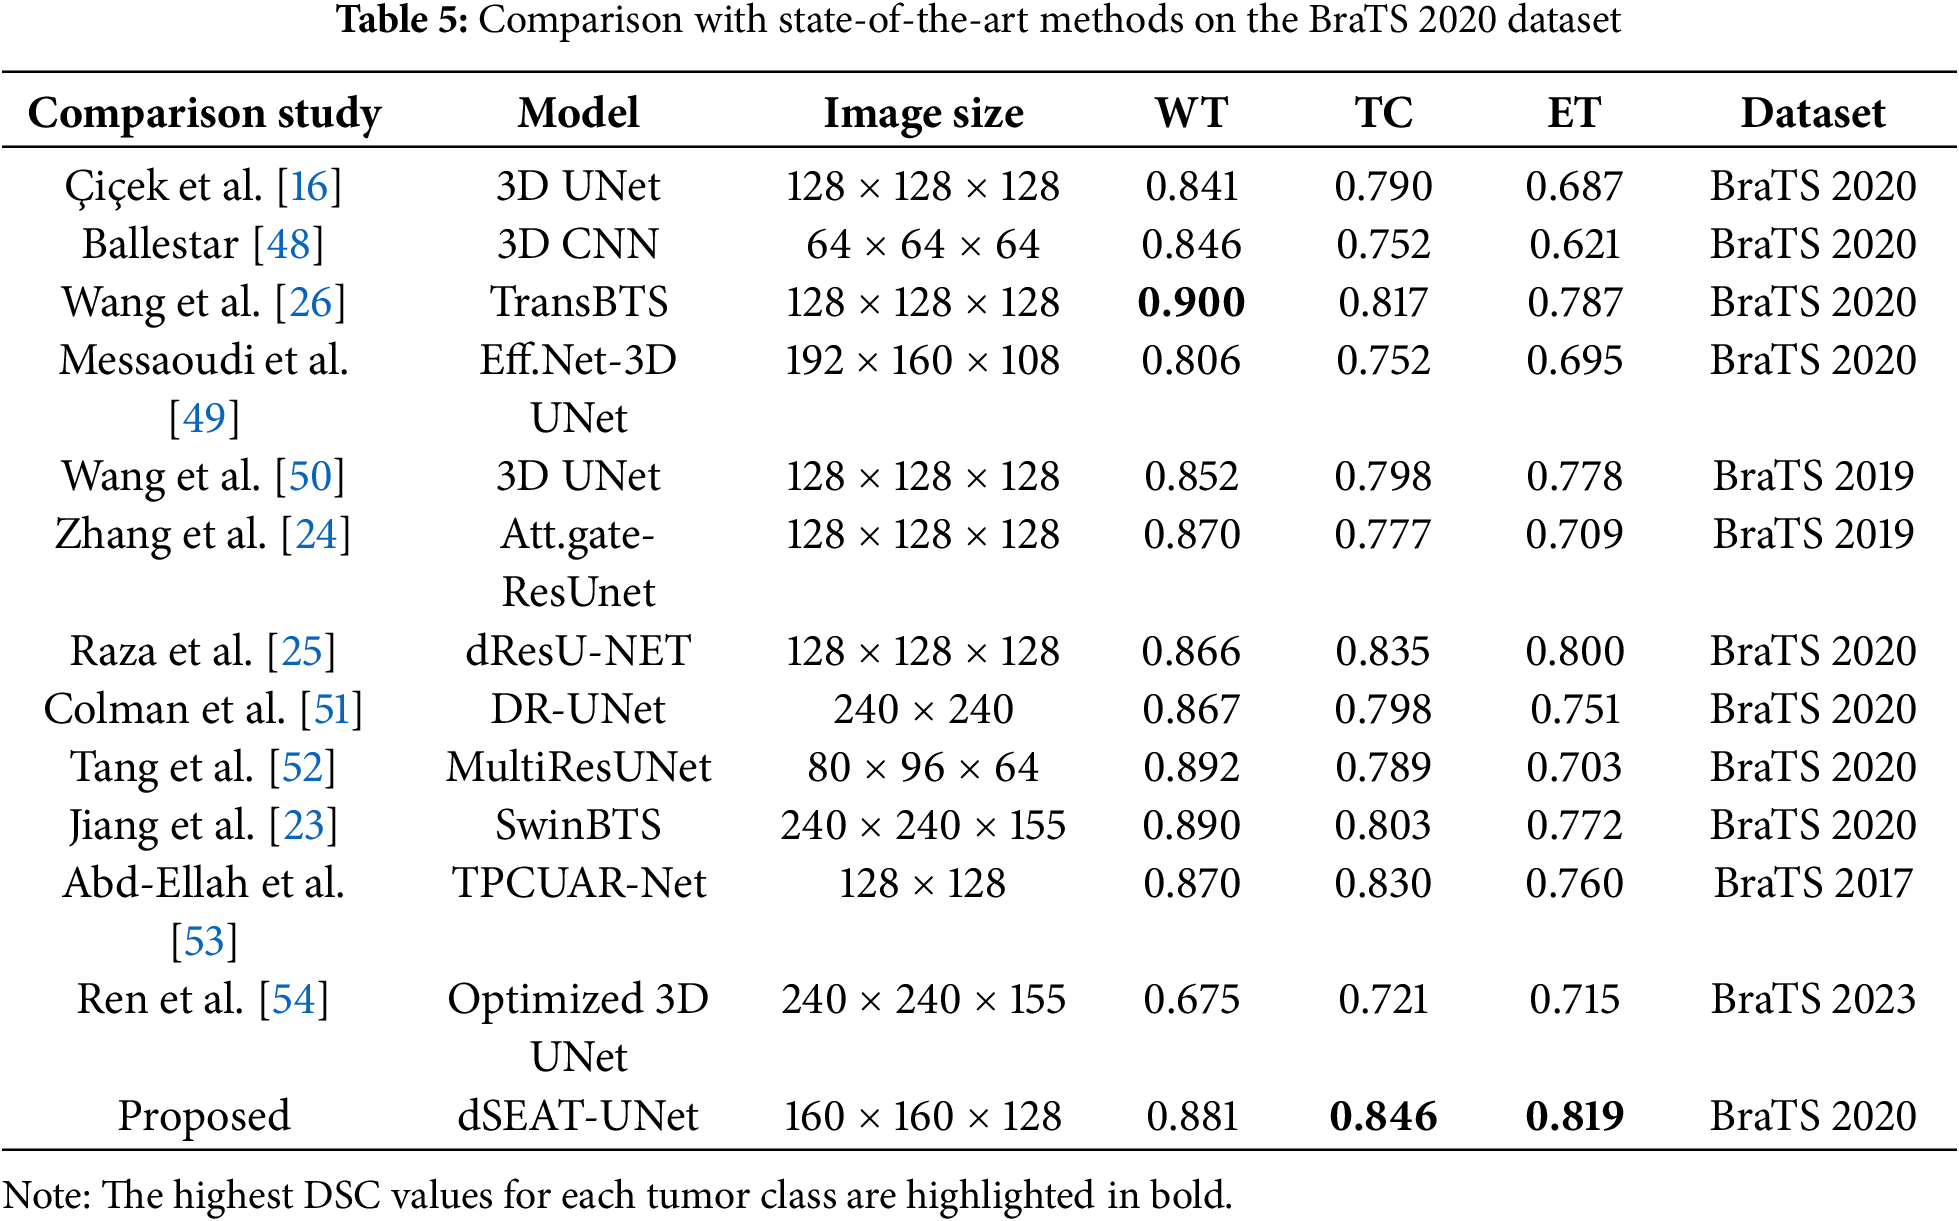
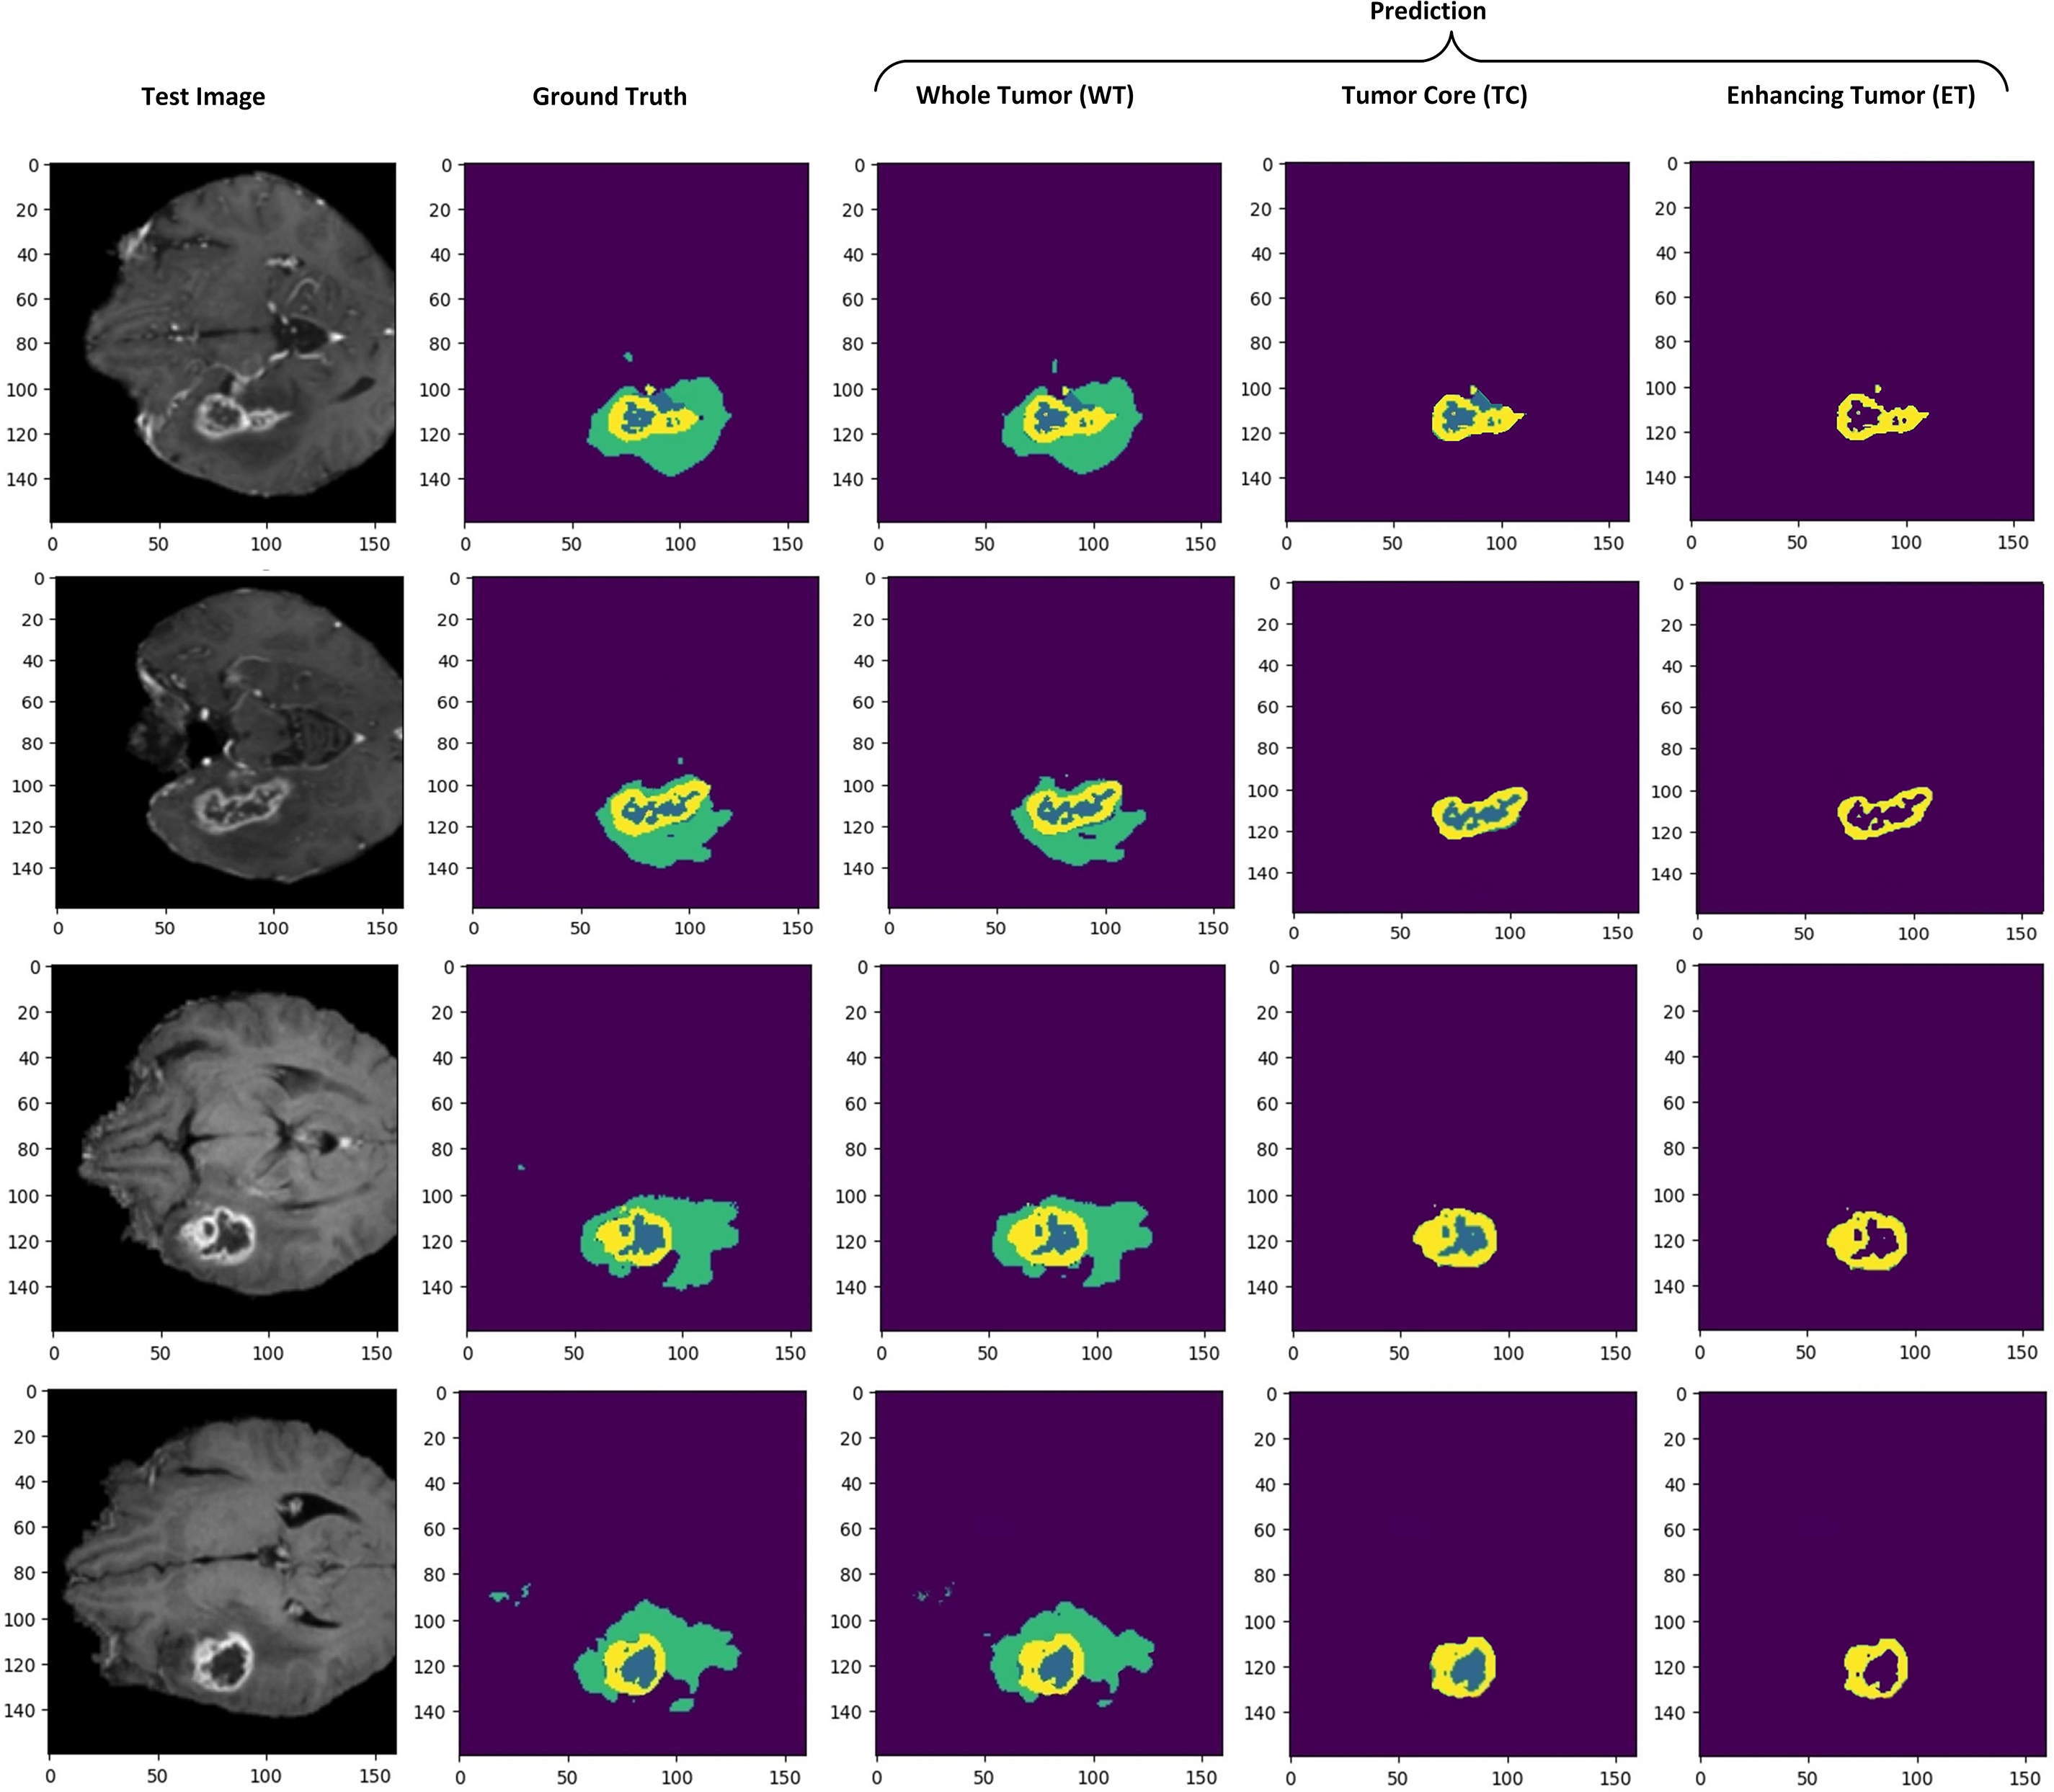
Figure 12: Qualitative visualization of model segmentation results when randomly selecting four test sample images from the dataset. Prediction shows separate illustrations of segmentations for WT, TC, and ET
5.2.2 Model Cross-Validation on BraTS 2021 Dataset
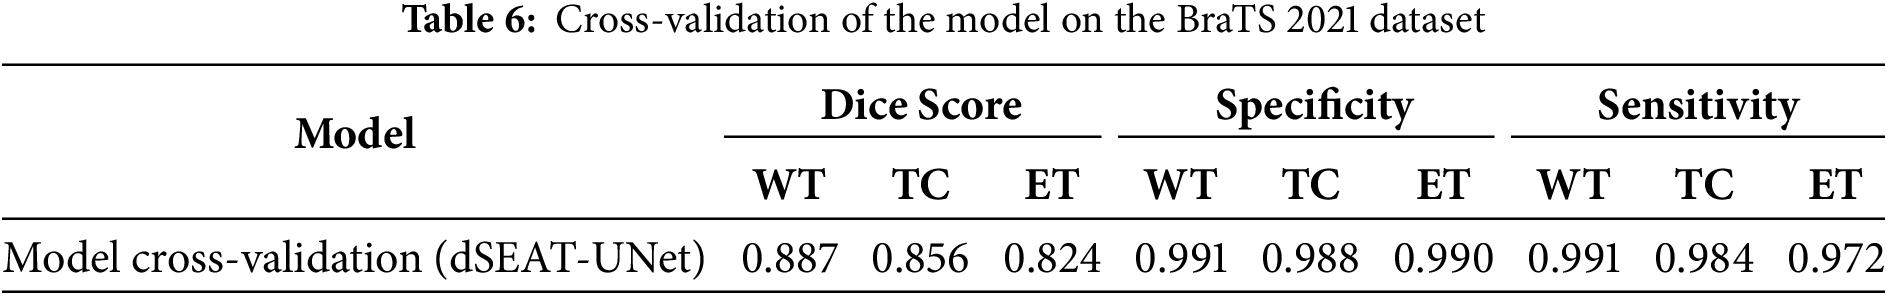
We also evaluated our model on the BraTS 2021 dataset to analyze the performance. The BraTS 2021 dataset is also pre-processed as BraTS2020 to make it suitable for testing. An unbiased performance of the model can be measured by testing the model on another dataset [55]. Our model also showed competitive results on unseen test samples from BraTS 2021. The sample preprocessed images of the BraTS 2021 dataset are shown in Fig. 13. We observed enhanced generalization ability and promising results of our model, as shown in Fig. 14, and quantitative results in Table 6. This highlights the effectiveness and robustness of our model, which outperformed other state-of-the-art studies with DSC values of 0.856 for TC and 0.824 for ET, respectively.
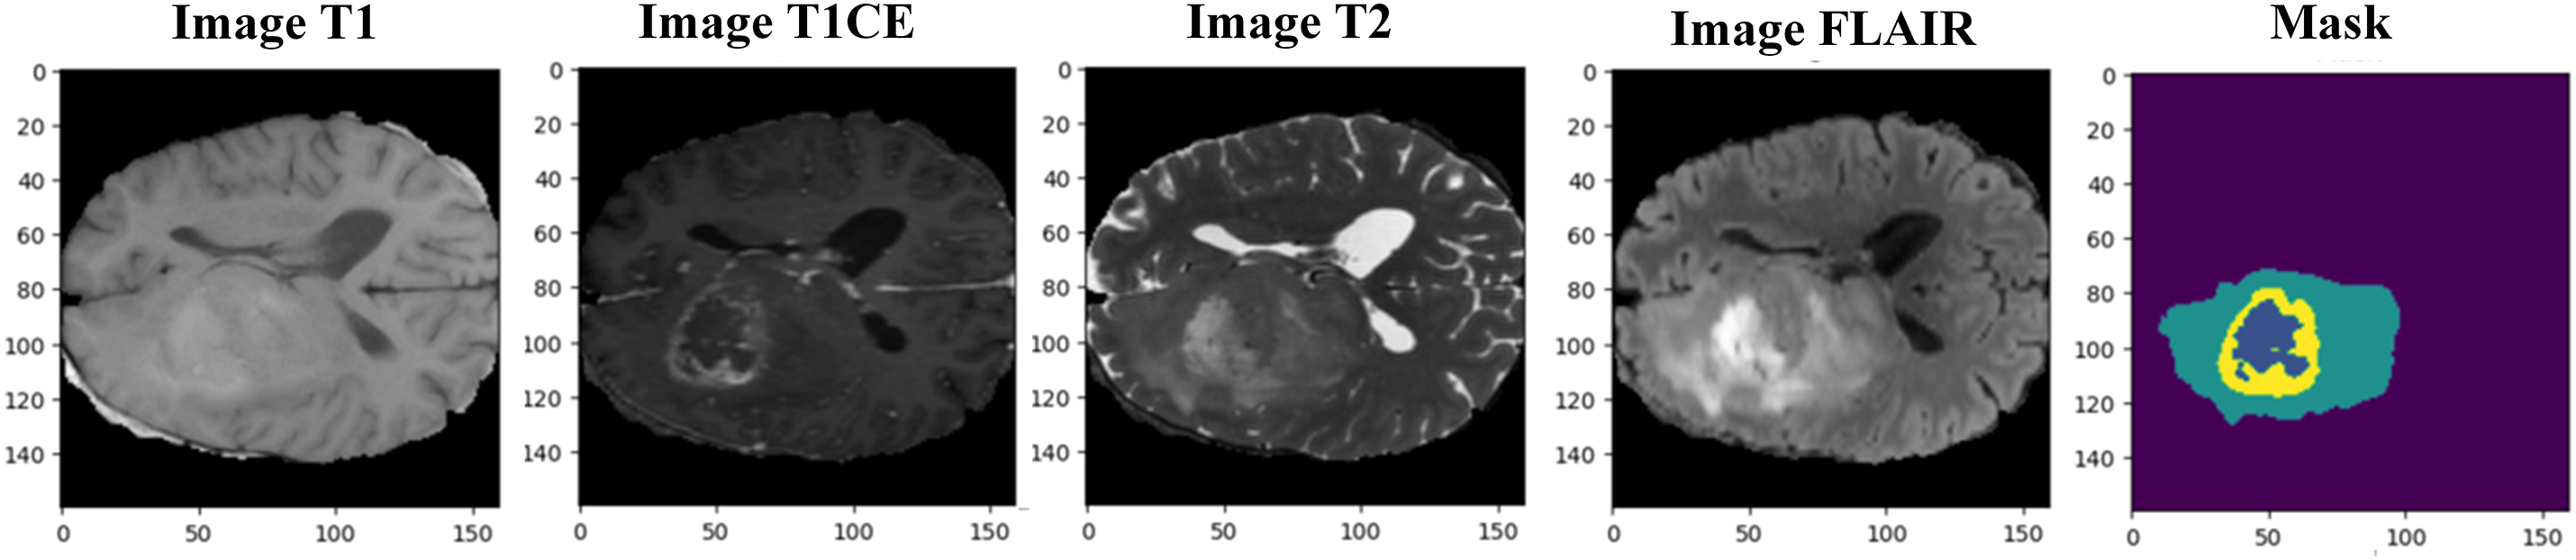
Figure 13: Resized BraTS 2021 sample MRI images with mask (ground truth)
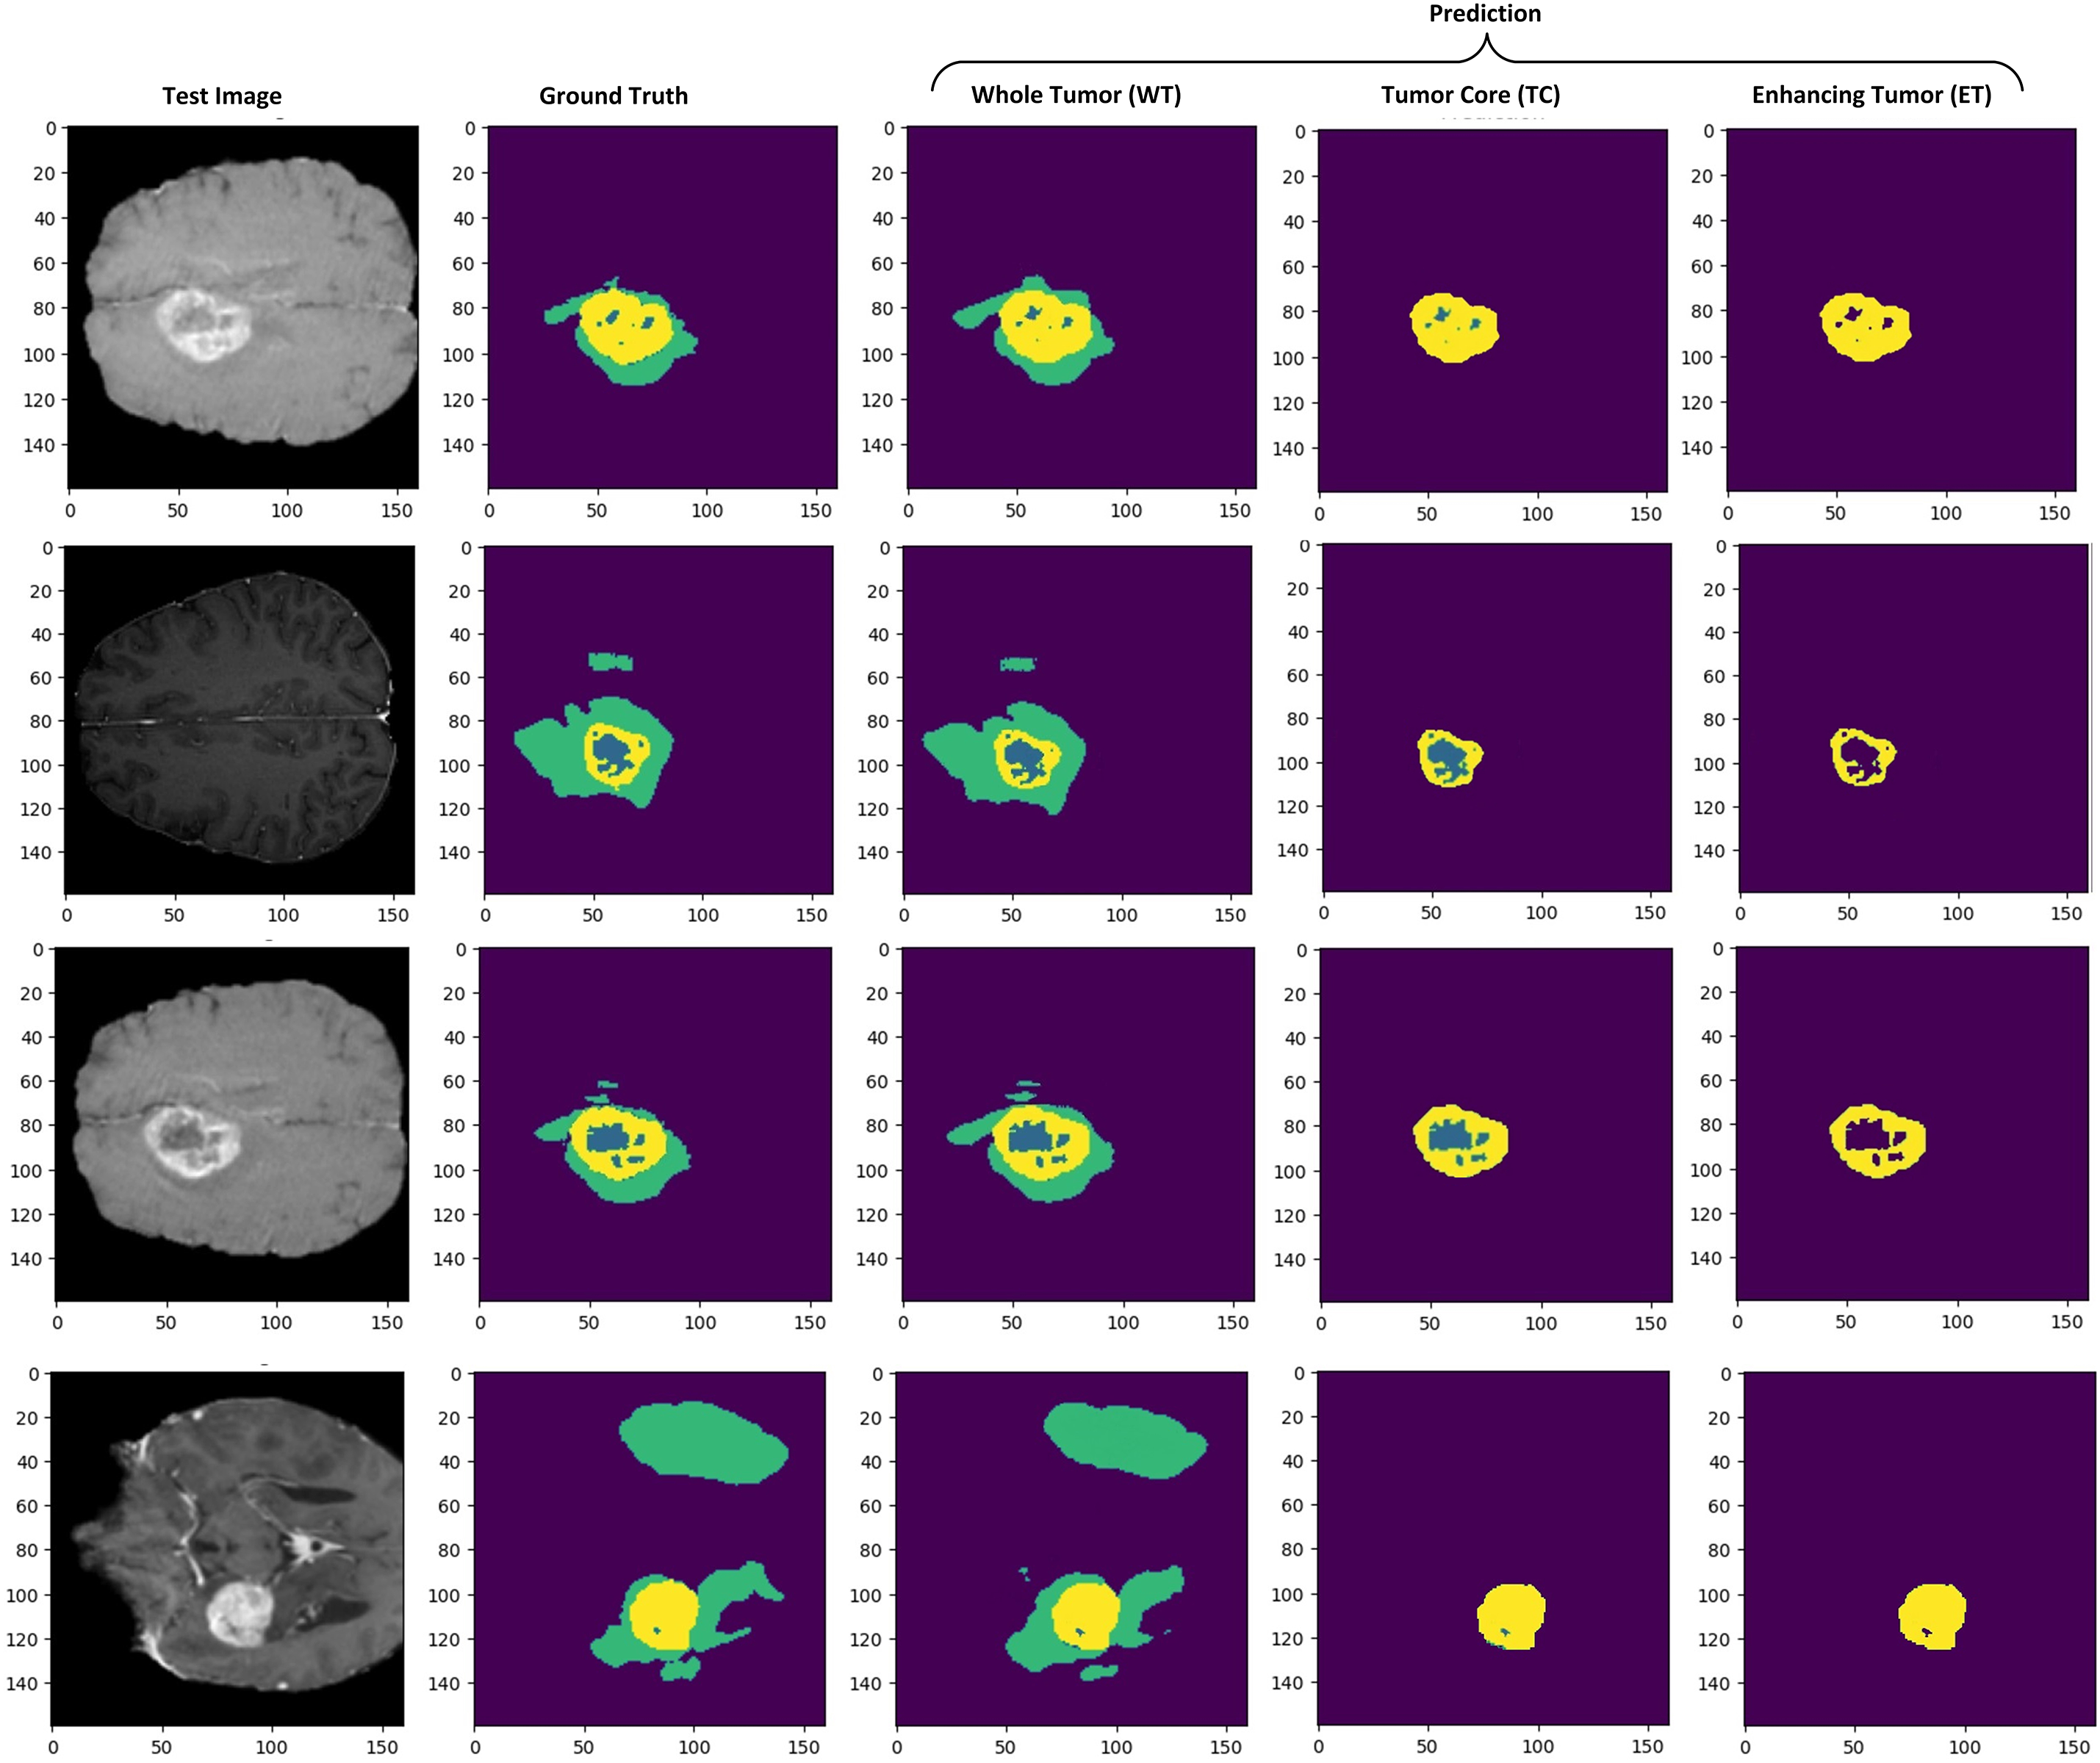
Figure 14: Brain tumor segmentation results on the axial axis. Prediction results show separate tumor regions for WT, TC, and ET
The dSEAT-UNet outperforms state-of-the-art methods in the accurate segmentation of WT, TC, and ET brain tumor regions. An ablation study is also conducted to highlight the importance of a combined network with residual blocks and SE mechanisms in skip connections. This network is compared with residual network-based encoder network and baseline 3D network, which do not contain squeeze and excitation mechanisms. The dSEAT-UNet has shown the highest performance compared to the two methods. The dice scores, specificity, and sensitivity metrics values for the three methods are shown in Table 7. The dice scores are plotted, and a comparison chart for the baseline 3D U-Net, proposed model without attention mechanism, and dSEAT-UNet is presented for three tumor regions, i.e., WT, TC, and ET, in Fig. 15.
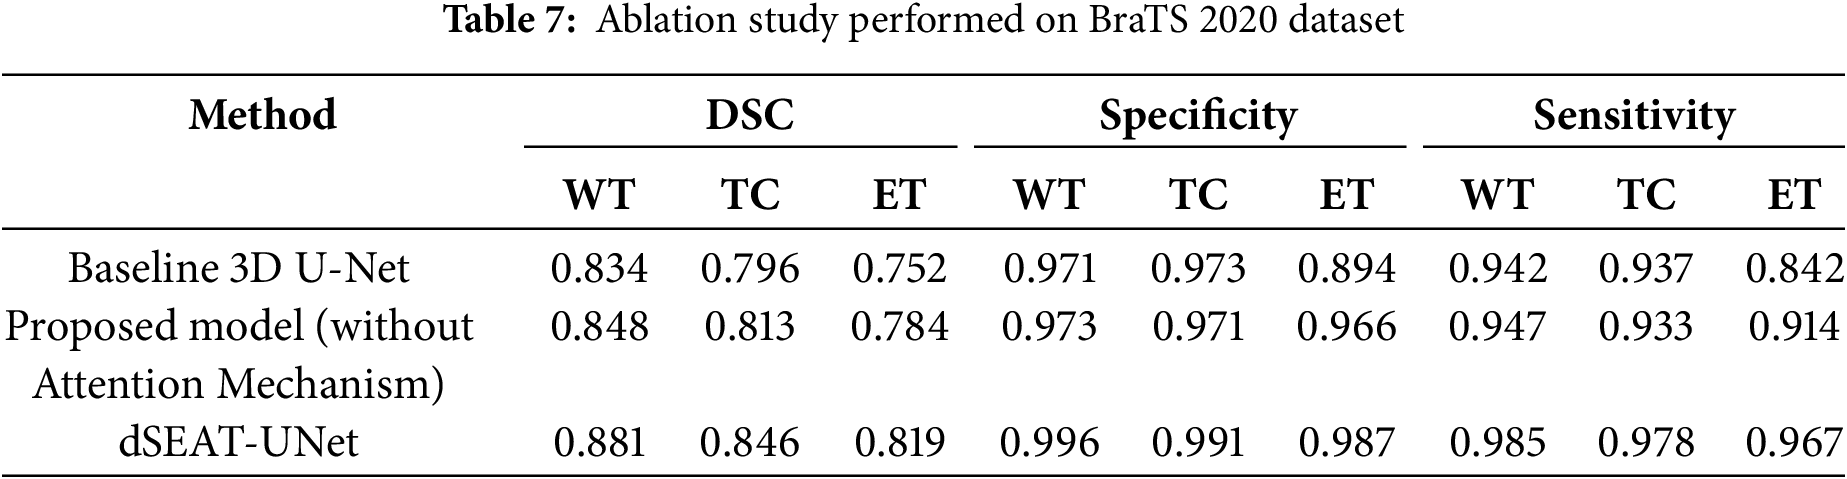
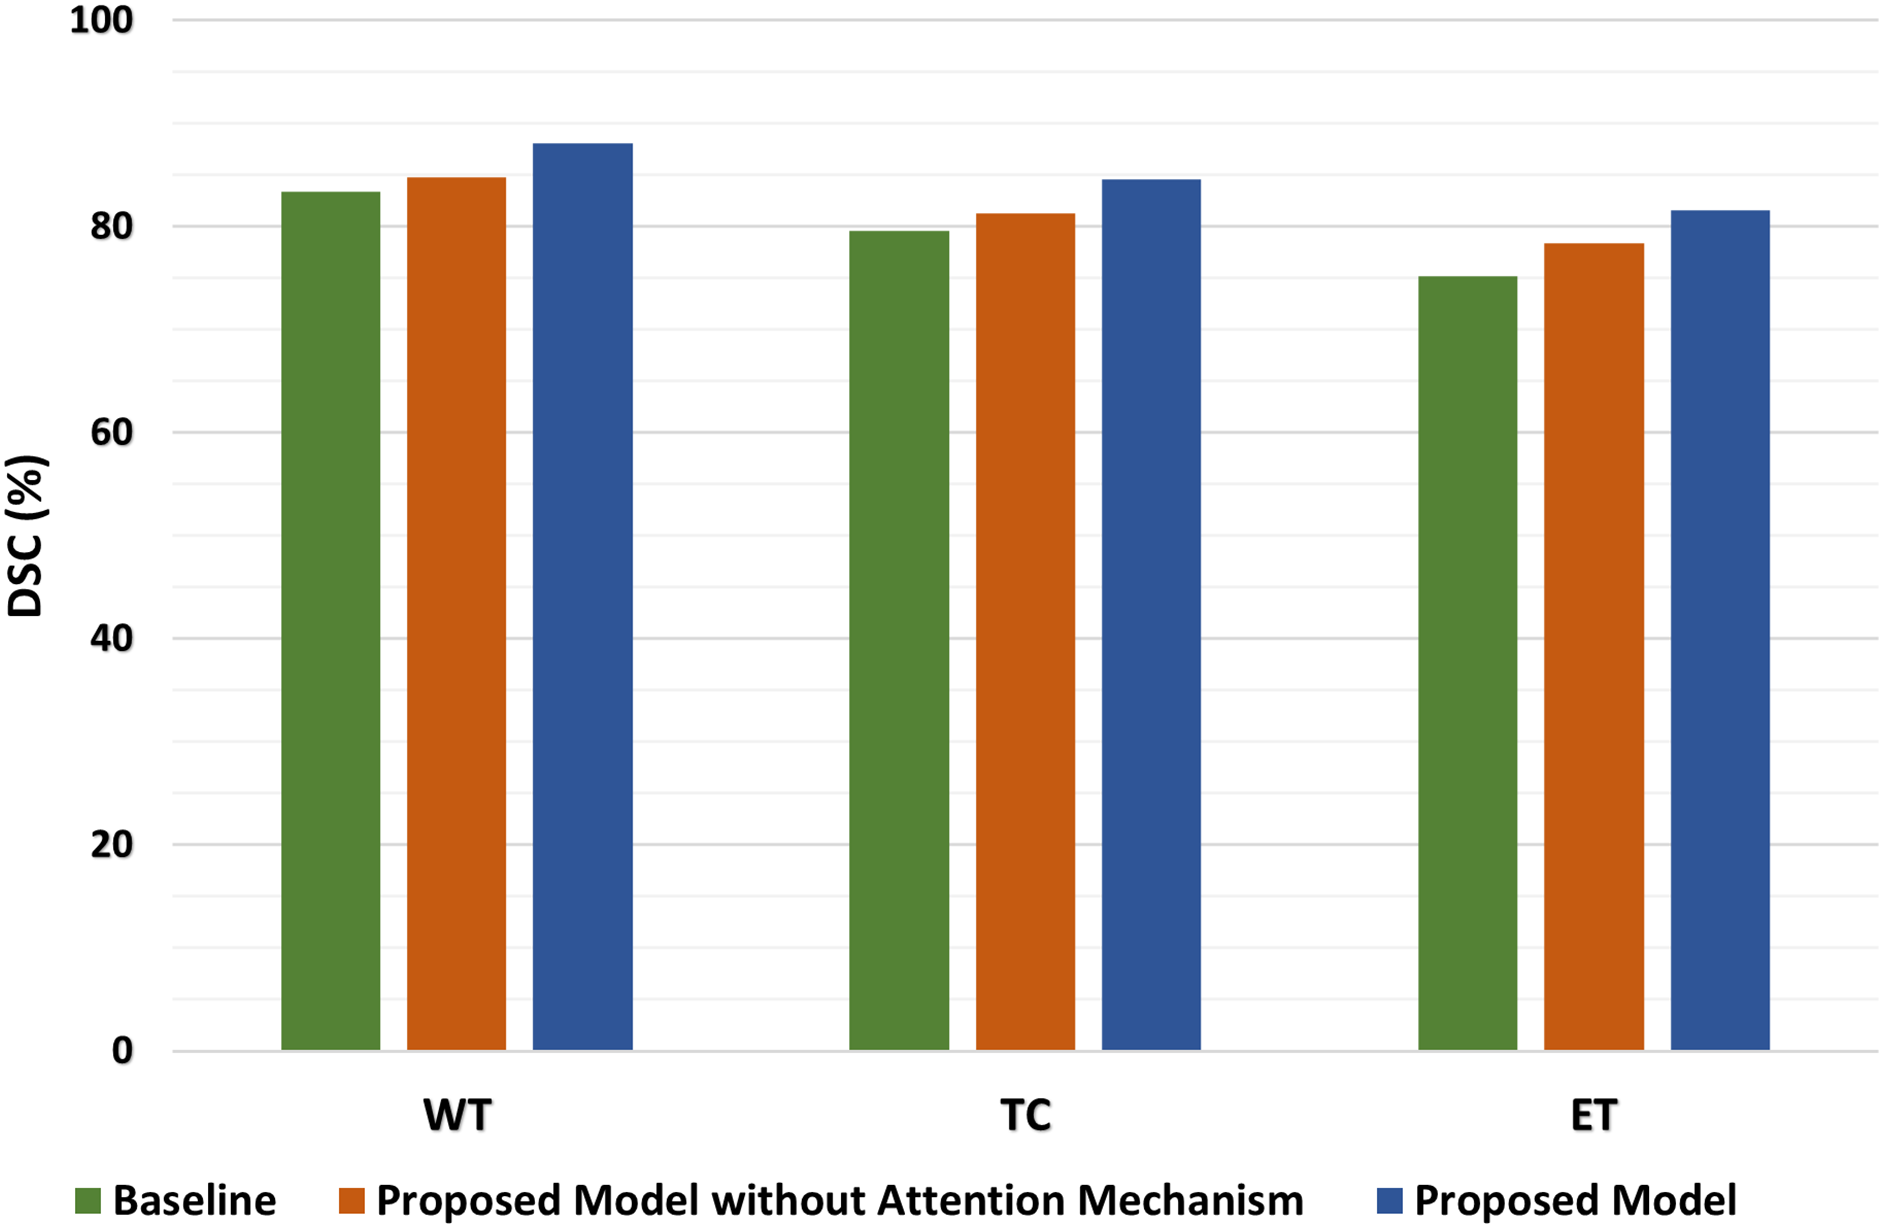
Figure 15: Comparison of dice scores on baseline 3D U-Net, proposed model without attention, and dSEAT-UNet for WT, TC, and ET
The quantitative analysis shows that dSEAT-UNet, which incorporates the SE attention mechanism, significantly outperforms both the baseline 3D U-Net and the proposed model without the attention mechanism across all three tumor regions. The dice score improvements for dSEAT-UNet indicate the effectiveness of the attention mechanism in enhancing segmentation performance. Specifically, for the WT region, dSEAT-UNet shows a performance improvement of 5.63% over the baseline and 3.89% over the proposed model without the attention mechanism, highlighting its superior ability to segment the entire tumor region accurately. For the TC region, the 6.28% improvement over the baseline and 4.06% over the proposed model without the attention mechanism underscores the attention mechanism’s impact on accurately identifying the tumor core. The most significant improvement is observed in the ET region, where dSEAT-UNet achieves an 8.51% enhancement over the baseline and 4.08% over the proposed model without the attention mechanism, demonstrating the attention mechanism’s critical role in capturing the enhancing tumor region, which is often more challenging to segment due to its variability and complexity.
To further quantify the contribution of the SE attention mechanism in dSEAT-UNet, we analyzed the performance improvements by comparing the model without SE attention to the full dSEAT-UNet. This comparison isolates the effect of the attention mechanism on segmentation accuracy. The results show that integrating SE attention leads to an increase in dice scores by approximately 3.3% for WT region, 3.3% for TC, and 3.5% for ET region. These improvements underscore the effectiveness of the SE module in enhancing feature recalibration and model sensitivity, particularly for complex and challenging tumor subregions.
The quantitative analysis highlights the substantial performance gains achieved by incorporating the attention mechanism in dSEAT-UNet. These improvements across all tumor regions demonstrate the critical importance of the attention mechanism in enhancing segmentation accuracy, proving dSEAT-UNet as the best-performing model among the three evaluated in the ablation study.
5.4 Limitations, Risks and Computational Trade-Offs
While the proposed dSEAT-UNet demonstrates strong segmentation accuracy on benchmark datasets, several challenges and deployment considerations must be addressed to ensure its real-world applicability in clinical settings:
• Computational Resource Constraints: The model architecture, integrating a deep ResNet encoder, SE attention mechanisms, and Gabor filters, improves segmentation accuracy but increases computational demands. Deploying such a model in clinical environments especially those with limited GPU availability can be challenging. Reducing the input volume size to 160 × 160 × 128 helped mitigate GPU memory overflow during training, but further optimizations such as model pruning, quantization, or knowledge distillation could enhance deployability without significant performance loss.
• Latency and Real-Time Processing: The depth and complexity of dSEAT-UNet, particularly in processing high-resolution 3D MRI scans, may introduce latency in inference. In time-sensitive clinical workflows, this could limit the model’s usability. Efficient model variants or hybrid encoder-decoder designs with fewer parameters could reduce inference time while preserving segmentation accuracy.
• Sensitivity to Variability in MRI Scans: Real-world MRI data often contain artifacts, inter-slice inconsistencies, or intensity variations across devices and institutions. These inconsistencies can degrade model performance, especially when segmenting small or diffuse tumor regions. Enhanced preprocessing strategies such as bias field correction and deep-learning-based denoising are essential to mitigate these issues in deployment scenarios.
• Generalization across Institutions: While the model performed well on the BraTS 2020 and 2021 datasets, its robustness on unseen clinical data from diverse scanners and acquisition protocols remains to be validated. Incorporating more heterogeneous training data and domain adaptation strategies can help improve the model’s generalization and reliability.
Addressing these challenges is critical for transitioning dSEAT-UNet from a research prototype to a practical tool for automated brain tumor segmentation in clinical environments.
5.5 Segmentation Challenges Analysis
While the proposed model demonstrates strong overall performance, several challenging cases highlight its limitations particularly segmenting ET, more critically segmenting NET regions, as illustrated in Fig. 16.
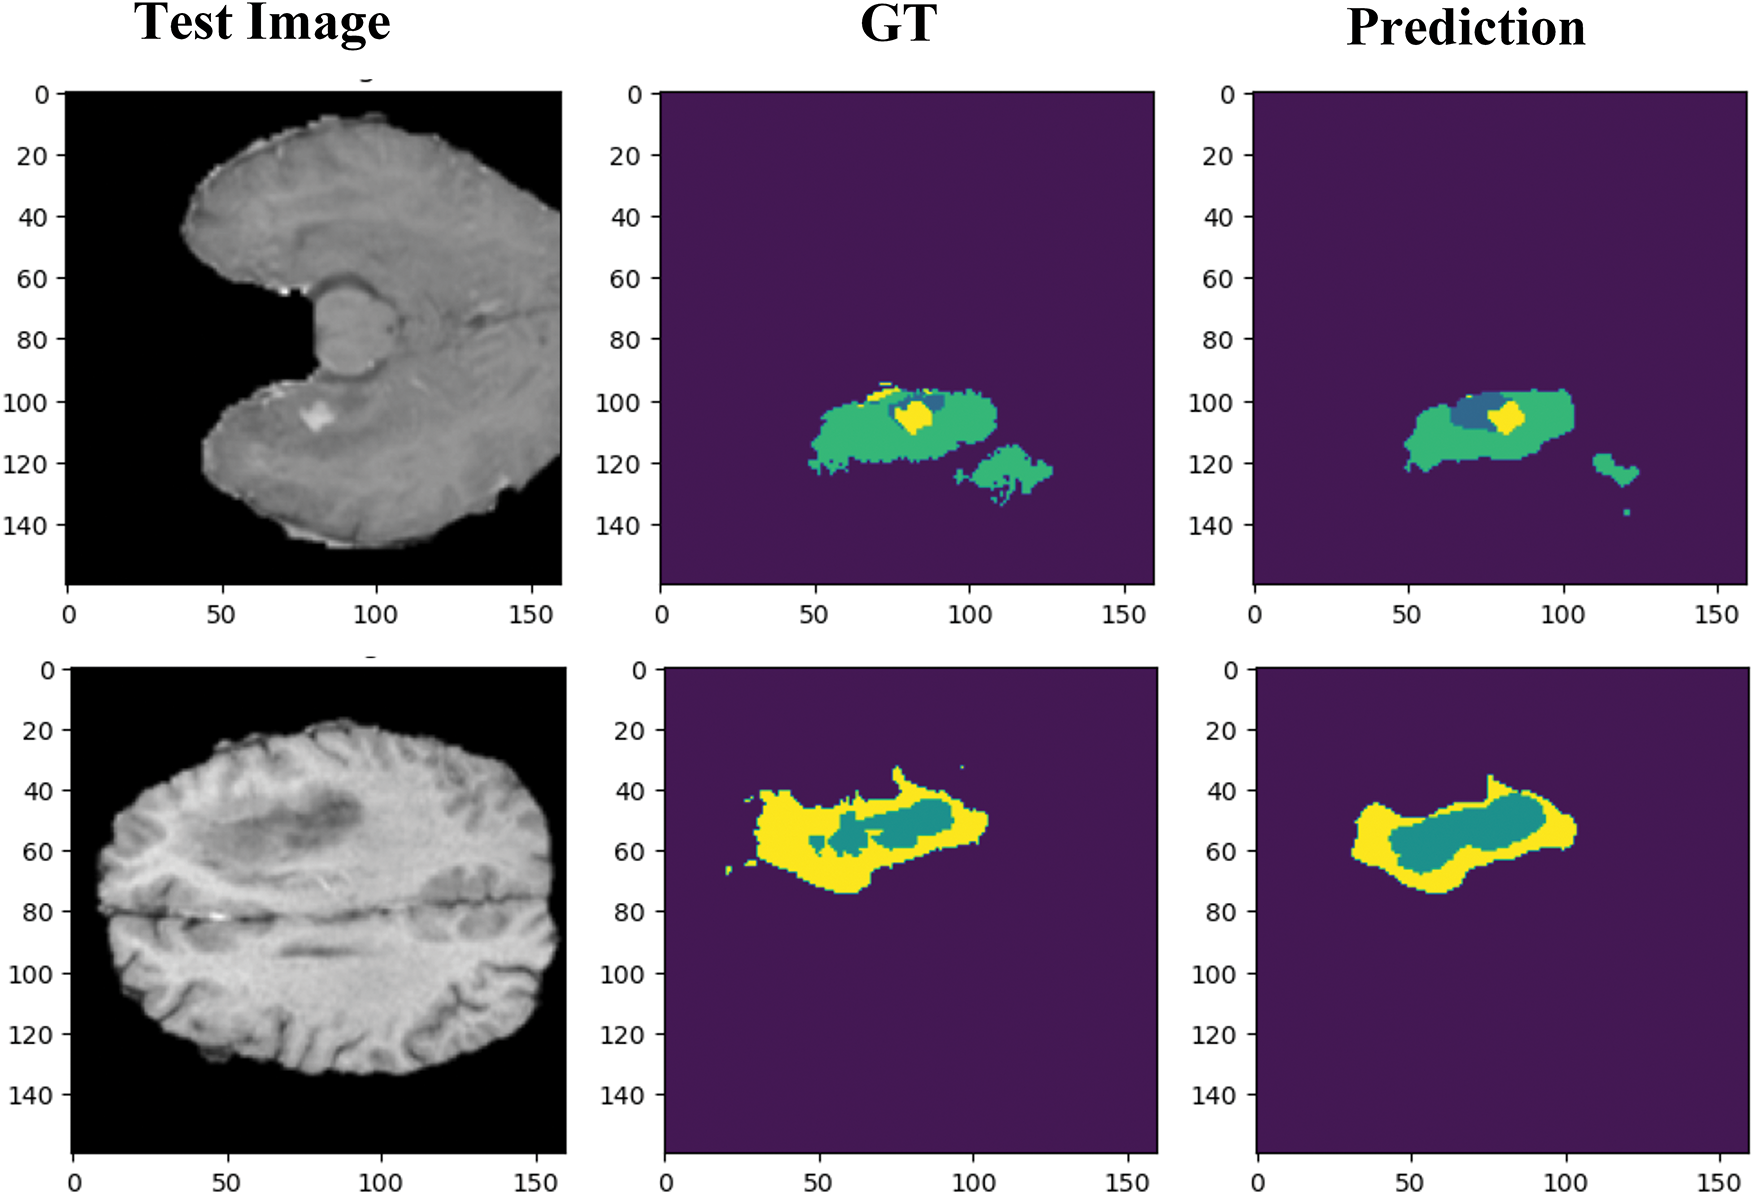
Figure 16: Segmentation challenges faced by dSEAT-UNet when segmenting narrow boundaries and small tumor regions
NET regions are especially difficult to segment due to their small size, diffuse and infiltrative nature, and low contrast against surrounding tissues. These characteristics often result in misclassification or under-segmentation. Unlike ET regions, NETs lack distinct intensity information in conventional MRI modalities, making them difficult to distinguish even for human experts.
The model’s underperformance in these regions may also come from its limited ability to capture fine intensity variations or its insufficient sensitivity to weak boundaries. In some cases, these regions were completely missed or partially segmented, which can critically impact the overall tumor characterization.
To address these challenges, future improvements could include:
• Refining the attention mechanisms to enhance sensitivity to weak gradients and boundary regions.
• Incorporating domain-specific priors, such as anatomical constraints or tumor growth patterns.
• Applying post-processing techniques like Conditional Random Fields (CRFs) or morphological operations to sharpen segmentation outputs.
• Training with dedicated loss functions, e.g., boundary loss or focal loss, suitable for underrepresented regions.
By including and analyzing these failure cases, we provide a more realistic picture of the model’s behavior in clinical settings and identify areas where further optimization is needed for robust, tumor-subregion-level segmentation.
5.6 Clinical Applicability and Future Integration
While dSEAT-UNet demonstrates promising results on benchmark datasets, its deployment in clinical settings presents several challenges that require future exploration. Integration into radiology workflows would require compatibility with clinical imaging systems such as PACS, robust inference speed suitable for real-time use, and output formats interpretable by clinicians. Enhancing the model’s explainability, through visual interpretability tools like attention heatmaps, could further facilitate clinician trust and adoption.
In addition, rigorous validation across diverse clinical cohorts and institutions is essential to ensure generalizability. Both retrospective analyses using real patient scans and prospective evaluation within clinical workflows will be needed to assess model robustness, safety, and usability. These steps, along with adherence to regulatory guidelines (e.g., FDA, CE), will be key to translating this research into a deployable clinical solution. Future work will focus on addressing these practical and regulatory challenges.
This study proposed dSEAT-UNet, a novel 3D brain tumor segmentation model that enhances the conventional 3D U-Net by integrating a deep ResNet-based encoder and squeeze-and-excitation (SE) attention mechanisms within the skip connections. The ResNet encoder improves semantic representation while maintaining stable training, and the SE blocks adaptively recalibrate features, leading to better generalization. These design enhancements collectively contributed to significant performance gains, especially in segmenting complex tumor regions across benchmarks datasets.
Additionally, the integration of Gabor filter banks into the encoder contributed to improved texture-aware feature extraction. This enhancement enabled the model to capture low-level, transformation-invariant features and mitigate texture interference, particularly in irregular tumor boundaries. These contributions facilitated faster convergence during early training and improved segmentation accuracy in small and complex tumor regions.
Our experiments on the BraTS 2020 dataset demonstrated that dSEAT-UNet obtained dice scores of 0.881 for Whole tumor (WT), 0.846 for Tumor core (TC), and 0.819 for Enhancing tumor (ET), outperforming several state-of-the-art models. The model’s generalizability was further confirmed on the BraTS 2021 dataset, maintaining strong performance across test cases.
Despite these promising results, challenges remain in accurately segmenting small or diffuse subregions, particularly under the presence of real-world imaging artifacts such as noise, motion blur, and inter-slice inconsistencies. Moreover, the model’s computational demand is considerable, given the complexity of its components, which limited training to a batch size of one and constrained the input volume size due to GPU memory limitations.
To improve practical applicability, future work will explore testing dSEAT-UNet on external clinical datasets from local hospitals to evaluate performance under varying MRI conditions, scanner types, and artifact scenarios. This validation step is critical for understanding the model’s real-world robustness and clinical reliability. Furthermore, lightweight versions of the model will be investigated using techniques such as model pruning, quantization, and knowledge distillation to reduce computational overhead and make the model more suitable for deployment in resource-limited clinical environments.
In terms of architectural innovation, future extensions will explore deformable convolutions, boundary-aware refinement modules, and hybrid CNN-transformer designs. These additions aim to enhance global context modeling and boundary localization. Further improvements in preprocessing including bias field correction, deep-learning-based denoising, and advanced data augmentation will support the model’s ability to handle diverse clinical data.
Overall, the proposed dSEAT-UNet demonstrates strong potential as a reliable and accurate solution for 3D brain tumor segmentation. Ongoing efforts to validate and optimize the model across diverse settings will be crucial to its successful integration into real-world clinical workflows.
Acknowledgement: The authors thank the National Science and Technology Council (NSTC) of the Republic of China, Taiwan, for financially supporting this research.
Funding Statement: The authors thank the National Science and Technology Council (NSTC) of the Republic of China, Taiwan, for financially supporting this research under Contract No. NSTC 112-2637-M-131-001.
Author Contributions: The authors confirm contribution to the paper as follows: Study Conceptualization: Nisar Ahmad, Yao-Tien Chen; Data Collection, Experiments: Nisar Ahmad; Results Analysis and Discussion: Nisar Ahmad, Yao-Tien Chen, Khursheed Aurangzeb; Supervision: Yao-Tien Chen; Writing, Editing: Nisar Ahmad; Draft Review: Yao-Tien Chen, Nisar Ahmad, Khursheed Aurangzeb. All authors reviewed the results and approved the final version of the manuscript.
Availability of Data and Materials: The datasets used in this study are two publicly available brain tumor datasets (BraTS 2020 (https://www.kaggle.com/datasets/awsaf49/brats20-dataset-training-validation) and BraTS 2021 (https://www.kaggle.com/datasets/dschettler8845/brats-2021-task1) (accessed on 20 June 2025)), which were downloaded from Kaggle. The preprocessed data versions utilized in this study are not publicly available but are available from the corresponding author upon request.
Ethics Approval: Not applicable.
Conflicts of Interest: The authors declare no conflicts of interest to report regarding the present study.
Appendix A Gabor Filter Mathematical Formulation and Parameters
This appendix provides the mathematical background and configuration details of the Gabor filter used in this study. The filter’s core formulas are shown in Eqs. (A1)–(A3). Table A1 defines the parameters and their roles, along with the optimized values selected during experimentation.
These wavelets can be described mathematically in the following Eqs. (A1)–(A3).
Appendix B Squeeze and Excitation (SE) Attention Formulation
This appendix details the squeeze phase of the SE attention mechanism. Table A2 describes the symbols used and formula is provided in Eq. (A4).
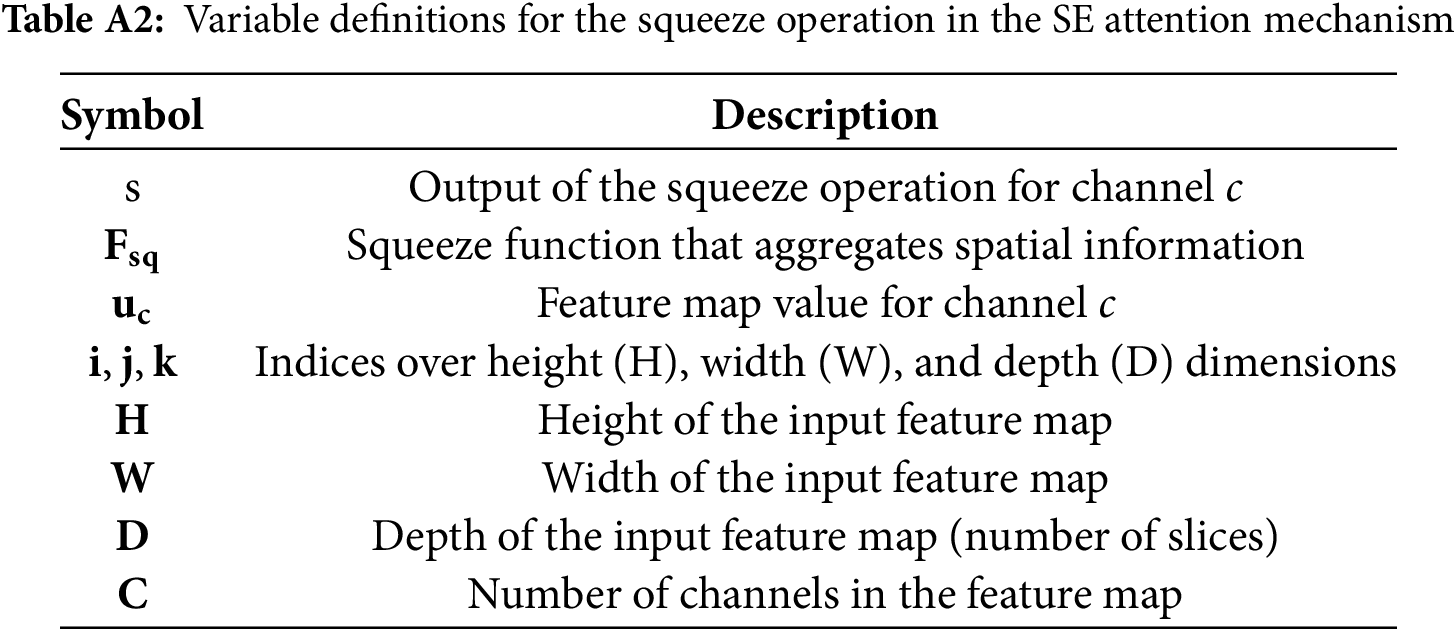
The squeeze operation that aggregates global spatial information is defined as,
References
1. Liu Z, Tong L, Chen L, Jiang Z, Zhou F, Zhang Q, et al. Deep learning based brain tumor segmentation: a survey. Complex Intell Syst. 2023;9(1):1001–26. doi:10.1007/s40747-022-00815-5. [Google Scholar] [CrossRef]
2. Feng X, Tustison NJ, Patel SH, Meyer CH. Brain tumor segmentation using an ensemble of 3D U-Nets and overall survival prediction using radiomic features. Front Comput Neurosci. 2020;14:25. doi:10.3389/fncom.2020.00025. [Google Scholar] [PubMed] [CrossRef]
3. Zhang D, Huang G, Zhang Q, Han J, Han J, Wang Y, et al. Exploring task structure for brain tumor segmentation from multi-modality MR images. IEEE Trans Image Process. 2020;29:9032–43. doi:10.1109/TIP.2020.3023609. [Google Scholar] [PubMed] [CrossRef]
4. Imtiaz T, Rifat S, Fattah SA, Wahid KA. Automated brain tumor segmentation based on multi-planar superpixel level features extracted from 3D MR images. IEEE Access. 2020;8:25335–49. doi:10.1109/access.2019.2961630. [Google Scholar] [CrossRef]
5. Shen S, Sandham W, Granat M, Sterr A. MRI fuzzy segmentation of brain tissue using neighborhood attraction with neural-network optimization. IEEE Trans Inf Technol Biomed. 2005;9(3):459–67. doi:10.1109/titb.2005.847500. [Google Scholar] [PubMed] [CrossRef]
6. Wang Y, Chen J, Bai X. Gradient-assisted deep model for brain tumor segmentation by multi-modality MRI volumes. Biomed Signal Process Control. 2023;85:105066. doi:10.1016/j.bspc.2023.105066. [Google Scholar] [CrossRef]
7. Gooya A, Pohl KM, Bilello M, Cirillo L, Biros G, Melhem ER, et al. GLISTR: glioma image segmentation and registration. IEEE Trans Med Imaging. 2012;31(10):1941–54. doi:10.1109/tmi.2012.2210558. [Google Scholar] [PubMed] [CrossRef]
8. Zhou S, Nie D, Adeli E, Yin J, Lian J, Shen D. High-resolution encoder-decoder networks for low-contrast medical image segmentation. IEEE Trans Image Process. 2020;29:461–75. doi:10.1109/TIP.2019.2919937. [Google Scholar] [PubMed] [CrossRef]
9. Zhou T, Canu S, Vera P, Ruan S. Latent correlation representation learning for brain tumor segmentation with missing MRI modalities. IEEE Trans Image Process. 2021;30:4263–74. doi:10.1109/TIP.2021.3070752. [Google Scholar] [PubMed] [CrossRef]
10. Kia M, Sadeghi S, Safarpour H, Sadeghi E, Shamsi M, Moghaddam HS, et al. Innovative fusion of VGG16, MobileNet, EfficientNet, AlexNet, and ResNet50 for MRI-based brain tumor identification. Iran J Comput Sci. 2025;8:185–215. doi:10.1007/s42044-024-00216-6. [Google Scholar] [CrossRef]
11. Wu B, Zhang F, Xu L, Shen S, Shao P, Sun M, et al. Modality preserving U-Net for segmentation of multimodal medical images. Quant Imaging Med Surg. 2023;13(8):5242–57. doi:10.21037/qims-22-1367. [Google Scholar] [PubMed] [CrossRef]
12. He K, Zhang X, Ren S, Sun J. Delving deep into rectifiers: Surpassing human-level performance on ImageNet classification. In: Proceedings of the IEEE International Conference on Computer Vision; 2015 Dec 7–13; Santiago, Chile. [Google Scholar]
13. Mzoughi H, Njeh I, Slima MB, Ben Hamida A, Mhiri C, Mahfoudh KB. Towards a computer aided diagnosis (CAD) for brain MRI glioblastomas tumor exploration based on a deep convolutional neuronal networks (D-CNN) architectures. Multimed Tools Appl. 2021;80(1):899–919. doi:10.1007/s11042-020-09786-6. [Google Scholar] [CrossRef]
14. Ronneberger O, Fischer P, Brox T. U-Net: convolutional networks for biomedical image segmentation. In: Navab N, Hornegger J, Wells W, Frangi A, editors. Medical image computing and computer-assisted intervention-MICCAI 2015 (lecture notes in computer science). Vol. 9351. Cham, Switzerland: Springer; 2015. p. 234–41. doi:10.1007/978-3-319-24574-4_28. [Google Scholar] [CrossRef]
15. Long J, Shelhamer E, Darrell T. Fully convolutional networks for semantic segmentation. In: Proceedings of the 2015 IEEE Conference on Computer Vision and Pattern Recognition (CVPR); 2015 Jun 7–12; Boston, MA, USA. doi:10.1109/CVPR.2015.7298965. [Google Scholar] [CrossRef]
16. Çiçek Ö, Abdulkadir A, Lienkamp SS, Brox T, Ronneberger O. 3D U-Net: learning dense volumetric segmentation from sparse annotation. In: Ourselin S, Joskowicz L, Sabuncu M, Unal G, Wells W, editors. Medical image computing and computer-assisted intervention-MICCAI 2016 (lecture notes in computer science). Vol. 9901. Cham, Switzerland: Springer; 2016. p. 424–32. doi:10.1007/978-3-319-46723-8_49. [Google Scholar] [CrossRef]
17. Dai J, Qi H, Xiong Y, Li Y, Zhang G, Hu H, et al. Deformable convolutional networks. In: Proceedings of the IEEE International Conference on Computer Vision; 2017 Dec 25; Venice, Italy. doi:10.1109/ICCV.2017.89. [Google Scholar] [CrossRef]
18. Zhou Y, Ye Q, Qiu Q, Jiao J. Oriented response networks. In: Proceedings of the IEEE Conference on Computer Vision and Pattern Recognition; 2017 Jul 21–26; Honolulu, HI, USA. [Google Scholar]
19. Gabor D. Theory of communication. Part 1: the analysis of information. J Inst Electr Eng. 1946;93(26):429–41. doi:10.1049/ji-3-2.1946.0074. [Google Scholar] [CrossRef]
20. Gong X, Xia X, Zhu W, Zhang B, Doermann D, Zhuo L. Deformable Gabor feature networks for biomedical image classification. In: Proceedings of the IEEE/CVF Winter Conference on Applications of Computer Vision; 2021 Jan 3–8; Waikoloa, HI, USA. [Google Scholar]
21. Vaswani A, Shazeer N, Parmar N, Uszkoreit J, Jones L, Gomez AN, et al. Attention is all you need. arXiv:1706.03762. 2017. [Google Scholar]
22. Hatamizadeh A, Tang Y, Nath V, Yang D, Myronenko A, Landman B, et al. UNETR: transformers for 3D medical image segmentation. In: Proceedings of the IEEE/CVF Winter Conference on Applications of Computer Vision; 2022 Jan 3–8; Waikoloa, HI, USA. [Google Scholar]
23. Jiang Y, Zhang Y, Lin X, Dong J, Cheng T, Liang J. SwinBTS: a method for 3D multimodal brain tumor segmentation using Swin transformer. Brain Sci. 2022;12(6):797. doi:10.3390/brainsci12060797. [Google Scholar] [PubMed] [CrossRef]
24. Zhang J, Jiang Z, Dong J, Hou Y, Liu B. Attention gate ResU-Net for automatic MRI brain tumor segmentation. IEEE Access. 2020;8:58533–45. doi:10.1109/ACCESS.2020.2983075. [Google Scholar] [CrossRef]
25. Raza R, Ijaz Bajwa U, Mehmood Y, Waqas Anwar M, Hassan Jamal M. dResU-Net: 3D deep residual U-Net based brain tumor segmentation from multimodal MRI. Biomed Signal Process Control. 2022;79(4):103861. doi:10.1016/j.bspc.2022.103861. [Google Scholar] [CrossRef]
26. Wang W, Chen C, Ding M, Yu H, Zha S, Li J. TransBTS: multimodal brain tumor segmentation using transformer. In: Proceedings of the 24th International Conference-Medical Image Computing and Computer Assisted Intervention—MICCAI 2021; 2021 Sep 27–Oct 1; Strasbourg, France. doi:10.1007/978-3-030-87193-2_11. [Google Scholar] [CrossRef]
27. Chen W, Liu B, Peng S, Sun J, Qiao X. S3D-UNet: separable 3D U-Net for brain tumor segmentation. In: Crimi A, Bakas S, Kuijf H, Keyvan F, Reyes M, van Walsum T, editors. Brainlesion: glioma, multiple sclerosis, stroke and traumatic brain injuries (lecture notes in computer science). Vol. 11384. Cham, Switzerland: Springer; 2019. doi:10.1007/978-3-030-11726-9_32. [Google Scholar] [CrossRef]
28. Maji D, Sigedar P, Singh M. Attention Res-UNet with guided decoder for semantic segmentation of brain tumors. Biomed Signal Process Control. 2022;71:103077. doi:10.1016/j.bspc.2021.103077. [Google Scholar] [CrossRef]
29. Kia M. Attention-guided deep learning for effective customer loyalty management and multi-criteria decision analysis. Iran J Comput Sci. 2024;8(1):163–84. doi:10.1007/s42044-024-00215-7. [Google Scholar] [CrossRef]
30. Zhang J, Lv X, Zhang H, Liu B. AResU-Net: attention residual U-Net for brain tumor segmentation. Symmetry. 2020;12(5):1–15. doi:10.3390/SYM12050721. [Google Scholar] [CrossRef]
31. Cao Y, Zhou W, Zang M, An D, Feng Y, Yu B. MBANet: a 3D convolutional neural network with multi-branch attention for brain tumor segmentation from MRI images. Biomed Signal Process Control. 2023;80(2):104296. doi:10.1016/j.bspc.2022.104296. [Google Scholar] [CrossRef]
32. Akbar AS, Fatichah C, Suciati N. Single level UNet3D with multipath residual attention block for brain tumor segmentation. J King Saud Univ Comput Inf Sci. 2022;34(6):3247–58. doi:10.1016/j.jksuci.2022.03.022. [Google Scholar] [CrossRef]
33. Liu H, Huo G, Li Q, Guan X, Tseng M-L. Multiscale lightweight 3D segmentation algorithm with attention mechanism: brain tumor image segmentation. Expert Syst Appl. 2023;214(1):119166. doi:10.1016/j.eswa.2022.119166. [Google Scholar] [CrossRef]
34. Li C, Zhang F, Du Y, Li H. Classification of brain tumor types through MRIs using parallel CNNs and firefly optimization. Sci Rep. 2022;12(1):12420. doi:10.1038/s41598-024-65714-w. [Google Scholar] [PubMed] [CrossRef]
35. Yuan L, Chen Y, Wang T, Yu W, Shi Y, Jiang Z, et al. Tokens-to-token ViT: training vision transformers from scratch on ImageNet. In: Proceedings of the 2021 IEEE/CVF International Conference on Computer Vision (ICCV); 2021 Oct 10–17; Montreal, QC, Canada. doi:10.1109/iccv48922.2021.00060. [Google Scholar] [CrossRef]
36. Menze BH, Jakab A, Bauer S, Kalpathy-Cramer J, Farahani K, Kirby J, et al. The multimodal brain tumor image segmentation benchmark (BRATS). IEEE Trans Med Imaging. 2015;34(10):1993–2024. doi:10.1109/TMI.2014.2377694. [Google Scholar] [PubMed] [CrossRef]
37. Bakas S, Akbari H, Sotiras A, Bilello M, Rozycki M, Kirby JS, et al. Advancing the cancer genome atlas glioma MRI collections with expert segmentation labels and radiomic features. Sci Data. 2017;4(1):170117. doi:10.1038/sdata.2017.117. [Google Scholar] [PubMed] [CrossRef]
38. Bakas S, Reyes M, Jakab A, Bauer S, Rempfler M, Crimi A, et al. Identifying the best machine learning algorithms for brain tumor segmentation, progression assessment, and overall survival prediction in the BRATS challenge. arXiv:1811.02629. 2018. [Google Scholar]
39. Bauer S, Wiest R, Nolte L-P, Reyes M. A survey of MRI-based medical image analysis for brain tumor studies. Phys Med Biol. 2013;58(13):R97–129. doi:10.1088/0031-9155/58/13/R97. [Google Scholar] [PubMed] [CrossRef]
40. Hu Z, Zhuang Q, Xiao Y, Wu G, Shi Z, Chen L, et al. MIL normalization—prerequisites for accurate MRI radiomics analysis. Comput Biol Med. 2021;133:104403. doi:10.1016/j.compbiomed.2021.104403. [Google Scholar] [PubMed] [CrossRef]
41. Patro SGK, Sahu KK. Normalization: a preprocessing stage. Int Adv Res J Sci Eng Technol. 2015;2(3):20–2. doi:10.17148/iarjset.2015.2305. [Google Scholar] [CrossRef]
42. Shao J, Chen S, Zhou J, Zhu H, Wang Z, Brown M. Application of U-Net and optimized clustering in medical image segmentation: a review. Comput Model Eng Sci. 2023;136(3):2173–219. doi:10.32604/cmes.2023.025499. [Google Scholar] [CrossRef]
43. Reyes AA, Paheding S, Deo M, Audette M. Gabor filter-embedded U-Net with transformer-based encoding for biomedical image segmentation. In: Li X, Lv J, Huo Y, Dong B, Leahy RM, Li Q, editors. Multiscale multimodal medical imaging. MMMI 2022 (lecture notes in computer science). Vol. 13594. Cham, Switzerland: Springer; 2022. doi:10.1007/978-3-031-18814-5_8. [Google Scholar] [CrossRef]
44. He K, Zhang X, Ren S, Sun J. Deep residual learning for image recognition. In: Proceedings of the 2016 IEEE Conference on Computer Vision and Pattern Recognition (CVPR); Las Vegas, NV, USA. doi:10.1109/cvpr.2016.90. [Google Scholar] [CrossRef]
45. Sudre CH, Li W, Vercauteren T, Ourselin S, Cardoso MJ. Generalised dice overlap as a deep learning loss function for highly unbalanced segmentations. In: Proceedings of the Deep Learning in Medical Image Analysis and Multimodal Learning for Clinical Decision Support: Third International Workshop, DLMIA 2017, and 7th International Workshop, ML-CDS 2017; 2017 Sep 14; Québec City, QC, Canada. doi:10.1007/978-3-319-67558-9_28. [Google Scholar] [PubMed] [CrossRef]
46. Bakas S, Akbari H, Sotiras A, Bilello M, Rozycki M, Kirby J, et al. Segmentation labels and radiomic features for the pre-operative scans of the TCGA-LGG collection. The Cancer Imaging Archive. 2017;286. doi:10.7937/K9/TCIA.2017.GJQ7R0EF. [Google Scholar] [CrossRef]
47. Lin T-Y, Goyal P, Girshick R, He K, Dollar P. Focal loss for dense object detection. IEEE Trans Pattern Anal Mach Intell. 2018;42(2):318–27. doi:10.1109/TPAMI.2018.2858826. [Google Scholar] [PubMed] [CrossRef]
48. Ballestar LM, Vilaplana V. Brain tumor segmentation using 3D-CNNs with uncertainty estimation. arXiv:2009.12188. 2020. [Google Scholar]
49. Messaoudi H, Belaid A, Allaoui ML, Zetout A, Allili MS, Tliba S, et al. Efficient embedding network for 3D brain tumor segmentation. In: Crimi A, Bakas S, editors. BrainLes 2020. Brainlesion: glioma, multiple sclerosis, stroke and traumatic brain injuries. BrainLes 2020. Lecture notes in computer science. Vol. 12658. Cham, Switzerland: Springer; 2021. doi:10.1007/978-3-030-72084-1_23. [Google Scholar] [CrossRef]
50. Wang F, Jiang R, Zheng L, Meng C, Biswal B. 3D U-net based brain tumor segmentation and survival days prediction. Lect Notes Comput Sci. 2020;11992(9255):131–41. doi:10.1007/978-3-030-46640-4_13. [Google Scholar] [CrossRef]
51. Colman J, Zhang L, Duan W, Ye X. DR-Unet104 for multimodal MRI brain tumor segmentation. In: Proceedings of the Brainlesion: Glioma, Multiple Sclerosis, Stroke and Traumatic Brain Injuries: 6th International Workshop, BrainLes 2020, Held in Conjunction with MICCAI 2020; 2020 Oct 4; Lima, Peru. doi:10.1007/978-3-030-72087-2_36. [Google Scholar] [CrossRef]
52. Tang J, Li T, Shu H, Zhu H. Variational-autoencoder regularized 3D MultiResUNet for the BraTS, 2020 brain tumor segmentation. In: Crimi A, Bakas S, editors. Brainlesion: glioma, multiple sclerosis, stroke and traumatic brain injuries. BrainLes 2020. Lecture notes in computer science. Vol. 12659. Cham, Switzerland: Springer; 2021. doi:10.1007/978-3-030-72087-2_38. [Google Scholar] [CrossRef]
53. Abd-Ellah MK, Awad AI, Khalaf AAM, Ibraheem AM. Automatic brain-tumor diagnosis using cascaded deep convolutional neural networks with symmetric U-Net and asymmetric residual-blocks. Sci Rep. 2024;14(1):9501. doi:10.1038/s41598-024-59566-7. [Google Scholar] [PubMed] [CrossRef]
54. Ren T, Honey E, Rebala H, Sharma A, Chopra A, Kurt M. An optimization framework for processing and transfer learning for the brain tumor segmentation. arXiv:2402.07008. 2024. [Google Scholar]
55. Kleppe A, Skrede OJ, De Raedt S, Liestøl K, Kerr DJ, Danielsen HE. Designing deep learning studies in cancer diagnostics. Nat Rev Cancer. 2021;21(3):199–211. doi:10.1038/s41568-020-00327-9. [Google Scholar] [PubMed] [CrossRef]
Cite This Article
 Copyright © 2025 The Author(s). Published by Tech Science Press.
This work is licensed under a Creative Commons Attribution 4.0 International License , which permits unrestricted use, distribution, and reproduction in any medium, provided the original work is properly cited.
 Downloads
 Citation Tools