
 Submit a Paper
 Propose a Special lssue
 Open Access
ARTICLE
Computational Modeling to Predict Conservative Treatment Outcome for Patients with Plaque Erosion: An OCT-Based Patient-Specific FSI Modeling Study
1 School of Biological Science and Medical Engineering, Southeast University, Nanjing, 210096, China
2 State Key Laboratory of Frigid Zone Cardiovascular Diseases (SKLFZCD), Key Laboratory of Myocardial Ischemia, Chinese
Ministry of Education, Department of Cardiology of the Second Affiliated Hospital, Harbin Medical University, 246 Xuefu
Road, Nangang District, Harbin, 150086, China
3 Mathematical Sciences Department, Worcester Polytechnic Institute, Worcester, MA 01609, USA
4 The Cardiovascular Research Foundation, Columbia University, New York, NY 10022, USA
5 Department of Cardiac Surgery, Shandong Second Provincial General Hospital, Jinan, 250022, China
6 School of Science, Nanjing University of Posts and Telecommunications, Nanjing, 210023, China
7 First Affiliated Hospital, Nanjing Medical University, Nanjing, 210029, China
* Corresponding Authors: Dalin Tang. Email: ; Bo Yu. Email:
# These authors contributed equally to this work
Computer Modeling in Engineering & Sciences 2025, 144(2), 1249-1270. https://doi.org/10.32604/cmes.2025.067039
Received 23 April 2025; Accepted 08 July 2025; Issue published 31 August 2025
 View Full Text
 Download PDF
Abstract
Image-based computational models have been used for vulnerable plaque progression and rupture predictions, and good results have been reported. However, mechanisms and predictions for plaque erosion are under-investigated. Patient-specific fluid-structure interaction (FSI) models based on optical coherence tomography (OCT) follow-up data from patients with plaque erosion and who received conservative antithrombotic treatment (using medication, no stenting) to identify risk factors that could be used to predict the treatment outcome. OCT and angiography data were obtained from 10 patients who received conservative antithrombotic treatment. Five participants had worse outcomes (WOG, stenosis severity ≥ 70% at one-year follow-up), while the other five had better outcomes (BOG, stenosis severity < 70% at one-year follow-up). Patient-specific 3D FSI models were constructed to obtain morphological and biomechanical risk factor values (a total of nine risk factors) for comparison and prediction. A logistic regression model was used to identify optimal predictors with the best treatment outcome prediction accuracies. Our results indicated that the combination of wall shear stress (WSS), lipid percent, and thrombus burden was the best group predictor according to the mean area under the curve (AUC) of 0.96 (90% confidence interval = (0.85, 1.00)). WSS was the best single predictor with mean AUC = 0.70 (90% confidence interval = (0.20, 1.00)). Thrombus burden was the only risk factor showing statistically significant group difference, suggesting its crucial role in the outcomes of conservative anti-thrombotic therapy. This pilot study indicated that integrating morphological and biomechanical risk factors could improve treatment outcome prediction accuracy in patients with plaque erosion compared to predictions using single predictors. Large-scale patient studies are needed to further validate our findings.Graphic Abstract
Keywords
Image-based computational models have been used for vulnerable plaque progression and rupture predictions, and good results have been reported [1–5]. Initial research showed that flow wall shear stress (WSS) and local fluid dynamics are associated with plaque progression [6–10]. Mechanisms and predictions for plaque erosion are under-investigated. Some pioneering computational fluid dynamics (CFD) papers for plaque erosion have been published, indicating that WSS conditions may be related to plaque erosion [11–14]. Fluid-structure interaction (FSI) models for plaque erosion are lacking in the current literature. With the acceptance of conservative antithrombotic therapy (non-stenting) for patients with plaque erosion, clinicians, patients, and researchers faced two challenging questions: (1) Which patient group would get a better outcome from the conservative treatment? (2) Which risk factors and prediction methods could be used to predict the treatment outcome? The objective of this paper was to introduce FSI models based on optical coherence tomography (OCT) follow-up data from patients with plaque erosion and who received conservative antithrombotic treatment (using medication, no stenting) to identify risk factors that could be used to predict the treatment outcome. This would also help to differentiate patients with better outcome (BOG, diameter stenosis (DS) < 70% at follow-up, no stenting needed) from patients with worse outcome (WOG, DS ≥ 70% at follow-up, revascularization interventions such as stenting still needed). We would like to show that combining multiple risk factors could have better prediction accuracy for treatment outcome than single predictors. We are advancing the CFD approach for plaque erosion in the current literature to the FSI approach so that our investigation would include both structural stress and strain and flow shear stress, and may lead to a better understanding of mechanisms linked to plaque erosion. The research is novel since our methods would help to predict clinical conservative treatment outcomes and identify patients who may benefit from conservative medication treatment without stenting.
Acute coronary syndrome (ACS) involves a group of conditions where blood flow to the heart muscle is suddenly reduced, leading to unstable angina and possible heart attack (myocardial infarction), with major underlying mechanisms including plaque rupture and plaque erosion [15]. Autopsy and intravascular OCT studies revealed that ~30% to 40% of ACS cases were caused by plaque erosion [16–18]. Stenting is a popular treatment strategy for ACS patients. However, it is expensive and involves high risk and subsequent complications. One big question for clinical practice is: can doctors use conservative treatment (using medication) for ACS patients and avoid stenting? Conservative antithrombotic therapy is a treatment that prevents or treats blood clots or thrombosis using medications without stenting. OCT has a high resolution (10~20 µm), allowing it to identify plaque erosion and rupture in vivo [19]. Plaque erosion usually has intact fibrous caps, large lumen diameters, and white thrombus with rich platelets, different from plaque rupture [20–23]. Several studies suggested that conservative anti-thrombotic therapy without stenting may be effective for ACS patients with plaque erosion [22,24]. Prati et al. compared ACS patients with plaque erosion treated with conservative anti-thrombotic therapy and stenting and their findings revealed that both groups remained asymptomatic at the two-year follow-up, indicating that conservative anti-thrombotic therapy was as efficacious as stenting [25].
The EROSION study (Effective Anti-Thrombotic Therapy Without Stenting: Intravascular Optical Coherence Tomography-Based Management in Plaque Erosion, PIs: Yu & Jia) was a single-center project to assess the safety and feasibility of conservative treatment avoiding stenting in erosion-related ACS culprit lesions [26,27]. At one-year follow-up, while some patients exhibited favorable clinical outcomes (DS < 70%), some other patients had less desirable outcomes (DS > 70%) and needed treatment with stenting [26,27]. In response to the inconsistent outcome of conservative anti-thrombotic therapy on patients, clinicians and researchers would like to find patient characteristics and risk factors to identify patients who are more suitable to receive conservative treatment. Computational models and predictive methods to achieve those goals are lacking in the current literature.
Image-based modeling for vulnerable plaques has become an important and useful tool in recent years, and a good review can be found in [28]. Patient-specific 3D FSI carotid and coronary plaque models based on in vivo image data were first introduced in the early 2000 s with new mesh generation and geometry pre-shrink and stretch techniques [29]. It has been demonstrated that plaque regions experiencing high plaque wall stress (PWS) correlated with compositional alterations indicative of increased plaque vulnerability, whereas areas with low WSS were associated with more plaque growth in progressing regions [2,12,13,30]. Plaque erosion became a more active research focus recently due to the development of OCT imaging, which made identification of plaque erosion in vivo possible, and a recent review can be found in [28,31–33]. McElroy et al. constructed CFD models of 17 patients with OCT-defined plaque erosion to investigate the flow environment permissive for plaque erosion and found that the majority of erosions occurred where the endothelium is exposed to elevated flow shear stress conditions [11]. Franck reviewed recent literature related to plaque erosion and indicated that neutrophils may promote thrombosis and platelet activation [34]. Hakim et al. investigated the correlation between plaque erosion and WSS by comparing eroded plaques and stable plaques, and their results showed that eroded plaques had higher WSS and WSS gradient [31]. Ahmed et al. used CFD models to investigate the relationship between endothelial shear stress (ESS) and culprit lesion proinflammatory/proatherogenic cell activities in coronary plaque erosion in patients with ACS. Their results showed that eroded plaques were associated with low ESS and high ESS gradient [32]. Those findings demonstrated the importance of biomechanics for erosion research. It should be noted that CFD models were limited to fluid mechanics, and the role of solid mechanics and the interaction between solid and fluid models could not be included. Plaque erosion happens on the lumen surface where both flow forces and structural stress/strain are involved in the process. FSI models could be used for the study of plaque erosion to find out if structure stress and strain do play a role in the erosion process. Wang et al. constructed OCT-based patient-specific FSI models with different thrombus volumes and showed that thrombus volume would elevate WSS and impact coronary hemodynamics and solid mechanics conditions [35]. Zhu et al. made 3D FSI models of coronary plaques with and without erosion and tried to predict which plaques were likely to have erosion. They found that plaques with erosion had higher WSS values (in agreement with prior publications). In addition to that, their results indicated that combining biomechanical and morphological risk factors could help better identify patients with potential plaque erosion [33]. These studies suggested that solid mechanics also has an impact on plaque erosion, which provided a new perspective for the study of plaque erosion.
In this paper, FSI models were introduced based on OCT follow-up data from patients who received conservative antithrombotic therapy to identify risk factors which could be used to differentiate patients who do not need further stenting (DS < 70% at follow up, conservative treatment considered successful) from patients who still need revascularization interventions such as stent implantation (DS ≥ 70% at follow up). In the current clinical guidelines, a stenosis degree of 70% is recommended as the standard for whether patients need to undergo revascularization interventions such as stent implantation. While DS < 70% is for the No-Stenting group and DS ≥ 70% is for the Stenting group, for simplicity, Better-Outcome-Group (BOG, DS < 70%) and Worse-Outcome-Group (WOG, DS ≥ 70%) were used in this paper as shorter notations. Ten sets of OCT and angiography data (5 for BOG; 5 for WOG) were obtained at baseline and one-year follow-up. Patient-specific 3D FSI models were constructed using baseline data to obtain morphological and biomechanical risk factor values for comparison and prediction analyses. A logistic regression model was used to identify optimal predictors for conservative antithrombotic therapy outcome and obtain prediction accuracies.
This study has the following novelties: (1) To the best of our knowledge, this should be the first publication identifying morphological and biomechanical risk factors and using them to predict the conservative treatment for patients with plaque erosion, which will further optimize secondary prevention for patients with plaque erosion; (2) By using patient-specific 3D models with fluid-structure interactions, we demonstrated that combining morphological factors, plaque wall stress and strain and wall shear stress would lead to better prediction accuracies for treatment outcome, which provides evidence for the development of intervention strategy in the mechanical perspective. This is only a pilot study and further large-scale studies are needed to validate our findings.
2.1 OCT and Angiography Data Acquisition and Patient Group Division
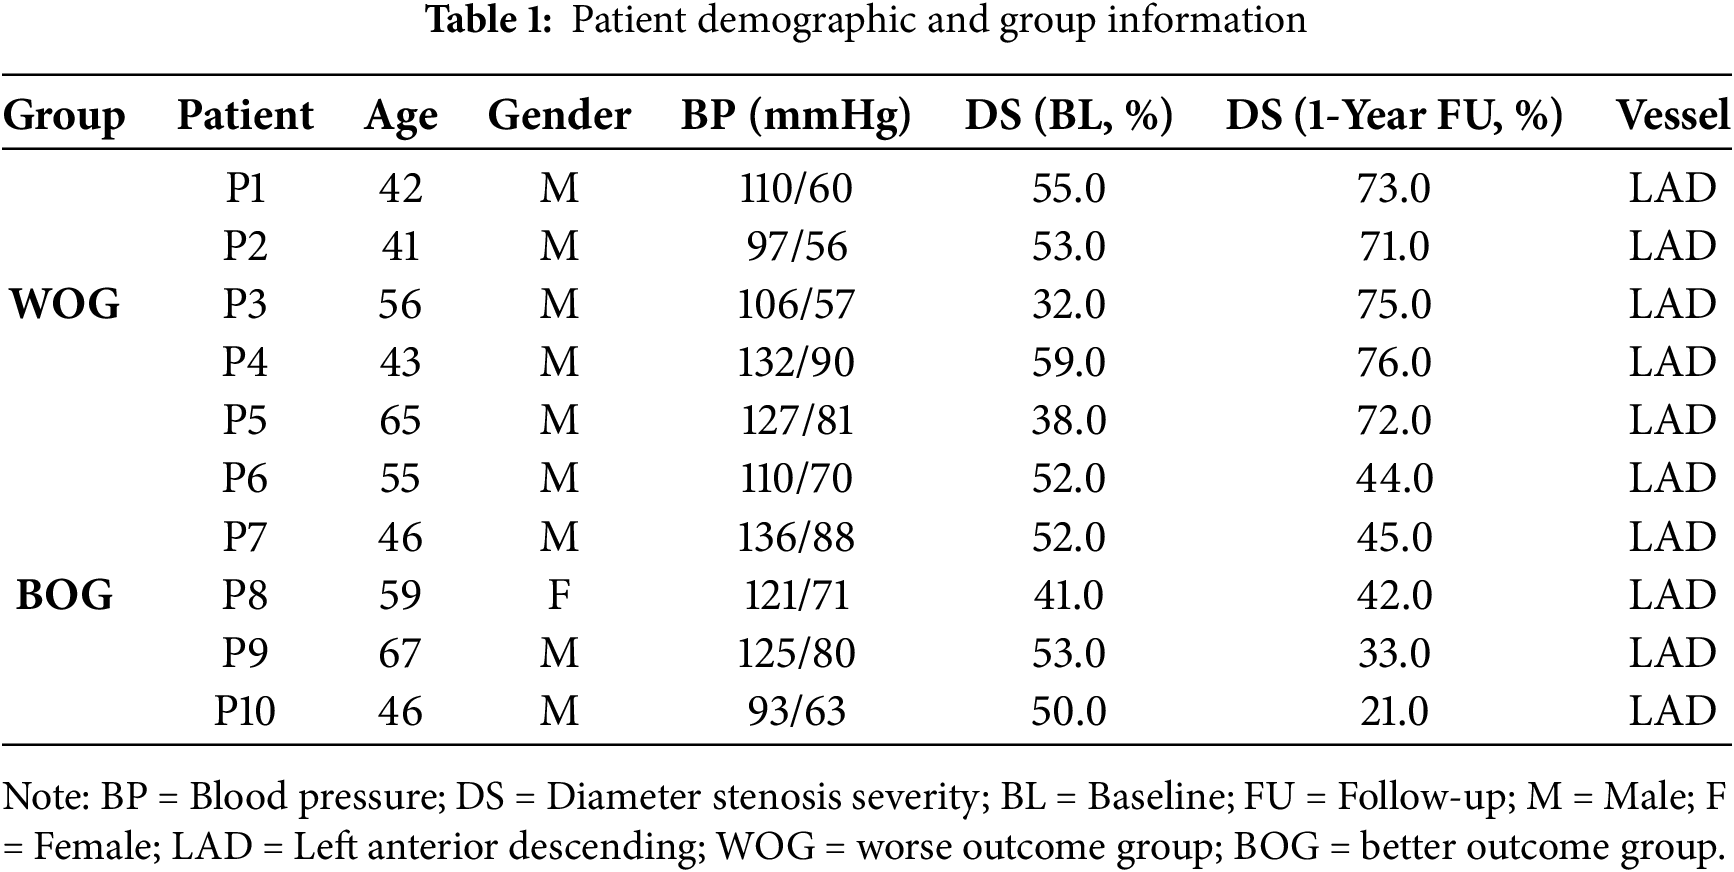
De-identified data from 10 patients (mean age 52; 9 m) with plaque erosion and treated by conservative anti-thrombotic therapy using medication without stenting (called conservative treatment thereafter) were selected from the EROSION study for this research. The inclusion criteria of the EROSION study were briefly summarized as follows: (1) ACS patients aged 18 to 75 years; (2) Culprit lesion located in a native coronary artery; (3) Thrombolysis in myocardial infarction (TIMI) flow grade 3 with diameter stenosis < 70% on angiography; (4) Plaque erosion identified by OCT. Angiography and OCT imaging were performed at baseline and one-year follow-up. For the 10 patients, 5 patients had diameter stenosis (DS) ≥ 70% (WOG, or Stenting-Group, see an example in Fig. 1) and received further treatment with stenting, while the other 5 had diameter stenosis (DS) < 70% (BOG, or No-Stenting-Group, see an example in Fig. 2) and the conservative treatment was considered successful. Patient demographic data are shown in Table 1. All participants in the EROSION study provided written informed consent, and the study was approved by the Ethics Committee of the Second Affiliated Hospital of Harbin Medical University (Harbin, China, IRB number KY2014-001).
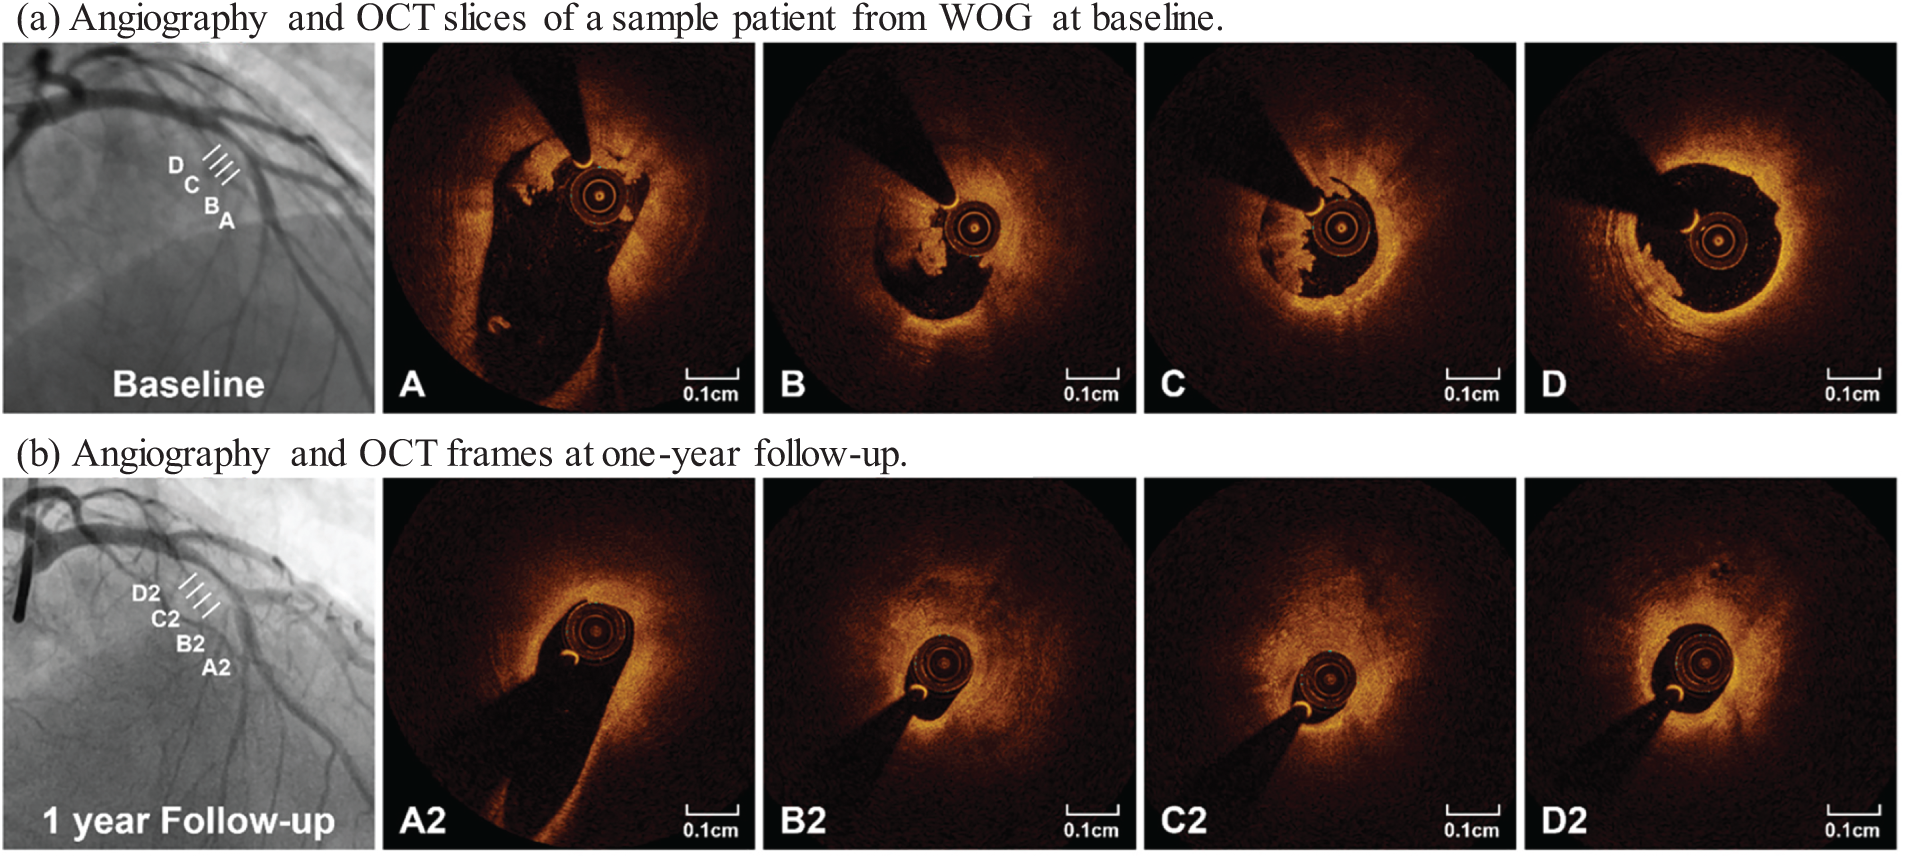
Figure 1: Angiography and selected OCT slices from a sample patient in WOG. At one-year follow-up, angiogram (lower left) showed a 75% stenosis, and serial OCT images showed significant lesion progression. A–D and A2–D2 marked matched OCT slice locations
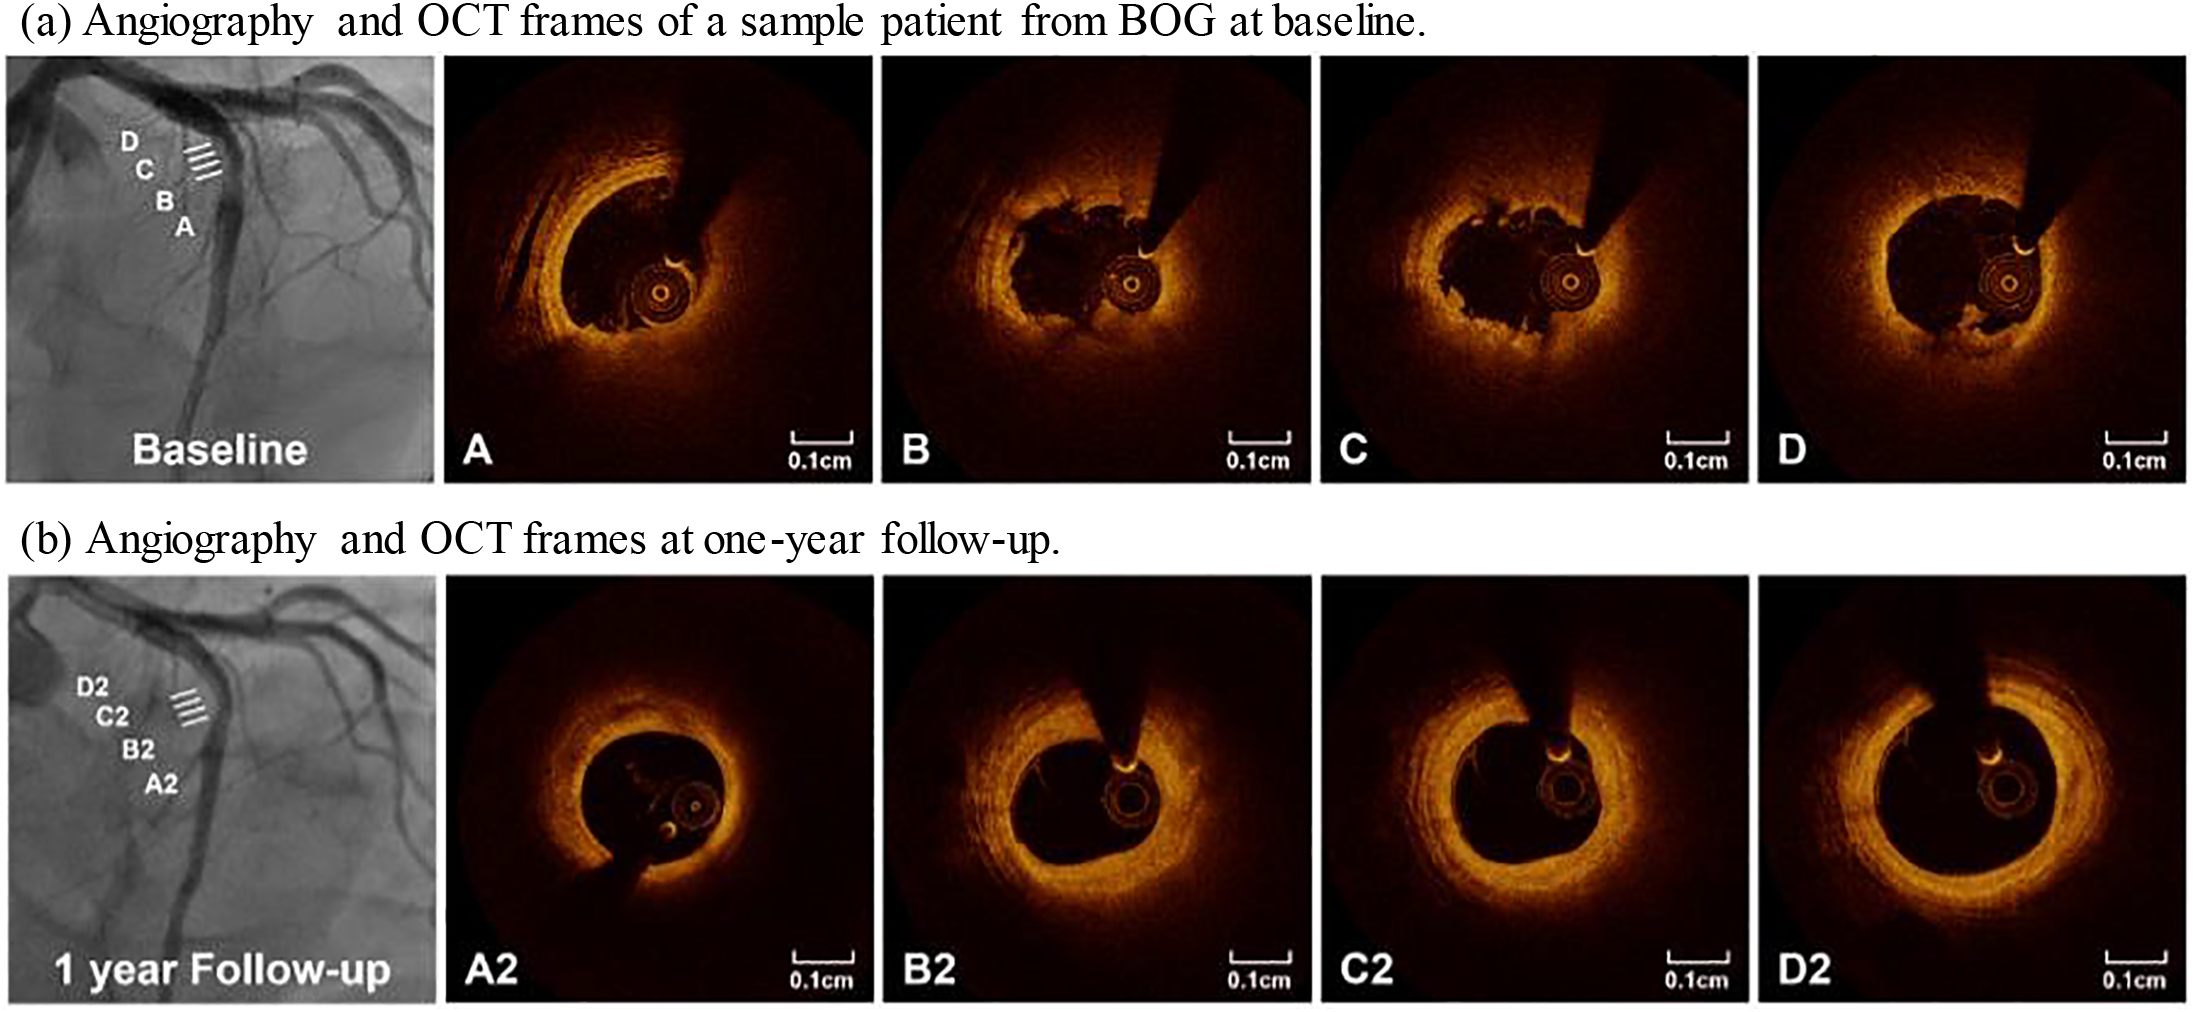
Figure 2: Angiography and selected OCT slices from a patient in BOG. At one-year follow-up, angiogram (lower left) showed a 42% stenosis, and serial OCT images showed significant lesion progression. A–D and A2–D2 marked matched OCT slice locations
2.2 Image Acquisition, Segmentation, Co-Registration, and 3D Reconstruction
The OCT images were acquired in the culprit vessel with a frequency-domain OCT system (C7-XR or ILUMIEN OPTIS, St. Jude Medical, St. Paul, MN, USA) with the OCT catheter (C7 Dragonfly™; LightLab Imaging Inc./St Jude Medical, Westford, MA, USA). The OCT catheter was deployed in the distal segment of the infarct-related vessel to the culprit lesion. The images were acquired using automated pullback at 20 mm/s (C7-XR, 100 frames/s) or 36 mm/s (ILUMIEN OPTIS, 180 frames/s). OCT image analysis was performed using the Offline Review Workstation (St. Jude Medical). OCT plaque segmentation was done manually by two independent investigators blinded to each other using the plaque classification method proposed by Jia and his co-workers [17]. For segmentations from the two people with differences greater than 10%, a senior investigator (also blind to the previous two) would perform the segmentation again. The final results were then determined by the senior investigator. Segmented vessel tissue and plaque components included fibrous tissues, lipid core, calcification and thrombus. In addition to these components of atherosclerotic plaques, lumen and media-adventitia boundary (external elastic membrane, EEM) were also segmented and used as vessel inner- and outer-boundaries, respectively.
The vessel centerline was obtained from X-ray angiography using ImageJ v1.54h software. Coronary angiography was performed through a radial or femoral access with the use of a 6F or 7F sheath after intracoronary administration of 100–200 mg nitroglycerin.
Co-registration between OCT slices and angiogram was conducted to identify OCT slice locations on the vessel centerline. That was necessary for 3D FSI model construction. Details of the co-registration process can be found in [35]. Primarily, the information on vessel branches and stenosis was used for registration. Based on branch information, the OCT slices with branches were identified and matched with the corresponding locations of the branches in the angiogram. The same method was applied to assist in co-registration between OCT and angiogram based on stenosis (vessel narrowing) information. For vessel 3D reconstruction, segmented OCT slices were placed vertically along the centerline using co-registration information [29]. In practice, once the locations of the beginning and ending slices were determined, all the other slices would be placed evenly along the vessel centerline. Fig. 3 shows selected OCT slices from a sample plaque with corresponding contours segmented based on the criteria above. Since this is a follow-up study investigating the outcome of patients who received conservative treatment (called anti-thrombotic therapy), we removed thrombus components from the baseline OCT images to get the vessel geometry after anti-thrombotic treatment [27].
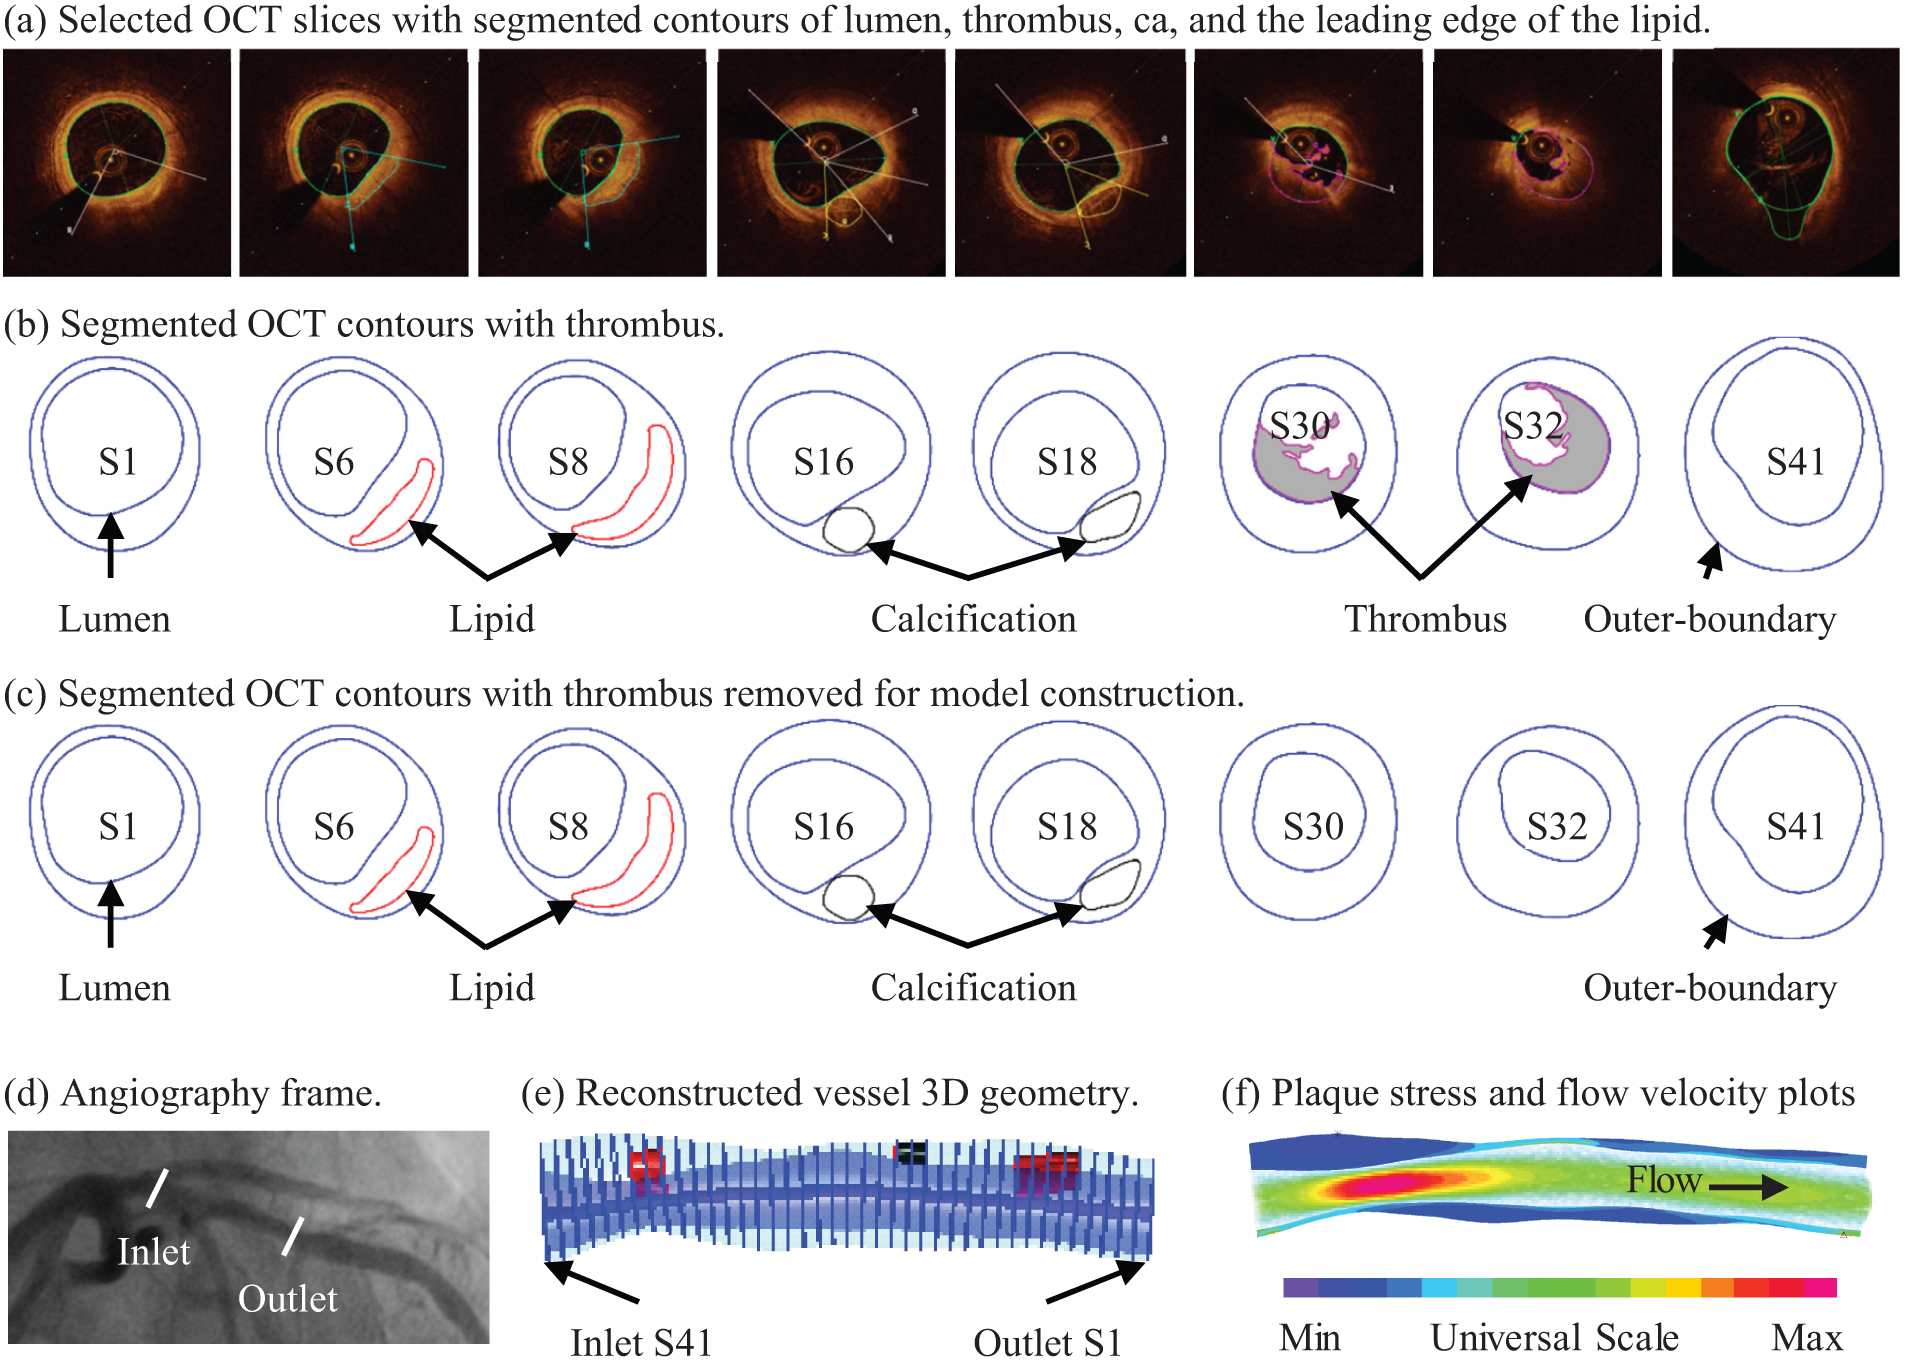
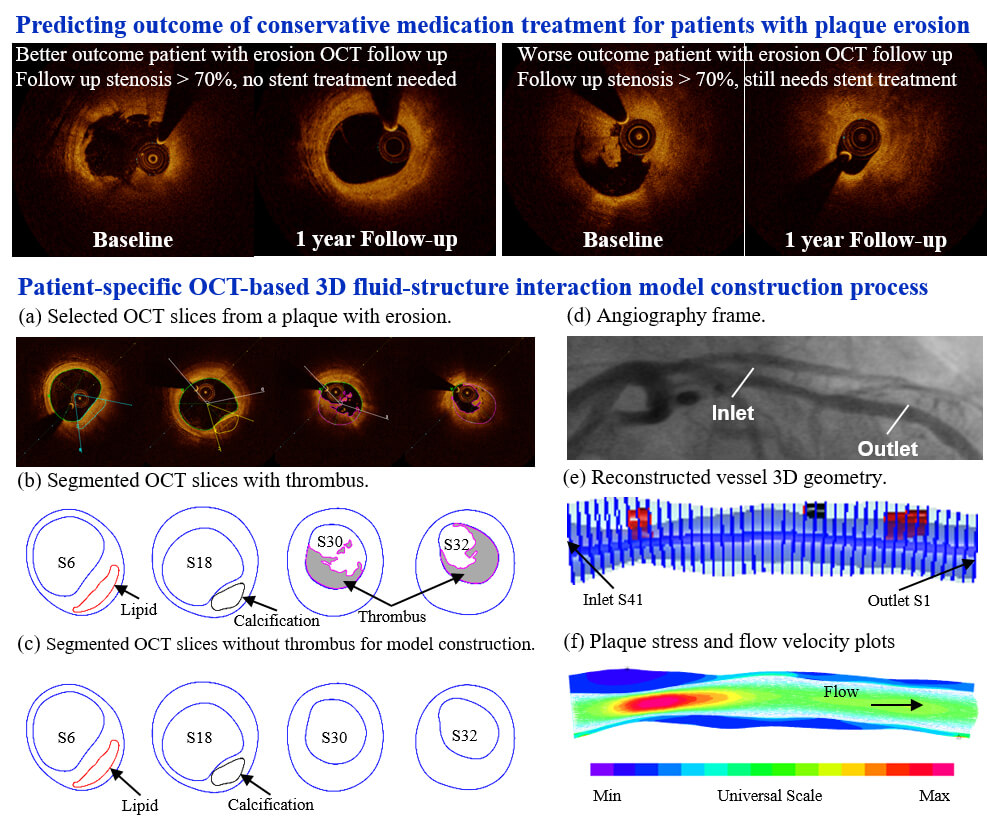
Figure 3: Selected OCT slices and angiography from a sample patient with plaque erosion and 3D geometry reconstruction. (a) Selected OCT slices with segmented contours of the lumen, thrombus, calcification, and the leading edge of the lipid; (b) Segmented OCT contours with thrombus. (c) Segmented OCT contours with thrombus removed for model construction. (d) Angiography frame. (e) Reconstructed vessel 3D geometry. (f) Plaque stress and flow velocity plots. Green line: lipid contour; Blue line: vessel lumen and outer boundary; Magenta line: thrombus contour; Black line: calcification contour
2.3 The 3D FSI Model and Model Construction Procedures
In this study, 3D patient-specific FSI models were constructed to obtain plaque wall stress (PWS), plaque wall strain (PWSn), and wall shear stress (WSS) values for analysis and prediction of anti-thrombotic therapy outcome.
FSI models may help to investigate the impact of full biomechanics on the conservative antithrombotic therapy outcome without stenting. Plaque erosion happens on the lumen surface where plaques are exposed to the blood, and both flow forces and structural stress/strain may be involved in the erosion process. In the current literature, CFD models have been popular for plaque erosion investigation. However, CFD models only consider fluid mechanics, neglecting the role of solid mechanics and the interaction between solid and fluid models. Using FSI models for the study of plaque erosion, we are adding structural stress and strain in our investigation to find their roles in the erosion process. We could investigate all the risk factors (morphological, solid, and flow risk factors) which may influence the outcome of the conservative antithrombotic therapy treatment and identify those which could be used to predict the treatment outcome from the perspective of solid and fluid mechanics and plaque morphological characteristics.
For the structural models, vessel wall and plaque components were assumed to be hyperelastic, nearly incompressible, and homogeneous. Vessel fibrous tissues were assumed to be anisotropic, while plaque components (mainly lipid-rich core and calcification) were assumed to be isotropic. Modified Mooney-Rivlin material models were used to describe the material properties. The strain energy density functions are shown below:
where
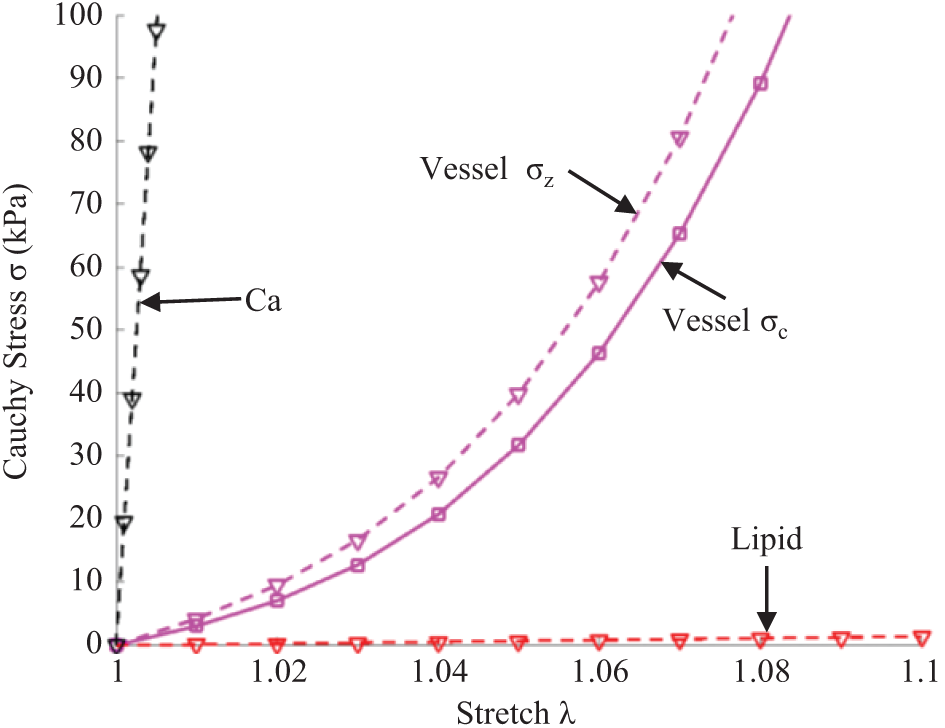
Figure 4: Stress-stretch curves derived from Mooney-Rivlin models of fibrous tissues, lipid, and calcification used in finite element modeling. σc: Circumferential stress; σz: Axial stress
For the flow model, blood was assumed to be laminar, viscous, incompressible, and Newtonian. No-slip boundary and force balance conditions were imposed on the blood-vessel and vessel-plaque component interfaces. The arbitrary Lagrangian-Eulerian Navier-Stokes equations were used in the model to handle the freely moving boundaries. The complete FSI model is given below [29]:
where
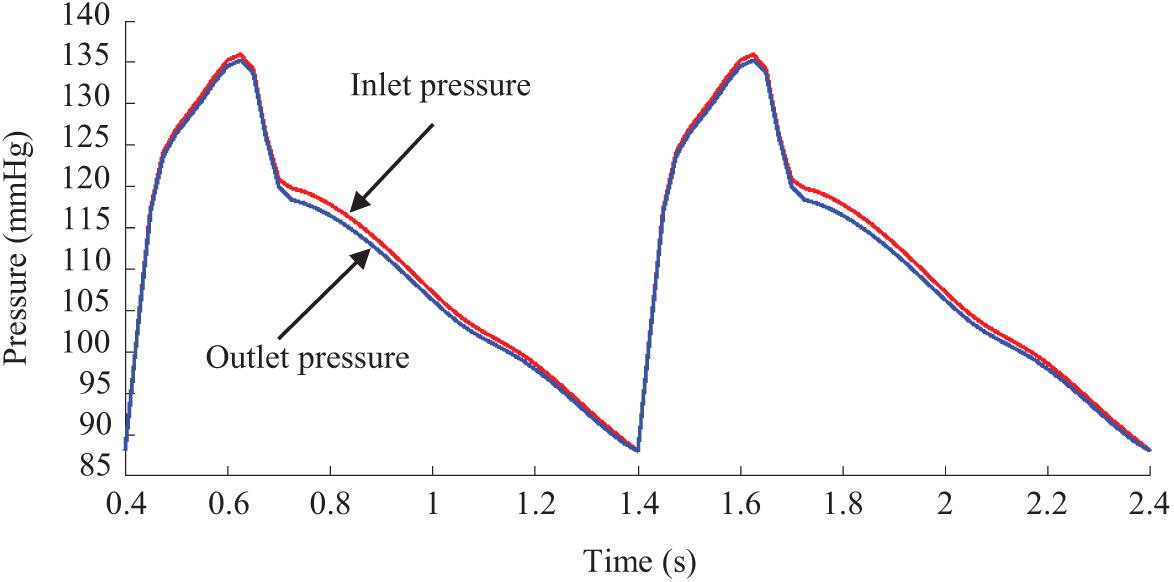
Figure 5: Pressure conditions imposed at the inlet and outlet for a sample patient
Since plaques have complex geometries with component inclusions, a finite element mesh could not be generated automatically by ADINA (Adina R & D, Watertown, MA, USA), which is a commercial software used to solve our FSI models. A finite volume component-fitting technique was introduced to generate a mesh for the plaque models in this paper [29]. With this technique, the 3D plaque domain was divided into some small “volumes” with regular geometries to fit different plaque components with irregular geometries. This made it possible for ADINA to generate a finite element mesh for our plaque models. Fig. 6 shows the process of component-fitting mesh generation using 2 slices containing one lipid core. First, slices 1 & 2 were divided into 3 matched layers, with the lipid core becoming part of the middle layer. The three layers were further divided into 8 parts (sometimes more if more components were present). Now, the vessel wall of the slice was divided into 24 parts. The two slices were then stacked vertically (as Fig. 6 shows, the real direction should be the vessel axial direction) to form “volumes”, with the corresponding parts in Slices 1 & 2 serving as the top and bottom of the small volume they formed. The process continues until all slices are used and the whole vessel is divided into many component-fitting small volumes. ADINA was then used to generate a finite element mesh for the calculation.

Figure 6: The process of component-fitting mesh generation. (a,b) Slices 1 and 2 with lipid core (red) and numerically-generated component-fitting curves and surfaces to form volumes; (c) Component-fitting volumes formed by stacking slices and connecting corresponding areas; (d) Component-fitting mesh generated with plaque component inclusion. The distance between two slices was enlarged for better viewing
Another technique we used was the preshrink-stretch process to obtain plaque no-load geometry for our models. Computer programs normally start from a no-load geometry with zero stress/strain conditions. However, OCT and angiography data were obtained under in vivo conditions with pressure and stress/strain distributions. Therefore, axial and circumferential shrinkage (plaque volume was conserved) were applied to obtain the zero-load state of the vessel segment so that the plaque could recover its in vivo state after applying axial stretch and blood pressure. Fig. 7 gives a flowchart of the iteration program for the pre-shrink-stretch process. Some details of the iteration program is as follows: (a) calculate the circumference C of inner-boundary in vivo before iteration; (b) assume 5% axial shrinkage, which will not be changed during the iteration process; (c) start from an initial radial shrinkage of inner-boundary
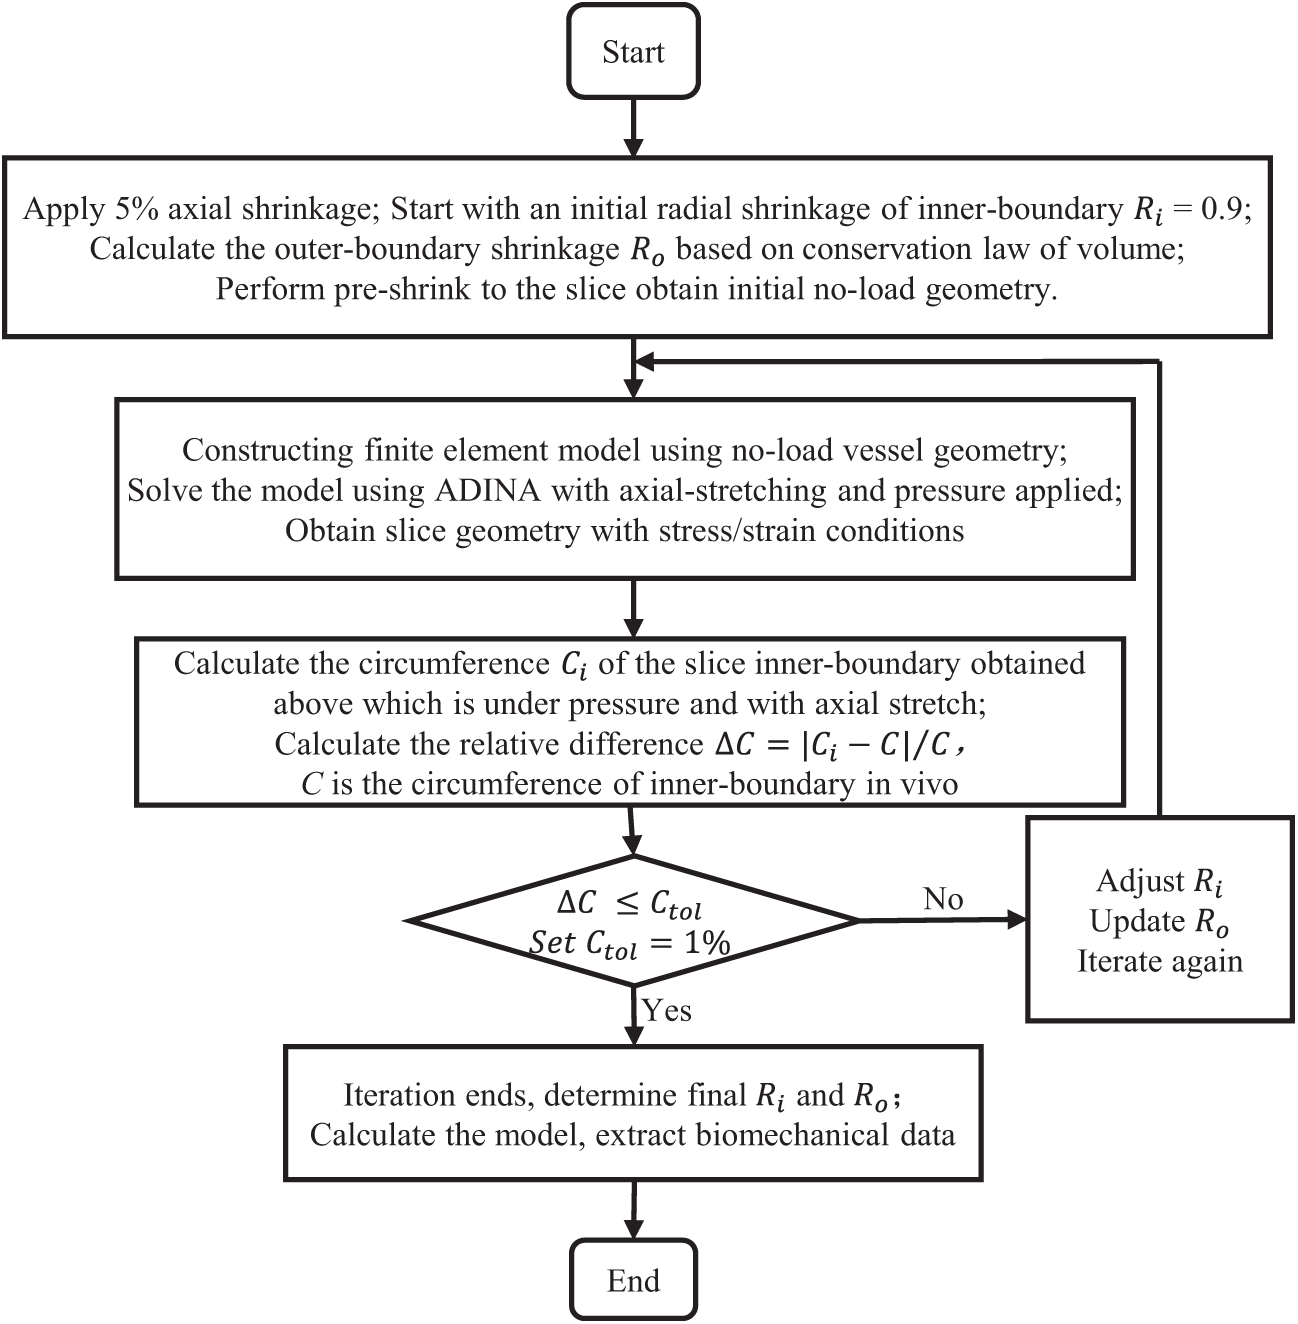
Figure 7: Flowchart of the preshrink-stretch process
A commercial finite element software, ADINA 9.6, was employed to solve the 3D FSI models using nonlinear incremental iterative procedures. Mesh analysis was performed by refining mesh density by 10% until changes in solutions became less than 2%. Solutions from the settled meshes were used to extract data for analyses.
2.4 Data Extraction, Comparison, and Correlation Analysis
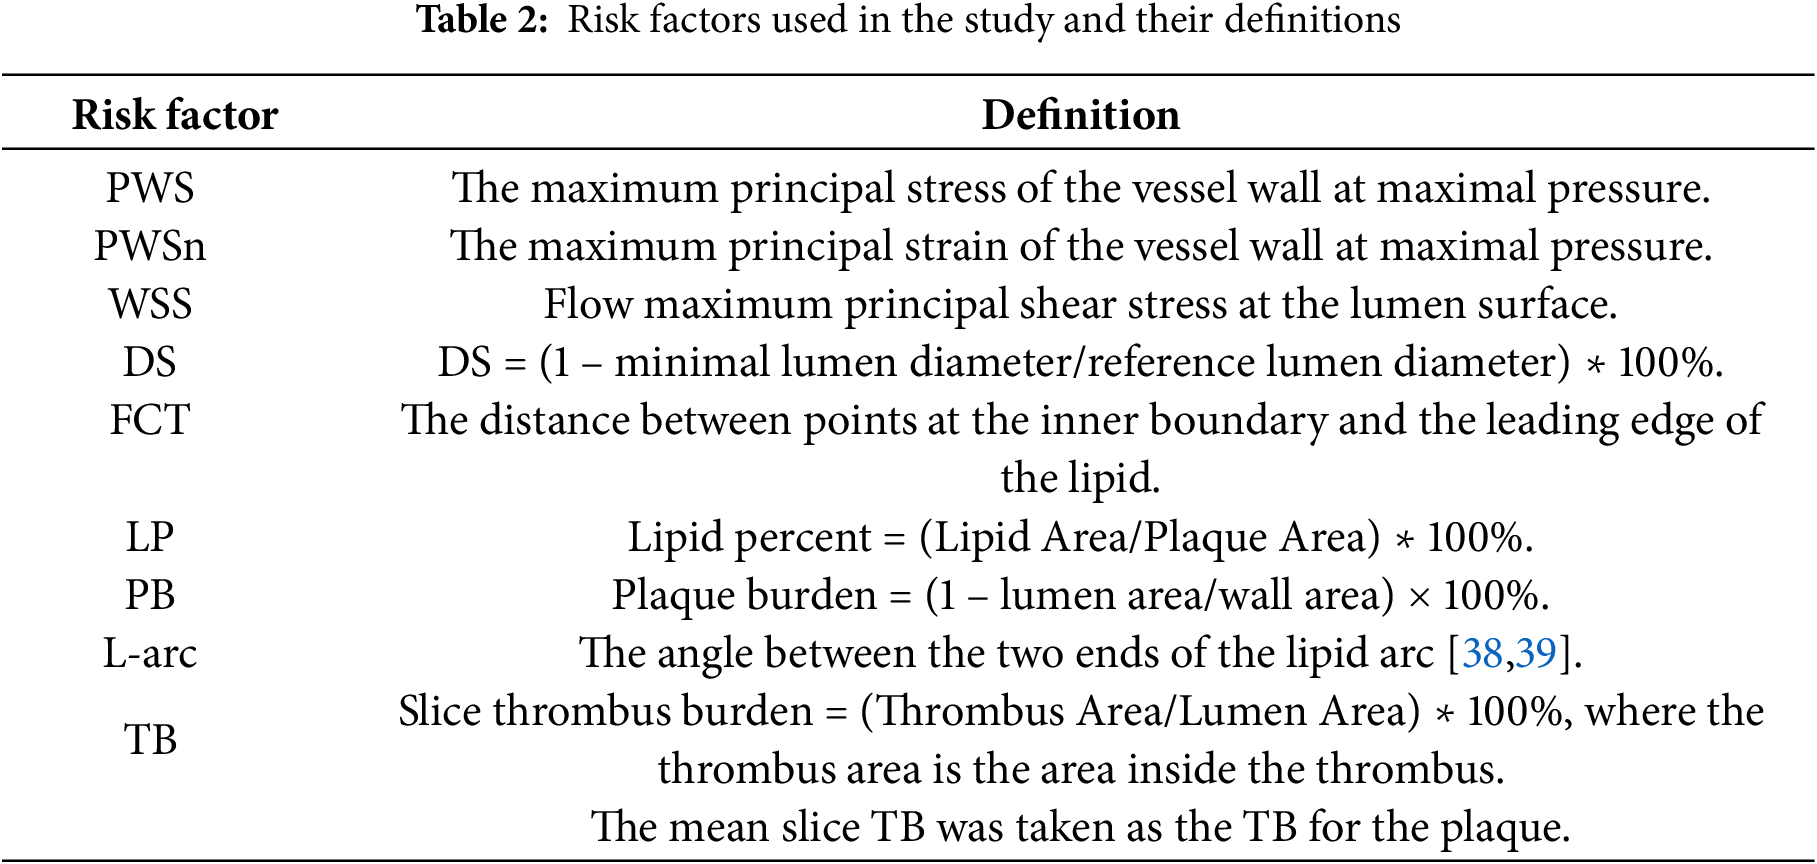
Once the solutions of the FSI models were obtained, morphological and biomechanical risk factor values were extracted for comparison and prediction analyses. We aimed to identify potential predictors based on their ability to predict conservative anti-thrombotic therapy outcome. With our past experiences for vulnerable plaque research and correlation analysis of risk factors and treatment outcome, the following nine risk factors were selected in our prediction analysis: maximum PWS, maximum PWSn, maximum WSS, diameter stenosis (DS) severity by angiography, thinnest fibrous cap thickness (FCT), maximum lipid percentage (LP), plaque burden (PB), maximum lipid angle (L-arc), and thrombus burden (TB) [38,39]. A large lipid core is known to be associated with plaque vulnerability. Lipid percentage and lipid angle are two measures of lipid core size. Definitions of these risk factors are shown in Table 2.
PWS, PWSn and WSS on the lumen surface were extracted from the FSI models using a Four-Quarter-Even-Spacing method illustrated by Fig. 8. Each slice was divided into 100 points and model results were extracted from these points for comparison and prediction use. The relative difference of a parameter values between two groups was calculated with the equation below:
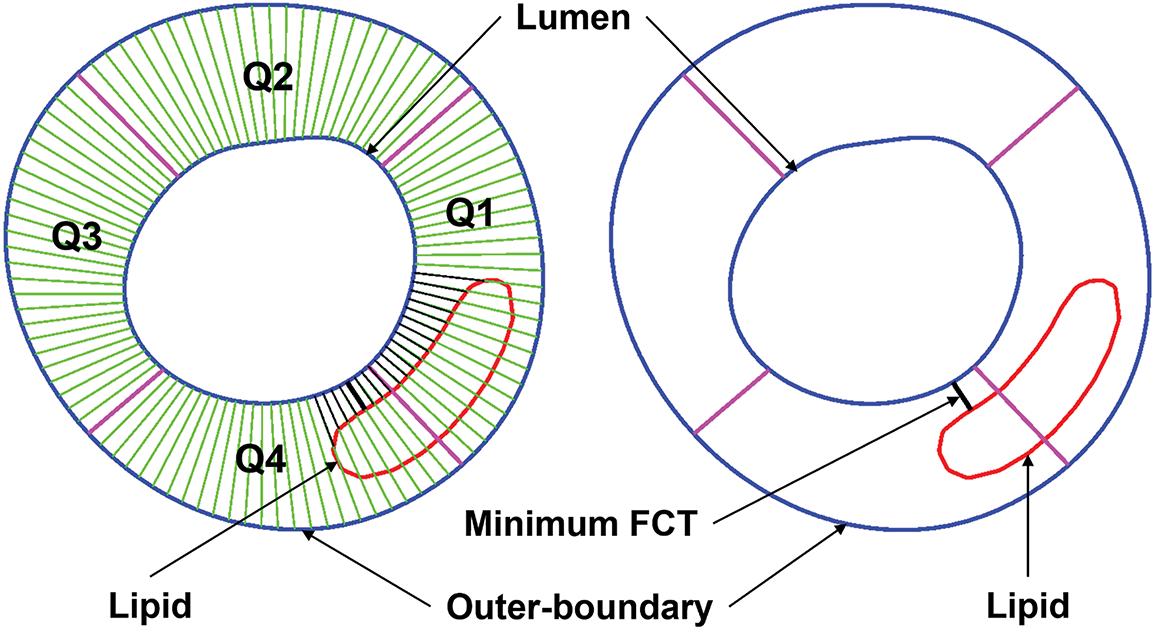
Figure 8: Sketch for the Four-Quarter-Even-Spacing method for data extraction showing definitions of quarters (Q1–Q4), minimum FCT, and lipid using a Four-Quarter-Even-Spacing method. FCT = fibrous cap thickness; Q = quarter
Spearman’s correlation analysis was applied to identify possible correlations between the risk factors and the anti-thrombotic therapy outcome, defined as the diameter stenosis severity by angiography at follow-up. The Kolmogorov-Smirnov test was used to test whether the data conformed to the normal distribution. To test for significant differences between the data of two groups, Student’s t test was used for normally distributed data, and the Wilcoxon rank sum test was used for data that significantly deviated from the normal distribution.
A logistic regression model was used to fit the predictor data and predict the binary status of the conservative anti-thrombotic therapy outcome. All patients in the study were assumed to be independent. Nine risk factors (Section 2.4) were selected as predictors in the prediction model. To limit model overfitting due to the small sample size, we restricted our analysis to models with at most three predictors, resulting in 9 single-predictor models, 36 two-predictor models, and 84 triple-predictor models. The best combination of predictors is the one whose model yields the highest prediction accuracy, as defined by the measure described below. Specifically, the logistic regression model was defined as:
where
To stabilize the prediction accuracy measures given the small sample size, we calculated the mean AUC value using repeated 5-fold cross-validation. Specifically, in each 5-fold cross-validation process, the data were randomly divided into 5 parts. Each time, 4 parts (8 patients) were used as training data to fit the predictive model, while the remaining part (2 patients) served as testing data. Each part served once as the testing set. To reduce potential bias and overfitting from a single random split, the 5-fold cross-validation was repeated 10 times, and the mean AUC was computed across all iterations. To further address the small sample size and assess the statistical reliability of the prediction accuracy, we obtained a 90% bootstrap confidence interval for the mean AUC value by performing 100 rounds of bootstrap resampling.
3.1 Combining Multiple Predictors Led to Better Prediction Accuracy Than Single Predictors
Table 3 gave the mean AUC values averaged over 100 rounds of bootstrap random-sample simulations, and the results showed that the combination of multiple risk factors had better prediction accuracies than single predictors. The combination of WSS, LP, and TB had the best prediction AUC [Mean AUC = 0.96, 90% confidence interval = (0.85, 1.00)]. PWSn + WSS + FCT and PWS + PWSn + WSS were the second and third best combination predictors. WSS was the single predictor with the best AUC [Mean AUC = 0.70, 90% confidence interval = (0.20, 1.00)] among the nine predictors considered. Fig. 9 gives the receiver operating characteristic (ROC) curves for the best combination and single predictors based on the prediction outcomes from all 100 rounds of bootstrap random-sample simulations. The results indicated that using FSI models and combining morphological and biomechanical factors may provide better prediction accuracies for conservative anti-thrombotic therapy outcomes than single predictors.
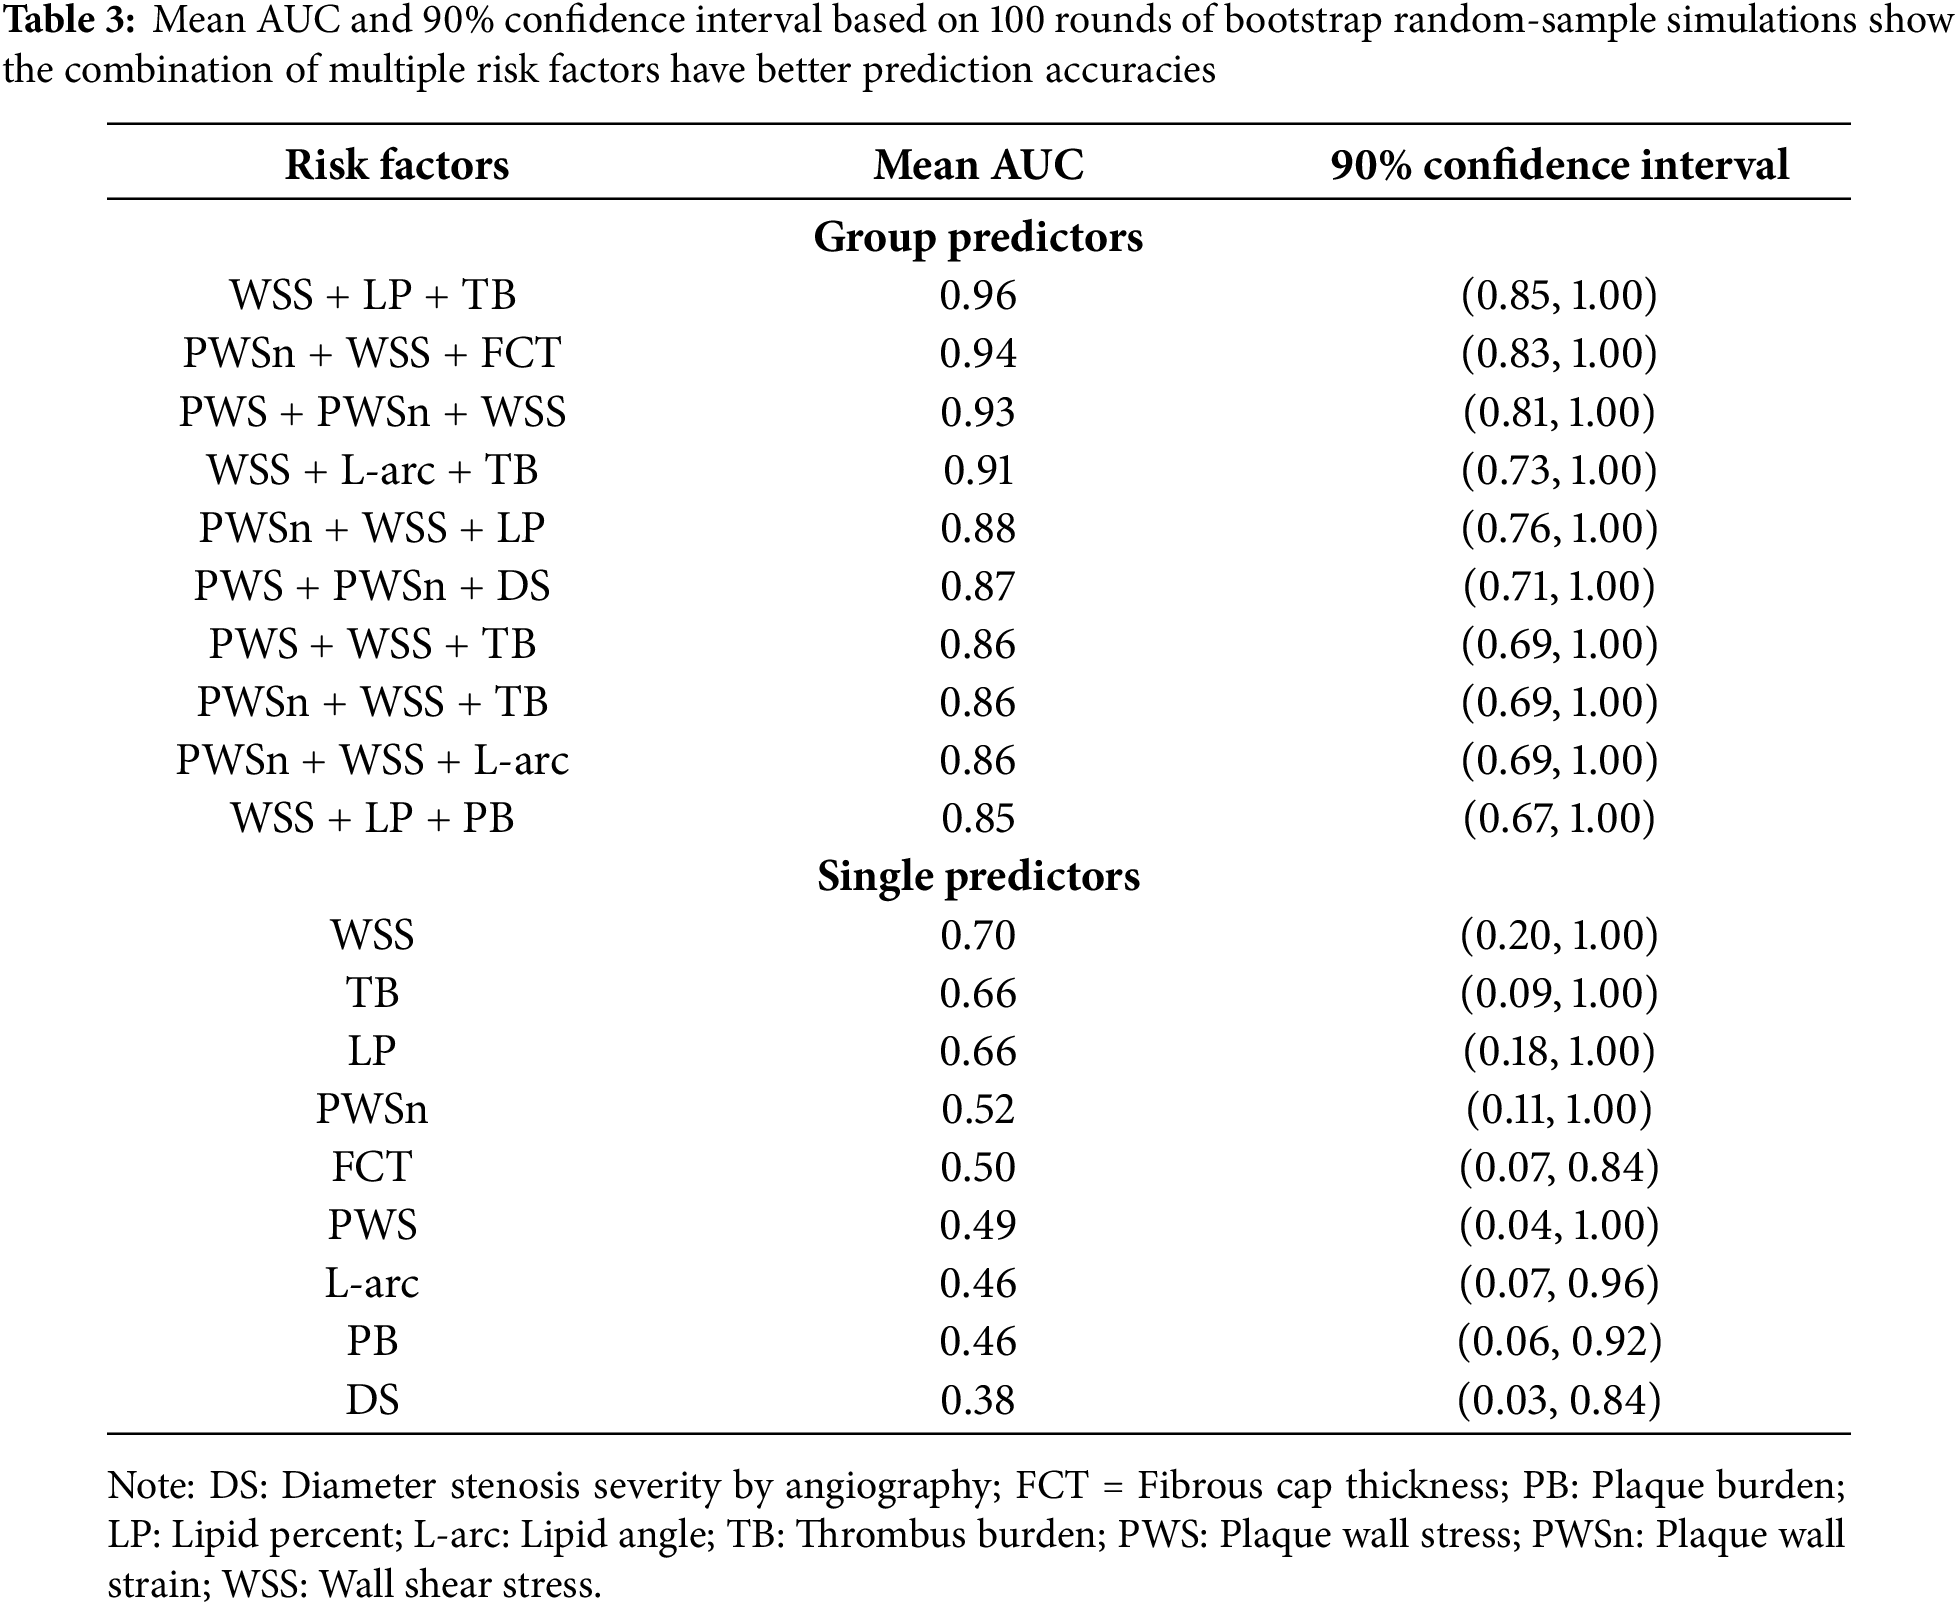
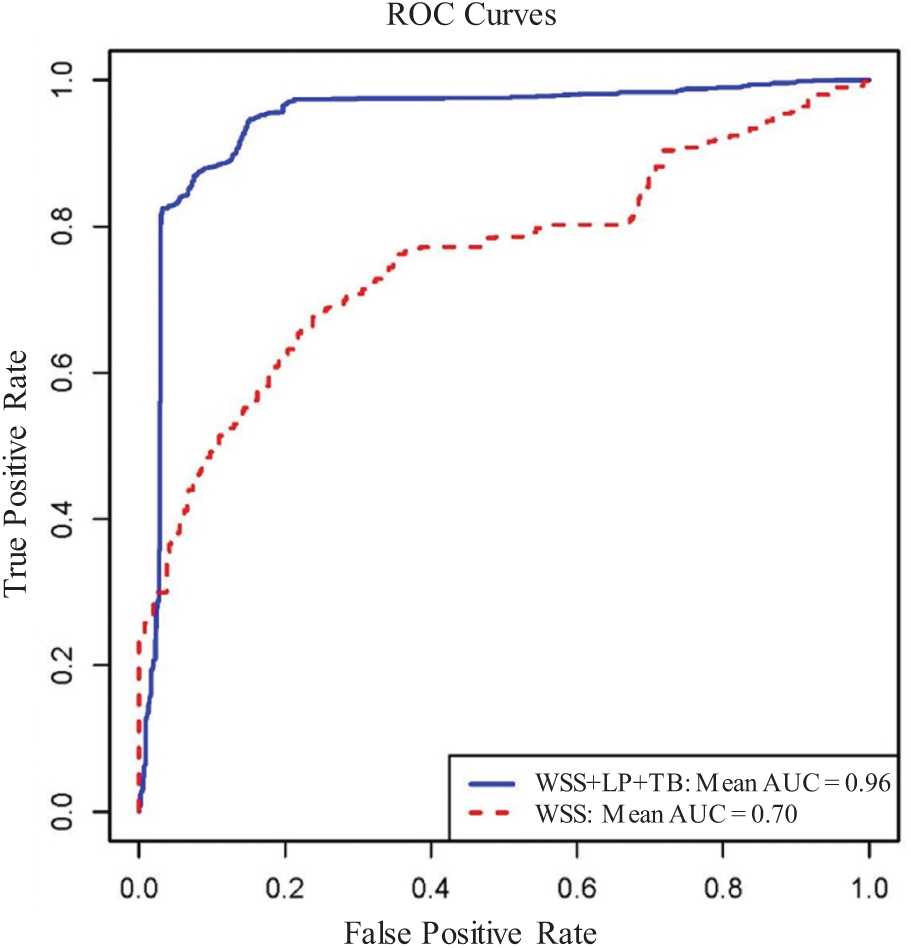
Figure 9: Receiver operating characteristic for predicting conservative anti-thrombotic therapy outcome. The ROC curves for the best triple-factor model (WSS + LP + TB; Mean AUC = 0.96) and the best single-factor model (WSS; Mean AUC = 0.70) based on the cumulated prediction outcomes from all 100 rounds of bootstrap random-sample simulations. AUC = area under the curve; WSS = wall shear stress; LP = lipid percentage; ROC = receiver operating characteristic; TB = thrombus burden
3.2 Morphological and Biomechanical Risk Factor Comparisons Indicated That Thrombus Burden Was the Only Risk Factor Showing a Statistically Significant Group Difference
The morphological risk factor comparison results were presented in Table 4. The mean thrombus burden (TB) from WOG was 65.9% higher than that from BOG (23.8% vs. 14.3%, p = 0.004), indicating a significant group difference. In the comparison of maximum LP and L-arc, substantial differences were noted between the two groups (LP: 66.7%; L-arc: 46.6%). The thinnest FCT for WOG was 24.5% less than that of BOG, suggesting that WOG had a thinner plaque cap. The DS severity by angiography for WOG was only 4.4% lower than that of BOG. Similarly, the relative difference in PB between the two groups was also slight (6.3%). However, those differences were not statistically significant.
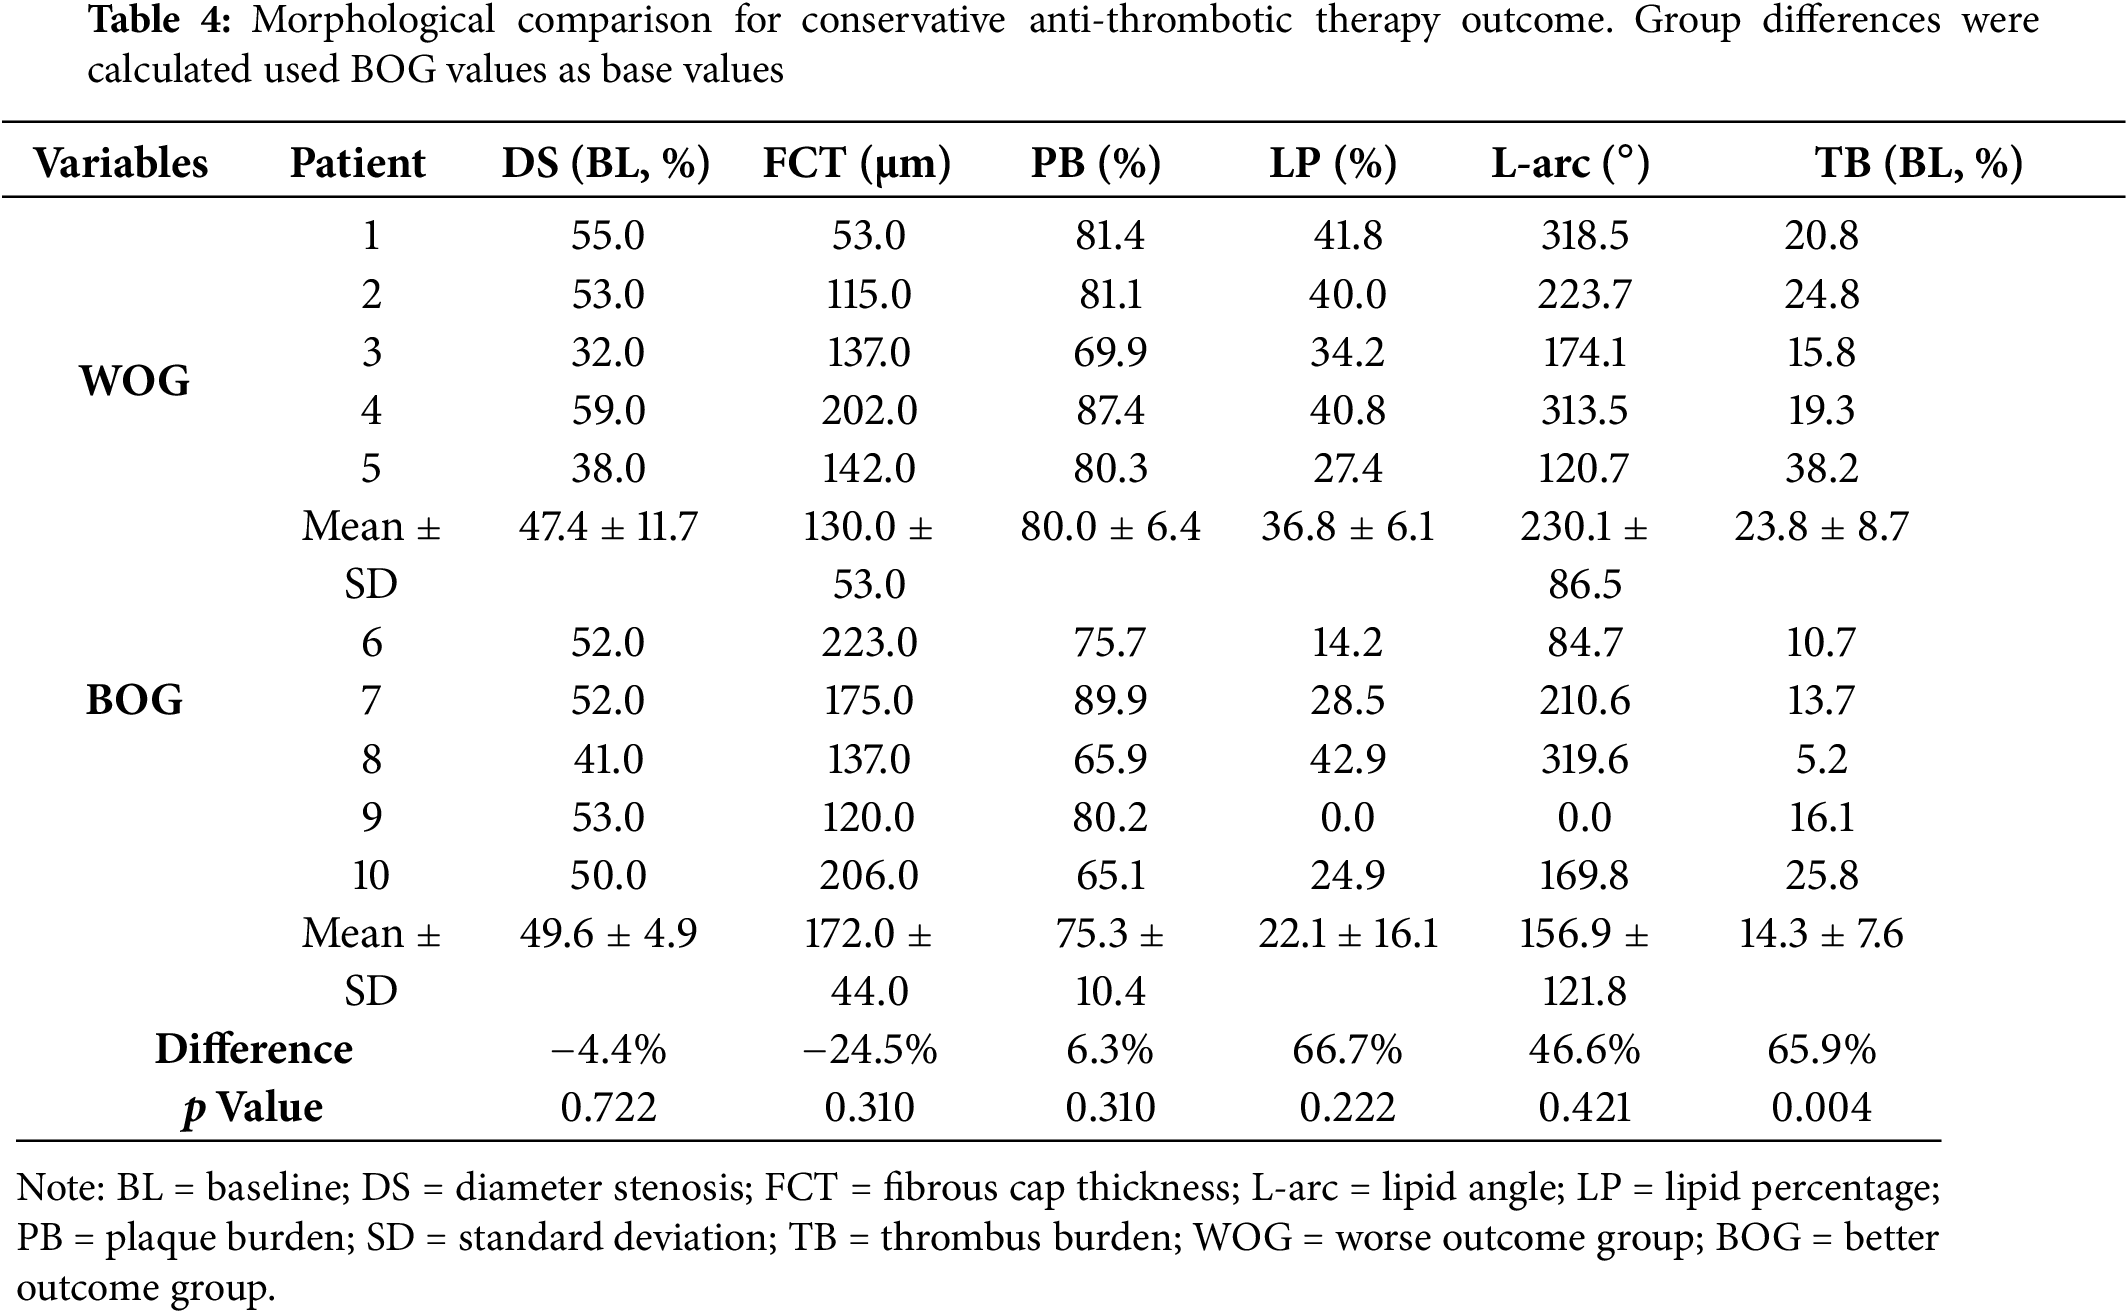
Table 5 gives the biomechanical plaque stress, strain, and wall shear stress comparison results. The mean maximum WSS from WOG was 98.0% higher than that from BOG (p = 0.095), suggesting that WSS may be of greater importance to outcomes of conservative anti-thrombotic therapy. The mean maximum PWS from WOG was 12.9% higher than that from BOG, indicating a minor difference. Additionally, the maximum PWSn comparison result showed that the mean value from WOG was 11.4% lower than that of BOG, which was still a small difference.
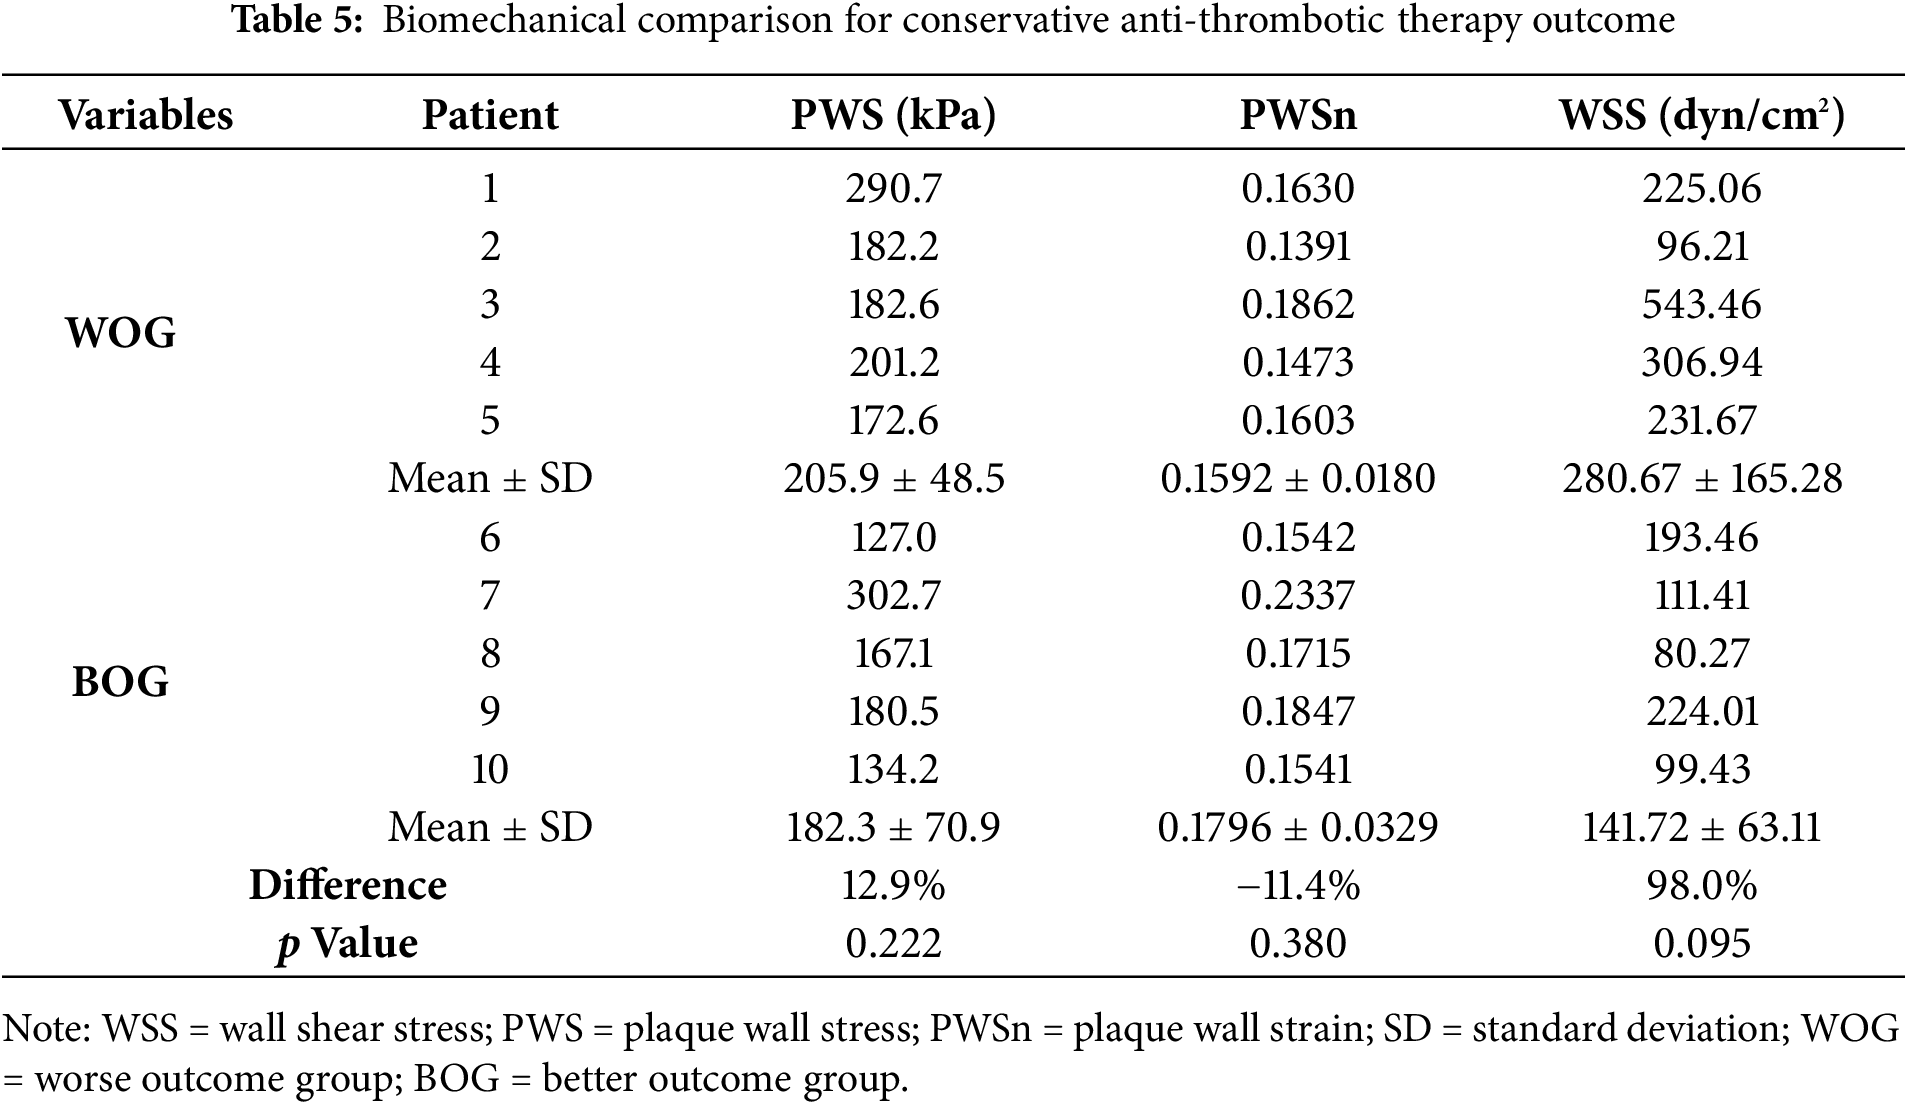
Table 6 shows the correlation results of nine risk factors with patients’ treatment outcomes at follow-up. The results showed that WSS had the most considerable Spearman coefficient value (0.7212) with a p-value of 0.024, followed by PWS (coefficient = 0.6242, p = 0.060). Due to the limited data size, the correlation results should be understood cautiously, and a large sample size is needed to get more solid correlation results.

The EROSION study assessed the safety and feasibility of conservative treatment, avoiding stenting in erosion-related ACS culprit lesions [19]. At one-year follow-up, while some patients exhibited favorable clinical outcomes (diameter stenosis (DS) < 70%) and the conservative treatment was considered successful, some other patients had fewer desirable outcomes (diameter stenosis (DS) >70%) and treatment with stenting was still needed [19–21]. This study was conducted to seek predictors that could be used to identify patients who would be more likely to get successful conservative treatment. This is a pilot study to predict the outcome of conservative treatment without stenting. Our study included three parts: (a) prediction of the outcome of conservative treatment without stenting using morphological and biomechanical risk factors; (b) comparison of morphological and biomechanical risk factor values between BOG group (treatment successful, no stenting needed) and WOG group (treatment unsuccessful, stenting still needed); (c) correlation between risk factors with the treatment outcome. Due to our small sample size, our results were preliminary and should be taken with caution as they were true only for our data set. Further explanations are given in the following Section 2.4.
4.1 Combining Multiple Risk Factors May Provide Better Treatment Outcome Prediction Accuracies than Using Single Predictors
We started with two challenging questions: (1) Which patient group would get a better outcome from the conservative treatment? (2) Which risk factors and prediction methods could be used to predict the treatment outcome? Plaque morphology obtained from OCT frames was utilized to construct FSI models, which were used to obtain plaque wall stress, strain, and wall shear stress conditions for prediction and comparison analysis. Patients’ conservative treatment outcomes at follow-up served as the gold standard for prediction models. FSI models were used so that we could have a complete list of risk factors, including morphological factors and both structural stress and strain and flow wall shear stress. Our results indicated that the best prediction was achieved by the combination of WSS, LP, and TB, with mean AUC = 0.96, 90% confidence interval = (0.85, 1.00), while WSS was the single predictor with best AUC (mean AUC = 0.70, 90% confidence interval = (0.20, 1.00)). There is a 37.1% improvement in the mean AUC value. While our results are limited by our small data size and should be further validated by large-scale studies, it did demonstrate that combining morphological and biomechanical risk factors could improve the accuracy for identifying patients with potentially worse outcomes of conservative anti-thrombotic therapy without stenting.
It should be emphasized that conservative treatment without stenting is very desirable. However, its feasibility and patient suitability need further investigation and large-scale patient study validations. Our work will fill a gap in the current literature and will be helpful in erosion treatment strategy improvements.
4.2 New Morphological Risk Factors Thrombus Burden, Lipid Percent, and Lipid Arc, Are Helpful in Getting Better Predictions
Compared to our previous prediction work, new morphological risk factors, including thrombus burden, lipid percent, and lipid arc, were added to our predictor list, and they helped to achieve better prediction accuracy. The best triple-predictor combination included WSS, LP, and TB and delivered a mean AUC = 0.96. The second-best triple-predictor combination consisted of PWSn, WSS, and FCT and its mean AUC was 0.94. The fourth best triple-predictor combination was made of WSS, L-arc, and TB, with its mean AUC = 0.91. These results indicated that those risk factors may be related to treatment outcome and should be monitored closely.
4.3 Higher Wall Shear Stress May Be Associated with Worse Outcomes of Conservative Treatment
Our results showed that the WSS mean value from WOG was 98.0% higher than that from BOG (280.67 vs. 141.72 (dyn/cm2), p value = 0.095). This result suggested that higher WSS may be associated with worse outcomes of conservative anti-thrombus therapy, which may assist in the clinical treatment decision-making process. It could be explained that plaque erosion starts with the apoptosis and abscission of vascular endothelium, and higher WSS may promote injury to the endothelial cells. Due to the small data set used in this study, large-scale studies are needed before we can come to conclusions of clinical and statistical significance.
4.4 Plaque Wall Stress and Strain Had Smaller Differences between the WOG and BOG
Unlike WSS, plaque wall stress and strain had smaller differences between WOG and BOG, and the differences were not statistically significant, as shown in Section 2.4. The comparison results suggested that it is hard to draw any conclusion about the impact of plaque wall stress and strain on the conservative anti-thrombotic therapy outcome. That being said, PWS and PWSn appeared in the triple-predictor combinations and provided the second and third best prediction accuracies with joint effort from other predictors. This means even though the PWS and PWSn had small differences between BOG and WOG, they could still have good contributions in achieving good prediction results. The results above indicated that plaque stress and strain may have some impact on conservative anti-thrombotic therapy outcome and may help to improve prediction accuracies.
4.5 Small Sample Size Limitation and Prediction Accuracy and Reliability
We acknowledge our small sample size limitation due to the difficulty in obtaining clinical data from patients with plaque erosion who received conservative medication treatment and also had one-year follow-up data. OCT data manual segmentation and 3D FSI model construction were also very time-consuming (this is why 3D FSI model papers are relatively rare in the literature). Even with these difficulties, results from the EROSION study pointed to an important research direction: predicting conservative treatment outcome and identifying patients who may be suitable to receive conservative treatment without further stenting. While a 10-patient data set is not enough to draw conclusive clinical conclusions, this paper was intended as a pilot study to get preliminary results so that our research team could seek funding for further investigations using a larger data set.
Consequently, the data analysis took into account the small sample size and aimed to mitigate its impact by using mean AUC measures obtained through repeated cross-validation, along with bootstrap confidence intervals to assess the statistical reliability of the prediction measures. Nevertheless, we acknowledge that these measures are specific to the given dataset, and we caution against over-extrapolating them as indicators of population-level predictive accuracy. These measures are more appropriate for relative comparison among different predictor combinations. Overall, based on the available data, the main takeaway is that combining appropriate predictive factors can lead to better predictions than using individual factors alone. However, the true predictive accuracy at the population level remains to be evaluated using larger datasets.
4.6 Limitation of Plaque Material Properties
We acknowledge that patient-specific material properties were not available for this study since our data were from a clinic study (Erosion Study, PIs: Yu and Jia) where additional data collection for patient-specific vessel material properties was not allowed. Plaque material parameter values were taken from existing literature [35]. Most plaque modeling papers would not have patient-specific material properties since that requires additional measurements (often invasive) from patients. Tang et al. studied the sensitivity for material properties and indicated that stiffness variations of vessel materials and plaque components (50% reduction or 100% increase) may affect maximal stress values by 20%–50% [41]. The results indicated that the material property limitation should be kept in mind when interpreting our model results.
4.7 Limitation of not Including Residual Stress
Residual stress was not included in our models since the vessel opening angle needed to include residual stress was not available in our study. In general, clinical data were from live patients, and vessel samples could not be removed from patients so that vessel rings could be made and cut open to get opening angles. Even when opening angles could be made available, methods for opening and closing up 3D curved coronary vessels are not available in the current literature.
Modeling papers using clinical data normally do not have patient-specific vessel material properties and the opening-angle data to include residual stress. Even with the limitations of patient-specific plaque material properties and lack of residual stress, results from our models can still be used to provide group comparative studies since all patients would be using the same model assumptions. This is like using a scale with error to weigh patients in a hospital. The absolute weight may be off. However, the weight differences between patients would be meaningful.
We will continue our effort with our available resources to increase our sample size to gain stronger statistical power and better clinical relevance. One important part of our work procedure is the automation of OCT segmentations. We started automatic OCT segmentation using machine learning a few years ago and will continue that effort. Another bottleneck of our research for potential clinical implementation is the model construction manpower cost. It is impractical for a modeling approach that costs 1–2 weeks for model construction to be implemented for clinical use. Rather than making the models more complicated, we could try to combine a 3D CFD model and a 2D structure model to get values for all biomechanical risk factors and compare the prediction results with those from FSI models. Automation of model constructions for CFD and 2D structure models is far easier than that for 3D FSI models. With automation, it is possible to achieve a one-hour turnaround time to deliver model analysis results to clinicians for diagnostic use. Those are some items for our future efforts.
Patient follow-up OCT data and OCT-based patient-specific FSI models were utilized to identify possible biomechanical and morphological predictors for the conservative treatment outcome of plaque erosion. We are advancing the CFD approach for plaque erosion in the current literature to the FSI approach so that our investigation would include both structural stress and strain and flow shear stress, and may lead to a better understanding of mechanisms linked to plaque erosion. Our preliminary results based on our data set indicated that combining morphological and biomechanical risk factors had better prediction accuracy for conservative medication treatment outcome than that obtained by single predictors. The approach could be used to identify patients who are more suitable to receive conservative antithrombotic therapy without stenting. Thrombus burden was the only risk factor that had a statistically significant group difference (among the 9 risk factors compared). A large cohort of patients is required to advance this study and validate our findings.
Acknowledgement: Not applicable.
Funding Statement: This research was supported in part by National Sciences Foundation of China grants 11972117; a Jiangsu Province Science and Technology Agency under grant number BE2016785. Yu received support from Natural Science Foundation of China (81827806 and 62135002). Jia received support from Natural Science Foundation of China (81722025) and Key R&D Project of Heilongjiang Province grant 2022ZX06C07. Lv received support from the Natural Science Foundation of Shandong Province under grant number ZR2024QA110, Shandong Province Medical Health Science and Technology Project (Nos. 202425020256, and 202403010254).
Author Contributions: The authors confirm contribution to the paper as follows: major contribution to the writing of the article, model building, data extraction and main writer: Yanwen Zhu, Dalin Tang, and Chen Zhao; overall design and execution: Dalin Tang, Haibo Jia, and Minglong Chen; prediction analysis: Zheyang Wu; patient image data preparation: Akiko Maehara, Dirui Zhang, Ming Zeng, and Yishuo Xu; data segmentation: Liang Wang, and Rui Lv; 3D model construction and calculation: Yanwen Zhu, Liang Wang, Xiaoya Guo, Rui Lv, and Mengde Huang; clinical guidance and technical support in data processing and analysis: Haibo Jia, Bo Yu, Minglong Chen, and Gary S. Mintz. All authors reviewed the results and approved the final version of the manuscript.
Availability of Data and Materials: The data that support the findings of this study are available from the Corresponding Author, Dalin Tang, upon reasonable request.
Ethics Approval: De-identified existing data were obtained from the EROSSION study. All participants in EROSION study provided written informed consent, and the study was approved by the Ethics Committee of the Second Affiliated Hospital of Harbin Medical University (Harbin, China, IRB number KY2014-001).
Conflicts of Interest: The authors declare no conflicts of interest to report regarding the present study.
References
1. Milzi A, Lemma ED, Dettori R, Burgmaier K, Marx N, Reith S, et al. Coronary plaque composition influences biomechanical stress and predicts plaque rupture in a morpho-mechanic OCT analysis. eLife. 2021;10:e64020. doi:10.7554/eLife.64020. [Google Scholar] [PubMed] [CrossRef]
2. Costopoulos C, Timmins LH, Huang Y, Hung OY, Molony DS, Brown AJ, et al. Impact of combined plaque structural stress and wall shear stress on coronary plaque progression, regression, and changes in composition. Eur Heart J. 2019;40(18):1411–22. doi:10.1093/eurheartj/ehz132. [Google Scholar] [PubMed] [CrossRef]
3. Gijsen F, Katagiri Y, Barlis P, Bourantas C, Collet C, Coskun U, et al. Expert recommendations on the assessment of wall shear stress in human coronary arteries: existing methodologies, technical considerations, and clinical applications. Eur Heart J. 2019;40(41):3421–33. doi:10.1093/eurheartj/ehz551. [Google Scholar] [PubMed] [CrossRef]
4. Cardoso L, Weinbaum S. Changing views of the biomechanics of vulnerable plaque rupture: a review. Ann Biomed Eng. 2014;42(2):415–31. doi:10.1007/s10439-013-0855-x. [Google Scholar] [PubMed] [CrossRef]
5. Arroyo LH, Lee RT. Mechanisms of plaque rupture: mechanical and biologic interactions. Cardiovasc Res. 1999;41(2):369–75. doi:10.1016/s0008-6363(98)00308-3. [Google Scholar] [PubMed] [CrossRef]
6. Samady H, Eshtehardi P, McDaniel MC, Suo J, Dhawan SS, Maynard C, et al. Coronary artery wall shear stress is associated with progression and transformation of atherosclerotic plaque and arterial remodeling in patients with coronary artery disease. Circulation. 2011;124(7):779–88. doi:10.1161/CIRCULATIONAHA.111.021824. [Google Scholar] [PubMed] [CrossRef]
7. Bourantas CV, Raber L, Sakellarios A, Ueki Y, Zanchin T, Koskinas KC, et al. Utility of multimodality intravascular imaging and the local hemodynamic forces to predict Atherosclerotic disease progression. JACC Cardiovasc Imaging. 2020;13(4):1021–32. doi:10.1016/j.jcmg.2019.02.026. [Google Scholar] [PubMed] [CrossRef]
8. Stone PH, Saito S, Takahashi S, Makita Y, Nakamura S, Kawasaki T, et al. Prediction of progression of coronary artery disease and clinical outcomes using vascular profiling of endothelial shear stress and arterial plaque characteristics: the PREDICTION study. Circulation. 2012;126(2):172–81. doi:10.1161/CIRCULATIONAHA.112.096438. [Google Scholar] [PubMed] [CrossRef]
9. Vergallo R, Papafaklis MI, D’Amario D, Michalis LK, Crea F, Porto I. Coronary plaque erosion developing in an area of high endothelial shear stress: insights from serial optical coherence tomography imaging. Coron Artery Dis. 2019;30(1):74–5. doi:10.1097/MCA.0000000000000673. [Google Scholar] [PubMed] [CrossRef]
10. Giddens DP, Zarins CK, Glagov S. The role of fluid mechanics in the localization and detection of atherosclerosis. J Biomech Eng. 1993;115(4b):588–94. doi:10.1115/1.2895545. [Google Scholar] [PubMed] [CrossRef]
11. McElroy M, Kim Y, Niccoli G, Vergallo R, Langford-Smith A, Crea F, et al. Identification of the haemodynamic environment permissive for plaque erosion. Sci Rep. 2021;11(1):7253. doi:10.1038/s41598-021-86501-x. [Google Scholar] [PubMed] [CrossRef]
12. Russo G, Pedicino D, Chiastra C, Vinci R, Lodi Rizzini M, Genuardi L, et al. Coronary artery plaque rupture and erosion: role of wall shear stress profiling and biological patterns in acute coronary syndromes. Int J Cardiol. 2023;370(23):356–65. doi:10.1016/j.ijcard.2022.10.139. [Google Scholar] [PubMed] [CrossRef]
13. Thondapu V, Mamon C, Poon EKW, Kurihara O, Kim HO, Russo M, et al. High spatial endothelial shear stress gradient independently predicts site of acute coronary plaque rupture and erosion. Cardiovasc Res. 2021;117(8):1974–85. doi:10.1093/cvr/cvaa251. [Google Scholar] [PubMed] [CrossRef]
14. Kim HO, Kim CJ, Kurihara O, Thondapu V, Russo M, Yamamoto E, et al. Angiographic features of patients with coronary plaque erosion. Int J Cardiol. 2019;288(Suppl J):12–6. doi:10.1016/j.ijcard.2019.03.039. [Google Scholar] [PubMed] [CrossRef]
15. Virmani R, Kolodgie FD, Burke AP, Farb A, Schwartz SM. Lessons from sudden coronary death: a comprehensive morphological classification scheme for atherosclerotic lesions. Arterioscler Thromb Vasc Biol. 2000;20(5):1262–75. doi:10.1161/01.atv.20.5.1262. [Google Scholar] [PubMed] [CrossRef]
16. Guagliumi G, Capodanno D, Saia F, Musumeci G, Tarantini G, Garbo R, et al. Mechanisms of atherothrombosis and vascular response to primary percutaneous coronary intervention in women versus men with acute myocardial infarction: results of the OCTAVIA study. JACC Cardiovasc Interv. 2014;7(9):958–68. doi:10.1016/j.jcin.2014.05.011. [Google Scholar] [PubMed] [CrossRef]
17. Jia H, Abtahian F, Aguirre AD, Lee S, Chia S, Lowe H, et al. In vivo diagnosis of plaque erosion and calcified nodule in patients with acute coronary syndrome by intravascular optical coherence tomography. J Am Coll Cardiol. 2013;62(19):1748–58. doi:10.1016/j.jacc.2013.05.071. [Google Scholar] [PubMed] [CrossRef]
18. Theofilis P, Vlachakis PK, Papanikolaou A, Karakasis P, Oikonomou E, Tsioufis K, et al. Coronary plaque erosion: epidemiology, diagnosis, and treatment. Int J Mol Sci. 2024;25(11):5786. doi:10.3390/ijms25115786. [Google Scholar] [PubMed] [CrossRef]
19. Collet C, Conte E, Mushtaq S, Brouwers S, Shinke T, Coskun AU, et al. Reviewing imaging modalities for the assessment of plaque erosion. Atherosclerosis. 2021;318:52–9. doi:10.1016/j.atherosclerosis.2020.10.017. [Google Scholar] [PubMed] [CrossRef]
20. Dai J, Xing L, Jia H, Zhu Y, Zhang S, Hu S, et al. In vivo predictors of plaque erosion in patients with ST-segment elevation myocardial infarction: a clinical, angiographical, and intravascular optical coherence tomography study. Eur Heart J. 2018;39(22):2077–85. doi:10.1093/eurheartj/ehy101. [Google Scholar] [PubMed] [CrossRef]
21. Kolte D, Libby P, Jang IK. New Insights into plaque erosion as a mechanism of acute coronary syndromes. JAMA. 2021;325(11):1043–4. doi:10.1001/jama.2021.0069. [Google Scholar] [PubMed] [CrossRef]
22. Yamamoto E, Yonetsu T, Kakuta T, Soeda T, Saito Y, Yan BP, et al. Clinical and laboratory predictors for plaque erosion in patients with acute coronary syndromes. J Am Heart Assoc. 2019;8(21):e012322. doi:10.1161/JAHA.119.012322. [Google Scholar] [PubMed] [CrossRef]
23. Baaten C, Nagy M, Bergmeier W, Spronk HMH, van der Meijden PEJ. Platelet biology and function: plaque erosion vs. rupture. Eur Heart J. 2024;45(1):18–31. doi:10.1093/eurheartj/ehad720. [Google Scholar] [PubMed] [CrossRef]
24. Luo X, Lv Y, Bai X, Qi J, Weng X, Liu S, et al. Plaque Erosion: a distinctive pathological mechanism of acute coronary syndrome. Front Cardiovasc Med. 2021;8:711453. doi:10.3389/fcvm.2021.711453. [Google Scholar] [PubMed] [CrossRef]
25. Prati F, Uemura S, Souteyrand G, Virmani R, Motreff P, Di Vito L, et al. OCT-based diagnosis and management of STEMI associated with intact fibrous cap. JACC Cardiovasc Imaging. 2013;6(3):283–7. doi:10.1016/j.jcmg.2012.12.007. [Google Scholar] [PubMed] [CrossRef]
26. Xing L, Yamamoto E, Sugiyama T, Jia H, Ma L, Hu S, et al. EROSION study (effective anti-thrombotic therapy without stenting: intravascular optical coherence tomography-based management in plaque erosiona 1-year follow-up report. Circ Cardiovasc Interv. 2017;10(12):e005860. doi:10.1161/CIRCINTERVENTIONS.117.005860. [Google Scholar] [PubMed] [CrossRef]
27. Jia H, Dai J, Hou J, Xing L, Ma L, Liu H, et al. Effective anti-thrombotic therapy without stenting: intravascular optical coherence tomography-based management in plaque erosion (the EROSION study). Eur Heart J. 2017;38(11):792–800. doi:10.1093/eurheartj/ehw381. [Google Scholar] [PubMed] [CrossRef]
28. Wang L, Zhu Y, Zhao C, Maehara A, Lv R, Guo X, et al. Role of biomechanical factors in plaque rupture and erosion: insight from intravascular imaging based computational modeling. npj Cardiovasc Health. 2025;2(1):12. doi:10.1038/s44325-025-00048-8. [Google Scholar] [CrossRef]
29. Yang C, Bach RG, Zheng J, Naqa IE, Woodard PK, Teng Z, et al. In vivo IVUS-based 3-D fluid-structure interaction models with cyclic bending and anisotropic vessel properties for human atherosclerotic coronary plaque mechanical analysis. IEEE Trans Biomed Eng. 2009;56(10):2420–8. doi:10.1109/TBME.2009.2025658. [Google Scholar] [PubMed] [CrossRef]
30. Cheng H, Zhong W, Wang L, Zhang Q, Ma X, Wang Y, et al. Effects of shear stress on vascular endothelial functions in atherosclerosis and potential therapeutic approaches. Biomed Pharmacother. 2023;158(1):114198. doi:10.1016/j.biopha.2022.114198. [Google Scholar] [PubMed] [CrossRef]
31. Hakim D, Pinilla-Echeverri N, Coskun AU, Pu Z, Kajander OA, Rupert D, et al. The role of endothelial shear stress, shear stress gradient, and plaque topography in plaque erosion. Atherosclerosis. 2023;376(13):11–8. doi:10.1016/j.atherosclerosis.2023.05.013. [Google Scholar] [PubMed] [CrossRef]
32. Ahmed ME, Leistner DM, Hakim D, Abdelwahed Y, Coskun AU, Maynard C, et al. Endothelial shear stress metrics associate with proinflammatory pathways at the culprit site of coronary erosion. JACC Basic Transl Sci. 2024;9(11):1269–83. doi:10.1016/j.jacbts.2024.07.008. [Google Scholar] [PubMed] [CrossRef]
33. Zhu Y, Zhao C, Wu Z, Maehara A, Tang D, Wang L, et al. Comparison and identification of human coronary plaques with/without erosion using patient-specific optical coherence tomography-based fluid-structure interaction models: a pilot study. Biomech Model Mechanobiol. 2025;24(1):213–31. doi:10.1007/s10237-024-01906-7. [Google Scholar] [PubMed] [CrossRef]
34. Franck G. Role of mechanical stress and neutrophils in the pathogenesis of plaque erosion. Atherosclerosis. 2021;318(1):60–9. doi:10.1038/s44325-025-00048-8. [Google Scholar] [CrossRef]
35. Wang L, He L, Jia H, Lv R, Guo X, Yang C, et al. Optical coherence tomography-based patient-specific residual multi-thrombus coronary plaque models with fluid-structure interaction for better treatment decisions: a biomechanical modeling case study. J Biomech Eng. 2021;143(9):091003. doi:10.1115/1.4050911. [Google Scholar] [PubMed] [CrossRef]
36. Holzapfel GA, Gasser TC, Ogden RW. A new constitutive framework for arterial wall mechanics and a comparative study of material models. J Elasticity. 2000;61(1–3):1–48. doi:10.1023/A:1010835316564. [Google Scholar] [CrossRef]
37. Huang X, Yang C, Zheng J, Bach R, Muccigrosso D, Woodard PK, et al. 3D MRI-based multicomponent thin layer structure only plaque models for atherosclerotic plaques. J Biomech. 2016;49(13):2726–33. doi:10.1016/j.jbiomech.2016.06.002. [Google Scholar] [PubMed] [CrossRef]
38. Tearney GJ, Regar E, Akasaka T, Adriaenssens T, Barlis P, Bezerra HG, et al. Consensus standards for acquisition, measurement, and reporting of intravascular optical coherence tomography studies. J Am Coll Cardiol. 2012;59(12):1058–72. doi:10.1016/j.jacc.2011.09.079. [Google Scholar] [PubMed] [CrossRef]
39. Zhang BC, Karanasos A, Gnanadesigan M, van der Sijde JN, van Ditzhuijzen N, Witberg K, et al. Qualitative and quantitative evaluation of dynamic changes in non-culprit coronary atherosclerotic lesion morphology: a longitudinal OCT study. EuroIntervention. 2018;13(18):e2190–200. doi:10.4244/EIJ-D-17-00161. [Google Scholar] [PubMed] [CrossRef]
40. Venables WN, Ripley BD. Modern applied statistics with S. 4th ed. New York, NY, USA: Springer; 2002. [Google Scholar]
41. Tang D, Yang C, Zheng J, Woodard PK, Saffitz JE, Sicard GA, et al. Quantifying effects of plaque structure and material properties on stress distributions in human atherosclerotic plaques using 3D FSI models. J Biomech Eng. 2005;127(7):1185–94. doi:10.1115/1.2073668. [Google Scholar] [PubMed] [CrossRef]
Cite This Article
 Copyright © 2025 The Author(s). Published by Tech Science Press.
This work is licensed under a Creative Commons Attribution 4.0 International License , which permits unrestricted use, distribution, and reproduction in any medium, provided the original work is properly cited.
 Downloads
 Citation Tools