
 Submit a Paper
 Propose a Special lssue
 Open Access
ARTICLE

Prediction and Sensitivity Analysis of Foam Concrete Compressive Strength Based on Machine Learning Techniques with Hyperparameter Optimization
1 School of Civil and Hydraulic Engineering, Chongqing University of Science and Technology, Shapingba District, Chongqing, 401331, China
2 School of Civil and Environmental Engineering, University of Technology Sydney, 15 Broadway, Ultimo, NSW 2007, Australia
* Corresponding Authors: Jiehong Li. Email: ; Yang Yu. Email:
Computer Modeling in Engineering & Sciences 2025, 144(3), 2943-2967. https://doi.org/10.32604/cmes.2025.067282
Received 29 April 2025; Accepted 25 August 2025; Issue published 30 September 2025
 View Full Text
 Download PDF
Abstract
Foam concrete is widely used in engineering due to its lightweight and high porosity. Its compressive strength, a key performance indicator, is influenced by multiple factors, showing nonlinear variation. As compressive strength tests for foam concrete take a long time, a fast and accurate prediction method is needed. In recent years, machine learning has become a powerful tool for predicting the compressive strength of cement-based materials. However, existing studies often use a limited number of input parameters, and the prediction accuracy of machine learning models under the influence of multiple parameters and nonlinearity remains unclear. This study selects foam concrete density, water-to-cement ratio (W/C), supplementary cementitious material replacement rate (SCM), fine aggregate to binder ratio (FA/Binder), superplasticizer content (SP), and age of the concrete (Age) as input parameters, with compressive strength as the output. Five different machine learning models were compared, and sensitivity analysis, based on Shapley Additive Explanations (SHAP), was used to assess the contribution of each input parameter. The results show that Gaussian Process Regression (GPR) outperforms the other models, with R2, RMSE, MAE, and MAPE values of 0.95, 1.6, 0.81, and 0.2, respectively. It is because GPR, optimized through Bayesian methods, better fits complex nonlinear relationships, especially considering a large number of input parameters. Sensitivity analysis indicates that the influence of input parameters on compressive strength decreases in the following order: foam concrete density, W/C, Age, FA/Binder, SP, and SCM.Keywords
Foam concrete is a lightweight concrete material that reduces density by introducing air bubbles. Due to its significant lightweight properties, excellent thermal and acoustic insulation performance, and relatively good fire resistance, foam concrete is widely used in various engineering fields such as construction, roads, railways, and tunnels [1,2]. Compared to traditional concrete, foam concrete has a lower self-weight, which can effectively reduce structural loads, and its production cost is relatively low, making it easy to construct [3,4]. However, the main issue with foam concrete is its relatively low strength, especially in applications that require high strength. As a result, the use of foam concrete is still limited in such engineering applications. Therefore, adjusting mixing design to improve its strength has become an important research topic.
The compressive strength of foam concrete is influenced by various factors, with key factors including the foam concrete’s density, W/C ratio, admixture content, fine aggregate content, and curing time. The density of foam concrete affects its compressive strength, as a higher density implies fewer pores and a more compact structure, thus improving its compressive capacity. In contrast, lower density results in a looser structure and weaker compressive strength [5–7]. The water to cement (W/C) ratio also influences the compressive strength of foam concrete. A higher W/C ratio increases the flowability of the cement paste, but it may cause an insufficient bond between the cement and aggregates, thereby reducing the strength of the structure. Conversely, a lower W/C ratio enhances the setting and hardening effect of the cement, which improves the compressive strength of foam concrete [8–10]. The content of admixtures and fine aggregates also affects the compressive strength of foam concrete. Admixtures can improve its microstructure and increase its density, thereby enhancing its strength [11–13]. However, an excessive amount of fine aggregates may increase the flowability of the concrete, reduce its density, and thus negatively affect the compressive strength [14–16]. These factors are interrelated in a complex way. Traditional experimental methods are time-consuming, labor-intensive, and have long cycles, making it difficult to comprehensively and accurately capture the combined effects of these influencing factors in a short period of time.
In recent years, machine learning has become an important method for predicting the strength of foam concrete. Various machine learning algorithms, such as Support Vector Machine (SVM), Artificial Neural Network (ANN), and Ensemble Decision Tree (EDT), have been proposed in the literature to construct prediction models for foam concrete strength. These methods can mine the potential patterns influencing strength based on a large amount of experimental data, thus achieving more accurate predictions. Yaseen et al. [17] used the Extreme Learning Machine (ELM) model to predict the compressive strength of foam concrete, while Salami et al. [18] employed ANN, Gene Expression Programming (GEP), and Gradient Boosted Trees (GBT) models for the same purpose. Zhang et al. [19] used multiple models to predict the compressive strength of foam concrete and found that the SVM model was the most optimal. However, existing machine learning models still face some issues, such as being heavily reliant on high-quality, large-scale experimental data for training and validation, and the quality and quantity of data directly impact the prediction ability of the model [17,18,20]. Furthermore, most of the current research related to machine learning focused on predicting the compressive strength of foam concrete with 2–4 input parameters, and the accuracy of predictions using more parameters has not been determined. Therefore, it is urgently needed to further explore the predictive performance of models under multiple parameter input conditions, thereby enhancing the model’s generalization ability and practical application value.
To address the above shortcomings, this study increased the number of input parameters to explore how to accurately predict the compressive strength of foam concrete under the influence of multiple nonlinear parameters. This study thoroughly investigates the impact of multiple key parameters on the compressive strength of foam concrete and performs a comparative analysis using various efficient models to improve prediction accuracy. Building on existing research, this study introduces additional input variables and considers their nonlinear effects, thus proposing a more comprehensive and precise prediction method. Compared to traditional methods, the approach presented in this paper demonstrates greater flexibility and superiority in handling complex parameter relationships, offering significant practical application value and research significance. Additionally, this study employs the Shapley Additive Explanations (SHAP) method to perform sensitivity analysis on the important parameters that influence the compressive strength of foam concrete, based on the optimal model, in order to reveal the contribution of various factors to the prediction of foam concrete’s compressive strength. This innovative work provides a more efficient, precise, and transparent solution for predicting the strength of foam concrete under the influence of multiple parameters.
2 Data Collection and Analysis
As is well known, the scale of the database plays a crucial role in the accuracy of the prediction model. A large amount of training data allows the model to better learn the underlying patterns in the data, thereby improving the accuracy of the prediction model. This study collected a large amount of experimental data from the published literature [21–50] and used five different machine learning models to train and test for predicting the compressive strength of foam concrete. The study used the density of foam concrete, W/C ratio, SCM substitution rate, FA/Binder ratio, SP content, and curing age as input variables, with the compressive strength as the output variable. Table 1 provides information on all the input parameters in the collected data, including the maximum value, minimum value, median, and other data points.
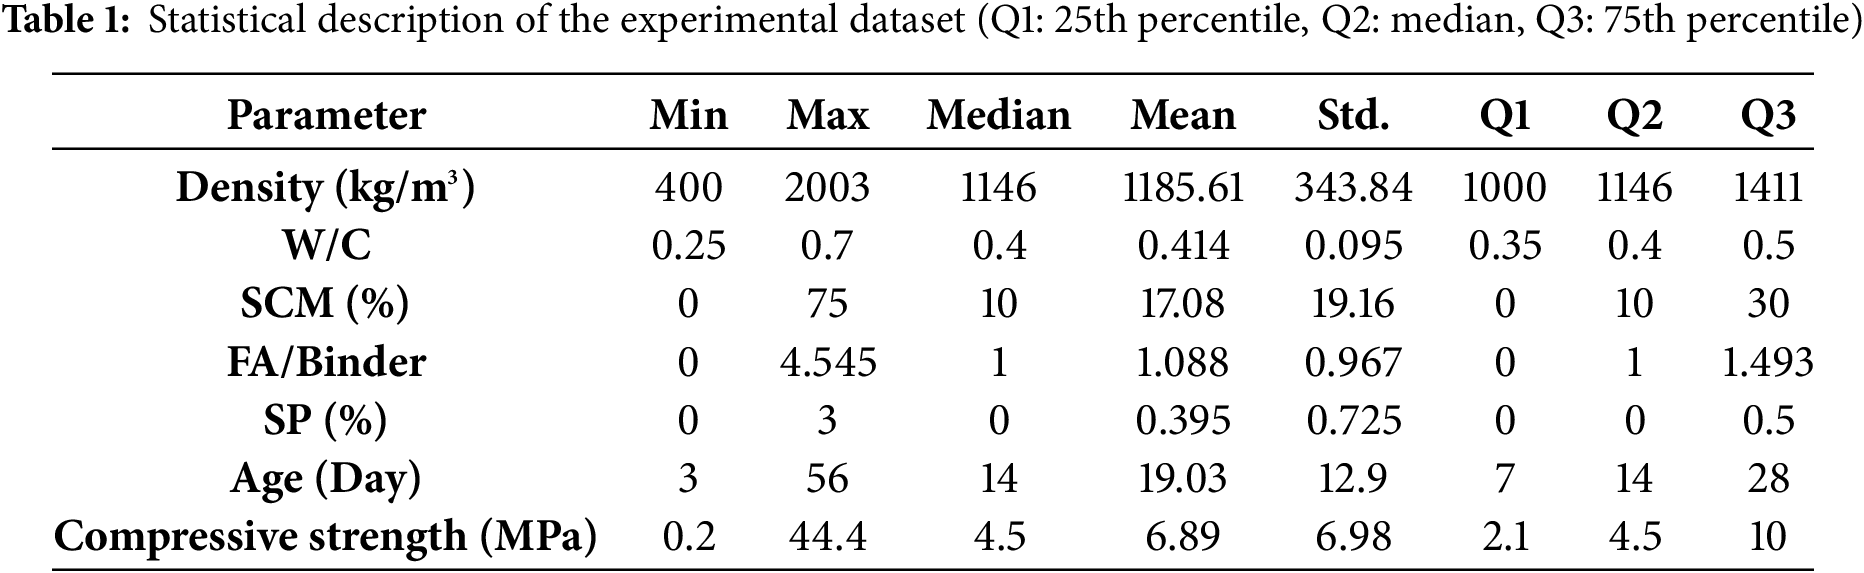
Fig. 1 shows the distribution range of all data across different input parameters when constructing the model. Most of the data points were distributed within the density range of 1000–1200 kg/m3, with some data points also distributed in other density ranges (Fig. 1a). The W/C ratio samples were mainly distributed in the range of less than 0.6 (Fig. 1b). The SCM substitution rate samples were about half in the range of less than 10%, and the other half more evenly distributed in the range greater than 10% (Fig. 1c). The FA/Binder ratio samples were approximately 40% distributed at 0, with some concentration around 1 and >2. The SP content was mostly distributed at 0, with a small portion found in the range of 0.5–1. Curing age was mostly distributed in the ranges of less than 10 and 20–30, indicating that most of the compressive strength data collected were from 7-day and 28-day curing periods.
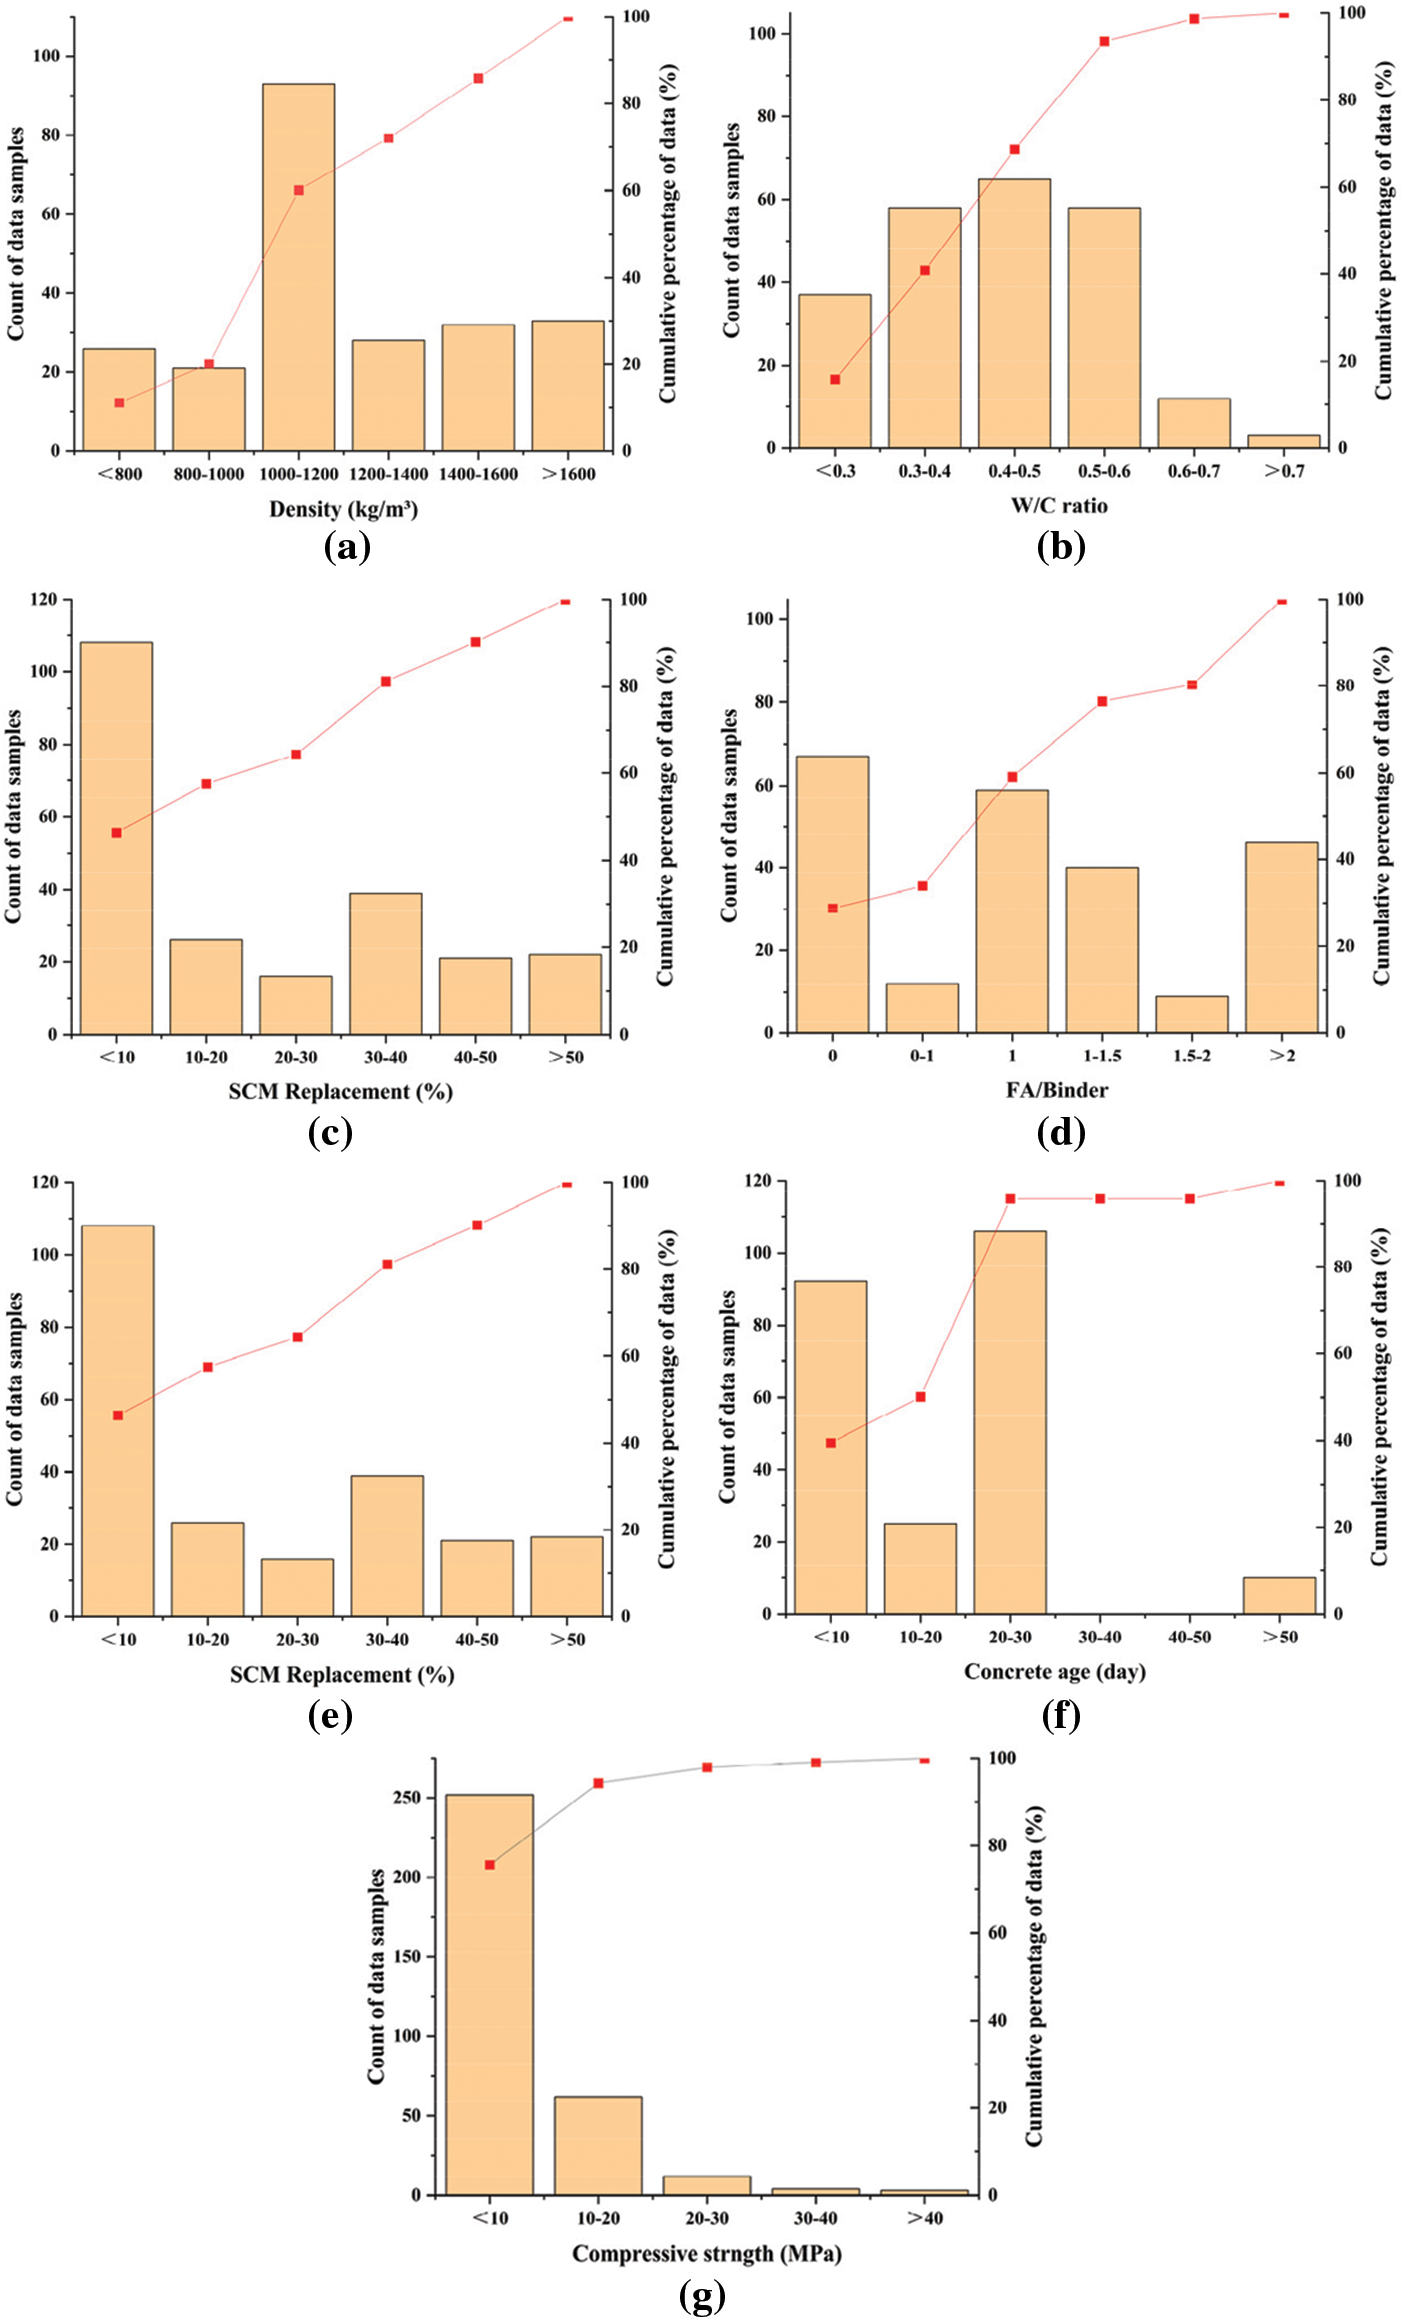
Figure 1: Distribution of input and output parameters in the experimental dataset. (a) Density; (b) W/C; (c) SCM; (d) FA/Binder; (e) SP; (f) Age; (g) Compressive strength
To reduce redundant features and select important ones to improve model efficiency, this study performed a correlation analysis on the variables affecting the compressive strength of foam concrete, with the results shown in the correlation matrix in Fig. 2. From the matrix, it is clear that the correlation between each pair of variables is represented by the correlation coefficient, typically measured using the Pearson Correlation Coefficient, which ranges from −1 to 1. A correlation coefficient close to 1 indicates a strong positive correlation between the two variables, while a coefficient close to −1 indicates a strong negative correlation. Based on the results from Fig. 2, it can be observed that most of the variables have low correlation, with almost no significant positive or negative correlation. This suggests that the parameters are relatively independent from each other, with each variable providing unique information.
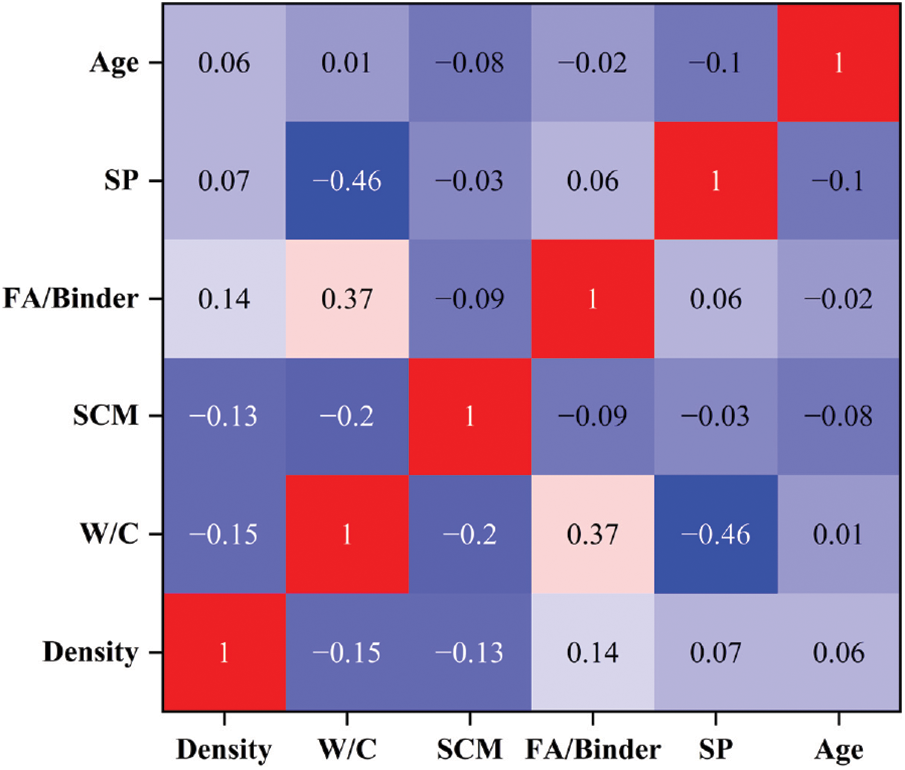
Figure 2: Correlation matrix among input parameters
Overall, the low correlation between the selected parameters indicates that each variable contributes independently to the prediction of compressive strength, thus reducing redundant features and mitigating the issue of multicollinearity between features. This independence not only enhances the stability of the model but also improves its accuracy when dealing with complex nonlinear relationships, ensuring the reliability and precision of the predictions. Therefore, the results of the correlation analysis further confirm the effectiveness of the selected features and provide a theoretical basis for the model’s further optimization and improved prediction accuracy.
This study aims to predict the compressive strength of foam concrete under the influence of multiple parameters using various machine learning models. The overall approach follows a systematic process, including data collection and preprocessing, model selection and training, as well as performance evaluation and comparison (Fig. 3). The input dataset consisted of key influencing parameters of foam concrete, and these data were standardized before being used in different prediction models. A comparative analysis was employed to assess the efficiency and accuracy of various machine learning techniques. All models were trained using the same dataset to ensure a fair comparison. Subsequently, the prediction capabilities of the models were analyzed using multiple evaluation metrics, in order to identify the most suitable model for predicting the compressive strength of foam concrete under the influence of multiple input parameters. Finally, based on the selected best model, SHAP was used for sensitivity analysis of the input parameters to clarify the importance ranking of each input parameter’s contribution to the strength of foam concrete.
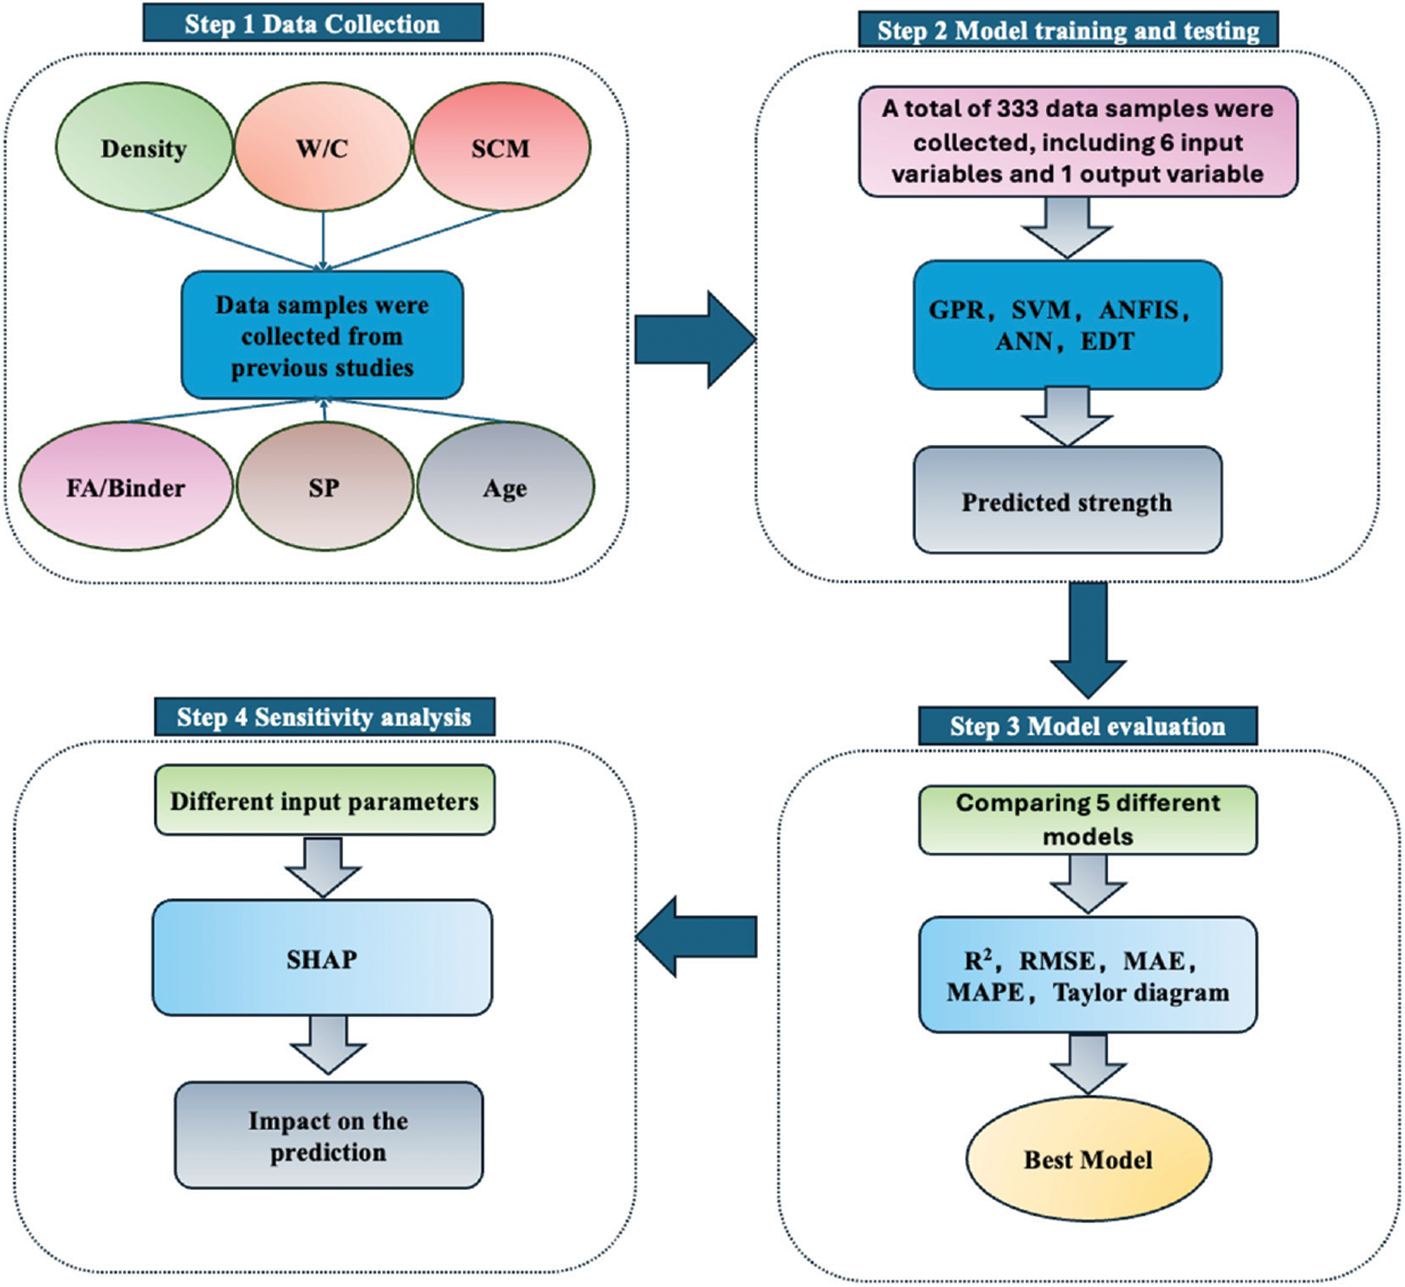
Figure 3: Overall methodology for predicting the compressive strength of foam concrete
This study employed five different machine learning models: GPR, SVM, ANFIS, ANN, and EDT. Each model has unique characteristics that impact the prediction performance in different ways.
GPR is a non-parametric regression method based on Bayesian inference [51]. It was selected for its ability to model uncertainty and fit complex, nonlinear data, which is especially useful when dealing with the noisy data often encountered in concrete material studies [52–54]. It models a Gaussian process for the training data, and during prediction, it provides both the mean and variance of the output. It is suitable for small sample sizes and highly nonlinear datasets. The core formula is as follows:
here, m(x) is the mean function, typically set to 0, and k(x, x′) is the kernel function, which defines the correlation between points. K(X, X) is the covariance matrix between the training data, and
SVM constructs an optimal hyperplane to maximize the margin between different classes and is widely used for classification and regression tasks [55]. The goal is to find the function that deviates the least within the tolerance of error. The core formula is as follows:
here, ω is the weight, C is the penalty parameter, and
ANFIS is a hybrid model that combines fuzzy logic systems with artificial neural networks [56]. It utilizes the self-learning capability of neural networks to optimize the membership function parameters in the fuzzy system, making it suitable for regression and modeling tasks. The core formula is as follows:
here,
ANN is a nonlinear predictive model that simulates the connection mechanism of neurons in the human brain [55]. It has strong fitting and learning capabilities, able to capture complex nonlinear relationships between input variables and output. It is widely used in the field of engineering prediction. The core formula is as follows:
here, Eq. (8) is the weighted sum formula for the neuron’s input, and Eq. (9) is the loss function used for error evaluation. In Eq. (8), xi is the input feature, wi is the weight, and b is the bias. In Eq. (9), yi is the actual value, and
EDT is a type of machine learning method that enhances prediction performance by integrating multiple decision trees [55]. Common forms include Random Forest (RF) and Gradient Boosting Decision Trees (GBDT). These methods have advantages such as strong resistance to overfitting and suitability for high-dimensional nonlinear data.
The dataset used in this study was compiled from over 30 published papers [21–50], which cover various laboratories, regions, and experimental conditions. To minimize the impact of data heterogeneity from different sources, the following measures were implemented: first, studies with clearly defined experimental methods and consistent measurement standards were selected; second, all data were based on compressive strength tests conducted on standard cubic specimens. To reduce bias arising from differences in specimen sizes, reduction coefficients based on relevant standards and literature were applied to convert the strengths of specimens with different sizes to equivalent standard cubic compressive strengths. Additionally, all numerical input variables were standardized, and obvious outliers were removed. These preprocessing steps ensured the physical comparability and statistical consistency of the data, thereby enhancing the reliability and generalization ability of the model training.
To mitigate the risk of overfitting, the 5-fold cross-validation method was employed in this study. Specifically, the dataset was divided into five subsets. In each experiment, one subset was selected as the validation set, while the remaining four subsets were used as the training set for model training and evaluation. By alternately using different validation sets, 5-fold cross-validation effectively assessed the model’s performance on various data subsets, ensuring its generalization ability and reducing the risk of overfitting. The implementation of this method improved the reliability and stability of model evaluation.
3.4 Model Accuracy Evaluation Metrics
In order to comprehensively evaluate the predictive accuracy of the models, this study used the following key metrics:
Coefficient of Determination (R2): This is a metric used to assess the goodness of fit of the model, and its value typically ranges from 0 to 1. The closer the value is to 1, the better the model fits the data. The formula is as follows:
Root Mean Square Error (RMSE): This is a metric that measures the difference between the model’s predictions and the actual values. It can be used to evaluate the accuracy of regression models and help assess the model’s predictive ability. The smaller the value, the stronger the model’s predictive ability. The formula is as follows:
Mean Absolute Error (MAE): This is a metric that measures the prediction accuracy of a regression model and intuitively represents the difference between the predicted values and the actual values. The formula is as follows:
Mean Absolute Percentage Error (MAPE): This metric reflects the relative error of the predictions by calculating the average absolute percentage error between the predicted values and the actual values. The smaller the value, the better. The formula is as follows:
3.5 Hyperparameter Optimization
In this study, the hyperparameters of the Gaussian Process Regression (GPR) model were tuned using Bayesian Optimization. The optimization process used the ‘Expected Improvement Plus’ acquisition function, with a maximum of 30 iterations. The hyperparameters optimized include the basis function (constant), kernel function (non-isotropic quadratic rational kernel), kernel length scale, signal standard deviation, and Sigma. As shown in the figure, the final optimized Sigma value was 0.1624, and the kernel length scale was automatically selected as 64.82, with the model trained under standardized conditions. Other models (such as SVM, ANN, ANFIS, and EDT) were not subjected to hyperparameter optimization and used the default parameter settings.
In this study, 70% of the collected data sets (233) were randomly chosen for model training, while the remaining data sets (100) were used for model testing to compare and evaluate the prediction performance of different models. As shown in Figs. 4–8, the predicted compressive strength, actual compressive strength values, and the error between them (i.e., the prediction error of different models) are displayed. It is clearly visible from the figures that the actual strength and predicted strength in the test data of the GPR model differed only slightly, whereas the error values for the ANN and ANFIS models were more significant. Further evidence of the GPR model’s accuracy, compared to other models, can be seen in the error graphs below. Overall (considering both the training and testing phases), the GPR model consistently shows predicted strengths that were close to the actual strengths, with the prediction error being the lowest among the five machine learning models.
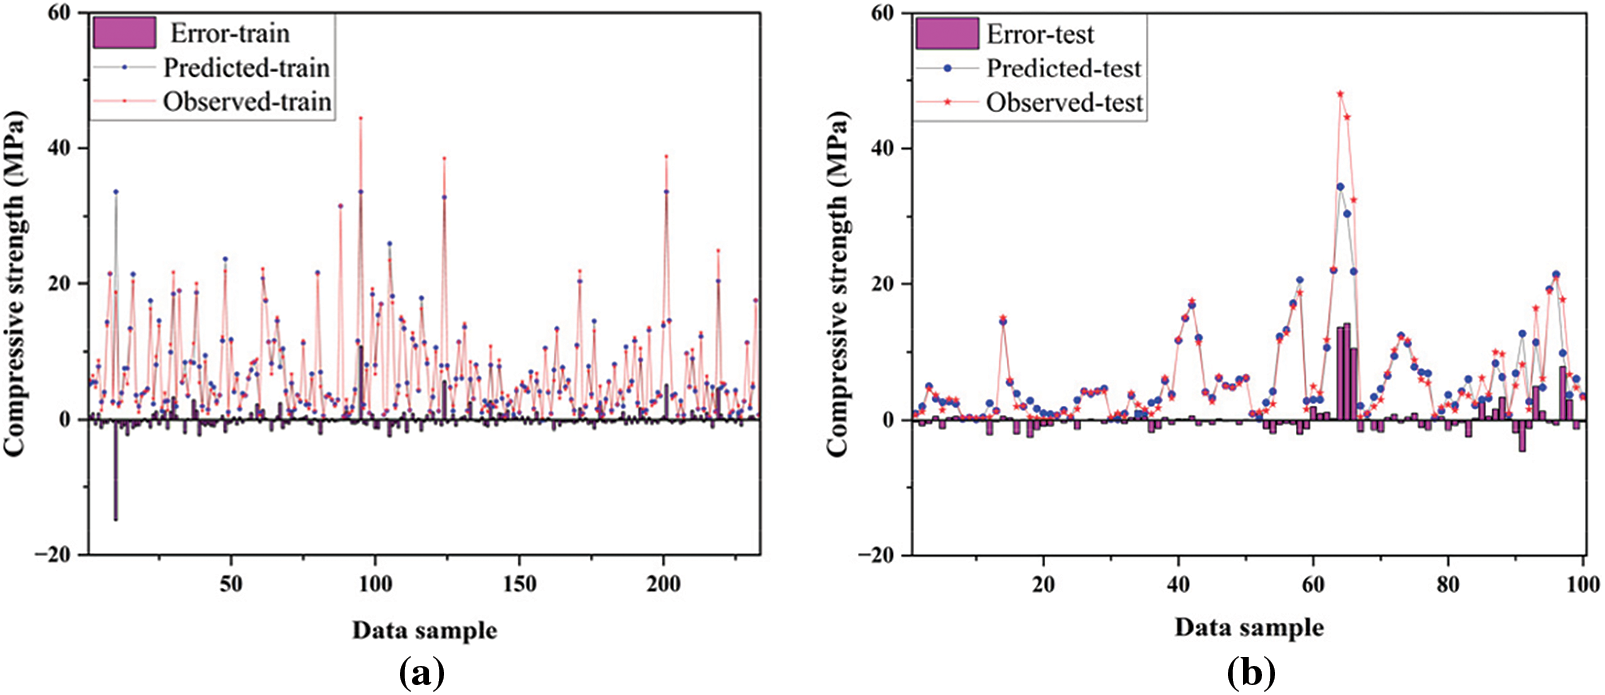
Figure 4: Comparison between observed and predicted compressive strength using GPR. (a) Training; (b) Testing
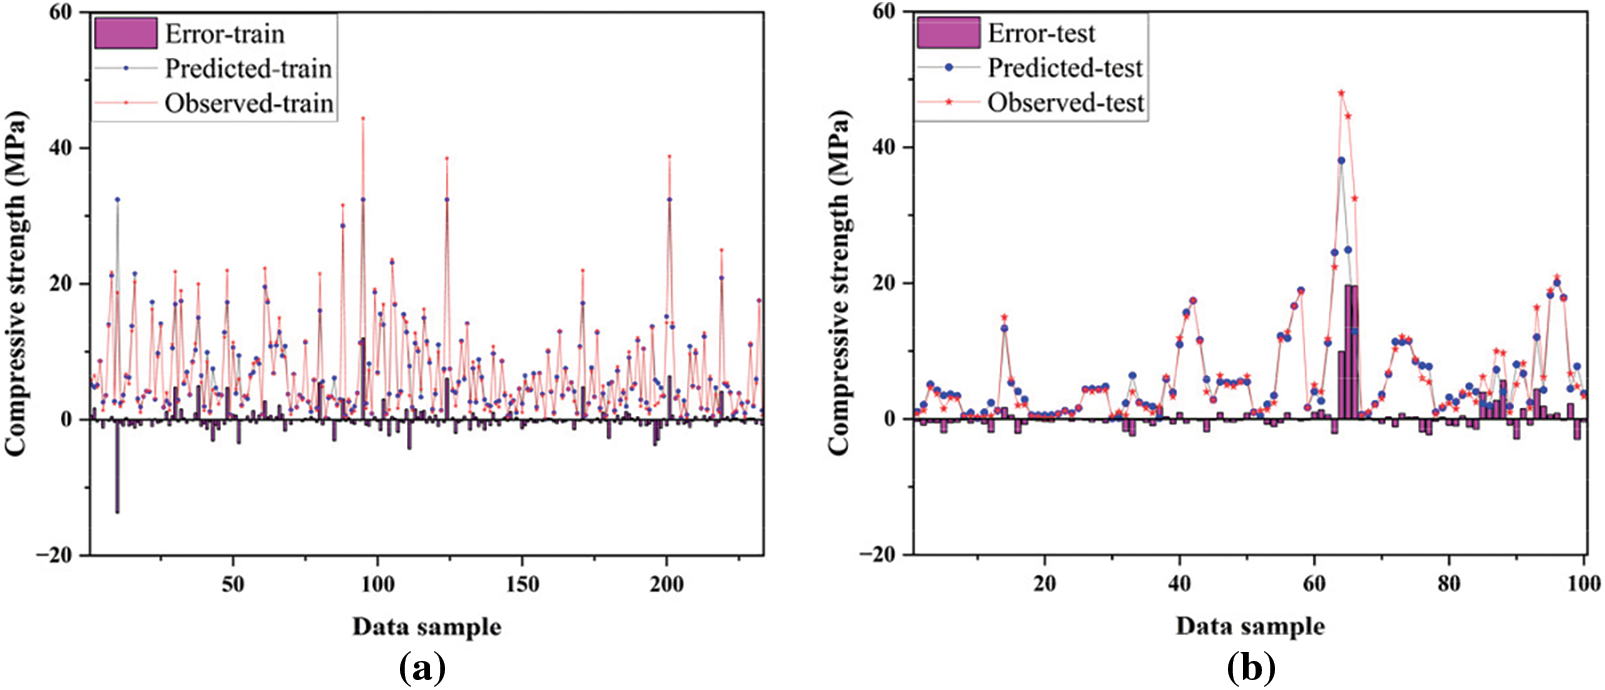
Figure 5: Comparison between observed and predicted compressive strength using SVM. (a) Training; (b) Testing
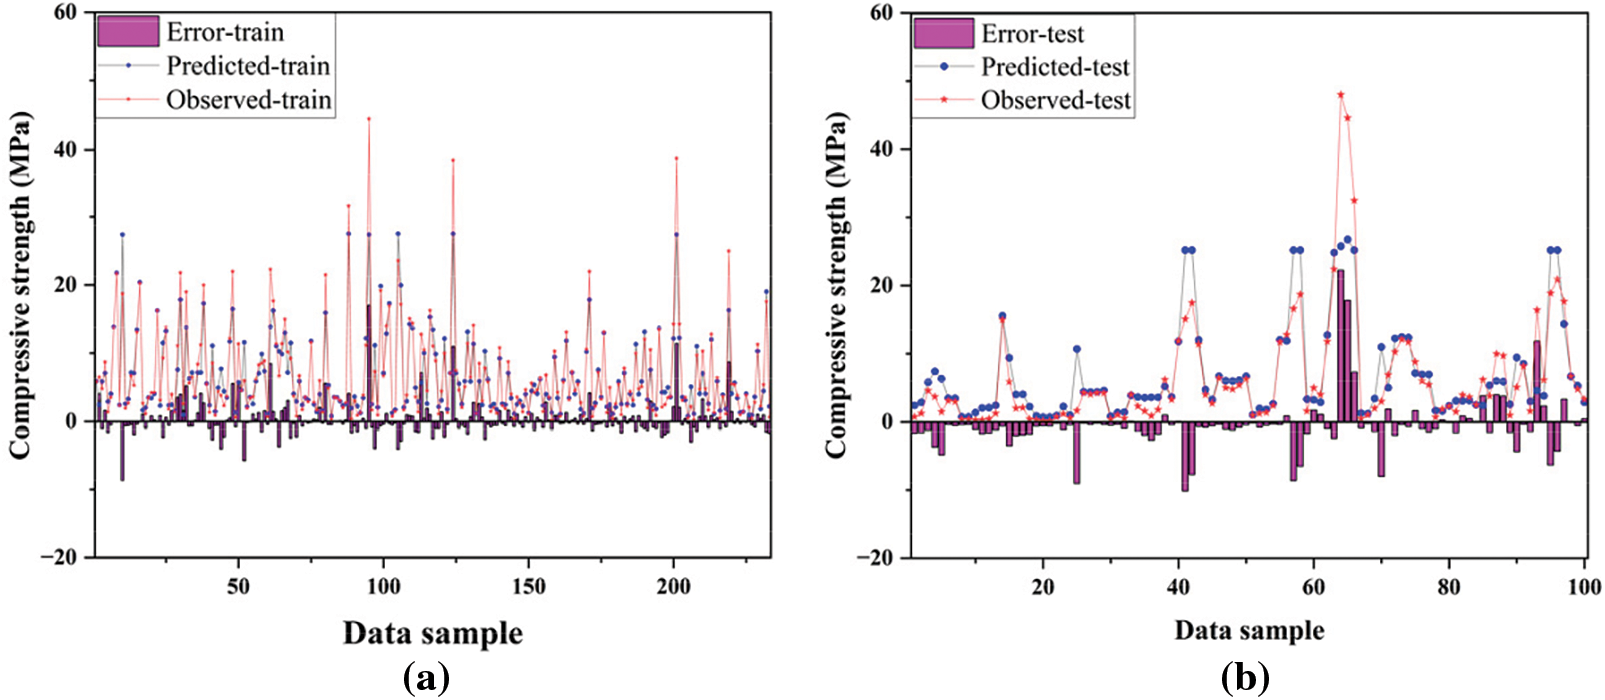
Figure 6: Comparison between observed and predicted compressive strength using ANFIS. (a) Training; (b) Testing
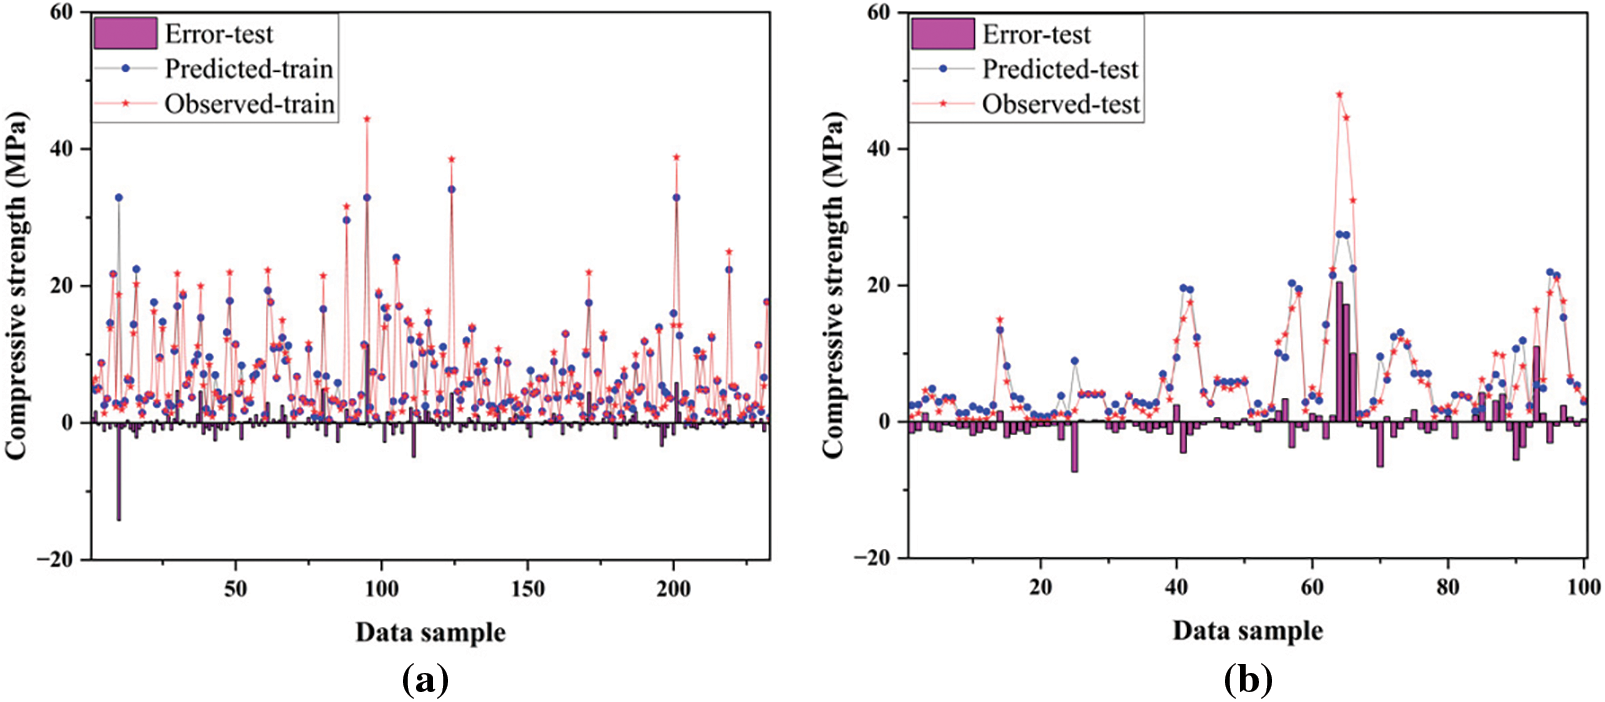
Figure 7: Comparison between observed and predicted compressive strength using ANN. (a) Training; (b) Testing
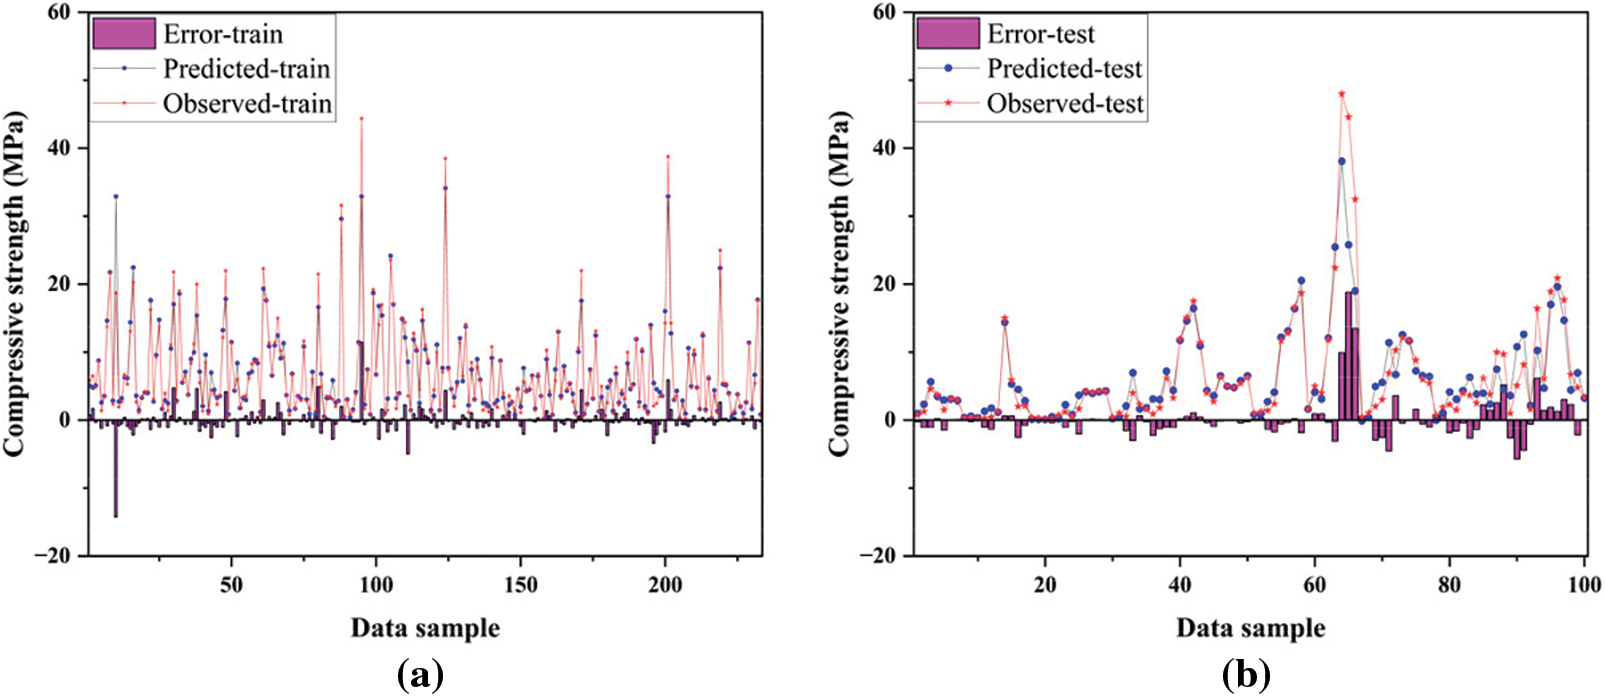
Figure 8: Comparison between observed and predicted compressive strength using EDT. (a) Training; (b) Testing
Figs. 9–13 present an accuracy analysis of different prediction models in predicting the compressive strength performance of foam concrete. The regression analysis of the training data (a) and testing data (b) can be clearly observed from the figures. From the (a) sections of Figs. 8–12, it can be seen that during the training phase, most of the data points for the GPR model, SVM model, and EDT model were distributed around the line y = x, with only a few points falling outside the ±20% region. This indicates that these three models had relatively good prediction accuracy during the training phase. In contrast, the data points for the ANFIS and ANN models were more scattered during the training phase, with a relatively larger number of points outside the ±20% region, suggesting that these two models had lower accuracy in predicting the compressive strength of foam concrete compared to the first three models. In the (b) sections of Figs. 8–12, it can be observed that the prediction accuracy of each model decreased during the testing phase compared to the training phase. This is evident from both the changes in the R2 values and the distribution of the data points. However, the performance of the GPR model remained outstanding among the five models. In terms of the R2 value, the GPR model maintained a relatively high level during the testing phase. As for the distribution of the data points, although there was a slight increase in the proportion of data points outside the ±20% region in the testing phase, the majority of the data points were still distributed around the line y = x, indicating the stability of its predictive capability.
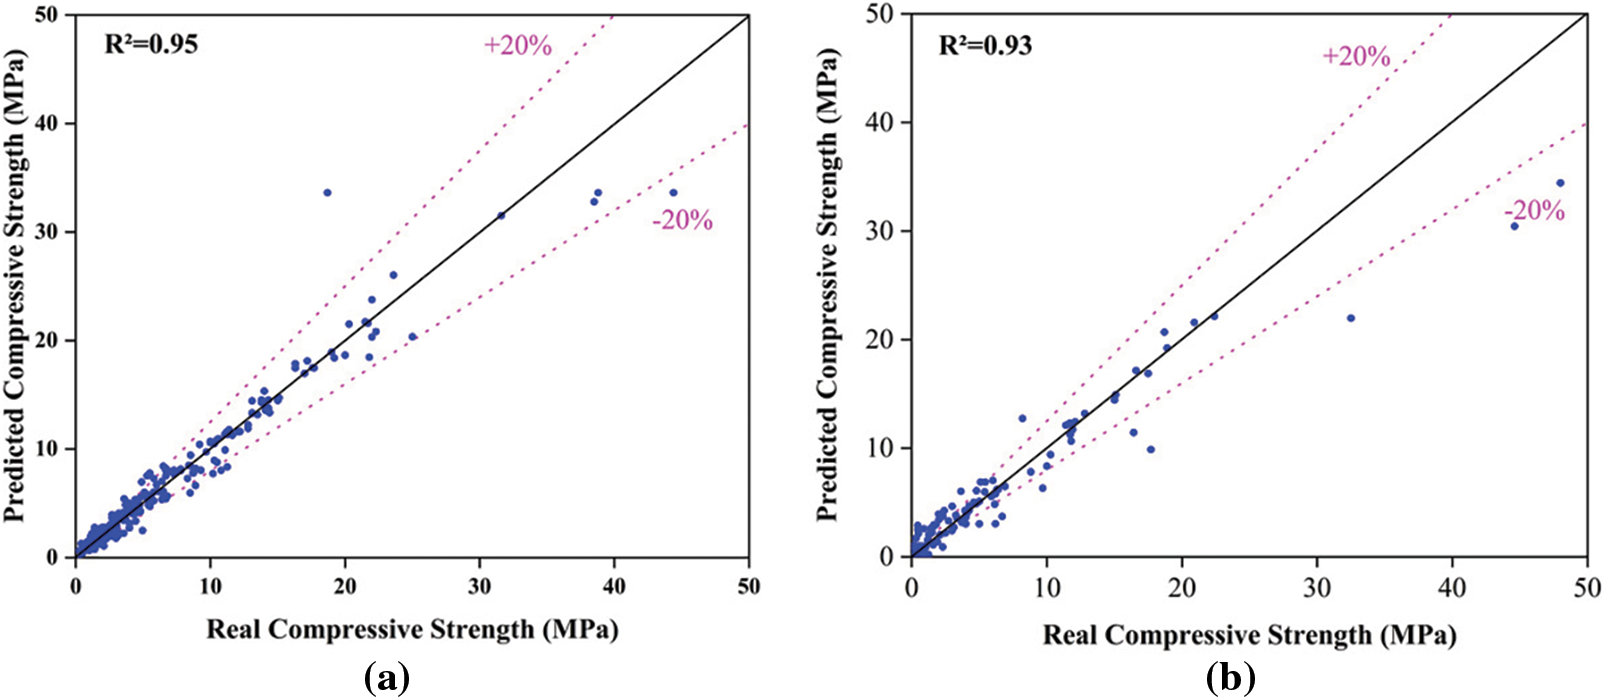
Figure 9: Regression analysis for GPR model. (a) Training; (b) Test
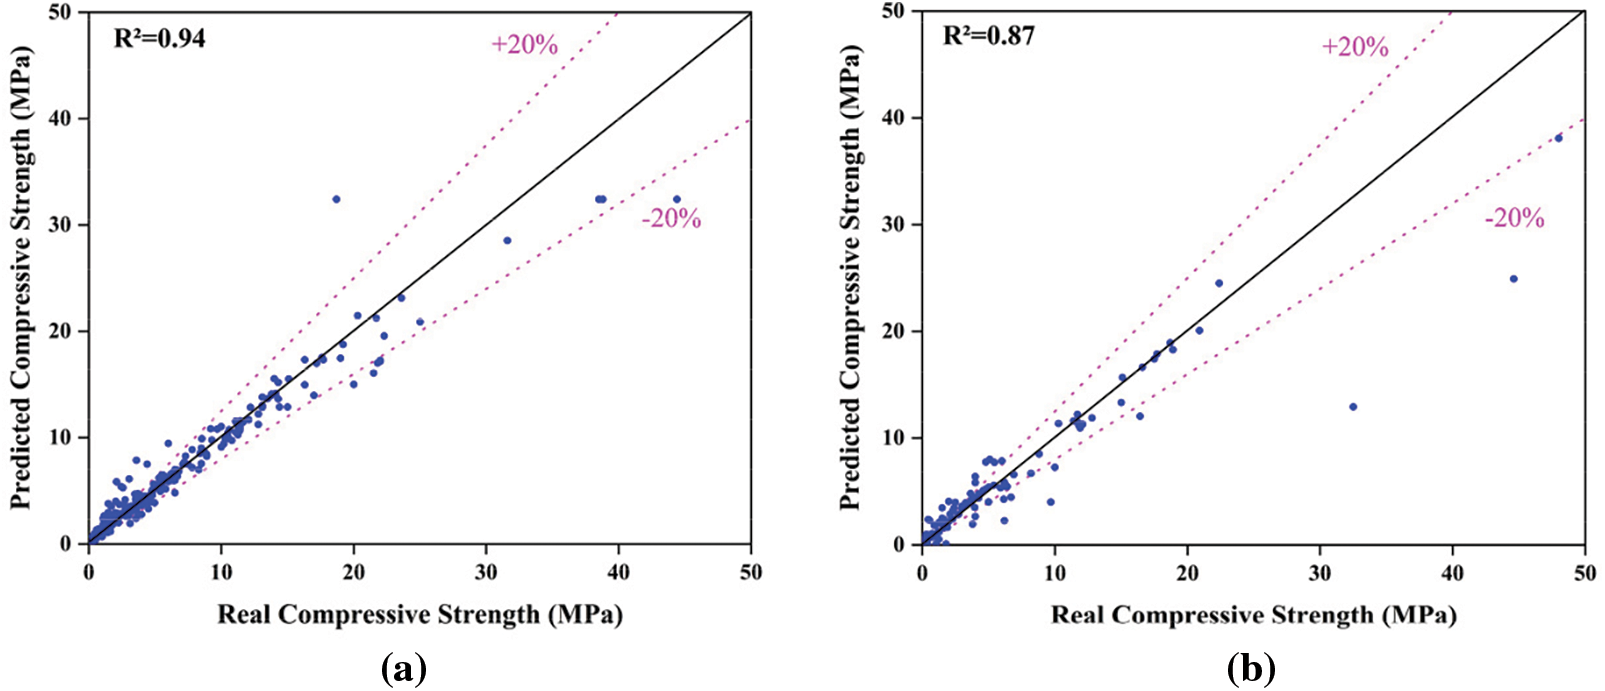
Figure 10: Regression analysis for SVM model. (a) Training; (b) Test
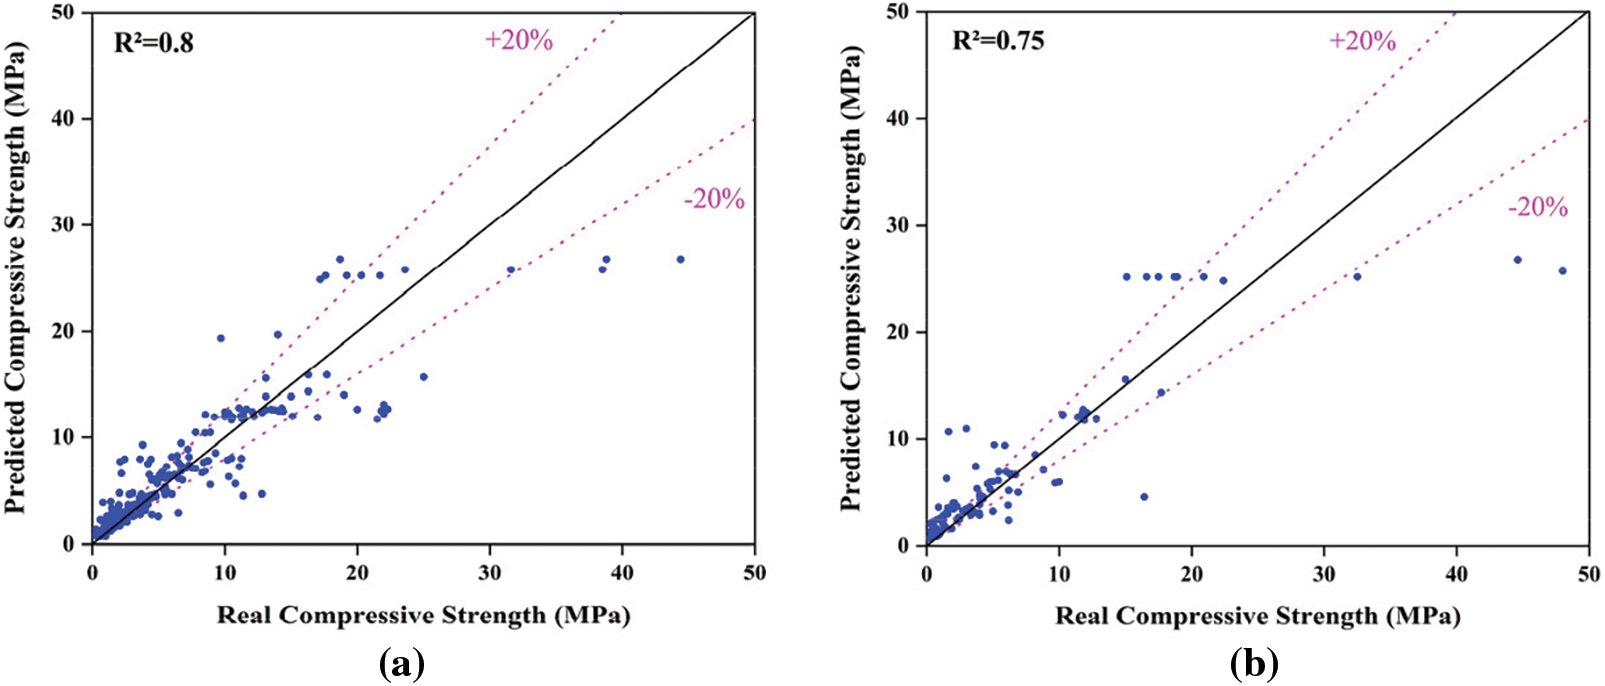
Figure 11: Regression analysis for ANFIS model. (a) Training; (b) Test
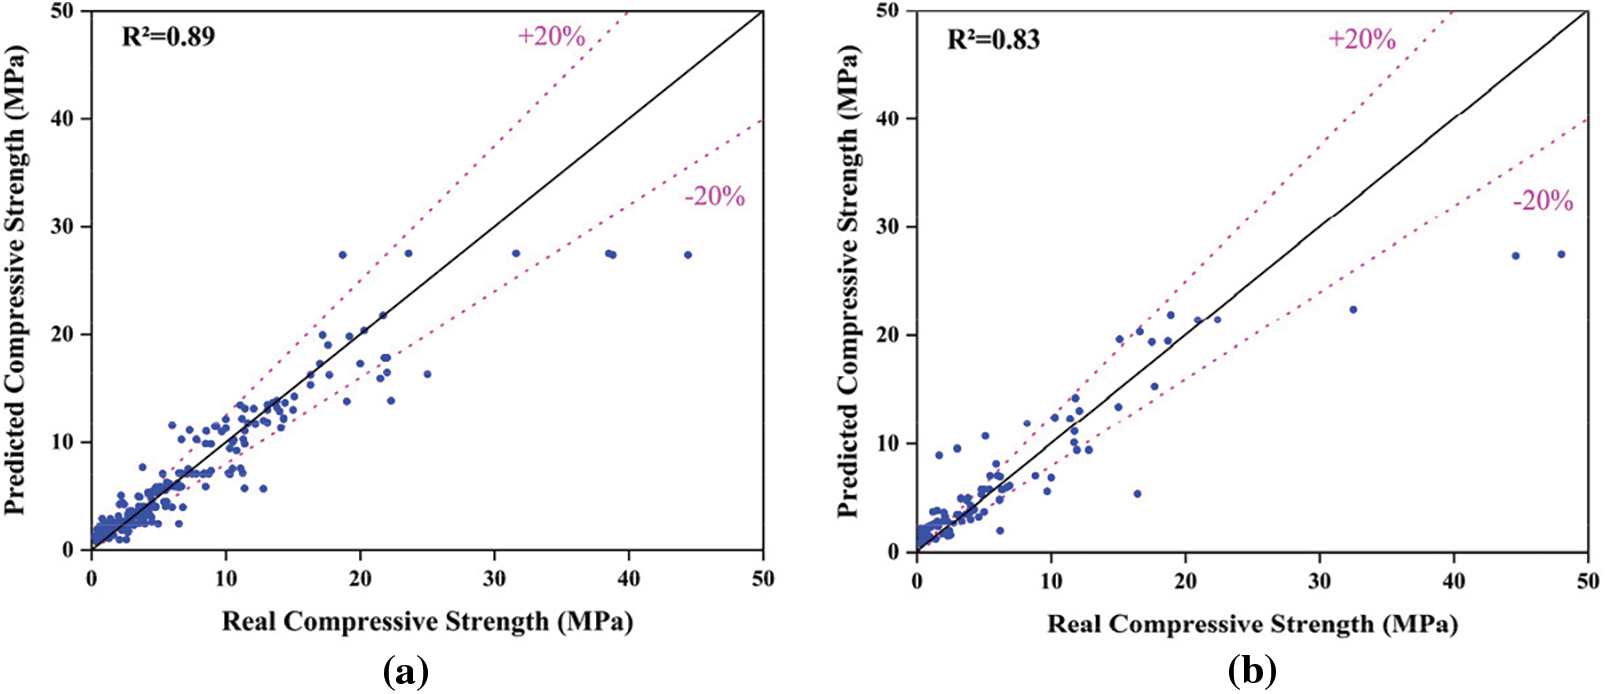
Figure 12: Regression analysis for ANN model. (a) Training; (b) Test
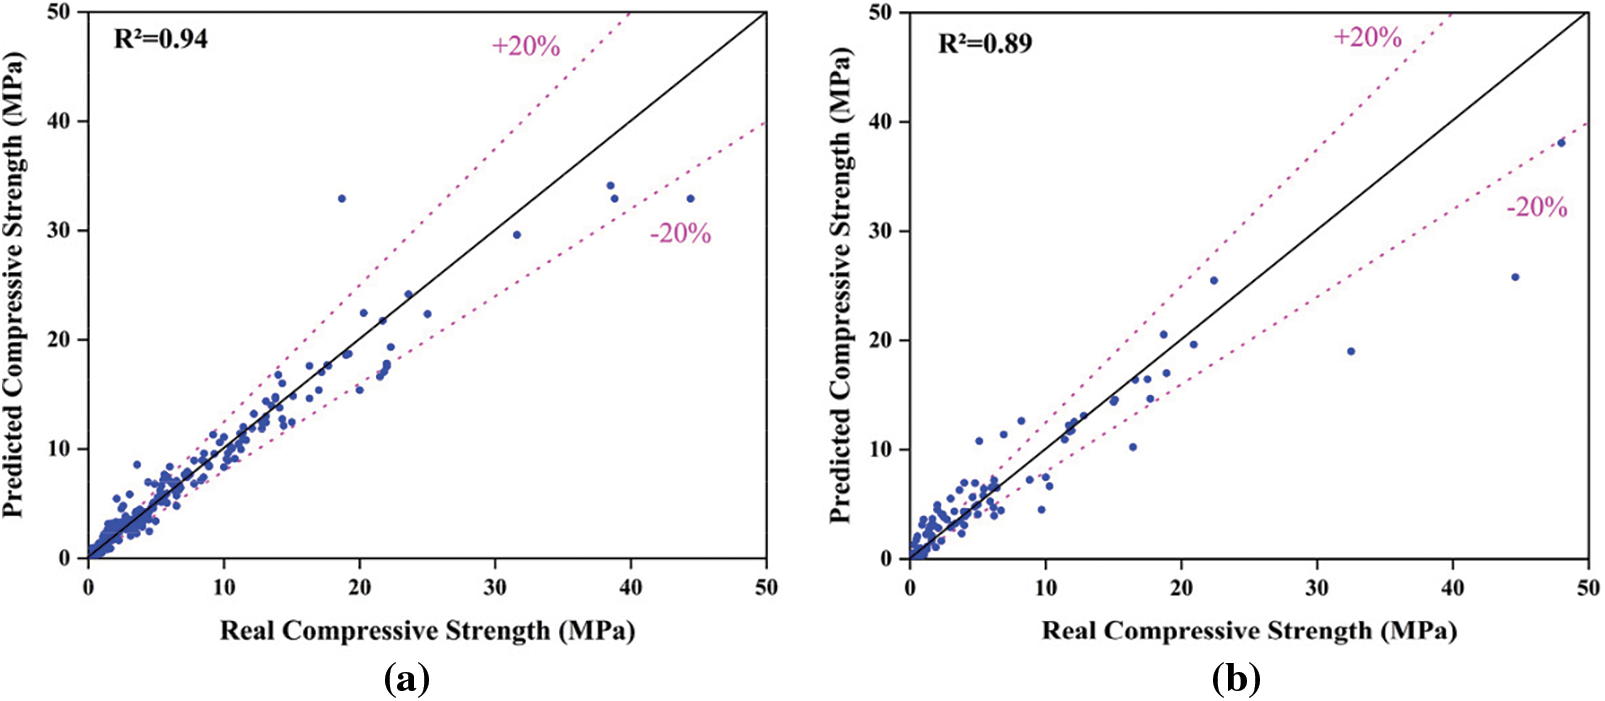
Figure 13: Regression analysis for EDT model. (a) Training; (b) Test
Figs. 14–17 present a comparison of four different metrics (R2, RMSE, MAE, and MAPE) for predicting the compressive strength of foam concrete using different machine learning models, with the results displayed in a radar chart. The results show that the GPR model outperforms the SVM, ANFIS, ANN, and EDT models in all metrics. As seen from the chart, during the training phase, most of the GPR model’s data ranked first, with an R2 value of 0.95. In this phase, the R2 values of the SVM and EDT models were also comparable to the GPR model, at 0.94 and 0.94, respectively. However, the ANFIS and ANN models performed somewhat less impressively, with R2 values of 0.8 and 0.89, respectively. In terms of MAE and RMSE, the differences between the GPR model and the other models were more significant. During the training phase, the GPR model had an MAE value of 0.81 and an RMSE value of 1.6, while the SVM, ANFIS, ANN, and EDT models had MAE values of 0.89, 1.78, 1.38, and 0.9, respectively, during the same phase. The RMSE values for these four models were 1.8, 3.13, 2.44, and 1.75, respectively. However, in terms of MAPE, although the GPR model is not the best, it still performed well. Clearly, based on the various parameters in the training phase, the GPR model demonstrated significantly higher accuracy in predicting the compressive strength of foam concrete compared to the other models. The SVM model closely followed the GPR model, while the EDT, ANN, and ANFIS models ranked third, fourth, and fifth, respectively.
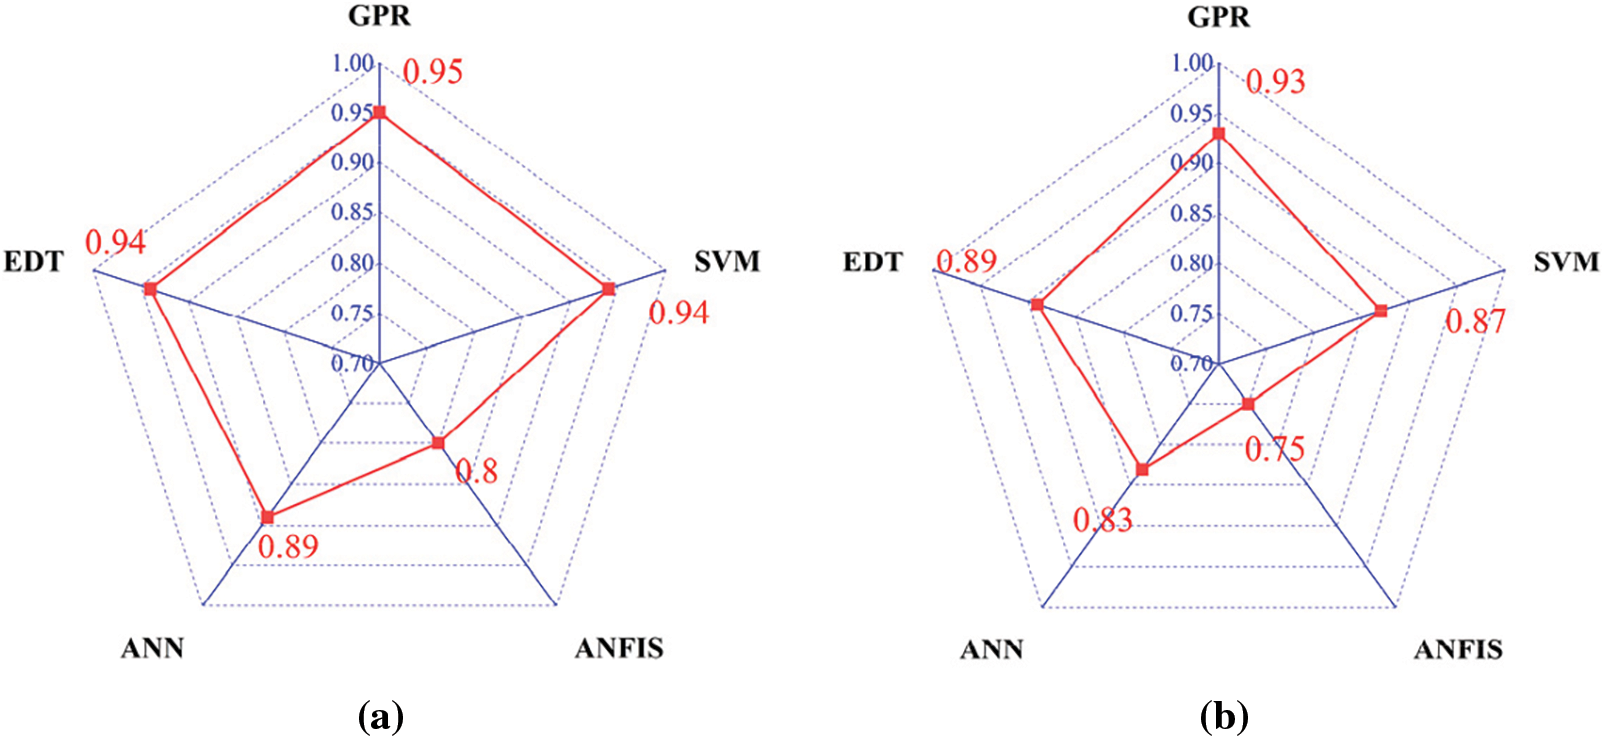
Figure 14: Radar plots of R2 for different machine learning models. (a) Training; (b) Test
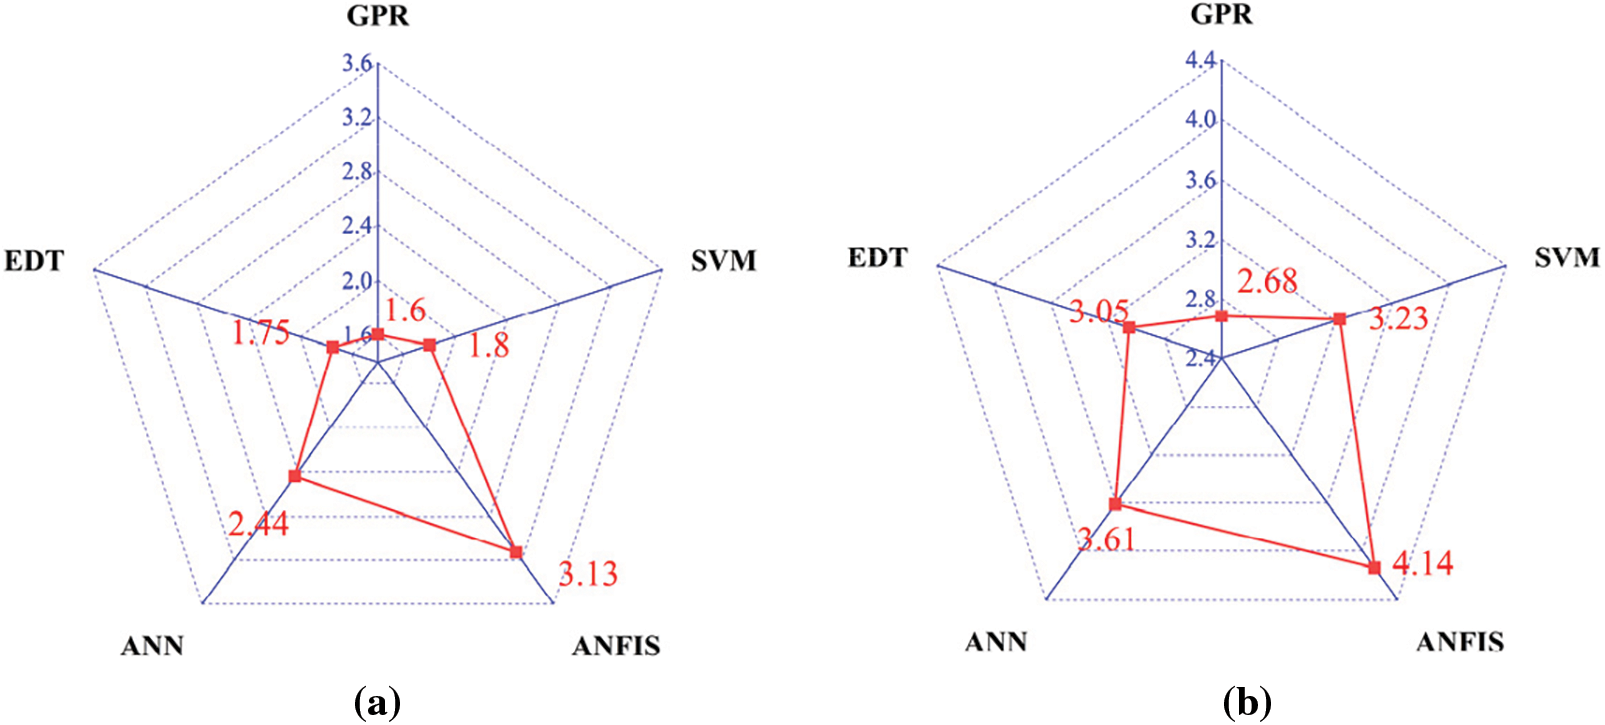
Figure 15: Radar plots of RMSE for different machine learning models. (a) Training; (b) Test
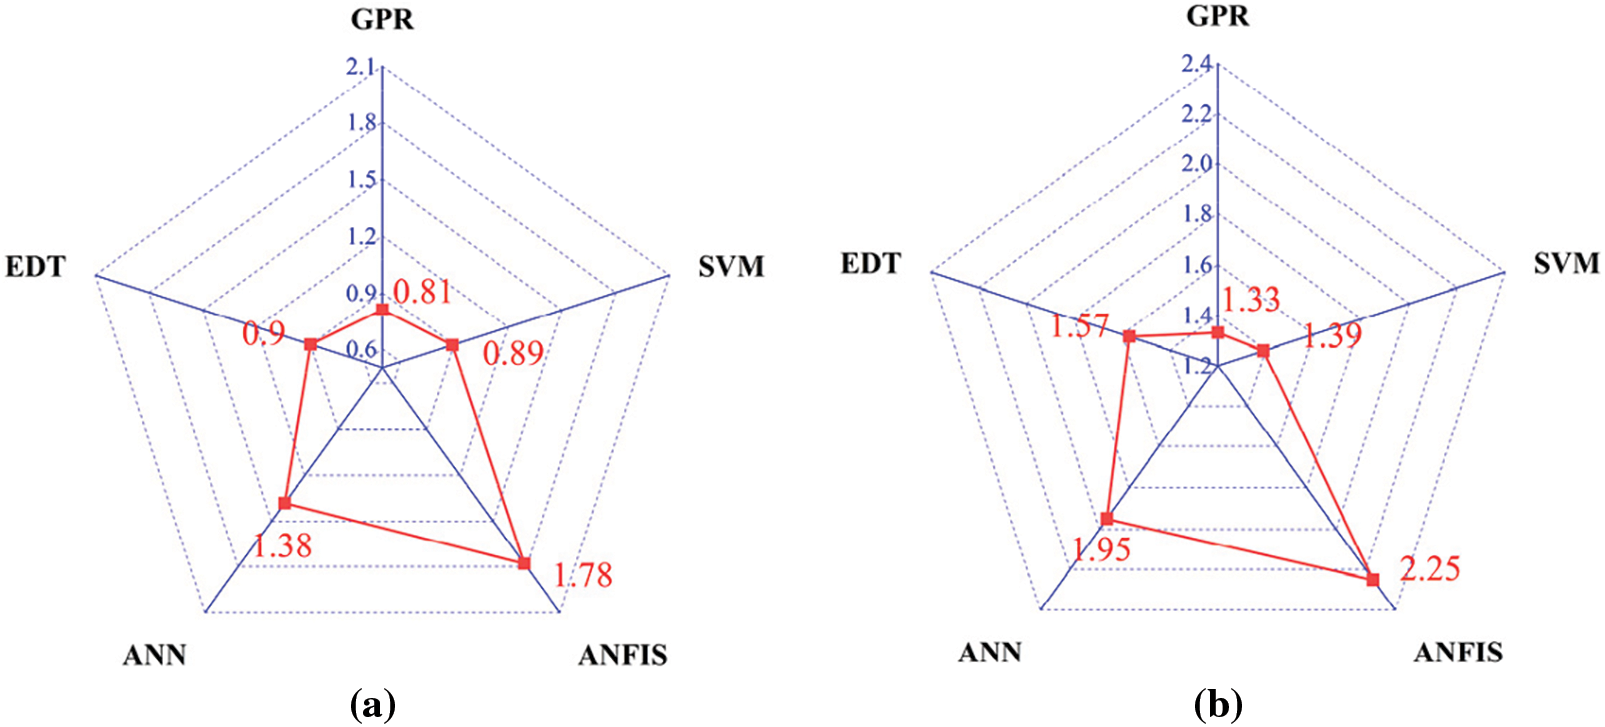
Figure 16: Radar plots of MAE for different machine learning models. (a) Training; (b) Test
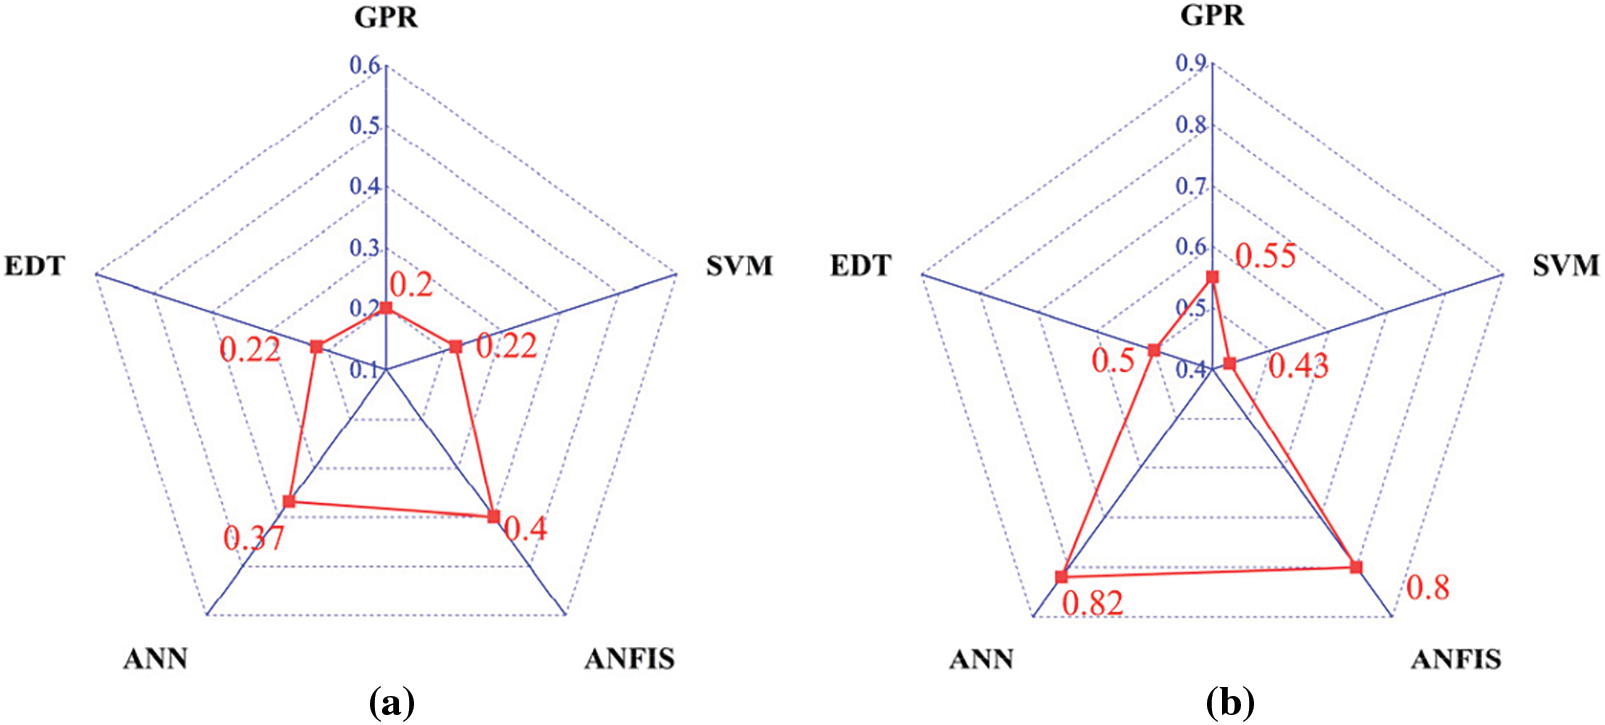
Figure 17: Radar plots of MAPE for different machine learning models. (a) Training; (b) Test
During the testing phase, the performance of the GPR model remained excellent. In terms of the R2 value, it continued to perform optimally, reaching an R2 value of 0.93, while the R2 values for the SVM, ANFIS, ANN, and EDT models were 0.87, 0.75, 0.83, and 0.89, respectively. The GPR model’s RMSE and MAE values remained the best compared to the other four models, which were 2.68 and 1.33, respectively. In terms of the MAPE metric during the testing phase, the performance of the five models was consistent with that in the training phase. Although the GPR model’s value was not the best, it was still quite close to the values of the SVM and EDT models.
To further validate the robustness of the GPR model, additional evaluations were conducted using different training-to-testing data ratios. Specifically, the model was assessed under various conditions, including 70%:30%, 80%:20%, and 60%:40% splits, to examine its performance across different data distributions. As presented in Table 2, the evaluation results demonstrate that the model maintains stable and reliable performance in both training and testing phases, as evidenced by consistently high R2 values and acceptable levels of RMSE and MAE.
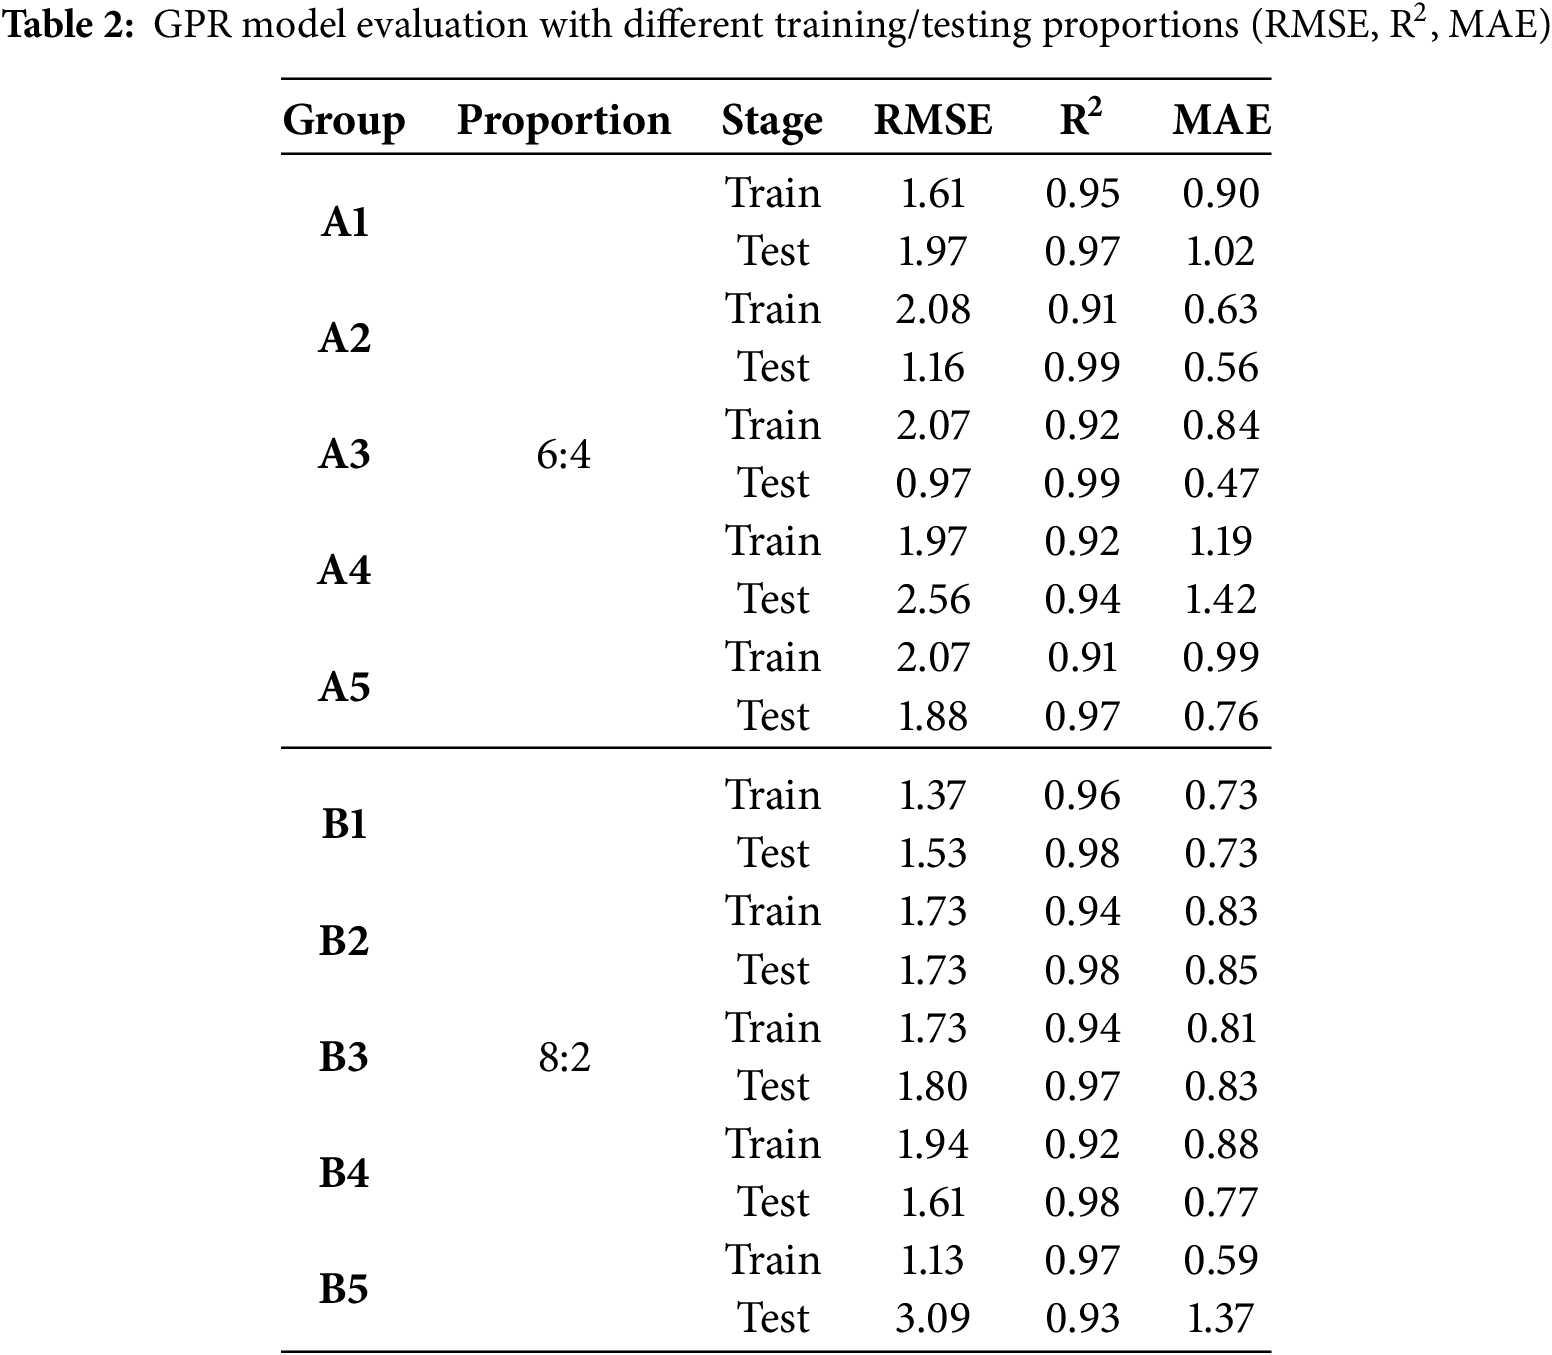
Notably, the model exhibited strong generalization capabilities across the 60%:40% and 80%:20% scenarios, with most test-stage R2 values exceeding 0.93. Although slightly elevated RMSE and MAE values were observed in a few groups (e.g., A4 and B5), the overall prediction errors remained within acceptable ranges. These results confirm the robustness of the GPR model with respect to data partitioning and support its reliability under varying data condition.
The error distribution between the predicted values and the actual values during the testing phase for the five different models used in this study to predict the compressive strength of foam concrete can be seen in Fig. 18. By observing the error distribution chart and comparing the errors of different models, it helps to assess the prediction quality and generalization ability of the models, as well as to select the optimal model. From Fig. 18, it can be seen that the error distribution of the GPR model was the most concentrated, with most of the errors close to zero, indicating that its predicted results were highly consistent with the actual values, exhibiting high prediction accuracy and stability. The error distribution of the GPR model was relatively symmetrical, and there were no obvious extreme values, showing its efficiency and robustness in handling the compressive strength of foam concrete, and its ability to fit the trend of the actual data well. In contrast, the error distribution of the SVM model, although somewhat concentrated, had a slightly wider error range compared to GPR and contained some large outliers. This suggests that while the SVM model could provide relatively accurate predictions, its stability during the prediction process was slightly worse, especially in the extreme value regions of the data, where the model performed less reliably than GPR. The error distribution of the ANFIS model was more dispersed; although some data points were concentrated near zero, the overall error was larger and fluctuated more, indicating that the model’s predictive ability for the compressive strength of foam concrete was inferior to that of GPR, and the model’s stability was poor. The error distribution of the ANN model was also widespread, with data points scattered and many outliers. This implies that the ANN model experienced significant errors during prediction, particularly when dealing with more complex or noisy data, resulting in higher uncertainty and poor performance. The error distribution of the EDT model, although more concentrated and similar to GPR, still shows a slightly more dispersed error range and some bias compared to GPR.
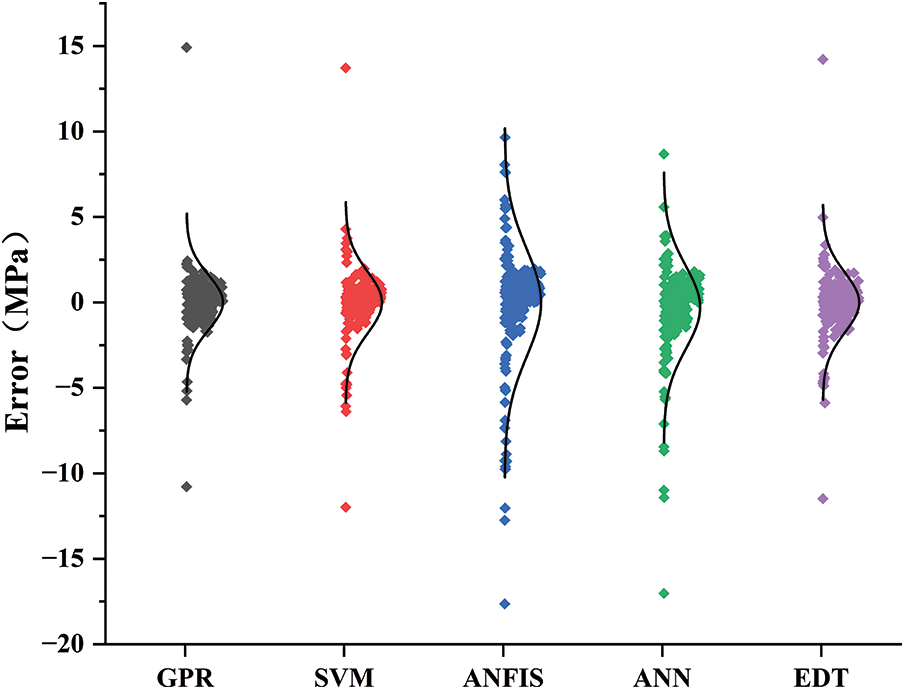
Figure 18: Error distribution of different models on the test dataset
The prediction errors of the model show a clear parameter dependence. As shown in Fig. 19, when the density of foam concrete is below 800 kg/m3, the predicted strength exhibits significant systematic negative bias (up to −15 MPa), while in the high-density region (>1600 kg/m3), the error narrows to −10 MPa. This trend may be related to the increased complexity of the internal pore structure in low-density materials, causing the strength evolution to deviate from the assumptions of the model.
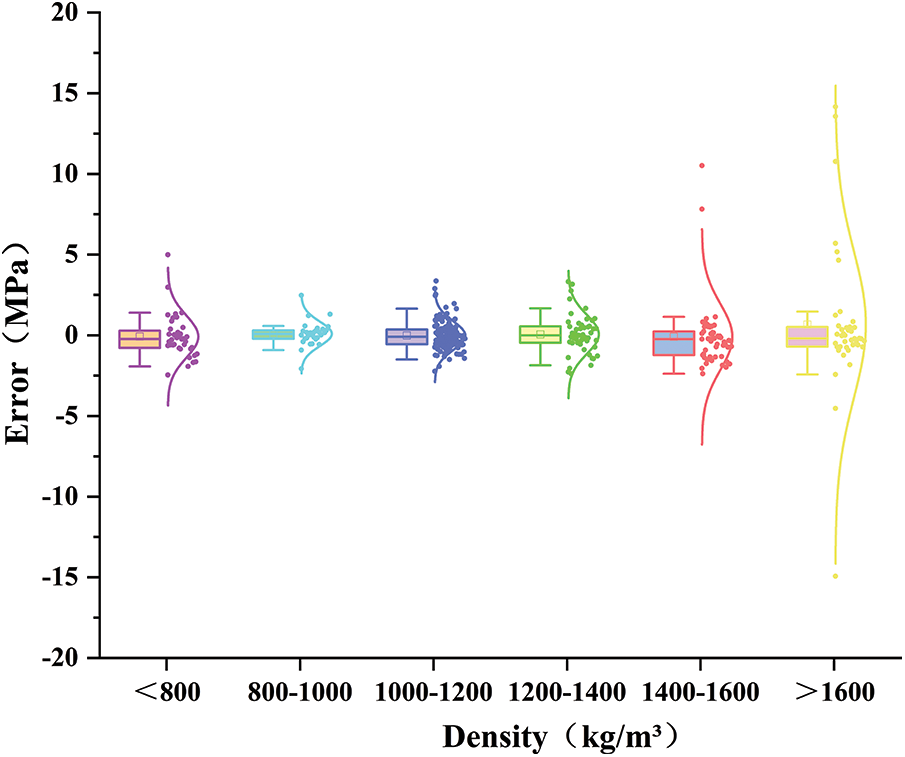
Figure 19: Prediction error of the GPR model across different foam concrete densities
Fig. 20 further illustrates that the model’s prediction accuracy is lowest for samples with curing times ≤7 days (with errors reaching −18 MPa at 3 days). This is because early hydration reactions have not yet stabilized, and the strength development shows strong nonlinearity. However, when the curing time is extended to 28 days, the error significantly decreases to within −5 MPa. The above analysis indicates that future research should focus on expanding the data for low-density and early curing samples and optimizing feature engineering.
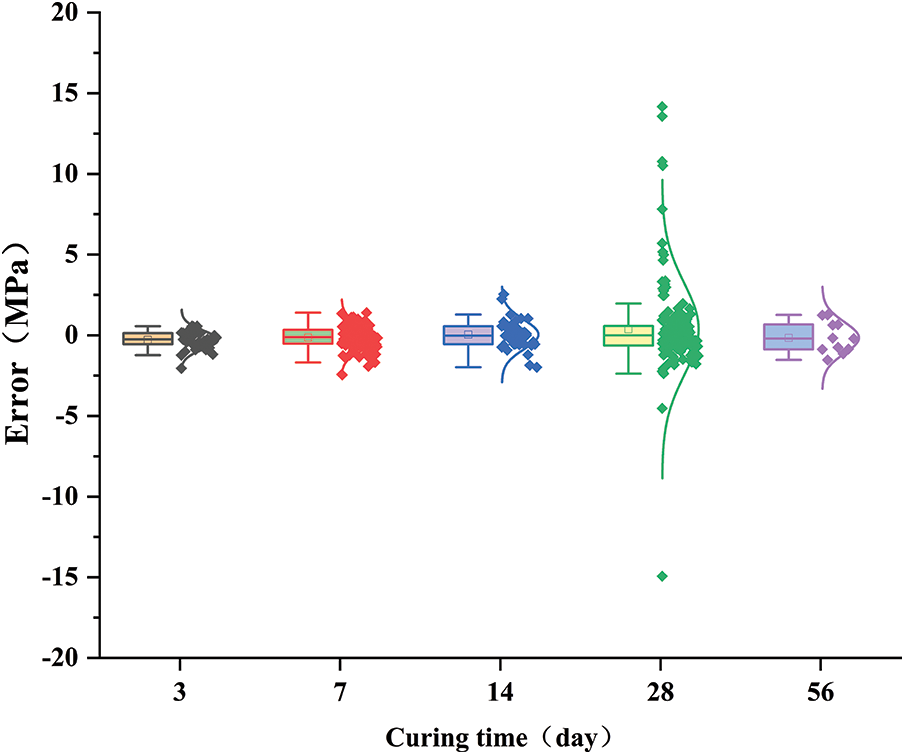
Figure 20: Prediction error of the GPR model under different curing times
From the Taylor diagram (Fig. 21), it can be observed that the five models (GPR, SVM, ANFIS, ANN, EDT) show significant differences in performance across two dimensions: standard deviation and correlation coefficient. The GPR model was positioned at the optimal point on the diagram, with a standard deviation close to the minimum value, indicating very small prediction errors, and most data points were concentrated near the actual values, showing extremely high precision and stability. Additionally, the correlation coefficient of GPR was close to 1, suggesting a very high fit with the actual data, effectively capturing the variation trend of the compressive strength of foam concrete, demonstrating the strongest predictive capability. Furthermore, the SVM model also performed well, with a slightly higher standard deviation than GPR, but its correlation coefficient was similarly close to 1, showing prediction accuracy comparable to GPR. The error distribution was also relatively concentrated, indicating stable and reliable prediction performance in practical applications. The positions of the ANFIS and ANN models were closer to the higher standard deviation region, indicating that their prediction results were more volatile, with a more scattered error distribution, showing poor stability. Particularly, the ANN model had a larger standard deviation and a lower correlation coefficient, suggesting that its prediction accuracy and stability were not as good as those of GPR and SVM. Furthermore, while the EDT model had a correlation coefficient close to 1, indicating a high correlation with the actual values, its standard deviation was large, suggesting high volatility in its prediction results and poor stability, especially with significant errors in predicting some extreme values.
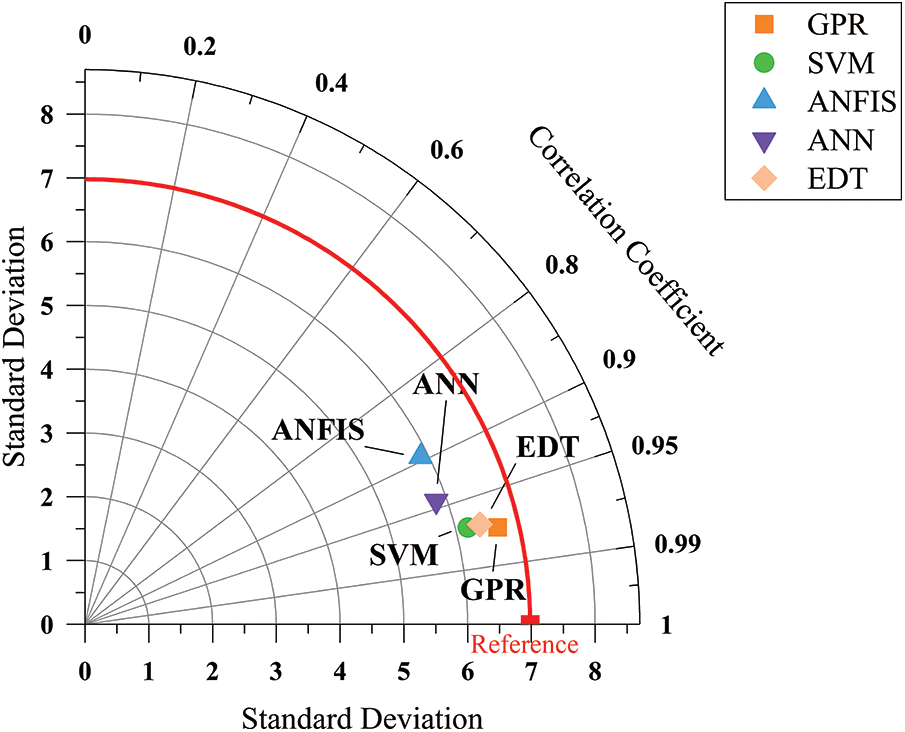
Figure 21: Taylor diagram comparing the performance of different prediction models
Based on the performance of the various models in the above evaluations, it can be concluded that GPR is the optimal model for this study. This is because GPR, based on Bayesian optimization, can accurately tune the key hyperparameters of the model, allowing it to better fit complex nonlinear relationships compared to other models [57,58]. Additionally, GPR is able to quantify the uncertainty of predictions, which is especially important when dealing with the noise and uncertainty commonly present in experimental data for foam concrete. In contrast, while SVM can handle complex nonlinear relationships, it is more sensitive to hyperparameters and outputs only the compressive strength as a single prediction value, lacking an assessment of model uncertainty, which affects the reliability of the prediction results. ANFIS combines the advantages of neural networks and fuzzy logic, theoretically performing well when handling multiple uncertainties in foam concrete strength. However, its training process is complex, and it is highly sensitive to the choice of initial parameters, which can lead to poor model stability [59,60]. While ANN has strong fitting ability, it is prone to overfitting, especially in cases with small datasets or high noise, which limits its generalization capability [61]. EDT, by integrating multiple decision trees for regression, is simple and less prone to overfitting, but it exhibits lower prediction accuracy when dealing with complex data and is easily affected by data noise, showing significant instability [62]. GPR, with its excellent fitting ability, stability, and capability to handle the complexity and uncertainty in data, becomes the best predictive model for predicting the compressive strength of foam concrete under the influence of multiple input parameters.
In this study, the SHAP method was primarily used to analyze the sensitivity of model inputs. SHAP is a widely adopted interpretability tool in the field of machine learning. It helps deeply understand the decision-making process of complex models by calculating the contribution of each feature to the final prediction [63]. By evaluating all possible feature combinations, SHAP can quantify the impact of individual features on the model output, thus assigning reasonable and consistent importance weights to the features. The core advantage of SHAP lies in its fairness and transparency. By quantifying the performance of different features in various predictions, SHAP values provide clear and interpretable feedback to the model, helping identify the most critical features in predicting the compressive strength of foam concrete. Furthermore, SHAP exhibits consistency, meaning that the sum of all feature importances equals the difference between the model output and the baseline value. This property not only enhances the reliability of feature comparisons but also makes it more intuitive to understand how features interact and influence predictions. Therefore, SHAP provides strong support for improving the transparency and interpretability of the model.
However, the SHAP method has a notable limitation. It requires low correlation between input parameters, as it assumes that features are independent of each other. When handling highly correlated features, issues with inaccurate contribution allocation may arise [64]. Therefore, in this study, a correlation analysis of the input parameters was conducted prior to the SHAP analysis, as shown in Fig. 2. The analysis results indicate that the correlation between input parameters is low, ensuring the accuracy of the SHAP analysis results.
Fig. 22 shows the importance of different input variables in predicting the compressive strength of foam concrete through a pie chart. Among them, density accounts for the largest share (43%), followed by the W/C at 20.6%, Age at 13.6%, SP at 11.2%, and the FA/Binder at 11.6%. The impact of SCM was very small. Fig. 23 presents the specific contributions of each input parameter to the compressive strength prediction using SHAP values. The SHAP analysis results indicate that the dry density of foam concrete makes the greatest contribution to the prediction of compressive strength among the input variables. This phenomenon can be explained by the fundamental principles of materials engineering: in foam concrete, density reflects the combined effects of porosity and the compactness of the material structure. Higher density typically implies lower porosity and a denser aggregate-cement matrix, which enhances the overall strength of the material. Additionally, variations in density indirectly reflect the combined effects of slurry composition, foaming agent stability, and curing conditions. Therefore, its dominant influence in the model aligns with the mechanical behavior of foam concrete. In contrast, the water-cement ratio (W/C) ranks second in contribution, which can be explained by its direct impact on the microstructure of concrete. The water-cement ratio directly affects the hydration reaction of the cement paste and the formation of its microstructure, thereby influencing the density and strength of the concrete. However, because its effect on the microstructure is indirect and often mediated through density, its contribution comes after dry density. The contribution of supplementary cementitious materials (SCM) is the lowest, which is primarily due to the more indirect nature of SCM’s effect. SCM generally enhances strength by improving the microstructure of the cement paste and enhancing durability, but these effects are more limited in foam concrete. Furthermore, the impact of SCM on the microstructure of foam concrete is slower and smaller, resulting in its relatively lower contribution in the model.
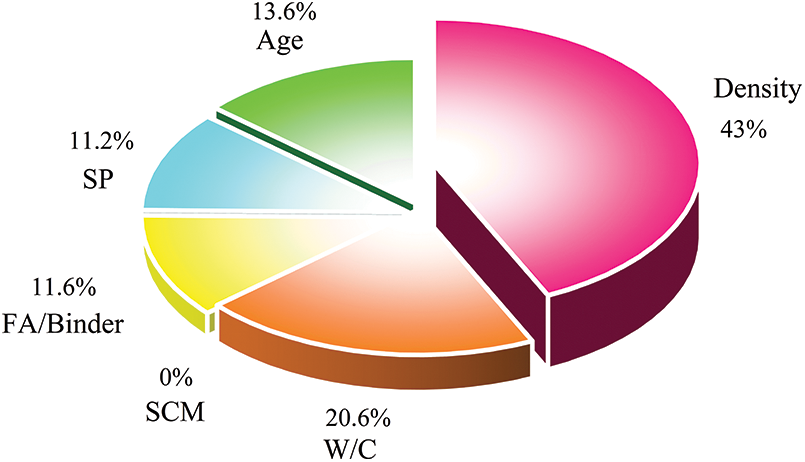
Figure 22: Pie chart of SHAP feature contribution to compressive strength prediction
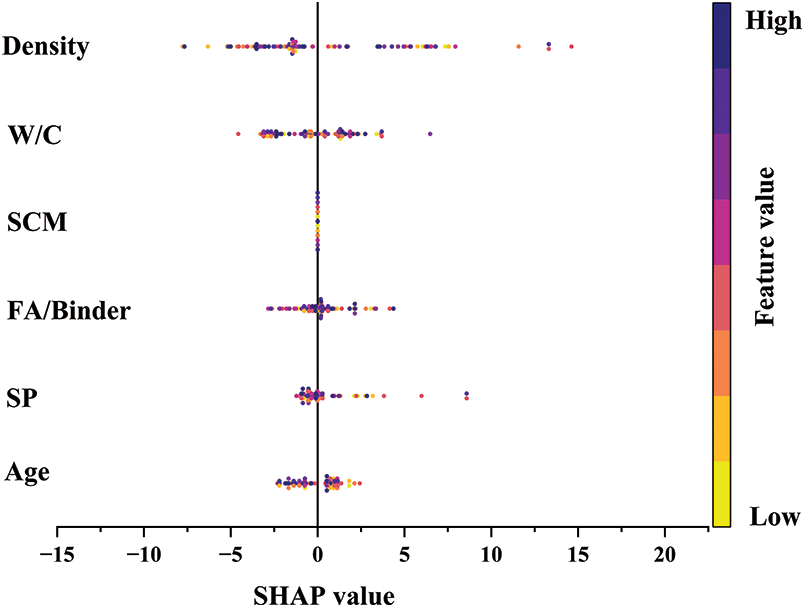
Figure 23: SHAP summary plot for compressive strength prediction using GPR model
Although the SHAP values of the W/C were relatively concentrated, they show significant variation at extreme values, indicating its sensitivity in influencing the compressive strength. The SHAP values of SCM and FA/Binder were close to zero, suggesting that their contribution to compressive strength is minimal, likely due to the low proportion of SCM used in the literature. The SHAP values of SP were dispersed, indicating its unstable influence on different data points, as it is closely related to the mix ratio and construction processes. The SHAP values of Age had a large range, suggesting that as time progresses, the cement hydration reaction enhances the structural stability of foam concrete.
In summary, through sensitivity analysis of feature importance and SHAP value analysis, it can be observed that density and W/C play a decisive role in predicting the compressive strength of foam concrete, with the largest contribution in the model. In contrast, SCM and FA have a smaller impact on the model’s prediction. These analyses provide guidance for future model optimization, particularly in feature selection.
4.3 Comparison with Existing Research
Compared to existing research, the model in this study performs better. Ayyanar and Ali [54] achieved an R2 of 0.83 using ANN, while Xu et al.’s [65] RF model achieved an R2 of 0.93. The GPR model used in this study reached an R2 of 0.93 on the test set with an RMSE of 2.67. Furthermore, the model incorporates more input variables and introduces SHAP analysis, leading to improved prediction accuracy and generalization capability.
This study systematically evaluated the predictive performance of different machine learning models for the compressive strength of foam concrete under multiple input parameters. Based on the optimal model, a sensitivity analysis of the input parameters was conducted, and the following main conclusions were drawn:
(1) Compared to the approach in existing literature, which typically constructs prediction models using 2–4 input variables, this study selected 6 key influencing factors (Density, W/C, SCM, FA/Binder, SP, and Age) as input parameters. This significantly enhanced the richness of the model’s input dimensions and strengthened its ability to characterize the variation patterns of foam concrete strength.
(2) By comparing the prediction results of five machine learning models, including GPR, SVM, ANFIS, ANN, and EDT. It was found that the GPR model demonstrated the best predictive performance in both the training and testing phases. Its testing phase R2, RMSE, MAE, and MAPE were 0.93, 2.67, 1.33, and 0.55, respectively, outperforming the other four models. GPR exhibited strong fitting ability and robustness when dealing with high-dimensional nonlinear relationships, making it suitable for data characteristics like those of foam concrete, which have complex input parameters and contain some noise.
(3) To enhance the interpretability of the model, this study introduced the SHAP method to analyse the feature contributions of the GPR model. The results indicate that the Density and W/C of foam concrete were the dominant factors influencing compressive strength, with average SHAP contributions of 43% and 20.6%, respectively. The effect of Age follows, accounting for 13.6%. In contrast, the admixture substitution rate had a minimal impact on the prediction results, indicating its low contribution in the current dataset. This analysis provided a theoretical basis for the performance regulation of foam concrete in engineering practice.
Based on the comprehensive performance evaluation and sensitivity analysis conducted in this study, several limitations and potential improvement directions have been identified. These form the basis for the following future research directions, which aim to enhance both the predictive accuracy and practical applicability of the model.
Future research can further incorporate environmental exposure factors (such as humidity, temperature, freeze-thaw cycles, etc.) into the model to enhance its applicability in complex environments. Additionally, the model’s applicability can be extended to other types of concrete (e.g., dry-cast concrete, recycled aggregate concrete, etc.) to verify its robustness and versatility, thereby promoting the widespread application of data-driven methods in concrete engineering design.
To further enhance the model’s reliability assessment, incorporating confidence interval analysis in future work will help evaluate the uncertainty of the predicted values and strengthen the model’s reliability in real-world engineering applications [66,67].
In future work, resampling techniques such as SMOTE [68,69] can be applied to balance the dataset, or modified loss functions can be used to emphasize underrepresented data ranges. Furthermore, the model’s performance will be evaluated more carefully across different strength ranges to ensure that it generalizes well across all compressive strength values.
5.2.2 Practical Significance for Engineering
To enhance the practical impact of the model, future work will focus on integrating the model with real-world engineering data and decision-making processes. By cross-validating it with actual data from concrete production and construction, the practical utility of the model in engineering decision-making can be further verified. Through this approach, the model is expected to not only provide highly accurate predictions but also become an essential tool for concrete quality control and engineering management.
Acknowledgement: The authors would like to appreciate the financial support from the funding body.
Funding Statement: This research is supported by the Postgraduate Innovation Program of Chongqing University of Science and Technology (Grant No. YKJCX2420605), Research Foundation of Chongqing University of Science and Technology (Grant No. ckrc20241225), Opening Projects of State Key Laboratory of Solid Waste Reuse for Building Materials (Grant No. SWR-2021-005), and Science and Technology Research Program of Chongqing Municipal Education Commission (Grant No. KJQN202401510).
Author Contributions: The authors confirm contribution to the paper as follows: Conceptualization, Sen Yang and Jiehong Li; methodology, Yi Sun and Yang Yu; software, Sen Yang, Jie Zhong and Yang Yu; validation, Boyu Gan, Changming Bu and Mingtao Zhang; formal analysis, Sen Yang; investigation, Jie Zhong; resources, Boyu Gan; data curation, Jie Zhong and Boyu Gan; writing—original draft preparation, Sen Yang and Jiehong Li; writing—review and editing, Mingtao Zhang, Jiehong Li and Yang Yu; visualization, Jie Zhong and Boyu Gan; supervision, Yang Yu; project administration, Jiehong Li; funding acquisition, Yi Sun, Changmin Bu and Jiehong Li. All authors reviewed the results and approved the final version of the manuscript.
Availability of Data and Materials: Data available on request from the authors.
Ethics Approval: Not applicable.
Conflicts of Interest: The authors declare no conflicts of interest to report regarding the present study.
References
1. Chica L, Alzate A. Cellular concrete review: new trends for application in construction. Constr Build Mater. 2019;200:637–47. doi:10.1016/j.conbuildmat.2018.12.136. [Google Scholar] [CrossRef]
2. Raj A, Sathyan D, Mini KM. Physical and functional characteristics of foam concrete: a review. Constr Build Mater. 2019;221(2):787–99. doi:10.1016/j.conbuildmat.2019.06.052. [Google Scholar] [CrossRef]
3. Mugahed Amran YH, Farzadnia N, Abang Ali AA. Properties and applications of foamed concrete; a review. Constr Build Mater. 2015;101(6):990–1005. doi:10.1016/j.conbuildmat.2015.10.112. [Google Scholar] [CrossRef]
4. Gomasa R. Study on mechanical properties of polyurethane foam concrete. Indian J Struct Eng. 2021;1(1):1–3. doi:10.35940/ijse.b8005.051121. [Google Scholar] [CrossRef]
5. Namsone E, Sahmenko G, Namsone E, Korjakins A. Development of high-strength foamed concrete compositions. Solid State Phenom. 2021;320(1):186–90. doi:10.4028/www.scientific.net/ssp.320.186. [Google Scholar] [CrossRef]
6. Othman R, Jaya RP, Muthusamy K, Sulaiman M, Duraisamy Y, Abdullah MMAB, et al. Relation between density and compressive strength of foamed concrete. Materials. 2021;14(11):2967. doi:10.3390/ma14112967. [Google Scholar] [PubMed] [CrossRef]
7. Wong SH, Shek PN, Saggaff A, Tahir MM, Lee YH. Compressive strength prediction of lightweight foamed concrete with various densities. IOP Conf Ser Mater Sci Eng. 2019;620(1):012043. doi:10.1088/1757-899X/620/1/012043. [Google Scholar] [CrossRef]
8. Liu J, Ge T, Wu Y, Chen R. Effect of sand-to-cement ratio on mechanical properties of foam concrete. Buildings. 2022;12(11):1969. doi:10.3390/buildings12111969. [Google Scholar] [CrossRef]
9. Liu Y, Zhao D, Yin R, Li Q, Wu X, Zeng X, et al. Optimal mix design and mechanical properties of rapid-hardening foam concrete. Adv Civ Eng. 2024;2024(1):6232941. doi:10.1155/2024/6232941. [Google Scholar] [CrossRef]
10. Onyelowe KC, Ebid AM, Fernandez Vinueza DF, Estrada Brito NA, Velasco N, Buñay J, et al. Estimating the compressive strength of lightweight foamed concrete using different machine learning-based symbolic regression techniques. Front Built Environ. 2024;10:1446597. doi:10.3389/fbuil.2024.1446597. [Google Scholar] [CrossRef]
11. Ahmed A. Assessing the effects of supplementary cementitious materials on concrete properties: a review. Discov Civ Eng. 2024;1(1):145. doi:10.1007/s44290-024-00154-z. [Google Scholar] [CrossRef]
12. Mayhoub O, Ahmed M, Hossam M, Mohamed B, Sherif M, Sayed S. A review on sustainable lightweight foamed concrete. Adv Sci Technol J. 2025;2(1):1–12. doi:10.21608/astj.2025.345092.1026. [Google Scholar] [CrossRef]
13. Mostofinejad D, Nasrollahi M, Bahmani H, Zajshoor Z, Sadeghi M. Enhancing concrete strength and durability of normal and high-strength concrete: exploring combined effects of optimized silica fume and slag. Iran J Sci Technol Trans Civ Eng. 2025;49(3):2309–28. doi:10.1007/s40996-024-01573-9. [Google Scholar] [CrossRef]
14. Al-Ani HKK, Hilal AA, Hama SM. Effect of finesse and type of aggregate on flowability and mechanical properties of foamed concrete. E3S Web Conf. 2023;427(2):02009. doi:10.1051/e3sconf/202342702009. [Google Scholar] [CrossRef]
15. Shang X, Qu N, Li J. Development and functional characteristics of novel foam concrete. Constr Build Mater. 2022;324(1):126666. doi:10.1016/j.conbuildmat.2022.126666. [Google Scholar] [CrossRef]
16. Shi P, Falliano D, Celi AB, Yang Z, Marano GC, Briseghella B. Workability and mechanical properties of structural foamed concretes with different dry densities, and fine sand grain sizes: preliminary study. In: 2024 IEEE International Workshop on Metrology for Living Environment (MetroLivEnv); 2024 Jun 12–14; Chania, Greece. doi:10.1109/MetroLivEnv60384.2024.10615453. [Google Scholar] [CrossRef]
17. Yaseen ZM, Deo RC, Hilal A, Abd AM, Bueno LC, Salcedo-Sanz S, et al. Predicting compressive strength of lightweight foamed concrete using extreme learning machine model. Adv Eng Softw. 2018;115:112–25. doi:10.1016/j.advengsoft.2017.09.004. [Google Scholar] [CrossRef]
18. Salami BA, Iqbal M, Abdulraheem A, Jalal FE, Alimi W, Jamal A, et al. Estimating compressive strength of lightweight foamed concrete using neural, genetic and ensemble machine learning approaches. Cem Concr Compos. 2022;133:104721. doi:10.1016/j.cemconcomp.2022.104721. [Google Scholar] [CrossRef]
19. Zhang C, Zhu Z, Shi L, Kang X, Wan Y, Huo W, et al. Compressive strength and sensitivity analysis of fly ash composite foam concrete: efficient machine learning approach. Adv Eng Softw. 2024;192(13):103634. doi:10.1016/j.advengsoft.2024.103634. [Google Scholar] [CrossRef]
20. Ashrafian A, Shokri F, Taheri Amiri MJ, Yaseen ZM, Rezaie-Balf M. Compressive strength of foamed cellular lightweight concrete simulation: new development of hybrid artificial intelligence model. Constr Build Mater. 2020;230:117048. doi:10.1016/j.conbuildmat.2019.117048. [Google Scholar] [CrossRef]
21. Ahmadi SF, Reisi M, Sajadi SM. Comparing properties of foamed concrete and lightweight expanded clay aggregate concrete at the same densities. Case Stud Constr Mater. 2023;19(1):e02539. doi:10.1016/j.cscm.2023.e02539. [Google Scholar] [CrossRef]
22. Al-Shwaiter A, Awang H, Khalaf MA. The influence of superplasticiser on mechanical, transport and microstructure properties of foam concrete. J King Saud Univ Eng Sci. 2023;35(2):101–9. doi:10.1016/j.jksues.2021.02.010. [Google Scholar] [CrossRef]
23. Alnahhal AM, Alengaram UJ, Yusoff S, Singh R, Radwan MKH, Deboucha W. Synthesis of sustainable lightweight foamed concrete using palm oil fuel ash as a cement replacement material. J Build Eng. 2021;35(4):102047. doi:10.1016/j.jobe.2020.102047. [Google Scholar] [CrossRef]
24. Alyami M, Mydin MAO, Zeyad AM, Majeed SS, Tayeh BA. Influence of wastepaper sludge ash as partial cement replacement on the properties of lightweight foamed concrete. J Build Eng. 2023;79(5):107893. doi:10.1016/j.jobe.2023.107893. [Google Scholar] [CrossRef]
25. Azree Othuman Mydin M, Hamah Sor N, Bahrami A, Dulaimi A, Onuralp Özkılıç Y, Althoey F, et al. Residual durability, mechanical, and microstructural properties of foamed concrete subjected to various elevated temperatures. Eng Sci Technol Int J. 2024;55(1):101725. doi:10.1016/j.jestch.2024.101725. [Google Scholar] [CrossRef]
26. Bagheri A, Samea SA. Role of non-reactive powder in strength enhancement of foamed concrete. Constr Build Mater. 2019;203(6):134–45. doi:10.1016/j.conbuildmat.2019.01.052. [Google Scholar] [CrossRef]
27. Bie Y, Ba S, Chen S. Studies on foamed concrete micropores and their effects on stress distribution and heat conduction. J Build Eng. 2024;87:109152. doi:10.1016/j.jobe.2024.109152. [Google Scholar] [CrossRef]
28. Chindaprasirt P, Rattanasak U. Shrinkage behavior of structural foam lightweight concrete containing glycol compounds and fly ash. Mater Des. 2011;32(2):723–7. doi:10.1016/j.matdes.2010.07.036. [Google Scholar] [CrossRef]
29. Chung SY, Abd Elrahman M, Kim JS, Han TS, Stephan D, Sikora P. Comparison of lightweight aggregate and foamed concrete with the same density level using image-based characterizations. Constr Build Mater. 2019;211(550):988–99. doi:10.1016/j.conbuildmat.2019.03.270. [Google Scholar] [CrossRef]
30. Dora S, Kuznik F, Mini KM. A novel PCM-based foam concrete for heat transfer in buildings-experimental developments and simulation modelling. J Energy Storage. 2025;105(9):114625. doi:10.1016/j.est.2024.114625. [Google Scholar] [CrossRef]
31. Eltayeb E, Xing M, Zhuge Y, Youssf O, Mills JE. Influence of rubber particles on the properties of foam concrete. J Build Eng. 2020;30(1):101217. doi:10.1016/j.jobe.2020.101217. [Google Scholar] [CrossRef]
32. Falliano D, Restuccia L, Vinci A, Ferro GA. Structural foamed concrete: preliminary studies for applications in seismic areas. Procedia Struct Integr. 2023;44(1):2350–5. doi:10.1016/j.prostr.2023.01.300. [Google Scholar] [CrossRef]
33. Gencel O, Benli A, Bayraktar OY, Kaplan G, Sutcu M, Elabade WAT. Effect of waste marble powder and rice husk ash on the microstructural, physico-mechanical and transport properties of foam concretes exposed to high temperatures and freeze-thaw cycles. Constr Build Mater. 2021;291(5):123374. doi:10.1016/j.conbuildmat.2021.123374. [Google Scholar] [CrossRef]
34. Gökçe HS, Hatungimana D, Ramyar K. Effect of fly ash and silica fume on hardened properties of foam concrete. Constr Build Mater. 2019;194(1):1–11. doi:10.1016/j.conbuildmat.2018.11.036. [Google Scholar] [CrossRef]
35. Gopalakrishnan R, Sounthararajan V, Mohan A, Tholkapiyan M. The strength and durability of fly ash and quarry dust light weight foam concrete. Mater Today Proc. 2020;22(1):1117–24. doi:10.1016/j.matpr.2019.11.317. [Google Scholar] [CrossRef]
36. Hilal AA, Thom NH, Dawson AR. On void structure and strength of foamed concrete made without/with additives. Constr Build Mater. 2015;85(5):157–64. doi:10.1016/j.conbuildmat.2015.03.093. [Google Scholar] [CrossRef]
37. Jose SK, Soman M, Evangeline YS. Influence of mixture composition on the properties of foamed concrete. Mater Today Proc. 2021;42(5):399–404. doi:10.1016/j.matpr.2020.09.592. [Google Scholar] [CrossRef]
38. Kamisetty A, Gandhi ISR, Kumar A. Combined effect of fly ash and fiber on spreadability, strength and water permeability of foam concrete. J Build Eng. 2023;78(11):107607. doi:10.1016/j.jobe.2023.107607. [Google Scholar] [CrossRef]
39. Maglad AM, Othuman Mydin MA, Dip Datta S, Tayeh BA. Assessing the mechanical, durability, thermal and microstructural properties of sea shell ash based lightweight foamed concrete. Constr Build Mater. 2023;402(5):133018. doi:10.1016/j.conbuildmat.2023.133018. [Google Scholar] [CrossRef]
40. Maglad AM, Othuman Mydin MA, Majeed SS, Tayeh BA, Tobbala DE. Exploring the influence of calcinated eggshell powder on lightweight foamed concrete: a comprehensive study on freshness, mechanical strength, thermal characteristics and transport properties. J Build Eng. 2024;87(3):108966. doi:10.1016/j.jobe.2024.108966. [Google Scholar] [CrossRef]
41. Makul N, Sua-Iam G. Characteristics and utilization of sugarcane filter cake waste in the production of lightweight foamed concrete. J Clean Prod. 2016;126(5):118–33. doi:10.1016/j.jclepro.2016.02.111. [Google Scholar] [CrossRef]
42. Özkan İGM, Aldemir K, Alhasan O, Benli A, Bayraktar OY, Yılmazoğlu MU, et al. Investigation on the sustainable use of different sizes of sawdust aggregates in eco-friendly foam concretes: physico-mechanical, thermal insulation and durability characteristics. Constr Build Mater. 2024;438(2):137100. doi:10.1016/j.conbuildmat.2024.137100. [Google Scholar] [CrossRef]
43. Sai Krishna A, Siempu R, Sandeep Kumar GAVS. Study on the fresh and hardened properties of foam concrete incorporating fly ash. Mater Today Proc. 2021;46(5):8639–44. doi:10.1016/j.matpr.2021.03.599. [Google Scholar] [CrossRef]
44. She W, Du Y, Zhao G, Feng P, Zhang Y, Cao X. Influence of coarse fly ash on the performance of foam concrete and its application in high-speed railway roadbeds. Constr Build Mater. 2018;170:153–66. doi:10.1016/j.conbuildmat.2018.02.207. [Google Scholar] [CrossRef]
45. Shi X, She W, Zhou H, Zhang Y, Shi F, Chen W. Thermal upgrading of Hui-style vernacular dwellings in China using foam concrete. Front Archit Res. 2012;1(1):23–33. doi:10.1016/j.foar.2012.02.001. [Google Scholar] [CrossRef]
46. Tang R, Wei Q, Zhang K, Jiang S, Shen Z, Zhang Y, et al. Preparation and performance analysis of recycled PET fiber reinforced recycled foamed concrete. J Build Eng. 2022;57(7):104948. doi:10.1016/j.jobe.2022.104948. [Google Scholar] [CrossRef]
47. Vinith Kumar N, Arunkumar C, Srinivasa Senthil S. Experimental study on mechanical and thermal behavior of foamed concrete. Mater Today Proc. 2018;5(2):8753–60. doi:10.1016/j.matpr.2017.12.302. [Google Scholar] [CrossRef]
48. Wang T, Gao X, Li Y, Liu Y. An orthogonal experimental study on the influence of steam-curing on mechanical properties of foam concrete with fly ash. Case Stud Constr Mater. 2024;20:e02665. doi:10.1016/j.cscm.2023.e02665. [Google Scholar] [CrossRef]
49. Wu J, Lv C, Pi R, Zhang H, Bi Y, Song X, et al. The stability and durability of silt-based foamed concrete: a new type of road engineering material. Constr Build Mater. 2021;304(17):124674. doi:10.1016/j.conbuildmat.2021.124674. [Google Scholar] [CrossRef]
50. Zhang H, Wang J, Liu Z, Ma C, Song Z, Cui F, et al. Strength characteristics of foamed concrete under coupling effect of constant compressive loading and freeze-thaw cycles. Constr Build Mater. 2024;411(1):134565. doi:10.1016/j.conbuildmat.2023.134565. [Google Scholar] [CrossRef]
51. Parab S, Srivastava S, Samui P, Murthy AR. Prediction of fracture parameters of high strength and ultra-high strength concrete beam using Gaussian process regression and least squares. Comput Model Eng Sci. 2014;101(2):139–58. doi:10.3970/cmes.2014.101.139. [Google Scholar] [CrossRef]
52. Rayjada SP, Raghunandan M, Ghosh J. Machine learning-based RC beam-column model parameter estimation and uncertainty quantification for seismic fragility assessment. Eng Struct. 2023;278:115111. doi:10.1016/j.engstruct.2022.115111. [Google Scholar] [CrossRef]
53. Zhang D. Prediction of concrete strength using MCMC and GPR methods. Theor Nat Sci. 2023;9(1):54–61. doi:10.54254/2753-8818/9/20240712. [Google Scholar] [CrossRef]
54. Ayyanar D, Ali SHM. Analysis of compressive strength of sustainable fibre reinforced foamed concrete using machine learning techniques. Mater Res Express. 2024;11(3):035701. doi:10.1088/2053-1591/ad2db7. [Google Scholar] [CrossRef]
55. Opěla P, Walek J, Kopeček J. Machine learning techniques in predicting hot deformation behavior of metallic materials. Comput Model Eng Sci. 2025;142(1):713–32. doi:10.32604/cmes.2024.055219. [Google Scholar] [CrossRef]
56. Adnan RM, Wang M, Masood A, Kisi O, Shahid S, Zounemat-Kermani M. Applications of advanced optimized neuro fuzzy models for enhancing daily suspended sediment load prediction. Comput Model Eng Sci. 2025;143(1):1249–72. doi:10.32604/cmes.2025.062339. [Google Scholar] [CrossRef]
57. Zou Z, Peng B, Xie L, Song S. Enhanced Gaussian process model for predicting compressive strength of ultra-high-performance concrete (UHPC). Materials. 2024;17(24):6140. doi:10.3390/ma17246140. [Google Scholar] [PubMed] [CrossRef]
58. Mesfin WM, Kim HK. Parametric study on global estimation models for compressive strength adopting various machine learning algorithms in concrete. Eng Appl Artif Intell. 2024;136(4):108888. doi:10.1016/j.engappai.2024.108888. [Google Scholar] [CrossRef]
59. Torkan M, Dehkordi MN. Development of ANFIS-PSO, SVR-PSO, and ANN-PSO hybrid intelligent models for predicting the compressive strength of concrete. Int J Optim Civ Eng. 2018;8(4):547–63. [Google Scholar]
60. Sharafati A, Naderpour H, Salih SQ, Onyari E, Yaseen ZM. Simulation of foamed concrete compressive strength prediction using adaptive neuro-fuzzy inference system optimized by nature-inspired algorithms. Front Struct Civ Eng. 2021;15(1):61–79. doi:10.1007/s11709-020-0684-6. [Google Scholar] [CrossRef]
61. Dao DV, Ly HB, Vu HT, Le TT, Pham BT. Investigation and optimization of the C-ANN structure in predicting the compressive strength of foamed concrete. Materials. 2020;13(5):1072. doi:10.3390/ma13051072. [Google Scholar] [PubMed] [CrossRef]
62. Mandal S, Shiuly A, Sau D, Mondal AK, Sarkar K. Study on the use of different machine learning techniques for prediction of concrete properties from their mixture proportions with their deterministic and robust optimisation. AI Civ Eng. 2024;3(1):7. doi:10.1007/s43503-024-00024-8. [Google Scholar] [CrossRef]
63. Mosca E, Szigeti F, Tragianni S, Gallagher D, Groh GL. SHAP-based explanation methods: a review for NLP interpretability. In: Proceedings of the 29th International Conference on Computational Linguistics; 2022 Oct 12–17; Gyeongju, Republic of Korea. [Google Scholar]
64. Prakash I, Nguyen DD, Tuan NT, Phong TV, Hiep LV. Landslide susceptibility zoning: integrating multiple intelligent models with SHAP analysis. J Sci Transp Technol. 2024;2024:23–41. doi:10.58845/jstt.utt.2024.en.4.1.23-41. [Google Scholar] [CrossRef]
65. Xu Y, Ahmad W, Ahmad A, Ostrowski KA, Dudek M, Aslam F, et al. Computation of high-performance concrete compressive strength using standalone and ensembled machine learning techniques. Materials. 2021;14(22):7034. doi:10.3390/ma14227034. [Google Scholar] [PubMed] [CrossRef]
66. Zhang X, Cheng L, Xu F, Yang C, Wang L. A novel model for shear strength prediction of a steel-UHPC composite structure considering interface friction. J Struct Eng. 2024;150(8):04024100. doi:10.1061/jsendh.steng-13164. [Google Scholar] [CrossRef]
67. Hu Z, Dang C, Wang D, Beer M, Wang L. Error-informed parallel adaptive Kriging method for time-dependent reliability analysis. Reliab Eng Syst Saf. 2025;262(2):111194. doi:10.1016/j.ress.2025.111194. [Google Scholar] [CrossRef]
68. Wang L, Yi S, Yu Y, Gao C, Samali B. Automated ultrasonic-based diagnosis of concrete compressive damage amidst temperature variations utilizing deep learning. Mech Syst Signal Process. 2024;221:111719. doi:10.1016/j.ymssp.2024.111719. [Google Scholar] [CrossRef]
69. Yu Y, Rashidi M, Dorafshan S, Samali B, Farsangi EN, Yi S, et al. Ground penetrating radar-based automated defect identification of bridge decks: a hybrid approach. J Civ Struct Health Monit. 2025;15(2):521–43. doi:10.1007/s13349-024-00895-6. [Google Scholar] [CrossRef]
Cite This Article
 Copyright © 2025 The Author(s). Published by Tech Science Press.
This work is licensed under a Creative Commons Attribution 4.0 International License , which permits unrestricted use, distribution, and reproduction in any medium, provided the original work is properly cited.
 Downloads
 Citation Tools