
 Submit a Paper
 Propose a Special lssue
 Open Access
ARTICLE

Vulnerability2Vec: A Graph-Embedding Approach for Enhancing Vulnerability Classification
1 Department of Computer Science and Engineering, Chung-Ang University, Seoul, 06974, Republic of Korea
2 School of Advanced Technology, Xi’an Jiaotong-Liverpool University, Suzhou, 215123, China
* Corresponding Author: Mucheol Kim. Email:
Computer Modeling in Engineering & Sciences 2025, 144(3), 3191-3212. https://doi.org/10.32604/cmes.2025.068723
Received 05 June 2025; Accepted 15 August 2025; Issue published 30 September 2025
 View Full Text
 Download PDF
Abstract
The escalating complexity and heterogeneity of modern energy systems—particularly in smart grid and distributed energy infrastructures—has intensified the need for intelligent and scalable security vulnerability classification. To address this challenge, we propose Vulnerability2Vec, a graph-embedding-based framework designed to enhance the automated classification of security vulnerabilities that threaten energy system resilience. Vulnerability2Vec converts Common Vulnerabilities and Exposures (CVE) text explanations to semantic graphs, where nodes represent CVE IDs and key terms (nouns, verbs, and adjectives), and edges capture co-occurrence relationships. Then, it embeds the semantic graphs to a low-dimensional vector space with random-walk sampling and skip-gram with negative sampling. It is possible to identify the latent relationships and structural patterns that traditional sparse vector methods fail to capture. Experimental results demonstrate a classification accuracy of up to 80%, significantly outperforming baseline methods. This approach offers a theoretical basis for classifying vulnerability types as structured semantic patterns in complex software systems. The proposed method models the semantic structure of vulnerabilities, providing a theoretical foundation for their classification.Keywords
The growing complexity of modern software systems, compounded by the integration of artificial intelligence technologies, leads to increasingly diverse and sophisticated forms of security vulnerabilities [1]. These vulnerabilities often emerge not in isolation, but as interconnected phenomena, such as semantic approaches that integrate vulnerability patterns [2] and structural techniques grounded in code-level representations [3]. In response, cybersecurity research institutions disseminate large-scale vulnerability information to support standardized risk assessment and mitigation efforts [4]. The National Vulnerability Database (NVD) [5], for example, registers more than 40 new entries daily which reflects the dynamic and high-dimensional nature of the current threat landscape. These trends underscore the urgent demand for intelligent classification frameworks that can model latent structures and evolving semantics, particularly within complex energy domains [6]. Energy systems comprise tightly coupled components spanning software, hardware, and communication protocols. Traditional vulnerability classification methods often fail to adequately capture this complexity. Therefore, there is a critical need for classification techniques that can effectively model the semantic characteristics in such systems.
Common vulnerabilities and exposures (CVE)1 and common weakness enumeration (CWE)2 are cybersecurity standards managed by MITRE3. CVE provides information related to various environments such as systems, software, and web applications, while CWE provides a formal taxonomy of generalized software weakness types. However, CVE entries lack an explicit classification schema, making them unsuitable for tasks requiring semantic categorization. The National Vulnerability Database (NVD), maintained by the National Institute of Standards and Technology (NIST), augments CVE entries with structured metadata to facilitate comprehensive impact analysis and risk assessment [6]. Although CVEs and CWEs are complementary, structural inconsistencies caused by the unstructured nature of CVE descriptions make automated classification difficult.
Although they are complementary, the structural misalignment between CVE and CWE hinders automated classification. Because CVE descriptions are unstructured, and CWE mappings are often incomplete. It is difficult to build scalable and interpretable threat detection architectures, especially in smart energy systems and cyber-physical domains. As vulnerability data grows in volume and complexity, the need arises for representation models that capture semantic structure—paving the way for graph-based learning methods grounded in deep and fractional modeling paradigms.
Recent advancements in cloud computing and artificial intelligence (AI) technologies increase the need for information management across various platforms. This expansion gives rise to increasingly complex and multifaceted attack patterns that challenge conventional classification systems based on predefined categories [7]. As shown in Fig. 1, there is a sharp increase in the number and types of security vulnerabilities reported in CVE. They are yet to be incorporated into the list of security weaknesses of existing software. As shown in Fig. 2, the growth rate of CWE increases by an average of approximately 27% from 1999 to 2017. Modern attacks often depend on the subtle misuse of logic, application programming interfaces (APIs) or contextual behavior, which is challenging to identify using structural features alone. Therefore, classifying vulnerabilities based on semantic context is essential, especially in complex, dynamic areas such as energy systems. This expansion introduces increasing semantic heterogeneity and hierarchical imbalance in vulnerability classification. It makes a structured mapping framework necessary to align emerging threats with their corresponding software weaknesses [8,9].
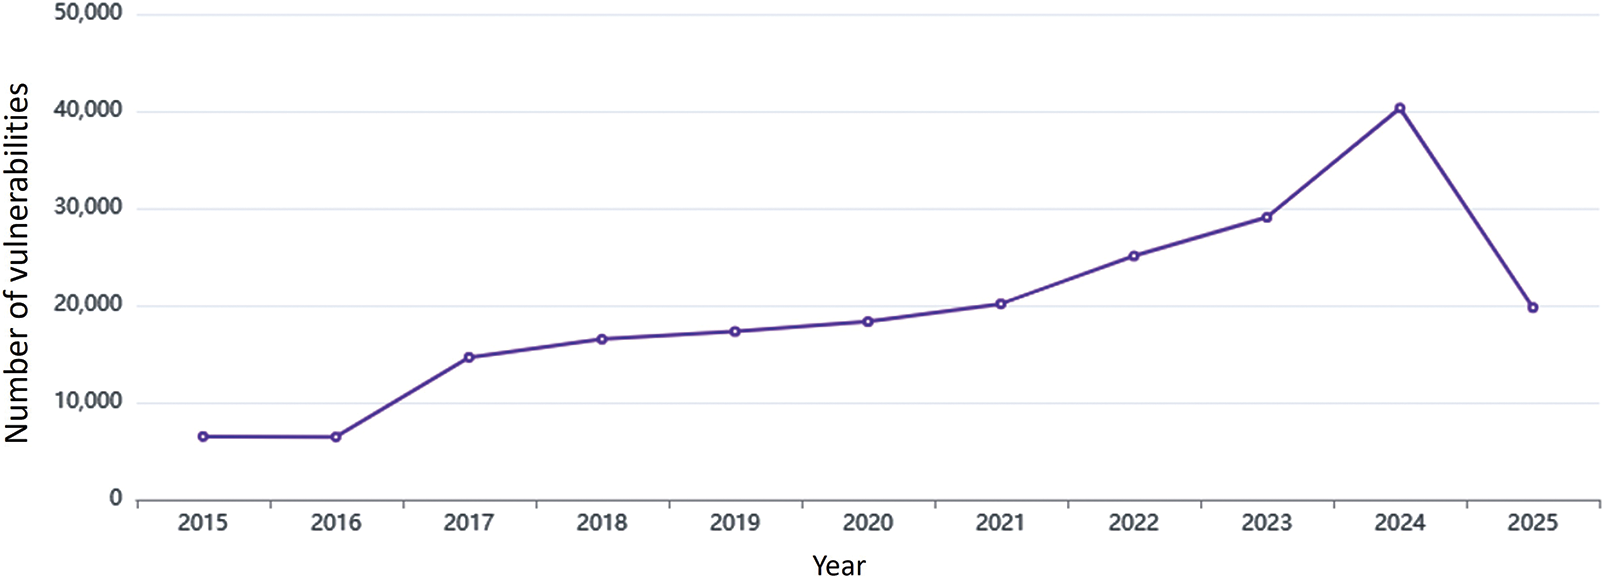
Figure 1: CVEs Count by year4
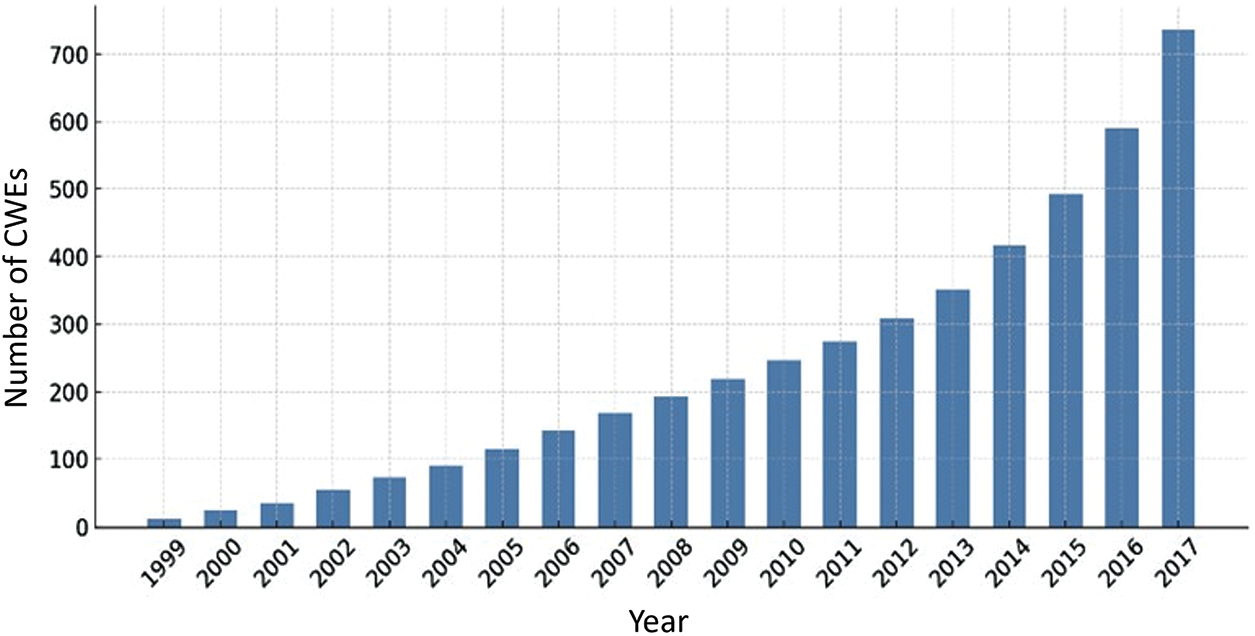
Figure 2: CWEs Count by year5
Because CVE data lacks an explicit representation of attack patterns, it often requires expert interpretation based on contextual security knowledge to determine operational relevance. Common Attack Pattern Enumeration and Classification (CAPEC)6 provides information on attack patterns that exploit security vulnerabilities. Although directly linking CVE with CAPEC remains challenging, it can be achieved by correlating them with the software security weaknesses defined in CWE [10,11]. The CWE classification systematically organizes diverse vulnerability information, enabling accurate risk assessment and the formulation of effective mitigation strategies. However, the pronounced class imbalance remains a fundamental limitation that constrains effective modeling of infrequent CWE categories [12]. Traditional methods for categorizing vulnerabilities often depend on relationships from information extracted by domain experts from various components, including system-level attributes [1] and software specifications [10,11,13,14]. Despite being a time-consuming process, traditional methods can lead to a high probability of errors and consistency issues owing to the subjective judgments of experts [15]. Therefore, the key to cybersecurity defense lies in dynamic management in response to in-creasing information and in analyses that can replace the role of experts [16].
The CVE description is important in CWE categorization because it often contains the most essential of the attributes. This provides insights into the conditions that define each vulnerability, thereby supporting both the mitigation of cyber-attacks and the development of effective response strategies [17]. Traditional automated classification approaches rely primarily on frequency-based analysis of terms appearing in CVE texts. Early neural network-based methods adopt one-hot encoding to represent features as sparse vectors. However, sparse vector representations—characterized by a limited set of activated terms—struggle to capture semantic distinctions when identical terms occur in different contexts. Moreover, such representations are insufficient for recognizing emerging vulnerability types due to the low frequency of critical technical terms or novel patterns. Meanwhile, methods like Sparse Coding [18] and Hashing Trick [19,20] improve computational efficiency and essential feature extraction while capturing contextual variations only to a limited extent.
Graph-based representation learning has emerged as a powerful paradigm for modeling structured relationships across complex domains. Unlike sparse vector representations, graph-based approaches are well-suited for modeling semantic and syntactic relationships. Graphs enable the abstraction of diverse data types—such as text, images, and entities—into nodes and edges. This effectively captures both local and global topological dependencies [21–23]. Traditional vulnerability detection methods (i.e., sparse vector representation via graph embeddings, source code graph-based methods) have difficulty capturing the potential semantic structure inherent in CVE descriptions. The limitations are even more pronounced when source code or text-based semantic relationship is unavailable. Graph embeddings capture the semantic relationships among key parts of speech extracted from vulnerability descriptions. By modeling the co-occurrence of local terms within a global semantic context, the method effectively encodes the interdependence among different types of vulnerabilities.
Graph embedding based methods are successfully applied in a wide range of contexts, including social networks, biological systems, and recommender architectures [24–26]. Graph embedding transforms relational structures into low-dimensional vector spaces while preserving connectivity and proximity information between entities. In the domain of software vulnerability analysis, graph neural networks (GNNs) show promise in modeling structural properties of source code through constructs such as abstract syntax trees (ASTs) and control flow graphs (CFGs). While effective in capturing syntactic structure, these approaches face limitations in generalizing to vulnerability types characterized by latent semantic nuances and context-dependent behaviors [27,28].
This paper presents Vulnerability2Vec to address challenges inherent in sparse vector representations derived from CVE description texts. The proposed method exhibits both structural complexity and semantic diversity. First, Vulnerability2Vec captures contextual relationships by learning the connections and structural patterns among nodes. The proposed method involves constructing a graph that models the semantic relationships among key parts of speech. Then, it classifies the graph using a traditional machine learning–based graph embedding model. This process positions elements with high semantic similarity in adjacent spaces. Second, we perform automated vulnerability classification by analyzing node similarities based on structural information. This process identifies related vulnerabilities while attacking techniques, uncovering hidden patterns within networks. This approach effectively captures contextual information through semantics-driven graph construction, without relying on the representational complexity of deep learning–based graph neural networks. Our contributions are as follows:
• We propose a novel approach with a unified multi-relational graph that integrates source code and graph components.
• Our proposed method outperforms over six baselines despite the expansion of CWE categories vulnerability types.
• Experimental results demonstrate the effectiveness of graph representation and node embedding process.
The remainder of this study is organized as follows. Section 2 reviews related work in the fields of security vulnerabilities and graph embedding. Section 3 describes the proposed method. Section 4 presents the experimental designs and results and discusses the research questions. Finally, Section 5 concludes the paper. During the preparation of this manuscript, the authors utilized OpenAI’s ChatGPT version GPT-4o to improve its linguistic clarity and grammar. The authors have carefully reviewed and revised the output and accept full responsibility for all content.
2.1 Vulnerability Classification
Classification of Vulnerability is a fundamental task in cybersecurity. It facilitates rapid response to emerging threats, prioritization of security risks, and the formulation of appropriate mitigation strategies. One line of work focuses on the use of sparse vectors from CVE descriptions and their subsequent application to machine learning algorithms. For instance, Na et al. [29] propose a naïve-bayes based classification model by applying a sparse vector model from NVD. Rahman and Mustafa [30] propose a text feature extraction method that enhances the classification performance by assigning weights to terms across the entire document, rather than focusing solely on their simple frequency for specific security. Yosifova et al. [31] apply various machine learning algorithms (linear support vector classification, multinomial naïve Bayes, and random forest classification) to text feature extraction with term frequency weights. They confirm the effectiveness of these algorithms in classifying vulnerability types. Yosifova [32] compares machine-learning algorithms that employ different ensemble techniques and highlights the importance of effectively learning complex data patterns for vulnerability classification.
Graph embedding captures the semantic relationships between terms. A study on graph embeddings converts the structural information into low-dimensional vectors. For instance, Perozzi et al. [33] propose DeepWalk, which applies a truncated random walk to a neural network model to learn relationships between graph nodes. DeepWalk encodes relationships between similar nodes into a low-dimensional vector space. This excels complex pattern recognition and structural understanding while preserving structural information. Grover and Leskovec [34] propose Node2Vec, an extension of DeepWalk. Node2Vec effectively captures the complex structure of graphs by employing breadth-first and depth-first sampling strategies to generate node sequences. Perozzi et al. [35] propose Walklets, which learns multi-scale relationships through paths of various lengths. Tang et al. [36] propose LINE, which applies to large-scale networks. LINE learns both direct and indirect neighbor relationships between nodes, expressing wide contextual relationships as low-dimensional vectors.
2.3 Source Code-Based Vulnerability Detection
In source code–based vulnerability detection, program structures such as ASTs and CFGs are applied to GNNs. Wang et al. [37] propose VulGraB which encodes program dependency graphs from source code with node2vec and applies a bidirectional gated graph neural network (BiGGNN) [38] for classification. VulGraB enhances detection through control–flow and data–flow analysis. VulGraB processes low-level code structures such as program dependency graphs. Its token-based node represents only partial access to higher-level semantics. Tang et al. [27] propose the CSGVD model, which enhances vulnerability detection by integrating source code sequences with graph-based structural representations. The model encodes semantic and structural properties of source code through a unified encoder to generate task-specific representations. The integration of semantic and structural representations involves intricate interactions, and the distinction between contextual and structural features remains subtle, reducing the model’s interpretive clarity. Ling et al. [28] propose DualGNN, which represents sequence embeddings as graph nodes and combines Graph Convolutional Network (GCN) and Graph Attention Network (GAT) to capture local and global source code characteristics. It extracts multi-scale features through convolutional kernels with varying receptive fields. The model accommodates varying context lengths, while its architecture involves considerable complexity and computational demand.
3 A Proposed Graph Embedding Approach for Efficient Vulnerability Classification
This section proposes Vulnerability2Vec, an efficient graph-embedding approach for vulnerability classification (Fig. 3). It consists of two parts which are a graph representation method for the vulnerability relationship and an efficient graph embedding approach.
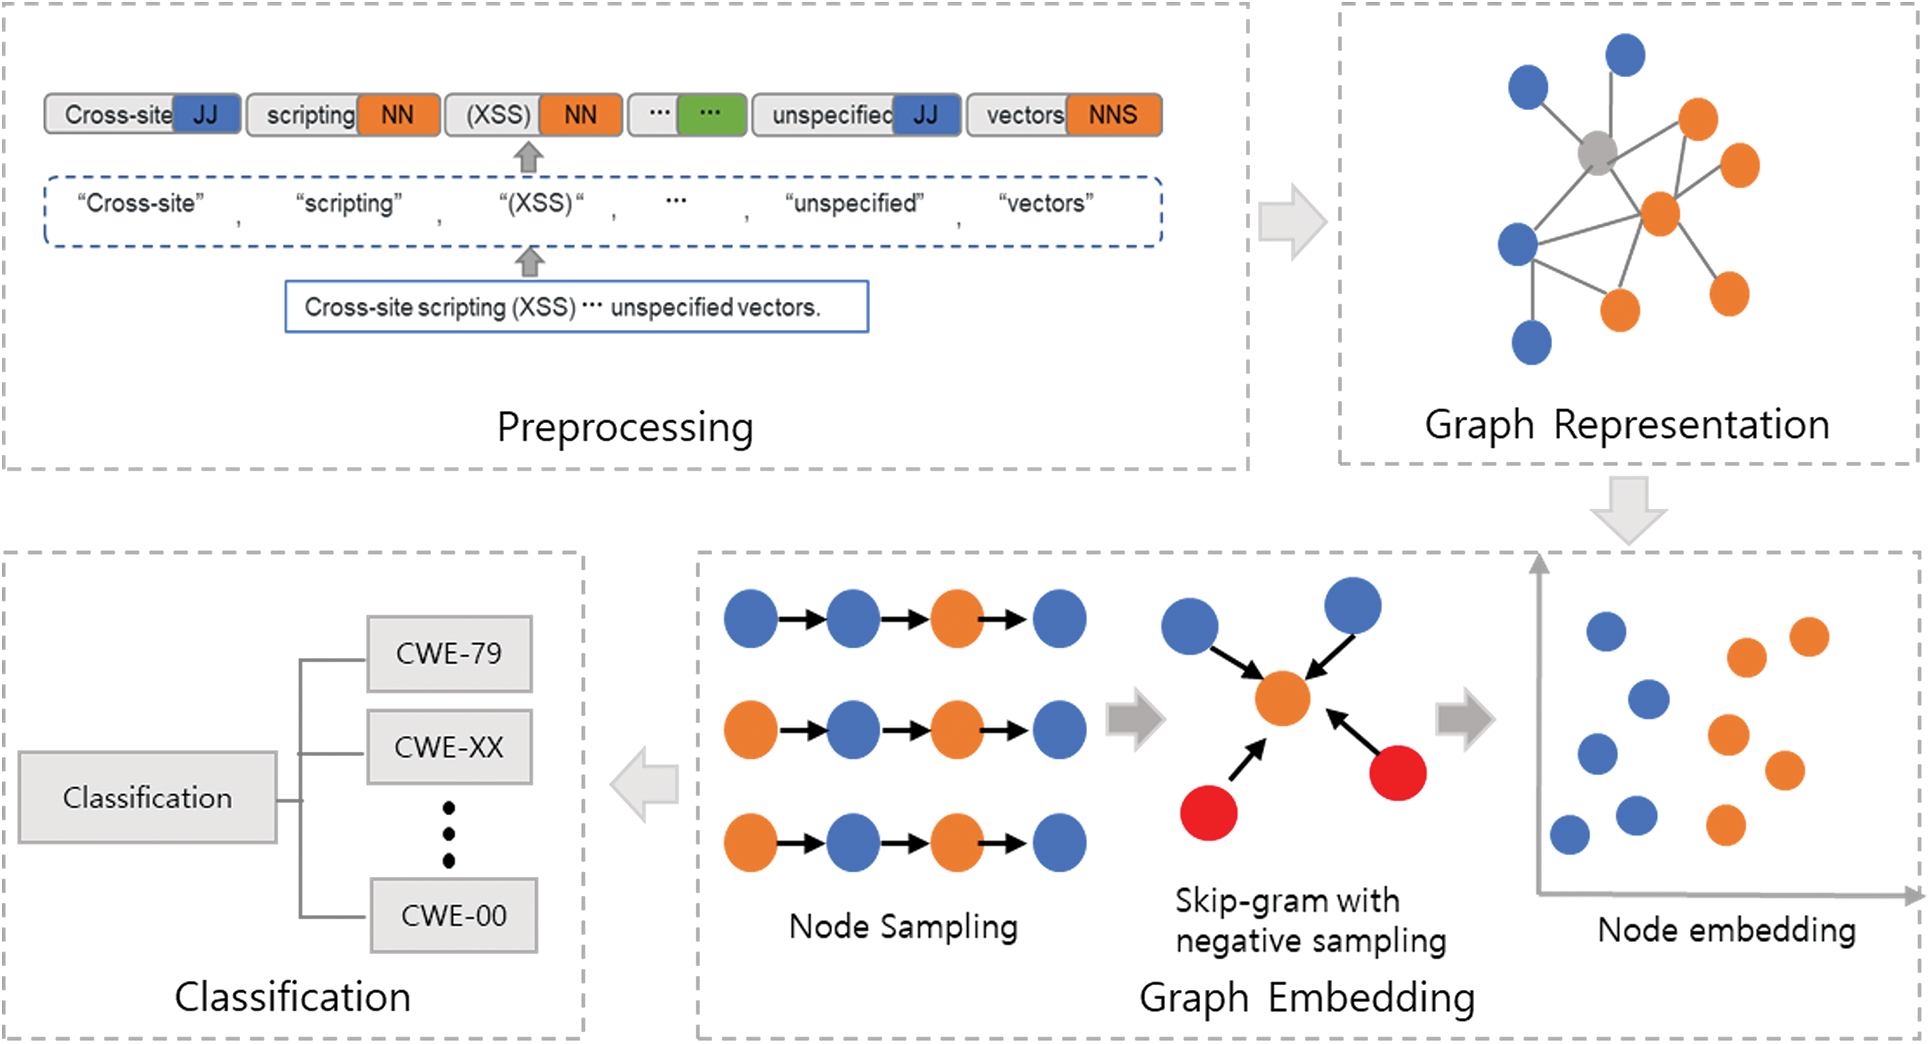
Figure 3: Overview of Vulnerability2Vec
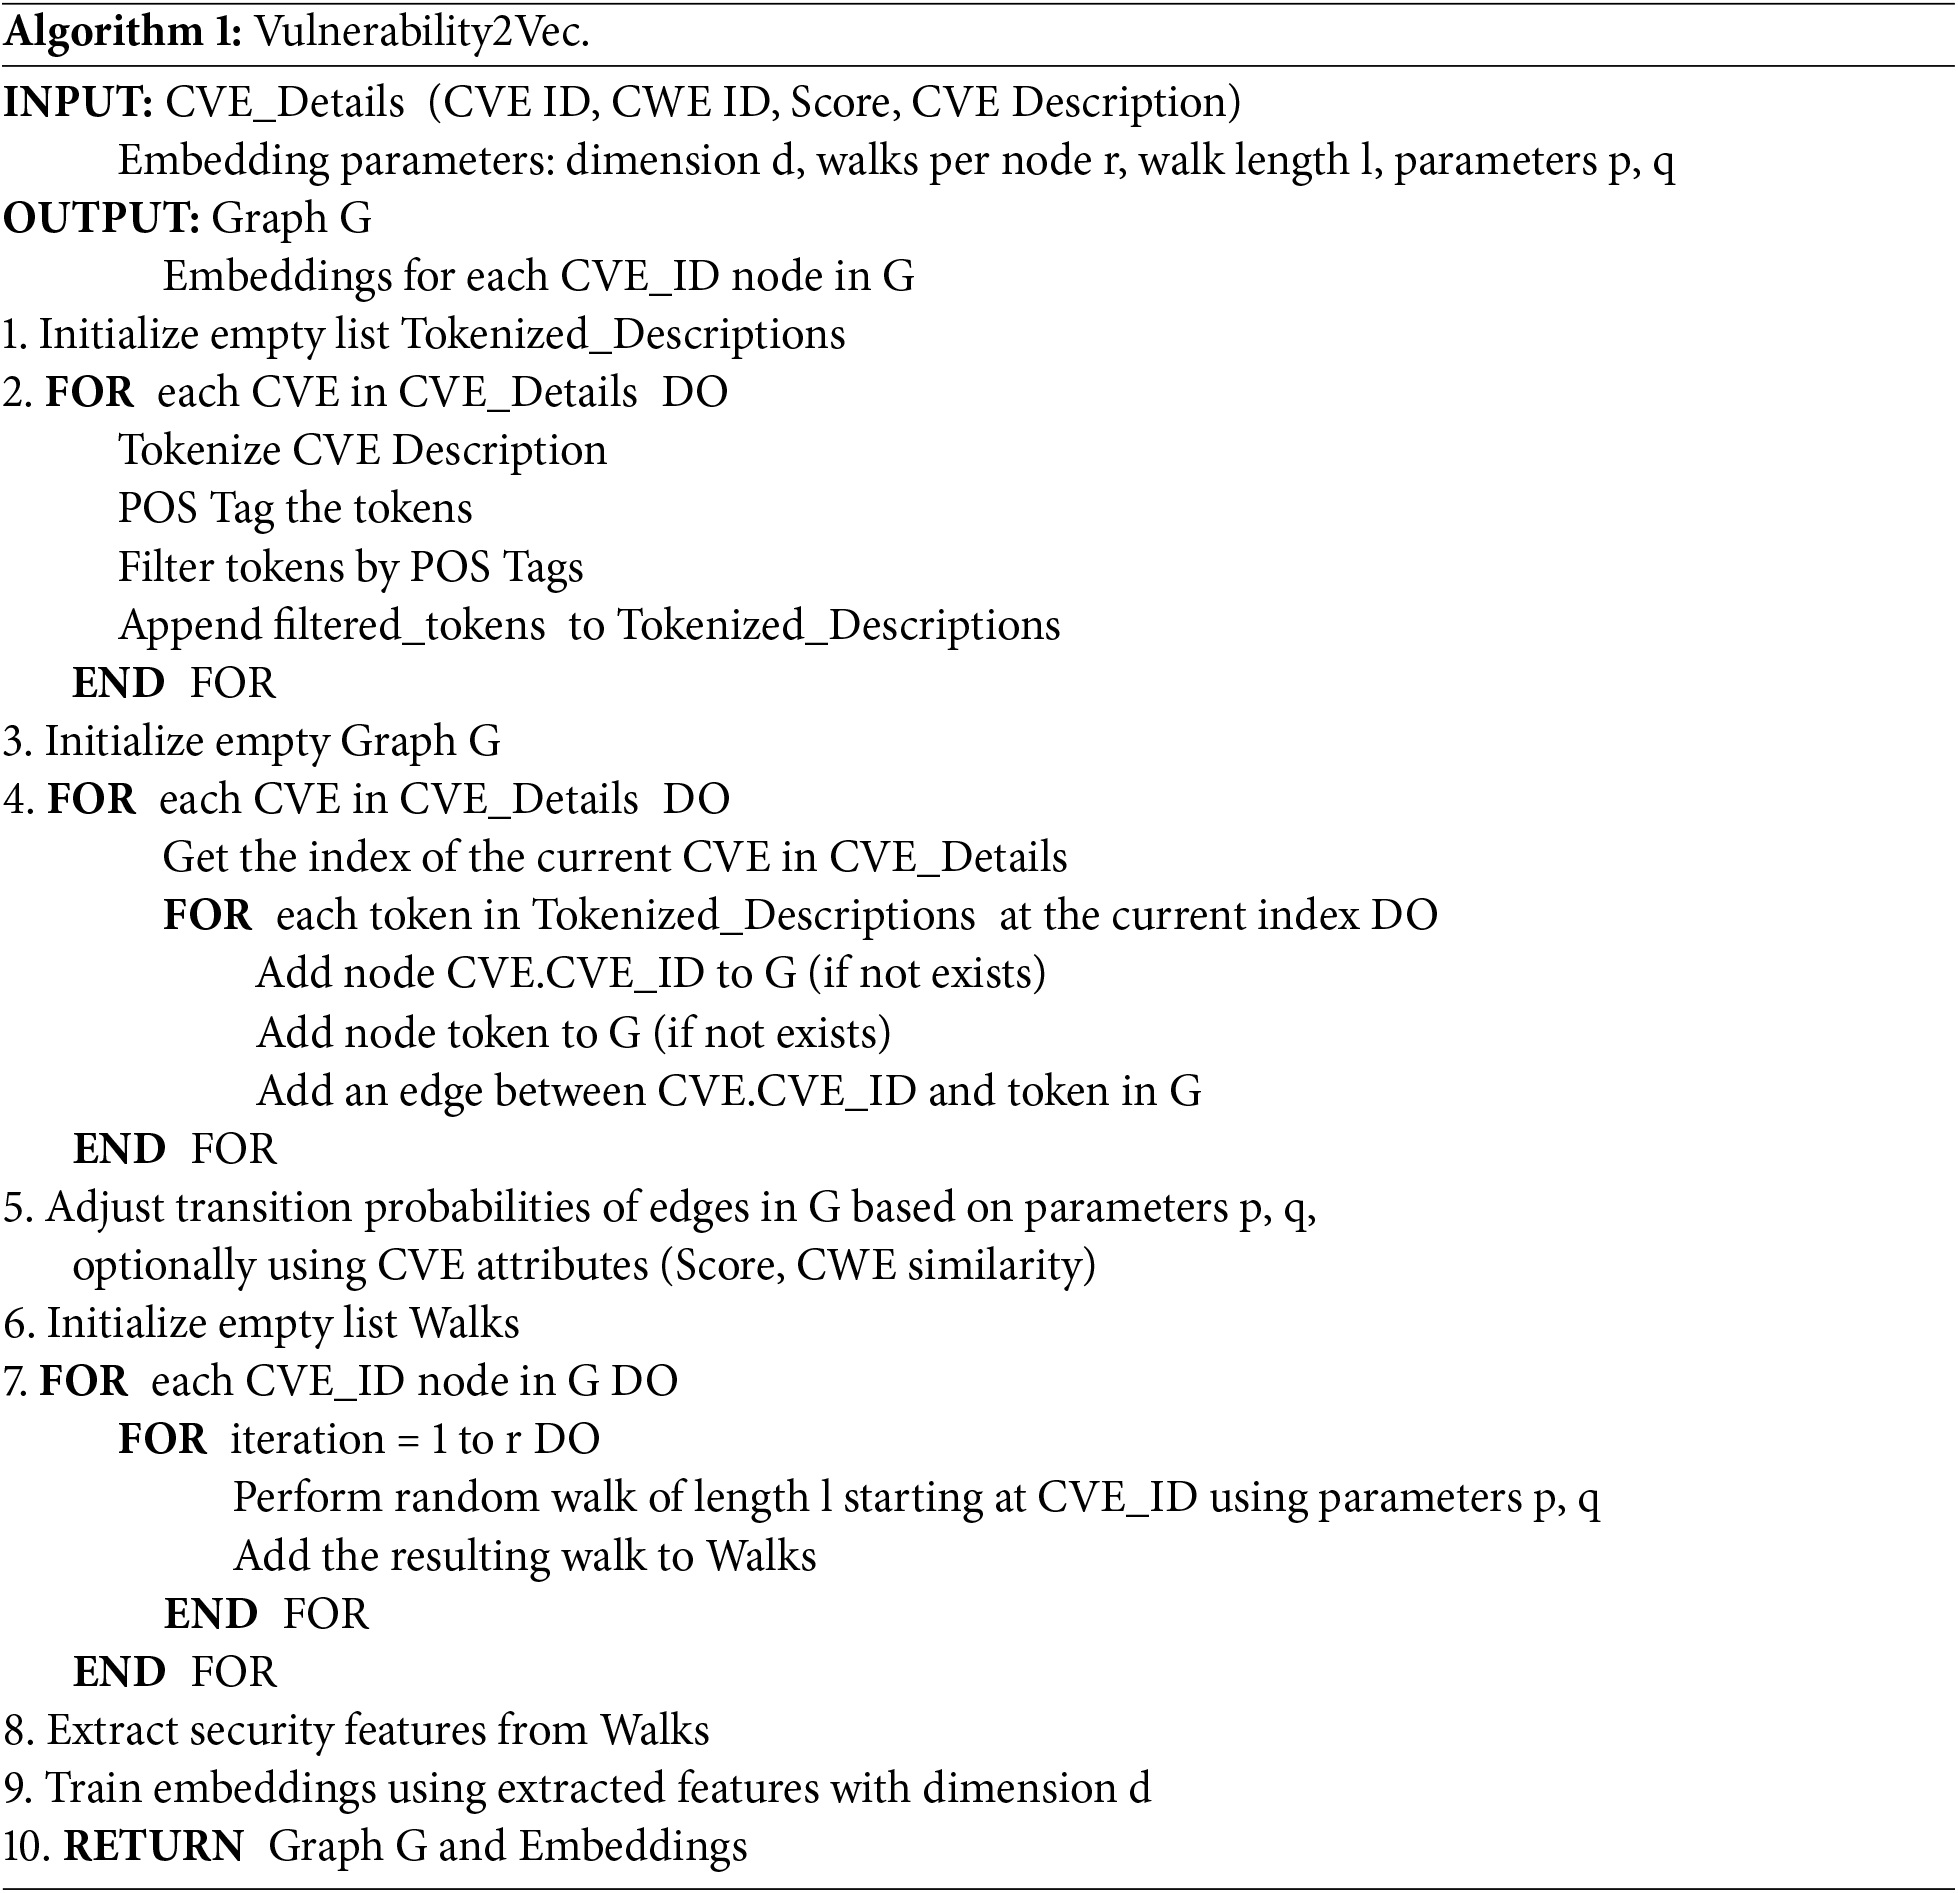
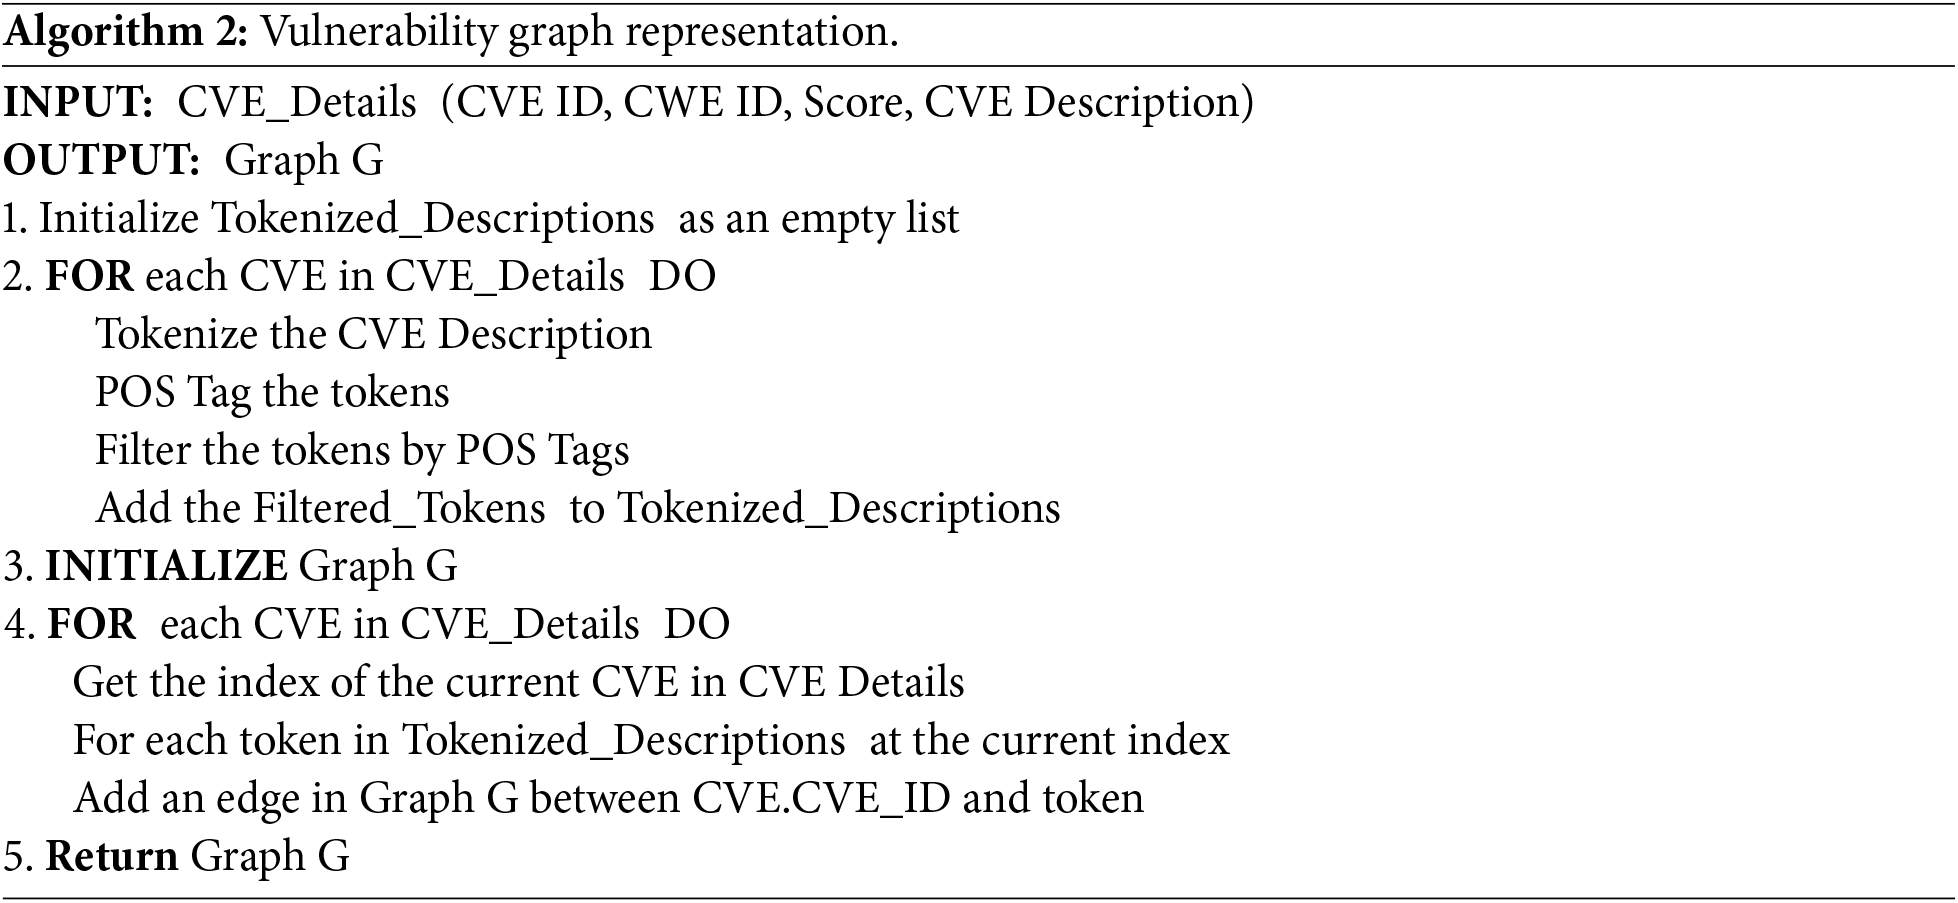
The graph representation preprocesses each CVE description into a graph in which nodes correspond to the CVE ID and salient terms (nouns, verbs, adjectives), while edges denote their co-occurrence relations. This structure captures both the semantic and structural attributes of vulnerability. Random-walk sampling combined with the Skip-Gram with Negative Sampling (SGNS) model embeds the graph into a continuous vector space for classification. Algorithm 1 presents the procedure for constructing a text-based graph and generating embeddings. The main components are described in detail as follows.
3.1 Graph Representation of Security Vulnerabilities
This section presents the graph representation step of security vulnerabilities to graph representations. Our approach transforms CVE data into embedding vectors composed of nodes and edges to understand the context and syntax of the descriptions. In this graph, nodes are formed from the preprocessed terms in the descriptions, while the edges indicate the relationships between the CVE identifier and features. It clarifies the various characteristics and interactions of security vulnerabilities.
Preprocessing. We preprocess the CVE data by extracting essential information of security vulnerabilities into a format suitable for graph analysis. Fig. 4 illustrates the preprocessing step for Vulnerability2Vec. This step converts textual data into a structured format to graphically represent CVE descriptions. Tokenization separates textual data into terms that aid in analyzing key information regarding security vulnerabilities. Part-of-speech (POS) tagging identifies important terms by classifying them as nouns, verbs, and adjectives [39]. A structured representation of the preprocessed data facilitates an understanding of the relationships between the causes, behaviors, and characteristics of vulnerabilities.
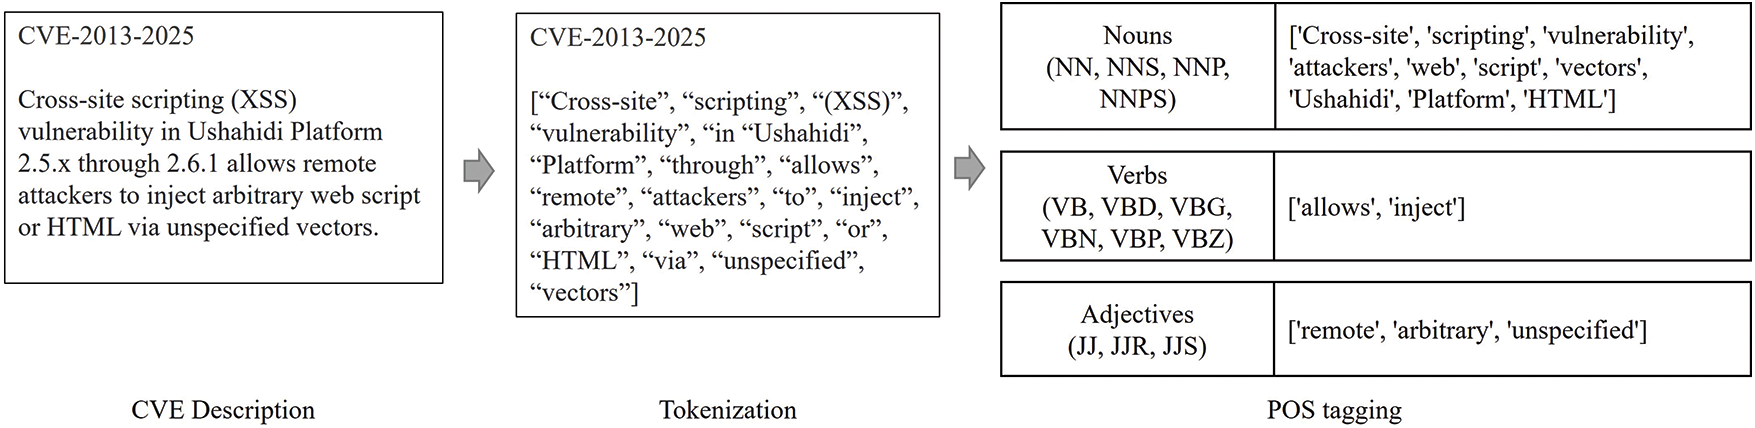
Figure 4: Preprocessing of a CVE description
Graph representation approach. We represent CVEs as a graph by linking them with preprocessed key terms to understand complex relationships (Fig. 5). This graph consolidates vulnerability information into a single structure and clarifies interactions. Nodes are constructed from nouns, verbs, and adjectives extracted from CVE IDs and descriptions, where nouns represent core characteristics, verbs express functional behaviors, and adjectives reflect descriptive qualities. This representation of CVE terms as nodes helps preserve the contextual semantics of each vulnerability. Edges capture the associations between CVE IDs and their corresponding terms, effectively modeling contextual relationships as a graph structure. The nodes in the graph are defined by Eq. (1).
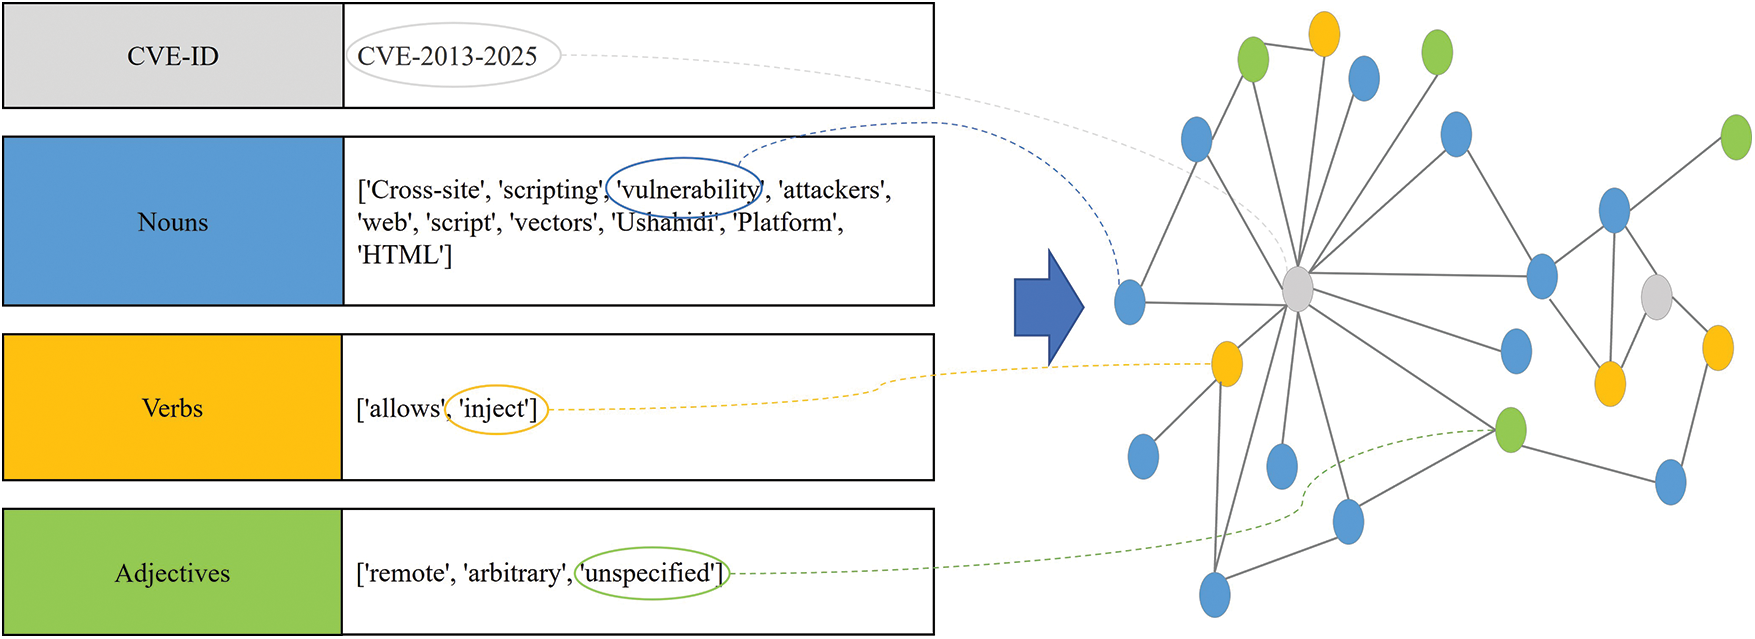
Figure 5: Example of a security vulnerability graph representation. The graph visualizes the relationships between CVE-IDs and various parts of speech. (The gray nodes represent CVE-IDs, blue nodes represent nouns, orange nodes represent verbs, and green nodes represent adjectives.)
where
where
Definition 1. Graph
3.2 Graph Embedding Approach for Representing Vulnerability Features
This section describes the graph-embedding approach for security vulnerabilities embedded into a low-dimensional vector space. Node2vec [34] embeds each node in the graph into a low-dimensional vector space based on the skip-gram model from Word2vec and then applies a support vector machine (SVM) for [40] classification.
Graph Embedding Method
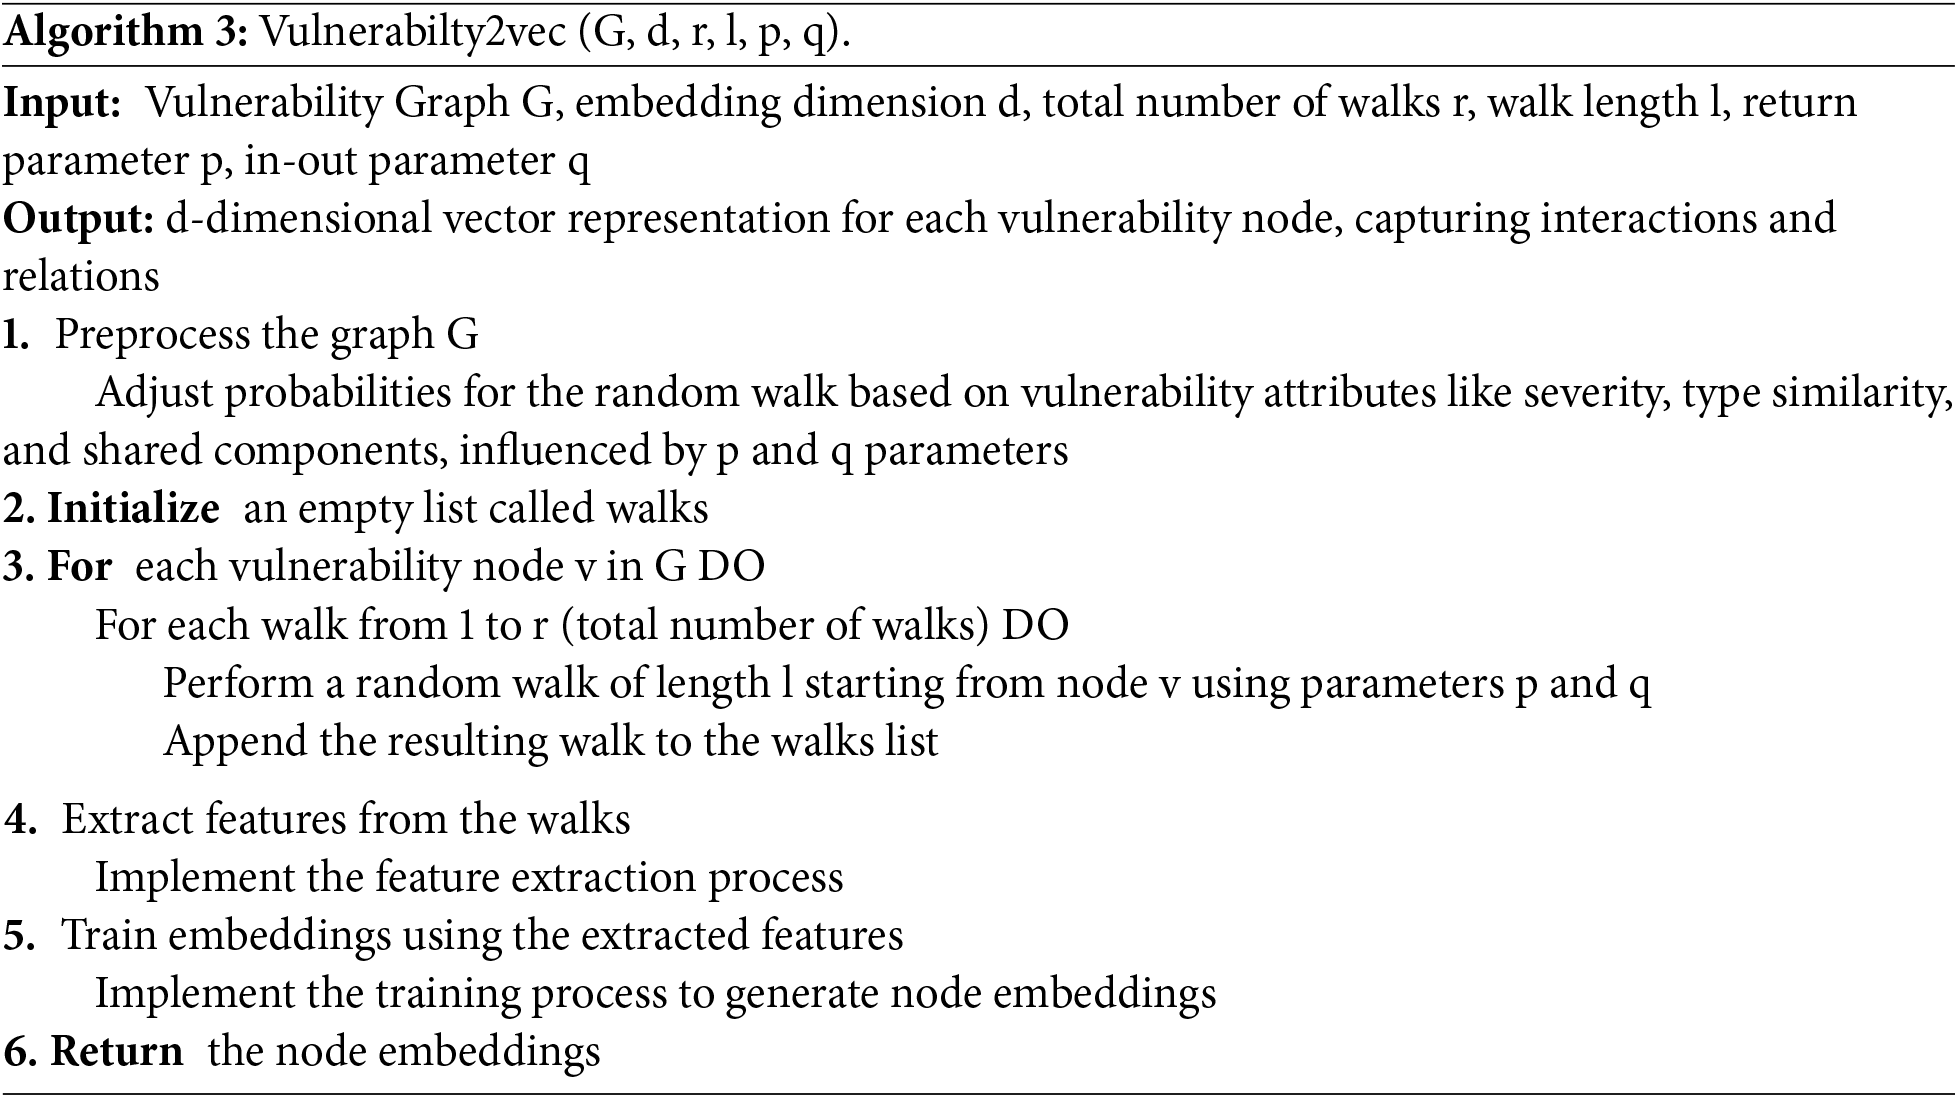
We apply Node2Vec to generate low-dimensional embeddings that encode the structural patterns within the semantic graph. These embeddings are then used as input features for a Support Vector Machine (SVM) classifier to identify vulnerability types. The full classification workflow is outlined in Algorithm 3.
Node sampling strategy. The node sampling strategy captures complex connectivity by randomly selecting the neighbors of a given vulnerability node. It learns these relationships using the random walk method, which involves starting at a designated node and then moving to a randomly selected neighboring node to generate a path. These paths produce sequences that represent the CVE ID context. For example, the random walk generates paths starting from a specific CVE ID and moving to connected nodes such as “inject”-“vulnerability”-“unspecified”, “unspecified”-“vulnerability”-“inject”. The generated sequence represents the context of the corresponding CVE ID, which clarifies the relationship by learning the connections between the key terms. To extend the path during random walks, the next node is selected based on a transition probability that reflects both node connectivity and data characteristics (Eq. (3)).
where
where
Definition 2. Node sampling infers the characteristics of a graph by selecting a specific node
Skip-gram with negative sampling. Vulnerability2Vec embeds complex relationships among security vulnerabilities into a low-dimensional vector space. SGNS generates node embeddings that capture the semantic similarities between vulnerability nodes (CVE IDs) and relevant parts of speech (nouns, verbs, and adjectives). The SGNS contextualizes the parts of speech within a certain range around each node to learn their relationships. Negative sampling enhances computational efficiency by randomly sampling irrelevant parts of speech and training the model to distinguish them clearly from the correct parts of speech. The optimization objective of the SGNS is to maximize the log probability of predicting key terms from a given node and reduce the probability of negative samples. The probability of a negative sample is defined by Eq. (5):
where V represents the set of security vulnerability nodes (CVE IDs)
The SGNS optimization adopts a conditional probability to express the relationship between security vulnerabilities. It is calculated based on the inner product of a specific security vulnerability and its key terms (nouns, verbs, and adjectives). This determines the log probability involved in the optimization objective. The conditional probability of SGNS is defined by Eq. (6):
where
Definition 3. The SGNS extends the skip-gram model by improving learning efficiency through negative sampling. It captures the similarity between nodes in a graph by learning the relationship between a given security vulnerability
Finally, we apply an SVM model for automated classification of vulnerability types. An SVM takes feature vectors from graph embedding as input. It learns the optimal boundary and classifies each vector into a specific CWE type. For example, it determines whether a vector represents CWE-79 (cross-site scripting) or CWE-89 (SQL Injection).
In this section, we evaluate the performance of the CWE classification task on CVE data by addressing two research questions. These questions are designed to analyze the extent to which graph-based semantic modeling improves classification accuracy and enhances our understanding of contextual vulnerability relationships.
RQ1: Does Vulnerability2Vec enhance the classification performance of security vulnerabilities?
We evaluate the effectiveness of Vulnerability2Vec using one-hot vectors, which represent each term as a distinct binary vector, thereby converting textual data into a structured numerical format. However, these vectors only represent individual terms, without capturing their structural relationships between them. To assess the impact on the classification performance, different models based on one-hot vectorized text data are applied to validate the effectiveness of the relationships.
RQ2: Do nouns, verbs, and adjectives extracted from security vulnerability descriptions contribute to understanding relationships between vulnerabilities?
We conduct experiments by including or excluding key vulnerability information to evaluate its impact on classification. The proposed method was evaluated to determine whether it accurately captures the relationships between vulnerabilities.
Vernerality2Vec maps the security vulnerabilities represented as graphs into low-dimensional vectors by exploiting Node2Vec. The Node2Vec hyperparameters are set based on the de-fault values proposed by Grover and Leskovec (2016) [34], as shown in Table 1. We apply 5-fold cross-validation during the evaluation process to ensure the reliability and robustness of the results.

We evaluate Vulnerability2Vec based on CVE-Details data collected from 1999 to 2017 under conditions of varying data scale and complexity. Preprocessing of the data results in 716,771 vulnerability records. The CVE attributes include a unique CVE ID, a common vulnerability scoring system (CVSS), general descriptions, and multiple references. The dataset spans vulnerabilities reported annually across diverse security domains and systems, reflecting a gradual increase in both semantic and structural variability. This progression supports a systematic evaluation of the model’s generalization capability. We randomly split the data into training (60%) and test (40%) sets.
The experiments compare Vulnerability2Vec with three traditional text classification models, including Logistic Regression, Naïve Bayes, and Random Forest.
Logistic Regression [41]: A linear model that computes class probabilities using weighted sums of sparse input vectors. It creates simple decision boundaries and treats each feature independently, without modeling interactions between terms.
Naïve Bayes [42]: A probabilistic classifier that assumes feature independence and estimates class membership based on word frequency and conditional probabilities. Its simplicity makes it effective for small or high-dimensional datasets.
Random Forest [43]: An ensemble model that combines multiple decision trees to capture non-linear patterns and partial feature interactions. It provides greater modeling flexibility compared to linear methods.
The baseline models perform classification solely on word-level information, without considering structural relationships between nodes. This setting compares graph-based and non-graph-based representations.
The experiments evaluate the classification performance of the models with Accuracy (Micro-F1), Precision, Recall, and Macro-F1. The metrics are defined in Eqs. (7)–(10).
Accuracy measures the proportion of total correct predictions among all predictions:
Precision indicates the proportion of correct positive predictions, averaged equally across all classes. It is important when false positives are costly.
Recall measures the proportion of actual positives correctly predicted, averaged equally across all classes. It is critical when false negatives are more concerning.
Macro-F1 is the harmonic means of precision and recall. It is the average of each class’s micro-F1, so every class counts equally.
where TP (True Positive) refers to the number of correctly predicted vulnerabilities, TN (True Negative) to correctly predicted normal samples, FP (False Positive) to normal samples misclassified as vulnerabilities, and FN (False Negative) to vulnerabilities incorrectly classified as normal. N denotes the total number of classes, and
Vulnerability2Vec captures the structural relationships among CVEs by generating graph-based embeddings. Fig. 6 illustrates how central nodes connect with subordinate nodes, revealing patterns that reflect related vulnerability types and attack vectors. For instance, the central node “CVE-2013-2025” connects to subordinate nodes such as “Cross-site,” “XSS,” and “inject.” These connections highlight the key attributes of XSS (Cross-Site Scripting) attacks, confirming that “CVE-2013-2025” belongs to the XSS vulnerability category. Multiple CVE IDs share XSS attacks, indicating that these vulnerabilities are repeatedly identified in certain systems. This pattern offers critical evidence to prioritize code reviews and patches in such systems. Nodes with lower connectivity show fewer links to other nodes while focusing on specific attributes. CVE-2016-10701’ connects only to attributes such as ‘arbitrary’ and ‘platform,’ indicating a unique security issue specific to certain platforms. Vulnerability2Vec offers a precise analysis of structural relationships among vulnerabilities, providing valuable insights for security management and response strategies.
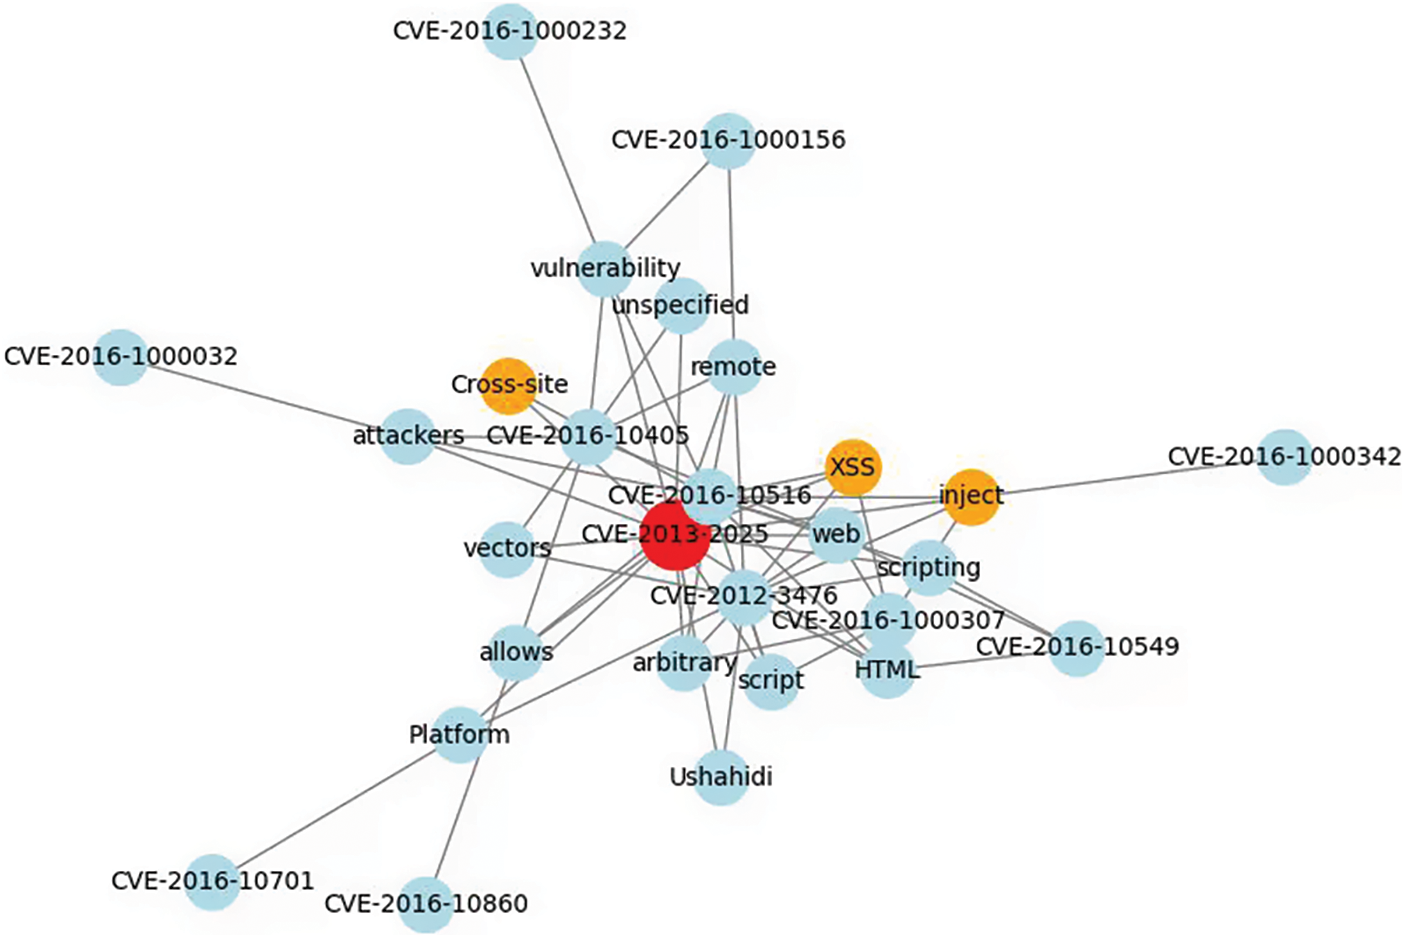
Figure 6: Visualizing CVE data relationships
4.6 Discussion with Research Questions
This section discusses the experimental results of Vulnerability2Vec to address the research question (RQ).
RQ1: Effectiveness of Vulnerability Classification
Table 2 illustrates the comparison of vulnerability classification accuracy among the baseline models. Vulnerability classification remains challenging due to the complexity of software systems. The effectively represented graph embedding matrix enhances accuracy to overcome existing challenges in automated vulnerability classification. Our model demonstrates a 0.02–0.17 points increase in accuracy over traditional probability-based models (Naive Bayesian, Random Forest), Logistic Regression, and one-hot encoding-based classification models from 2009 to 2017. It outperforms random forest by 0.02–0.06 points, which was the smallest performance difference. Table 2 presents a detailed performance comparison with accuracy. Vulnerability2Vec outperforms competing methods by up to 0.247 points in accuracy, with particularly strong gains over Naïve Bayes and Random Forest across multiple years. Furthermore, Table 3 shows that our model achieves up to 0.247 points higher macro F1 than Naive Bayesian and up to 0.14 higher than Random Forest, consistently maintaining stable macro F1 performance even as baseline models decline.


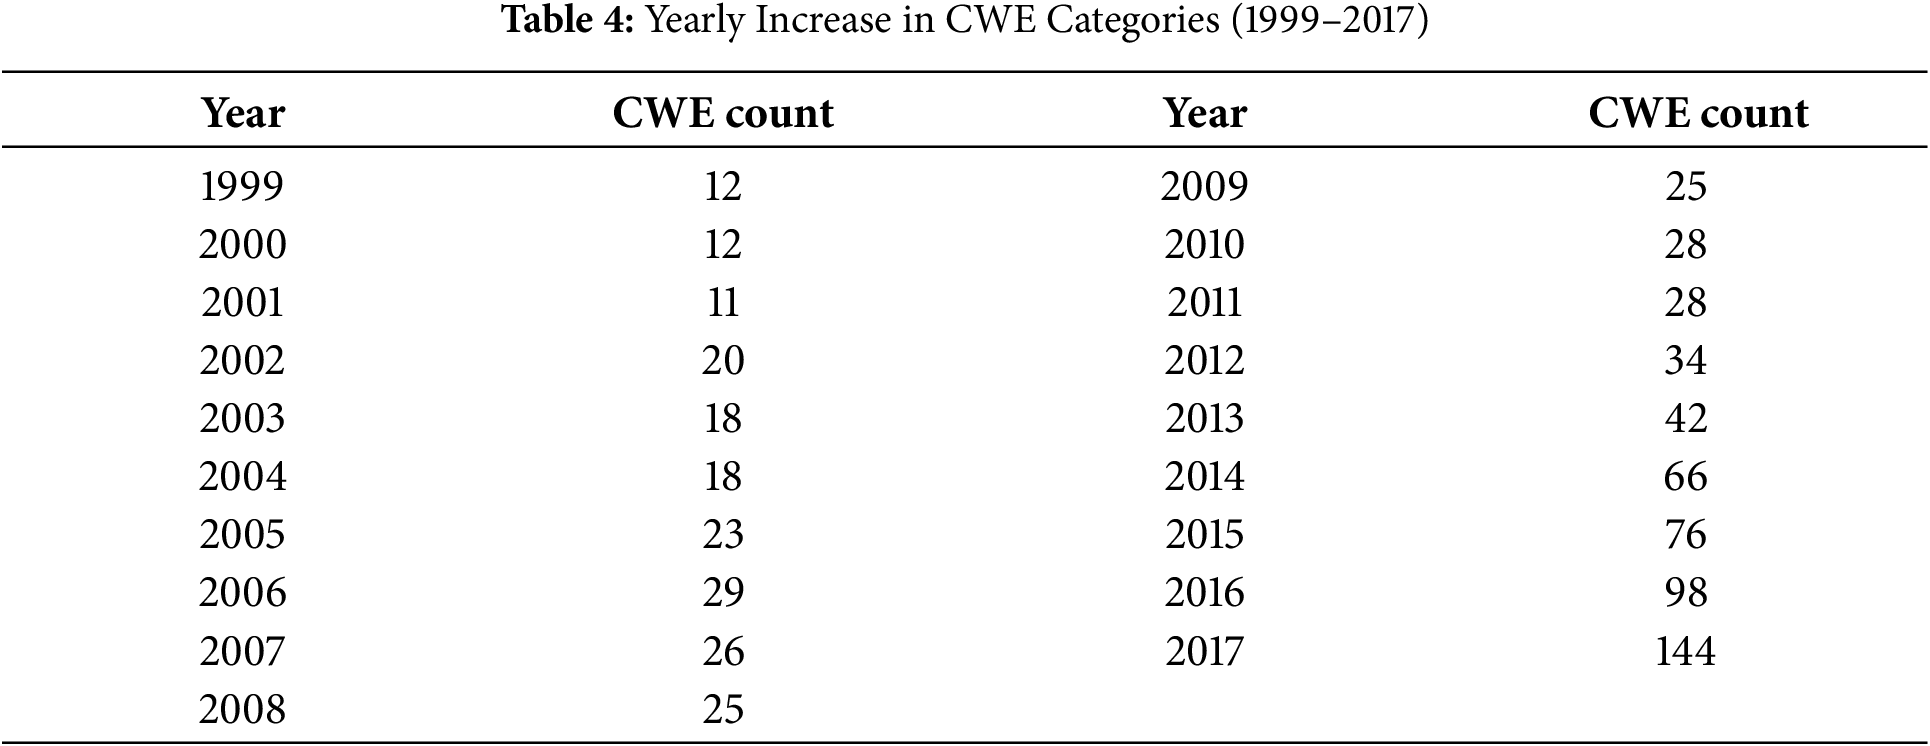
This performance advantage highlights the model’s ability to capture semantic relationships among key vulnerability characteristics. Fig. 7 displays the yearly trend of both precision and recall from 1999 to 2017. While all models decrease in performance on both metrics after 2008, the proposed model maintains higher values than the baseline model. This is attributed to the increased data volume, complexity of vulnerability types, and changes in data characteristics. As shown in Table 4, the number of CWEs has steadily increased over the past few years. The difficulty of classification increases when complex relationships are insufficiently modeled. The rapid increase in CWE diversity causes performance decline observed from 2008. It requires handling class imbalance caused by the growing number of classes. However, our model maintains a relative outperformance compared with the other models. Baseline models have advantages for analyzing individual features rather than contextual relationships between terms. They are effective in small-scale data but are limited in capturing the complex context and syntax of vulnerabilities. Our model enables more accurate classification by identifying key features and their semantics. For example, existing models are limited in their ability to adequately reflect the context of various vulnerabilities when they rely solely on the term ‘buffer overflow.’ Contrarily, our model identifies the causes of potential buffer overflows by considering the similarity of key terms such as ‘memory,’ ‘corrupt,’ and ‘potential.’ This approach employs memory-related issues to classify potential buffer overflow vulnerabilities. Vulnerability2Vec, which accounts for the semantics between vulnerabilities, achieves higher accuracy in classifying security vulnerabilities than models focusing only on individual terms.
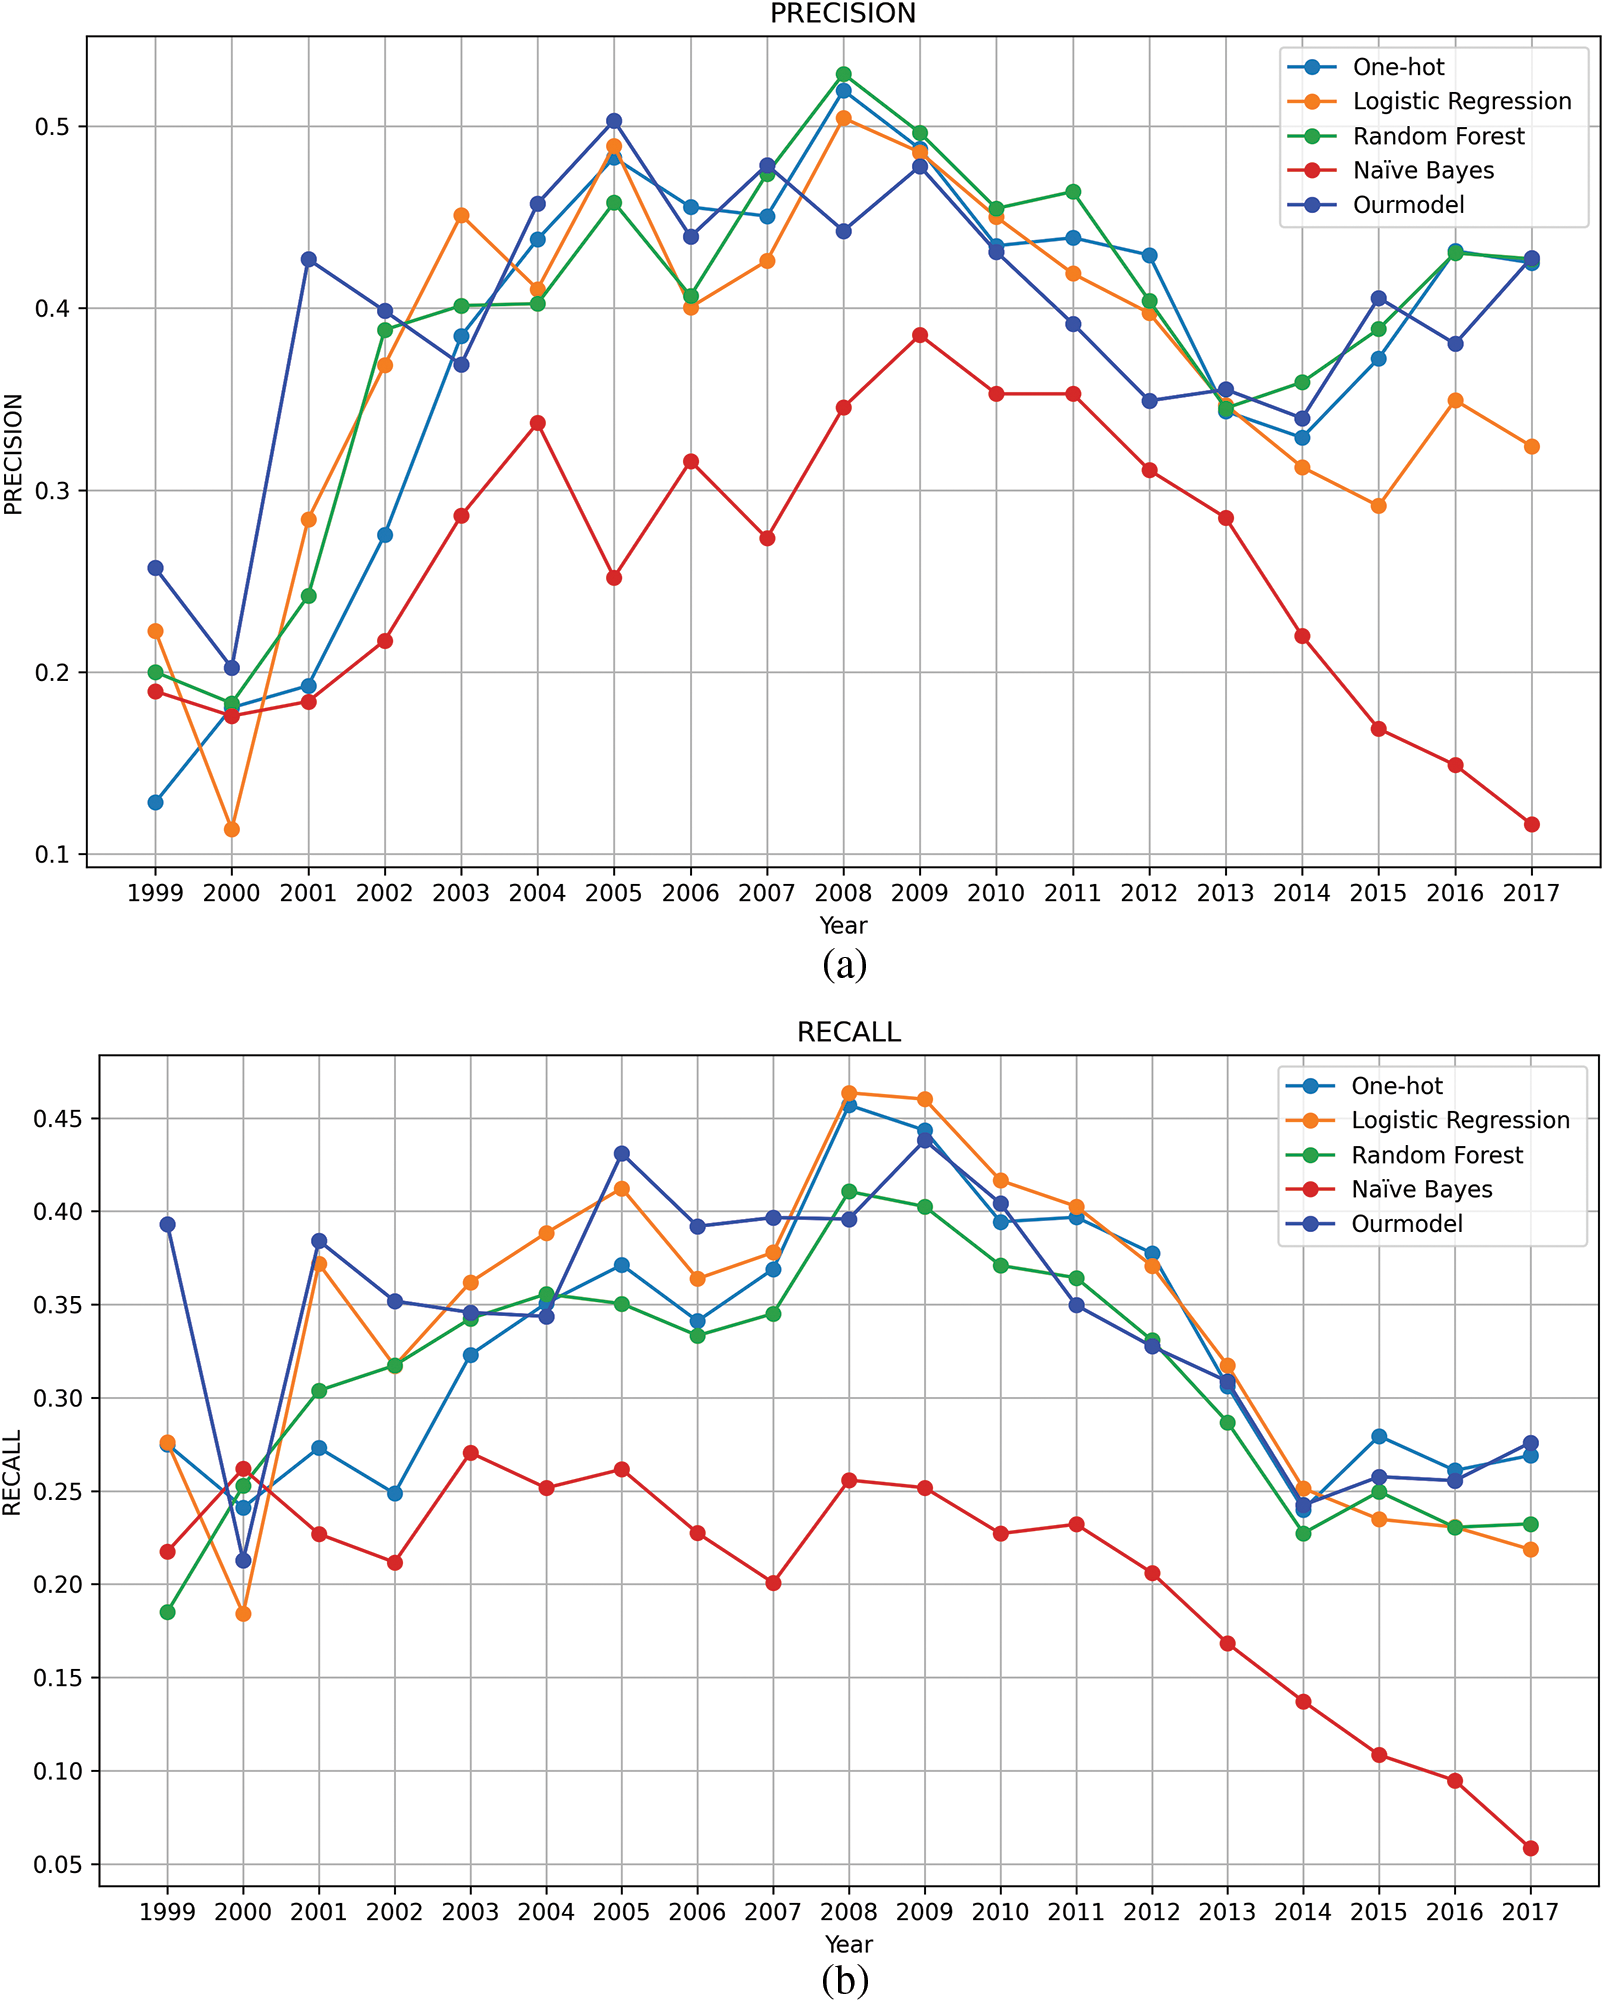
Figure 7: Annual changes in vulnerability classification performance (1999–2017). (a) Precision; (b) Recall
RQ2: Effectiveness of Extracting Meaningful Information for Vulnerability Classification
This experiment evaluates the effect of different parts of speech such as nouns, verbs, and adjectives in CVE descriptions on modeling structural relationships between security vulnerabilities. This study examines how parts of speech affect semantic relationship modeling and CWE classification through removal and combination.
Our model demonstrates that effectively combining key information and removing unnecessary details is crucial for optimizing performance. We also conduct an ablation study to verify the effectiveness of the proposed graph representation approach by adopting various Vulnerability2Vec variants. The variants are as follows: (1) excluding actions and characteristics of vulnerabilities (Nouns), (2) excluding subjects and characteristics (Verbs), (3) excluding characteristics (Nouns + Verbs), (4) combining nouns with substitute terms (Nouns + Pronouns), (5) combining Vulnerability2Vec with substitute terms (Nouns + Pronouns + Verbs + Adjectives), (6) using only the CVSS score of vulnerability attributes (Score), and (7) combining nouns + pronouns with score (CVE data). Fig. 8 illustrates the results of the ablation study on the meaningful relationships in the data. By combining or excluding nouns, verbs, and adjectives, Vulnerability2Vec outperforms models that rely solely on a single part of speech. Table 5 details the year-by-year performance trends. Accuracy is the highest in most years, with a 0.43–0.46 points advantage over all comparison models between 2005 and 2010, confirming the consistency and robustness of the proposed graph-representation strategy. The proposed model combines key parts of speech (nouns, verbs, and adjectives) to reveal meaningful relationships and enhance the structural understanding of core characteristics and their impacts. This improvement has likely resulted from minimizing unnecessary information and focusing on key features to capture hidden patterns. Our model outperforms the Nouns + Verbs model by approximately 0.006 accuracy points on average across all years, surpassing the Nouns + Pronouns + Verb + Adjectives and CVE data models by approximately 1 accuracy point. It also achieves improvements of over 0.46 accuracy points compared to the Score model, based on the results in 2006. For example, our model improves structural understanding of the relationships between vulnerabilities by combining key terms such as ‘exploit’ (verb), ‘unauthorized’ (adjective), and ‘SQL injection’ (noun). However, ambiguous expressions such as ‘it’ or ‘they’ can complicate identifying key information by merging different security issues. The experimental results indicate that combining key information specifically nouns, verbs, and adjectives and removing irrelevant content substantially improves model performance. This emphasizes the importance of reducing data noise and ensuring reliable results for security vulnerability classification.
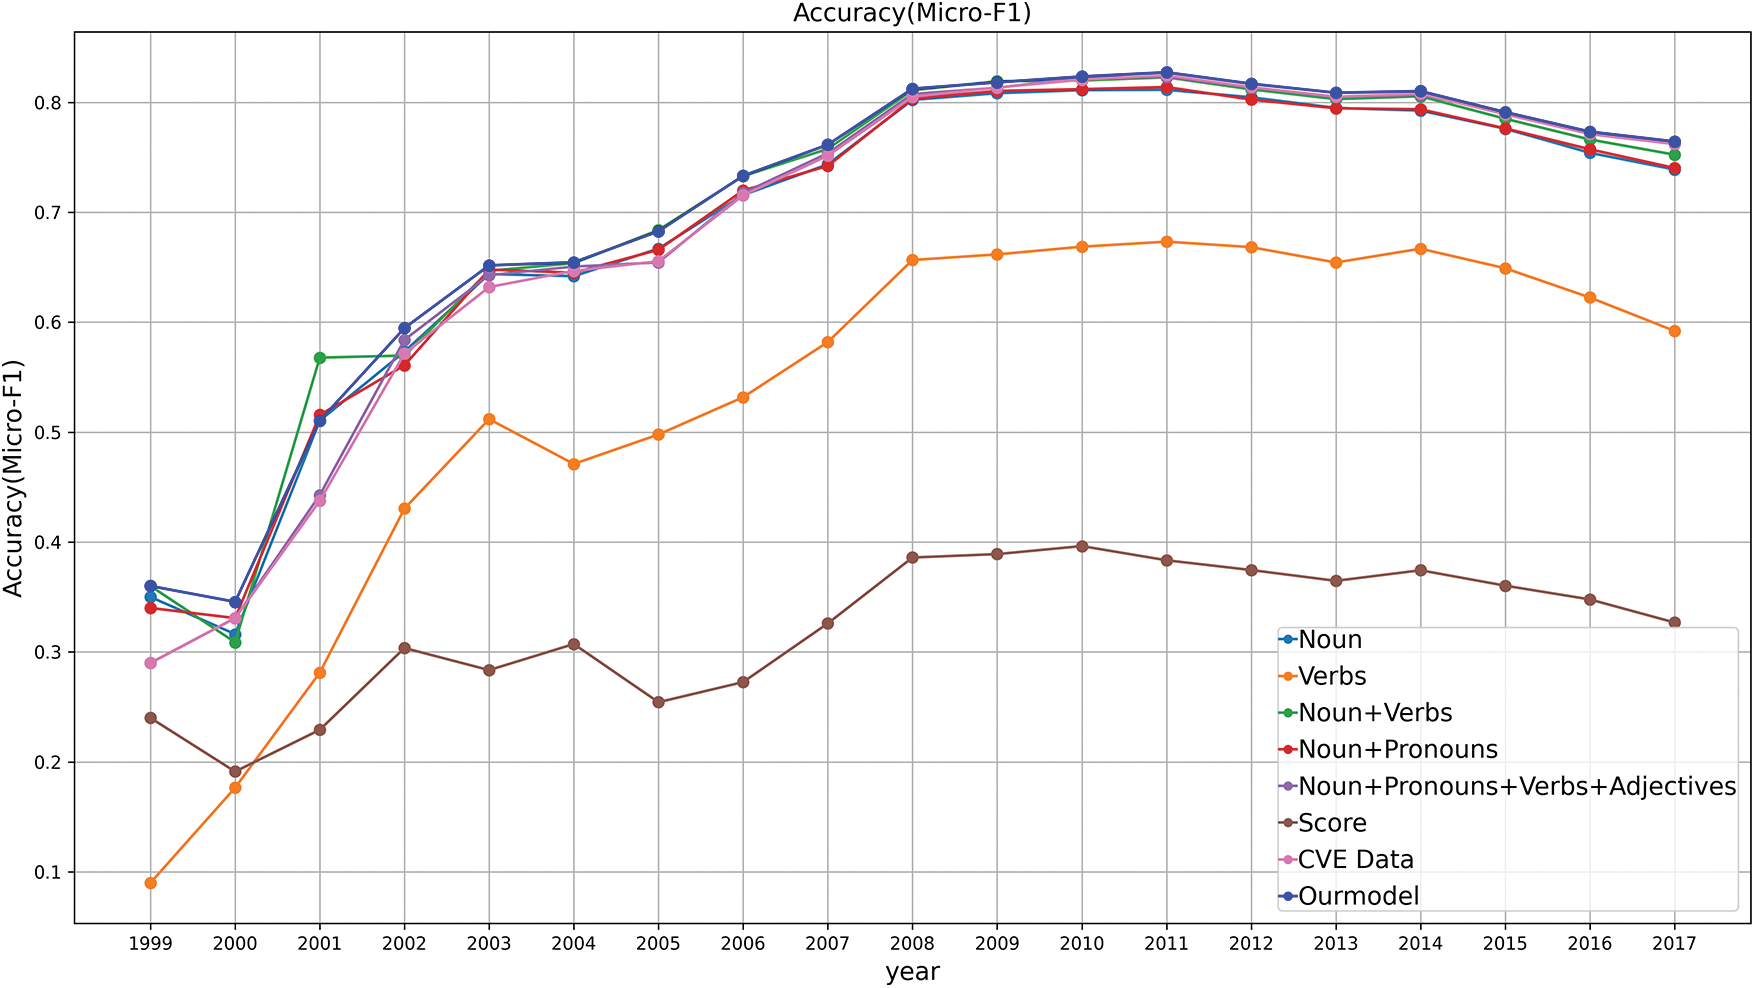
Figure 8: Year-by-year accuracy from an ablation study which evaluates how the structural relationships between parts of speech (nouns, verbs, adjectives, etc.) influence vulnerability classification

Advancements in information technology (IT) leads to an increasing demand for automated security vulnerability analyses, and text descriptions are central in effective automated response systems. In this study, we propose Vulnerability2Vec, a novel approach for capturing semantic similarities in vulnerability type classification. The proposed method represents CVE descriptions as graphs to learn node embeddings using Node2vec. These embeddings enable the classification of security vulnerability types through an SVM classifier. The experimental results demonstrate that the proposed method outperforms existing approaches based on sparse vector term frequency in classifying the complex relationships of CVEs. Particularly, the combination of key terms effectively captures complex relationships and important patterns. The results demonstrate that both the semantic similarity of texts and the structural relationships of key features are effective for classifying vulnerability types.
Despite these advantages, the proposed model is still limited by two core factors. First, it relies on a static graph representation, embedding vulnerability information in a fixed, time-invariant structure that must be rebuilt whenever new CVEs appear, thereby constraining scalability. Second, all embeddings are generated offline in batch mode, preventing real-time processing and diminishing the model’s utility for continuous security monitoring. Future work may focus on enriching the graph with additional modalities, such as abstract syntax trees, control-flow graphs, and CVSS metrics. Multimodal joint-embedding or gating mechanisms can be used to broaden semantic coverage and bolster classification robustness. For the node embedding method, graph attention-based methods and deep neural networks or knowledge graphs may be used. Efficient graph mining or dynamic graph neural networks may be used for incremental updates, and continual-learning techniques to avert catastrophic forgetting. In future, our model can be applied to practical applications through real-time vulnerability monitoring and automated patch prioritization scenarios. We personally aim to develop a tool that classifies new vulnerabilities in real-time using Vulnerability2Vec. This will allow us to build a more efficient security vulnerability management system.
Acknowledgement: During the preparation of this manuscript, the authors utilized OpenAI’s ChatGPT version GPT-4o to improve its linguistic clarity and grammar. The authors have carefully reviewed and revised the output and accept full responsibility for all content.
Funding Statement: This work was partly supported by the MSIT (Ministry of Science and ICT), Republic of Korea, under the Convergence Security Core Talent Training Business Support Program (IITP-2025-RS-2023-00266605, 50%), and in part by the Institute of Information & Communications Technology Planning & Evaluation (lITP) grant funded by the Korea government (MSIT) (RS-2025-02305436, Development of Digital Innovative Element Technologies for Rapid Prediction of Potential Complex Disasters and Continuous Disaster Prevention, 30%). It was also supported by the Chung-Ang University Graduate Research Scholar-ship in 2023 (20%).
Author Contributions: Conceptualization, Myoung-oh Choi and Mincheol Shin; methodology, Myoung-oh Choi and Mincheol Shin; software, Myoung-oh Choi and Mincheol Shin; resources, Hyonjun Kang; writing—original draft preparation, Myoung-oh Choi; writing—review and editing, Mucheol Kim and Ka Lok Man; supervision, Mucheol Kim; project administration, Mucheol Kim; funding acquisition, Mucheol Kim. All authors reviewed the results and approved the final version of the manuscript.
Availability of Data and Materials: The data that support the findings of this study are openly available at: http://cvedetails.com (accessed on 15 May 2025).
Ethics Approval: Not applicable.
Conflicts of Interest: The authors declare no conflicts of interest to report regarding the present study.
1https://www.mitre.org/focus-areas/cybersecurity (accessed on 15 May 2025).
2https://cwe.mitre.org/ (accessed on 15 May 2025).
3https://www.mitre.org/ (accessed on 15 May 2025).
4http://cvedetails.com (accessed on 15 May 2025).
5https://www.cvedetails.com/cwe-definitions/ (accessed on 15 May 2025).
6https://capec.mitre.org/ (accessed on 15 May 2025).
References
1. Alhazmi O, Malaiya Y, Ray I. Security vulnerabilities in software systems: a quantitative perspective. In: Data and applications security XIX. Berlin/Heidelberg, Germany: Springer; 2005. p. 281–94. doi:10.1007/11535706_21. [Google Scholar] [CrossRef]
2. Akhter L, Khan MT, Loukas G, Sakellari G. Towards integration of syntactic and semantic vulnerability patterns. In: 2024 IEEE 21st International Conference on Software Architecture Companion (ICSA-C); 2024 Jun 4–8; Hyderabad, India. p. 260–4. doi:10.1109/ICSA-C63560.2024.00054. [Google Scholar] [CrossRef]
3. Ji C, Yang S, Sun H, Zhang Y. Applying contrastive learning to code vulnerability type classification. In: Proceedings of the 2024 Conference on Empirical Methods in Natural Language Processing. Stroudsburg, PA, USA: ACL; 2024. p. 11942–52. doi:10.18653/v1/2024.emnlp-main.666. [Google Scholar] [CrossRef]
4. Strom BE, Applebaum A, Miller DP, Nickels KC, Pennington AG, Thomas CB. Mitre att&ck: design and philosophy. Technical report. McLean, VA, USA: The MITRE Corporation; 2018. [Google Scholar]
5. Byers R, Turner C, Brewer T. National vulnerability database. Gaithersburg, MD, USA: National Institute of Standards and Technology; 2022. [Google Scholar]
6. Adam C, Bulut MF, Sow D, Ocepek S, Bedell C, Ngweta L. Attack techniques and threat identification for vulnerabilities. arXiv:2206.11171. 2022. [Google Scholar]
7. Mohamed N. Artificial intelligence and machine learning in cybersecurity: a deep dive into state-of-the-art techniques and future paradigms. Knowl Inf Syst. 2025;67(8):6969–7055. doi:10.1007/s10115-025-02429-y. [Google Scholar] [CrossRef]
8. Varma G. A study of synergy between programming practices evolution and information disclosure-causing vulnerabilities. Iran J Comput Sci. 2024;7(1):25–40. doi:10.1007/s42044-023-00156-7. [Google Scholar] [CrossRef]
9. Steve C, Martin R. Vulnerability type distributions in CVE. Mitre Report. 2007;200(7):1–38. [Google Scholar]
10. Tripathi A, Singh UK. Taxonomic analysis of classification schemes in vulnerability databases. In: 2011 6th International Conference on Computer Sciences and Convergence Information Technology (ICCIT); 2011 Nov 29–Dec 1; Seogwipo, Republic of Korea. p. 686–691. [Google Scholar]
11. Liu P, Ye W, Duan H, Li X, Zhang S, Yao C, et al. Graph neural network based approach to automatically assigning common weakness enumeration identifiers for vulnerabilities. Cybersecurity. 2023;6(1):29. doi:10.1186/s42400-023-00160-1. [Google Scholar] [CrossRef]
12. Atiiq SA, Gehrmann C, Dahlén K, Khalil K. From generalist to specialist: exploring cwe-specific vulnerability detection. arXiv:2408.02329. 2024. [Google Scholar]
13. Li X, Chen J, Lin Z, Zhang L, Wang Z, Zhou M, et al. A mining approach to obtain the software vulnerability characteristics. In: 2017 Fifth International Conference on Advanced Cloud and Big Data (CBD); 2017 Aug 13–16; Shanghai, China. p. 296–301. doi:10.1109/CBD.2017.58. [Google Scholar] [CrossRef]
14. Chang YY, Zavarsky P, Ruhl R, Lindskog D. Trend analysis of the CVE for software vulnerability management. In: 2011 IEEE Third International Conference on Privacy, Security, Risk and Trust and 2011 IEEE Third International Conference on Social Computing; 2011 Oct 9–11; Boston, MA, USA. p. 1290–3. doi:10.1109/PASSAT/SocialCom.2011.184. [Google Scholar] [CrossRef]
15. Russo ER, Di Sorbo A, Visaggio CA, Canfora G. Summarizing vulnerabilities’ descriptions to support experts during vulnerability assessment activities. J Syst Softw. 2019;156(1):84–99. doi:10.1016/j.jss.2019.06.001. [Google Scholar] [CrossRef]
16. Liu C, Chen X, Li X, Xue Y. Making vulnerability prediction more practical: prediction, categorization, and localization. Inf Softw Technol. 2024;171(4):107458. doi:10.1016/j.infsof.2024.107458. [Google Scholar] [CrossRef]
17. Wei Y, Bo L, Sun X, Li B, Zhang T, Tao C. Automated event extraction of CVE descriptions. Inf Softw Technol. 2023;158(1):107178. doi:10.1016/j.infsof.2023.107178. [Google Scholar] [CrossRef]
18. Templeton A. Word equations: inherently interpretable sparse word embeddings through sparse coding. arXiv:2004.13847. 2020. [Google Scholar]
19. Weinberger K, Dasgupta A, Langford J, Smola A, Attenberg J. Feature hashing for large scale multitask learning. In: Proceedings of the 26th Annual International Conference on Machine Learning. Montreal, QC, Canada: ACM; 2009. p. 1113–20. doi:10.1145/1553374.1553516. [Google Scholar] [CrossRef]
20. Freksen CB, Kamma L, Green Larsen K. Fully understanding the hashing trick. In: Advances in Neural Information Processing Systems 31 (NeurIPS 2018). San Jose, CA, USA: Curran Associates, Inc.; 2018. [Google Scholar]
21. Yao L, Mao C, Luo Y. Graph convolutional networks for text classification. Proc AAAI Conf Artif Intell. 2019;33(1):7370–7. doi:10.1609/aaai.v33i01.33017370. [Google Scholar] [CrossRef]
22. Zhou J, Cui G, Hu S, Zhang Z, Yang C, Liu Z, et al. Graph neural networks: a review of methods and applications. AI Open. 2020;1(1):57–81. doi:10.1016/j.aiopen.2021.01.001. [Google Scholar] [CrossRef]
23. Han K, Wang Y, Guo J, Tang Y, Wu E. Vision GNN: an image is worth graph of nodes. Adv Neural Inf Process Syst. 2022;35:8291–303. [Google Scholar]
24. Bourigault S, Lagnier C, Lamprier S, Denoyer L, Gallinari P. Learning social network embeddings for predicting information diffusion. In: Proceedings of the 7th ACM International Conference on Web Search and Data Mining. New York, NY, USA: ACM; 2014. p. 393–402. doi:10.1145/2556195.2556216. [Google Scholar] [CrossRef]
25. Theocharidis A, van Dongen S, Enright AJ, Freeman TC. Network visualization and analysis of gene expression data using BioLayout Express 3D. Nat Protoc. 2009;4(10):1535–50. doi:10.1038/nprot.2009.177. [Google Scholar] [PubMed] [CrossRef]
26. Yu J, Yin H, Xia X, Chen T, Li J, Huang Z. Self-supervised learning for recommender systems: a survey. IEEE Trans Knowl Data Eng. 2024;36(1):335–55. doi:10.1109/TKDE.2023.3282907. [Google Scholar] [CrossRef]
27. Tang W, Tang M, Ban M, Zhao Z, Feng M. CSGVD: a deep learning approach combining sequence and graph embedding for source code vulnerability detection. J Syst Softw. 2023;199(3):111623. doi:10.1016/j.jss.2023.111623. [Google Scholar] [CrossRef]
28. Ling M, Tang M, Bian D, Lv S, Tang Q. A dual graph neural networks model using sequence embedding as graph nodes for vulnerability detection. Inf Softw Technol. 2025;177(3):107581. doi:10.1016/j.infsof.2024.107581. [Google Scholar] [CrossRef]
29. Na S, Kim T, Kim H. A study on the classification of common vulnerabilities and exposures using naïve bayes. In: Advances on Broad-Band Wireless Computing, Communication and Applications (BWCCA-2016). Berlin/Heidelberg, Germany: Springer; 2017. p. 657–62. doi:10.1007/978-3-319-49106-6_65. [Google Scholar] [CrossRef]
30. Rehman S, Mustafa K. Software design level vulnerability classification model. Int J Comput Sci Secur. 2012;6(4):238–55. [Google Scholar]
31. Yosifova V, Tasheva A, Trifonov R. Predicting vulnerability type in common vulnerabilities and exposures (CVE) database with machine learning classifiers. In: 2021 12th National Conference with International Participation (ELECTRONICA); 2021 May 27–28; Sofia, Bulgaria. p. 1–6. doi:10.1109/ELECTRONICA52725.2021.9513723. [Google Scholar] [CrossRef]
32. Yosifova V. Vulnerability type prediction in common vulnerabilities and exposures database with ensemble machine learning. In: 2021 International Conference Automatics and Informatics (ICAI); 2021 Sep 30–Oct 2; Varna, Bulgaria. p. 146–9. doi:10.1109/icai52893.2021.9639588. [Google Scholar] [CrossRef]
33. Perozzi B, Al-Rfou R, Skiena S. DeepWalk: online learning of social representations. In: Proceedings of the 20th ACM SIGKDD International Conference on Knowledge Discovery and Data Mining. New York, NY, USA: ACM; 2014. p. 701–10. doi:10.1145/2623330.2623732. [Google Scholar] [CrossRef]
34. Grover A, Leskovec J. node2vec: scalable feature learning for networks. In: Proceedings of the 22nd ACM SIGKDD International Conference on Knowledge Discovery and Data Mining. New York, NY, USA: ACM; 2016. p. 855–64. doi:10.1145/2939672.2939754. [Google Scholar] [PubMed] [CrossRef]
35. Perozzi B, Kulkarni V, Chen H, Skiena S. Don’t walk, skip!: online learning of multi-scale network embeddings. In: Proceedings of the 2017 IEEE/ACM International Conference on Advances in Social Networks Analysis and Mining 2017. New York, NY, USA: ACM; 2017. p. 258–65. doi:10.1145/3110025.3110086. [Google Scholar] [CrossRef]
36. Tang J, Qu M, Wang M, Zhang M, Yan J, Mei Q. LINE: large-scale information network embedding. In: Proceedings of the 24th International Conference on World Wide Web. Florence, Italy: International World Wide Web Conferences Steering Committee; 2015. p. 1067–77. doi:10.1145/2736277.2741093. [Google Scholar] [CrossRef]
37. Wang S, Huang C, Yu D, Chen X. VulGraB: graph-embedding-based code vulnerability detection with bi-directional gated graph neural network. Softw Pract Exp. 2023;53(8):1631–58. doi:10.1002/spe.3205. [Google Scholar] [CrossRef]
38. Chen Y, Wu L, Zaki MJ. Reinforcement learning based graph-to-sequence model for natural question generation. arXiv:1908.04942. 2019. [Google Scholar]
39. Lee R. Part-of-Speech (POS) tagging. In: Natural language processing: a textbook with python implementation. Berlin/Heidelberg, Germany: Springer; 2025. p. 45–68. doi:10.1007/978-981-96-3208-4_3. [Google Scholar] [CrossRef]
40. Awad M, Khanna R, Awad M, Khanna R. Support vector machines for classification. In: Efficient learning machines: theories, concepts, and applications for engineers and system designers. Berkeley, CA, USA: Apress; 2015. p. 39–66. doi:10.1007/978-1-4302-5990-9_3. [Google Scholar] [CrossRef]
41. Wright RE. Logistic regression. In: Reading and understanding multivariate statistics. Washington, DC, USA: APA; 1995. p. 217–44. [Google Scholar]
42. Dumais S, Platt J, Heckerman D, Sahami M. Inductive learning algorithms and representations for text categorization. In: Proceedings of the Seventh International Conference on Information and Knowledge Management. New York, NY, USA: ACM; 1998. p. 148–55. doi:10.1145/288627.288651. [Google Scholar] [CrossRef]
43. Breiman L. Random forests. Mach Learn. 2001;45(1):5–32. doi:10.1023/A:1010933404324. [Google Scholar] [CrossRef]
Cite This Article
 Copyright © 2025 The Author(s). Published by Tech Science Press.
This work is licensed under a Creative Commons Attribution 4.0 International License , which permits unrestricted use, distribution, and reproduction in any medium, provided the original work is properly cited.
 Downloads
 Citation Tools