
 Submit a Paper
 Propose a Special lssue
 Open Access
ARTICLE

Noninvasive Hemoglobin Estimation with Adaptive Lightweight Convolutional Neural Network Using Wearable PPG
1 Mathematics, Physics, and Natural Science Division, The University of New Mexico, 705 Gurley Ave., Gallup, NM 87301, USA
2 Biomedical Engineering Department, College of Engineering, Imam Abdulrahman Bin Faisal University, Dammam, 34212, Saudi Arabia
3 Department of Computer Science, College of Computer, Qassim University, Buraydah, 51452, Saudi Arabia
4 School of Biomedical Engineering, Shenzhen University, Shenzhen, 518060, China
5 Department of Software Engineering, Lahore Garrison University, Lahore, 54810, Pakistan
* Corresponding Author: Mubashir Ali. Email:
(This article belongs to the Special Issue: Artificial Intelligence Models in Healthcare: Challenges, Methods, and Applications)
Computer Modeling in Engineering & Sciences 2025, 144(3), 3715-3735. https://doi.org/10.32604/cmes.2025.068736
Received 05 June 2025; Accepted 01 September 2025; Issue published 30 September 2025
 View Full Text
 Download PDF
Abstract
Hemoglobin is a vital protein in red blood cells responsible for transporting oxygen throughout the body. Its accurate measurement is crucial for diagnosing and managing conditions such as anemia and diabetes, where abnormal hemoglobin levels can indicate significant health issues. Traditional methods for hemoglobin measurement are invasive, causing pain, risk of infection, and are less convenient for frequent monitoring. PPG is a transformative technology in wearable healthcare for noninvasive monitoring and widely explored for blood pressure, sleep, blood glucose, and stress analysis. In this work, we propose a hemoglobin estimation method using an adaptive lightweight convolutional neural network (HMALCNN) from PPG. The HMALCNN is designed to capture both fine-grained local waveform characteristics and global contextual patterns, ensuring robust performance across acquisition settings. We validated our approach on two multi-regional datasets containing 152 and 68 subjects, respectively, employing a subject-independent 5-fold cross-validation strategy. The proposed method achieved root mean square errors (RMSE) of 0.90 and 1.20 g/dL for the two datasets, with strong Pearson correlations of 0.82 and 0.72. We conducted extensive post-hoc analyses to assess clinical utility and interpretability. A 1 g/dL clinical error tolerance evaluation revealed that 91.3% and 86.7% of predictions for the two datasets fell within the acceptable clinical range. Hemoglobin range-wise analysis demonstrated consistently high accuracy in the normal and low hemoglobin categories. Statistical significance testing using the Wilcoxon signed-rank test confirmed the stability of performance across validation folds ( > 0.05 for both RMSE and correlation). Furthermore, model interpretability was enhanced using Gradient-weighted Class Activation Mapping (Grad-CAM), supporting the model’s clinical trustworthiness. The proposed HMALCNN offers a computationally efficient, clinically interpretable, and generalizable framework for noninvasive hemoglobin monitoring, with strong potential for integration into wearable healthcare systems as a practical alternative to invasive measurement techniques.Keywords
Hemoglobin is a crucial protein found in red blood cells, responsible for transporting oxygen from the lungs to various tissues throughout the body. It comprises iron-rich heme groups, which bind to oxygen molecules for efficient oxygen delivery. The concentration of hemoglobin in the blood is a critical indicator of a person’s overall health. Abnormal levels of hemoglobin can lead to various health conditions, as the body’s tissues may not receive an adequate supply of oxygen [1]. Maintaining normal hemoglobin levels is essential for the body’s metabolic processes. Hemoglobin levels are closely linked to anemia and diabetes, two prevalent health conditions that significantly impact global populations. Anemia is characterized by a deficiency in the number or quality of red blood cells, leading to reduced oxygen-carrying capacity [2]. This condition often results in fatigue, weakness, and a range of other symptoms that can severely affect quality of life. The poor management of diabetes leads to various complications. Chronic kidney disease is a common complication of diabetes that can impair the production of erythropoietin, a hormone essential for red blood cell production, thereby leading to anemia [3]. Additionally, high blood glucose levels can damage blood vessels and reduce the overall efficiency of oxygen delivery, further exacerbating the problem. Beyond anemia and diabetes, abnormal hemoglobin levels are associated with other blood-related complications. For instance, polycythemia is a condition characterized by an excess of hemoglobin due to an overproduction of red blood cells [4], which can lead to an increased risk of thrombosis, stroke, and heart attack as shown in Fig. 1. On the other hand, low hemoglobin levels can result in hypoxia, where the body’s tissues are deprived of adequate oxygen, potentially leading to organ damage and other serious health issues [5]. Hemoglobin abnormalities can also indicate underlying conditions such as thalassemia or sickle cell disease, which are inherited blood disorders that affect the shape and function of red blood cells, leading to a range of severe health complications [6].

Figure 1: Illustration of hemoglobin levels along with associated diseases. Low hemoglobin levels are associated with anemia, liver, and kidney, while high hemoglobin levels are associated with dehydration, lung, and heart
Traditionally, hemoglobin levels have been measured using invasive methods, such as blood draws followed by laboratory analysis [7]. Common techniques include the cyanmethemoglobin method, where blood is mixed with a chemical that forms a stable compound with hemoglobin, and then its concentration is measured spectrophotometrically. Another method involves the use of automated hematology analyzers, which count red blood cells and determine hemoglobin concentration. While these methods are accurate, they are invasive, requiring needle punctures to obtain blood samples, which can cause discomfort and pose a risk of infection. Additionally, these methods are often time-consuming and require laboratory facilities, making them less suitable for frequent monitoring, particularly in low-resource settings or for individuals who require regular hemoglobin checks.
Photoplethysmography (PPG) has emerged as a promising noninvasive technology for hemoglobin measurement, offering a more convenient and less painful alternative to traditional methods [8]. PPG works by using a light source and a photodetector to measure the changes in light absorption in the blood vessels, which occur as a result of blood volume changes during the cardiac cycle [9]. Since hemoglobin has specific light absorption characteristics, PPG can be used to estimate hemoglobin concentration by analyzing the light absorption patterns. This technique has the potential to revolutionize hemoglobin monitoring, especially for patients with chronic conditions such as anemia and diabetes, who require regular assessment of their hemoglobin levels. The emergence of deep learning in healthcare applications enables the automatic extraction of features and patterns from medical data, such as images, signals, and patient records, facilitating accurate diagnoses, predictions, and personalized treatments [10]. Deep learning uses multi-layered neural networks to model and analyze complex patterns within vast amounts of data [11]. It has revolutionized healthcare by enabling systems to autonomously learn from large datasets and make informed decisions. Deep learning has found numerous applications in biosignal analysis, including sleep monitoring, stress detection, and cardiovascular analysis [12]. The main novelties of this work are described as follows:
• We propose a novel end-to-end adaptive lightweight convolutional neural network (HMALCNN) that efficiently learns both fine-grained local waveform characteristics and global contextual patterns from multi-wavelength PPG signals for accurate hemoglobin estimation.
• We validate the proposed model on two multi-regional datasets with different spectral configurations (dual- and four-wavelength PPG) using a subject-independent five-fold cross-validation strategy, ensuring robust generalization across acquisition settings and populations.
• We conduct extensive post-hoc analyses, including clinical error tolerance evaluation (
• We enhance model transparency and physiological interpretability through Gradient-weighted Class Activation Mapping (Grad-CAM), which highlights clinically relevant waveform segments such as systolic peaks and dicrotic notches, demonstrating that the network attends to meaningful PPG features.
• Comparative experiments against state-of-the-art methods show that the proposed HMALCNN achieves lower root-mean-square error (RMSE) and higher Pearson correlation, offering a computationally efficient and clinically reliable alternative for noninvasive hemoglobin monitoring.
The rest of the paper is structured as follows: Section 2 reviews the literature, showcasing the current state-of-the-art in noninvasive hemoglobin measurement. Section 3 describes the methodology, providing a comprehensive explanation of our proposed approach. Section 4 describes the experimental setup, including details on the dataset. In Section 5, we present and discuss the results, evaluating the performance and implications of our findings. Finally, Section 6 concludes the paper, summarizing the key contributions and future research.
Several efforts have been made to develop noninvasive methods for hemoglobin measurement, achieving varying degrees of success. These approaches range from traditional machine learning techniques, which rely on manual feature extraction from PPG signals, to more advanced deep learning models. Table 1 shows World Health Organization (WHO) rules to classify the stage of Anemia based on hemoglobin level measurement.

Kavsaoglu et al. [13] proposed a noninvasive method to estimate hemoglobin levels using PPG signal characteristics and machine learning algorithms. They demonstrated that combining PPG signal analysis with machine learning techniques could provide reliable estimates of hemoglobin levels without the need for invasive blood sampling. Vladislav et al. [14] investigated noninvasive hemoglobin concentration measurements using multi-wavelength PPG in wrist-wearable devices. They applied multi-wavelength PPG in reflectance mode, typical of consumer wrist-wearable devices, to estimate total hemoglobin concentration, highlighting the potential of wearable technology in noninvasive hemoglobin estimation. Wang et al. [15] introduced a smartphone-based application called HemaApp, which utilized the Nexus-5p smartphone camera combined with multiple lighting sources, including infrared LEDs to predict hemoglobin concentration. They reported a correlation coefficient (R) ranging between 0.69 and 0.82, although the performance was limited for hemoglobin levels below 8 g/dL. Hasan et al. [16] developed SmartHeLP application for estimating hemoglobin levels using artificial neural networks (ANN) to analyze features extracted from fingertip videos. Their approach achieved a high correlation (
Edward et al. [19] improved upon the HemaApp by enhancing the hardware configuration to better amplify the weaker signals of the blue and green channels, which allowed them to estimate hemoglobin levels without the need for infrared LEDs. This iteration achieved a Pearson correlation of 0.62, highlighting the continued challenges in noninvasive hemoglobin measurement. Humera et al. [20] employed the ResNet-18 architecture to analyze PPG signals of 150 anemic patients for hemoglobin level measurement. This study underscores the potential of deep learning models in processing PPG data for noninvasive hemoglobin level assessment. Lakshmi et al. [21] focused on pregnant womens hemoglobin level measurement using machine learning techniques by analyzing PPG signals. Their study involved collecting data from 127 participants and extracting features such as the first and second derivatives of the PPG signal. They employed linear regression models to estimate hemoglobin levels. Silva et al. [22] employed a deep-learning approach to estimate hemoglobin levels from PPG signals obtained through smartphone-based recordings. They utilized a ResNet architecture, which is known for its capacity to handle complex patterns in image data, to analyze the stacked frames from fingertip videos. Their model outperformed traditional machine learning methods, achieving a lower RMSE and demonstrating the robustness of deep learning in processing PPG signals. Pinto et al. [23] developed an embedded system for noninvasive hemoglobin measurement using PPG. Their device employs a finger probe with LEDs at wavelengths of 670, 770, 810, 850, and 950 nm, alongside a silicon photodetector. The system demonstrated improved accuracy in hemoglobin estimation, reducing the mean absolute error from 1.3778 to 0.9422 g/dL when utilizing five wavelengths. Chen et al. [24] introduced a real-time noninvasive hemoglobin prediction method using deep learning-enabled smartphone imaging. Their approach involves capturing eye images with a smartphone application and analyzing them using a deep neural network trained on invasive blood test data. The EGE (Efficient Group Enhanced)-Unet model was utilized for eyelid segmentation, while the DHA (C3AE) model predicted hemoglobin levels, demonstrating the feasibility of smartphone-based hemoglobin estimation. In another study, Taslim et al. [25] proposed a Convolutional Neural Network (CNN) to process PPG signals captured from fingertip videos. The CNN was designed to automatically extract relevant features from the PPG signal. This method showed a high correlation between the predicted and actual hemoglobin levels, underscoring the effectiveness of deep learning models in this domain.
These studies collectively emphasize the growing role of deep learning in enhancing the accuracy and reliability of noninvasive hemoglobin level estimation through PPG signals. The ability of deep learning models to automatically learn and extract meaningful features from raw PPG data has opened new avenues for developing portable and accessible health monitoring tools.
We have developed a noninvasive hemoglobin measurement method using PPG and an adaptive lightweight convolutional neural network (HMALCNN). The code of the proposed approach is available at www.github.com/hmlcnn (accessed on 31 August 2025). The HMALCNN is designed to extract local and global features from PPG signals to estimate hemoglobin levels. To evaluate the effectiveness of our method, we conducted assessments using RMSE and correlation analysis, ensuring that the predicted hemoglobin levels were closely aligned with the actual values. The methodology is divided into 4 sub-sections as follows.
3.1 Photoplethysmography (PPG)
PPG is an optical technique used to detect blood volume changes in the microvascular bed of tissue [26]. It is a non-invasive method that has gained significant attention due to its simplicity, cost-effectiveness, and versatility in various medical applications. PPG operates by emitting light into the skin and measuring the amount of light transmitted or reflected by the blood vessels, as shown in Fig. 2. The variations in the light signal correspond to changes in blood volume, which are then recorded as a PPG waveform. The PPG is based on the Beer-Lambert law [27], which describes the attenuation of light as it passes through a medium:
where

Figure 2: Illustration of PPG acquisition modes. LED and PD are placed on the same side in reflective PPG while opposite sides on transmission PPG
The working principle of PPG relies on the interaction between light and biological tissue. When light in the infrared or visible spectrum is directed toward the skin, it penetrates the tissue and encounters various components, including blood vessels. Hemoglobin is a key component in red blood cells that absorbs specific wavelengths of light. When the heart pumps blood, the volume of blood increases in the systole phase, leading to more light absorption and less reflection. Conversely, during the diastole phase, the blood volume decreases and allowing more light to be reflected to the sensor. These cyclical changes produce the PPG waveform, which can be analyzed to extract vital information about cardiovascular health and other physiological parameters.
PPG can be classified into two primary types based on the mode of light detection: transmission mode and reflection mode. In transmission mode, the light source and photodetector are positioned on opposite sides of the tissue, such as a finger or earlobe, allowing light to pass through the tissue. This setup is commonly used in pulse oximeters. Reflection mode places both the light source and photodetector on the same side of the tissue, measuring the light that is reflected from the skin. This mode is more versatile, as it can be applied to various body sites, including the wrist and forehead, making it suitable for wearable devices and continuous monitoring systems. PPG has found widespread application in the medical field, particularly in monitoring cardiovascular parameters such as heart rate, blood oxygen saturation (
PPG signals are commonly acquired using wearable devices placed on peripheral sites such as the finger or wrist. However, even small involuntary movements of the sensor relative to the skin introduce motion-induced artifacts, baseline wander, and high-frequency noise that can obscure the true pulsatile component. It is critical to address these noise issues while preserving the underlying physiological waveform. Assume we have a raw dataset
where L is the total recording duration in seconds (here,
For each subject
where here,
Then, each filtered channel is normalized to zero mean and unit variance:
Finally, the preprocessed dataset
where each
Fig. 3 illustrates the effectiveness of our preprocessing pipeline on multi-wavelength PPG signals. Subfigure (a) shows the raw one-minute recordings at 660, 730, 850, and 940 nm, revealing baseline wander and high-frequency noise caused by motion artifacts. Subfigure (b) displays the 15-s segment extracted after discarding the initial 10 s, followed by Chebyshev Type II band-pass filtering (0.5–8 Hz) and z-score normalization. Furthermore, a beat validity check was applied to ensure that only segments containing at least 15 valid systolic peaks were retained. This step helped eliminate low-quality or irregular waveforms, ensuring that the input to the model preserved consistent and physiologically meaningful cardiac activity.

Figure 3: Preprocessing. Subfigure (a) shows a raw multi-wavelength PPG signal, exhibiting drift and noise. Subfigure (b) shows the corresponding 15 s preprocessed segment with marking
3.3 Adaptive Lightweight Convolutional Neural Network (ALCNN)
Deep learning (DL) is a subset of machine learning (ML) that has revolutionized the field of artificial intelligence (AI) by enabling neural models to learn complex patterns and representations from large datasets [10]. Convolutional neural networks (CNNs) are the most influential DL architectures, which are particularly well-suited for processing grid-like data such as images and time-series signals [11]. CNNs use convolutional layers to automatically extract hierarchical features, ranging from simple edges in early layers to more complex structures in deeper layers, making them highly effective for image recognition, object detection, and time-series analysis tasks. Just like the human brain learns by processing sensory input and adapting based on past experiences, neural networks also learn by processing input data and adjusting their weights through training. Like the human brain, neural networks consist of interconnected layers and neurons that work together to process information and make decisions. Each layer processes different features of the input data, similar to how the brain analyzes sensory information through neurons. As the network trains, it adjusts the connections between neurons, refining its ability to recognize patterns and improve decision-making, much like the brain adapts and learns from experience. In the medical field, CNNs have been widely applied to various diagnostic and monitoring tasks. These include medical image analysis for detecting conditions such as tumors, lesions, and other abnormalities in radiological images, as well as analyzing PPG and other physiological signals [28–30]. CNNs have demonstrated remarkable accuracy and efficiency, surpassing traditional methods in many cases. However, the application of CNNs in medical settings often comes with challenges, particularly related to the large size and computational complexity of the models, which can hinder their deployment in resource-constrained environments such as mobile devices or real-time monitoring systems. One of the main challenges with traditional CNNs is their computational intensity and the large number of parameters, which can make them impractical for use in settings where computational resources are limited.
To address this issue, we proposed an adaptive lightweight convolutional neural network (ALCNN) as shown in Fig. 4. The ALCNN is specifically designed to reduce the computational burden while maintaining high accuracy in the task of noninvasive hemoglobin measurement. The ALCNN is optimized to extract the essential features from PPG signals, enabling accurate hemoglobin estimation without the need for a large and complex network. The proposed ALCNN is a one-dimensional convolutional network specifically designed for hemoglobin prediction from multi-wavelength PPG signals. The network architecture comprises four convolutional blocks, each consisting of a convolutional layer, batch normalization, ReLU activation, and max-pooling, followed by three fully connected layers for regression.
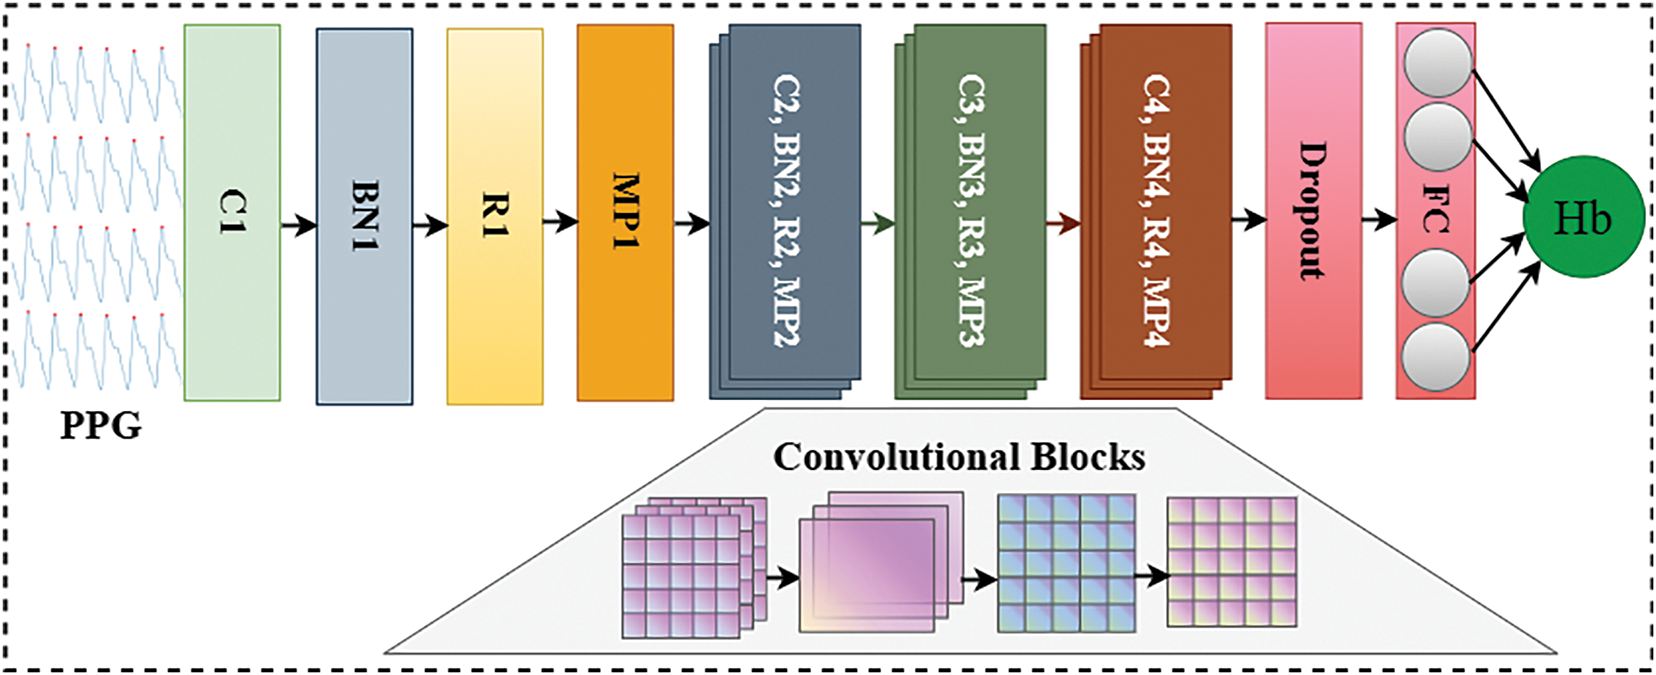
Figure 4: The architecture of adaptive lightweight convolutional neural network (ALCNN)
The first convolutional block transforms the input sequence into 4 feature maps using a kernel size
where
Each output is batch normalized:
followed by the ReLU non-linearity:
Max-pooling with kernel size
The same process is repeated for subsequent convolutional layers with channel sizes: Conv2
The output from the final pooling layer is flattened into a vector of length
Dropout with rate
This is followed by the second fully connected layer:
with another dropout layer, and finally, the regression output layer:
where
The network is trained using the Mean Squared Error (MSE) loss:
Optimization is performed using the Adam optimizer (
The architecture and training hyperparameters of the proposed HMALCNN were optimized through systematic experimentation. We explored dropout rates in the range of 0.1–0.5, convolutional filter configurations from 4, 8, 16, 32 up to 16, 32, 64, 128, kernel sizes of 3 and 5, learning rates of 0.001, 0.0005, and 0.0001, and batch sizes of 8, 16, and 32. Fully connected layers of varying sizes were also evaluated, with the final architecture adopting two dense layers of sizes 100 and 50. The Adam optimizer was employed with a learning rate of 0.0005, paired with a ReduceLROnPlateau scheduler (factor = 0.1, patience = 5) to adaptively reduce the learning rate when the validation loss plateaued. Early stopping with a patience of 10 epochs was applied to prevent overfitting. Validation RMSE was the primary criterion for selection, with Pearson correlation coefficient monitored as a secondary metric. The final configuration includes a dropout rate of 0.3, four convolutional layers with filters 4, 8, 16, 32, and a kernel size of 5.
3.4 Performance Evaluation Metrics
For a robust evaluation of the HMALCNN approach, we employed both numerical and correlation evaluation metrics. Numerical evaluation, particularly Root Mean Squared Error (RMSE), provides a direct measure of the difference between predicted and actual values. RMSE was chosen over Mean Absolute Error (MAE) due to its higher sensitivity to large prediction errors, which is critical in clinical applications. Unlike MAE, RMSE penalizes larger deviations more severely, making it a more appropriate metric where under or overestimation of hemoglobin can have significant clinical implications. For instance, an inaccurate estimation in the lower or higher hemoglobin range could lead to misdiagnosis of anemia or polycythemia, respectively. In parallel, we adopted Pearson correlation analysis to evaluate the strength of the linear relationship between predicted and actual hemoglobin values. This metric not only reflects how well the model captures inter-subject variability but also validates the model’s ability to track physiological trends. Unlike confidence intervals, which primarily quantify uncertainty around a central estimate, Pearson correlation offers an interpretable and standardized measure of predictive alignment. Confidence intervals are more suitable for inferential statistics rather than for evaluating regression-based predictive performance, and they often depend on assumptions that may not hold in heterogeneous or limited datasets. Therefore, RMSE and Pearson correlation together provide a rigorous and clinically relevant framework to assess the performance of the proposed model in both numerical accuracy and physiological consistency. RMSE can be defined as:
where N is the number of samples,
Correlation analysis was conducted to evaluate the strength and direction of the linear relationship between the predicted (
where N is the number of samples,
In this study, we employed two multi-regional multi-wavelength datasets. The dataset-A is comprised of PPG signals and corresponding hemoglobin values that are collected from a total of 68 subjects, ranging in age from 18 to 65 years, at the Primary Health Center in Jatiuwung, Tangerang City, Banten, Indonesia [32]. Each subject’s PPG signal was measured using a MAX30102 module sensor, which emitted two types of light: red light with a wavelength of 660 nm and infrared light with a wavelength of 880 nm. The sensor recorded the intensity of light absorbed by the subject’s finger, with the resulting data stored in arbitrary units (a.u.). The dataset includes 816 data points, with each subject contributing 12 sets of red and infrared light signals. In addition to the PPG signals, the dataset also includes demographic information such as gender and age, as well as the hemoglobin concentration measured in grams per deciliter (g/dL). The hemoglobin values were obtained using a Nesco Multicheck hemoglobin meter, which required a small blood sample from each subject. The Dataset-B comprised 152 healthy volunteers (aged 21–88 years, male:female

Figure 5: Illustration of multi-regional data acquisition. Block (A) presents the multi-regional subjects; Block (B) shows the subject arrival and demographic data recording; Block (C) represents the finger PPG and Hemoglobin acquisition in both datasets with different PPG setups; Block (D) shows the dataset curation and storage
All experiments in this study were conducted using Python 3.9.7 and the PyTorch framework. PyTorch is a widely used open-source deep learning library known for its flexibility and dynamic computational graph, which makes it ideal for developing and experimenting with neural network models [34]. Its support for GPU acceleration further enhances the efficiency of model training, particularly for large datasets and complex models. The experiments were run on a system equipped with an NVIDIA RTX 4060 GPU with 32 GB of RAM. This setup provided the necessary computational power to handle the intensive tasks involved in training deep learning models, including large-scale matrix operations and backpropagation.
To ensure rigorous validation of the model, we initially performed model development using Dataset-B, where the data was split into 70% for training, 10% for validation, and 20% for testing. This phase was used to optimize hyperparameters, including learning rate, dropout rate, batch size, and optimizer parameters. Dataset-B contains four-channel PPG inputs at wavelengths of 660, 730, 850, and 940 nm, allowing the model to learn comprehensive multi-wavelength feature representations. Once the optimal hyperparameters were determined, the same architecture was applied to Dataset-A, which consists of two-channel PPG signals (660 and 880 nm), while keeping all other architectural and training settings consistent for fairness in evaluation. For the final performance assessment, we employed subject-independent group-based 5-fold cross-validation with random splitting for both datasets. Cross-validation is a robust statistical method used to assess the performance of a model by dividing the dataset into multiple subsets (folds) [35]. In each round of cross-validation, one group of subjects is used exclusively for testing, while the remaining groups are used for training the model in a subject-independent manner. This process is repeated until each group has been used for testing exactly once. The results from all folds are then averaged to produce a single performance metric. The use of this protocol ensures that PPG signals from the same subject are never present in both the training and testing sets, effectively preventing information leakage and yielding a more reliable estimate of generalization ability.
Initially, we conducted a detailed statistical analysis to explore the gender specific distributions in both datasets. Fig. 6 shows the gender-based distribution of hemoglobin concentration and age variability. We used density plots to illustrate the distribution of hemoglobin levels separately for males and females. In Fig. 6a, the

Figure 6: Gender-based distribution of hemoglobin and age in both datasets
Fig. 7 illustrates the training and validation loss of the HMALCNN model for both datasets. In Fig. 7a, training (blue line) and validation loss (orange line) decrease rapidly during the initial epochs, indicating that the model is effectively learning and adapting to the features in dataset-A. Around the 10th epoch, the losses converge and stabilize, suggesting that the model has achieved an optimal balance without overfitting. The close alignment of training and validation loss curves after stabilization further indicates robust generalization, as the model performs consistently on both training and validation sets. In Fig. 7b, the HMALCNN model’s training and validation losses for dataset-B exhibit an even more rapid convergence; both curves decline steeply by epoch 5. Then, the losses remain flat and almost indistinguishable, indicating that the network has fully captured the underlying mapping and maintains excellent generalization without overfitting. This early plateau demonstrates that the model attains optimal performance within the first few epochs, reflecting the model’s high representational efficiency on this cohort. This stability highlights the effectiveness of the HMALCNN model in capturing relevant features for hemoglobin level estimation.
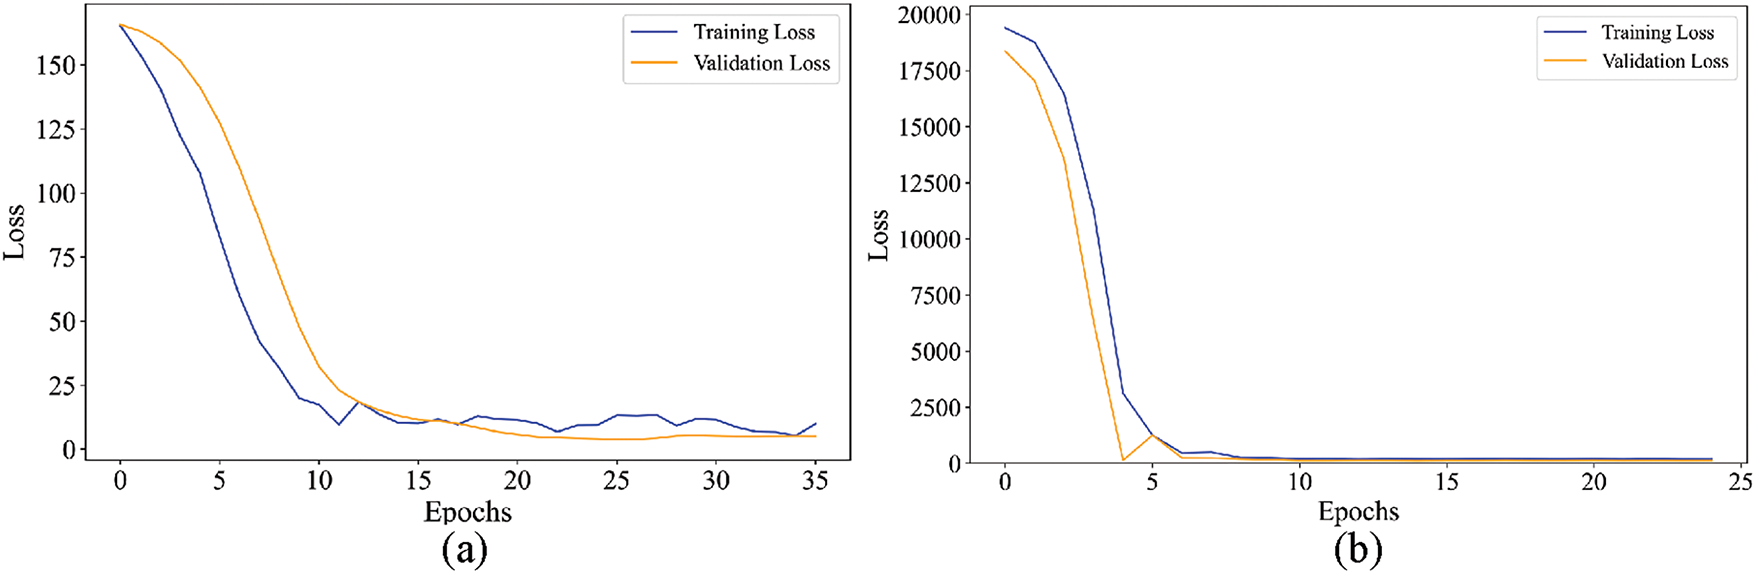
Figure 7: Training and validation loss of HMALCNN over epocs
Moreover, we conducted an extensive evaluation of time complexity, which serves as a crucial metric for assessing the computational efficiency of classification models. In this study, testing time, defined as the duration required by the model to generate predictions on test data, was employed as the primary indicator of efficiency using Kernel density estimation (KDE). The training process was performed manually and was not included in the evaluation. Fig. 8 illustrates that the proposed model demonstrates low time complexity on both datasets. The proposed model achieved an average elapsed time of approximately 0.038 s on Dataset-A and 0.058 s on Dataset-B, which indicates that the proposed model is computationally efficient across different datasets, making it suitable for clinical applications where timely and accurate early diagnosis is essential.

Figure 8: Kernel density estimation (KDE) of testing time distribution for the proposed model on Dataset-A and Dataset-B
To assess the generalizability of HMALCNN, we performed group-based, subject-independent 5-fold cross-validation on both datasets. Dataset-A (68 subjects) was partitioned into five non-overlapping groups of 13–14 subjects, and Dataset-B (152 subjects) into five groups of 30–31 subjects. In each fold, exactly one group served as the test set, and the remaining groups provided the training data. Every subject appears exactly once in a test fold and is completely excluded from the corresponding training sets, ensuring true subject-independent validation and promoting better model generalization. Table 2 presents the per-fold RMSE and Pearson correlation for both datasets. On Dataset-A, the average RMSE was 1.20 g/dL with an average correlation of 72%. Fold 5 achieved the lowest RMSE of 1.14 g/dL, and Fold 1 the highest correlation 74%. On Dataset-B, the average RMSE was 0.90 g/dL and the average correlation was 82%. The lowest RMSE of 0.85 g/dL was achieved in Fold 3, while the highest correlation of 87% was observed in Fold 2. A Wilcoxon signed-rank test was conducted to evaluate the statistical significance of performance variations across the 5 folds. For both Dataset-A and Dataset-B,
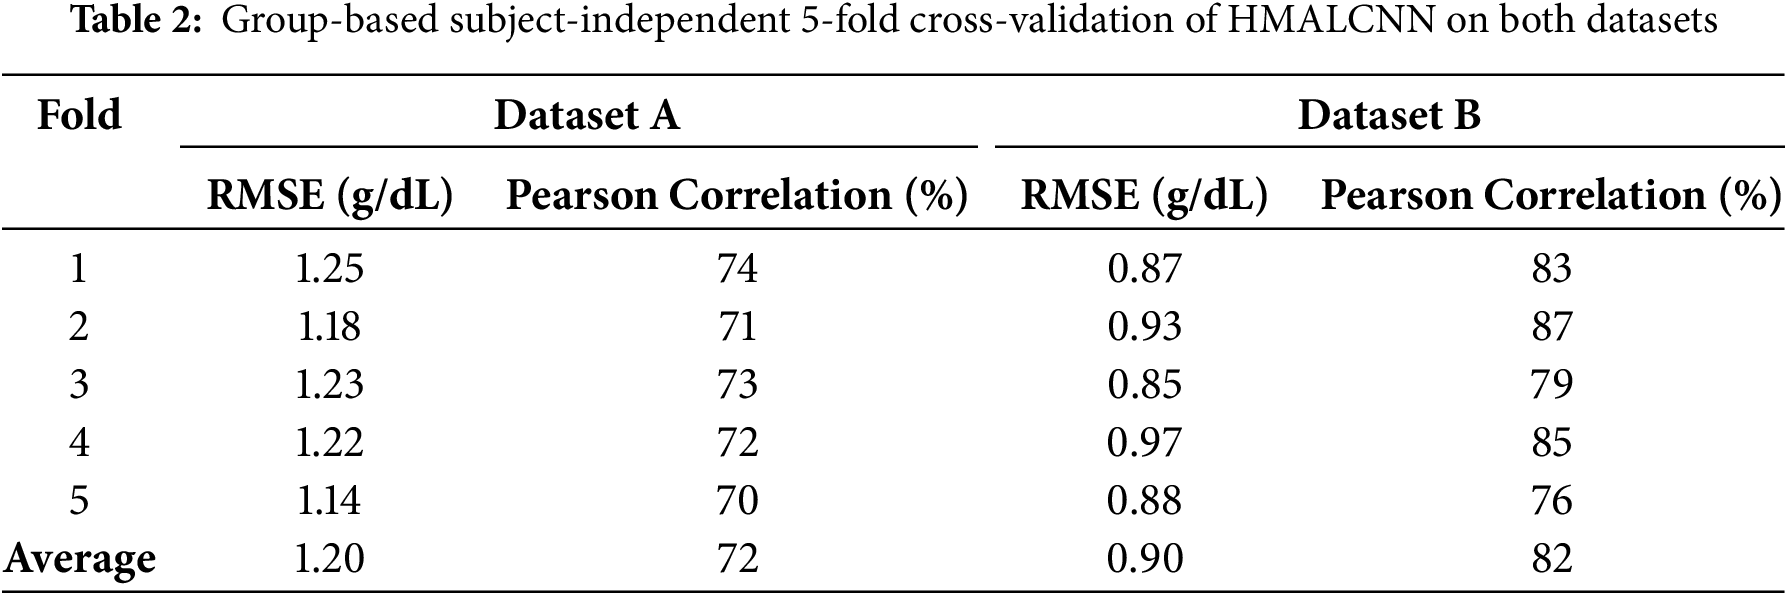
Fig. 9 illustrates results in terms of a bar plot for Dataset-A and Bland–Altman analysis for Dataset-B. The Fig. 9a illustrates the comparison between actual and predicted hemoglobin levels (in g/dL) for a random fold using the HMALCNN approach. The

Figure 9: Bar plot of hemoglobin level predictions by HMALCNN approach
To further assess the clinical reliability of our model, we conducted a hemoglobin range-wise error analysis by stratifying test predictions into three clinical categories: low (<12 g/dL), normal (12–16 g/dL), and high (>16 g/dL). The proposed HMALCNN achieved lower RMSE and higher correlation in the normal range—0.65 g/dL (
To enhance the interpretability of the proposed HMALCNN model, we applied Gradient-weighted Class Activation Mapping (Grad-CAM) to the final convolutional layer. Grad-CAM computes the gradient of the prediction score for feature maps, producing a localization map that highlights the most influential temporal regions in the input PPG signal as shown in Fig. 10. The resulting attention map, overlaid on the normalized PPG waveform, revealed that the model predominantly attends to the systolic peaks, dicrotic notches, and steep rising and falling slopes, physiologically significant regions that correlate with optical absorption properties of hemoglobin. In contrast, low-attention areas correspond to baseline segments or motion-distorted intervals, indicating effective suppression of non-informative patterns. These results confirm that the network learns to focus on clinically relevant features, supporting its potential reliability in real-world, noninvasive hemoglobin monitoring.
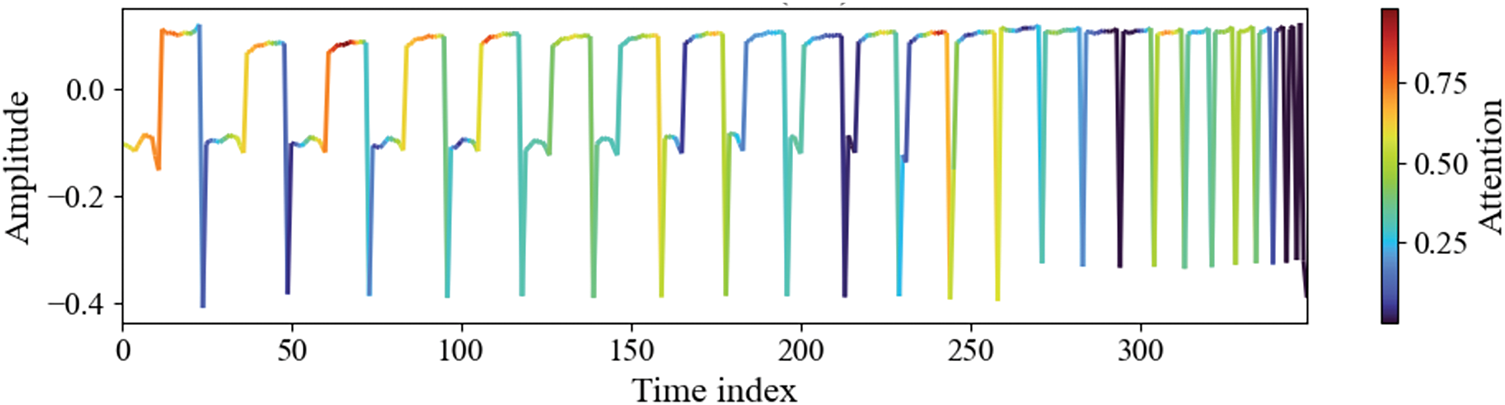
Figure 10: Grad-CAM visualization of the proposed method on dataset-A. Color intensity denotes the level of network attention, with red indicating high relevance and blue indicating low relevance. The model exhibits strong focus on systolic peaks, dicrotic notches, and steep waveform slopes, which are physiologically linked to hemoglobin concentration
The proposed approach showed competitive results and outperformed existing methods in terms of RMSE and Pearson Correlation coefficient analysis as shown in Table 3. We used RMSE instead of the MSE metric for hemoglobin measurement because it penalizes larger errors more severely. Incorrect predictions of higher hemoglobin levels can lead to severe consequences. Furthermore, we compared the results of subject-independent 5-fold cross-validation on the entire dataset instead of the traditional train/test split comparison. The comparative studies explored a wide range of hand-crafted PPG features and demographic covariates using classical machine-learning methods, including SVM, stacking regressor, XGBoost, and linear regression [15,18,21,36,37]. Only reference [15] applied leave-one-subject-out (LOSO) validation; the remaining works relied on conventional train/test splits without subject-independent cross-validation. Similarly, end-to-end deep learners, including ResNet-18, ResNet-101, MobileNet, and CNN have been compared [14,20,38,39], yet all used simple hold-out testing. In contrast, our HMALCNN is assessed via group-based, subject-independent 5-fold cross-validation, ensuring each subject appears only in one test fold. Performance for each dataset is reported independently in Table 3 to ensure a fair and unbiased comparison.

PPG is a noninvasive optical technique widely employed for measuring blood volume variations associated with cardiac activity. As the heart pumps blood through the circulatory system, variations in blood volume occur with each heartbeat. These changes in blood volume within the capillaries can be analyzed using PPG. The changes in light absorption or reflection caused by these blood volume changes lead to digital biomarker investigation correlated with human health. The widespread adoption of PPG in wearable devices has proven valuable in various biomedical applications, including monitoring blood pressure, blood glucose levels, sleep patterns, stress, and other physiological health indicators. One of the most critical components in the human body is hemoglobin, which plays a pivotal role in oxygen transportation. Hemoglobin carries oxygen from the lungs to tissues and organs, and its ability to bind with oxygen is essential for maintaining normal body function. Regular measurement of hemoglobin levels is vital, as abnormal levels can indicate serious health conditions like anemia. Traditional hemoglobin measurement methods are invasive requiring painful blood samples. Further, hemoglobin measurement is challenging in underserved populations and developing countries.
To address these challenges, PPG-based analysis offers a non-invasive alternative for hemoglobin measurement. With recent advancements in machine learning and deep learning, the ability to analyze PPG signals has significantly improved, enabling more accurate detection of biomarkers. While current machine learning methods typically require substantial human intervention for feature engineering, they often fail to capture the full spectrum of features within the signal. On the other hand, deep learning models are highly effective in extracting complex features but are computationally intensive and require significant resources. In this study, we proposed an end-to-end adaptive lightweight convolutional neural network to efficiently extract both local and global features from blood volumetric signals, which are closely associated with variations in hemoglobin levels. CNNs have demonstrated great promise in medical signal processing and bioinformatics due to their ability to learn hierarchical features from raw data.
To evaluate our proposed approach, we used two multi-regional multi-wavelength datasets having 152 and 68 subjects. Further, we employed a group-based five-fold cross-validation technique to prevent overfitting. Cross-validation provides a robust assessment by ensuring that the model is trained and tested on different subsets of data, ultimately improving generalization and reliability. In addition to standard cross-validation, we implemented subject-independent testing within each fold. This approach further enhances generalizability by ensuring that the model performs well on unseen individuals, making it more suitable for real-world applications. Performance assessment was carried out using the RMSE, which is a well-suited metric for regression tasks like hemoglobin estimation. RMSE penalizes larger errors more heavily, providing a clear indication of model accuracy and highlighting areas where improvements are needed. To complement RMSE, we calculated correlation coefficients between predicted and actual hemoglobin values, verifying that the model’s predictions align positively with true measurements. The proposed approach exhibits competitive performance, achieving an RMSE of 1.20 g/dL and a strong correlation coefficient of 0.72 on Dataset-A and an RMSE of 0.90 g/dL and a correlation coefficient of 0.82 in Dataset-B. These results surpass the performance of state-of-the-art methods, demonstrating the effectiveness of the proposed approach. Real-world deployment requires a clinically usable system that must deliver results quickly and operate reliably on lightweight hardware. The proposed model achieved an average inference time of roughly 0.038 s on Dataset-A and 0.058 s on Dataset-B, demonstrating computational efficiency suitable for both wearable sensors and clinical workstations. Such sub-tenth-second latency ensures that hemoglobin estimates can be delivered in near-real time, meeting the responsiveness needed for continuous monitoring in wearables and rapid decision support in point-of-care environments.
The proposed ALCNN framework offers several advantages. First, its lightweight design enables efficient processing of multi-wavelength PPG signals on wearable devices with limited computational resources. Second, the architecture is adaptable, functioning effectively with both dual-wavelength and four-wavelength inputs without major retraining, thus ensuring applicability across different sensor configurations. Third, the use of multi-regional datasets and subject-independent cross-validation enhances the model’s generalization to diverse populations. Moreover, the combination of spectral and temporal features improves robustness to sensor noise and physiological variability. Despite the promising performance of the proposed approach, there are a few limitations that need to be addressed in future research. The current study relied on controlled conditions with a limited clinical trial and device regulatory concerns. The datasets used in this study did not include annotations related to confounding factors such as skin tone, fingertip temperature, or blood perfusion variability. As a result, these aspects were not analyzed. Future work will focus on data acquisition in free-living environments to confirm robustness during everyday activity with formal clinical validation. Subsequently, the inclusion of metadata to investigate the model’s performance across diverse physiological and demographic conditions. Furthermore, consideration for implementing the clinically validated model on wearable devices for subsequent regulatory approvals.
In this study, we presented an adaptive lightweight convolutional neural network (HMALCNN) for noninvasive hemoglobin measurement using PPG. The proposed method effectively integrates local morphological features and global contextual patterns, enabling accurate estimation of hemoglobin levels across diverse acquisition settings. Extensive evaluation was performed on two multi-regional datasets using group-based, subject-independent 5-fold cross-validation to ensure robust and unbiased performance assessment. The HMALCNN achieved RMSEs of 1.20 and 0.90 g/dL, with Pearson correlation coefficients of 0.72 and 0.82 for the respective datasets. Additional analyses, including clinical range-wise evaluation,
Acknowledgement: The researchers would like to thank the Deanship of Graduate Studies and Scientific Research at Qassim University for financial support (QU-APC-2025).
Funding Statement: This project is funded by the Deanship of Graduate Studies and Scientific Research at Qassim University for financial support (QU-APC-2025).
Author Contributions: Conceptualization: Florentin Smarandache, Saleh I. Alzahrani, and Mubashir Ali; methodology: Florentin Smarandache, Saleh I. Alzahrani, Sulaiman Al Amro, and Mubashir Ali; software: Florentin Smarandache and Mubashir Ali; validation: Saleh I. Alzahrani, Sulaiman Al Amro, and Ijaz Ahmad; formal analysis: Florentin Smarandache, Sulaiman Al Amro, and Ijaz Ahmad; investigation: Sulaiman Al Amro and Ijaz Ahmad; resources: Mubashir Ali; writing—original draft preparation: Florentin Smarandache, Saleh I. Alzahrani, and Sulaiman Al Amro; writing—review and editing: Ijaz Ahmad and Mubashir Ali; visualization: Florentin Smarandache and Mubashir Ali; project administration: Florentin Smarandache and Mubashir Ali. All authors reviewed the results and approved the final version of the manuscript.
Availability of Data and Materials: Datasets: https://doi.org/10.1016/j.dib.2023.109823; https://doi.org/10.6084/m9.figshare.22256143.v1; Code: https://github.com/drmubashirali/HMLCNN (accessed on 31 August 2025).
Ethics Approval: Not applicable.
Conflicts of Interest: The authors declare no conflicts of interest to report regarding the present study.
Abbreviations
| PPG | Photoplethysmography |
| CNN | Convolutional Neural Network |
| ALCNN | Adaptive Lightweight Convolutional Neural Network |
| HM | Hemoglobin Measurement |
| HMALCNN | Hemoglobin Estimation Method Using Adaptive Lightweight Convolutional Neural Network |
| g/dL | Grams Per Deciliter |
| g/L | Grams Per Liter |
| RMSE | Root Mean Square Error |
| CV | Cross-Validation |
References
1. Hanna RM, Streja E, Kalantar-Zadeh K. Burden of anemia in chronic kidney disease: beyond erythropoietin. Adv Therapy. 2021;38(1):52–75. doi:10.1007/s12325-020-01524-6. [Google Scholar] [PubMed] [CrossRef]
2. Brittenham GM, Moir-Meyer G, Abuga KM, Datta-Mitra A, Cerami C, Green R, et al. Biology of anemia: a public health perspective. J Nutrition. 2023;153(10270):S7–28. doi:10.1016/j.tjnut.2023.07.018. [Google Scholar] [PubMed] [CrossRef]
3. Farook MAA, Rukmanidevi S, Shanker N. Haemoglobin measurement from eye anterior ciliary arteries through borescope camera. Comput Syst Sci Eng. 2023;44(2):1763–74. doi:10.32604/csse.2023.026260. [Google Scholar] [CrossRef]
4. Yang X, Li H, Zhang J, Yang X, Che Q, Cai Z, et al. Hemoglobin is associated with hypertension-mediated cardiovascular damages in hypertensive patients with high-altitude polycythemia. Int Emerg Med. 2025;20(2):403–11. doi:10.1007/s11739-024-03800-7. [Google Scholar] [PubMed] [CrossRef]
5. Webb KL, Dominelli PB, Baker SE, Klassen SA, Joyner MJ, Senefeld JW, et al. Influence of high hemoglobin-oxygen affinity on humans during hypoxia. Front Physiol. 2022;12:763933. doi:10.3389/fphys.2021.763933. [Google Scholar] [PubMed] [CrossRef]
6. Shafique F, Ali S, Almansouri T, Van Eeden F, Shafi N, Khalid M, et al. Thalassemia, a human blood disorder. Braz J Biol. 2021;83:e246062. doi:10.1590/1519-6984.246062. [Google Scholar] [PubMed] [CrossRef]
7. Whitehead RDJr, Mei Z, Mapango C, Jefferds MED. Methods and analyzers for hemoglobin measurement in clinical laboratories and field settings. Ann New York Acad Sci. 2019;1450(1):147–71. doi:10.1111/nyas.14124. [Google Scholar] [PubMed] [CrossRef]
8. Ajmal A, Shankarnath S, Athif M. Development of the relationship between hemoglobin concentration and PPG signal characteristics. In: 2019 14th Conference on Industrial and Information Systems (ICIIS); 2019 Dec 18–20; Kandy, Sri Lanka: IEEE. p. 58–62. [Google Scholar]
9. Ray D, Collins T, Woolley SI, Ponnapalli PV. A review of wearable multi-wavelength photoplethysmography. IEEE Rev Biomed Eng. 2021;16:136–51. doi:10.1109/rbme.2021.3121476. [Google Scholar] [PubMed] [CrossRef]
10. Al-Zoghby AM, Ismail Ebada A, Saleh AS, Abdelhay M, Awad WA. A comprehensive review of multimodal deep learning for enhanced medical diagnostics. Comput Mater Contin. 2025;84(3):4155–93. doi:10.32604/cmc.2025.065571. [Google Scholar] [CrossRef]
11. Li Z, Liu F, Yang W, Peng S, Zhou J. A survey of convolutional neural networks: analysis, applications, and prospects. IEEE Transact Neu Net Learn Syst. 2021;33(12):6999–7019. doi:10.1109/tnnls.2021.3084827. [Google Scholar] [PubMed] [CrossRef]
12. Yen CT, Liao CH. Blood pressure and heart rate measurements using photoplethysmography with modified LRCN. Comput Mat Cont. 2022;71(1):1973–86. doi:10.32604/cmc.2022.022679. [Google Scholar] [CrossRef]
13. Kavsaoğlu AR, Polat K, Hariharan M. Non-invasive prediction of hemoglobin level using machine learning techniques with the PPG signal’s characteristics features. Appl Soft Comput. 2015;37(4):983–91. doi:10.1016/j.asoc.2015.04.008. [Google Scholar] [CrossRef]
14. Lychagov VV, Semenov VM, Volkova EK, Chernakov DI, Ahn J, Kim JY. Noninvasive hemoglobin measurements with photoplethysmography in wrist. IEEE Access. 2023;11:79636–47. doi:10.1109/access.2023.3300293. [Google Scholar] [CrossRef]
15. Wang EJ, Li W, Hawkins D, Gernsheimer T, Norby-Slycord C, Patel SN. HemaApp: noninvasive blood screening of hemoglobin using smartphone cameras. In: Proceedings of the 2016 ACM International Joint Conference on Pervasive and Ubiquitous Computing. UbiComp ’16; 2016 Sep 12–16; Heidelberg, Germany. New York, NY, USA: Association for Computing Machinery. p. 593–604. [Google Scholar]
16. Hasan MK, Haque MM, Adib R, Tumpa JF, Begum A, Love RM, et al. SmartHeLP: smartphone-based hemoglobin level prediction using an artificial neural network. In: AMIA Annual Symposium Proceedings; 2018 Nov 3–7; San Francisco, CA, USA: American MedicalInformatics Association. [Google Scholar]
17. Zhu J, Sun R, Liu H, Wang T, Cai L, Chen Z, et al. A non-invasive hemoglobin detection device based on multispectral photoplethysmography. Biosensors. 2023;14(1):22. doi:10.3390/bios14010022. [Google Scholar] [PubMed] [CrossRef]
18. Acharya S, Swaminathan D, Das S, Kansara K, Chakraborty S, Kumar RD, et al. Non-invasive estimation of hemoglobin using a multi-model stacking regressor. IEEE J Biomed Health Inform. 2020;24(6):1717–26. doi:10.1109/jbhi.2020.3004803. [Google Scholar] [CrossRef]
19. Wang EJ, Li W, Zhu J, Rana R, Patel SN. Noninvasive hemoglobin measurement using unmodified smartphone camera and white flash. In: 2017 39th Annual International Conference of the IEEE Engineering in Medicine and Biology Society (EMBC); 2017 Jul 11–15; Jeju, Republic of Korea. p. 2333–6. [Google Scholar]
20. Sabir H, Khan KU, Ishaq O, Alazeb A, Aljuaid H, Algarni A, et al. Fingertip video dataset for non-invasive diagnosis of anemia using ResNet-18 classifier. IEEE Access. 2024;12:68880–92. doi:10.1109/access.2024.3398353. [Google Scholar] [CrossRef]
21. Lakshmi M, Manimegalai P, Bhavani S. Non-invasive haemoglobin measurement among pregnant women using photoplethysmography and machine learning. J Phy Conf Ser. 2020;1432(1):012089. doi:10.1088/1742-6596/1432/1/012089. [Google Scholar] [CrossRef]
22. Silva DF, De MJG, Domingues LV, Mazzu-Nascimento T. Hemoglobin estimation from smartphone-based photoplethysmography with small data. In: 2023 IEEE 36th International Symposium on Computer-Based Medical Systems (CBMS); 2023 Jun 22–24; L’Aquila, Italy. p. 75–8. [Google Scholar]
23. Pinto C, Parab J, Naik G. Non-invasive hemoglobin measurement using embedded platform. Sens Biosensing Res. 2020;29(8):100370. doi:10.1016/j.sbsr.2020.100370. [Google Scholar] [CrossRef]
24. Chen Y, Hu X, Zhu Y, Liu X, Yi B. Real-time non-invasive hemoglobin prediction using deep learning-enabled smartphone imaging. BMC Med Inform Decis Mak. 2024;24(1):187. doi:10.1186/s12911-024-02585-1. [Google Scholar] [PubMed] [CrossRef]
25. Taslim Uddin Raju SM, Hashem MMA. DNN based blood glucose level estimation using PPG characteristic features of smartphone videos. In: 2022 25th International Conference on Computer and Information Technology (ICCIT); 2022 Dec 17–19; Cox’s Bazar, Bangladesh. p. 13–8. [Google Scholar]
26. Kyriacou PA, Chatterjee S. The origin of photoplethysmography. In: Photoplethysmography. Cambridge, MA, USA: Academic Press; 2022. p. 17–43. doi:10.1016/b978-0-12-823374-0.00004-9. [Google Scholar] [CrossRef]
27. Kocsis L, Herman P, Eke A. The modified Beer-Lambert law revisited. Phy Medi Biol. 2006;51(5):N91. [Google Scholar] [PubMed]
28. Anwar SM, Majid M, Qayyum A, Awais M, Alnowami M, Khan MK. Medical image analysis using convolutional neural networks: a review. J Med Syst. 2018;42(11):1–13. doi:10.1007/s10916-018-1088-1. [Google Scholar] [PubMed] [CrossRef]
29. Nie G, Zhu J, Tang G, Zhang D, Geng S, Zhao Q, et al. A review of deep learning methods for photoplethysmography data. arXiv:2401.12783. 2024. [Google Scholar]
30. Sufian A, Ghosh A, Sadiq AS, Smarandache F. A survey on deep transfer learning to edge computing for mitigating the COVID-19 pandemic. J Syst Archit. 2020;108(4):101830. doi:10.1016/j.sysarc.2020.101830. [Google Scholar] [CrossRef]
31. Cohen I, Huang Y, Chen J. Pearson correlation coefficient. Noise Reduct Speech Process. 2009:1–4. [Google Scholar]
32. Abuzairi T, Vinia E, Yudhistira MA, Rizkinia M, Eriska W. A dataset of hemoglobin blood value and photoplethysmography signal for machine learning-based non-invasive hemoglobin measurement. Data Brief. 2024;52(6):109823. doi:10.1016/j.dib.2023.109823. [Google Scholar] [PubMed] [CrossRef]
33. Liang Y. Non-invasive hemoglobin detection based on four-wavelength PPG signal [Data set]. Figshare; 2023 [cited 2025 Jul 31]. Available from: https://figshare.com/articles/dataset/Hemoglobin_detection_based_on_four-wavelength_PPG_signal_zip/22256143. [Google Scholar]
34. Paszke A, Gross S, Massa F, Lerer A, Bradbury J, Chanan G, et al. Pytorch: an imperative style, high-performance deep learning library. Adv Neural Inf Process Syst. 2019;32. [Google Scholar]
35. Wong TT. Performance evaluation of classification algorithms by k-fold and leave-one-out cross validation. Pattern Recognit. 2015;48(9):2839–46. doi:10.1016/j.patcog.2015.03.009. [Google Scholar] [CrossRef]
36. Kumar RD, Guruprasad S, Kansara K, Rao KR, Mohan M, Reddy MR, et al. A novel noninvasive hemoglobin sensing device for anemia screening. IEEE Sens J. 2021;21(13):15318–29. doi:10.1109/jsen.2021.3070971. [Google Scholar] [CrossRef]
37. Chen Z, Qin H, Ge W, Li S, Liang Y. Research on a non-invasive hemoglobin measurement system based on four-wavelength photoplethysmography. Electronics. 2023;12(6):1346. doi:10.3390/electronics12061346. [Google Scholar] [CrossRef]
38. Lychagov V, Semenov V, Volkova E, Chernakov D, Ahn J, Kim JY. Non-invasive hemoglobin concentration measurements with multi-wavelength reflectance mode PPG sensor and CNN data processing. In: 2023 45th Annual International Conference of the IEEE Engineering in Medicine & Biology Society (EMBC); 2023 Jul 24– 27; Sydney, Australia. p. 1–4. [Google Scholar]
39. Xu L, Chen Y, Lu S, Zhong K, Li Y, Yi B. A self-supervised causal feature reinforcement learning method for non-invasive hemoglobin prediction. IET Image Process. 2024;18(1):22–33. doi:10.1049/ipr2.12930. [Google Scholar] [CrossRef]
Cite This Article
 Copyright © 2025 The Author(s). Published by Tech Science Press.
This work is licensed under a Creative Commons Attribution 4.0 International License , which permits unrestricted use, distribution, and reproduction in any medium, provided the original work is properly cited.
 Downloads
 Citation Tools