
 Submit a Paper
 Propose a Special lssue
 Open Access
ARTICLE

SGO-DRE: A Squid Game Optimization-Based Ensemble Method for Accurate and Interpretable Skin Disease Diagnosis
1 Department of Science in Engineering Management, Trine University, Detroit, MI 48101-3636, USA
2 Department of Biomedical Engineering, Sir Syed University of Engineering and Technology (SSUET), Karachi, 75300, Pakistan
3 School of Mathematics and Statistics, Guizhou University, Guiyang, 550025, China
4 State Key Laboratory of Public Big Data, College of Computer Science and Technology, Institute for Artificial Intelligence, Guizhou University, Guiyang, 550025, China
5 EIAS Data Science Lab, College of Computer and Information Sciences, Prince Sultan University, Riyadh, 11586, Saudi Arabia
6 School of Electronic Information, Central South University, Changsha, 410083, China
7 Department of Information Technology, College of Computer and Information Sciences, Princess Nourah bint Abdulrahman University, P.O. Box 84428, Riyadh, 11671, Saudi Arabia
* Corresponding Authors: Areeba Masood Siddiqui. Email: ; Muhammad Asim. Email:
Computer Modeling in Engineering & Sciences 2025, 144(3), 3135-3168. https://doi.org/10.32604/cmes.2025.069926
Received 03 July 2025; Accepted 11 August 2025; Issue published 30 September 2025
 View Full Text
 Download PDF
Abstract
Timely and accurate diagnosis of skin diseases is crucial as conventional methods are time-consuming and prone to errors. Traditional trial-and-error approaches often aggregate multiple models without optimization by resulting in suboptimal performance. To address these challenges, we propose a novel Squid Game Optimization-Dimension Reduction-based Ensemble (SGO-DRE) method for the precise diagnosis of skin diseases. Our approach begins by selecting pre-trained models named MobileNetV1, DenseNet201, and Xception for robust feature extraction. These models are enhanced with dimension reduction blocks to improve efficiency. To tackle the aggregation problem of various models, we leverage the Squid Game Optimization (SGO) algorithm, which iteratively searches for the optimal weightage set to assign the appropriate weightage to each individual model within the proposed weighted average aggregation ensemble approach. The proposed ensemble method effectively utilizes the strengths of each model. We evaluated the proposed method using an 8-class skin disease dataset, a 6-class MSLD dataset, and a 4-class MSID dataset, achieving accuracies of 98.71%, 96.34%, and 93.46%, respectively. Additionally, we employed visual tools like Grad-CAM, ROC curves, and Precision-Recall curves to interpret the decision making of models and assess its performance. These evaluations ensure that the proposed method not only provides robust results but also enhances interpretability and reliability in clinical decision-making.Keywords
Cancer is a major health threat and the second leading cause of global mortality. It is marked by the rapid spread of abnormal cells that can invade adjacent tissues and spread to other areas of the body including the lymphatic and circulatory systems [1]. Among the different types of cancer, skin cancer is the most dangerous due to its rapid growth and high mortality rate [2]. Skin cancer symptoms include new growths or changes in existing spots, such as size, shape, color changes, and possible itching or bleeding [3]. The automated diagnosis of skin diseases has emerged as a critical area of research in the medical field due to the increasing demand for accurate and efficient clinical decision-making [4]. Skin diseases are ranging from common conditions such as acne and eczema to severe diseases like melanoma by imposing a significant burden on global healthcare systems across the United States from 1990 to 2017 [5]. Timely and accurate classification of these diseases is crucial for providing appropriate treatment and improving patient outcomes. Traditional diagnostic methods rely on dermoscopic images analyzed by dermatologists and have limitations in terms of accessibility, accuracy, and time, particularly in underserved areas with limited access to dermatological specialists [6,7]. Dermoscopy is a specialized diagnostic technique that enables clinicians to examine skin lesions using advanced magnification by providing enhanced visual insights into surface and subsurface skin characteristics. Manual interpretation of dermoscopy images presents significant challenges by requiring extensive time, expertise to accurately analyze intricate skin details and identifying various skin cancer types can be challenging due to their similar appearances [8]. The complexity of skin lesions makes dermoscopy particularly difficult, as it demands specialized clinical expertise and comprehensive training in identifying subtle skin morphological variations. These challenges underscore the critical need for advanced computational diagnostic approaches in medical imaging that can enhance both the speed and accuracy of skin disease classification. Consequently, there is a growing need for reliable computer-aided diagnostic (CAD) [9] tools capable of addressing these challenges and assisting dermatologists in the efficient diagnosis of skin cancer.
Deep learning (DL) techniques have shown great promise in automating the diagnosis of various types of diseases [10–12]. Convolutional neural networks (CNNs) are a key method within DL that have demonstrated superior performance in the classification of diverse diseases [13,14], especially in skin disease diagnosis [15]. CNNs [16,17] are particularly effective in analyzing medical images and have significantly improved the accuracy of skin disease detection. These advancements have led to improved detection of conditions such as melanoma and other skin cancers by helping earlier and more accurate clinical decision-making.
However, DL models for skin cancer detection presents limitations due to the complexity and variability of skin lesions. Multiscale feature fusion [18] addresses these challenges by combining features from multiple scales. This technique enhances the diagnostic capabilities of models to detect subtle differences in skin tumors [19,20] by leading to more accurate and reliable automated skin cancer detection. Single models often face limitations when applied to the complex and diverse nature of skin cancer detection. These models may struggle to capture the intricate features, and subtle differences present within various skin lesions. Such limitations highlight the need for an ensemble approach [21], where multiple models are combined to leverage the strengths of each individual model. An ensemble approach can reduce the risk of errors inherent in single model approaches by increasing robustness and improving the ability to detect complex patterns across various skin conditions.
However, while ensemble methods address the weaknesses of individual models, they require careful optimization to achieve optimal performance. By combining models without an effective optimizations techniques can result in suboptimal performance [22]. To enhance the ensemble approach, grid search based algorithm [23] and more efficient heuristic algorithms [24–26] provide an effective optimization technique. These methods can fine-tune the contribution of models within the ensemble by ensuring that each model contributes maximally to the final prediction. By employing heuristic techniques, the ensemble model becomes more adaptable for skin cancer diagnosis. In this study, the design of optimized ensemble method combined with multiscale feature fusion and heuristic optimization offers a promising approach to the automated diagnosis of skin diseases. These techniques significantly enhance the accuracy and reliability of skin disease classification by leveraging the strengths of multiple models and improving the ability to capture complex patterns in skin lesions [27,28]. These advancements will ultimately benefit medical practitioners and patients by providing faster, more accurate diagnoses, improving treatment outcomes, and reducing the burden on healthcare systems.
• Selection of Pre-Trained Models with Dimension Reduction: We selected pre-trained models named MobileNetV1, DenseNet201, and Xception for robust feature extraction. These models are further enhanced with dimension reduction blocks to improve computational efficiency while retaining important features for accurate skin disease classification.
• Development of the SGO-DRE Method: We propose a novel Squid Game Optimization-Dimension Reduction-based Ensemble (SGO-DRE) method, which leverages base models and the Squid Game Optimization algorithm to effectively aggregate model predictions. The algorithm optimizes the weightage assignment for each model, ensuring the ensemble performs optimally by maximizing the strengths of individual models.
• Model Performance and Visualization: The proposed method achieves high accuracy across various skin disease datasets by outperforming base models. Additionally, visualization techniques, including Grad-CAM, ROC, and Precision-Recall curves, are used to interpret model predictions, providing transparency and aiding in the clinical validation of the model.
1.2 Organization of the Manuscript
This manuscript is organized as follows: Section 2 will comprise about the relevant literature study on skin disease diagnosis methods. Section 3 describes the methods used, including dataset details and the proposed methodological framework. Section 4 presents experimental outcomes and analysis. Finally, Section 5 concludes the manuscript with key findings and future directions.
In recent years, CNNs have gained substantial attention for their capability to classify images of skin lesions [29,30]. Accurate analysis of skin lesions is critical, as timely and precise identification of skin cancers greatly influences treatment effectiveness and patient recovery. Consequently, the key advantage of CNNs networks lies in their automatic extraction and interpretation of key visual characteristics from medical images by significantly improving diagnostic reliability. Several studies have explored the use of CNNs for classifying skin lesions and improving skin cancer diagnosis. Among them, Aquil et al. [31] applied machine learning methods and DL models to predict skin conditions using the HAM10000 dataset. To mitigate class imbalance, the authors employed Synthetic Minority Oversampling Technique (SMOTE) and advanced resampling techniques, complemented by Principal Component Analysis (PCA) for feature dimensionality reduction. The integrated Random Forest model with DenseNet121 demonstrated superior performance, achieving an optimal accuracy of 98.32%. Shanthi et al. [32] used CNNs to detect four types of skin diseases by using the DermNet database and achieved an accuracy of 98.6%. Bajwa et al. [33] developed a CAD system for skin disease classification using DL models. These models were trained and evaluated on the ISIC dataset and exhibited an average accuracy of 93% for skin disease detection. Rezaee et al. [34] introduced a 2-branch model combining Transformer, self-attention unit, and CNN for diagnosing skin cancer using dermoscopy images. Their model achieved 97.48% accuracy on ISIC-2019 by outperforming traditional CNN models. It demonstrated superior performance across key metrics by enabling real-time skin disease detection in smart healthcare systems. Hosny et al. [35] employed the AlexNet model combined with transfer learning (TL) techniques to train a DL model for skin disease classification. They conducted simulations on a large dataset of skin images by demonstrating the model generalizability. The proposed methodology demonstrated remarkable diagnostic performance with high accuracy of 95.91% on the validation dataset by highlighting the significant potential of transfer learning in enhancing skin disease detection. Chaturvedi et al. [36] leveraged an advanced classification framework utilizing a refined MobileNet architecture, trained and validated on a comprehensive dermoscopy image dataset comprising 10,015 high-resolution skin lesion samples. Their method utilized TL to enhance performance and achieved an overall accuracy of 83.1% for classifying seven distinct types of skin cancer classes.
Sayed et al. [37] develop a model for skin lesion classification to differentiate normal lesions from melanoma. Their model addressed class imbalance using random over-sampling and data augmentation. The authors optimized their hybrid CNN architecture with Bald Eagle Search (BES) for SqueezeNet hyperparameters achieved an accuracy of 98.37% on the ISIC 2020 dataset. Gupta et al. [38] proposed a hybrid method for melanoma detection with the Ensemble Optimization Algorithm (EOA) to optimize the model. The EfficientNet-based model achieved 87% accuracy on the ISIC dataset by leveraging effective augmentation strategies to improve performance. Golnoori et al. [39] optimized deep neural network architectures and hyperparameters using advanced metaheuristic algorithms by strategically extracting and fusing deep features to enhance classification performance through an advanced Machine learning (ML) classifier. Ther model achieved an accuracy of 81.6% on ISIC 2017 and 90.1% on ISIC 2018, respectively. Liu et al. [40] develop a novel Ensemble Learning Model (EL-DLOA) based on DL and grey wolf optimization algorithm (GWOA) by using four different deep neural network (DNN) architectures to generate confidence levels for classes. Their model achieved an accuracy of 88.8% on HAM10000 dataset by demonstrating the effectiveness of the proposed approach in dermatology diagnosis. Mandal et al. [41] proposed an efficient framework that combines active learning (AL) with particle swarm optimization (PSO) to detect skin cancer. Their method on the HAM10000 dataset achieved an accuracy of 89.4% by significantly improving both classification accuracy and efficiency compared to traditional approaches. Esteva et al. [42] employed pre-trained DL architecture, complemented by advanced data augmentation strategies to enhance the diversity and representativeness of the skin lesion imaging dataset. Their model achieved an accuracy of 71.2% by demonstrating the effectiveness of data augmentation in improving model performance for skin lesion classification. On the other hand, Kassem et al. [43] utilized the GoogleNet model with TL to classify skin lesions. Their model underwent comprehensive validation across multiple diverse skin image datasets, demonstrating its robust capability to classify and detect various skin lesion categories, achieving an impressive accuracy of 94.92% by showing its high potential in skin disease detection. Balasundaram et al. [44] proposed a Genetic Algorithm-Optimized Stacking Approach for skin disease detection using the HAM10000 dataset and achieved an accuracy of 91.73%. However, this accuracy can be further improved with advanced techniques or optimizations. Rahman et al. [45] combined the HAM10000 and ISIC 2019 datasets using a weighted average ensemble method through grid search for achieving an accuracy of 88.00%. This relatively low accuracy presents a limitation by indicating potential for further improvement.
In this section, we briefly discuss the data set used, the models selected for robust feature extraction, and the methods employed for dimensionality reduction. The dataset consists of images from various skin disease categories for training and evaluating the models. For feature extraction, we selected several DL models, which are designed to capture high-level features from the input images. To enhance model efficiency, we employed a Naive Inception block for dimensionality reduction, which helps to reduce the complexity of the data while retaining essential information. Additionally, optimization algorithm was applied for ensuring better convergence during training. Finally, the proposed methodological framework integrates these techniques to improve the classification accuracy by combining feature extraction, dimensionality reduction, and optimization in a unified approach for accurate skin disease detection.
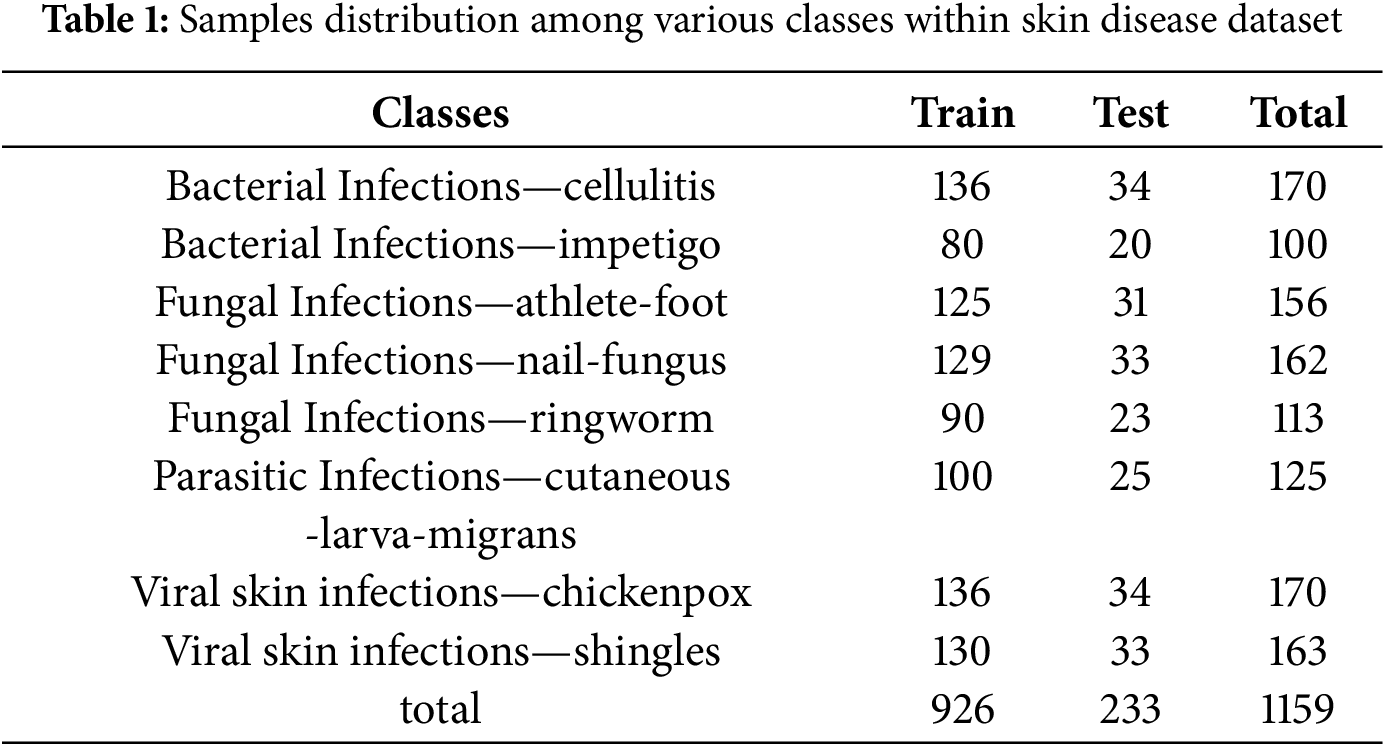
The dataset employed in this study is a publicly available collection from Kaggle comprising images from eight distinct skin diseases. The used dataset can be download from the following Kaggle directory: https://www.kaggle.com/datasets/subirbiswas19/skin-disease-dataset/data (accessed on 01 June 2025). Fig. 1 illustrates the representative samples across different skin lesion categories. We implemented a stratified data splitting approach by allocating 80% of the images for model training and 20% for rigorous performance validation, ensuring comprehensive and reliable evaluation. The dataset distribution is detailed in Table 1, which provides a comprehensive distribution of the images per class by totaling 1159 images across the eight skin disease categories. This dataset structure ensures a representative sample for both training and validation by supporting a thorough evaluation of the proposed models.
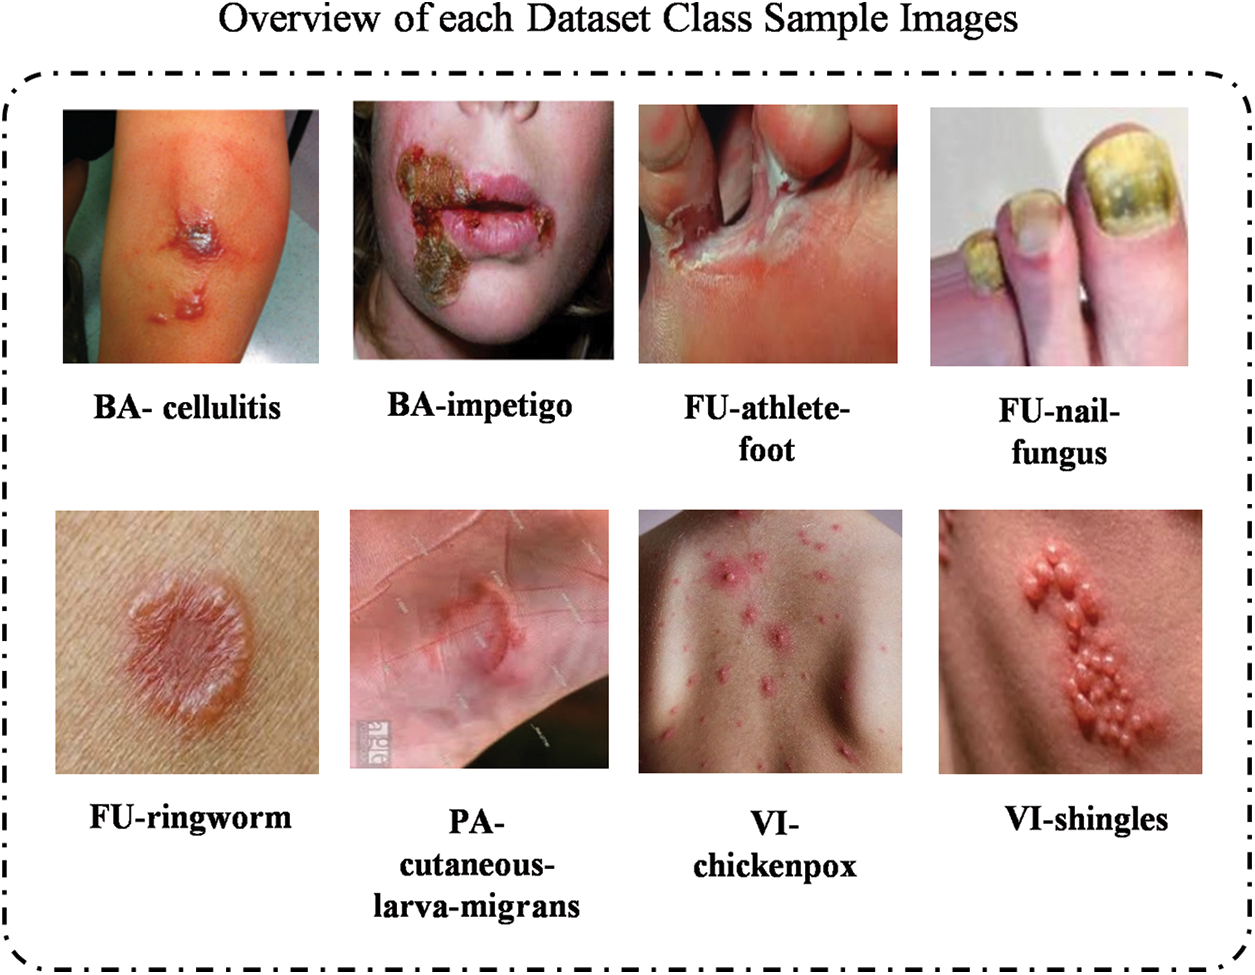
Figure 1: The illustration of skin images from each category within 8 class skin datasets
3.2 Preprocessing and Augmentation
Preprocessing: The preprocessing phase is essential to prepare the raw data for the model by standardizing the input and improving the model learning efficiency. As illustrated in Fig. 2a,b, two main preprocessing techniques were applied. This study includes resizing, normalization, and rescaling:
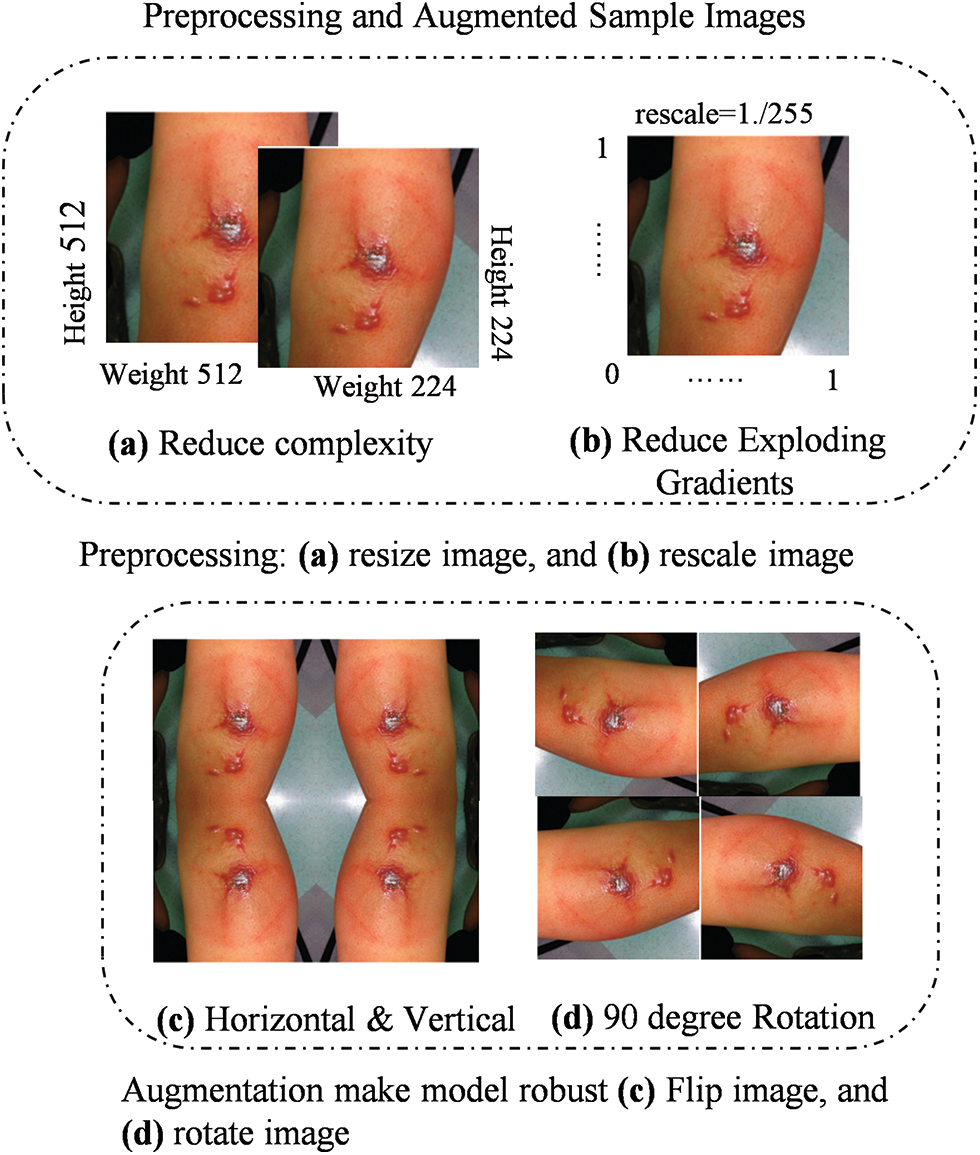
Figure 2: Image augmentation techniques: (a) Horizontal flipping, (b) Vertical flipping, (c) 90-degree rotation, and (d) Random zooming to enhance dataset diversity and model robustness
1. Resizing: We resize the images to a fixed dimension of 224 × 224 pixels to standardize input sizes for the CNN. This step reduces computational complexity and ensures consistency across the dataset, making it easier for the model to learn from patterns rather than discrepancies in image sizes. While resizing improves model efficiency, the computational speed gain specifically depends on the hardware and network architecture, which may vary. For our experiments, resizing allowed us to process images at a consistent rate, but specific speed improvements will be quantified in future work as hardware considerations (e.g., GPU or CPU) may influence the exact time gain.
2. Normalization: Pixel values are scaled to a range of [0, 1] by dividing each pixel by 255. This normalization prevents issues like exploding gradients during training, ensuring more stable and faster convergence. This step is especially important in CNN, where unnormalized data can cause instability in the training process.
Augmentation: We applied two augmentation techniques to expand the diversity of our dataset, improving the model ability to generalize. As shown in Fig. 2c,d, image augmentation techniques such as horizontal and vertical flipping Fig. 2c and 90-degree rotation Fig. 2d were applied to enhance the robustness of the model. These transformations simulate variations of real-world data, preventing overfitting:
1. Flipping: Horizontal and vertical flipping were applied to introduce variability in the dataset, providing the model with different orientations of the same image. This enhances the model ability to detect disease patterns from different viewpoints, which is particularly valuable in skin disease classification, where lesions may appear at varying orientations.
2. Rotation: A 90-degree rotation was performed on images to simulate additional geometrical transformations. This technique increases dataset variability by providing different perspectives of the same image, which helps the model generalize better across different real-world scenarios.
3.3 Baseline Model Selection Criteria
The MobileNetV1 [46] model is a lightweight DL architecture designed for mobile and embedded devices by focusing on delivering high performance with lower computational cost. As shown in Fig. 3, the model employs depthwise separable convolutions, which reduce the number of parameters and computational complexity compared to traditional convolutions. This design enables the model to efficiently process input images while maintaining strong performance. The workflow begins with the input image being passed through the initial convolution layers, followed by a series of depthwise separable convolutions. These layers progressively extract features from the image, with the output being fed into fully connected layers for the final classification. By using these efficient operations, MobileNetV1 ensures fast inference, making it ideal for applications with limited computational resources.
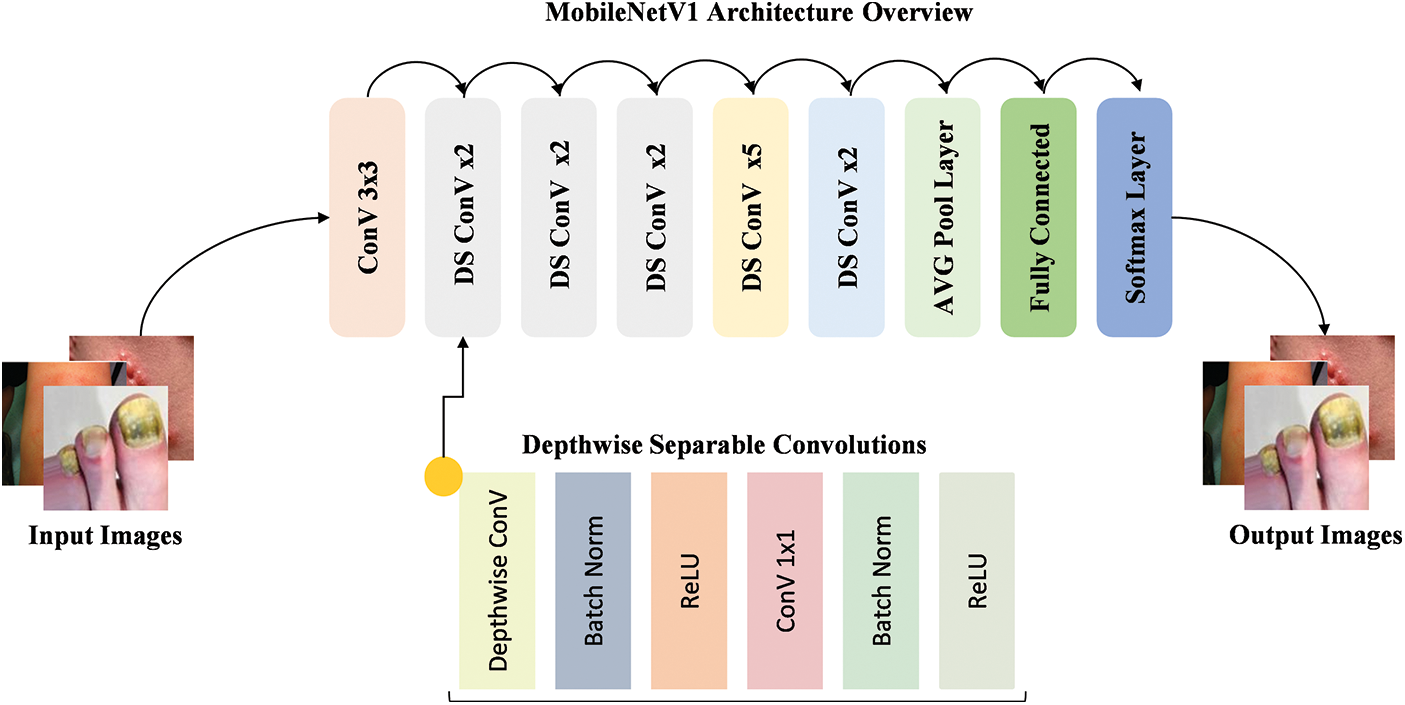
Figure 3: Workflow of the MobileNetV1 model with depthwise separable convolutions for efficient feature extraction
The DenseNet201 [47] model is a DL architecture designed to improve feature reuse by connecting each layer to every other layer in a densely connected pattern. As shown in Fig. 4, the model employs dense blocks, where each layer receives input from all previous layers, allowing for better gradient flow and more efficient learning. The workflow begins with the input image being processed through initial convolution layers, followed by a series of dense blocks. Each block contains several convolutional layers, where the output from each layer is merged with the inputs of the following layers. This structure enhances the capability of models to extract and reuse features at various levels. The use of dense connections allows DenseNet201 to achieve high performance while maintaining relatively fewer parameters by making it efficient for image classification tasks.
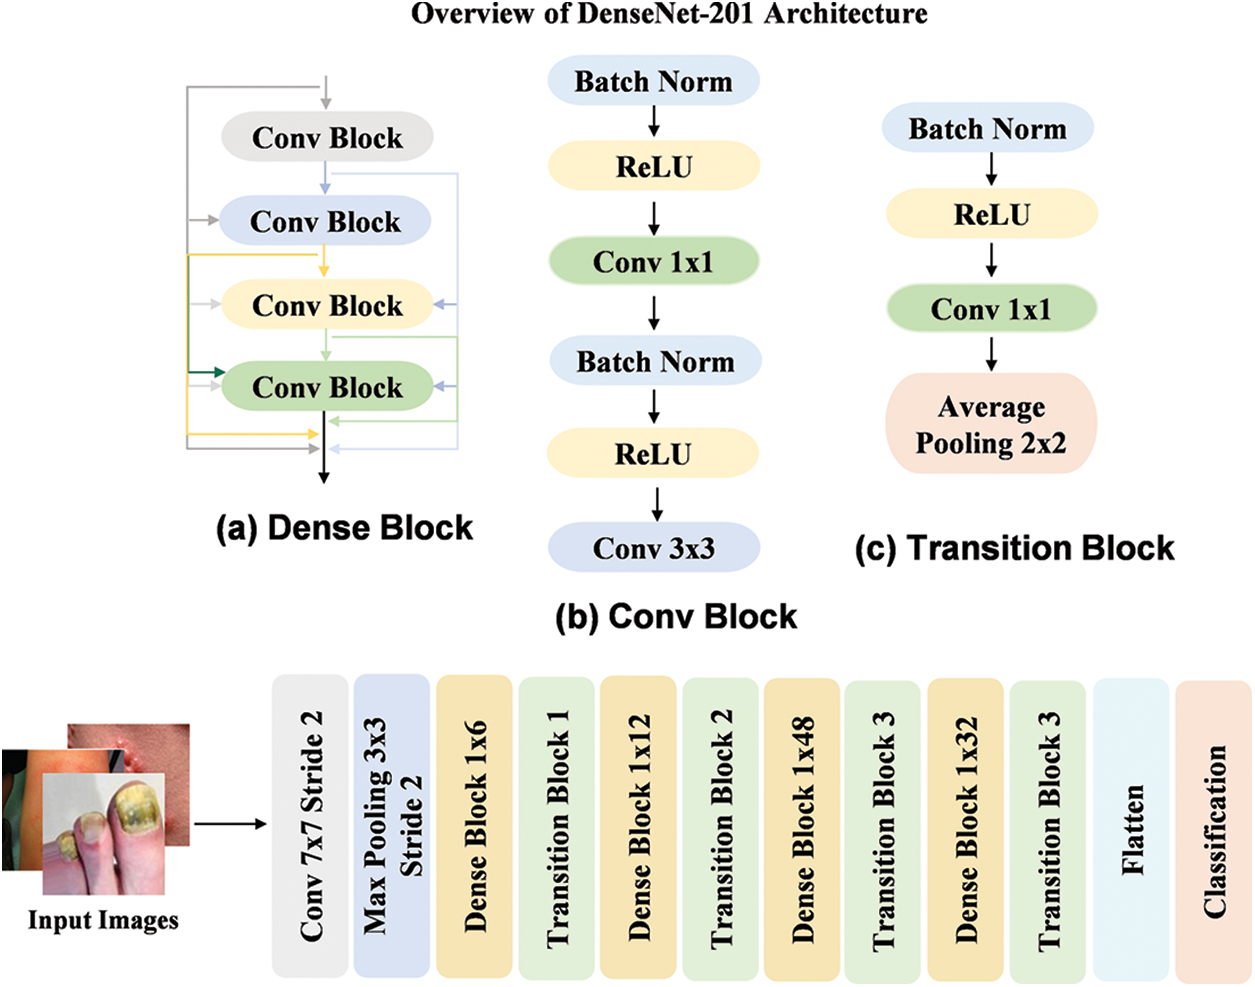
Figure 4: Workflow of the DenseNet201 model by utilizing dense blocks for efficient feature reuse
The Xception [48] model is a DL architecture that builds upon the idea of depthwise separable convolutions, further improving the efficiency by using a streamlined design with separable convolutions for both spatial and channel dimensions. As shown in Fig. 5, the model consists of a series of depthwise separable convolution layers, with each layer using both a depthwise convolution followed by a pointwise convolution. This architecture reduces the number of parameters while maintaining high performance by enabling more effective feature extraction. The workflow starts by passing the input image through initial convolution layers, which is followed by a series of depthwise separable convolutions. These layers extract relevant features at various spatial scales, which are then passed through global average pooling and Dense layers for classification. The design of this model enables faster training and inference by making it highly suitable for tasks that involve both efficiency and high accuracy.
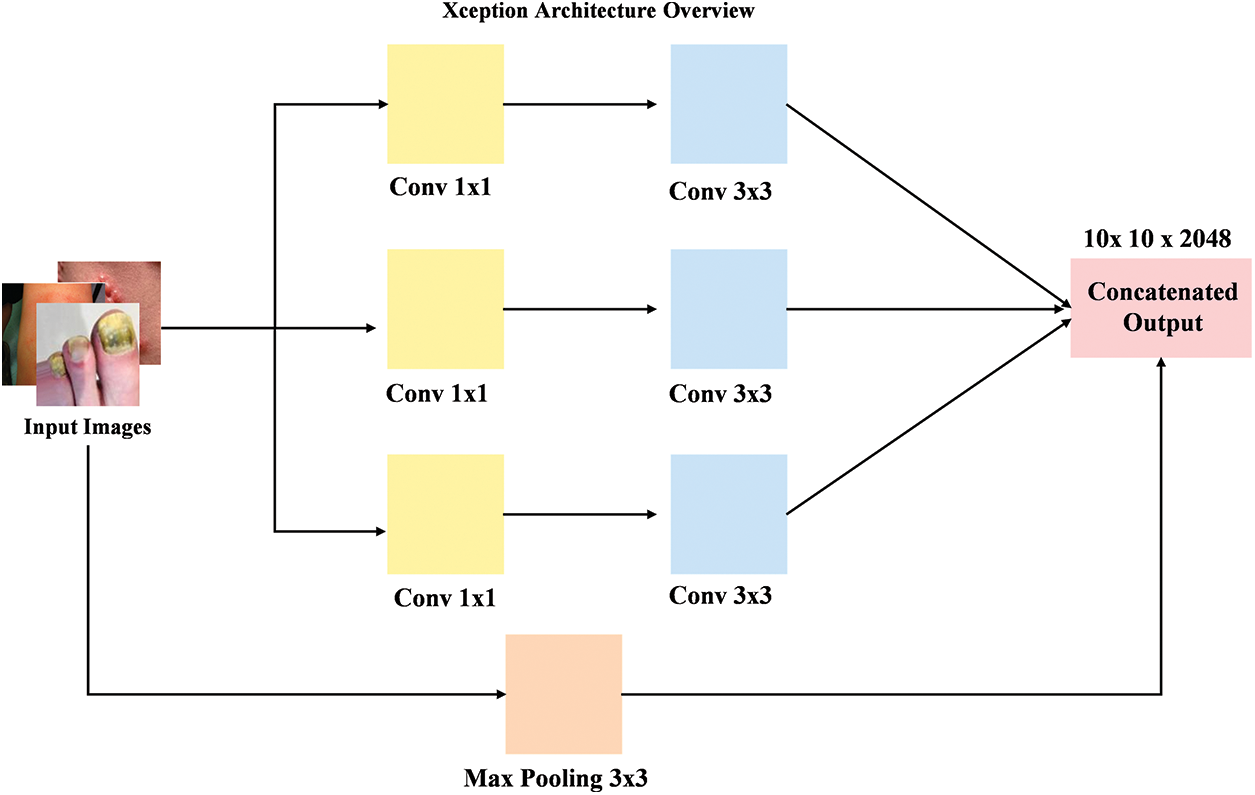
Figure 5: Overview of the Xception model workflow with depthwise separable convolutions for efficient feature extraction
3.4 Improve Baseline Model with Dimension Reduction
In this section, we explore the enhancement of the baseline model through the integration of dimension reduction naïve inception block [49], as illustrated in Fig. 6. The model employs a series of convolutional layers with varying filter sizes (1 × 1, 3 × 3, and 5 × 5) followed by the ReLU activation function to extract features efficiently. Additionally, the use of a max pooling operation with a 3 × 3 filter helps in reducing the spatial dimensions while retaining critical features. A key aspect of the improvement is the application of LeakyReLU in one of the convolution layers, which helps prevent dead neurons and improves the model capacity to learn. The final step involves concatenating the filters, further optimizing the feature extraction process. This approach ensures that the model benefits from both local and global feature extraction while reducing computational complexity, ultimately enhancing the model performance.
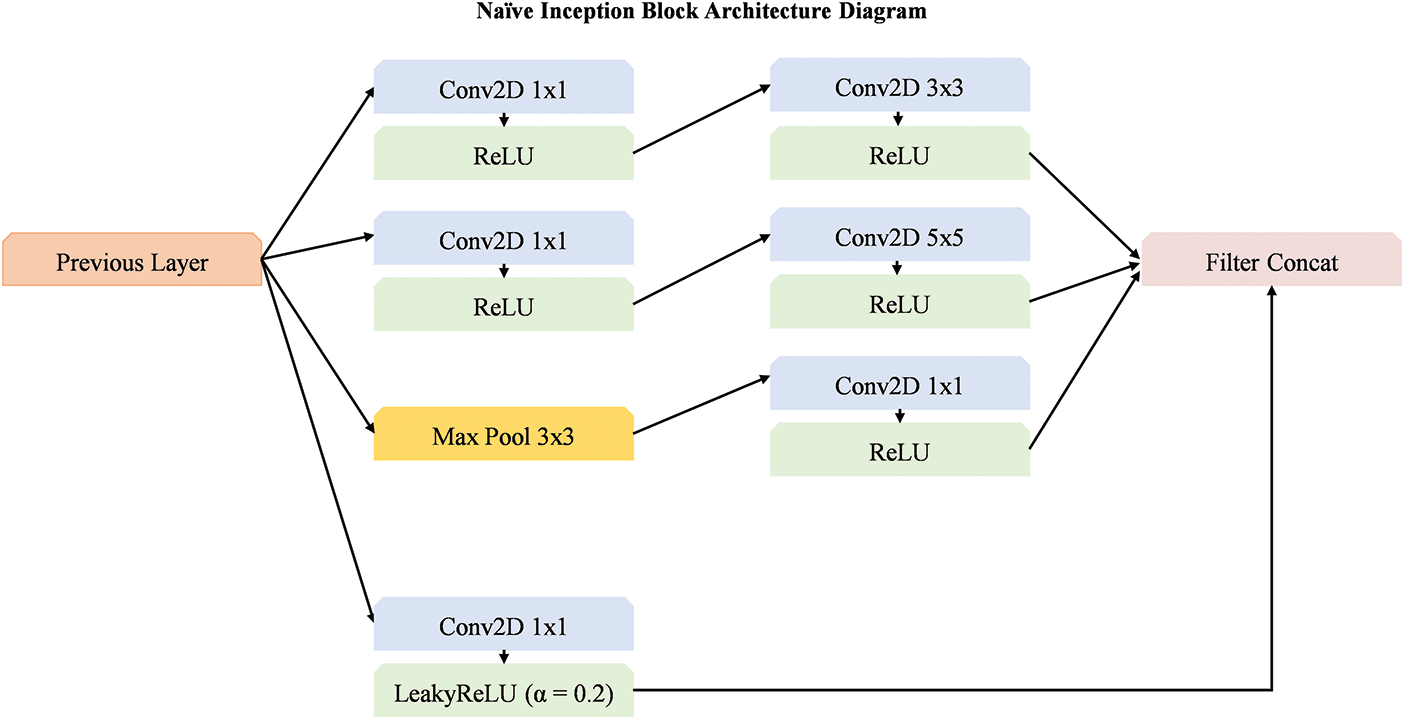
Figure 6: Overview of dimension reduction block integrated with base models
Rationale behind the selection of filter sizes and activation functions:
The rationale for using these specific convolution (1 × 1, 3 × 3, and 5 × 5) sizes stems from their complementary role in capturing different levels of feature abstractions. The 1 × 1 convolution reduces the dimensionality of the input by enabling more efficient feature extraction, while the 3 × 3 and 5 × 5 convolutions capture local spatial information at different scales. Together, these convolutions contribute to a richer and more expressive feature representation, enabling the model to capture both fine-grained details and broader contextual information across different scales. The intention behind the use of both ReLU and LeakyReLU activations within a single block is to combine the benefits of both activation functions. ReLU is widely used for its simplicity and ability to promote sparse activations, whereas LeakyReLU is employed to mitigate the “dying ReLU” problem by allowing a small gradient for negative inputs. We believe that using both activations enables the model to effectively learn a broader range of features.
Mathematical formulations:
Let the input feature map from the previous layer be denoted as
The first convolution is a
This produces a feature map after applying the
In next branch, a
The
Subsequently, we applied
This step further processes the feature map by allowing the network to learn more refined features after the ReLU activation.
Now, a
The
Additionally, a max pooling operation is applied with a
Max pooling helps reduce the spatial dimensions and retain the most important features.
Finally, after the MaxPool operation, a
Followingly, we applied a
LeakyReLU is used here instead of ReLU to allow small gradients for negative values by preventing potential issues like dying ReLU.
Finally, all the processed feature maps from the previous operations are concatenated along the channel dimension:
3.5 Squid Game Optimization Algorithm
The Squid Game Optimization (SGO) [50] algorithm is applied to optimize the weightage vector
Mathematical Model:
In the initialization phase, positions for each candidate solution (representing weights in
where
After initialization, the candidates are sub-divided into following two groups: Offensive (Off) and Defensive (Def) groups. The mathematical representation of these groups is as follows:
where
The Offensive players (
where
Impact of Offensive and Defensive Players:
The SGO algorithm utilizes the roles of “Offensive” and “Defensive” players to optimize the search process. The “Offensive” player focuses on exploration by seeking new and unexplored solutions within the search space. This player pushes the optimization process by identifying regions that may contain optimal or near-optimal solutions. In contrast, the “Defensive” player emphasizes exploitation by refining previously identified high-quality solutions to ensure stability and convergence. The combination of exploration and exploitation in the SGO algorithm enhances its ability to find new solutions while improving existing ones. This dual approach allows the algorithm to navigate complex search spaces more effectively, leading to better overall performance in optimization tasks.
Winning State Calculation:
Each Offensive player evaluates the objective function for each solution. The winning state
The winning Offensive player joins the Successful Offensive Group (SOG) and continues to improve their position:
where
where
If the defensive player performance surpasses that of the offensive player (
where OG represents the Offensive Group by consisting of the collective set of offensive players.
Integration of SGO into Aggregation System:
SGO operates on the predictions generated by the individual models during the aggregation phase. Specifically, SGO is used to determine the optimal weight set for each backbone model based on the predictions it generates, which are then aggregated to form the final ensemble output. This approach avoids the need for SGO during model training itself by focusing its role on optimizing the contribution of each model in the ensemble during the aggregation stage.
3.6 Overview of Proposed SGO-DRE Framework
In this section, we will provide an overview of the proposed SGO-DRE methodology, which aims to improve the diagnostic performance of skin cancer through a combination of advanced techniques. The framework integrates preprocessing, model selection, dimension reduction, model aggregation using the SGO algorithm, model evaluation, and visualization techniques to achieve superior classification performance. The process begins with preprocessing, which is a crucial step to ensure the data is in an appropriate format for model input. The raw images are resized to a fixed resolution of 224 × 224 pixels by ensuring uniformity across the dataset and compatibility with DL models. The pixel values of the images are rescaled to the range of [0, 1] by dividing each value by 255. This normalization step helps stabilize the model training and speeds up convergence by ensuring the model focuses on the features.
Following preprocessing, the next step involves augmentation to enhance the diversity of data samples. This increases the dataset size and helps to prevent overfitting, as the model is exposed to a broader range of image conditions during training. These transformations simulate real-world variations and allow the model to learn more generalized features by improving its performance on unseen data.
For robust feature extraction, we selected three pre-trained models including MobileNetV1, DenseNet201, and Xception, which are well-known for their superior performance in image classification tasks and performed superior to other pre trained models. These models are selected from several candidate models due to their proven effectiveness in extracting hierarchical features from images by making them suitable for the skin disease classification task. Each model is further enhanced by integrating a dimension reduction block, which reduces the number of features while preserving essential information. This reduction helps improve computational efficiency by lowering the number of parameters, speeding up training, and preventing overfitting, while still retaining the ability of models to capture complex features.
The core of the methodology lies in the aggregation of the selected models using the Squid Game Optimization (SGO) algorithm. The SGO algorithm is used to search for the optimal weightage assignment for each individual model within the ensemble. By iteratively optimizing the weightage vector set, the SGO algorithm ensures that each model contributes effectively to the final prediction by allowing the proposed method to leverage the strengths of each model. This dynamic aggregation approach helps solve the problem of model combination by improving classification accuracy. For model evaluation, we conduct tests on datasets with both fewer and larger numbers of images to assess the performance of proposed method across varying dataset sizes. This ensures the robustness and generalization ability of the proposed method by allowing it to handle different levels of data complexity. The evaluation provides insights into the effectiveness of models in real-world scenarios, where datasets can vary in size and quality.
Finally, visualization techniques such as Grad-CAM, ROC curves, and Precision-Recall curves are employed to interpret and validate the models’ predictions. Grad-CAM visualizations highlight the regions of the images that the model focuses on when making decisions by providing transparency and interpretability, which is crucial for clinical settings. The ROC and Precision-Recall curves are used to evaluate the performance of models across different thresholds by ensuring it can balance precision and recall effectively. The overall workflow framework of the proposed method is illustrated in Fig. 7.
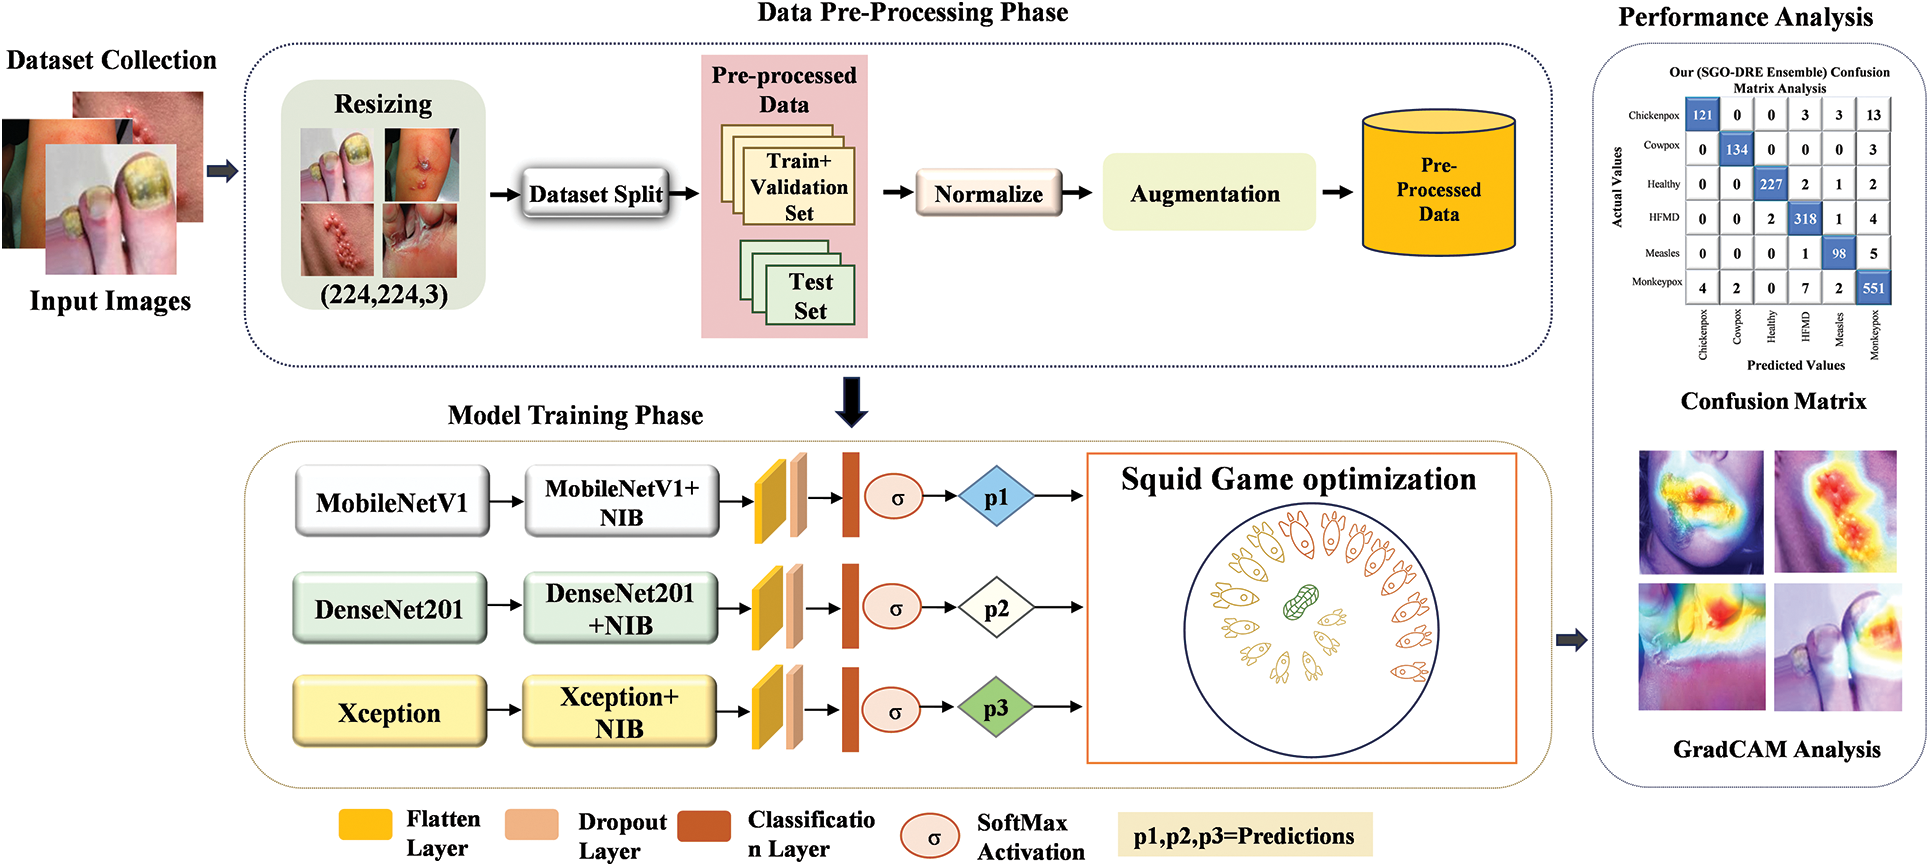
Figure 7: Overview of proposed framework
In this section, we present the experimental results of the proposed method, focusing on its performance and effectiveness. We will showcase various visualization techniques to better understand the results and highlight key observations. Furthermore, we will compare the performance of the proposed method with that of individual models as well as existing methods to demonstrate their superiority and practical advantages.
We assess the performance of the proposed method using a publicly available skin disease dataset, which provides a diverse set of images and annotations for skin disease classification. The proposed approach was developed using Python 3.0+ and the Keras library, leveraging its DL capabilities for model training. The training process was conducted on Jupyter Notebook, with GPU acceleration to enhance computational efficiency and speed. For this, we utilized an NVIDIA GeForce MX350, which is equipped with 2GB of GDDR5 VRAM, System RAM—16 GB, and Storage—512 GB SSD. The powerful GPU capabilities enabled us to efficiently handle large volumes of data by ensuring faster convergence of the model and better handling of complex computations involved in training DL models for skin disease classification.
4.2 Hyperparameter and Model Evaluation Metrics
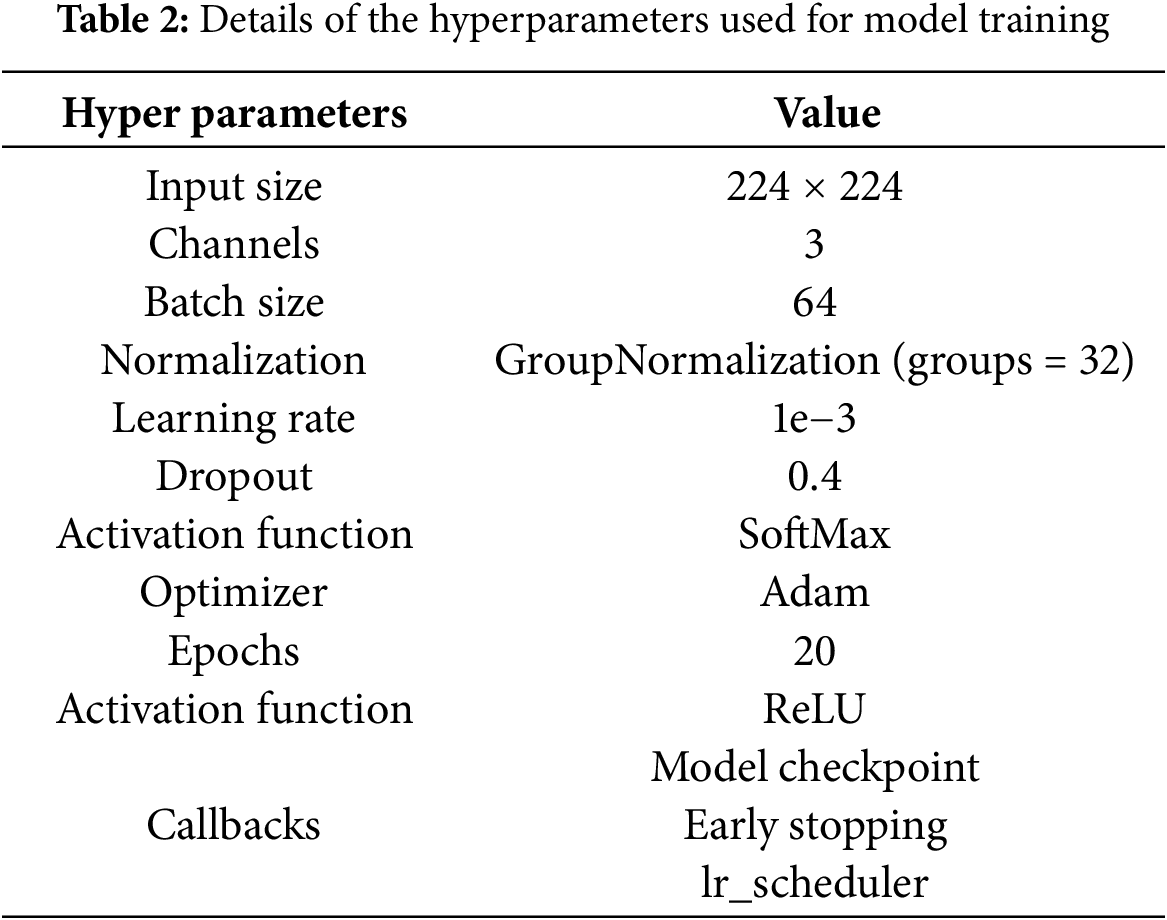
Model hyperparameters are crucial settings utilized during the training process of DL models by significantly influencing their overall performance. These hyperparameters play a vital role in optimizing how the model learns from the data by affecting learning speed, generalization, and computational effectiveness. The tuning of these parameters is critical for ensuring effective learning while avoiding issues such as overfitting or underfitting. Table 2 presents a comprehensive summary of the hyperparameters utilized for training the DL architectures. Input images are adjusted to a size of 224 × 224 pixels to meet the specifications of the models. To prevent overfitting, a dropout rate of 0.4 is implemented by randomly deactivating 40% of the neurons during each update in every training batch. The learning rate is established at 1.0 × 10⁻³ by facilitating precise adjustments of the model weights according to the gradient of the loss function. The model uses GroupNormalization (groups = 32) for normalization to improve the stability of the training process. The ReLU activation function is utilized to introduce non-linearity, enabling the network to learn intricate patterns. In the output layer, the SoftMax function transforms the outputs into probabilities for classification. The Adam optimizer is preferred for its ability to dynamically modify learning rates based on gradient changes, which enhances training efficiency. Several callbacks are incorporated including model checkpoints, early stopping, and a learning rate scheduler. A batch size of 64 is selected to ensure efficient memory usage, and the models undergo training for 20 epochs to effectively analyze the dataset and improve their capacity to learn intricate features.
The performance of the model in accurately classifying skin diseases was evaluated using metrics such as accuracy (
4.3 Class Wise Performance Evaluation of Proposed Ensemble Model
Class-wise performance analysis plays a crucial role in assessing how well models differentiate between various categories. It helps ensure that the model performs effectively across all classes and highlights areas where improvements may be necessary. Table 3 provides detailed class-wise performance by comparing base models Multiscale fusion (MSF) like MSF1 (MobileNetV1 + NB), MSF2 (DenseNet201 + NB), MSF3 (Xception + NB), and the proposed SGO-DRE Ensemble method. The MSF1 model achieved perfect recall scores of 1.000 for Impetigo, Nail-fungus, and Chickenpox by demonstrating its strong ability to correctly classify these classes. However, the model faced challenges with Ringworm class, which resulted in a lower recall score of 0.9130, and Larva-migrans with a recall score of 0.9200. Other classes showed reasonable recall scores by indicating satisfactory performance across most categories. Overall, MSF1 achieved an impressive accuracy of 96.57% across all classes by highlighting its effectiveness, though there is some room for improvement in certain categories.
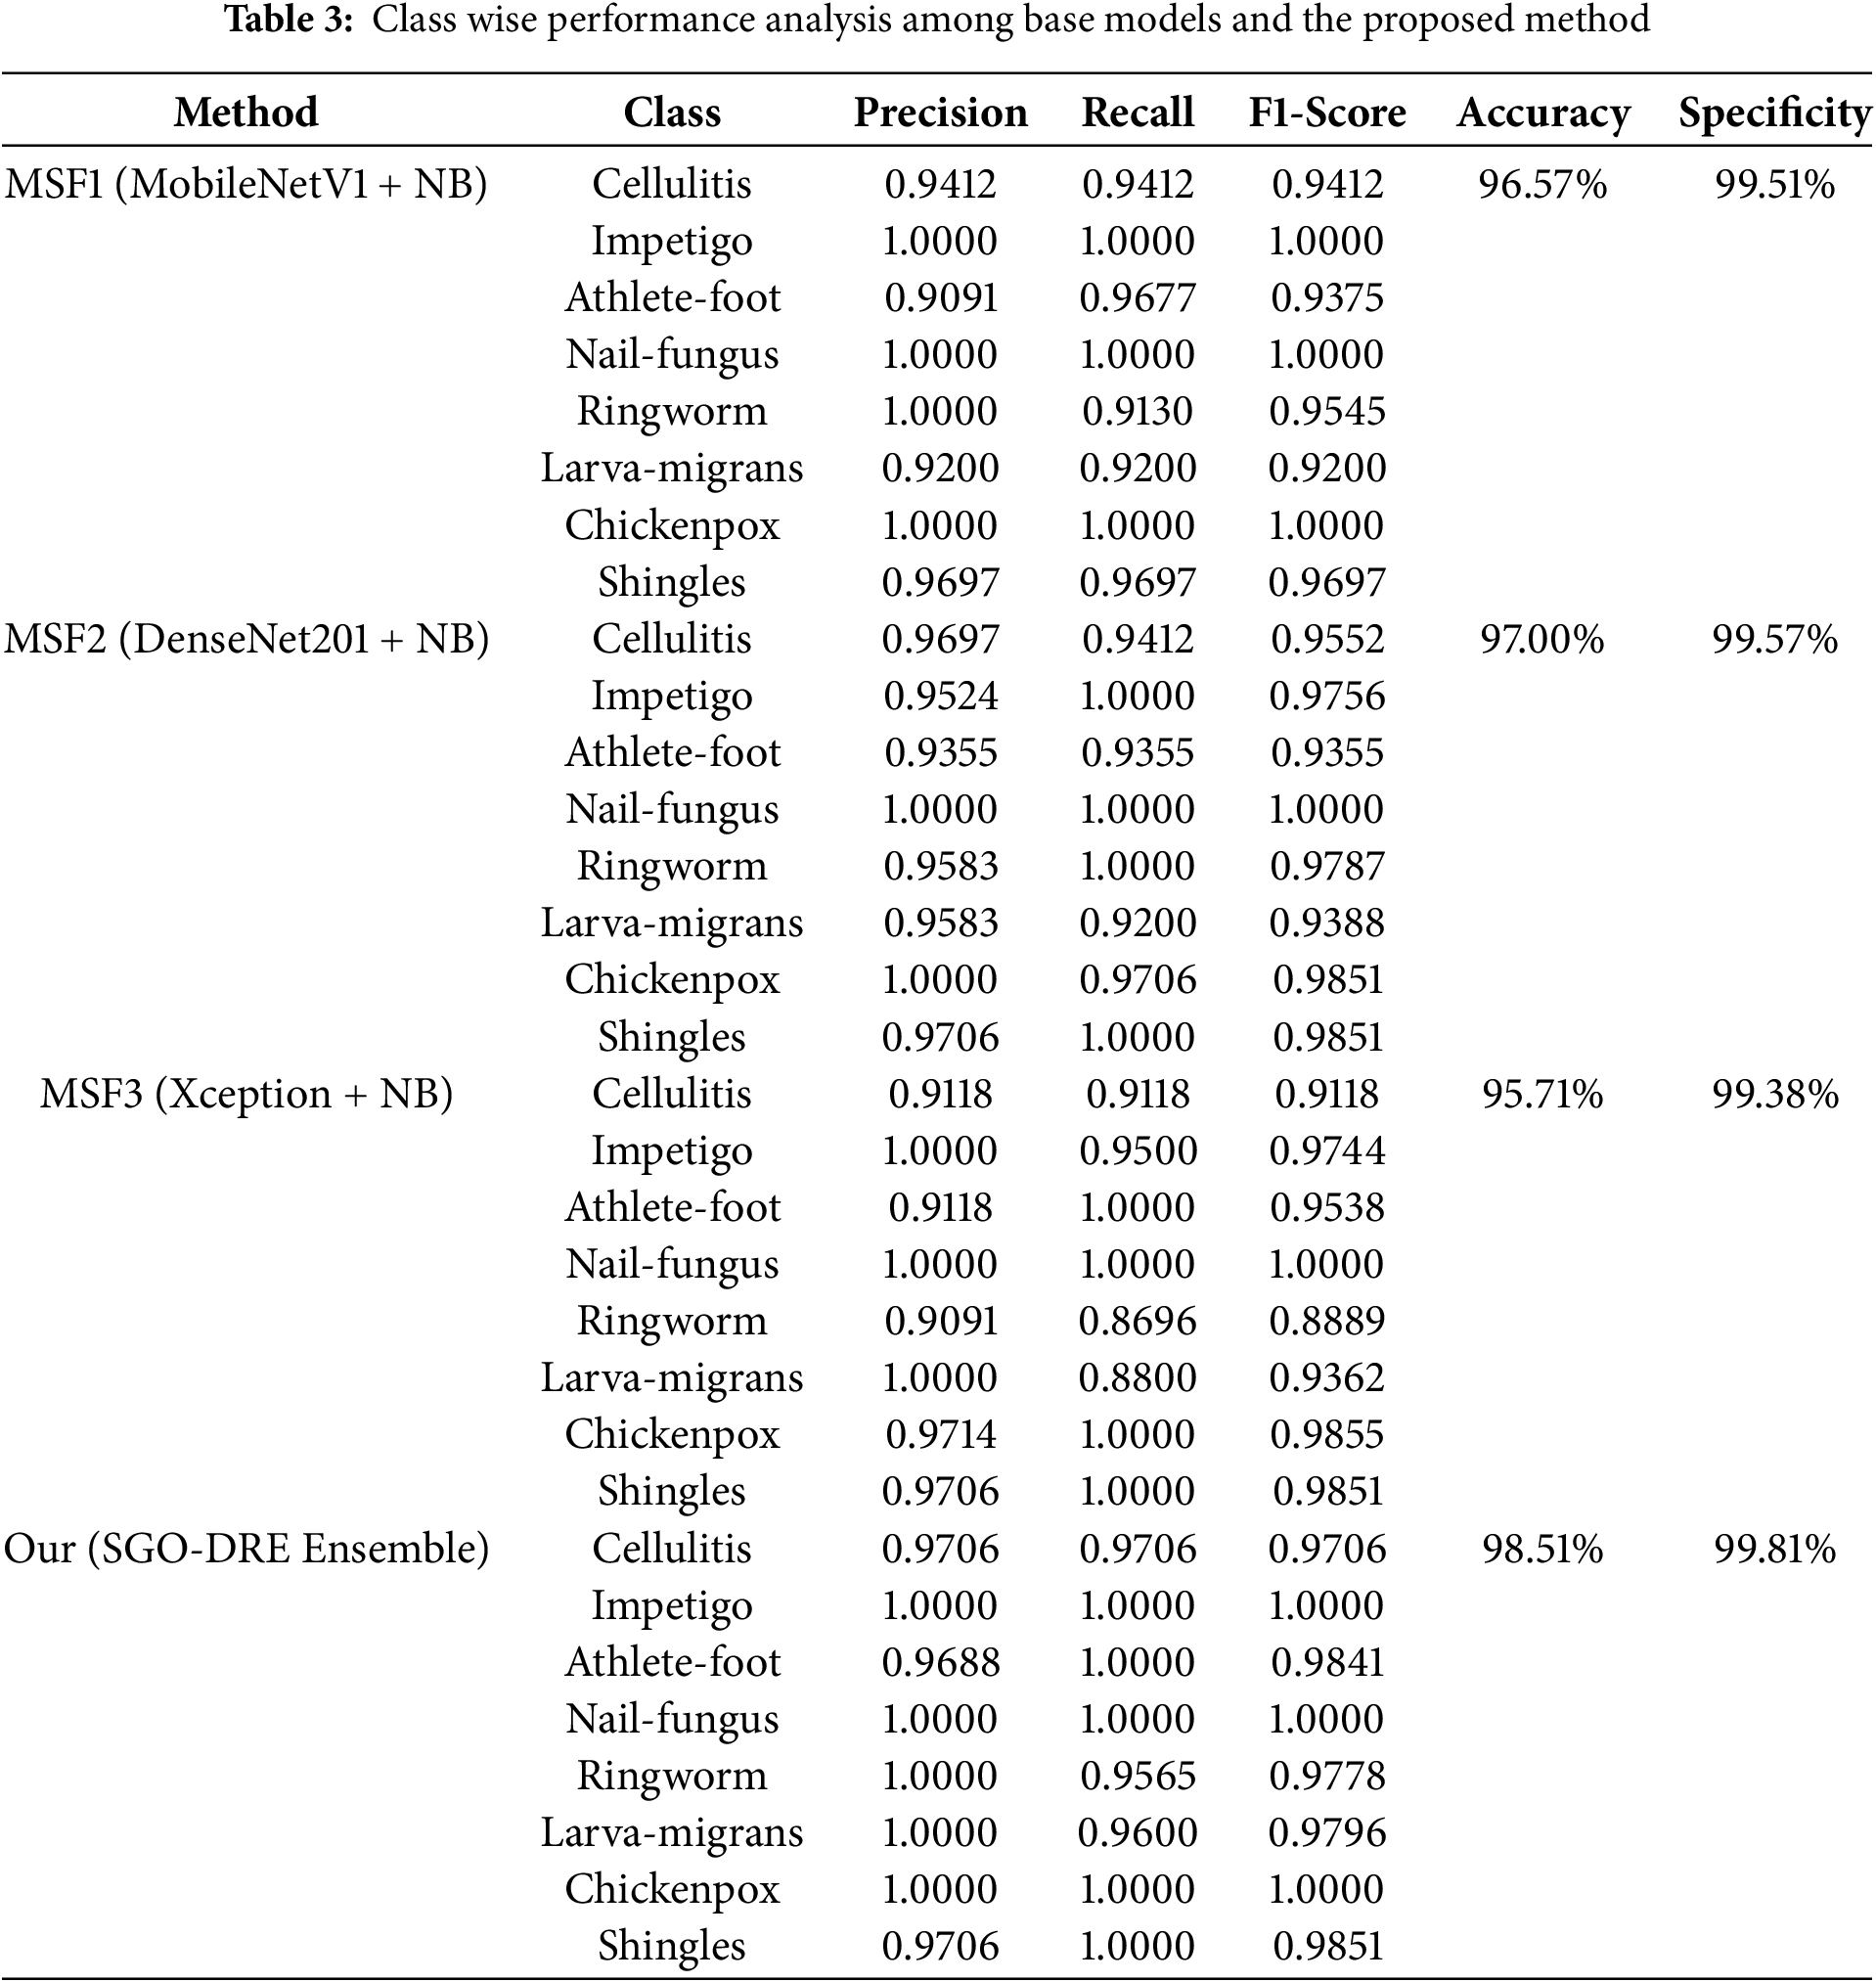
The MSF2 model performed exceptionally well with perfect recall scores of 1.000 for Impetigo, Nail-fungus, Ringworm, and Shingles by reflecting its strong ability to correctly identify these 4 classes. Despite this, the model faced challenges with Athlete-foot, which resulted in a lower recall score of 0.9355. When compared to MSF1, it showed improved performance in Ringworm class, where the recall score increased from 0.9130 to 1.0000. However, the recall for Larva-migrans remained consistent at 0.9200. Overall, MSF2 model achieved a higher accuracy performance of 97.00% than MSF1 model by demonstrating superior performance in various categories, though there is still some potential for improvement in specific areas like Athlete-foot and Larva-migrans.
The MSF3 model achieved perfect recall scores of 1.000 for Athlete-foot, Nail-fungus, Chickenpox, and Shingles, demonstrating strong performance. However, it faced challenges with Ringworm at recall rate of 0.8696 and Larva-migrans at a recall rate of 0.8800 by showing areas of difficulty in these classes. Compared to MSF1 and MSF2, it showed improvement in the Athlete-foot class and maintained performance in Nail-fungus. Chickenpox performed better than MSF2, though similar to MSF1, and Shingles improved from MSF1 while maintaining performance similar to MSF2. However, the performance of other classes declined in MSF3. The overall accuracy of MSF3 is 95.71%, which is lower than both MSF1 (96.57%) and MSF2 (97.00%) by indicating a potential for further improvement. For the lower performance of MSF3 (Xception + NB), we observe that despite the deep architecture of Xception, it performs worse than other models such as MobileNetV1 and DenseNet201. This can be attributed to the increased complexity of the Xception model, which may lead to overfitting, especially when combined with the relatively small and imbalanced dataset. The larger number of parameters in Xception increases the risk of the model fitting too closely to the training data by leading to poorer generalization. Additionally, the ensemble of models in MSF3 may have faced optimization challenges, as more complex architectures are harder to tune effectively compared to the lighter models in MSF1 and MSF2, such as MobileNetV1 and DenseNet201.
Finally, the proposed SGO-DRE Ensemble method delivered outstanding performance with perfect recall scores of 1.000 among most of the classes including Impetigo, Athlete-foot, Nail-fungus, Chickenpox, and Shingles by indicating its exceptional capability to correctly distinguish between these classes. The model also performed well on Cellulitis and Larva-migrans with recall scores of 0.9706 and 0.9600, respectively. It indicates a slightly lower recall rate of 0.9565 in Ringworm class but still performing well. Compared to 3 base models MSF1, MSF2, and MSF3, the proposed SGO-DRE Ensemble outperformed all other models in terms of recall and achieved the highest overall accuracy of 98.51% by reflecting its superior classification capabilities across all classes. We can also notice that the proposed model demonstrates higher specificity of 99.81% compared to individual models MSF (1–3).
The confusion matrix is an important tool for evaluating classification models by offering a clear summary of predicted vs. actual labels. It not only reveals the number of accurate predictions but also highlights the misclassifications across different categories for providing essential insights where the performance of models can be improved. The visualization of confusion matrices for the various base models and the proposed method is shown in Fig. 8. This evaluation used 233 test images representing 8 distinct skin disease categories. As shown in Fig. 8a, the MSF1 model correctly classified 225 images, with 8 misclassifications. In Fig. 8b, the MSF2 model performed slightly better by correctly identifying 226 samples and misclassifying only 7. In Fig. 8c, the MSF3 model showed a decrease in performance by correctly diagnosing 223 images and misclassifying 10, indicating a need for further refinement to reduce misclassification rate. On the other hand, the proposed SGO-DRE Ensemble method in Fig. 8d exhibited a notable improvement by accurately classifying 230 images and misclassifying only 3 samples. This enhanced performance can be attributed to the optimization-driven dynamic weighting strategy incorporated into the proposed method.
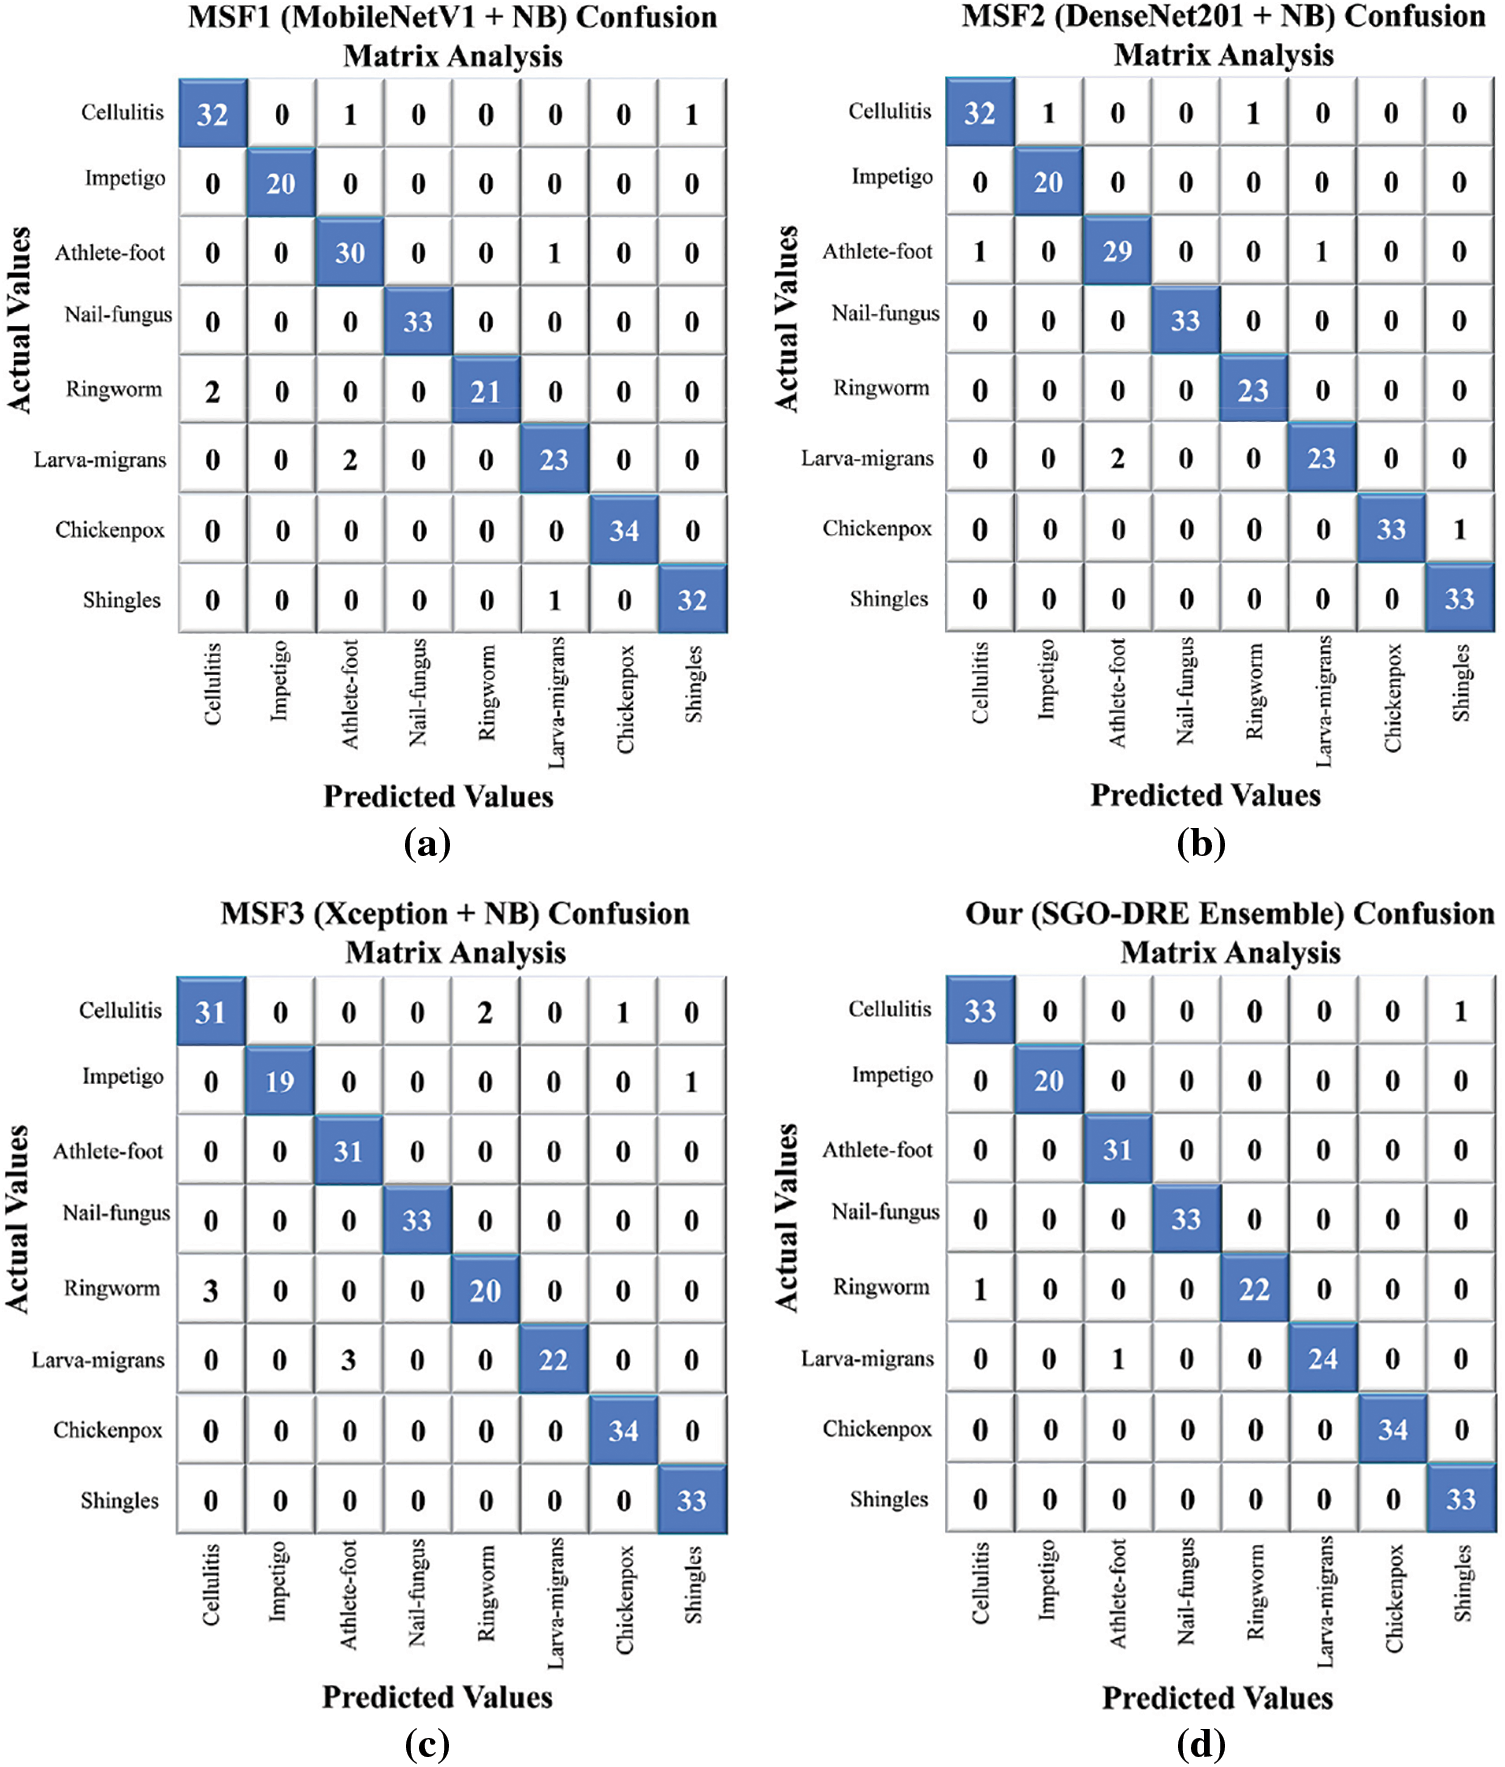
Figure 8: Confusion matrix analysis visualization comparing (a) MSF1, (b) MSF2, (c) MSF3, (d) proposed SGO-DRE method
The performance of the MSF1, MSF2, MSF3, and proposed SGO-DRE Ensemble models is further assessed through the receiver operating characteristics-Area under the curve (ROC-AUC) and precision-recall (P-R) curves, as shown in Fig. 9. The AUC-ROC curve is crucial for evaluating the ability of the models to distinguish between positive and negative classes by providing a comprehensive measure of model performance across all classification thresholds. The PR curve is important as it emphasizes the trade-off between precision and recall, particularly in scenarios with imbalanced datasets by revealing how well the model balances false positives and true positives. The AUC-ROC curves in Fig. 9a illustrate that all models exhibit strong AUC scores with the MSF1 model achieving an AUC of 0.9982, MSF2 at 0.9992, MSF3 at 0.9980, and the proposed SGO-DRE Ensemble leading with an AUC of 0.9995. This demonstrates the overall excellent performance of all models in distinguishing between positive and negative samples. In the PR curve analysis in Fig. 9b, the proposed SGO-DRE Ensemble model outperforms the others with an average precision (AP) of 0.9970. MSF2 follows closely with an AP of 0.9951, while MSF1 and MSF3 show slightly lower precision scores of 0.9913 and 0.9885, respectively. These results suggest that the proposed SGO-DRE Ensemble model maintains a superior balance between precision and recall, especially at higher thresholds, indicating its overall enhanced classification capability compared to the other models.
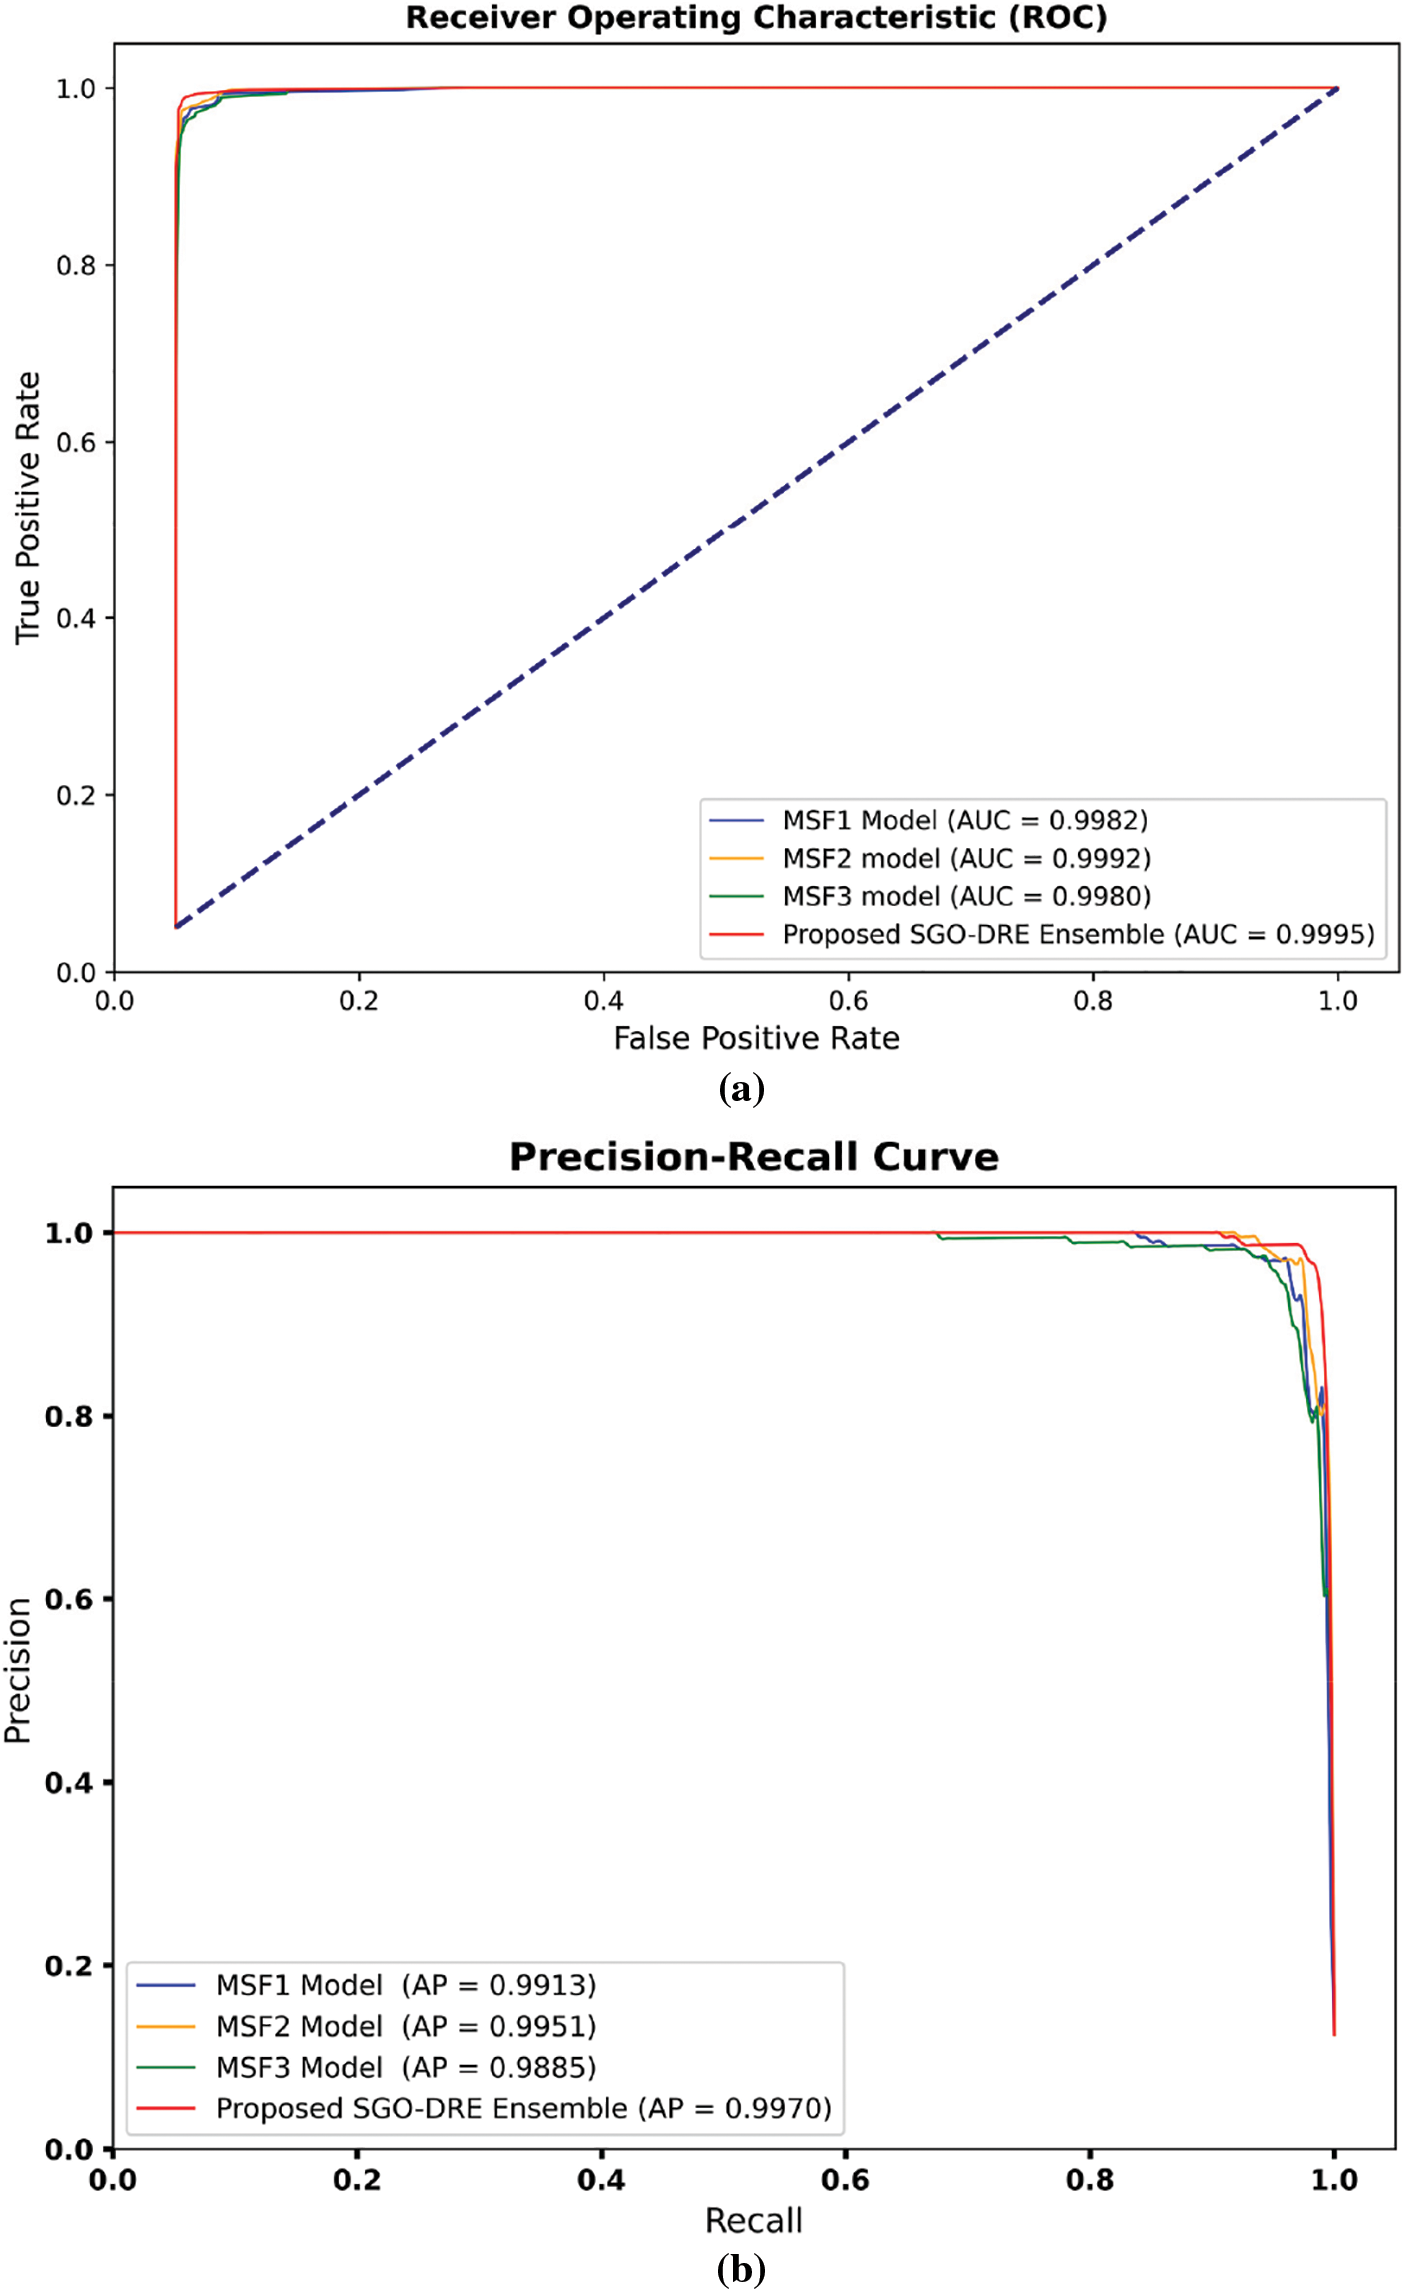
Figure 9: The performance evaluation among MSF1, MSF2, MSF3, and Proposed SGO-DRE using (a) AUC-ROC and PR curves, (b) P-R curves for the same models
4.4 Comparative Analysis among Proposed and Existing CNNs
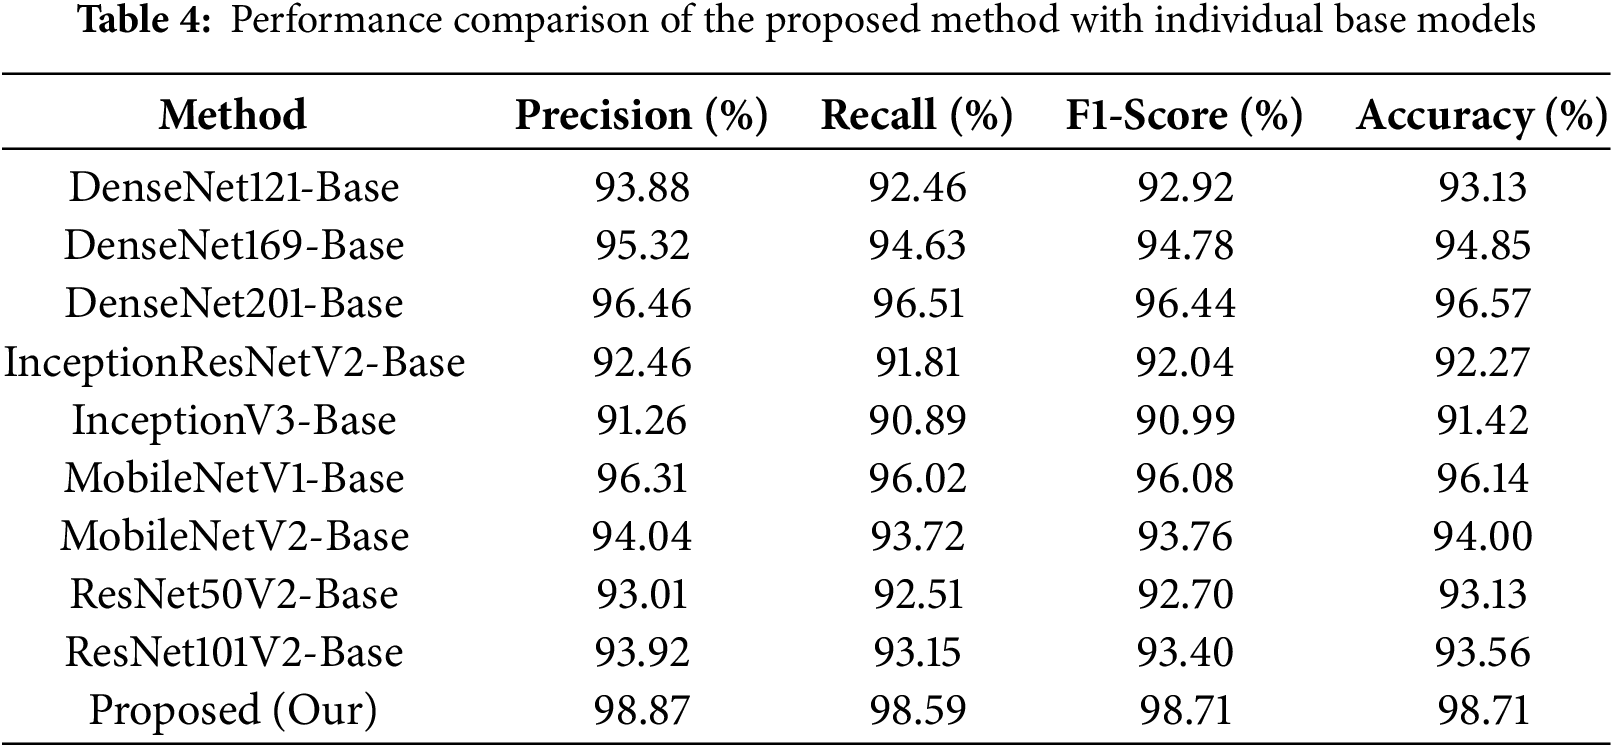
In this section, we compare the performance of the proposed method with the individual base models. In this section, we compare the performance of the proposed method with that of the individual base models. All baseline models were trained and evaluated under the same conditions as those used in the primary experiments to ensure a fair comparison. Specifically, the models were trained using the same data splits, data augmentation techniques, and the same number of epochs. This approach allows for a consistent and accurate assessment of the proposed method’s performance, highlighting its advantages over the individual base models.
As shown in Table 4, the InceptionV3-base model demonstrates the lowest recall rate of 90.89, which results in the lowest accuracy of 91.42%. The InceptionResNetV2-base model also performs poorly, with a recall value of 91.81 and an accuracy of 92.27%. Among the DenseNet series, DenseNet201 outperforms other DenseNet models, achieving a recall rate of 96.51 and an accuracy of 96.57%. MobileNetV1 outperforms MobileNetV2 with a recall score of 96.02 and an accuracy of 96.14%, although it still lags behind DenseNet201 in terms of performance. In contrary, the DenseNet169 model shows lower performance compared to DenseNet201 and MobileNetV1 but higher than other models. In comparison, our proposed model significantly surpasses all individual models by achieving a superior accuracy of 98.71% and a recall rate of 98.59%, which distinguishes it as the top performer among the individual models.
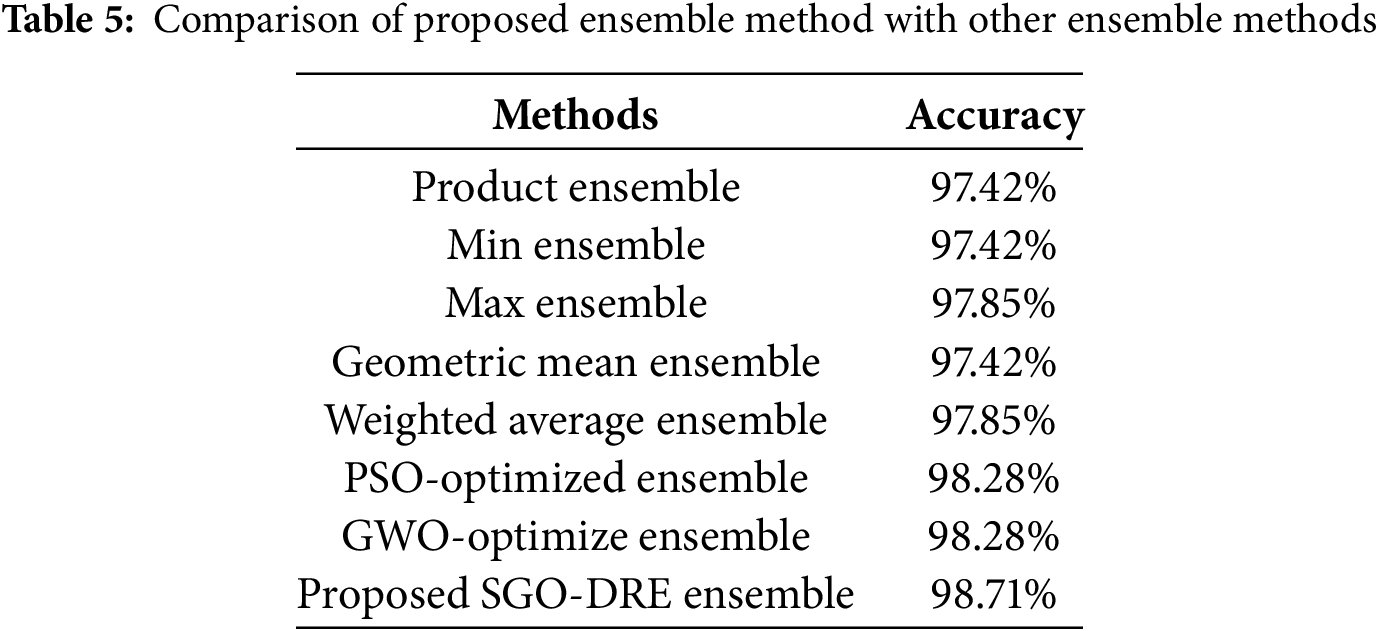
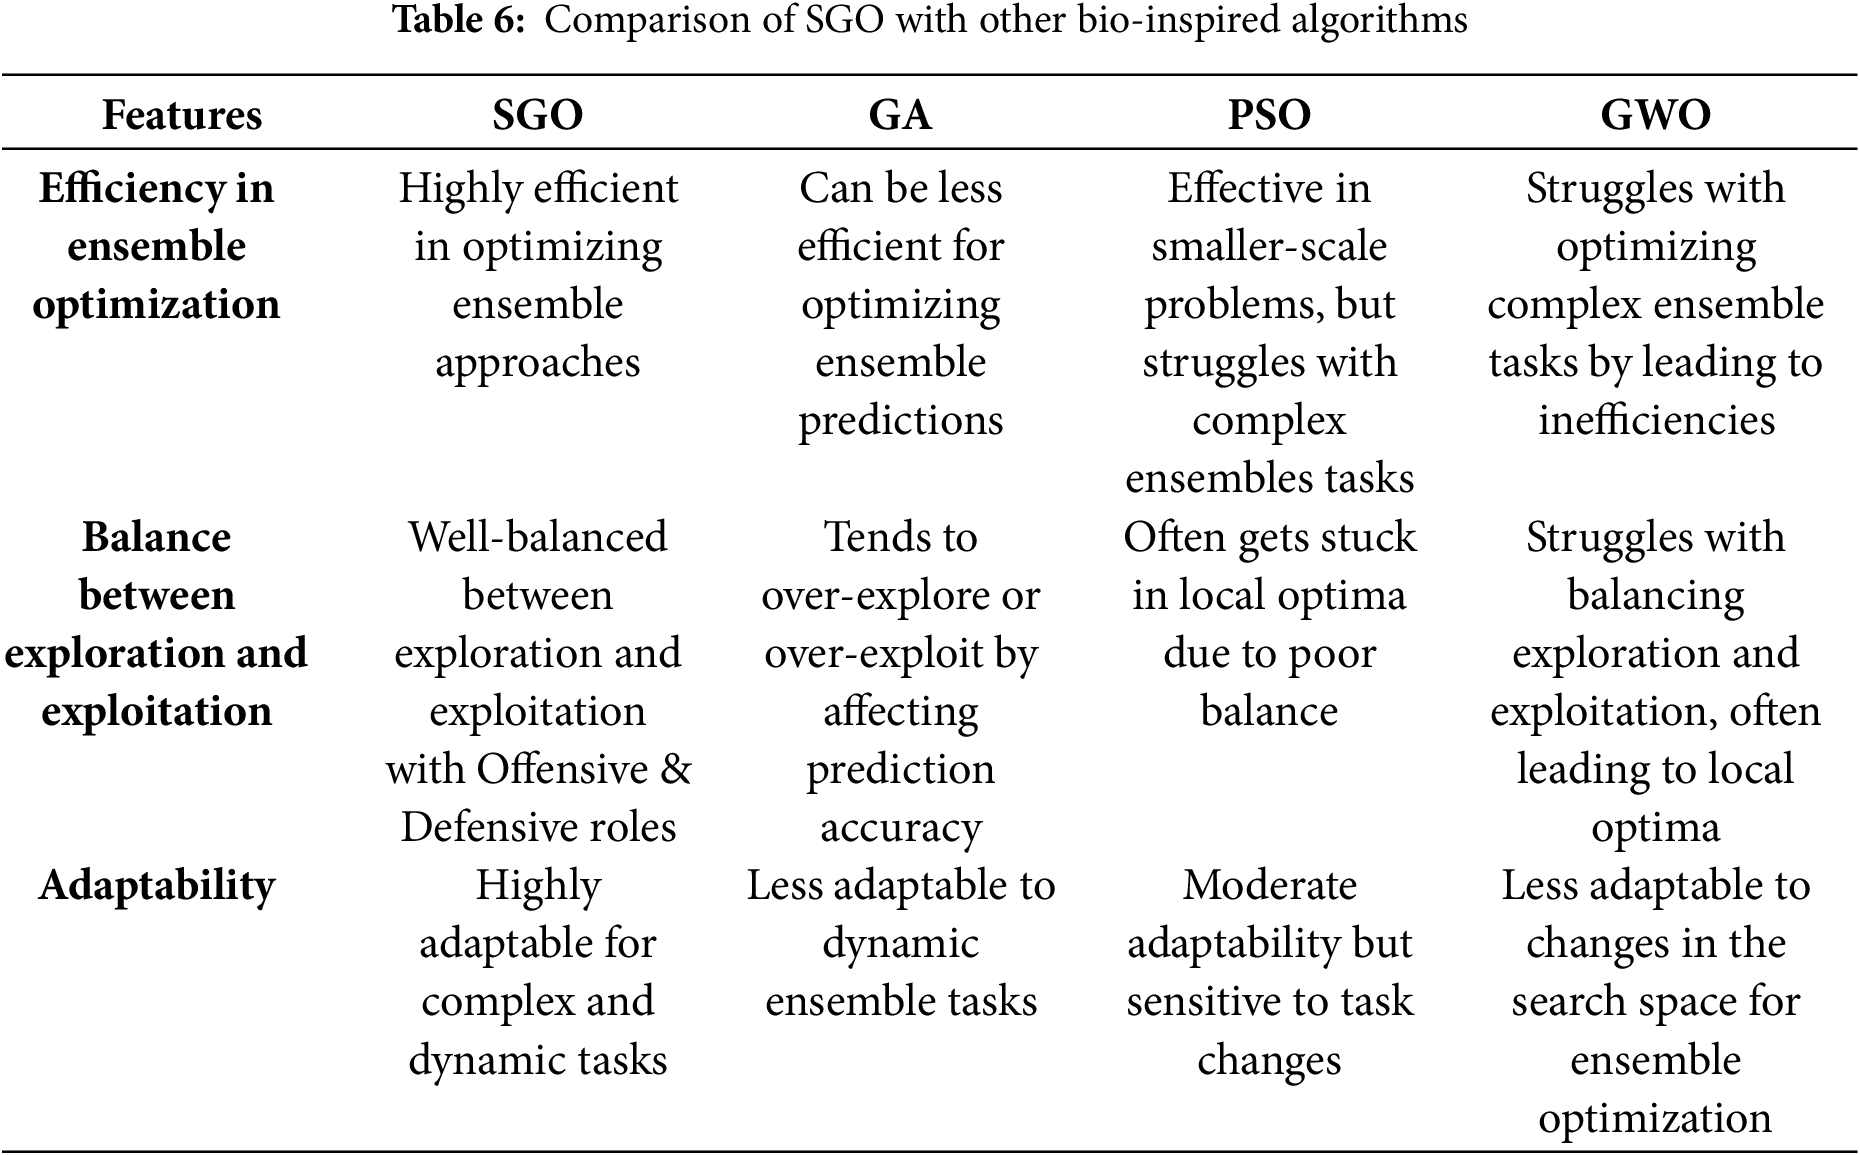
The performance of the proposed ensemble method compared with other conventional ensemble approaches is presented in Table 5. The Product Ensemble and Min Ensemble each achieve an accuracy of 97.42%, while the Max Ensemble and Weighted Average Ensemble show a marginally higher accuracy of 97.85%. The Geometric Mean Ensemble also yields an accuracy of 97.42%. The Particle swarm optimization (PSO)-based Ensemble and Grey Wolf Optimization (GWO)-based Ensemble methods each achieve an accuracy of 98.28% by demonstrating remarkable performance. However, both of these methods still lag behind the proposed SGO-based approach, which outperforms them in terms of overall classification accuracy performance. In comparison, the Proposed SGO-DRE Ensemble method outperforms all tested strategies by achieving an accuracy of 98.71%, thereby demonstrating its superior capability in enhancing classification performance. We will highlight the features which differentiate the SGO from other bio-inspired algorithms, as summarized in Table 6.
4.6 Comparing Performance of Proposed Model with Existing Studies
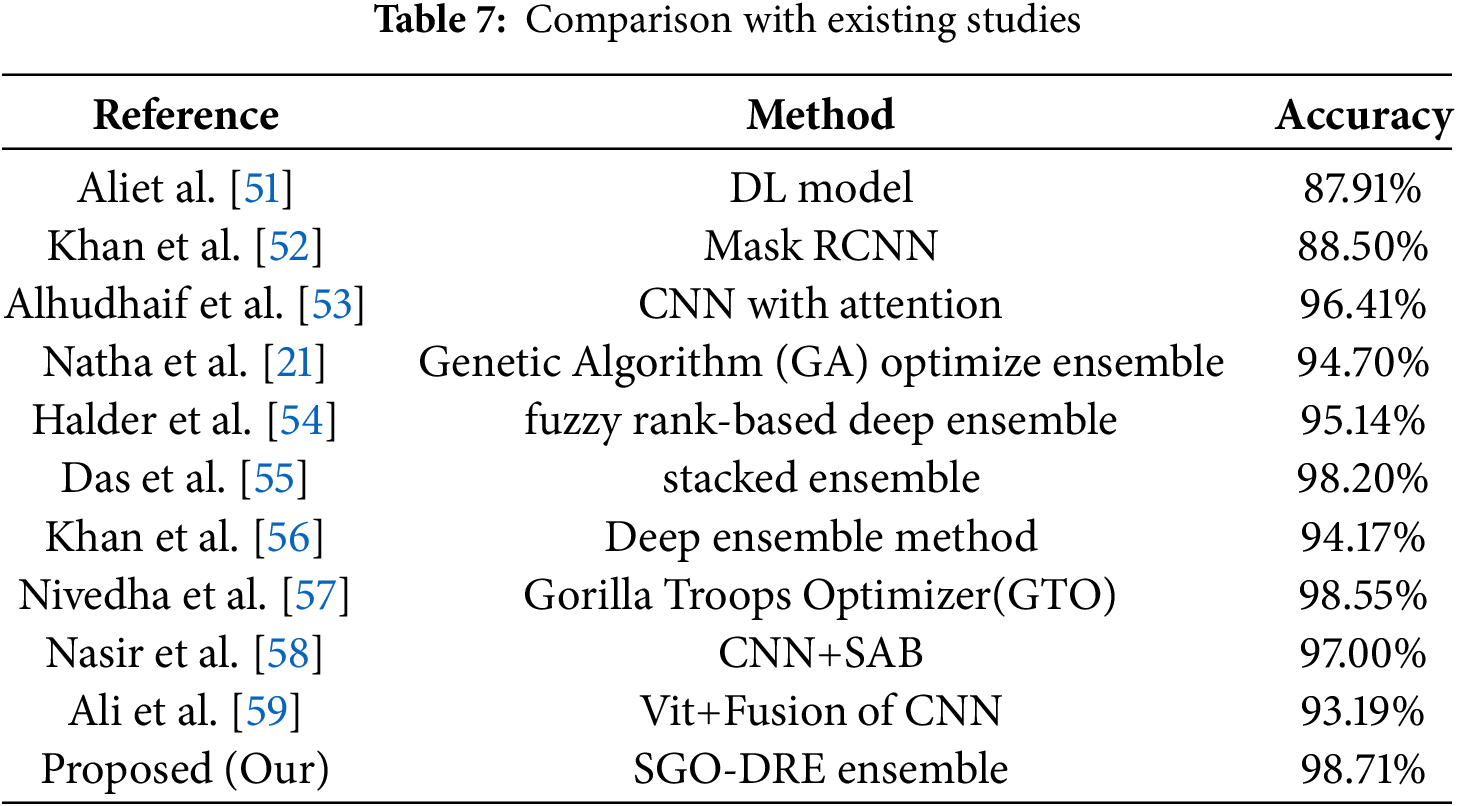
The performance of the proposed SGO-DRE Ensemble method is evaluated against recent leading techniques in skin disease classification. The other methods referenced in the comparison utilize the same dataset with similar data splitting strategies for ensuring that the accuracy values are comparable across the studies. This consistency allows for a fair and meaningful comparison of the performance of the proposed method with existing approaches. Table 7 provides a summary of the accuracy comparisons between our approach and other established methods. The SGO-DRE Ensemble achieves the highest classification accuracy of 98.71% by outperforming all compared methods including stacked ensemble with 98.20% accuracy, CNN with attention at 96.41% accuracy, and fuzzy rank-based deep ensemble with 95.14% accuracy. The method which used vision transformer with fusion of CNNs achieved slightly lower accuracy performance of 93.19%. The CNN with Spike attention Block (SAB) exhibit reasonable accuracy of 97.00%. The GTO algorithm with Faster R-CNN method achieved competitive performance of 98.55% but still lacks behind the performance of proposed method. These empirical results highlight the effectiveness of the proposed approach in efficiently capturing and leveraging significant features from skin images by resulting in enhanced diagnostic accuracy.
4.7 GradCAMs Visualization Analysis
This section showcases the GRAD-CAM visualizations and analyses applied to images depicting multiple skin disease regions, as illustrated in Fig. 10. The last row showcases random input images from various skin disease classes taken from the test samples. GRAD-CAM provides valuable insights into the areas of the images that the models identify as most relevant for classification. These visualizations highlight the regions that the model focuses on revealing the specific areas of the image that contribute to the classification decision. Notably, the heatmaps consistently demonstrate that skin disease regions are highlighted by the proposed method by aligning with the expected outcome. The uniformity of the regions identified as important is influenced by key contributing factors, which are critical for understanding how the model makes its predictions. In clinical settings, GRAD-CAM can be employed to improve interpretability by enabling dermatologists to see which areas of the images the model is concentrating on.
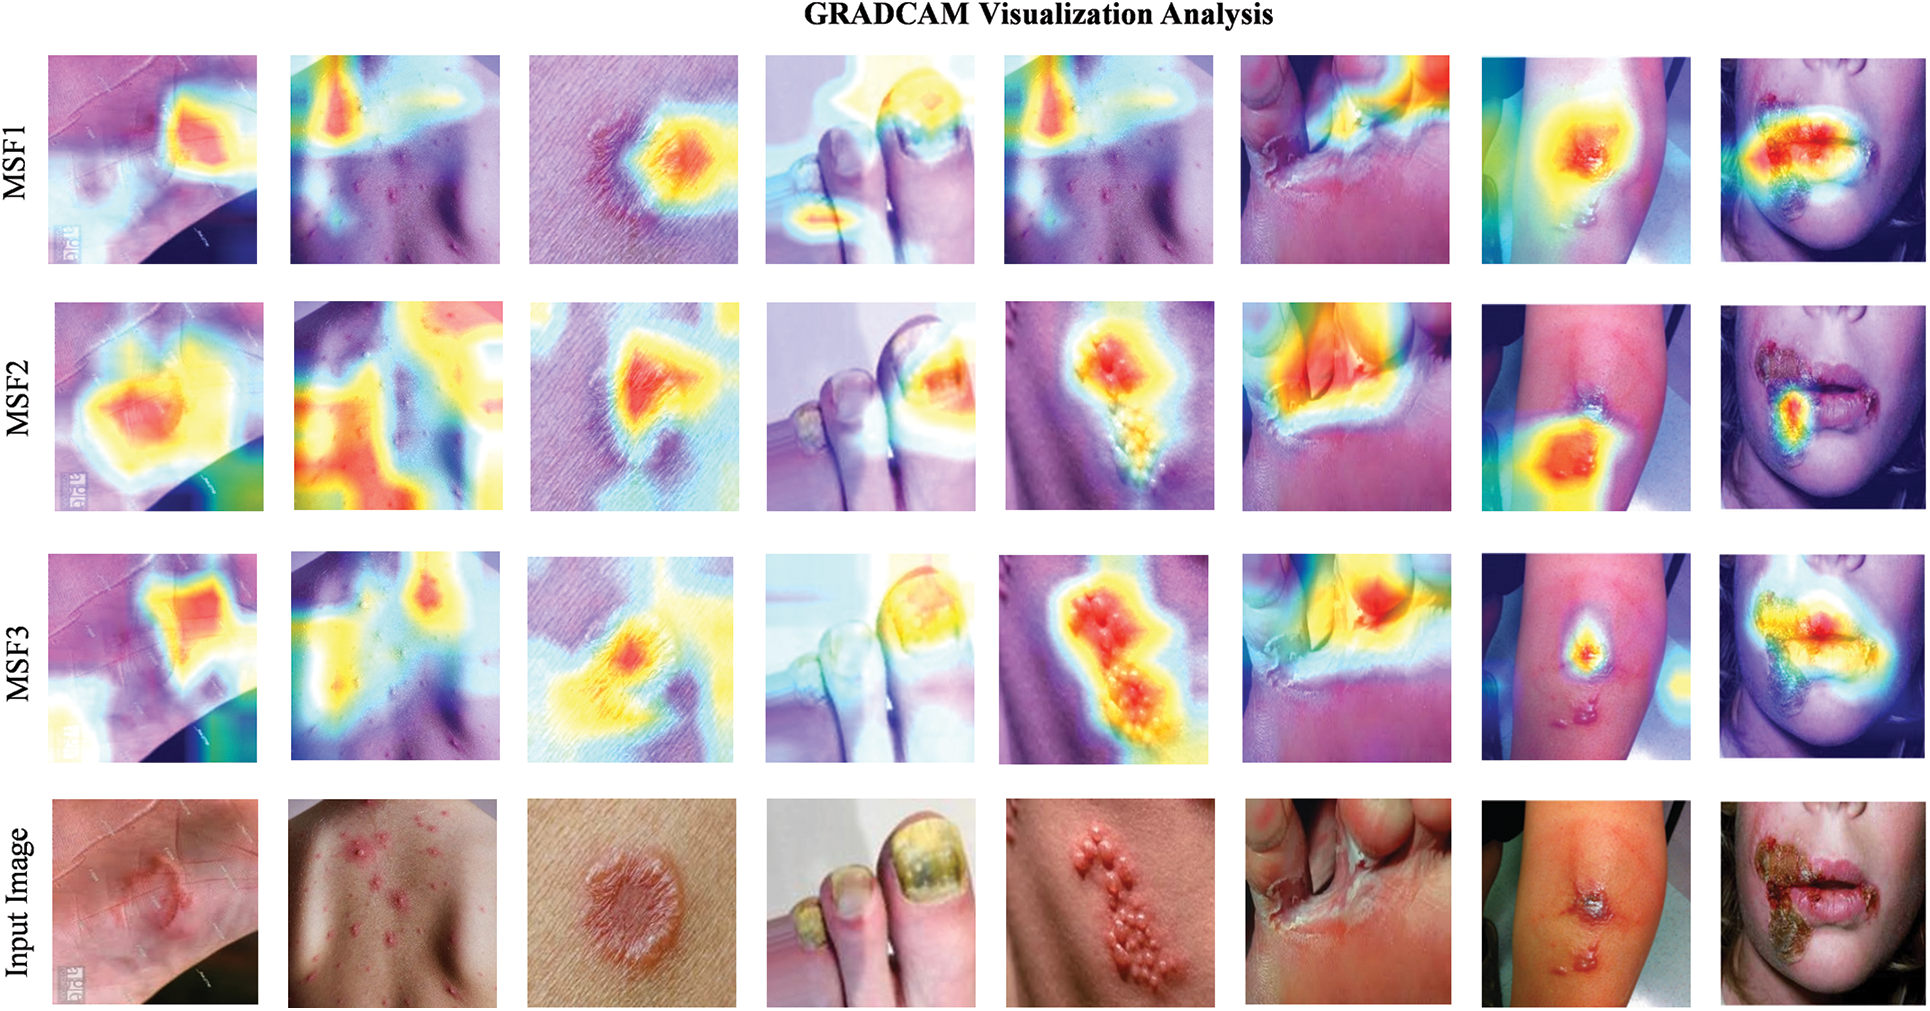
Figure 10: GRAD-CAM visualizations highlighting regions of interest in skin disease images for MSF1, MSF2, and MSF3 base models
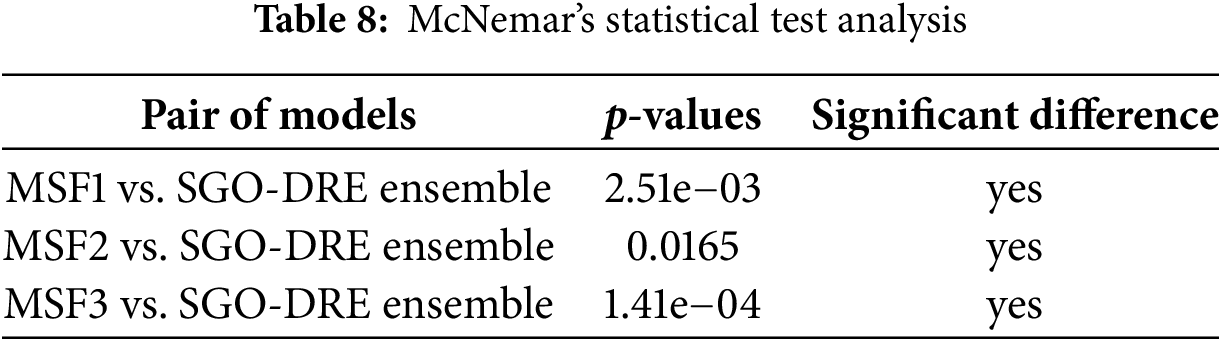
4.8 McNemar’s Statistical Tests
McNemar’s statistical test is used to evaluate the significance of performance differences between paired models on the same dataset, especially in classification tasks. It assesses whether the observed discrepancies in predictions are due to chance or reflect a true difference in performance. Table 8 presents the results of McNemar’s test, comparing the proposed SGO-DRE Ensemble model against MSF1, MSF2, and MSF3. All pairwise comparisons showed statistically significant differences (p < 0.05), with p-values of 2.51e−03, 0.0165, and 1.41e−04, respectively. These results indicate that the performance improvements of the proposed SGO-DRE Ensemble are statistically significant and unlikely to be caused by random variation by demonstrating its superiority over the three comparison models.
To further evaluate the performance of the proposed method [60,61], we considered an additional MSLD skin disease dataset consisting of six classes, which is publicly available on Kaggle [62] and can be download on the following link: https://www.kaggle.com/datasets/joydippaul/mpox-skin-lesion-dataset-version-20-msld-v20?resource=download (accessed on 10 July 2025). The dataset includes images from the following skin disease classes: Cellulitis, Impetigo, Athlete-foot, Nail-fungus, Ringworm, and Chickenpox. We trained the models again using the same experimental setup and data splitting strategy as in primary dataset case [63,64] by ensuring consistency across all evaluations. By testing this additional dataset, we aim to assess the ability of the models in diagnosing a broader range of skin diseases. The results from this testing further demonstrate the robustness and efficiency of the proposed method across diverse skin disease classifications. Fig. 11 displays images from the additional skin disease dataset, used to further evaluate the proposed method.
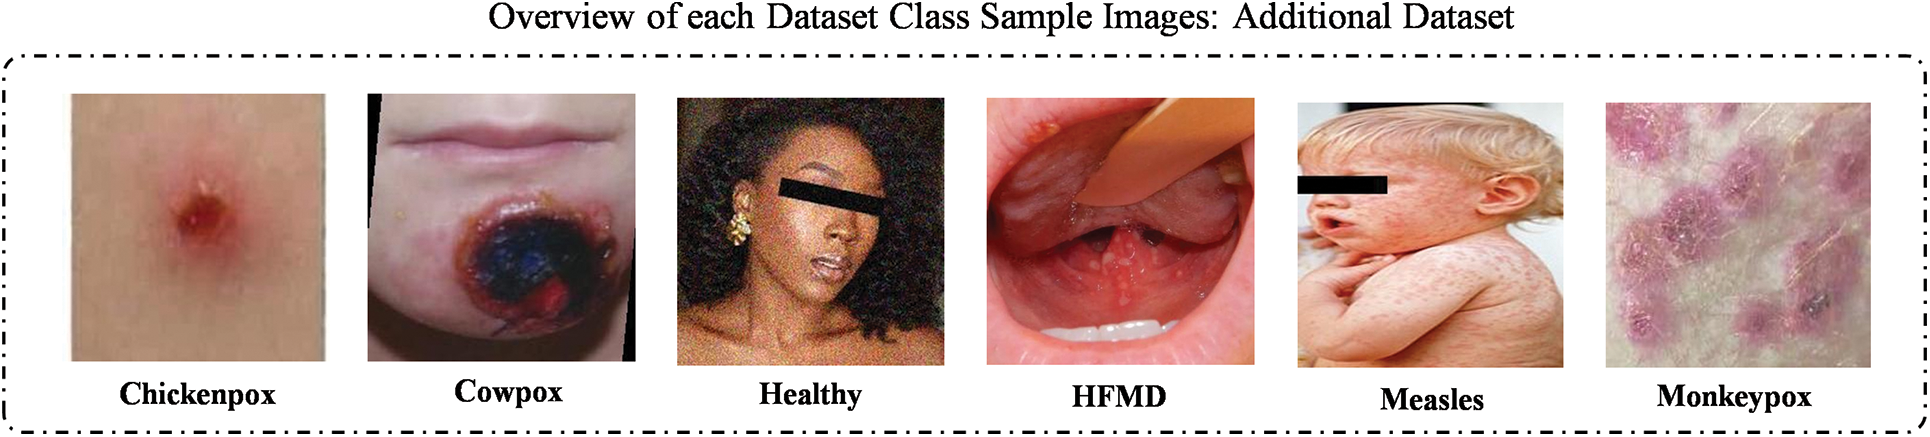
Figure 11: Sample images taken from the additional skin disease dataset
Now we will compare the performance of various base models with the proposed method using class-wise performance, as outlined in Table 9. The MSF1 model achieved the highest recall score of 96.00 for Hand, Foot, and Mouth Disease (HFMD) class by demonstrating its strong ability to correctly classify this class. However, the model faced challenges with Chickenpox, resulting in a lower recall score of 82.14. Other classes showed reasonable recall scores by indicating satisfactory performance across most categories. Overall, MSF1 achieved an accuracy of 93.09 across all classes by showcasing its effectiveness with room for improvement in certain categories. The class-wise performance analysis for the MSF2 model reveals that it achieved the highest recall score of 97.54 for HFMD by reflecting its strong ability to accurately classify this class. However, the model encountered difficulties with Chickenpox, which resulted in a lower recall score of 84.29. Other classes like Cowpox and Healthy showed reasonable recall values by demonstrating strong performance across most categories. MSF2 model achieved an overall accuracy of 95.55 across all classes, which is improved from the MSF1 model.
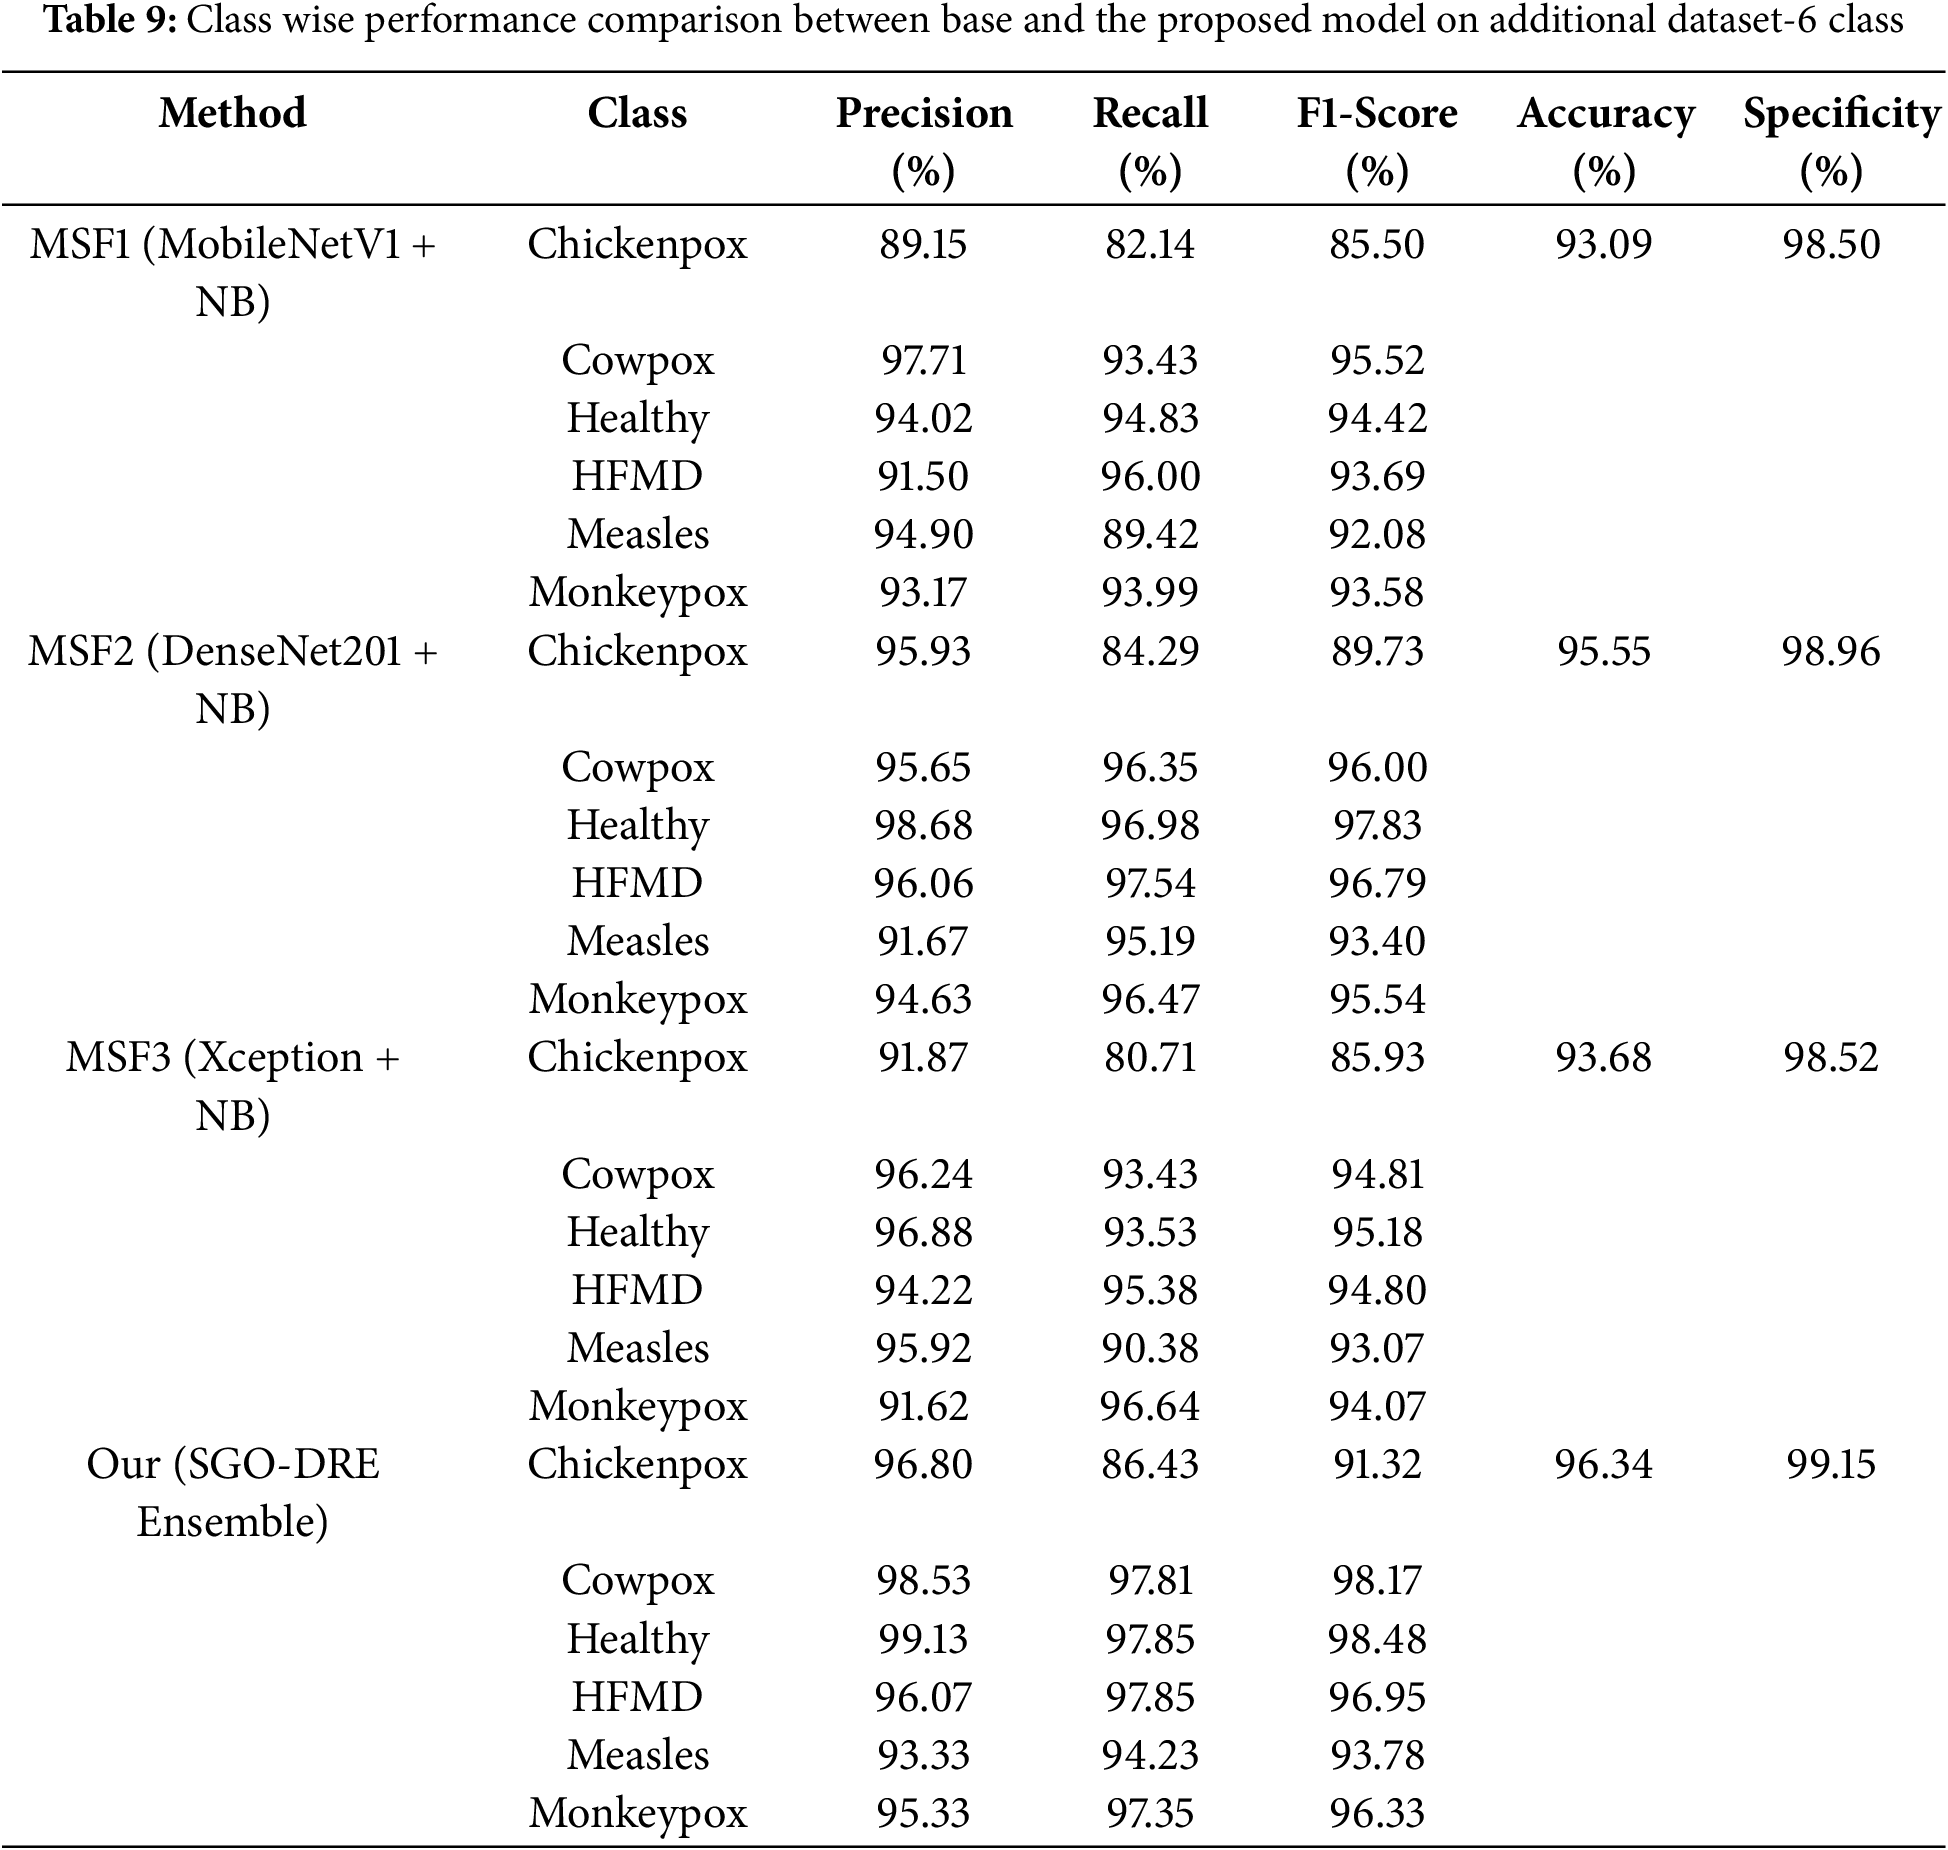
The MSF3 model demonstrates exceptional classification performance for Monkeypox class by exhibiting the highest recall score of 96.64. Chickenpox class presented a more challenging classification scenario by resulting in a lower recall score of 80.71. Despite this variation, the model maintained reasonable and consistent recall values across other classes. Ultimately, MSF3 achieved an overall accuracy of 93.68% by representing an improvement over MSF1 but still lacking behind the performance of MSF2 model. The SGO-DRE Ensemble model showcases its classification prowess through impressive recall scores, with Healthy and HFMD categories standing out at 97.84 and 97.85, respectively. While Chickenpox posed a notable challenge with a recall score of 86.43, the model demonstrated consistent performance across Cowpox, Measles, and Monkeypox categories. This advanced classification ability resulted in an overall accuracy of 96.34 by effectively outperforming individual base models and establishing the proposed method as more robust diagnostic potential. Additionally, the proposed SGO-DRE Ensemble shows superior specificity score of 99.15 compared to individual backbone models.
The confusion matrices for various base models and the proposed method in Fig. 12 were visualized using a comprehensive 6-class skin disease dataset comprising 1504 test images. In Fig. 12a, the MSF1 model demonstrated initial performance by correctly classifying 1400 images, indicating potential areas for improvement. In Fig. 12b, the MSF2 model exhibited enhanced classification capabilities, accurately identifying 1437 samples and showcasing incremental progress. In contrast, the MSF3 model in Fig. 12c displayed a slight performance regression, correctly diagnosing 1409 images and positioning itself between MSF1 and MSF2 in terms of accuracy. In Fig. 12d, the proposed SGO-DRE Ensemble method significantly outperformed previous models by accurately classifying 1449 images and minimizing misclassification to only 55 samples. This remarkable performance can be attributed to the innovative optimization-driven dynamic weighting strategy integrated into the ensemble approach. The substantial improvement highlights the effectiveness of our proposed methodology in enhancing diagnostic accuracy across complex skin disease classification tasks.
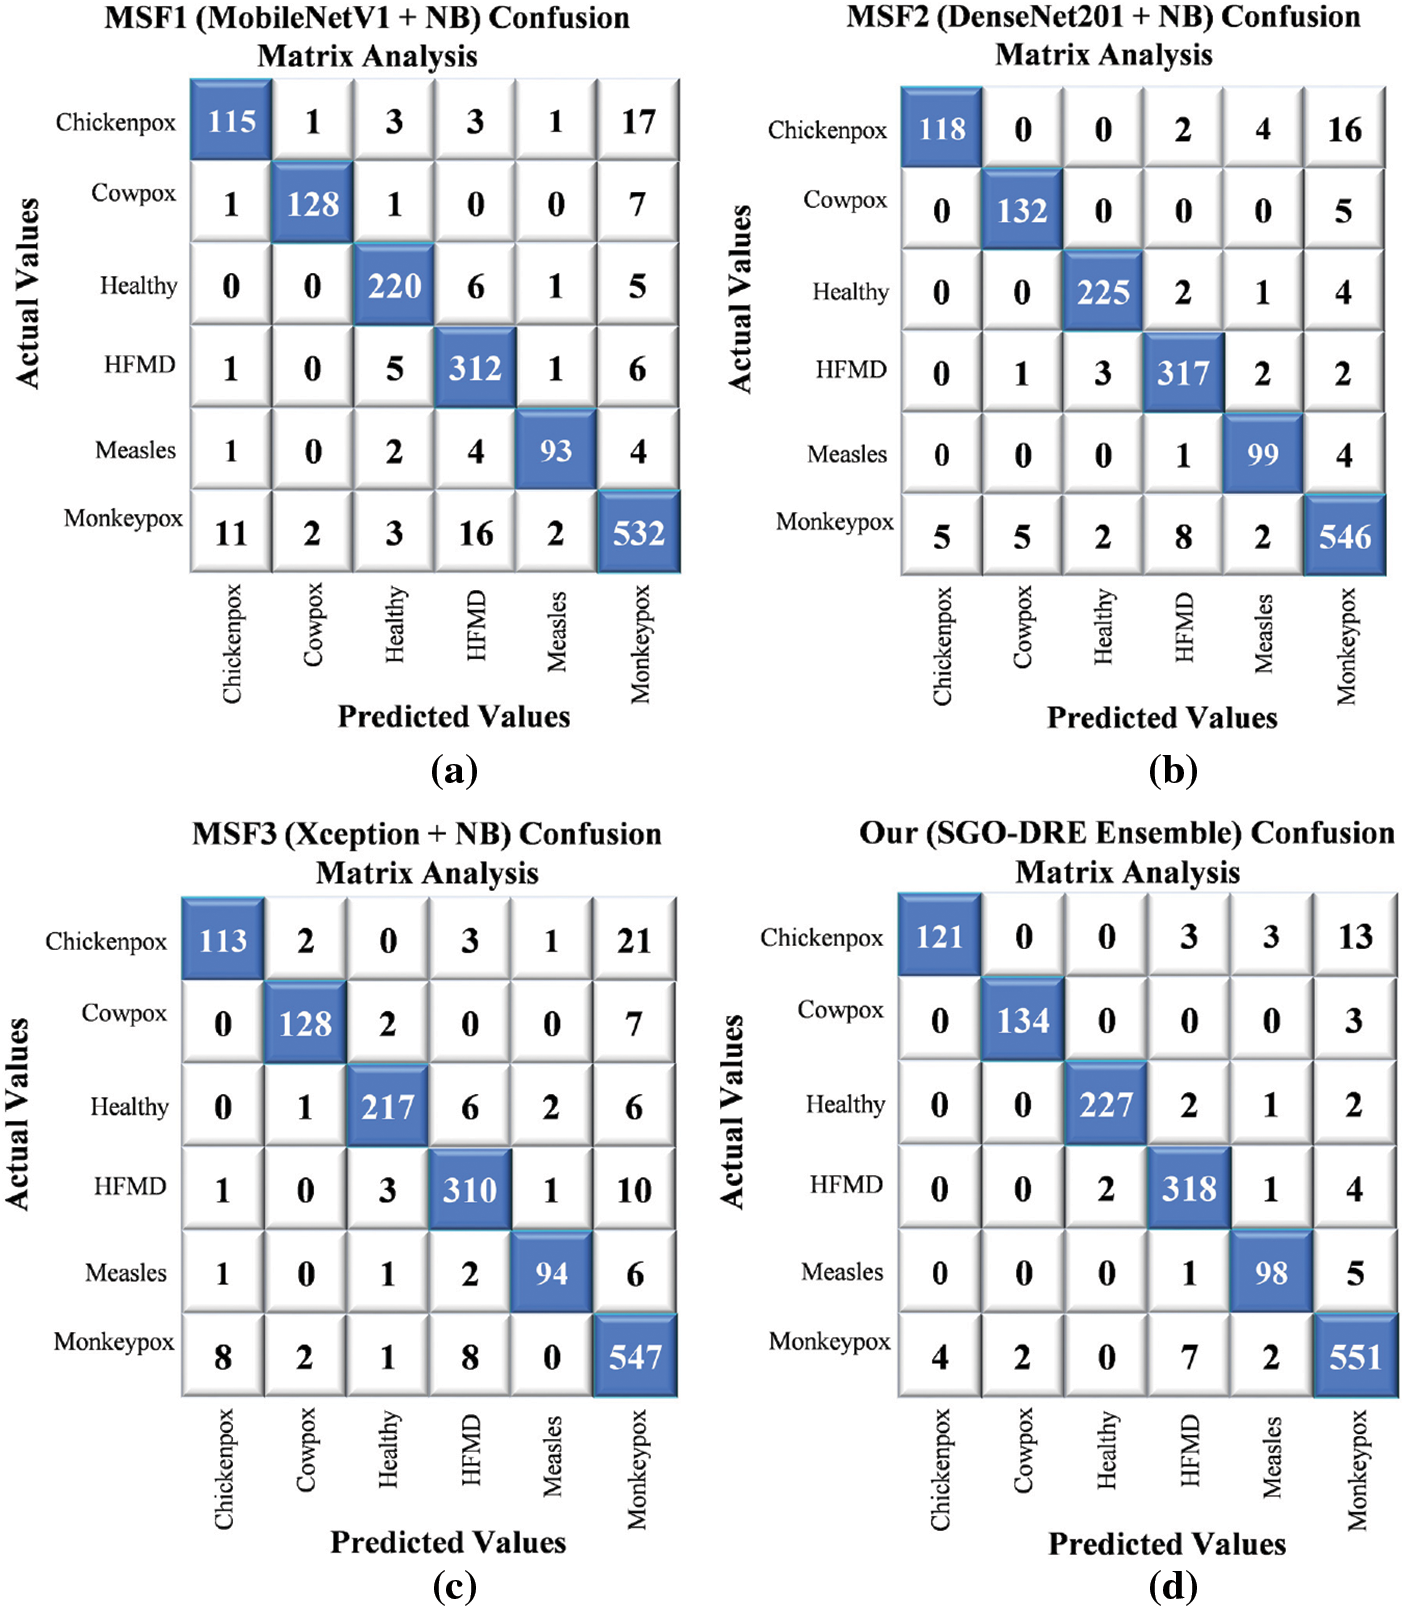
Figure 12: Confusion matrix analysis by comparing performance of (a) MSF1, (b) MSF2, (c) MSF3, and (d) Proposed SGO-DRE ensemble method on 6-class skin disease dataset
4.10 Validate Model Robustness with Unseen Dataset
In this section, we validate the robustness of the proposed method by evaluating its performance on an unseen dataset consisting of 4 skin disease classes. This MSID dataset [65] is also publicly available on Madeley and can be download from the following link: https://data.mendeley.com/datasets/r9bfpnvyxr/6 (accessed on 11 July 2025). It comprises images from Chickenpox, Measles, Normal, and Monkeypox classes. The models were tested on this additional dataset while maintaining the same data splitting strategy as in the previous evaluations. As illustrated in Fig. 13, the visualizations provide an overview of sample images from each class by demonstrating the capability of models to generalize on unseen data.
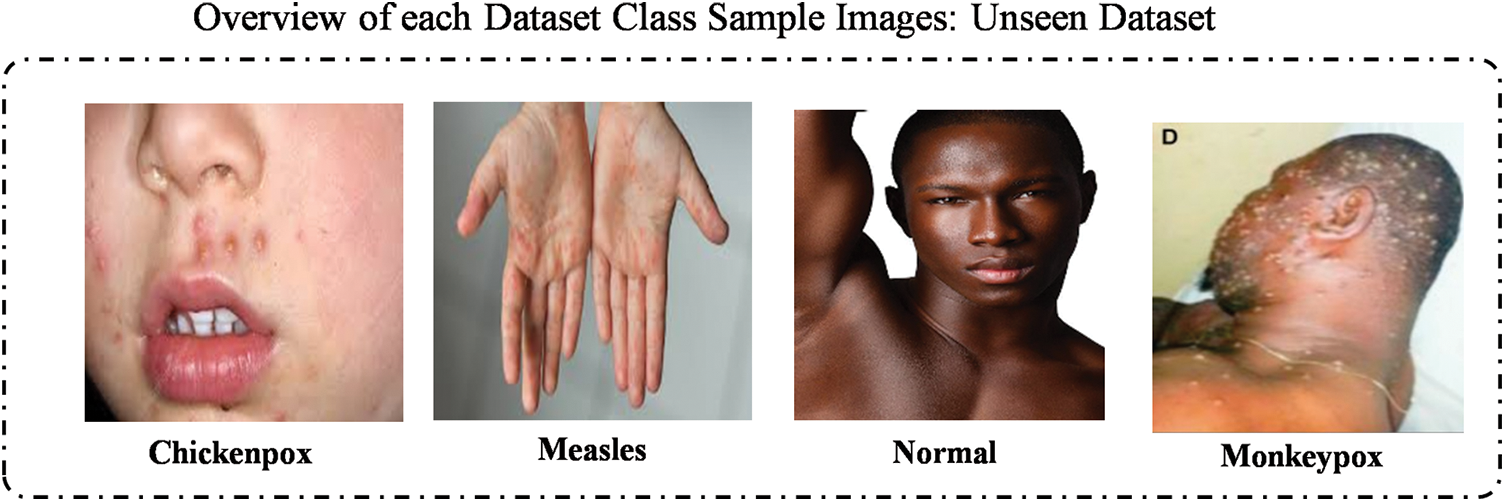
Figure 13: Illustration of samples images taken from each class within additional 4 class skin disease dataset
To comprehensively evaluate the performance of base models and the proposed method, we conducted a detailed class-wise performance analysis on the 4-class dataset, as presented in Table 10. The MSF1 model excelled in Normal and Monkeypox classes by achieving impressive recall scores of 98.28 and 96.43, respectively. However, significant challenges emerged with Chickenpox and Measles classes, where lower recall scores of 66.67 and 77.79 indicated potential limitations in the diagnostic performance of model. Consequently, MSF1 attained an overall accuracy of 90.85% by demonstrating moderate performance with clear opportunities for targeted improvement in underperforming categories. For MSF2 model, it demonstrated exceptional performance in the Normal class by achieving a remarkable recall score of 98.28. Monkeypox class also exhibited strong diagnostic capabilities with a recall score of 92.86. However, significant challenges emerged in the Chickenpox and Measles classes, with lower recall scores of 57.17 and 83.33, respectively. Compared to MSF1, MSF2 experienced a performance decline by attaining an overall accuracy of 88.89%.
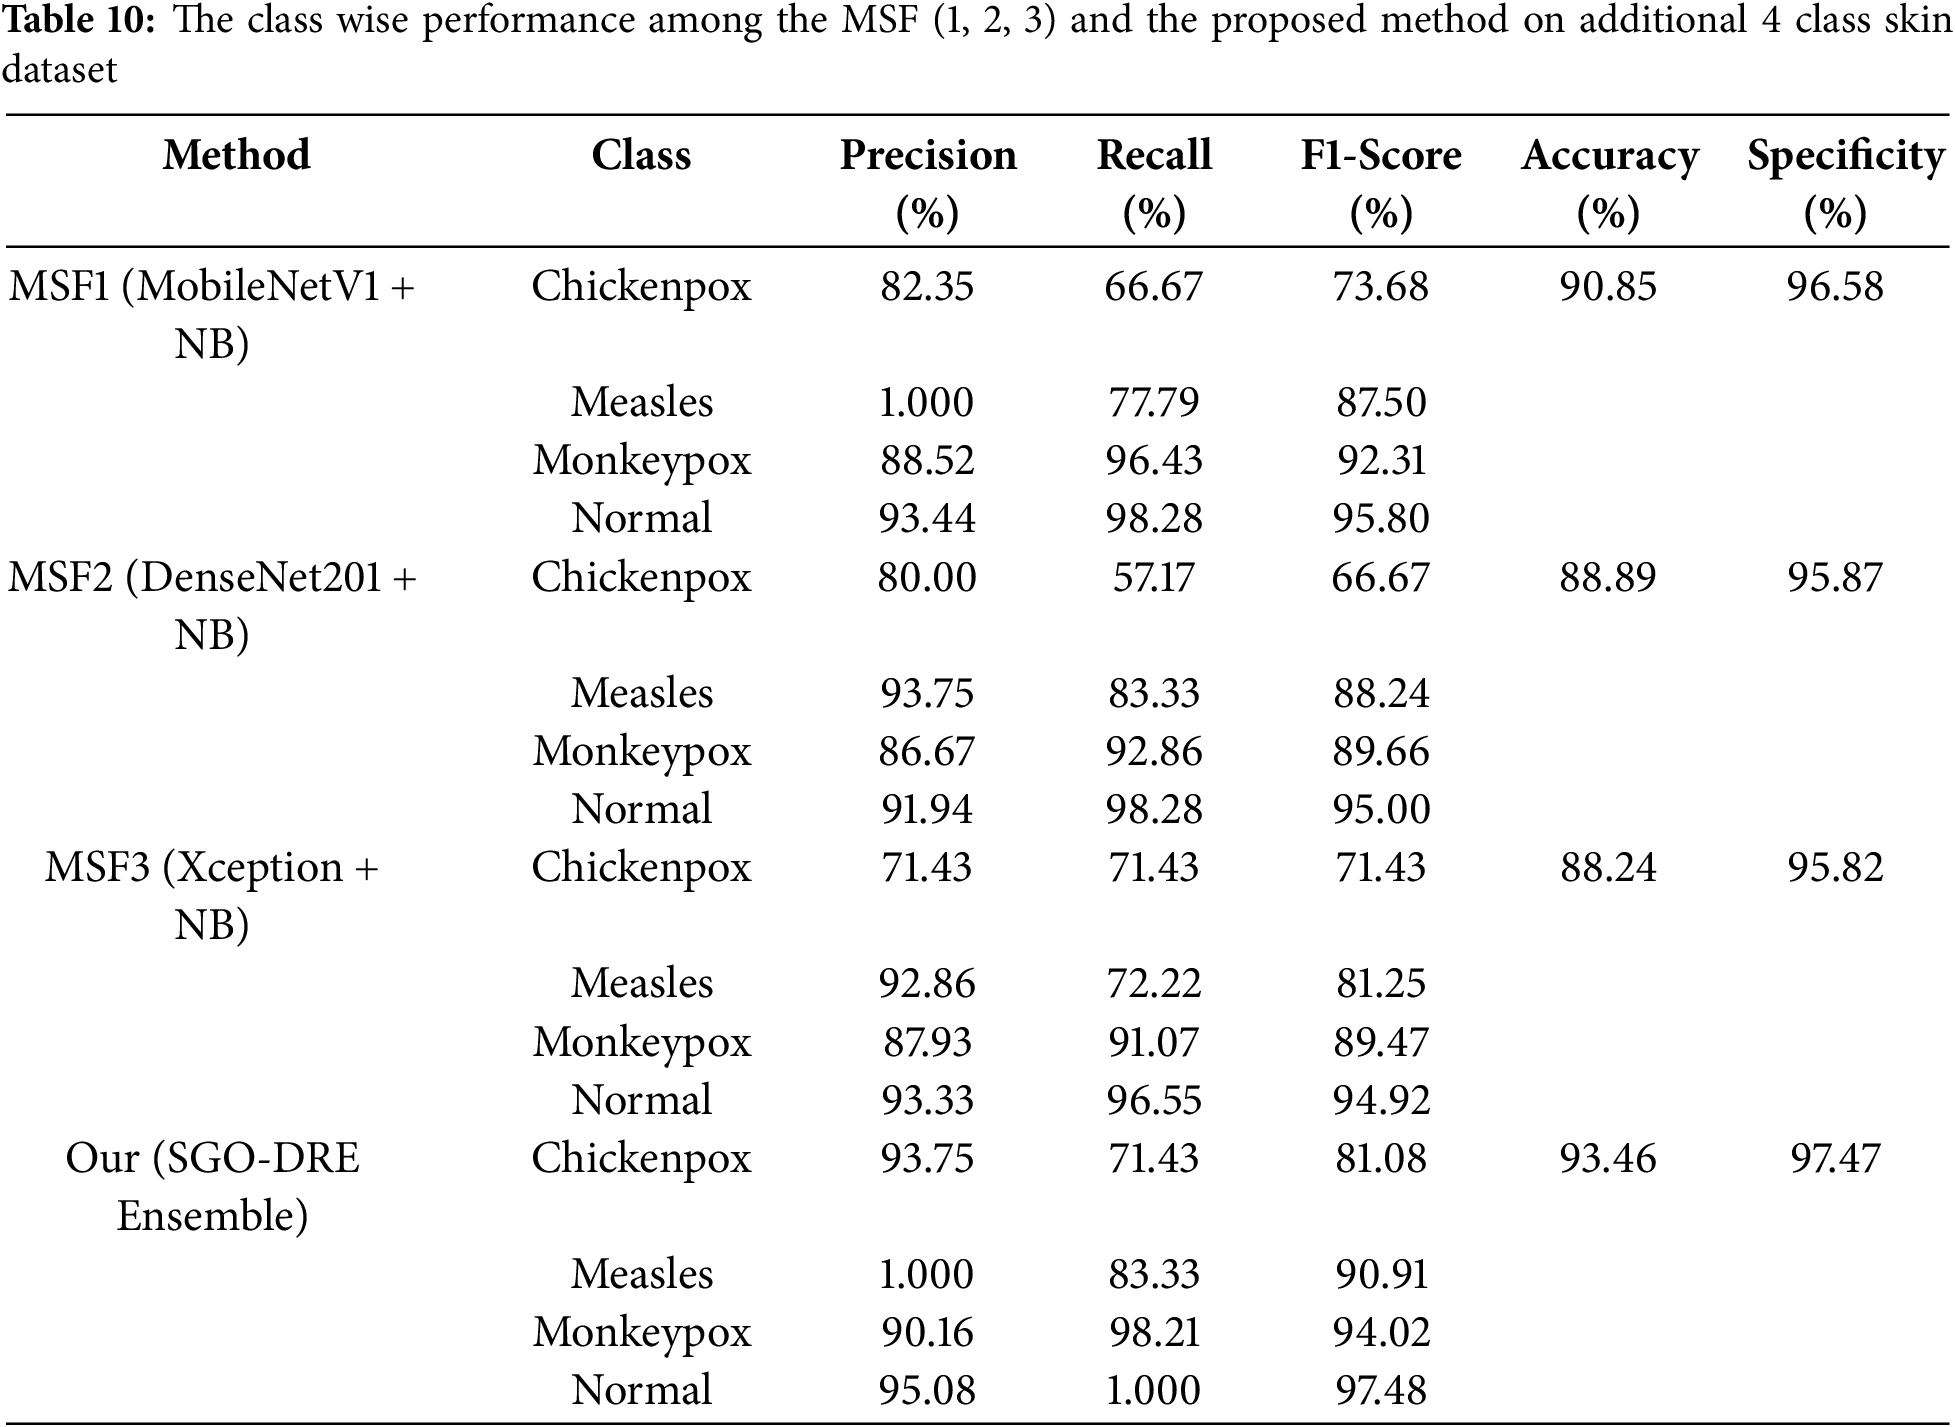
The MSF3 model demonstrated robust performance in the Normal class with a recall score of 96.55, while the Monkeypox class showed reliable diagnostic accuracy at 91.07. However, the model encountered significant classification challenges in the Chickenpox and Measles categories, with recall scores of 71.43 and 72.22, respectively. Compared to MSF1 and MSF2, it showed a decrease in performance with an overall accuracy of 88.24%. This analysis underscores the need for further improvements, particularly in the lower-performing disease categories.
Finally, the proposed SGO-DRE method reveals exceptional diagnostic capabilities by achieving a perfect recall score of 1.000 for the Normal class and a remarkable 98.21 for the Monkeypox class. While demonstrating robust performance in the Measles category with a recall score of 83.33, the model encountered classification challenges in the Chickenpox class with a recall score of 71.43. Despite these performance variations, the SGO-DRE method clearly outperformed all base models with an impressive overall accuracy of 93.46%. This comprehensive evaluation confirms the superior classification capabilities of the proposed method across multiple skin disease categories. In case of specificity, the proposed method also surpassed other backbone models with the score of 97.47 on addition asking disease 4 class dataset.
The confusion matrix visualization in Fig. 14 presents a comprehensive analysis of various base models and the proposed method across a 4-class skin disease dataset by utilizing 153 test images. The MSF1 model in Fig. 14a demonstrated initial performance by correctly classifying 139 images. The MSF2 model in Fig. 14b showed a marginal performance variation with accurately identifying 136 samples by suggesting slight inconsistencies in classification. The MSF3 model in Fig. 14c experienced a further performance decline with 135 images correctly diagnosing and highlighting the need for further improvement. In contrast, the proposed SGO-DRE Ensemble method in Fig. 14d exhibited remarkable performance by accurately classifying 143 images and misclassifying only 10 samples. This significant improvement underscores the superior classification accuracy and reduced error rate of the proposed method compared to individual base models, demonstrating the effectiveness of the optimized ensemble approach in medical image diagnostics.
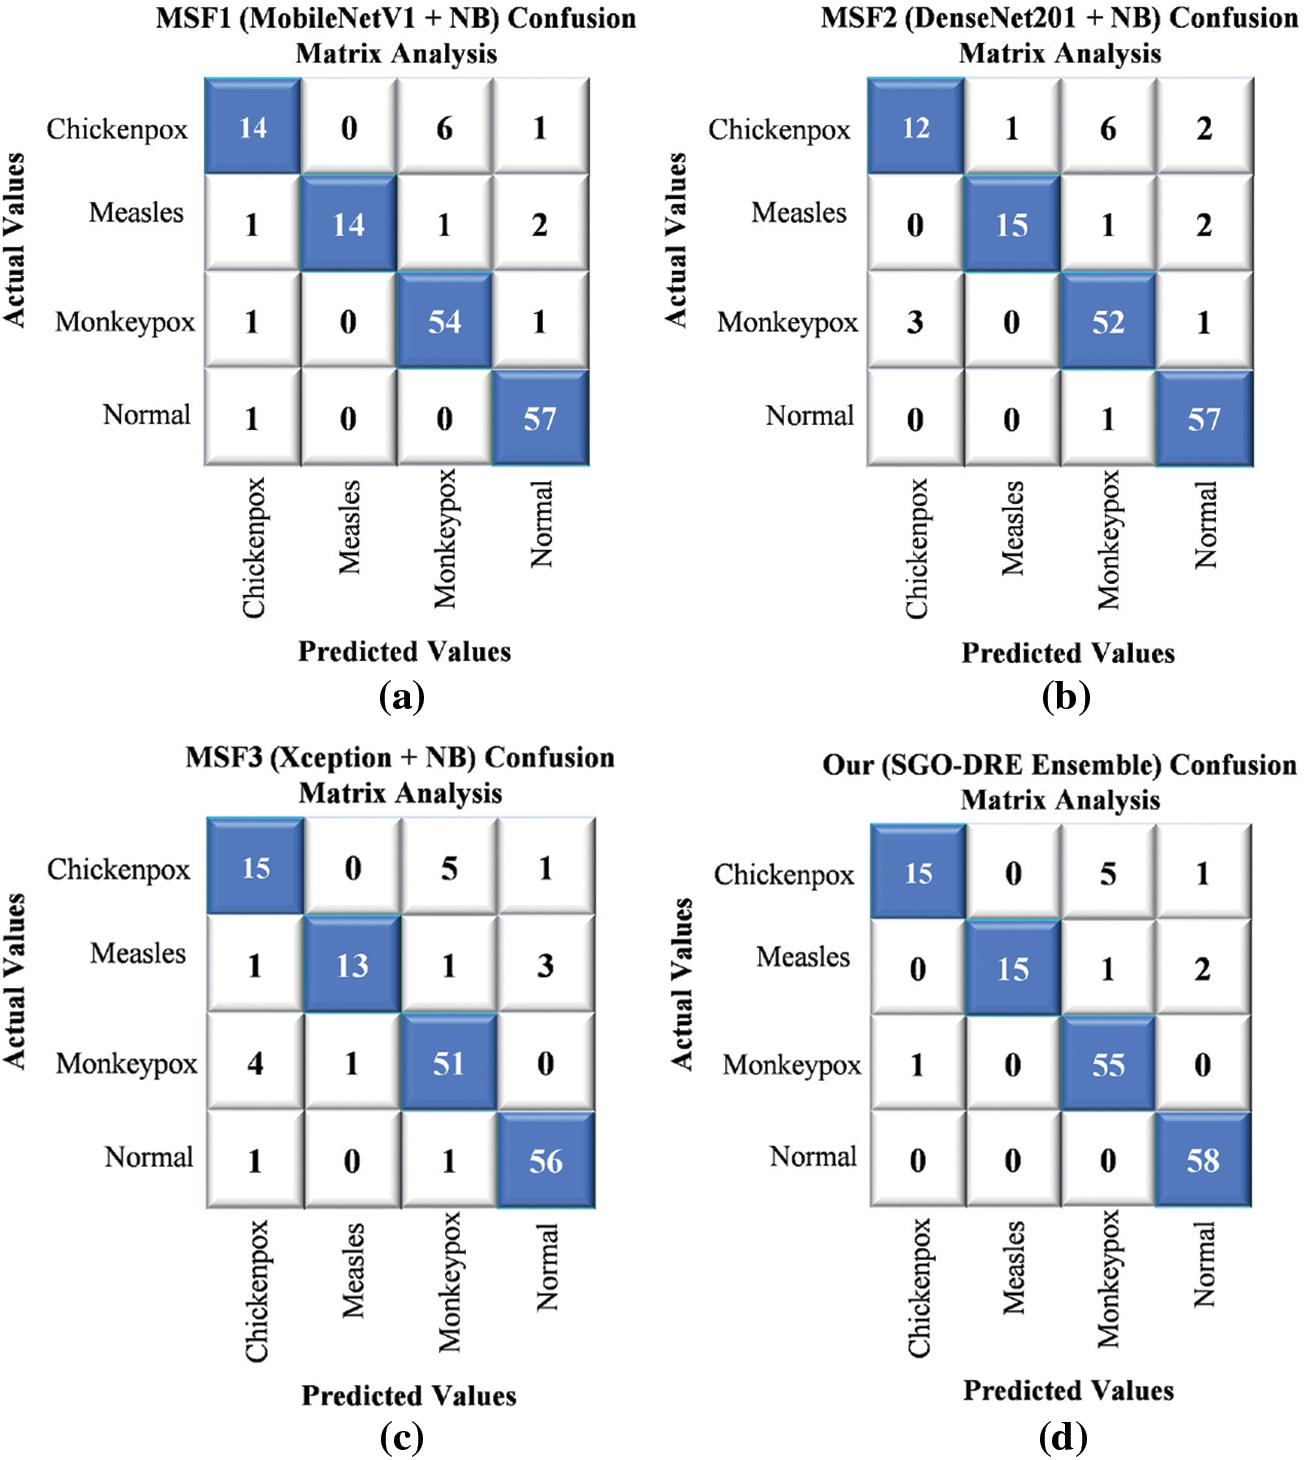
Figure 14: Comparative performance evaluation through confusion matrices for (a) MSF1, (b) MSF2, (c) MSF3, and (d) Proposed SGO-DRE ensemble method on 4-class skin disease dataset
4.11 Limitation and Advantages
Adding the dimension reduction block introduces some computational cost. However, the overall model size remains smaller compared to transformer-based models and other deep architectures. Dimension reduction reduces the feature space by leading to faster computation and more efficient memory usage, thereby enhancing the model’s efficiency and improvements. In future work, we aim to optimize this block further to strike a better balance between efficiency and performance.
The effectiveness of the model is significantly influenced by the quality and variety of the training dataset. When the dataset is not diverse or exhibits biases, the model may face challenges in generalizing well to new unseen data.
The class imbalance in the dataset poses a challenge by causing biased model training. While data augmentation has been employed to increase data diversity and mitigate this issue, it alone is insufficient to fully address this problem. Advanced techniques such as focal loss or sampling strategies are required to address the imbalance more effectively. These approaches will be incorporated in future work to improve the performance and generalization of model across all classes.
The use of the Squid Game Optimization algorithm allows for optimal weightage assignment across the ensemble models, effectively utilizing the strengths of each model. This results in a more reliable and precise classification performance.
Using a dimension reduction block within each DL model reduces data complexity, speeds up training and inference, and prevents overfitting by eliminating irrelevant features by leading to improved generalization on unseen data.
In this study, we developed the SGO-DRE method to address the limitations of conventional skin disease diagnostic approaches, which are often time-consuming and prone to errors. By leveraging pre-trained models such as MobileNetV1, DenseNet201, and Xception for robust feature extraction, we enhanced their performance by incorporating dimension reduction blocks. This methodology ensures efficient feature processing while maintaining accuracy. Furthermore, the use of the SGO algorithm allowed us to effectively solve the aggregation problem by optimizing the weightage of individual models within the ensemble. Our approach was evaluated on three distinct skin disease datasets: an 8-class skin disease dataset, a 6-class MSLD dataset, and a 4-class MSID dataset. The results demonstrated the effectiveness of the proposed method, achieving accuracies of 98.71%, 96.34%, and 93.46%, respectively. Additionally, visual analysis through Grad-CAM and performance metrics like ROC and Precision-Recall curves provided valuable insights into model behavior and performance, further validating the robustness and interpretability of the SGO-DRE ensemble. Overall, this study successfully highlights the potential of the SGO-DRE method to improve the accuracy and efficiency of skin disease diagnosis. The approach not only outperforms existing models but also provides a transparent and interpretable solution that can be trusted in clinical settings.
Acknowledgement: The authors would like to acknowledge the Princess Nourah bint Abdulrahman University Researchers Supporting Project number (PNURSP2025R749), Princess Nourah bint Abdulrahman University, Riyadh, Saudi Arabia. The author would also like to acknowledge Prince Sultan University and EIAS Lab for their valuable support.
Funding Statement: This research was funded by Princess Nourah bint Abdulrahman University Researchers Supporting Project number (PNURSP2025R749), Princess Nourah bint Abdulrahman University, Riyadh, Saudi Arabia. Also, the authors would like to acknowledge the support of Prince Sultan University.
Author Contributions: Conceptualization, Areeba Masood Siddiqui, Hyder Abbas, Muhammad Asim, Abdelhamied A. Ateya, and Hanaa A. Abdallah; methodology, Areeba Masood Siddiqui, Hyder Abbas, Muhammad Asim, Abdelhamied A. Ateya, and Hanaa A. Abdallah; software, Areeba Masood Siddiqui, Hyder Abbas, Muhammad Asim, Abdelhamied A. Ateya, and Hanaa A. Abdallah; validation, Areeba Masood Siddiqui, Hyder Abbas, Muhammad Asim, Abdelhamied A. Ateya, and Hanaa A. Abdallah; formal analysis, Areeba Masood Siddiqui, Hyder Abbas, Muhammad Asim, Abdelhamied A. Ateya, and Hanaa A. Abdallah; investigation, Areeba Masood Siddiqui, Hyder Abbas, Muhammad Asim, Abdelhamied A. Ateya, and Hanaa A. Abdallah; resources, Areeba Masood Siddiqui, Hyder Abbas, Muhammad Asim, Abdelhamied A. Ateya, and Hanaa A. Abdallah; data curation, Areeba Masood Siddiqui, Hyder Abbas, Muhammad Asim, Abdelhamied A. Ateya, and Hanaa A. Abdallah; writing—original draft preparation, Areeba Masood Siddiqui, Hyder Abbas, Muhammad Asim, Abdelhamied A. Ateya, and Hanaa A. Abdallah; writing—review and editing, Areeba Masood Siddiqui, Hyder Abbas, Muhammad Asim, Abdelhamied A. Ateya, and Hanaa A. Abdallah; visualization, Areeba Masood Siddiqui, Hyder Abbas, Muhammad Asim, Abdelhamied A. Ateya, and Hanaa A. Abdallah; supervision, Areeba Masood Siddiqui, Hyder Abbas, Muhammad Asim, Abdelhamied A. Ateya, and Hanaa A. Abdallah; project administration, Areeba Masood Siddiqui, Hyder Abbas, Muhammad Asim, Abdelhamied A. Ateya, and Hanaa A. Abdallah; funding acquisition, Areeba Masood Siddiqui, Hyder Abbas, Muhammad Asim, Abdelhamied A. Ateya, and Hanaa A. Abdallah. All authors have equal contribution to the published version of the manuscript. All authors reviewed the results and approved the final version of the manuscript.
Availability of Data and Materials: The datasets generated or analyzed during the current study are available from the Kaggle directory: https://www.kaggle.com/datasets/subirbiswas19/skin-disease-dataset/data (accessed on 10 August 2025).
Ethical Approval: Not applicable.
Conflicts of interest: The authors declare no conflicts of interest to report regarding the present study.
Abbreviation
| ML | Machine Learning |
| DL | Deep Learning |
| TL | Transfer Learning |
| CNN | Convolution Neural Network |
| SGO-DRE | Squid Game Optimization-Dimension Reduction-based Ensemble |
| MSF | Multiscale Fusion |
| SGO | Squid Game Optimization |
| CAD | Computer-aided Diagnostic |
References
1. Sriharikrishnaa S, Suresh PS, Prasada KS. An introduction to fundamentals of cancer biology. In: Optical polarimetric modalities for biomedical research. Berlin/Heidelberg, Germany: Springer; 2023. p. 307–30 doi:10.1007/978-3-031-31852-8_11. [Google Scholar] [CrossRef]
2. Roky AH, Islam MM, Ahasan AMF, Mostaq MS, Mahmud MZ, Amin MN, et al. Overview of skin cancer types and prevalence rates across continents. Cancer Pathog Ther. 2025;3(2):89–100. doi:10.1016/j.cpt.2024.08.002. [Google Scholar] [PubMed] [CrossRef]
3. Ahmed B, Qadir MI, Ghafoor S. Malignant melanoma: skin cancer−diagnosis, prevention, and treatment. Crit RevTM Eukaryot Gene Expr. 2020;30(4):291–7. doi:10.1615/critreveukaryotgeneexpr.2020028454. [Google Scholar] [PubMed] [CrossRef]
4. Anand V, Gupta S, Koundal D, editors. Skin disease diagnosis: challenges and opportunities. In: Proceedings of Second Doctoral Symposium on Computational Intelligence: DoSCI 2021; 2021 Mar 6; Lucknow, India. [Google Scholar]
5. Laughter MR, Maymone MB, Karimkhani C, Rundle C, Hu S, Wolfe S, et al. The burden of skin and subcutaneous diseases in the United States from 1990 to 2017. JAMA Dermatol. 2020;156(8):874–81. doi:10.1001/jamadermatol.2020.1573. [Google Scholar] [PubMed] [CrossRef]
6. Alwahaibi N, Alwahaibi M. Mini review on skin biopsy: traditional and modern techniques. Front Med. 2025;12:1476685. doi:10.3389/fmed.2025.1476685. [Google Scholar] [PubMed] [CrossRef]
7. Zhang J, Zhong F, He K, Ji M, Li S, Li C. Recent advancements and perspectives in the diagnosis of skin diseases using machine learning and deep learning: a review. Diagnostics. 2023;13(23):3506. doi:10.3390/diagnostics13233506. [Google Scholar] [PubMed] [CrossRef]
8. Khan MA, Akram T, Sharif M, Javed K, Rashid M, Bukhari SAC. An integrated framework of skin lesion detection and recognition through saliency method and optimal deep neural network features selection. Neural Comput Appl. 2020;32(20):15929–48. doi:10.1007/s00521-019-04514-0. [Google Scholar] [CrossRef]
9. Huang H-Y, Hsiao Y-P, Karmakar R, Mukundan A, Chaudhary P, Hsieh S-C, et al. A review of recent advances in computer-aided detection methods using hyperspectral imaging engineering to detect skin cancer. Cancers. 2023;15(23):5634. doi:10.3390/cancers15235634. [Google Scholar] [PubMed] [CrossRef]
10. Bilal O, Asif S, Zhao M, Li Y, Tang F, Zhu Y. Differential evolution optimization based ensemble framework for accurate cervical cancer diagnosis. Appl Soft Comput. 2024 1;167(1):112366. doi:10.1016/j.asoc.2024.112366. [Google Scholar] [CrossRef]
11. Hekmat A, Zhang Z, Khan SU, Shad I, Bilal O. An attention-fused architecture for brain tumor diagnosis. Biomed Signal Process Control. 2025;101:107221. doi:10.1016/j.bspc.2024.107221. [Google Scholar] [CrossRef]
12. Khan SU, Asif S, Bilal O. Ensemble architecture of vision transformer and CNNs for breast cancer tumor detection from mammograms. Int J Imaging Syst Technol. 2025;35(3):e70090. doi:10.1002/ima.70090. [Google Scholar] [CrossRef]
13. Khan SUR, Asif S, Bilal O, Rehman HU. Lead-cnn: lightweight enhanced dimension reduction convolutional neural network for brain tumor classification. Int J Mach Learn Cybern. 2025;19(5):1–20. doi:10.1007/s13042-025-02637-6. [Google Scholar] [CrossRef]
14. Bilal O, Asif S. A lightweight neural network with feature-level fusion and attention mechanisms for brain tumor classification. Multiscale Multidiscip Model Exp Des. 2025;8(6):1–19. doi:10.1007/s41939-025-00889-x. [Google Scholar] [CrossRef]
15. Khan SUR, Asif S, Bilal O, Ali S. Deep hybrid model for Mpox disease diagnosis from skin lesion images. Int J Imaging Syst Technol. 2024;34(2):e23044. doi:10.1002/ima.23044. [Google Scholar] [CrossRef]
16. Fu’adah YN, Pratiwi NC, Ibrahim N, editors. Convolutional neural network (CNN) for automatic skin cancer classification system. In: Proceedings of the IOP Conference Series: Materials Science and Engineering; 2020 Sep 2–3; Purbalingga, Indonesia. doi:10.1088/1757-899x/982/1/012005. [Google Scholar] [CrossRef]
17. Nawaz K, Zanib A, Shabir I, Li J, Wang Y, Mahmood T, et al. Skin cancer detection using dermoscopic images with convolutional neural network. Sci Rep. 2025;15(1):7252. doi:10.1038/s41598-025-91446-6. [Google Scholar] [PubMed] [CrossRef]
18. Bakheet S, Alsubai S, El-Nagar A, Alqahtani A. A multi-feature fusion framework for automatic skin cancer diagnostics. Diagnostics. 2023;13(8):1474. doi:10.3390/diagnostics13081474. [Google Scholar] [PubMed] [CrossRef]
19. Khan SUR, Zhao M, Li Y. Detection of MRI brain tumor using residual skip block based modified MobileNet model. Clust Comput. 2025;28(4):248. doi:10.1007/s10586-024-04940-3. [Google Scholar] [CrossRef]
20. Khan SUR. Multi-level feature fusion network for kidney disease detection. Comput Biol Med. 2025;191(1):110214. doi:10.1016/j.compbiomed.2025.110214. [Google Scholar] [PubMed] [CrossRef]
21. Natha P, Tera SP, Chinthaginjala R, Rab SO, Narasimhulu CV, Kim TH. Boosting skin cancer diagnosis accuracy with ensemble approach. Sci Rep. 2025;15(1):1290. doi:10.1038/s41598-024-84864-5. [Google Scholar] [PubMed] [CrossRef]
22. Hosseinzadeh M, Hussain D, Zeki Mahmood FM, Alenizi A, Varzeghani F, Asghari AN, et al. A model for skin cancer using combination of ensemble learning and deep learning. PLoS One. 2024;19(5):e0301275. doi:10.1371/journal.pone.0301275. [Google Scholar] [PubMed] [CrossRef]
23. Bilal O, Asif S, Zhao M, Khan SUR, Li Y. An amalgamation of deep neural networks optimized with Salp swarm algorithm for cervical cancer detection. Comput Electr Eng. 2025;123(5):110106. doi:10.1016/j.compeleceng.2025.110106. [Google Scholar] [CrossRef]
24. Khan SU, Asif S, Zhao M, Zou W, Li Y, Xiao C. ShallowMRI: a novel lightweight CNN with novel attention mechanism for Multi brain tumor classification in MRI images. Biomed Signal Process Control. 2026;111(2):108425. doi:10.1016/j.bspc.2025.108425. [Google Scholar] [CrossRef]
25. Hekmat A, Zuping Z, Bilal O, Khan SUR. Differential evolution-driven optimized ensemble network for brain tumor detection. Int J Mach Learn Cybern. 2025;11(6):1–26. doi:10.1007/s13042-025-02629-6. [Google Scholar] [CrossRef]
26. Khan Z, Khan SUR, Bilal O, Raza A, Ali G, editors. Optimizing cervical lesion detection using deep learning with particle swarm optimization. In: Proceedings of the 6th International Conference on Advancements in Computational Sciences (ICACS); 2025 Mar 27; Lahore, Pakistan. [Google Scholar]
27. Khan SUR, Asif S, Zhao M, Zou W, Li Y, Li X. Optimized deep learning model for comprehensive medical image analysis across multiple modalities. Neurocomputing. 2024;619(1):129182. doi:10.1016/j.neucom.2024.129182. [Google Scholar] [CrossRef]
28. Khan SUR, Asif S. Oral cancer detection using feature-level fusion and novel self-attention mechanisms. Biomed Signal Process Control. 2024;95(1):106437. doi:10.1016/j.bspc.2024.106437. [Google Scholar] [CrossRef]
29. Popescu D, El-Khatib M, Ichim L. Skin lesion classification using collective intelligence of multiple neural networks. Sensors. 2022;22(12):4399. doi:10.3390/s22124399. [Google Scholar] [PubMed] [CrossRef]
30. Khan SUR, Asim MN, Vollmer S, Dengel A. Robust & precise knowledge distillation-based novel context-aware predictor for disease detection in brain and gastrointestinal. arXiv:2505.06381. 2025. [Google Scholar]
31. Aquil A, Saeed F, Baowidan S, Ali AM, Elmitwally NS. Early detection of skin diseases across diverse skin tones using hybrid machine learning and deep learning models. Information. 2025;16(2):152. doi:10.3390/info16020152. [Google Scholar] [CrossRef]
32. Shanthi T, Sabeenian R, Anand R. Automatic diagnosis of skin diseases using convolution neural network. Microprocess Microsyst. 2020;76(1):103074. doi:10.1016/j.micpro.2020.103074. [Google Scholar] [CrossRef]
33. Bajwa MN, Muta K, Malik MI, Siddiqui SA, Braun SA, Homey B, et al. Computer-aided diagnosis of skin diseases using deep neural networks. Appl Sci. 2020;10(7):2488. doi:10.3390/app10072488. [Google Scholar] [CrossRef]
34. Rezaee K, Zadeh HG. Self-attention transformer unit-based deep learning framework for skin lesions classification in smart healthcare. Discov Appl Sci. 2024;6(1):3. doi:10.1007/s42452-024-05655-1. [Google Scholar] [CrossRef]
35. Hosny KM, Kassem MA, Foaud MM. Classification of skin lesions using transfer learning and augmentation with Alex-net. PLoS One. 2019;14(5):e0217293. doi:10.1371/journal.pone.0217293. [Google Scholar] [PubMed] [CrossRef]
36. Chaturvedi SS, Gupta K, Prasad PS,editors. Skin lesion analyser: an efficient seven-way multi-class skin cancer classification using MobileNet. In: Proceedings of the Advanced Machine Learning Technologies and Applications; 2020 Feb 13–15; Jaipur, India. [Google Scholar]
37. Sayed GI, Soliman MM, Hassanien AE. A novel melanoma prediction model for imbalanced data using optimized SqueezeNet by bald eagle search optimization. Comput Biol Med. 2021;136(10):104712. doi:10.1016/j.compbiomed.2021.104712. [Google Scholar] [PubMed] [CrossRef]
38. Gupta S, Jayanthi R, Verma AK, Saxena AK, Moharana AK, Goswami S. Ensemble optimization algorithm for the prediction of melanoma skin cancer. Meas Sens. 2023;29(1):100887. doi:10.1016/j.measen.2023.100887. [Google Scholar] [CrossRef]
39. Golnoori F, Boroujeni FZ, Monadjemi A. Metaheuristic algorithm based hyper-parameters optimization for skin lesion classification. Multimed Tools Appl. 2023;82(17):25677–709. doi:10.1007/s11042-023-14429-7. [Google Scholar] [CrossRef]
40. Liu L, Zhang X, Xu Z. An adaptive weight search method based on the Grey wolf optimizer algorithm for skin lesion ensemble classification. Int J Imaging Syst Technol. 2024;34(2):e23049. doi:10.1002/ima.23049. [Google Scholar] [CrossRef]
41. Mandal S, Ghosh S, Jana ND, Chakraborty S, Mallik S. Active learning with particle swarm optimization for enhanced skin cancer classification utilizing deep CNN models. J Imaging Inform Med. 2024;38(4):1–18. doi:10.1007/s10278-024-01327-z. [Google Scholar] [PubMed] [CrossRef]
42. Esteva A, Kuprel B, Novoa RA, Ko J, Swetter SM, Blau HM, et al. Dermatologist-level classification of skin cancer with deep neural networks. Nature. 2017;542(7639):115–8. doi:10.1038/nature21056. [Google Scholar] [PubMed] [CrossRef]
43. Kassem MA, Hosny KM, Fouad MM. Skin lesions classification into eight classes for ISIC, 2019 using deep convolutional neural network and transfer learning. IEEE Access. 2020;8(1):114822–32. doi:10.1109/access.2020.3003890. [Google Scholar] [CrossRef]
44. Balasundaram A, Shaik A, Alroy BR, Singh A, Shivaprakash S. Genetic algorithm optimized stacking approach to skin disease detection. IEEE Access. 2024;12:88950–62. doi:10.1109/access.2024.3412791. [Google Scholar] [CrossRef]
45. Rahman Z, Hossain MS, Islam MR, Hasan MM, Hridhee RA. An approach for multiclass skin lesion classification based on ensemble learning. Inform Med Unlocked. 2021;25(10):100659. doi:10.1016/j.imu.2021.100659. [Google Scholar] [CrossRef]
46. Howard AG, Zhu M, Chen B, Kalenichenko D, Wang W, Weyand T, et al. Mobilenets: efficient convolutional neural networks for mobile vision applications. arXiv:1704.04861. 2017. [Google Scholar]
47. Huang G, Liu Z, Van Der Maaten L, Weinberger KQ. Densely connected convolutional networks. In: Proceedings of the IEEE Conference on Computer Vision and Pattern Recognition; 2017 Jul 21–26; Honolulu, HI, USA. [Google Scholar]
48. Chollet F. Xception: Deep learning with depthwise separable convolutions. In: Proceedings of the IEEE Conference on Computer Vision and Pattern Recognition; 2017 Jul 21–26; Honolulu, HI, USA. [Google Scholar]
49. Szegedy C, Vanhoucke V, Ioffe S, Shlens J, Wojna Z. Rethinking the inception architecture for computer vision. In: Proceedings of the IEEE Conference on Computer Vision and Pattern Recognition; 2016 Jun 27–30; Las Vegas, NV, USA. [Google Scholar]
50. Azizi M, Baghalzadeh Shishehgarkhaneh M, Basiri M, Moehler RC. Squid game optimizer (SGOa novel metaheuristic algorithm. Sci Rep. 2023;13(1):5373. doi:10.1038/s41598-023-32465-z. [Google Scholar] [PubMed] [CrossRef]
51. Ali K, Shaikh ZA, Khan AA, Laghari AA. Multiclass skin cancer classification using EfficientNets—a first step towards preventing skin cancer. Neurosci Inform. 2022;2(4):100034. doi:10.1016/j.neuri.2021.100034. [Google Scholar] [CrossRef]
52. Khan MA, Akram T, Zhang Y-D, Sharif M. Attributes based skin lesion detection and recognition: a mask RCNN and transfer learning-based deep learning framework. Pattern Recognit Lett. 2021;143:58–66. doi:10.1016/j.patrec.2020.12.015. [Google Scholar] [CrossRef]
53. Alhudhaif A, Almaslukh B, Aseeri AO, Guler O, Polat K. A novel nonlinear automated multi-class skin lesion detection system using soft-attention based convolutional neural networks. Chaos Solitons Fractals. 2023;170(1):113409. doi:10.1016/j.chaos.2023.113409. [Google Scholar] [CrossRef]
54. Halder A, Dalal A, Gharami S, Wozniak M, Ijaz MF, Singh PK. A fuzzy rank-based deep ensemble methodology for multi-class skin cancer classification. Sci Rep. 2025;15(1):6268. doi:10.1038/s41598-025-90423-3. [Google Scholar] [PubMed] [CrossRef]
55. Das A, Mohanty MN. Design of stacked ensemble classifier for skin cancer detection. Multimed Tools Appl. 2025;2025(28):1–20. doi:10.1007/s11042-025-20630-7. [Google Scholar] [CrossRef]
56. Khan MA, Alam S, Ahmed W. Enhanced skin cancer diagnosis via deep convolutional neural networks with ensemble learning. SN Comput Sci. 2025;6(2):1–14. doi:10.1007/s42979-024-03581-y. [Google Scholar] [CrossRef]
57. Nivedha S, Shankar S. Melanoma diagnosis using enhanced faster region convolutional neural networks optimized by artificial gorilla troops algorithm. Inf Technol Control. 2023;52(4):819–32. doi:10.5755/j01.itc.52.4.33503. [Google Scholar] [CrossRef]
58. Nasir IM, Tehsin S, Damaševičius R, Maskeliūnas R. Integrating explanations into CNNs by adopting spiking attention block for skin cancer detection. Algorithms. 2024;17(12):557. doi:10.3390/a17120557. [Google Scholar] [CrossRef]
59. Ali A, Shahbaz H, Damaševičius R. xCViT: improved vision transformer network with fusion of CNN and Xception for skin disease recognition with explainable AI. Comput Mater Contin. 2025;83(1):1368–98. doi:10.32604/cmc.2025.059301. [Google Scholar] [CrossRef]
60. Joseph A, Dhruvan A, Anandh K, Adamu M, Ibrahim YE. Behavior of double skin composite shear wall with different faceplate configuration towards cyclic loading. Int J Technol. 2024;15(6):1632–43. doi:10.14716/ijtech.v15i6.7324. [Google Scholar] [CrossRef]
61. Zeeshan HM, Bin Heyat MB, Bin Hayat MA, Parveen S, Sultana A, Akhtar F, et al. Progress and research trends in lumpy skin disease based on the scientometric assessment—a review. Ann Anim Sci. 2025;25(3):829–43. doi:10.2478/aoas-2024-0091. [Google Scholar] [CrossRef]
62. Ali SN, Ahmed MT, Jahan T, Paul J, Sani SS, Noor N, et al. A web-based mpox skin lesion detection system using state-of-the-art deep learning models considering racial diversity. Biomed Signal Process Control. 2024;98:106742. doi:10.1016/j.bspc.2024.106742. [Google Scholar] [CrossRef]
63. Hammad M, Pławiak P, ElAffendi M, El-Latif AAA, Latif AAA. Enhanced deep learning approach for accurate eczema and psoriasis skin detection. Sensors. 2023;23(16):7295. doi:10.3390/s23167295. [Google Scholar] [PubMed] [CrossRef]
64. Khan SUR, Asim MN, Vollmer S, Dengel A. FOLC-Net: a federated-optimized lightweight architecture for enhanced MRI disease diagnosis across axial, coronal, and sagittal views. arXiv:2507.06763. 2025. [Google Scholar]
65. Bala D, Hossain MS, Hossain MA, Abdullah MI, Rahman MM, Manavalan B, et al. MonkeyNet: a robust deep convolutional neural network for monkeypox disease detection and classification. Neural Netw. 2023;161(2):757–75. doi:10.1016/j.neunet.2023.02.022. [Google Scholar] [PubMed] [CrossRef]
Cite This Article
 Copyright © 2025 The Author(s). Published by Tech Science Press.
This work is licensed under a Creative Commons Attribution 4.0 International License , which permits unrestricted use, distribution, and reproduction in any medium, provided the original work is properly cited.
 Downloads
 Citation Tools