
 Submit a Paper
 Propose a Special lssue
 Open Access
ARTICLE

Automatic Identification of Local Instability in Shallow-Buried Thick Sand Strata during Diaphragm Wall Construction
1 Department of Geotechnical Engineering, Tongji University, Shanghai, 200092, China
2 Department of Mathematics and Physics, Leibniz University Hannover, Hannover, 30167, Germany
* Corresponding Author: Xiaoying Zhuang. Email:
(This article belongs to the Special Issue: Advanced Computational Methods in Multiphysics Phenomena)
Computer Modeling in Engineering & Sciences 2025, 144(3), 3287-3305. https://doi.org/10.32604/cmes.2025.070018
Received 06 July 2025; Accepted 09 September 2025; Issue published 30 September 2025
 View Full Text
 Download PDF
Abstract
Shallow-buried thick sand strata present considerable local instability risks during diaphragm wall trenching construction. However, this critical issue has not been extensively studied, despite its serious safety consequences. This paper proposes an automatic identification model for shallow-buried thick sand strata, integrating three-dimensional limit equilibrium theory with a genetic algorithm to precisely identify the most potentially dangerous local instability mass and determine its minimum safety factor. The model establishes three undetermined parameters: failure angle, upper boundary, and thickness of the local instability mass. These parameters define the search space for the local instability mass. The effectiveness of this approach was confirmed through a diaphragm wall engineering case near the Rhine River in France, where the predicted instability location closely aligned with field observations. A systematic analysis of the model indicated that the difference in slurry-groundwater levels and the friction angle are the most significant factors affecting local instability in shallow-buried thick sand strata. The model indicated that the location of the most potentially dangerous instability mass changes depending on geological conditions, and larger instability masses do not always relate to lower safety factors. Additionally, exploratory experiments revealed that support pressure losses caused by slurry infiltration significantly influence local instability calculations in sand strata. This points out the importance of considering these support pressure losses in the stability evaluations of high permeable sand strata. The results improve the evaluation of safety and the optimization of design for diaphragm wall construction in shallow-buried thick sand strata.Keywords
Trench excavation is a crucial phase in the construction of diaphragm walls, significantly influencing the final outcome of the project. In complex geological conditions, even minor construction errors may result in trench collapse and significant ground subsidence [1–3]. It is widely recognized that agree that diaphragm wall trench instability can be categorized into global and local instability [4–5]. Extensive research has focused on the global instability mechanism of diaphragm walls. Li proposed the horizontal slice method to address stratigraphic heterogeneity in the stability calculations of deep diaphragm walls [6]. Huang et al. [7] expanded on Li’s research, observing that a small ratio of trench length to depth can lead to unsafe outcomes when using the three-dimensional horizontal slice method. To address this limitation, Huang developed an iterative horizontal slice method for the global stability analysis of slurry trenches in layered soil [8]. Various analytical approaches have been applied to investigate global instability. Zhang utilized the upper bound theorem of limit analysis to assess slurry trench stability, considering anisotropy and heterogeneity [9]. Liu proposed that instability is triggered by the movement of rigid blocks with conical discontinuities and analyzed trench stability using the kinematic approach of limit analysis, thereby obtaining the upper bound solution for the safety factor [10]. Wang et al. [11] presented a three-dimensional rigid rotational mechanism through a spatial discretization scheme for the global stability analysis of slurry trenches in cohesive-frictional soil. Recent studies have emphasized the significance of accounting for parameter uncertainty. Chen et al. [12] illustrated that spatial variability has a considerable effect on stability assessment. Additionally, Hong et al. [13] and Pang et al. [14] indicated that uncertainty in soil parameters can greatly influence system reliability in deep excavations.
Unlike global instability, local instability does not extend to the ground surface and remains difficult to detect visually, thus presenting greater challenges in understanding its failure mechanisms as shown in Fig. 1. And numerous researchers have investigated stability phenomena. Shen and Zhou assumed that the sand strata conform to the Mohr-Coulomb yield criterion and is in a limit state, establishing a hyperbolic partial differential equation to solve for the safety factor [15]. Han examined the local stability of 2D and 3D rotational modes, finding that the safety factor for the 3D solution is slightly larger than that of the 2D solution [16]. Liu developed a limit equilibrium model considering seepage conditions to study local stability during trench excavation [17]. Similarly, Liu and Shi, also considering seepage effects, developed a three-dimensional translational failure mechanism for evaluating the local stability of slurry trenches [18].
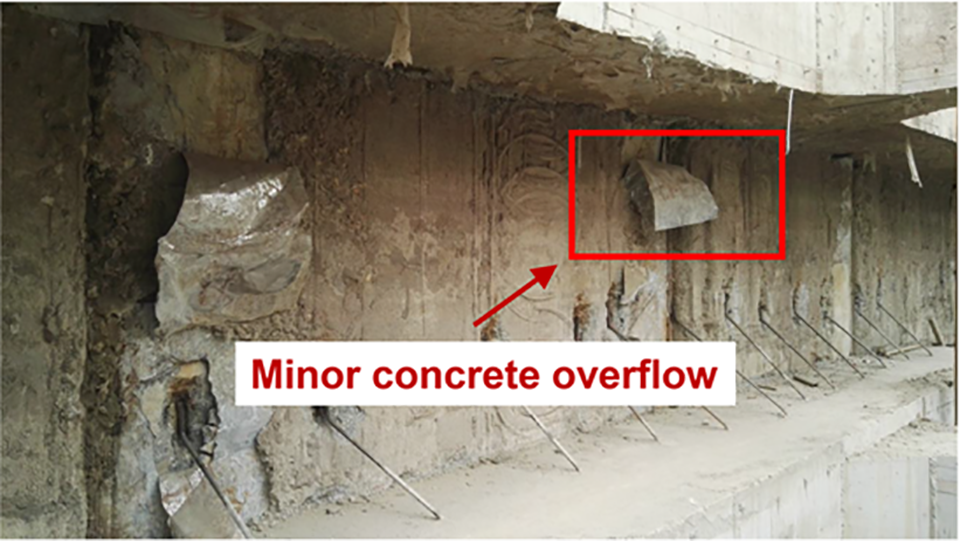
Figure 1: Concrete extrusion caused by local instability (Sanyang Road, Wuhan, China)
However, current research on local stability primarily focuses on thin weak interlayers, where it is generally assumed that the entire weak strata represent the unstable mass. This assumption is clearly inappropriate for shallow-buried thick sand strata. If the thickness of the local instability mass is considered to be equal to the total thickness of the sand strata, the failure mechanism is similar to global instability. However, the failure surface may not reach the ground surface because of the effects of stratified soils. Moreover, this approach significantly overestimates the local stability of sand strata due to the influence of end friction effects. The limited research on local stability in shallow-buried thick sand strata makes it important to investigate their specific local instability mechanisms for both theoretical and practical reasons. Additionally, recent studies have revealed that slurry infiltration in sand strata is highly complex, exhibiting several distinctly different penetration modes [19–20], which may affect local stability calculations [20–23]. These phenomena have rarely been incorporated into stability analyses despite their potential critical impact on local stability assessments.
To address these difficulties, this paper proposes an automatic identification model that integrates three-dimensional limit equilibrium theory with genetic algorithm to precisely locate the most potentially dangerous local instability mass and determine its minimum safety factor. Subsequently, a comprehensive sensitivity analysis is performed to evaluate the influence of critical parameters on the proposed local instability model. And the model is validated through a case study of a diaphragm wall project adjacent to the Rhine River in France. Finally, an exploratory slurry infiltration experiment is conducted to investigate the influence of slurry penetration on local instability calculations, revealing the critical role of infiltration-induced pressure distribution in stability assessment. These investigations offer critical insights into the local stability mechanisms of shallow-buried thick sand strata, significantly advancing the safety evaluation of diaphragm wall construction in such challenging geological conditions.
2 Limit Equilibrium Approach for Automatic Identification of Instability Zone Locations
When excavating trenches through shallowly buried thick sand strata, numerous potential local instability masses exist within the formation. These instability masses vary in shape, location, and failure depth, constituting a search space that contains the most potentially dangerous local instability mass with the minimum safety factor. Thus, it is essential to parameterize this local instability mass space. The choice of various undetermined parameters establishes different search spaces, while a comprehensive selection of parameters results in a wider search space. As the search space increases, the geometry and safety factor of the identified most potentially dangerous local instability mass become more precise, although this comes with higher computational costs. The model exhibits high flexibility, thus the selection of undetermined parameters should balance engineering practice experience with computational efficiency.
The local instability masses observed in the field resemble three-dimensional wedge shapes [12,17,18]. Based on these observations, this paper selects three undetermined parameters—failure angle (
As illustrated in Fig. 2, there is a local instability mass with the minimum safety factor, denoted as the most potentially dangerous local instability mass ABCDEF in the shaded area. Its upper surface is
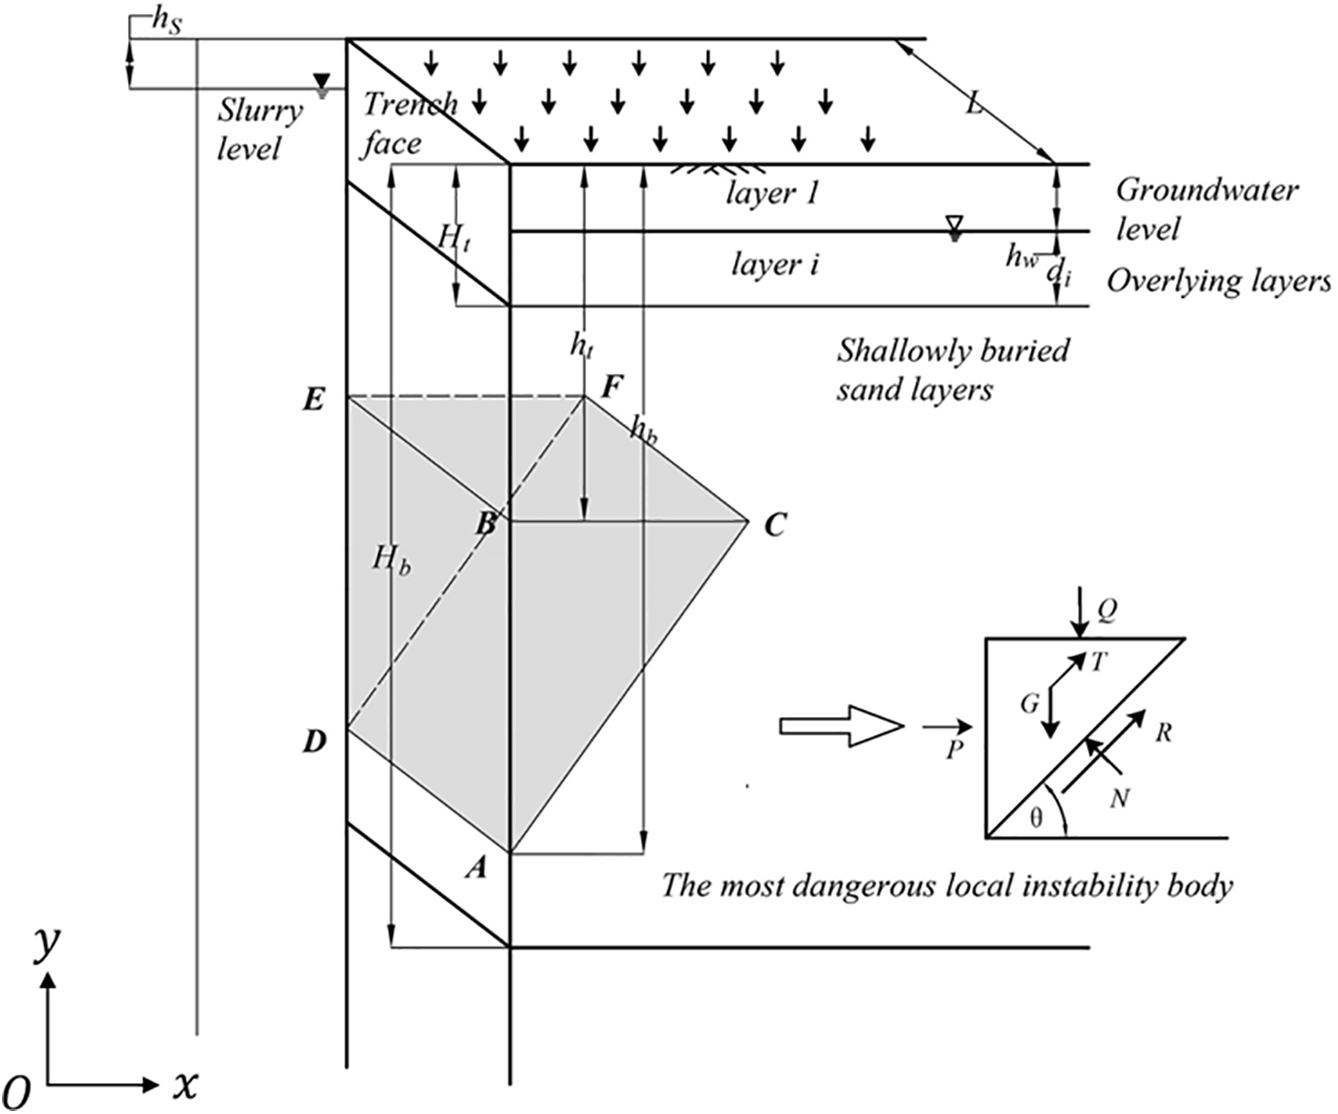
Figure 2: Lobal instability model with three undetermined parameters
The self-weight of the local instability mass
where
The slurry support force acting on the local instability mass
where
Stress redistribution during trench wall excavation creates a soil arching effect, which reduces the vertical stress above the wedge-shaped body. Tsai et al. [18,24] accounted for the trench spatial dimension effect and revised the distribution of vertical stress in layered strata. This paper adopts the vertical stress considering the revised reduction:
where
As shown in Fig. 2,
where
Based on the vertical stress distribution obtained from Eq. (5), the total vertical load Q acting on the critical surface can be calculated as:
The frictional force
where
From the wedge equilibrium diagram presented in Fig. 2, the following limit equilibrium equation can be established:
(1) Force equilibrium in Y direction:
(2) Force equilibrium in X direction:
(3) Limit equilibrium of the sliding surface:
The explicit expression for the safety factor
The normal force
When
Thus, for given geotechnical parameters, Fs becomes a function of only the three undetermined geometric parameters (
Based on field observations from documented local instability cases [12,17,18], the failure angle of local instability wedges predominantly ranges around 60°. When the failure angle is insufficient, the wedge geometry becomes insufficiently steep for instability initiation. Conversely, excessive failure angles result in excessively slender wedges that remain confined along the trench wall surface, exhibiting minimal impact on diaphragm wall stability. Therefore, the search space for the failure angle is set between 40° and 80° to encompass all potentially instability mechanisms. Furthermore, standard diaphragm wall construction requires the installation of concrete guide walls at the ground surface, which provide structural support to prevent local instability in the shallow zone. When the depth to the upper surface of the shallowly buried thick sand strata (
Considering these engineering constraints and physical mechanisms, the optimization problem is formulated as:
(1) Optimization variables:
[
(2) Objective function:
(3) Value range:
This section presents a case study of local instability during diaphragm wall panel installation near the Rhine River in France. In this case, the trench walls were excavated through a shallow, thick sand strata with an internal friction angle of 35°, and the groundwater level was located 1.5 m below the ground surface. The soil density above the groundwater level was 2.1 t/m3, while below the groundwater level it was 1.3 t/m3. The slurry unit weight was 10.8 kN/m3, with the slurry level consistently maintained at ground surface level. During construction, over 100 slurry trench walls were excavated, with widths ranging from 4 to 6 m and depths varying from 26 to 30 m. When the trench width reached 5.5 m, some trench walls began to experience collapse, with the lower boundary of instability occurring at depths between 8 and 12 m below ground surface.
As illustrated in Fig. 3, both global and local stability analyses of the trench walls were conducted using the three-dimensional horizontal slice method and the three-dimensional wedge-shaped local instability mass search model derived in Section 2.1. The results demonstrate that when the lower boundary of the failure envelope was between 8 and 12 m depth, the global stability safety factors remained above 1.2 regardless of trench width variations (4 to 6 m), indicating an extremely low probability of global instability. The local stability safety factors gradually decreased with increasing trench width. When the trench width reached 5.5 m, the safety factor first dropped below unity to 0.9843. The corresponding instability mass had an upper boundary at 4.02 m, a lower boundary at 10.81 m, and a failure angle of 65.44°. Since the upper layers consisted entirely of cohesionless sandy soil, this ultimately led to larger-scale failure. The field observations were consistent with the computational results obtained using the automatic identification model derived in Section 2.1, thereby validating the effectiveness of this model.
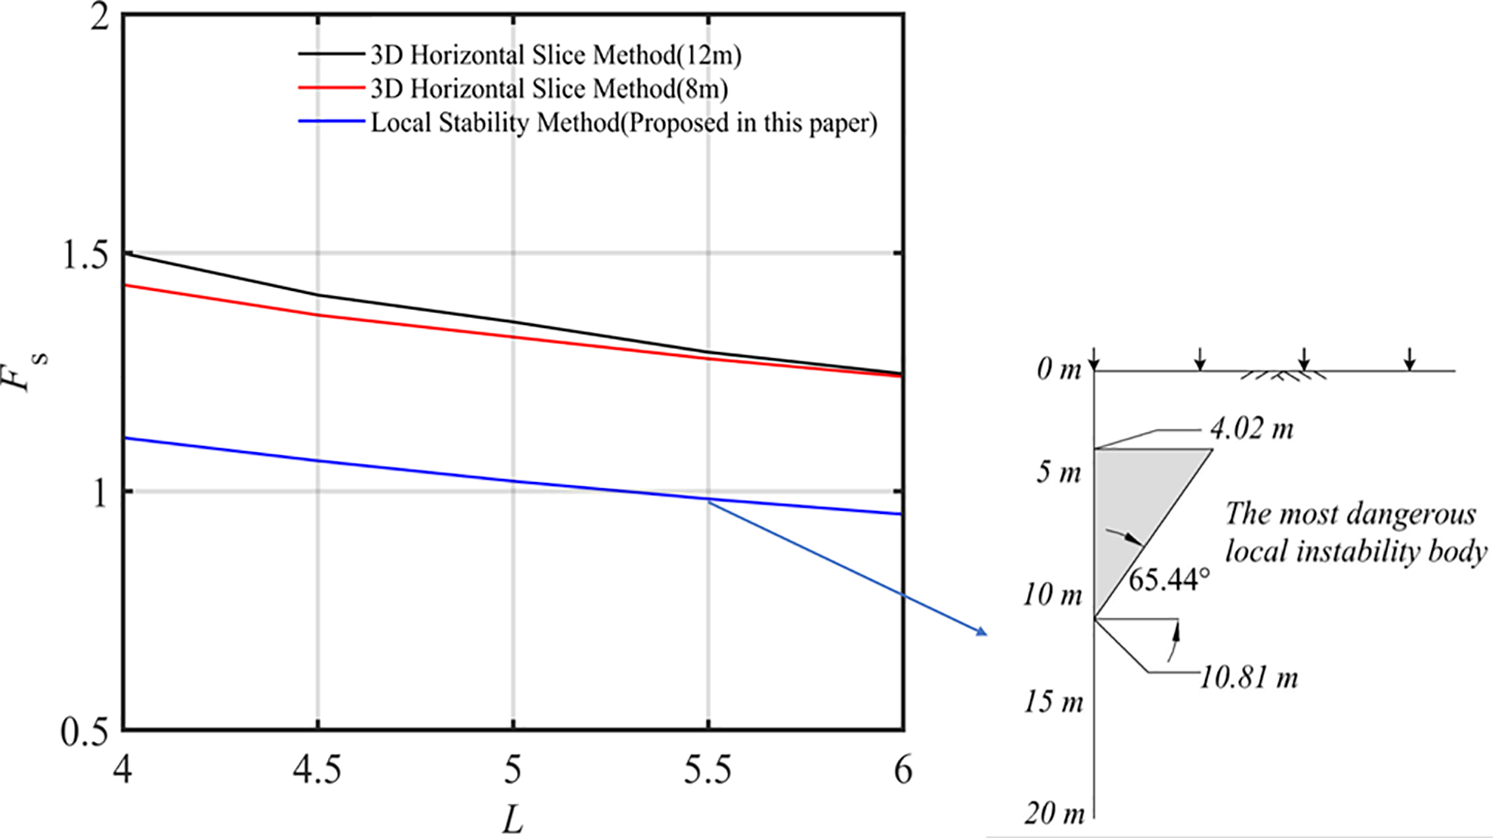
Figure 3: Stability analysis of the example case by three-dimensional horizontal slice method and local instability model with undetermined parameters
As shown in Fig. 4, the effective friction angle of the shallowly buried thick sand strata is assumed to be
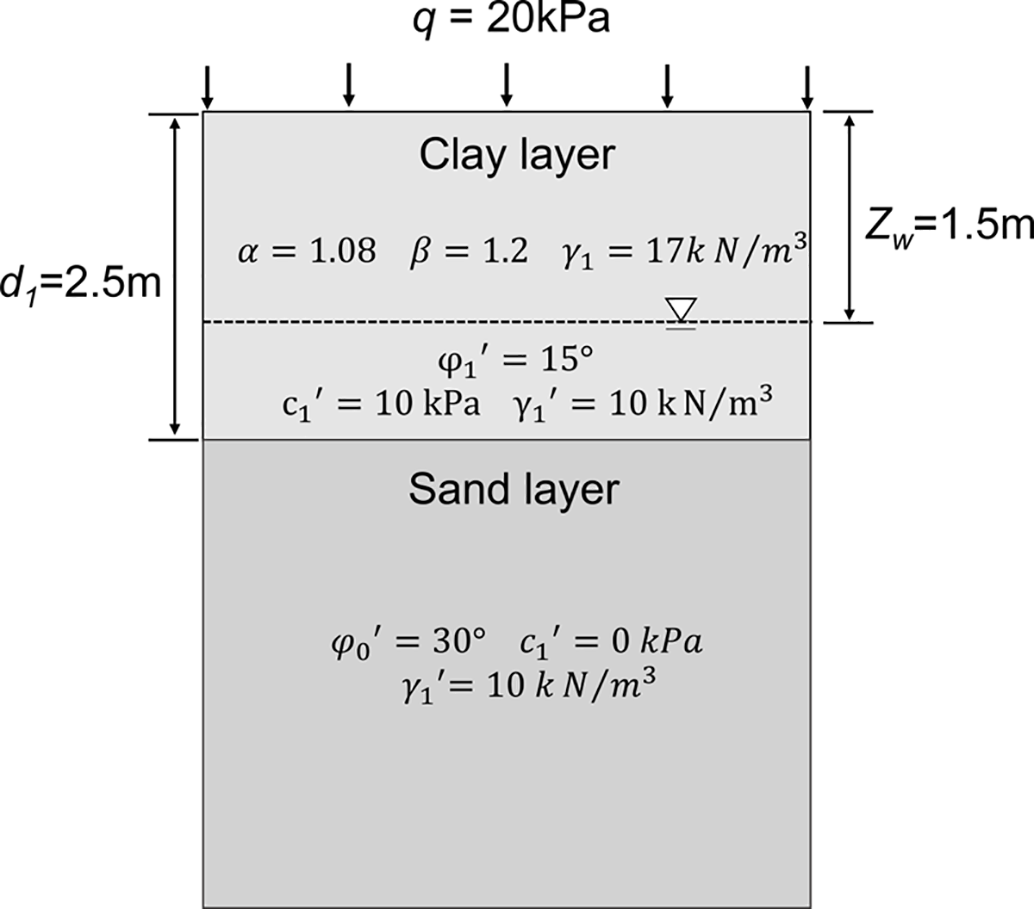
Figure 4: Profile of slurry trenching
Based on Table 1 and Fig. 5, as the surcharge load
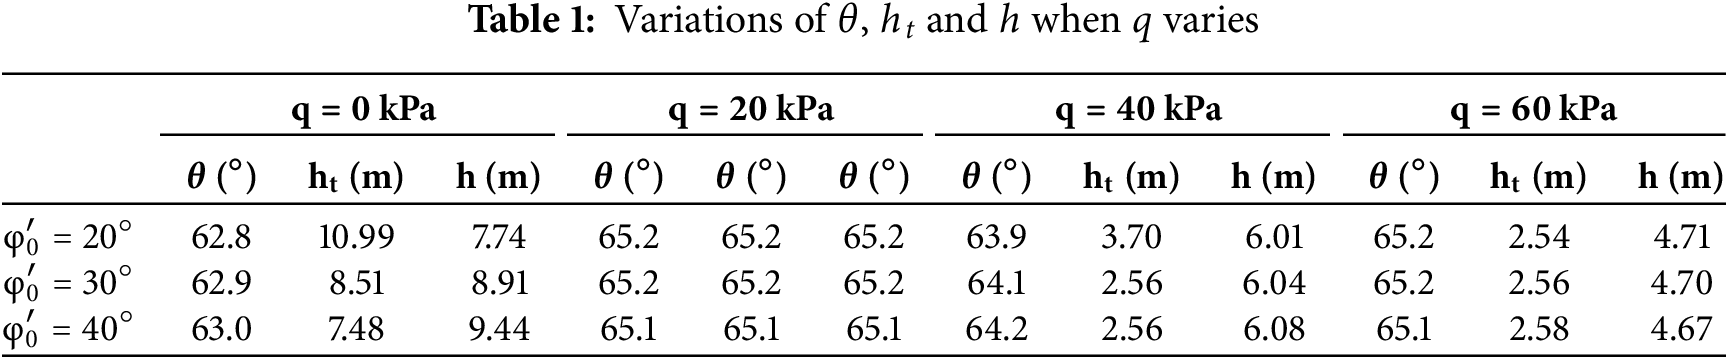
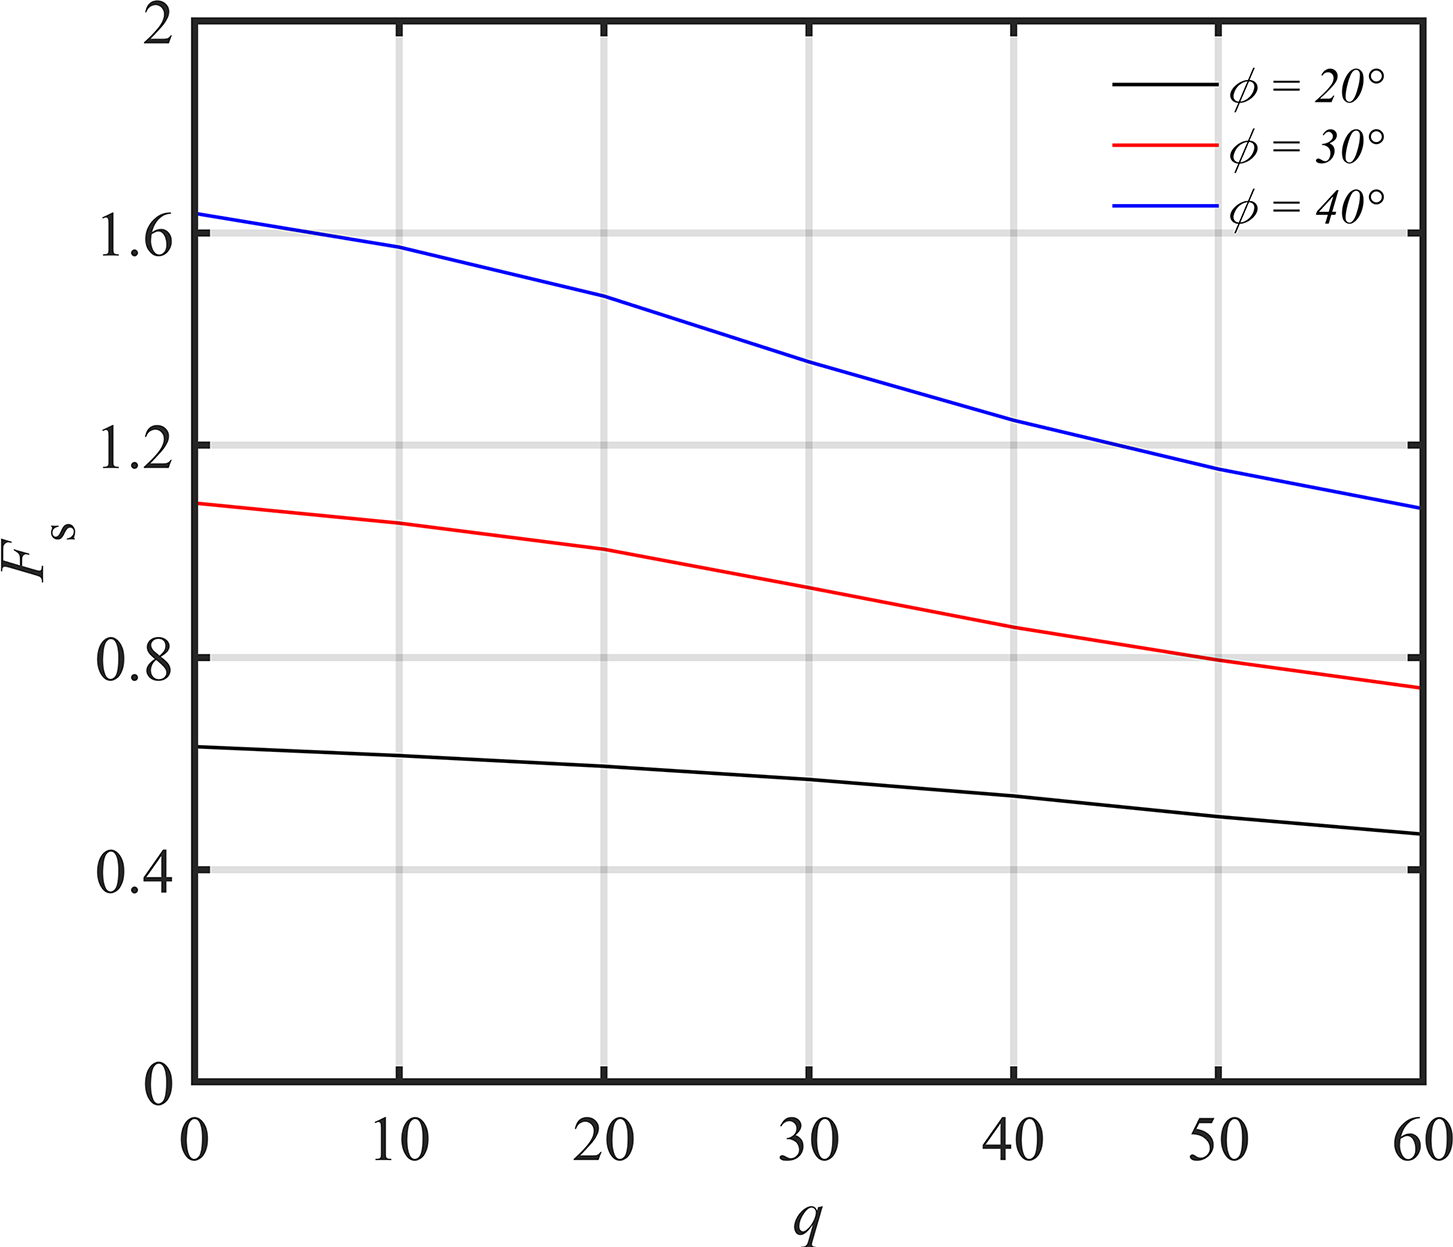
Figure 5: Variation of safety factor with surcharge
Compared to the loading effects, as shown in Table 2, the increase in trench width
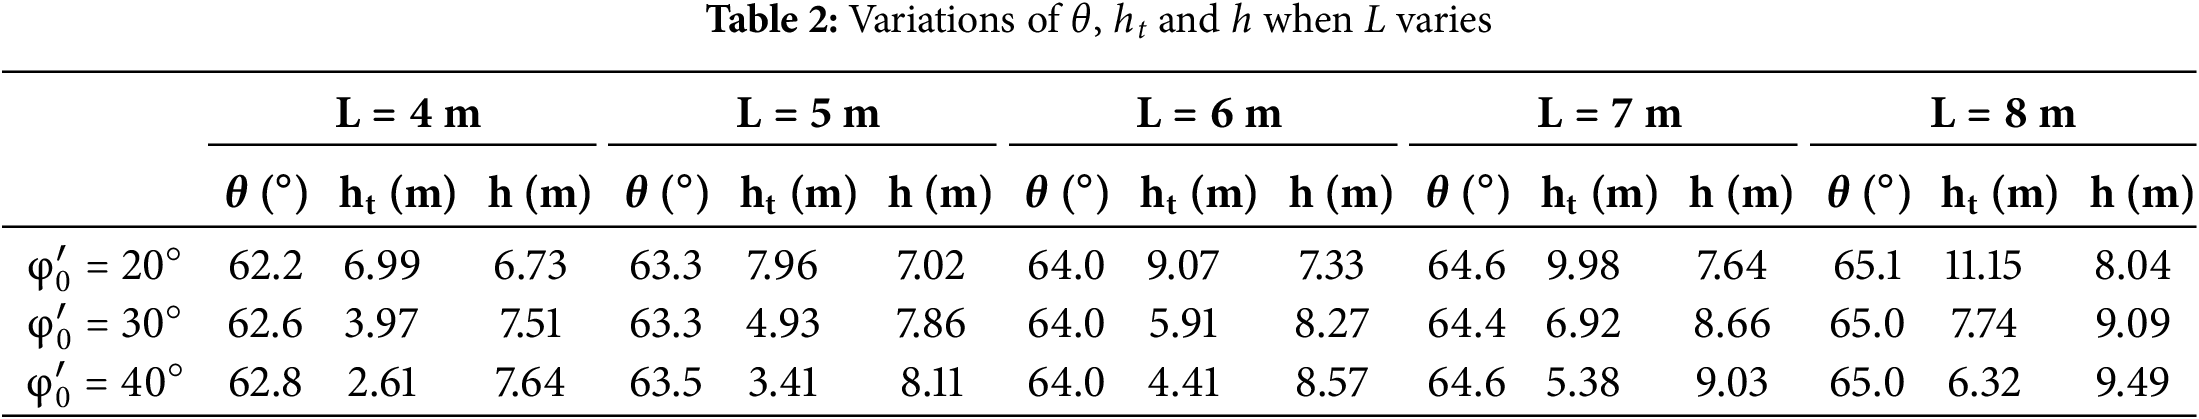
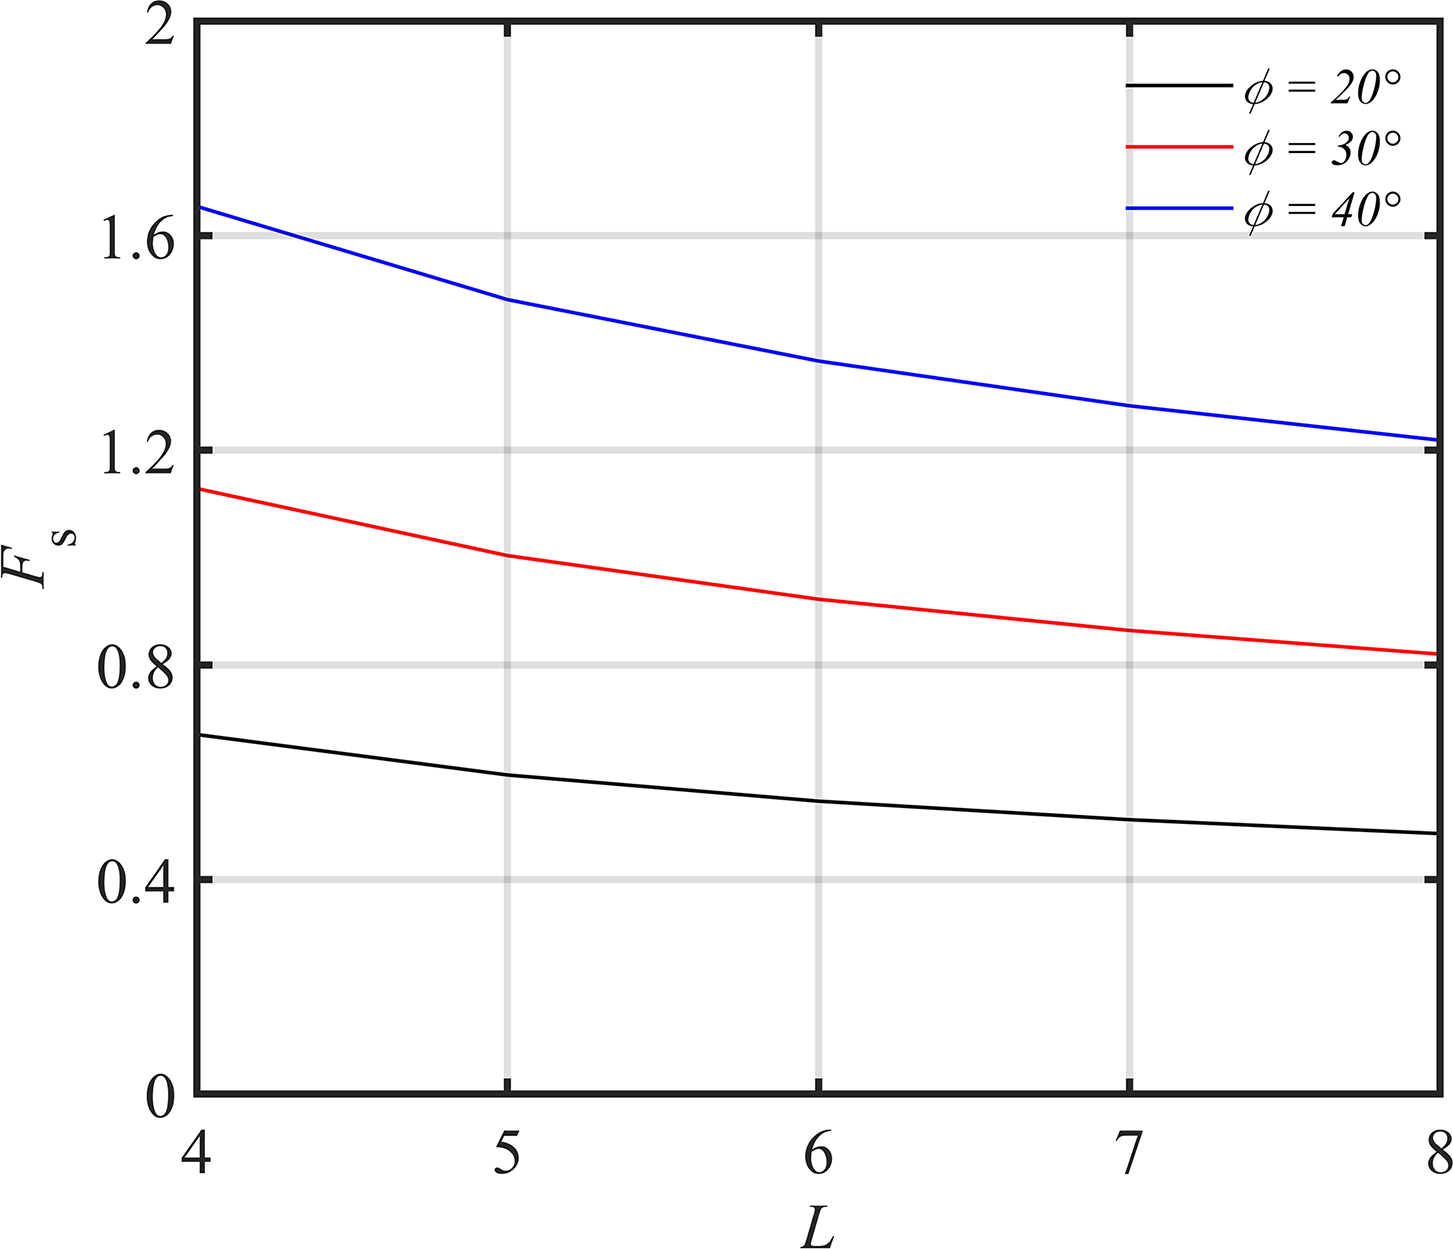
Figure 6: Variation of safety factor with trench width
As shown in Tables 3 and 4 and Fig. 7, the increase in the slurry-groundwater level difference (
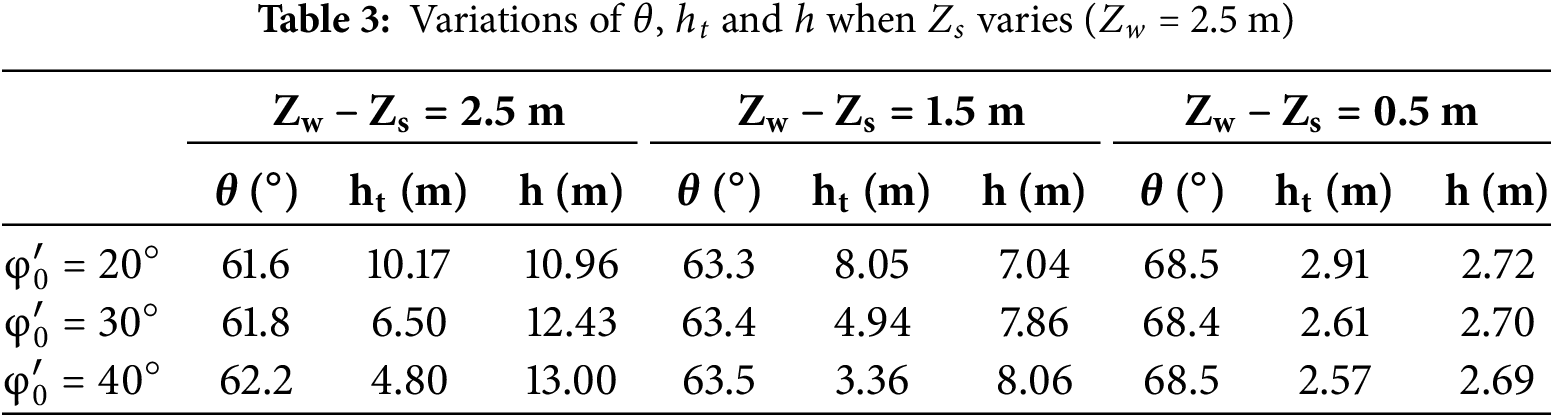
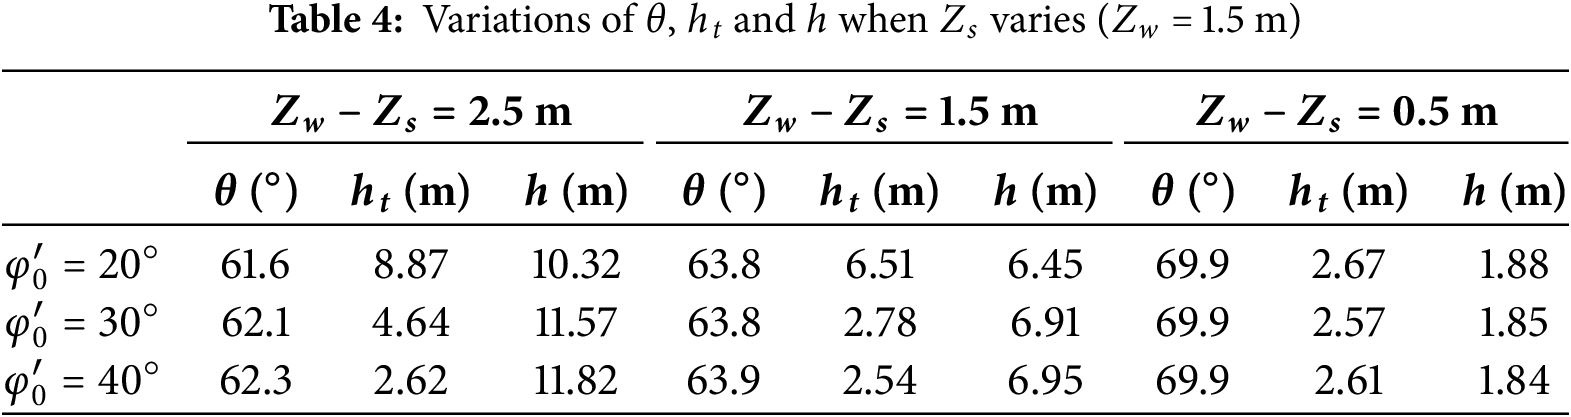
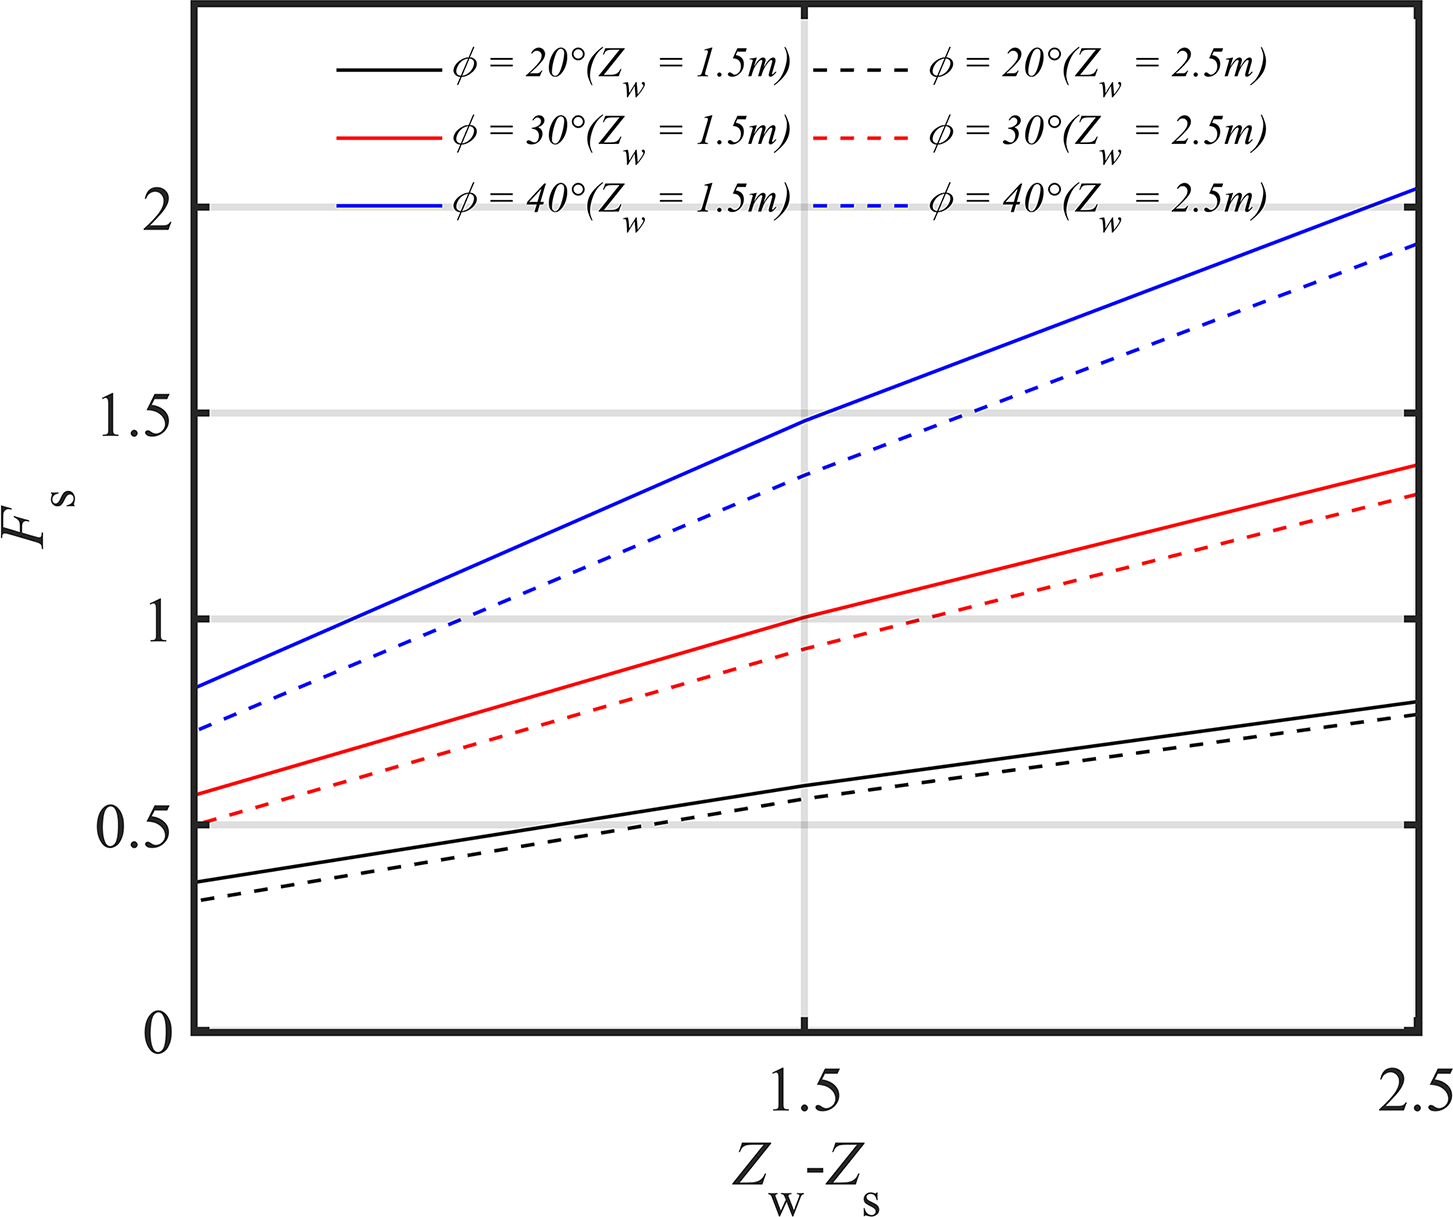
Figure 7: Variation of safety factor with
A global sensitivity analysis of the safety factor was performed in Fig. 8 utilizing the Sobol method with 10,240 samples to ensure analytical precision. The parameters influencing the safety factor, ranked by importance, are as follows: the slurry-groundwater level difference, the friction angle of shallow thick sand strata, and the trench width and surcharge. Furthermore, in conjunction with the safety factor influence diagrams presented earlier, regardless of the friction angle value, the variation in safety factor caused by the water level difference is always the largest. When the friction angle is set at 40°, a 2.5 m variation in water level difference can result in a safety factor span of up to 1.5, with an average sensitivity as high as 0.6 m−1, while other factors can only achieve a maximum safety factor variation of 0.5. In summary, the water level difference emerges as the most sensitive parameter, working synergistically with the friction angle to predominantly control the stability of local instability bodies. These findings provide explicit guidance for prioritizing engineering design and risk management.
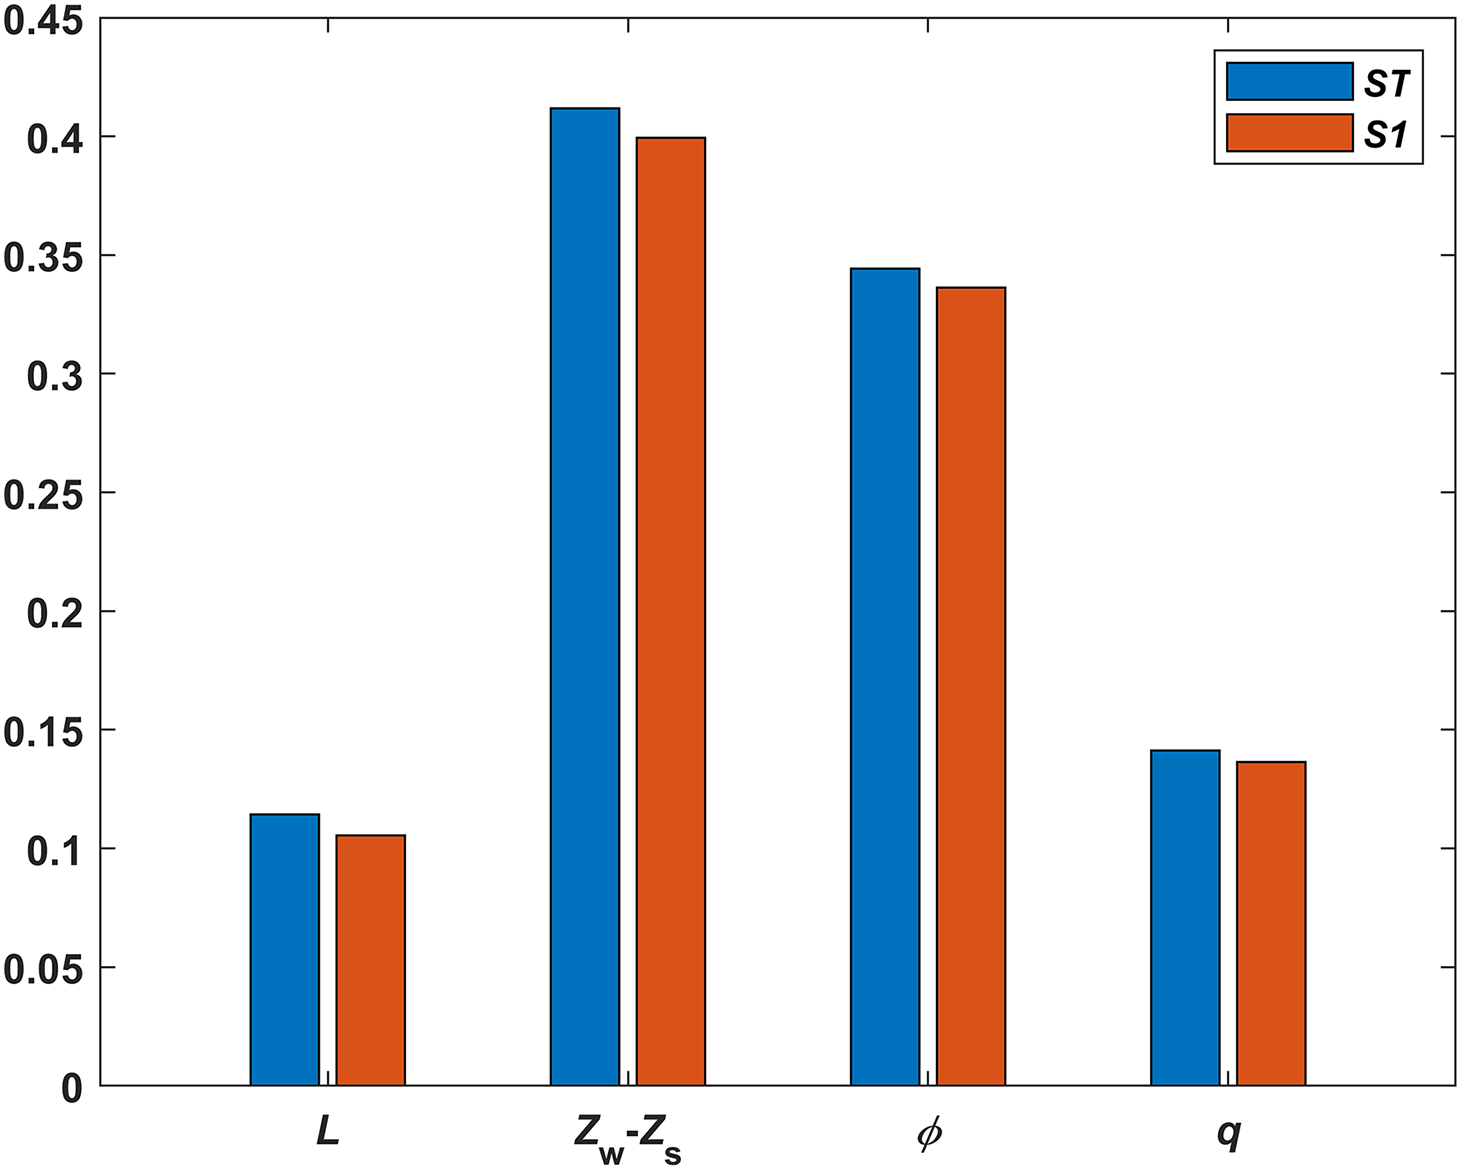
Figure 8: Global sensitivity analysis of the safety factor
3 Reduction in Slurry Support Pressure
Based on the sensitivity analysis conclusions presented above, for shallow sand layers, the pressure differential between mud pressure and groundwater level (i.e., support pressure P) emerges as the most critical influencing factor. To further investigate the impact of this factor on local stability, slurry infiltration experiments were conducted to examine the influence of this parameter on local stability conditions.
3.1 Slurry Infiltration Experiment
This study utilized a modified slurry infiltration experimental device developed by Xu et al. [26–28], in which a small polymethyl methacrylate (PMMA) cylinder was incorporated at the base of a larger PMMA cylinder. This modification was intended to reduce the excessive initial infiltration gradient observed in traditional infiltration experiments, thereby providing a more accurate simulation of slurry infiltration under field conditions. Fig. 9 shows the experimental setup. Data were collected continuously at a frequency of 1 Hz throughout the experiments. Three pore water pressure transducers (PPTs) with a measurement range of 0–100 kPa were installed at the cylinder joint to monitor changes in pore water pressure within the slurry and sand. Transducer P1 was positioned at the slurry-sand interface to measure slurry pressure, whereas transducers P2 and P3 were situated 10 and 40 cm below the interface, respectively. The experiments utilized a novel composite sodium bentonite specifically developed for diaphragm wall construction in Shanghai, consisting mainly of bentonite, water, and soda ash. Preliminary tests revealed that particle size significantly influences infiltration behavior. When sand particle size was below 0.5 mm, the slurry rapidly formed a dense filter cake on the sand surface, with pore water pressure concentrated entirely at the slurry-sand interface. Conversely, when particle size exceeded 1.0 mm, the infiltration distance became excessively long, exceeding the apparatus capacity. Therefore, this study focused on sand particles within the 0.50–1.00 mm range, where measurable infiltration characteristics could be properly captured. The test sand was classified into two categories according to particle size: 0.50–0.75 mm and 0.75–1.00 mm. Three distinct air pressure gradients were applied: 10, 25, and 50 kPa. Table 5 presents the detailed experimental program.
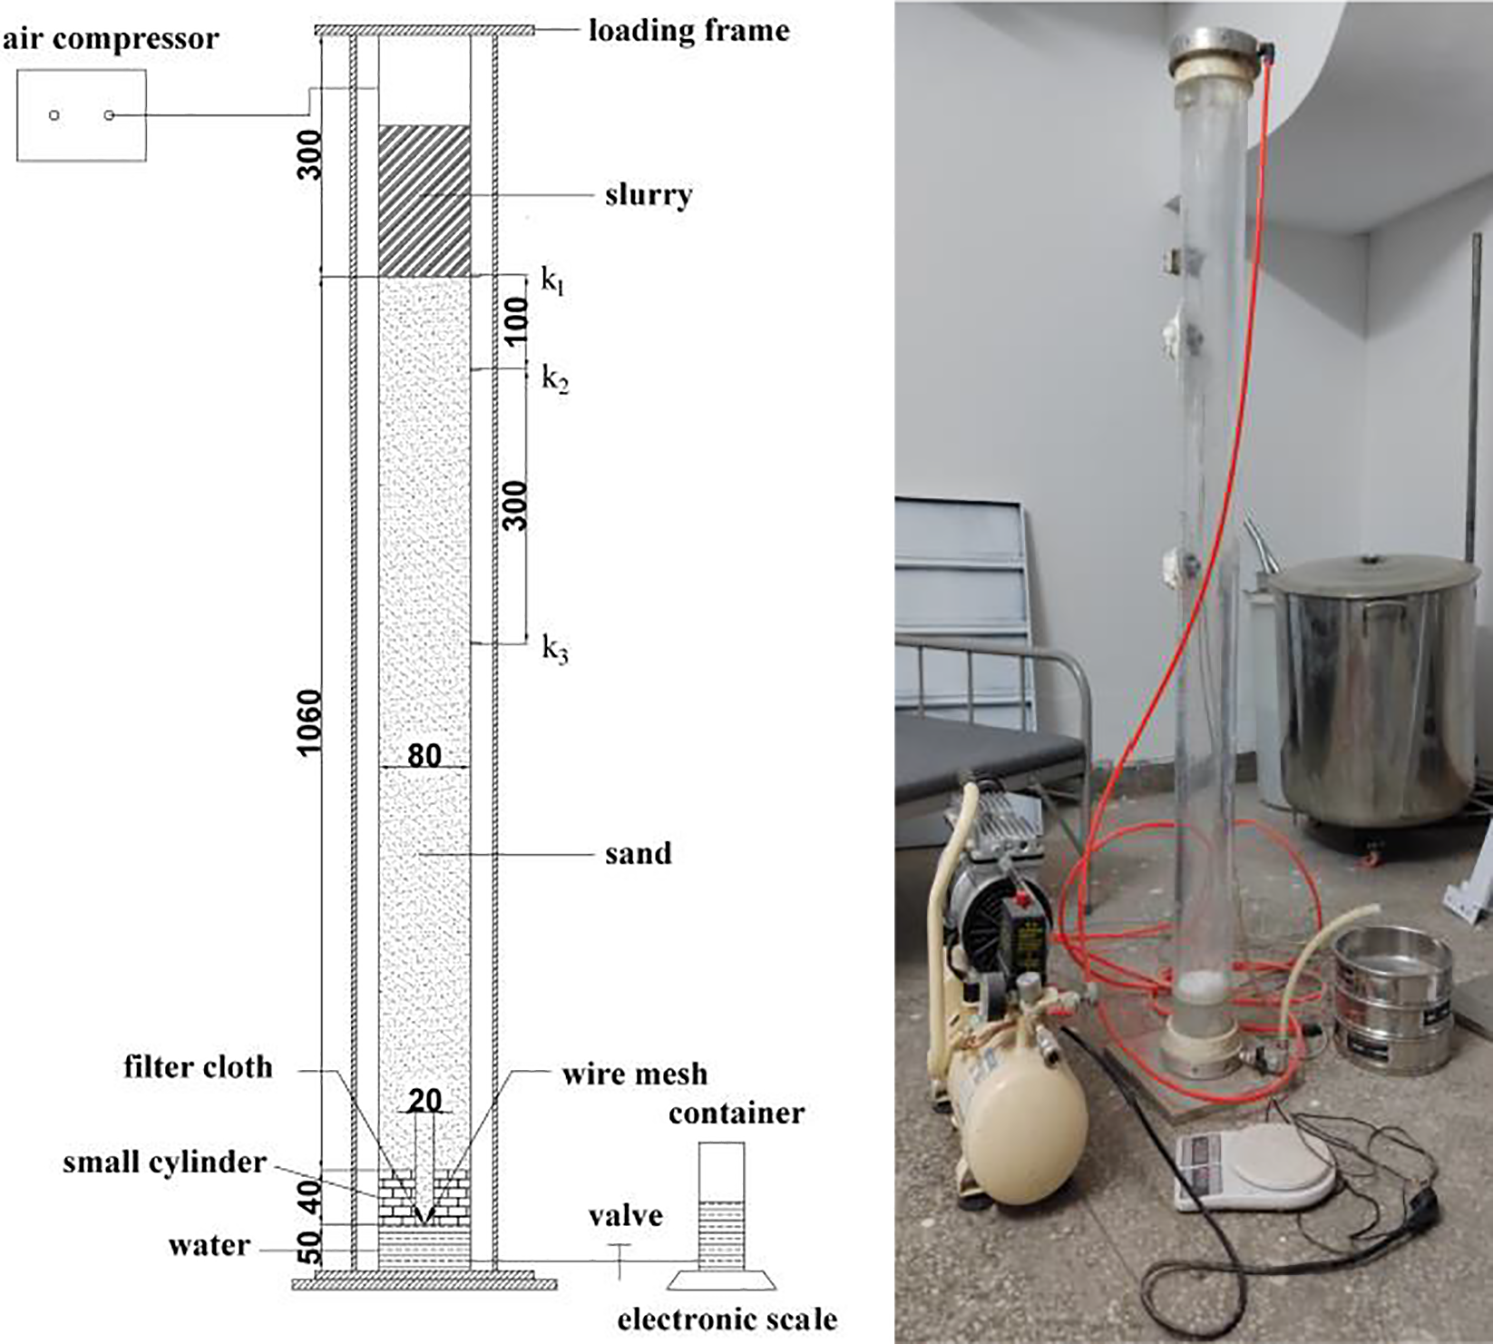
Figure 9: Device for of pressure infiltration of bentonite slurry
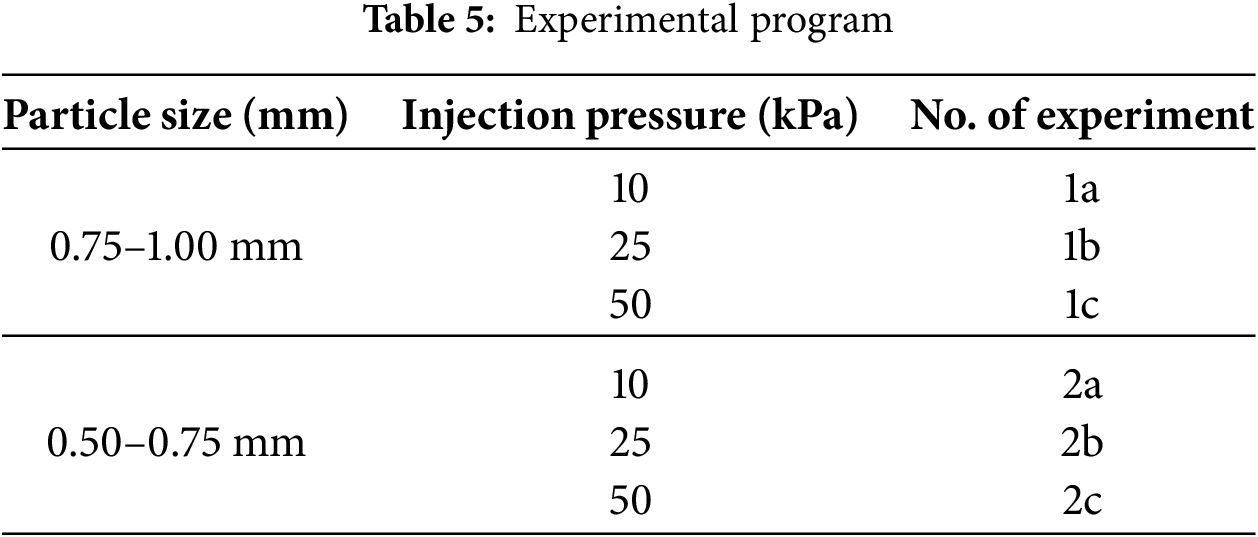
Fig. 10 illustrates the temporal variations in discharge volume and infiltration distance. The solid lines denote results for sand particles measuring 0.75–1.00 mm, whereas the dashed lines represent results for sand particles measuring 0.50–0.75 mm. The experimental results indicate that the coarse sand strata display a pure infiltration mode, while the fine sand strata form a filter cake mode. Although both infiltration modes exhibit comparable initial infiltration curve characteristics, the fine sand strata demonstrate a notable turning point where the total discharge volume experiences a sharp decline and subsequently stabilizes. Higher injection pressures result in earlier occurrence of this turning point. The coarse sand strata lack a significant turning point, as slurry infiltration persists at a minimal rate of less than 2 cm3/s in the later phases of the experiment.
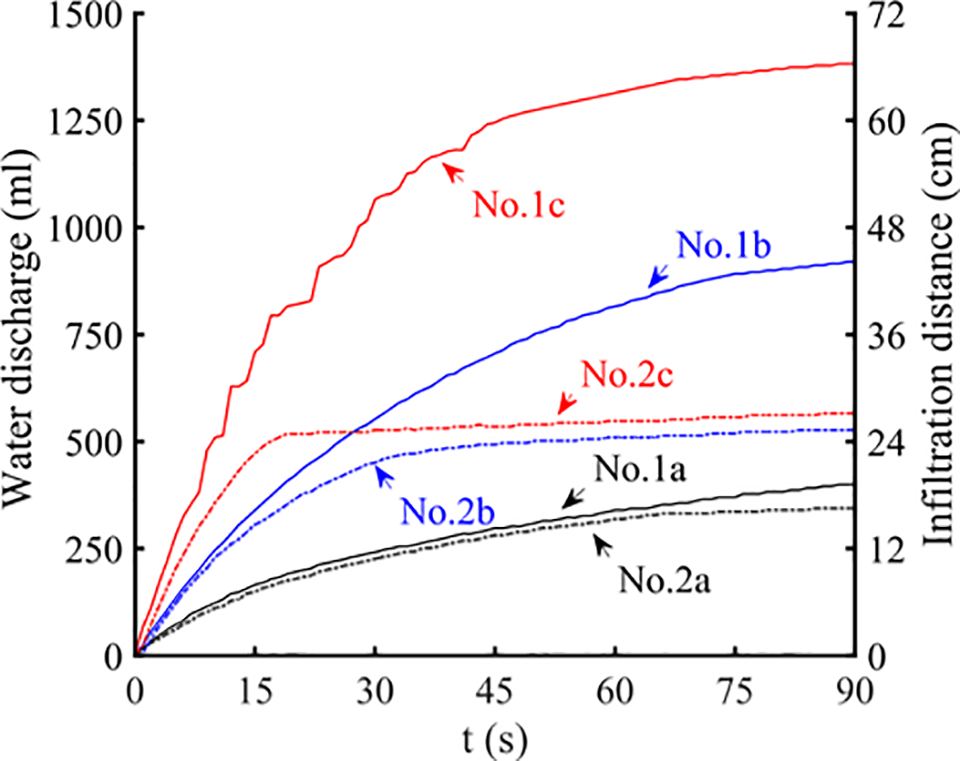
Figure 10: Variation of water flow rate with infiltration time
Experimental observations reveal that in the pure infiltration mode within coarse sand strata, the infiltration of slurry into saturated sand results in the effective filling of small pores with bentonite, while larger pores remain incompletely sealed. The permeability coefficient of the infiltrated sand decreases to a stable value. As the infiltration distance increases, flow resistance within the sand strata rises, causing a progressive decline in the slurry infiltration rate and ultimately establishing a stable pure infiltration zone. In the filter cake formation mode within fine sand strata, the filling of small pores occurs concurrently with the effective filling of certain larger pores. Filter cake formation begins when the Peclet number reaches a critical value during slurry infiltration.
Monitoring the pore water pressure transducer readings revealed that in the filter cake formation mode within fine sand strata, the slurry pressure focuses on the filter cake. In the pure infiltration mode within coarse sand strata, the slurry pressure is distributed across the formation. Fig. 11 illustrates the temporal variation of slurry pressure percentages at distances of 0–10 cm and 10–40 cm from the infiltration surface where ω denotes the percentage of slurry pressure. The solid lines represent the slurry pressure percentage in the 0–10 cm section. The dashed lines represent the slurry pressure percentage in the 10–40 cm section. Under slurry pressures of 10, 25, and 50 kPa, the stable infiltration distances reach approximately 14, 40, and 65 cm, respectively. The corresponding pressure distributions in the 0–10 cm zone are 43%, 22%, and 18%, while the 10–40 cm zone accounts for 31%, 56%, and 45%, respectively. The experimental results for the pure infiltration mode indicate that the slurry pressure is primarily localized within the infiltration zone, with minimal pressure transmitted to the non-infiltrated layer.
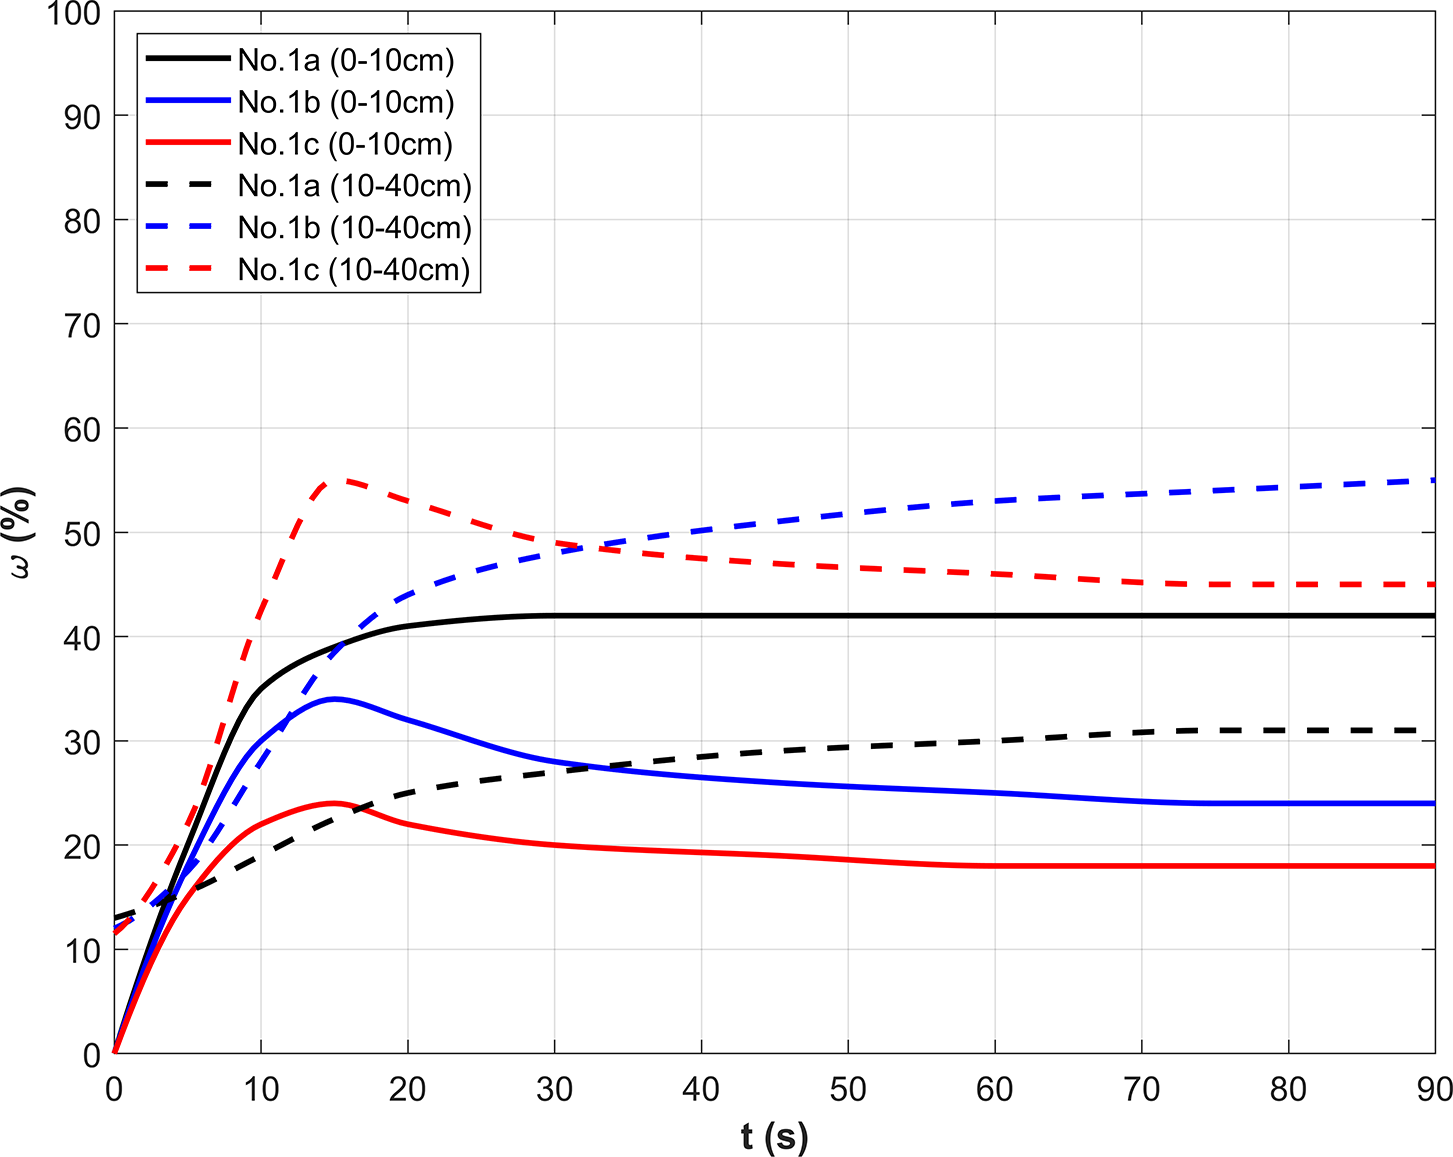
Figure 11: Slurry pressure ratio variation with time at different depths
The slurry infiltration results reveal two distinctly different infiltration patterns for sand layers with different particle sizes. For the 0.50–0.75 mm stratum, after initial slurry infiltration, a large number of slurry particles are retained at the infiltration surface. Under the action of infiltration pressure, these slurry particles are compressed to gradually form a relatively dense mud cake that prevents further slurry flow, with the slurry pressure primarily acting on the infiltration surface. In contrast, for the 0.75–1.00 mm stratum, the larger pore spaces result in fewer slurry particles being retained at the surface, leading to substantial penetration of slurry particles into the stratum interior. Larger slurry particles become trapped within the flow channels, progressively reducing the permeability coefficient and forming a stable infiltration zone. While slurry continues to flow steadily through these channels at decreasing velocities, the slurry pressure is mainly distributed within the infiltration zone.
Although this experiment adopted the apparatus developed by Tao et al. to minimize the initial hydraulic gradient and better approximate actual field conditions, the tests were conducted under steady-state flow conditions with constant hydraulic gradients. In contrast, field conditions involve transient flow states due to continuous excavation and fluctuating groundwater levels, which represents a significant difference between experimental and field conditions. Additionally, the restricted particle size range and pressure conditions limit the applicability of the experimental results. Future research should extend the testing program to include wider particle size distributions, higher pressure ranges, and time-dependent infiltration processes to better represent actual construction conditions.
3.3 Safety Factor Correction Calculation Considering Support Pressure Reduction
The experimental results demonstrate that the three-dimensional wedge-shaped instability body shown in Fig. 12 provides an example for dividing the pressure distribution of slurry infiltration into three distinct zones: Zone I denotes the infiltration zone adjacent to the excavation face, characterized by concentrated slurry pressure near the infiltration surface and minimal slurry support pressure loss. Zone II represents the infiltration zone distant from the infiltration surface, where the seepage force may extend beyond the failure line, resulting in ineffective support pressure. Zone III defined as the non-infiltration zone, where the slurry seepage force can lie outside the failure line, also resulting in ineffective support pressure.
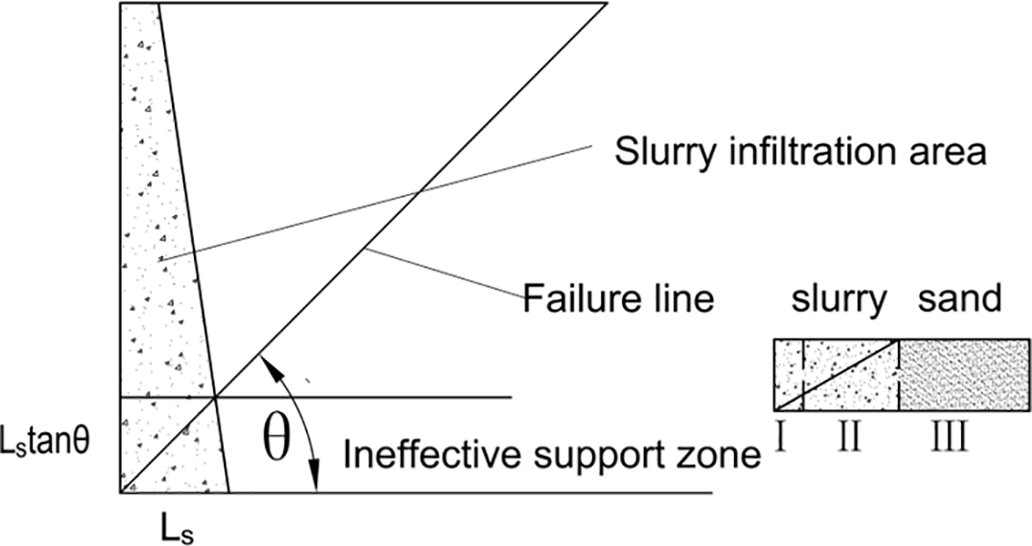
Figure 12: Support pressure loss diagram
Based on the following assumptions for slurry infiltration pressure: (i) slurry support pressure remains fully effective in Zone I; (ii) slurry support pressure decreases linearly in Zone II; these assumptions provide a preliminary framework for evaluating ineffective support force
where
This study represents exploratory experimental research aimed at investigating the mechanisms by which slurry support pressure reduction caused by slurry infiltration affects local instability. Given the exploratory nature of this research, the geological parameters specified in Section 2.3 were adopted, with the assumption that all calculated strata consist of sand strata with particle sizes of 0.75–1.00 mm as described in Section 3.1. The slurry infiltration phenomena and infiltration pressure distribution in these strata were consistent with the experimental conditions at 25 kPa. As illustrated in Fig. 13, the instability body’s bottom boundary was fixed at 10 m, while four scenarios with upper boundaries at 4, 5, 6, and 7 m were analyzed using the limit equilibrium method. The dotted lines represent scenarios with support pressure reduction due to slurry infiltration, while the solid lines represent ideal conditions with full slurry pressure acting on the mud cake surface. The comparative analysis reveals a significant phenomenon: when support pressure reduction due to slurry infiltration is not considered, the safety factor increases sharply as the instability body thickness decreases; conversely, when support pressure reduction is accounted for, the safety factor remains relatively stable with decreasing instability body thickness. This is most likely because when the wedge body is smaller, the loss of slurry support pressure caused by slurry infiltration is actually higher, thus leading to this phenomenon. Further analysis demonstrates that under ideal conditions without considering slurry infiltration, the safety factors corresponding to three failure angles (55°, 60°, and 65°) all exceed 1.0, satisfying stability requirements. However, when the slurry support pressure loss due to slurry infiltration is considered, the safety factors exhibit varying degrees of reduction. Particularly noteworthy is the case with a failure angle of 65° and upper boundary at 7 m (i.e., instability body thickness of 3 m), where the safety factor decreases by approximately 0.14, representing a 13% reduction. This shifts the stability assessment from a stable state (
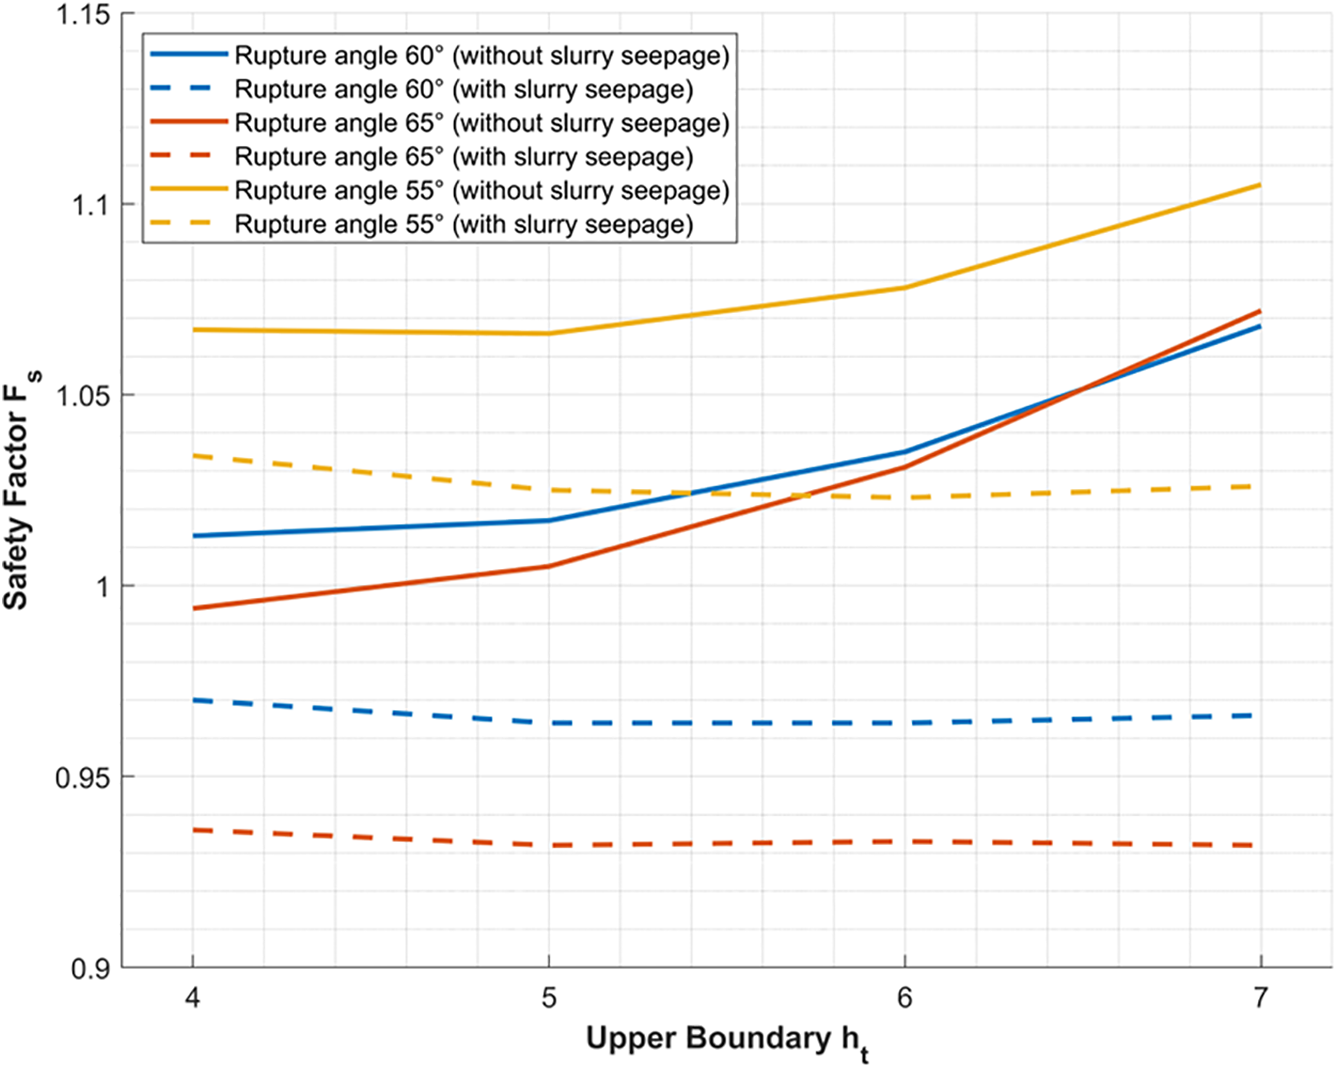
Figure 13: Reduction effect of slurry seepage on safety factor
This study has examined the local instability issues associated with shallow-buried thick sand strata during trench excavation for diaphragm wall construction. It develops an automatic identification method for locating local instability positions in these specific geological conditions, and performed an initial exploration of influence of slurry infiltration on local stability of shallow-buried thick sand layers. The primary conclusions are as follows:
(1) A model for automatic identification of local instability in shallow-buried thick sand layers has been developed using three-dimensional limit equilibrium theory and a genetic algorithm, addressing the shortcomings of traditional methods that typically regard the entire weak layer as the instability zone. The model establishes three undetermined parameters (failure angle, upper boundary, and thickness of the local instability mass) that define the search space for the local instability mass. It can then autonomously identify the most potentially dangerous position of the local instability mass and calculate the minimum safety factor. Validation through the Rhine River project case in France indicated that when the trench width reached 5.5 m, the model-calculated instability position in the shallow-buried thick sand layer (upper boundary 4.02 m, lower boundary 10.81 m) aligned well with field observations.
(2) Parameter sensitivity analysis indicates that both the difference between slurry level and groundwater level and the friction angle of sand strata significantly affect the safety factor of local instability in thick sand strata, with notable coupling effects between these two factors. In contrast, trench width exhibits a nearly linear relationship with the safety factor, yet its influence operates independently of soil strength parameters. Additionally, surcharge load has a greater impact on the safety factor when the friction angle is higher. Regarding the failure mechanism, the failure angle of the local instability mass remains stable at approximately 60°, whereas the upper boundary position and thickness of the instability mass are significantly influenced by geological conditions and construction parameters.
(3) The exploratory experimental study reveals that support pressure reduction due to slurry infiltration significantly affects local stability safety factors. A critical finding is that when infiltration effects are considered, the safety factor does not exhibit the sharp increase typically observed in conventional analyses as instability body thickness decreases. For an instability body with a failure angle of 65° and an upper boundary at 7 m as an example, the safety factor decreased by approximately 0.14 (a 13% reduction) when accounting for infiltration effects, shifting the stability assessment from stable (
(4) Based on these findings, several critical considerations for field applications are recommended: maintaining adequate hydraulic head difference between slurry level and groundwater level with continuous monitoring; adjusting slurry properties when encountering coarse-grained, highly permeable sand strata by increasing slurry density and incorporating coarser particles to enhance mud cake formation and pore blocking; and implementing multi-depth pore pressure monitoring systems for real-time tracking of seepage pressure distribution evolution. These measures are essential for improving construction safety in shallow-buried thick sand strata.
Acknowledgement: The research is supported by the Fundamental Research Funds for the Central Universities (No. 02302350113).
Funding Statement: The research is supported by the Fundamental Research Funds for the Central Universities (No. 02302350113).
Author Contributions: The authors confirm contribution to the paper as follows: Conceptualization, Yuhang Liu; methodology, Yuhang Liu and Xiaoying Zhuang; validation, Yuhang Liu; formal analysis, Huilong Ren; investigation, Huilong Ren; resources, Xiaoying Zhuang; writing—original draft preparation, Yuhang Liu; writing—review and editing, Xiaoying Zhuang and Huilong Ren; visualization, Yuhang Liu; supervision, Xiaoying Zhuang. All authors reviewed the results and approved the final version of the manuscript.
Availability of Data and Materials: All data generated or analyzed during this study are included in this published article.
Ethics Approval: Not applicable.
Conflicts of Interest: The authors declare no conflicts of interest to report regarding the present study.
Nomenclature
| Effective vertical stresses at the upper surface of the assumed local instability mass within the shallowly buried thick sand strata (kPa) | |
| Effective vertical stresses at the upper surface of the shallowly buried thick sand strata (kPa) | |
| Effective cohesion of the shallowly buried thick sand strata (kPa) | |
| Effective cohesion of the | |
| Effective unit weight of the shallowly buried thick sand strata (kN/m3) | |
| Effective unit weight of the | |
| Effective vertical stresses at the lower boundaries of the | |
| Effective vertical stresses at the upper lower boundaries of the | |
| Effective friction angle of the shallowly buried thick sand strata (°) | |
| Effective friction angle of the | |
| Depth from the ground surface to the lower surface of the assumed local instability mass (m) | |
| Depth from the ground surface to the upper surface of the assumed local instability mass (m) | |
| Factor of safety | |
| Depth from the ground surface to the lower boundary of the shallowly buried thick sand strata (m) | |
| Depth from the ground surface to the upper boundary of the shallowly buried thick sand strata (m) | |
| Coefficient of earth pressure at rest | |
| Thickness of the assumed local instability mass (m) | |
| Effective weight (kN) | |
| Trench width (m) | |
| Support force along the failure surface (kN) | |
| Actual support force of the retaining slurry (kN) | |
| Vertical force of the overlying soil (kN) | |
| Friction force along the failure surface (kN) | |
| Lateral friction force (kN) | |
| Failure angle (°) |
References
1. Daniel R, Jeffrey E, Nathan C. Soil-bentonite slurry trench cutoff wall longevity. IFCEE 2018. 2018;131(8):214–223. doi:10.1061/9780784481608.021. [Google Scholar] [CrossRef]
2. Lei MF, Liu LH, Lin YX, Shi CH, Yang WC, Cao CY, et al. Research progress on stability of slurry wall trench of underground diaphragm wall and design method of slurry unit weight. Adv Civil Eng. 2019;2019(1):25. doi:10.1155/2019/3965374. [Google Scholar] [CrossRef]
3. Cała M, Le TCT, Stopkowicz A. Three-dimensional and two-dimensional stability analysis of bentonite slurry trenches using a shear strength reduction technique and limit equilibrium methods. Appl Sci. 2024;14(12):5251. doi:10.3390/app14125251. [Google Scholar] [CrossRef]
4. Wong GCY. Stability analysis of slurry trenches. J Geotech Eng. 1984;110(11):1537–696. doi:10.1061/(ASCE)0733-9410(1984)110::11(1577). [Google Scholar] [CrossRef]
5. George F, Tiffany A, Richard D. Stability of long trenches in sand supported by bentonite-water slurry. J Geotech Geoenviron Eng. 2004;9(130):915– 21. doi:10.1061/(ASCE)1090-0241(2004)130:9(915). [Google Scholar] [CrossRef]
6. Li YC, Pan Q, Cleall PJ, Chen YM, Ke H. Stability analysis of slurry trenches in similar layered soils. J Geotech Geoenviron Eng. 2013;139(12):2104–9. doi:10.1061/(asce)gt.1943-5606.0000958. [Google Scholar] [CrossRef]
7. Huang MS, Wang HY, Tan TZ, Li YL. Engineering evaluation method for overall stability of slurry trenches. Chinese J Geotech Eng. 2021;43(5):795–803. doi:10.11779/CJGE202105002. [Google Scholar] [CrossRef]
8. Huang MS, Tan TZ, Shi ZH. Iterative horizontal method of slices for global stability of slurry trench in layered cohesive-frictional soils. Int J Geomech. 2023;23(2):395. doi:10.1061/ijgnai.Gmeng-7949. [Google Scholar] [CrossRef]
9. Zhang JW, Gao YF, Zhang F, Wan YK, Liu MC. Influence of anisotropy and nonhomogeneity on stability analysis of slurry-support trenches. Int J Geomech. 2018;18(5):109. doi:10.1061/(asce)gm.1943-5622.0001151. [Google Scholar] [CrossRef]
10. Liu W, Shi PX, Cai GQ, Gan PL. A three-dimensional mechanism for global stability of slurry trench in frictional soils. Eur J Environ Civil Eng. 2019;26(2):594–619. doi:10.1080/19648189.2019.1667876. [Google Scholar] [CrossRef]
11. Wang HY, Huang MS, Liu YH, Chian SC. Discretization-based kinematic approach for three-dimensional stability analysis of slurry trenches in cohesive-frictional soils. Int J Geomech. 2024;24(1):517. doi:10.1061/ijgnai.Gmeng-8857. [Google Scholar] [CrossRef]
12. Chen LL, Zhang WG, Paneiro G, He YW, Hong L. Efficient numerical-simulation-based slope reliability analysis considering spatial variability. Acta Geotechnica. 2023;19(5):2691–713. doi:10.1007/s11440-023-02138-2. [Google Scholar] [CrossRef]
13. Hong L, Wang XY, Zhang WG, Li YQ, Zhang RH, Chen CX. System reliability-based robust design of deep foundation pit considering multiple failure modes. Geosci Front. 2024;15(2):101761. doi:10.1016/j.gsf.2023.101761. [Google Scholar] [CrossRef]
14. Pang R, Yao HY, Xu MY, Zhou Y. Slope displacement reliability analysis considering rock parameters spatial variability subjected to stochastic mainshock-aftershock earthquake. Reliab Eng Syst Safe. 2024;251:110337. doi:10.1016/j.ress.2024.110337. [Google Scholar] [CrossRef]
15. Shen C, Zhou SH. Local stability of slurry trench in sandwiched sand layer with confined water pressure. ICTE. 2013;20132013(71):2540–48. doi:10.1061/9780784413159.369. [Google Scholar] [CrossRef]
16. Han CY, Wang JH, Xia XH, Chen JJ. Limit analysis for local and overall stability of a slurry trench in cohesive soil. Int J Geomech. 2015;15(5):1105. doi:10.1061/(asce)gm.1943-5622.0000268. [Google Scholar] [CrossRef]
17. Liu Y, Liu W, Shi PX, Zhao Y. Local instability analysis of the ultra-deep wall-to-slotted in water rich soft layer. Rock Soil Mech. 2020;41(S1). doi:10.16285/j.rsm.2019.1130. [Google Scholar] [CrossRef]
18. Liu W, Shi P, Cai G, Cao C. Seepage on local stability of slurry trench in deep excavation of diaphragm wall construction. Comput Geotech. 2021;129(9):103878. doi:10.1016/j.compgeo.2020.103878. [Google Scholar] [CrossRef]
19. Muller-Kirchenbauer K. Stability of slurry trenches. In: Proceedings of the 5th European Conference on Soil Mechanics and Foundation Engineering. Madrid, Spain: Sociedad Española de Mecánica del Suelo y Cimentaciones; 1972. p. 543–53. [Google Scholar]
20. Yuan HZ, Zhang ZX, Huang X, Li Y. Comparing, slurry infiltration characteristics between calcareous and silica sands based on slurry infiltration column tests and CT scanning. Tunnelling Undergr Space Technol. 2024;152:105919. doi:10.1016/j.tust.2024.105919. [Google Scholar] [CrossRef]
21. Ning J, Huang M, Yu J. Modelling of slurry infiltration in saturated porous media integrating particle dispersion and blockage. Comput Geotech. 2025;177(3):106875. doi:10.1016/j.compgeo.2024.106875. [Google Scholar] [CrossRef]
22. Liu J, Hanley KJ. Simulation of non-spherical slurry particle re-infiltration dynamics in shield tunnelling using CFD-DEM. Tunnelling Undergr Space Technol. 2025;163(5):106694. doi:10.1016/j.tust.2025.106694. [Google Scholar] [CrossRef]
23. Cheng Y, Wang T, Wang P, Qin S, Zhou WH, Yin ZY. Hydromechanical analysis of slurry infiltration with coupled CFD-DEM method. Int J Numer Anal Methods Geomech. 2024;48(11):3032–53. doi:10.1002/nag.3762. [Google Scholar] [CrossRef]
24. Tsai JS, Chang CC, Jou LD. Lateral extrusion analysis of sandwiched weak soil in slurry trench. J Geotech Geoenviron. 1998;124(11):1082–90. doi:10.1061/(Asce)1090-0241(1998)124:. [Google Scholar] [CrossRef]
25. Yan YH, Li MG, Chen HB, Xie XL, Wang JF, Chen JJ. Performances of deep circular excavation above an ultra-thick confined aquifer: numerical simulations and field measurement. Geomech Geoeng. 2025;2025(8):1–20. doi:10.1080/17486025.2025.2529860. [Google Scholar] [CrossRef]
26. Xu T, Bezuijen A. Analytical methods in predicting excess pore water pressure in front of slurry shield in saturated sandy ground. Tunnelling Undergr Space Technol. 2018;73(2):203–11. doi:10.1016/j.tust.2017.12.011. [Google Scholar] [CrossRef]
27. Xu T, Bezuijen A. Bentonite slurry infiltration into sand: filter cake formation under various conditions. Geotechnique. 2019;69(12):1095–106. doi:10.1680/jgeot.18.P.094. [Google Scholar] [CrossRef]
28. Hu X, Fang Y, Walton G, He C. Laboratory model test of slurry shield tunnelling in saturated sandy soil. Geotechnique. 2022;73(10):885–906. doi:10.1680/jgeot.21.00066. [Google Scholar] [CrossRef]
Cite This Article
 Copyright © 2025 The Author(s). Published by Tech Science Press.
This work is licensed under a Creative Commons Attribution 4.0 International License , which permits unrestricted use, distribution, and reproduction in any medium, provided the original work is properly cited.
 Downloads
 Citation Tools