
 Submit a Paper
 Propose a Special lssue
 Open Access
ARTICLE

Cavitation Performance Analysis of Tip Clearance in a Bulb-Type Hydro Turbine
1 School of Energy and Power Engineering, Lanzhou University of Technology, Lanzhou, 730050, China
2 Key Laboratory of Solar Power Generation System of Gansu Province, Jiuquan Vocational Technical University, Jiuquan, 735000, China
3 Tianjin Tianfa Heavy Hydropower Equipment Manufacturing Co., Ltd., Tianjin, 300400, China
* Corresponding Author: Qifei Li. Email:
(This article belongs to the Special Issue: Modeling and Applications of Bubble and Droplet in Engineering and Sciences)
Computer Modeling in Engineering & Sciences 2025, 145(1), 411-429. https://doi.org/10.32604/cmes.2025.069639
Received 27 June 2025; Accepted 03 September 2025; Issue published 30 October 2025
 View Full Text
 Download PDF
Abstract
Bulb-type hydro turbines are commonly used in small- to medium-scale hydropower stations due to their compact design and adaptability to low-head conditions. However, long-term operation often results in wear at the runner rim, increasing tip clearance and triggering leakage flow and cavitation. These effects reduce hydraulic efficiency and accelerate blade surface erosion, posing serious risks to unit safety and operational stability. This study investigates the influence of tip clearance on cavitation performance in a 24 MW prototype bulb turbine. A three-dimensional numerical model is developed to simulate various operating conditions with different tip clearance values (3.0, 4.5, and 6.0 mm) and cavitation numbers (σ = 1.20–1.33). Internal flow characteristics—including pressure distribution, velocity fields, hydraulic efficiency, and pressure pulsation—are analyzed to elucidate the impact of tip clearance on cavitation development. Results show that under σ = 1.2 and a 4.5 mm tip clearance, the pressure pulsation amplitude at the blade tip reaches 4870 Pa—approximately 1.5 times higher than that near the hub. At partial flow conditions, turbine efficiency decreases by up to 6.8% compared to the rated condition. Increasing the tip clearance from 1.5 to 6.0 mm expands the low-pressure area near the blade tip by around 32%, significantly intensifying cavitation. Frequency domain analysis reveals dominant pulsation frequencies between 10–20 Hz, characterized by blade-passing features and a wave-clipping effect. These findings provide theoretical insight and quantitative evidence to support the optimization of tip clearance design and cavitation mitigation strategies in bulb turbines, aiming to improve both efficiency and operational stability.Keywords
Bulb-type hydro turbines are widely adopted in small- to medium-scale hydropower stations due to their compact structure, flexible layout, and suitability for low-head flow conditions. Compared to traditional Francis or axial-flow turbines, bulb turbines feature a more direct runner arrangement and a shorter flow path, leading to higher energy conversion efficiency [1]. However, this inherent structural configuration also renders them particularly vulnerable to complex, unstable flow phenomena [2]. Key issues include tip clearance leakage, unsteady flow separation, and cavitation inception and evolution during operation [3–5]. Among these, the tip clearance between the runner rim and the casing is recognized as a critical parameter, significantly influencing the hydraulic performance, efficiency, and cavitation resistance of the turbine [6,7].
Over time, operational wear, thermal deformation, and assembly tolerances inevitably lead to enlargement of the tip clearance [8]. This geometric change fundamentally alters the flow dynamics around the blade tips. This enlargement intensifies leakage flow and leads to the expansion of low-pressure zones near the blade tip, which may trigger cavitation. Cavitation not only reduces turbine efficiency and amplifies noise and vibration, but may also cause material damage and fatigue cracking [9–13]. At the microstructural level, studies like that of Wang and Zhang [14] on CA6NM hydro turbine steel revealed that cavitation erosion can induce a phase transformation from austenite to strain-induced martensite. Stress concentration at the interface of these mismatched lattice structures initiates and propagates cracks, providing a fundamental explanation for the cavitation-induced damage mechanisms in turbine components.
To mitigate these adverse effects, significant research efforts have been directed towards cavitation control strategies and optimizing key geometric parameters. For instance, air injection has emerged as a practical technique. For instance, Praveen et al. [15] demonstrated that air injection effectively reduces vortex-induced vibration and noise in bulb turbines, improving operational stability under high-load conditions. Similarly, Gao et al. [16] comprehensively investigated the effect of cavitation evolution on the power characteristics of tidal current turbines. Their study revealed that as the cavitation number decreases below critical thresholds (around 1.3 and 0.8), vapor distribution expands significantly, leading to substantial reductions in both viscous power (due to decreased mixture viscosity) and pressure difference power (due to reduced blade loading and adverse pressure gradients), ultimately causing a drastic decline in the blade power coefficient (down to 14% at σ = 0.5).
In a broader context, cavitation remains highly sensitive to off-design conditions in various turbine types, such as Francis and tidal turbines. Altintas et al. [17] reported that steady-state and transient simulations yield significantly different predictions of cavitation evolution. Transient simulations more accurately capture asymmetric flow behavior and cavitation losses, thus offering a more realistic estimation of turbine efficiency. Capone et al. [18] investigated the impact of cavitation and inflow perturbations on a horizontal-axis tidal turbine, demonstrating that both the type (e.g., sheet, cloud) and location of cavitation directly influence the turbine’s hydrodynamic performance and distinct acoustic signature. This body of work collectively underscores the complex, multi-faceted nature of cavitation and the necessity for its accurate identification, characterization, and control.
Despite these significant advances in cavitation control strategies, vortex structure analysis, and numerical/experimental characterization techniques, systematic studies specifically addressing the influence of tip clearance variation on the cavitation evolution dynamics, resultant energy performance, and induced pressure pulsation characteristics in bulb-type hydro turbines remain notably limited [19]. Existing work often emphasizes either global flow path optimization or specific mitigation techniques like air injection, frequently overlooking the direct hydraulic significance and impact of the structural tip clearance dimension itself as a primary design and operational variable [20,21]. Furthermore, comprehensive quantitative analyses that explicitly couple the intensity and morphology of cavitation structures with efficiency variations across a representative range of operating conditions (head, discharge, cavitation number) are still lacking for this turbine type.
Therefore, this study focuses on a 24 MW bulb-type hydro turbine widely used in engineering practice. Using a CFD (Computational Fluid Dynamics)-based approach, the effects of tip clearance and cavitation number on flow structure evolution, cavitation development, pressure pulsation characteristics, and turbine efficiency are thoroughly investigated. The objective is to provide theoretical insights and technical references for optimizing tip clearance and enhancing cavitation resistance in bulb-type hydro turbines.
2 Numerical Methods and Cavitation Flow Theory
2.1 Numerical Simulation Approach
In this study, a 24 MW prototype bulb-type hydro turbine from a hydropower station is selected as the research object. The station has a total installed capacity of 96 MW, with an annual average power generation of 491 million kWh. Based on the main design parameters (see Table 1), a complete three-dimensional computational domain and boundary surfaces were constructed, as illustrated in Fig. 1. The computational domain includes the inlet passage of the water conveyance system, guide vane region, runner domain, and draft tube. Boundary surfaces are used for applying boundary conditions and extracting calculation results.
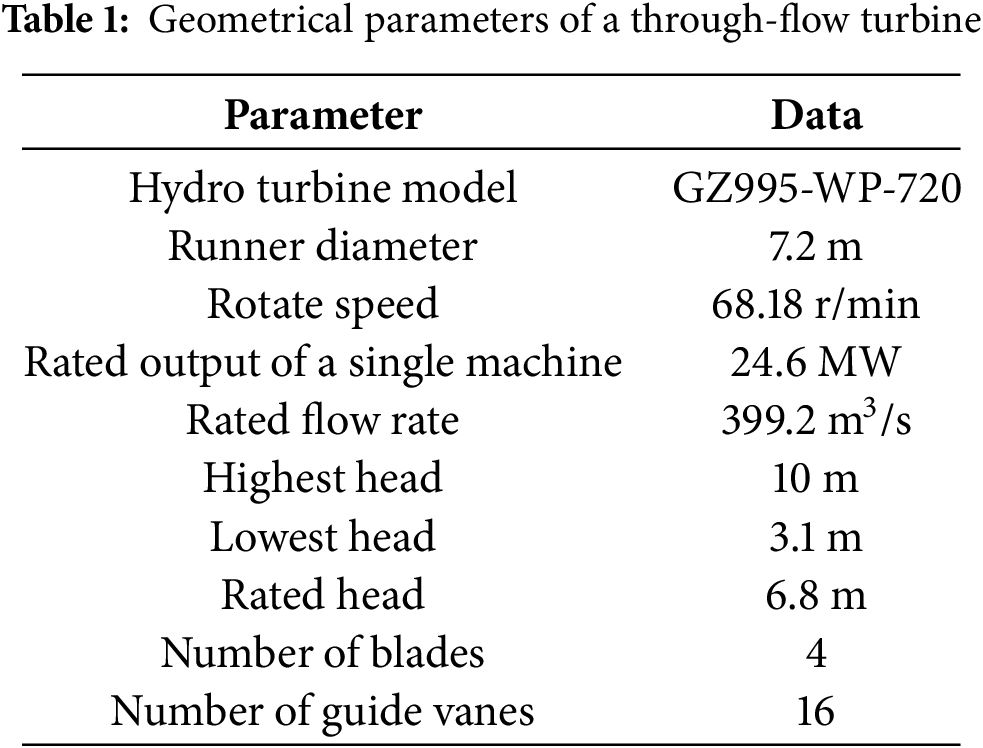
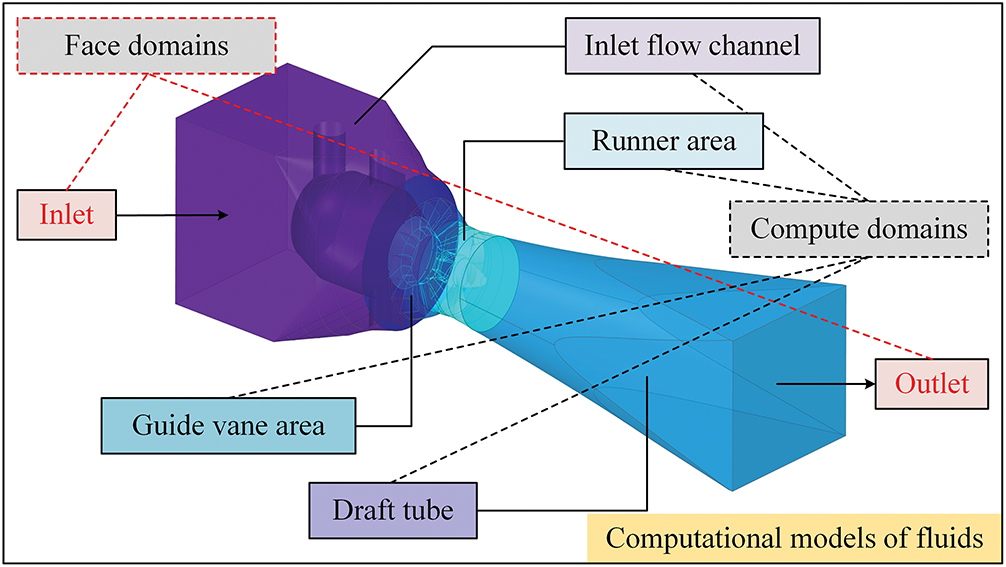
Figure 1: Schematic representation of a 3D hydro turbine flow field model
For the three-dimensional flow field simulation, water is treated as an incompressible fluid due to its negligible compressibility and minimal temperature variation during turbine operation. Therefore, the energy equation is omitted, and only the continuity equation and Navier–Stokes momentum equations are solved to describe the viscous, incompressible flow behavior [1].
In these governing equations: ρ represents the fluid density; μ denotes the velocity vector, with components u, v, and w in the x, y, and z directions, respectively; P is the pressure; Su, Sv, and Sw are the generalized source terms in each coordinate direction; φ is the dynamic viscosity coefficient. Given the complex curved geometry of the guide vanes, runner blades, and casing surfaces, and to accurately capture overall flow characteristics, the SST (Shear Stress Transport) k-ε turbulence model is adopted in this study.
Mesh generation was tailored to the geometric features of different components in the computational domain. Structured hexahedral grids were applied to regions with regular geometries such as the upstream conduit, bulb housing, and draft tube. In contrast, the runner region—featuring high blade curvature and complex surfaces—was meshed using unstructured tetrahedral elements, ensuring mesh adaptability to surface geometry while maintaining sufficient boundary layer resolution.
To ensure mesh quality and solution reliability, a mesh independence study was performed under a typical operating condition of φ = 25, n11 = 118.31 r/min, as shown in Fig. 2a. Simulations were conducted using various mesh densities. Results indicate that when the total cell count reaches approximately 10 million, the computed turbine efficiency becomes stable, and further refinement has minimal impact on the outcome—demonstrating good mesh independence. Accordingly, all subsequent simulations adopt a mesh system consisting of 8,998,552 elements. Fig. 2b illustrates the final mesh distribution adopted in this study.
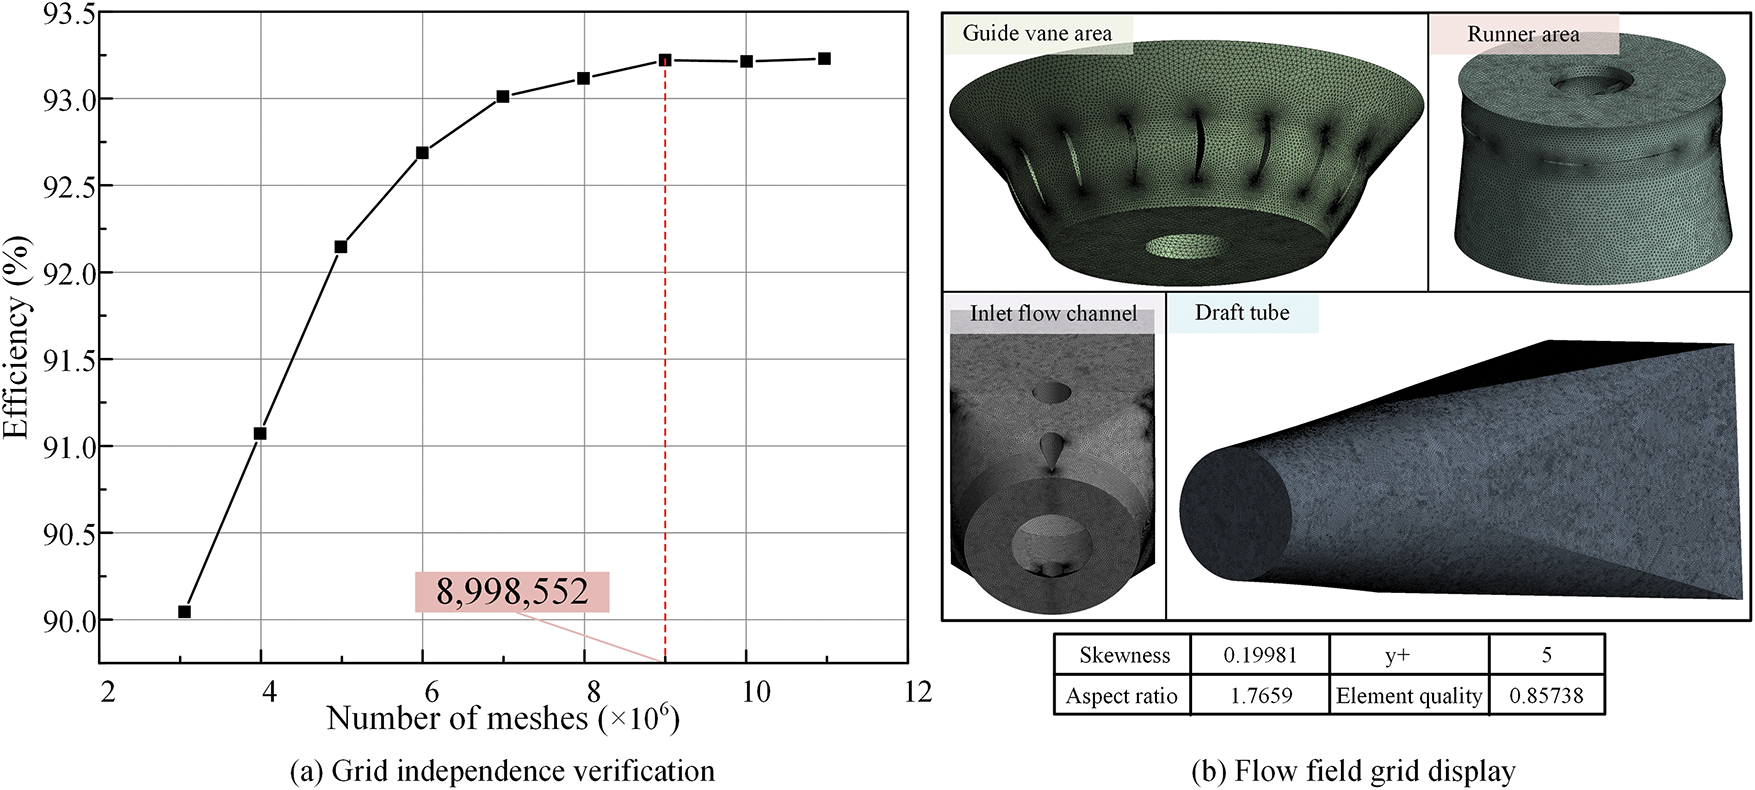
Figure 2: Grid independence verification and mesh structure display
2.2 Cavitation Criterion and Operating Conditions
During the operation of fluid machinery, when the local pressure in the flow field drops below the saturated vapor pressure at a given temperature, the liquid undergoes vaporization, forming a large number of vapor bubbles—i.e., cavitation occurs. As these bubbles are transported into high-pressure regions, they collapse rapidly, generating localized high-frequency impacts, pressure fluctuations, and cavitation erosion. This not only causes material damage on blade surfaces but also leads to efficiency loss and reduced service life of the hydro turbine. Therefore, accurately predicting and controlling cavitation is critical for the design and optimization of hydro turbines.
Considering the flow as incompressible and adiabatic, and assuming a statistically steady operating condition, the Bernoulli equation is applied between a free surface (∞) and the point of minimum pressure (k), as shown in Eq. (2). However, it is crucial to note that the internal flow field, particularly in the presence of cavitation and tip clearance effects, exhibits significant unsteadiness. To accurately capture the evolution of cavitation structures, vortex dynamics, and pressure pulsations, the numerical simulations presented in this study were performed using a transient approach (The software version used is ANSYS Fluent 2023). Consequently, the governing equations solved, including the continuity and momentum equations (Eq. (1)), retain the time-dependent derivative terms to resolve these transient phenomena. The application of the Bernoulli equation (Eq. (2)) relates the time-averaged pressure conditions at these points for cavitation analysis under the specified operating condition.
here, p∞ is the inlet (reference) pressure, ρ is the fluid density, g is gravitational acceleration, v∞ and vk are the flow velocities at the reference point and the minimum pressure point, respectively, and z∞ and zk are the corresponding geometric elevations. pk denotes the pressure at the lowest pressure point on the runner blade.
Due to the compact structure and short flow passage of bulb-type turbines, the flow velocity changes dramatically within the runner zone, making cavitation particularly sensitive in this type of turbine. To establish an effective cavitation criterion, cavitation theory models are often employed to describe the formation and collapse of vapor bubbles in the fluid [9]. A widely accepted condition for cavitation inception is based on the comparison between local pressure and vapor pressure. Cavitation may occur when the minimum local pressure pk is less than or equal to the saturated vapor pressure pv, i.e., pk ≤ pv [10].
To quantify the severity of cavitation, the cavitation number σ is introduced, defined as:
Here pk denotes the local static pressure at the monitoring point within the flow field; pv is the saturated vapor pressure of water at the operating temperature (≈1710 Pa absolute at 15°C); ρ is the fluid density; and v is the local flow velocity. In this study, pressures in the CFD model are reported in absolute terms unless otherwise specified. The reference pressure p∞ (0 Pa absolute, i.e., −101,325 Pa gauge) is only used to set the global operating condition, but the cavitation number itself is calculated based on the local pressure pk to ensure consistency with the standard definition and comparability with published results. This non-dimensional parameter represents the ratio between the pressure head resisting cavitation (the pressure difference between the reference pressure and vapor pressure) and the dynamic pressure promoting cavitation. A smaller σ indicates a higher risk of cavitation [11]. In hydro turbine applications, Eq. (4) can be rewritten as:
where Hs as reference head; Hv as vapor pressure head; H as velocity head.
To investigate the influence of tip clearance on the cavitation performance of bulb-type turbines, three representative operating conditions were selected for numerical simulation—namely, rated load, high flow rate, and low flow rate (see Table 2). Under each condition, multiple tip clearance values were set and coupled with different cavitation numbers to conduct a series of comparative simulations and flow field analyses. The goal is to systematically reveal how the variation in tip clearance affects cavitation development and intensity distribution, thereby providing theoretical insights and supporting data for clearance optimization and cavitation-resistant design strategies.
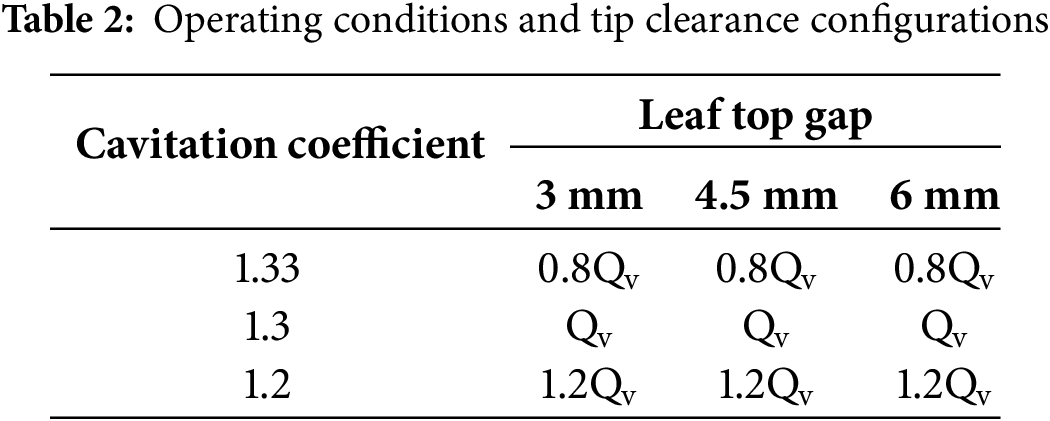
The selection of tip clearance values was based on current engineering research and practical wear conditions of bulb turbine runners. It is well known that during long-term operation, the rim region of the runner is prone to significant wear, often resulting in an actual clearance greater than the design value [12]. Referring to a typical clearance range of 0%–1.875% of the runner diameter (D1), this study selects three representative values: 3.0, 4.5, and 6.0 mm. Among them, 4.5 mm corresponds to the measured operational clearance and thus carries strong engineering relevance.
3 Flow Characteristics in the Runner Region
3.1 Pressure Distribution on Runner Blades
The variation in tip clearance within the runner casing significantly alters the internal flow structure of the runner zone, resulting in noticeable fluctuations in the surface pressure distribution on the blades. Consequently, the cavitation performance of the turbine deviates from the expected behavior originally targeted in hydraulic design. In particular, an increased tip clearance often leads to the expansion of low-pressure regions and an enhanced pressure gradient near the blade tip, thereby intensifying the risk of cavitation [13,22].
Fig. 3 illustrates the static pressure distribution on the blade suction surface under varying operating conditions and tip clearances. Crucially, the view is from the upstream (inlet) side looking downstream towards the outlet, with the blade pressure side facing away from the viewer and the suction side facing towards the viewer. The rotation direction is indicated by the arrow in the figure.
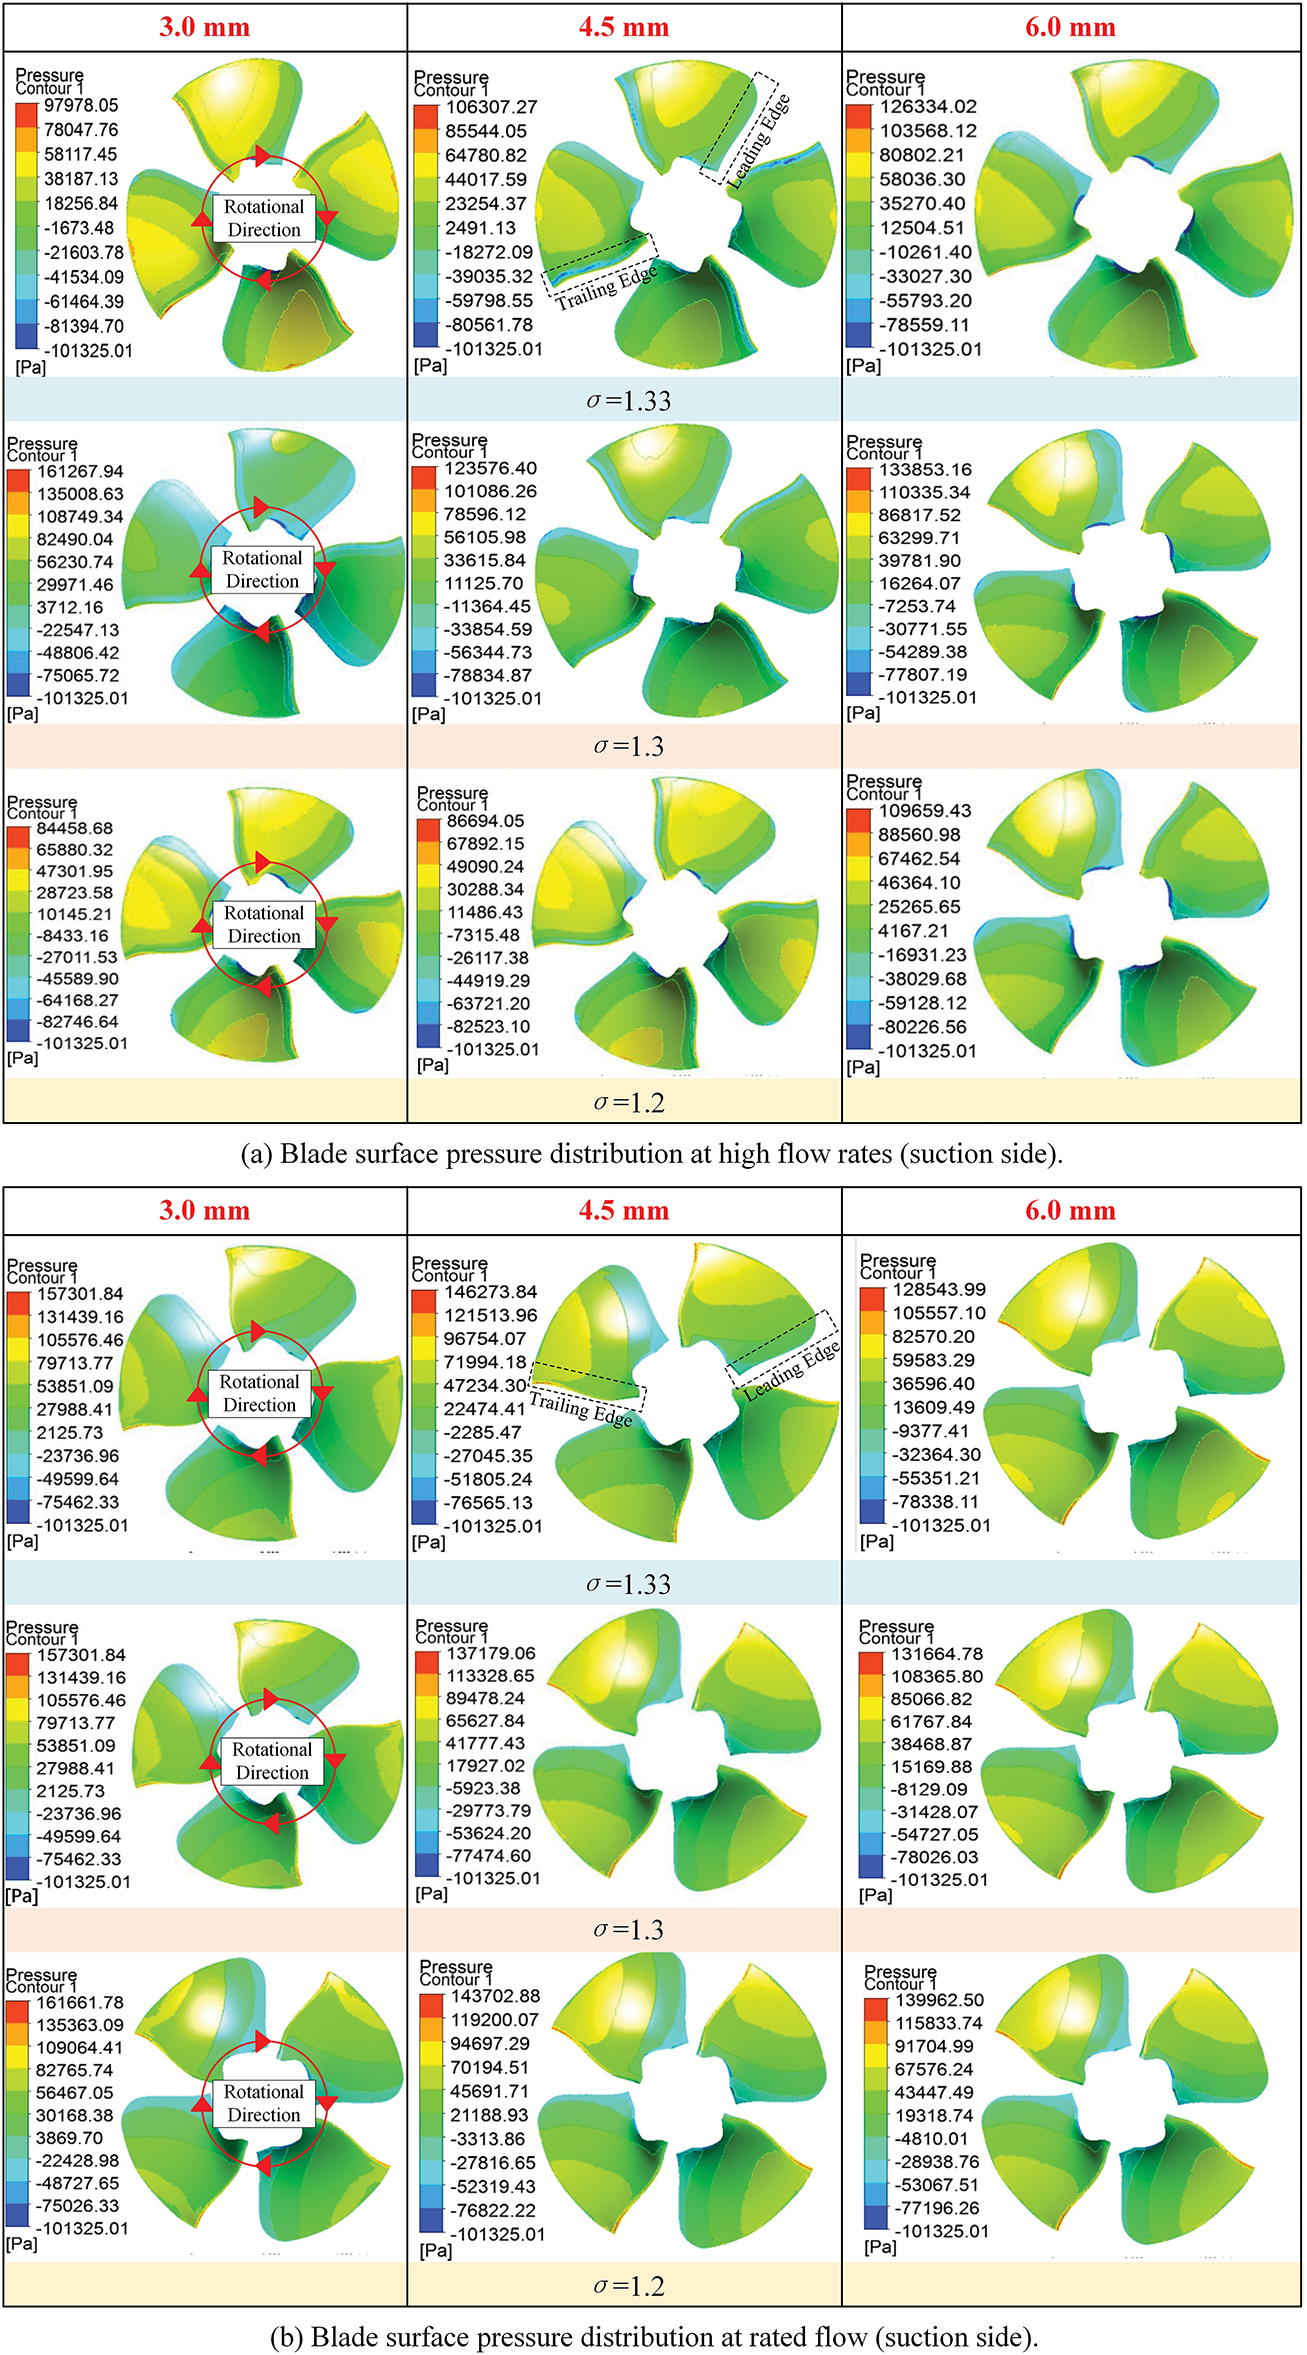
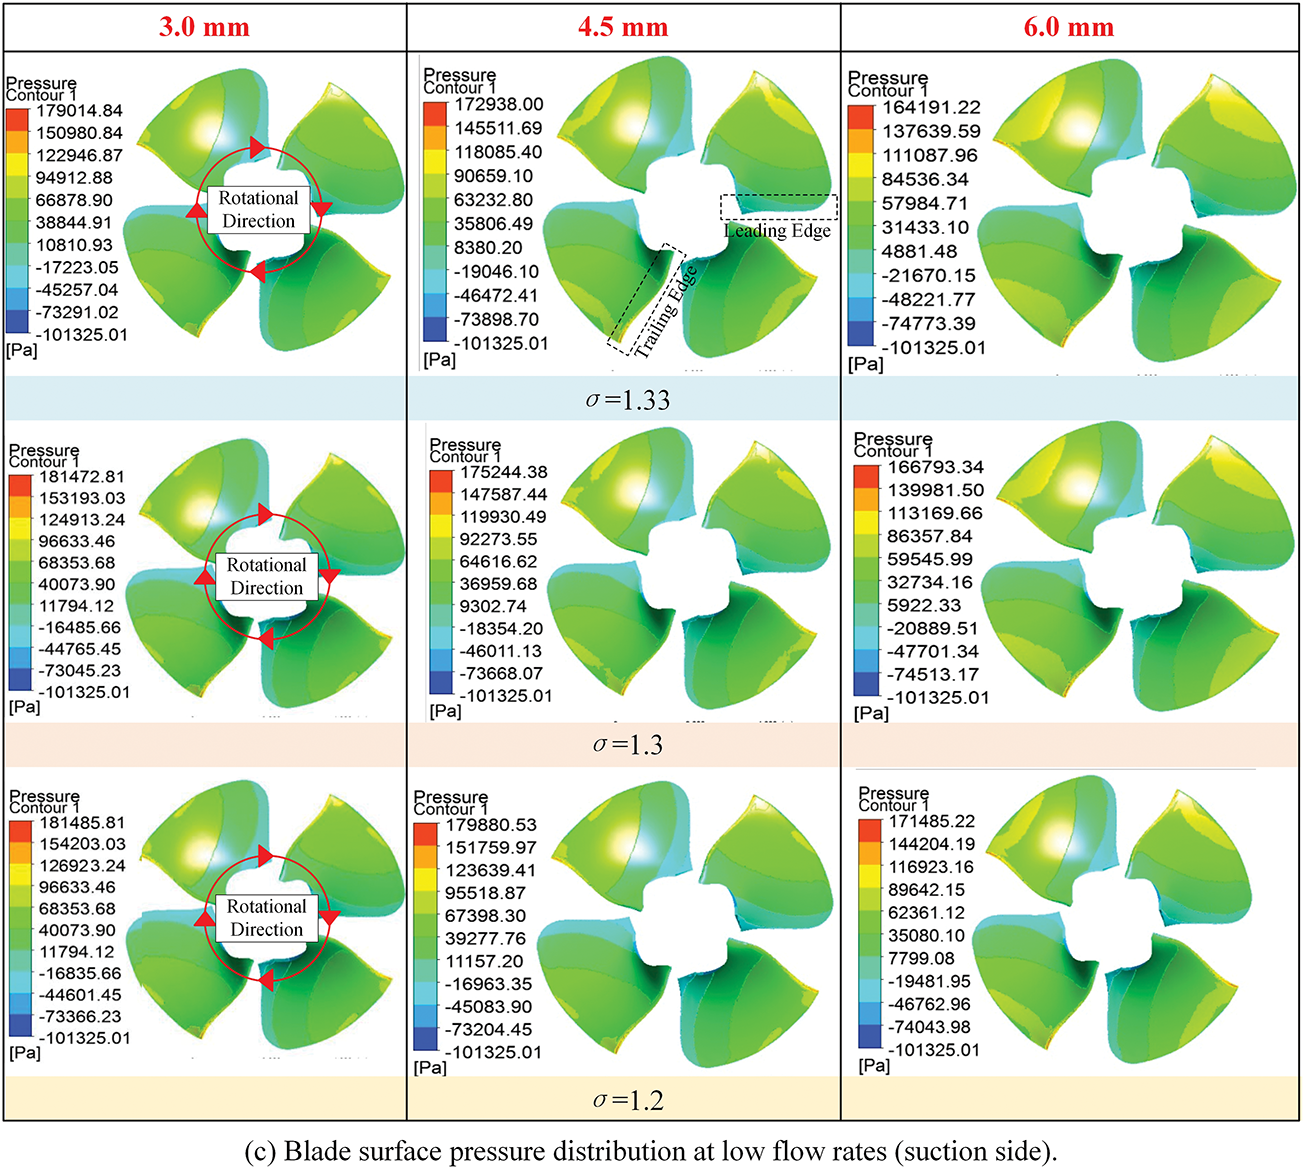
Figure 3: Blade surface pressure distribution under different working conditions
Fig. 3 illustrates the static pressure distribution on the blade suction surface (explicitly labeled in the figure) under varying operating conditions and tip clearances, viewed from the upstream perspective with rotation direction indicated. Contrary to conventional suction-surface expectations, the pressure distribution reveals a complex three-dimensional pattern where a pronounced low-pressure region consistently develops near the trailing edge at the hub, particularly evident in configurations like Fig. 3a. This phenomenon stems fundamentally from the inward radial migration of the tip leakage vortex (TLV) core and its dynamic interaction with hub secondary flows. As the TLV propagates downstream along the suction side, pressure gradients within the blade passage and momentum exchange with the hub passage vortex drive the low-pressure core toward the hub region, where downwash effects and localized flow separation create significant pressure depression at the trailing edge. It should be noted that the value reported as “−101,325 Pa” arises from the CFD solver’s use of gauge pressure, where the atmospheric pressure is defined as 0 Pa. Under this convention, 0 Pa absolute corresponds to −101,325 Pa gauge. In reality, the saturated vapor pressure of water at the operating temperature is positive in absolute terms (≈1710 Pa at 15°C). Therefore, the pressure constraint in the cavitation zone should be understood as 0 Pa absolute (−101,325 Pa gauge), rather than a physically negative vapor pressure.
Operational changes further modulate this pattern: Reduced flow rate amplifies the hub trailing-edge low-pressure zone due to diminished main flow momentum enhancing leakage and secondary flow dominance, while concurrently expanding high-pressure regions at the leading edge on the pressure side (not visible in this suction-side view) from increased incidence angles. Enlarging tip clearance systematically expands this hub trailing-edge low-pressure region chordwise and intensifies tip-to-hub pressure gradients, as strengthened TLV enhances radial migration and vortex interaction. This clearance effect promotes cavitation near the blade exit—a high-risk zone where operators typically apply anti-wear coatings against long-term erosion. Furthermore, reducing cavitation number under fixed clearance lowers overall surface pressure and causes the hub low-pressure zone to expand toward the trailing edge, forming distinct band-like regions with elevated cavitation susceptibility [23–26]. These clearance-induced alterations intensify cavitation risk beyond design expectations, primarily through TLV-hub interaction mechanisms evident in the pressure fields. Furthermore, the static pressure on the suction side is lower near the leading edge due to the strong flow acceleration, which is consistent with the onset of cavitation-prone regions. Toward the trailing edge, however, the local velocity decreases as the flow undergoes diffusion and partial energy recovery. This deceleration results in a static pressure rise, producing higher pressure values at the trailing edge compared to the leading edge. Such pressure recovery near the blade outlet is a typical feature of hydro turbine runners and does not contradict the overall pressure distribution trend.
3.2 Streamline Distribution on Runner Blades
To further investigate the influence of tip clearance on the internal flow structure and cavitation behavior of the runner, streamline visualization is employed to illustrate the dynamic features of the flow field. Compared to static pressure maps, streamline plots offer a more intuitive depiction of fluid paths, velocity gradients, and vortex structures, particularly useful for identifying leakage flows, separation zones, and turbulence regions [27–29].
As shown in the streamline plots (Fig. 4), the local velocity consistently increases along the radial direction from the hub to the blade tip, reaching a peak near the tip region. This trend is primarily attributed to the increasing circumferential velocity with blade radius, which reaches a maximum of 3.6 m in this case. The radial variation in velocity introduces significant shear layers, especially in the outer region, promoting the formation of tip vortices and flow instability.
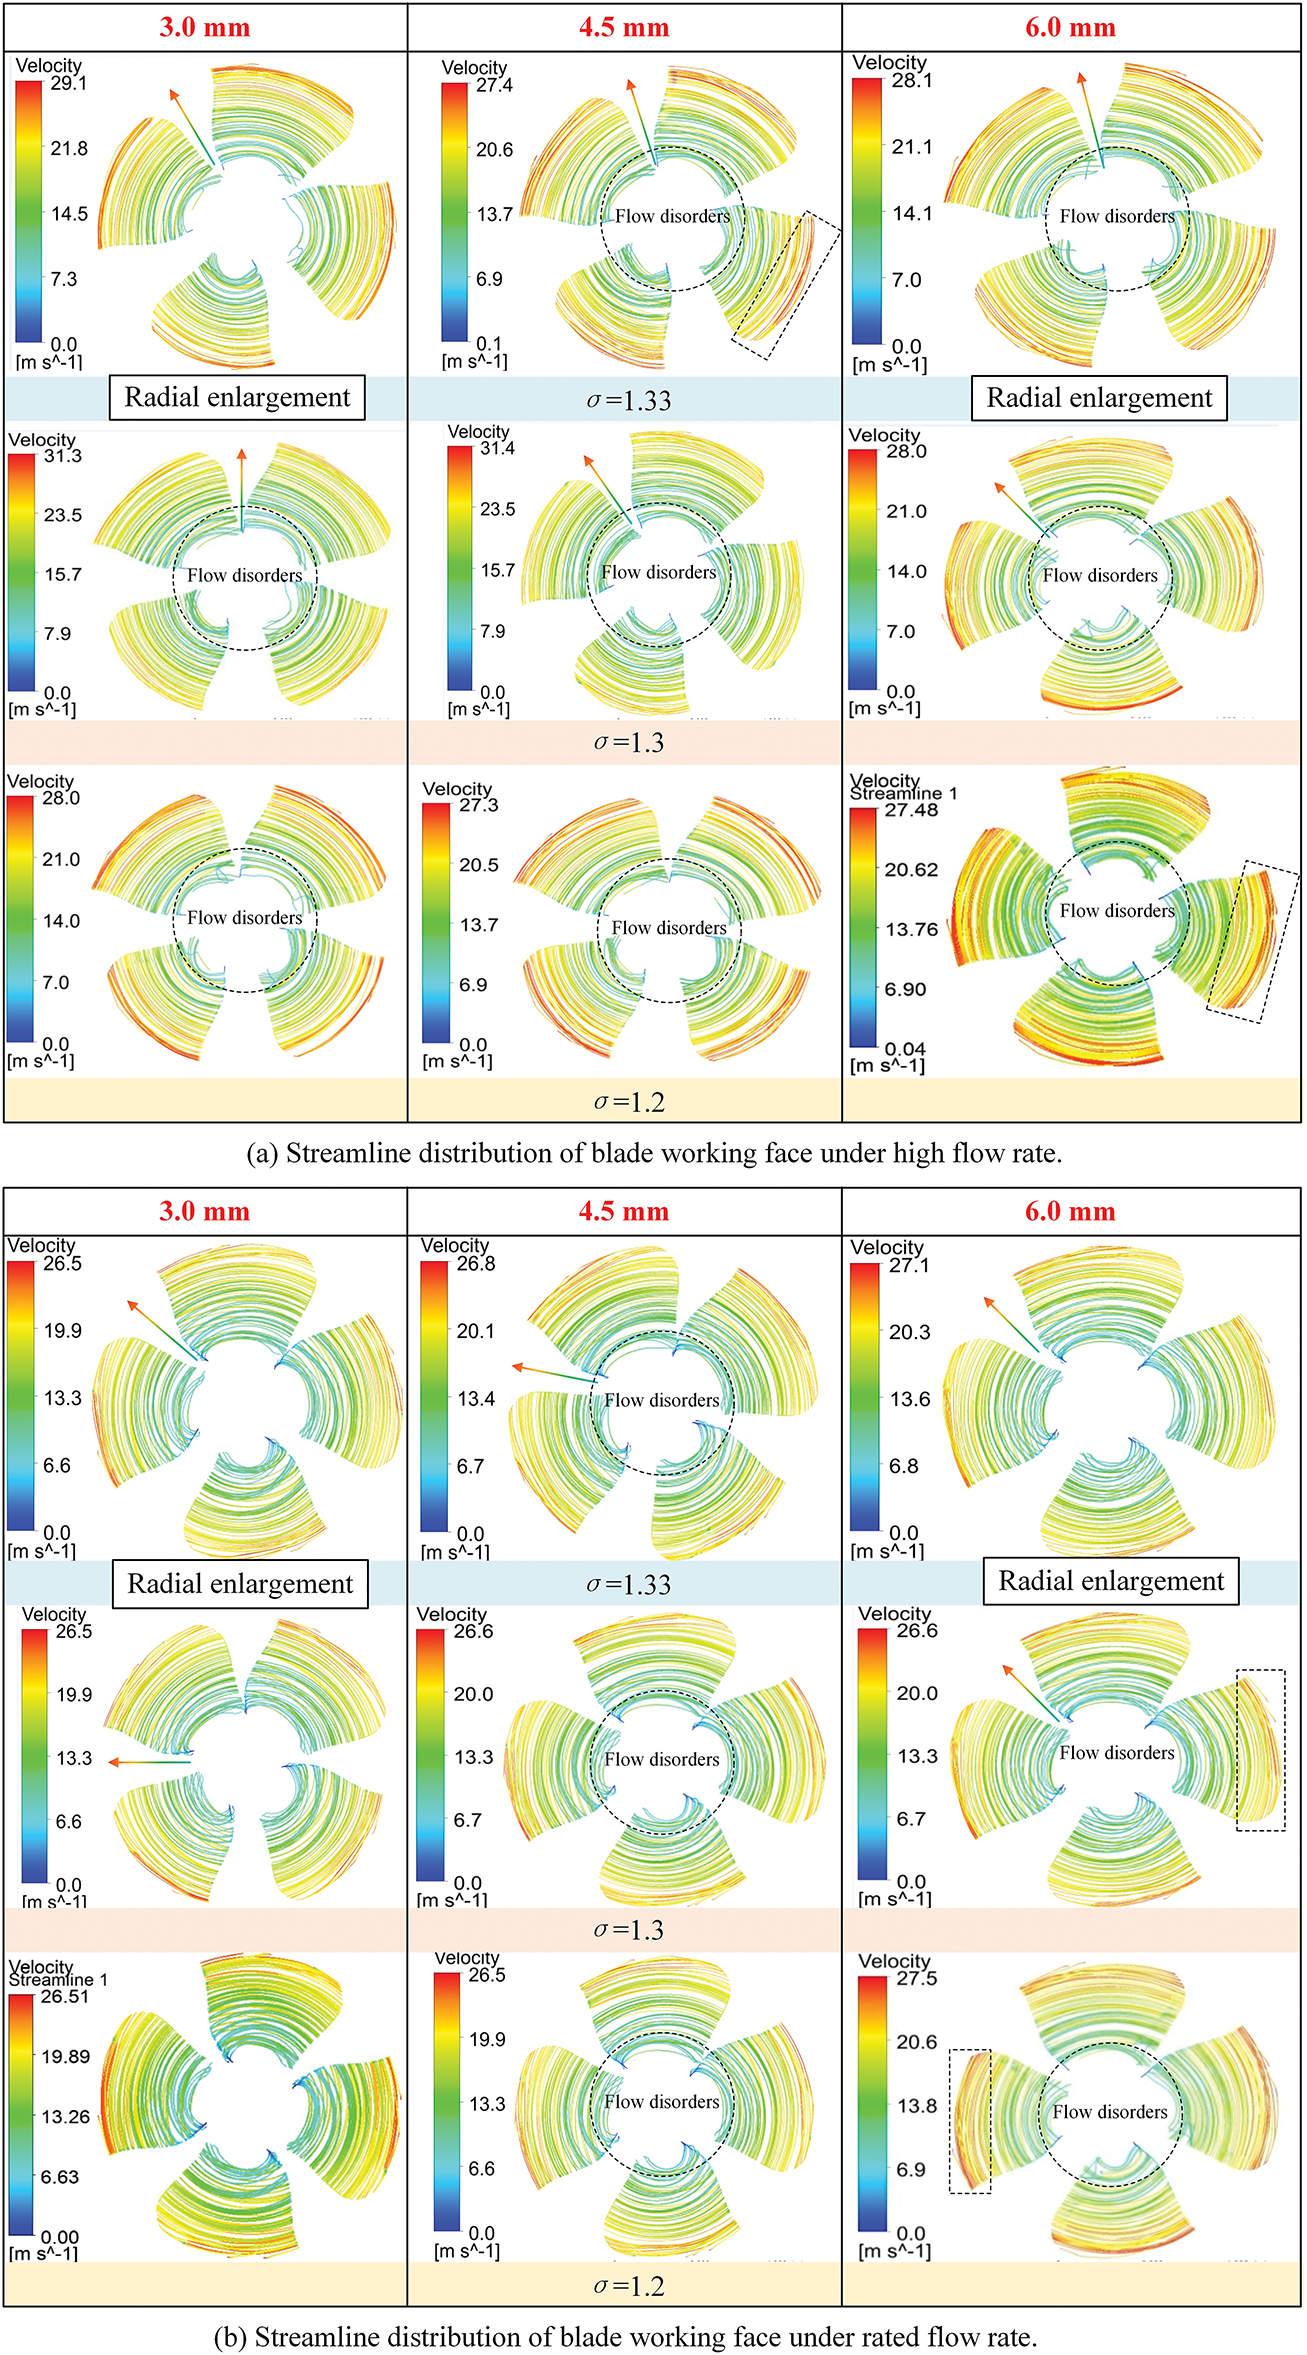
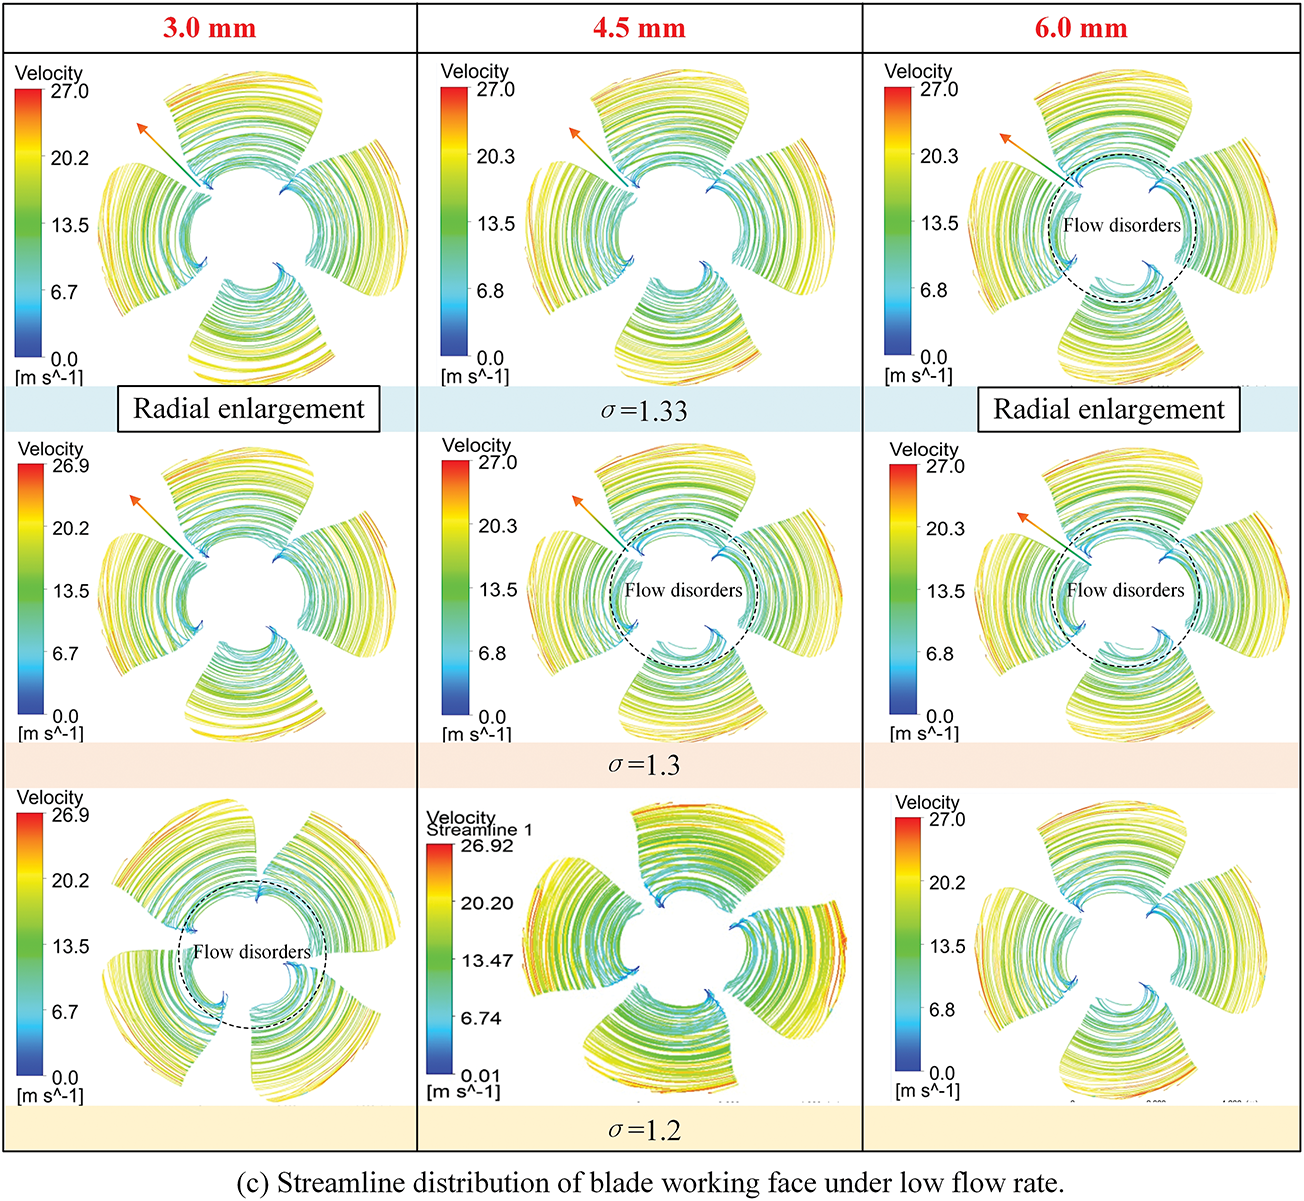
Figure 4: Streamline distribution of blade working face under different working conditions
The overall streamline distribution exhibits a concentric, axisymmetric pattern under all examined conditions, aligning with the cylindrical flow assumption often adopted in ideal hydraulic designs. However, it is important to clarify that the current numerical model omits gravity and hydrostatic effects. In actual horizontal-axis turbines, the hydrostatic pressure difference between the top and bottom of the runner may reach approximately 0.72 bar. This vertical pressure gradient can induce substantial asymmetries in both pressure and velocity distributions. Therefore, the observed symmetry in the streamline plots should be interpreted as an idealized pattern under gravity-free conditions, rather than direct evidence of real-world axial symmetry.
As the tip clearance increases, variations in streamline continuity become more pronounced near the blade tip; however, this behavior exhibits a clear dependence on flow rate. Under low-flow conditions, streamline distortion is most prominent in the 3.0 mm clearance case, especially in the mid-span region near the suction side, where strong leakage-induced vortices form. When the clearance increases to 4.5 mm, the streamline pattern near the blade tip becomes more ordered and smoother, with the disordered region reduced by approximately 20% compared to the 3.0 mm case, indicating partial flow recovery and suppression of leakage-induced turbulence. However, as the clearance further increases to 6.0 mm, the streamlines once again become unstable, and the extent of local disorder increases by approximately 10% relative to the 4.5 mm case, suggesting that excessive tip clearance promotes renewed flow separation and vortex shedding.
In contrast, under rated and high-flow conditions, this trend becomes less apparent. The influence of tip clearance on streamline irregularity diminishes as the incoming flow momentum increases, resulting in generally more stable flow structures across different clearance values. This indicates that the flow sensitivity to tip leakage is significantly higher under low-flow operation, where tip-induced disturbances can more easily disrupt the main flow field.
Streamline disorder typically initiates near the pressure side of the blade tip and extends downstream toward the trailing edge, forming well-defined tip leakage vortices. These vortices modify the local flow direction and energy distribution, leading to destabilization of the boundary layer and increasing local flow losses. The strengthened leakage flow not only reduces the effective momentum exchange on the blade surface but also compromises the coherence of the main stream, contributing directly to a decrease in volumetric efficiency and hydraulic performance.
Furthermore, although cavitation structures are not directly plotted in this figure, the presence of low-pressure cores within these vortices—especially near the trailing edge—is a strong indication of potential cavitation inception. The interaction between enhanced leakage flow and local pressure reduction near the tip region is likely a primary mechanism for cavitation development, which is further examined in the following sections.
From Fig. 5, it is evident that both cavitation and tip clearance have significant impacts on turbine efficiency. First, under constant tip clearance, turbine efficiency decreases with declining cavitation number, indicating that intensified cavitation directly impairs the runner’s ability to extract energy from the flow, resulting in reduced overall hydraulic efficiency [30].
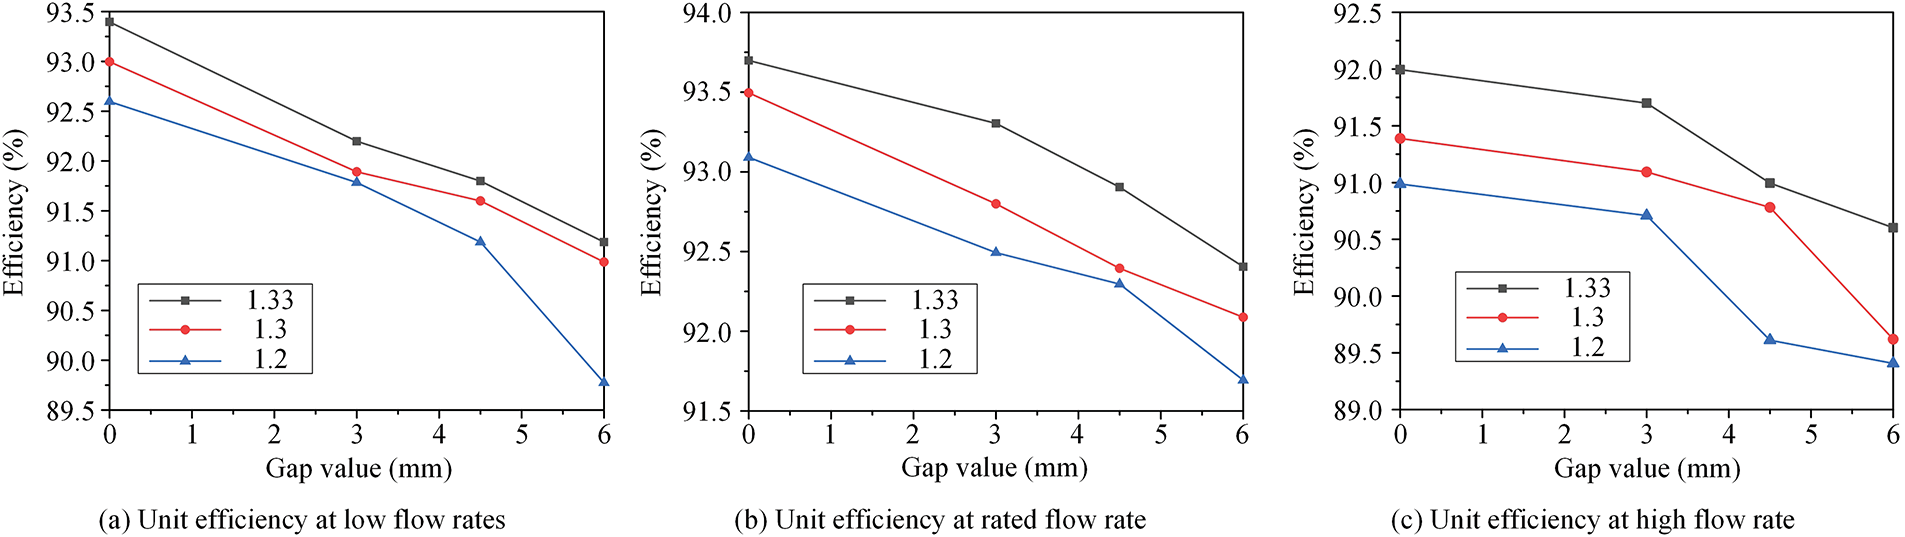
Figure 5: Unit efficiency curves under different working conditions
Second, under constant cavitation number, efficiency decreases as tip clearance increases. The enlarged clearance leads to greater leakage flow, diverting part of the fluid from the main passage and reducing the volume of water effectively performing work on the runner. In addition, increased clearance promotes the development of localized unsteady flow structures, particularly near the blade tip. Previous studies have demonstrated that enlarged gaps facilitate the formation of tip leakage vortices and shear-layer instabilities in this region Refs. [1–3]. Although not directly visualized in this work, similar flow irregularities can be inferred from the observed streamline disruption (Section 3.2) and enhanced pressure fluctuations (Section 4.1), both of which indicate intensified flow separation and unsteadiness due to excessive clearance. [10–13,16]. These structures trigger the formation of low-pressure regions and cavitation nuclei. The accumulation and evolution of vapor bubbles on the blade surface weaken the negative pressure suction effect, impairing cavitation performance and further decreasing turbine efficiency.
Notably, under rated flow conditions, turbine efficiency is less sensitive to variations in tip clearance and cavitation number. The decline in efficiency is smaller than that observed under high or low flow conditions. This is because the inlet flow angle under rated conditions is closer to the design incidence angle, resulting in a more stable flow field and stronger blade work capacity. Hence, the influence of leakage on the main flow structure is relatively minimal, and turbine efficiency remains more stable.
4 Flow-Induced Load Analysis in the Runner Region
4.1 Time-Domain Analysis of Pressure Pulsation Induced by Tip-Clearance Cavitation
Cavitation significantly alters the pressure fluctuation characteristics of the fluid in the runner region [31–33]. To investigate the effects of tip clearance and cavitation on unsteady flow behavior, a set of pressure monitoring points was arranged on the runner blade surfaces. Sensors were placed on both the pressure side and suction side, and their layout is illustrated in Fig. 6. The left subfigure represents the pressure side, and the right subfigure shows the suction side, both presented from the same viewing direction to ensure spatial consistency [34–37]. By comparing the instantaneous pressure responses at these selected locations under varying tip clearance and cavitation number conditions, the study examines the spatial characteristics of pressure pulsations and their correlation with cavitation development. This analysis provides insight into localized flow instabilities induced by leakage vortices and cavitation dynamics [38–41].
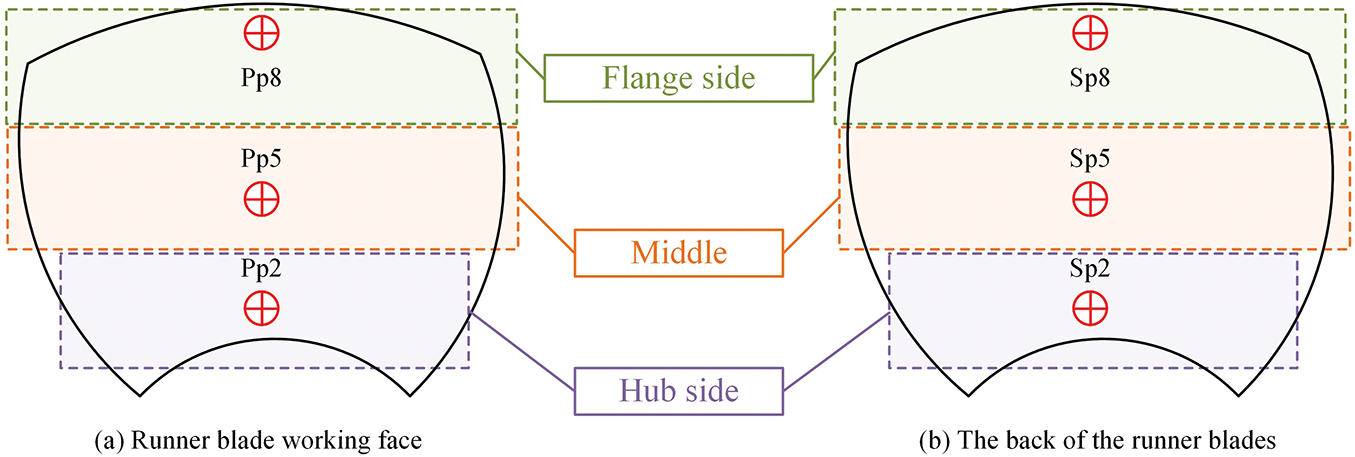
Figure 6: Schematic diagram of the monitoring point on the blade surface
Fig. 7 presents the time-domain variation of pressure pulsation at monitoring points Pp2, Pp5, and Pp8, located on the pressure side of the runner blades under different tip clearance (3.0, 4.5, 6.0 mm) and flow rate conditions. These three points are positioned near the mid-span of the blade inlet, the central blade region, and close to the trailing edge, respectively, and are representative of the spatial–temporal evolution of pressure disturbances along the flow direction [42,43].
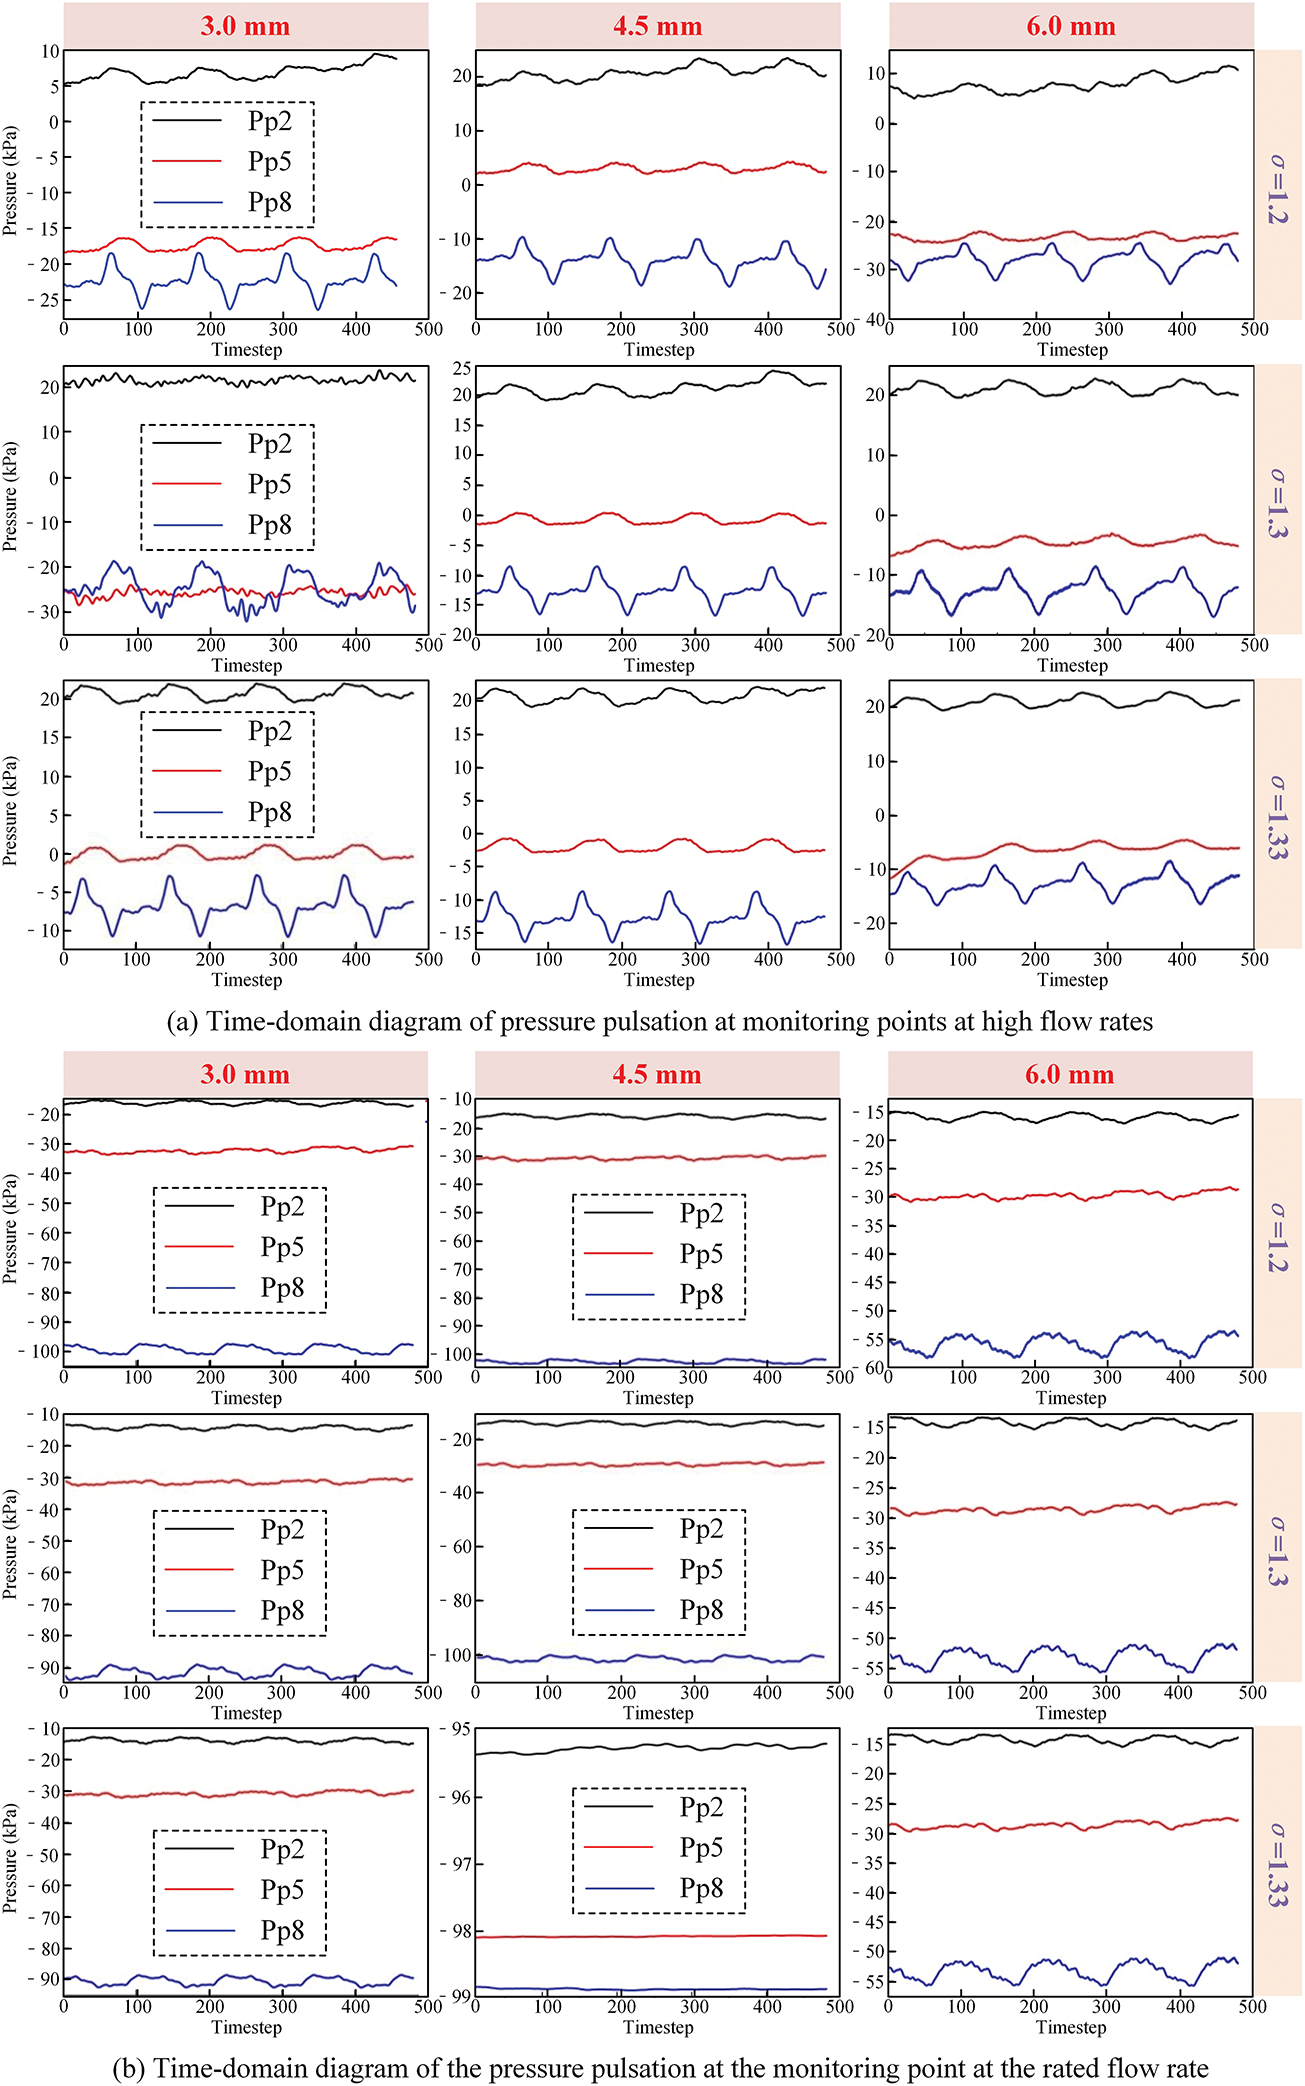
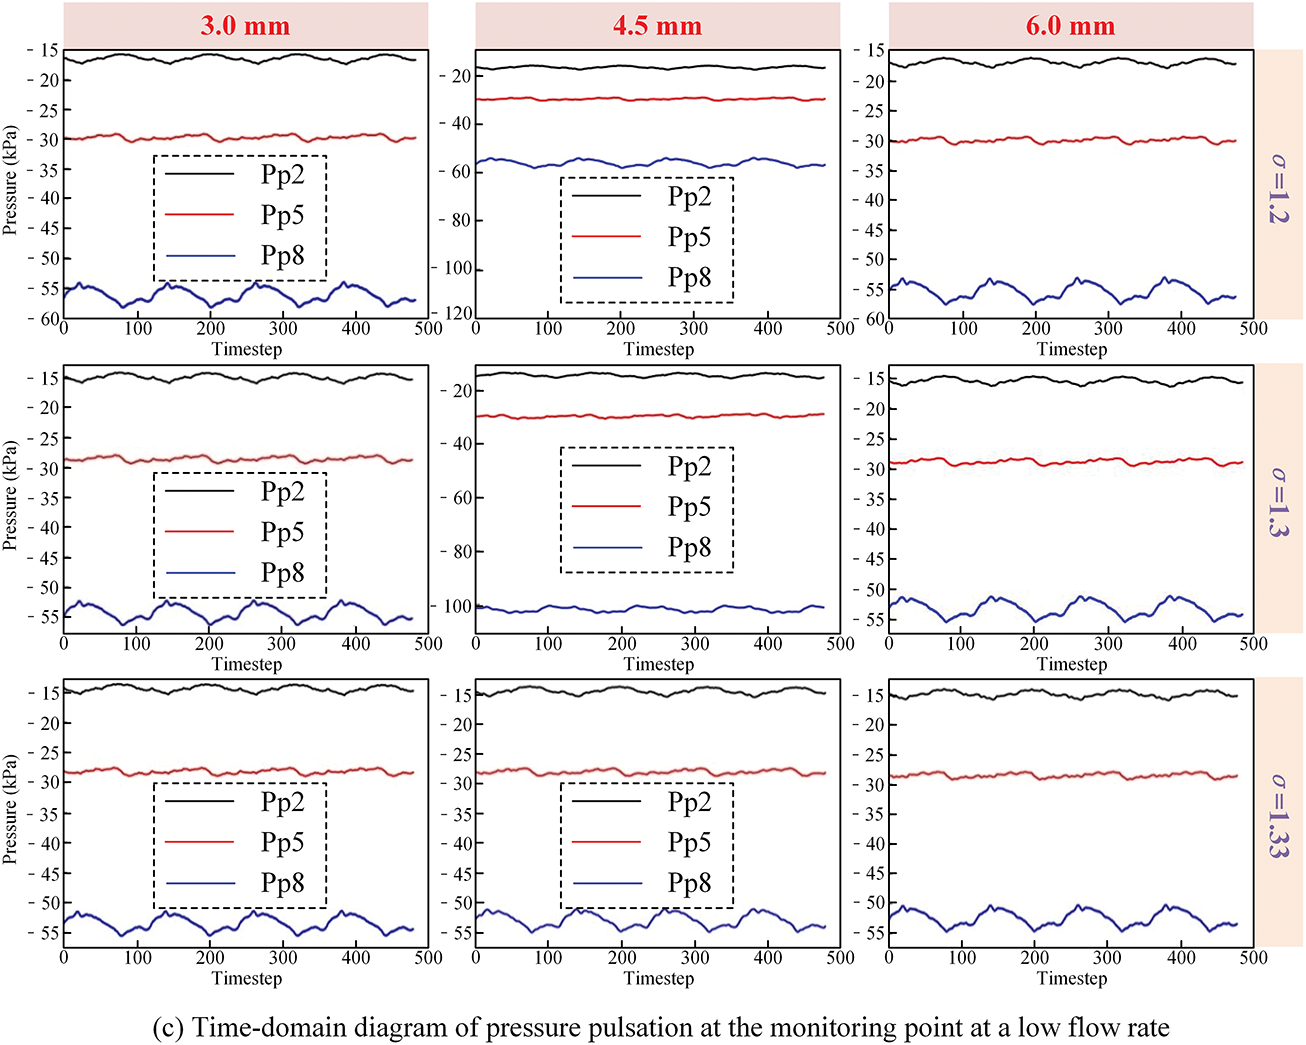
Figure 7: Time-domain distribution of pressure pulsation at some monitoring points
As shown in the figure, pressure pulsation signals at all monitoring points exhibit strong periodicity and synchronization during one full runner rotation cycle. The pressure waveforms show consistent trends, following a rise–fall pattern, with pressure peaks and valleys appearing almost simultaneously. A closer inspection reveals that the number of distinct pressure peaks per cycle corresponds to the number of runner blades, confirming the typical blade-passing frequency behavior.
Among the three locations, Pp8, which is closest to the blade tip, consistently shows the highest-pressure pulsation amplitude, up to 7.5–12 kPa, depending on the clearance. This is approximately 3 times higher than that observed at Pp2 (near the blade hub), indicating the strong influence of tip-leakage-induced unsteady flow on local pressure fluctuation.
Under constant cavitation number (σ = 1.2), increasing the tip clearance from 3.0 to 4.5 mm results in a decrease in peak pressure amplitude at Pp8 by about 18.7%, while a further increase to 6.0 mm leads to another drop of approximately 11.3%. This attenuation is attributed to the wave-clipping effect, where cavitation bubbles generated in low-pressure regions limit further pressure drops by collapsing at or near vapor pressure, thus flattening the waveform troughs and reducing pulsation magnitude.
In contrast, under fixed tip clearance (e.g., 3.0 mm), decreasing the cavitation number from 1.33 to 1.2 leads to a rise in pulsation amplitude at Pp8 by nearly 10%, alongside a noticeable increase in waveform asymmetry and distortion. The low-pressure region expands toward the mid-blade zone (Pp5), with the pressure difference between Pp8 and Pp5 reducing by approximately 75%, indicating a significant increase in cavitation extent across the blade surface.
Additionally, the amplitude hierarchy across the monitoring points becomes distinct, following the relation: PHub > PMid > PTip, reaffirming the role of flow rate in modulating spatial pressure distributions.
4.2 Frequency-Domain Analysis of Pressure Pulsation Induced by Tip-Clearance Cavitation
Frequency-domain analysis provides further insight into the energy distribution and dominant frequencies of pressure pulsations caused by cavitation, thereby highlighting its unsteady nature. Fig. 8 shows the spectral response of pressure pulsations at monitoring points SP2, SP5, and SP8 under various tip clearance conditions. These points correspond to positions near the blade hub, middle, and tip regions, enabling a comprehensive assessment of cavitation-induced vibration characteristics across the blade span.
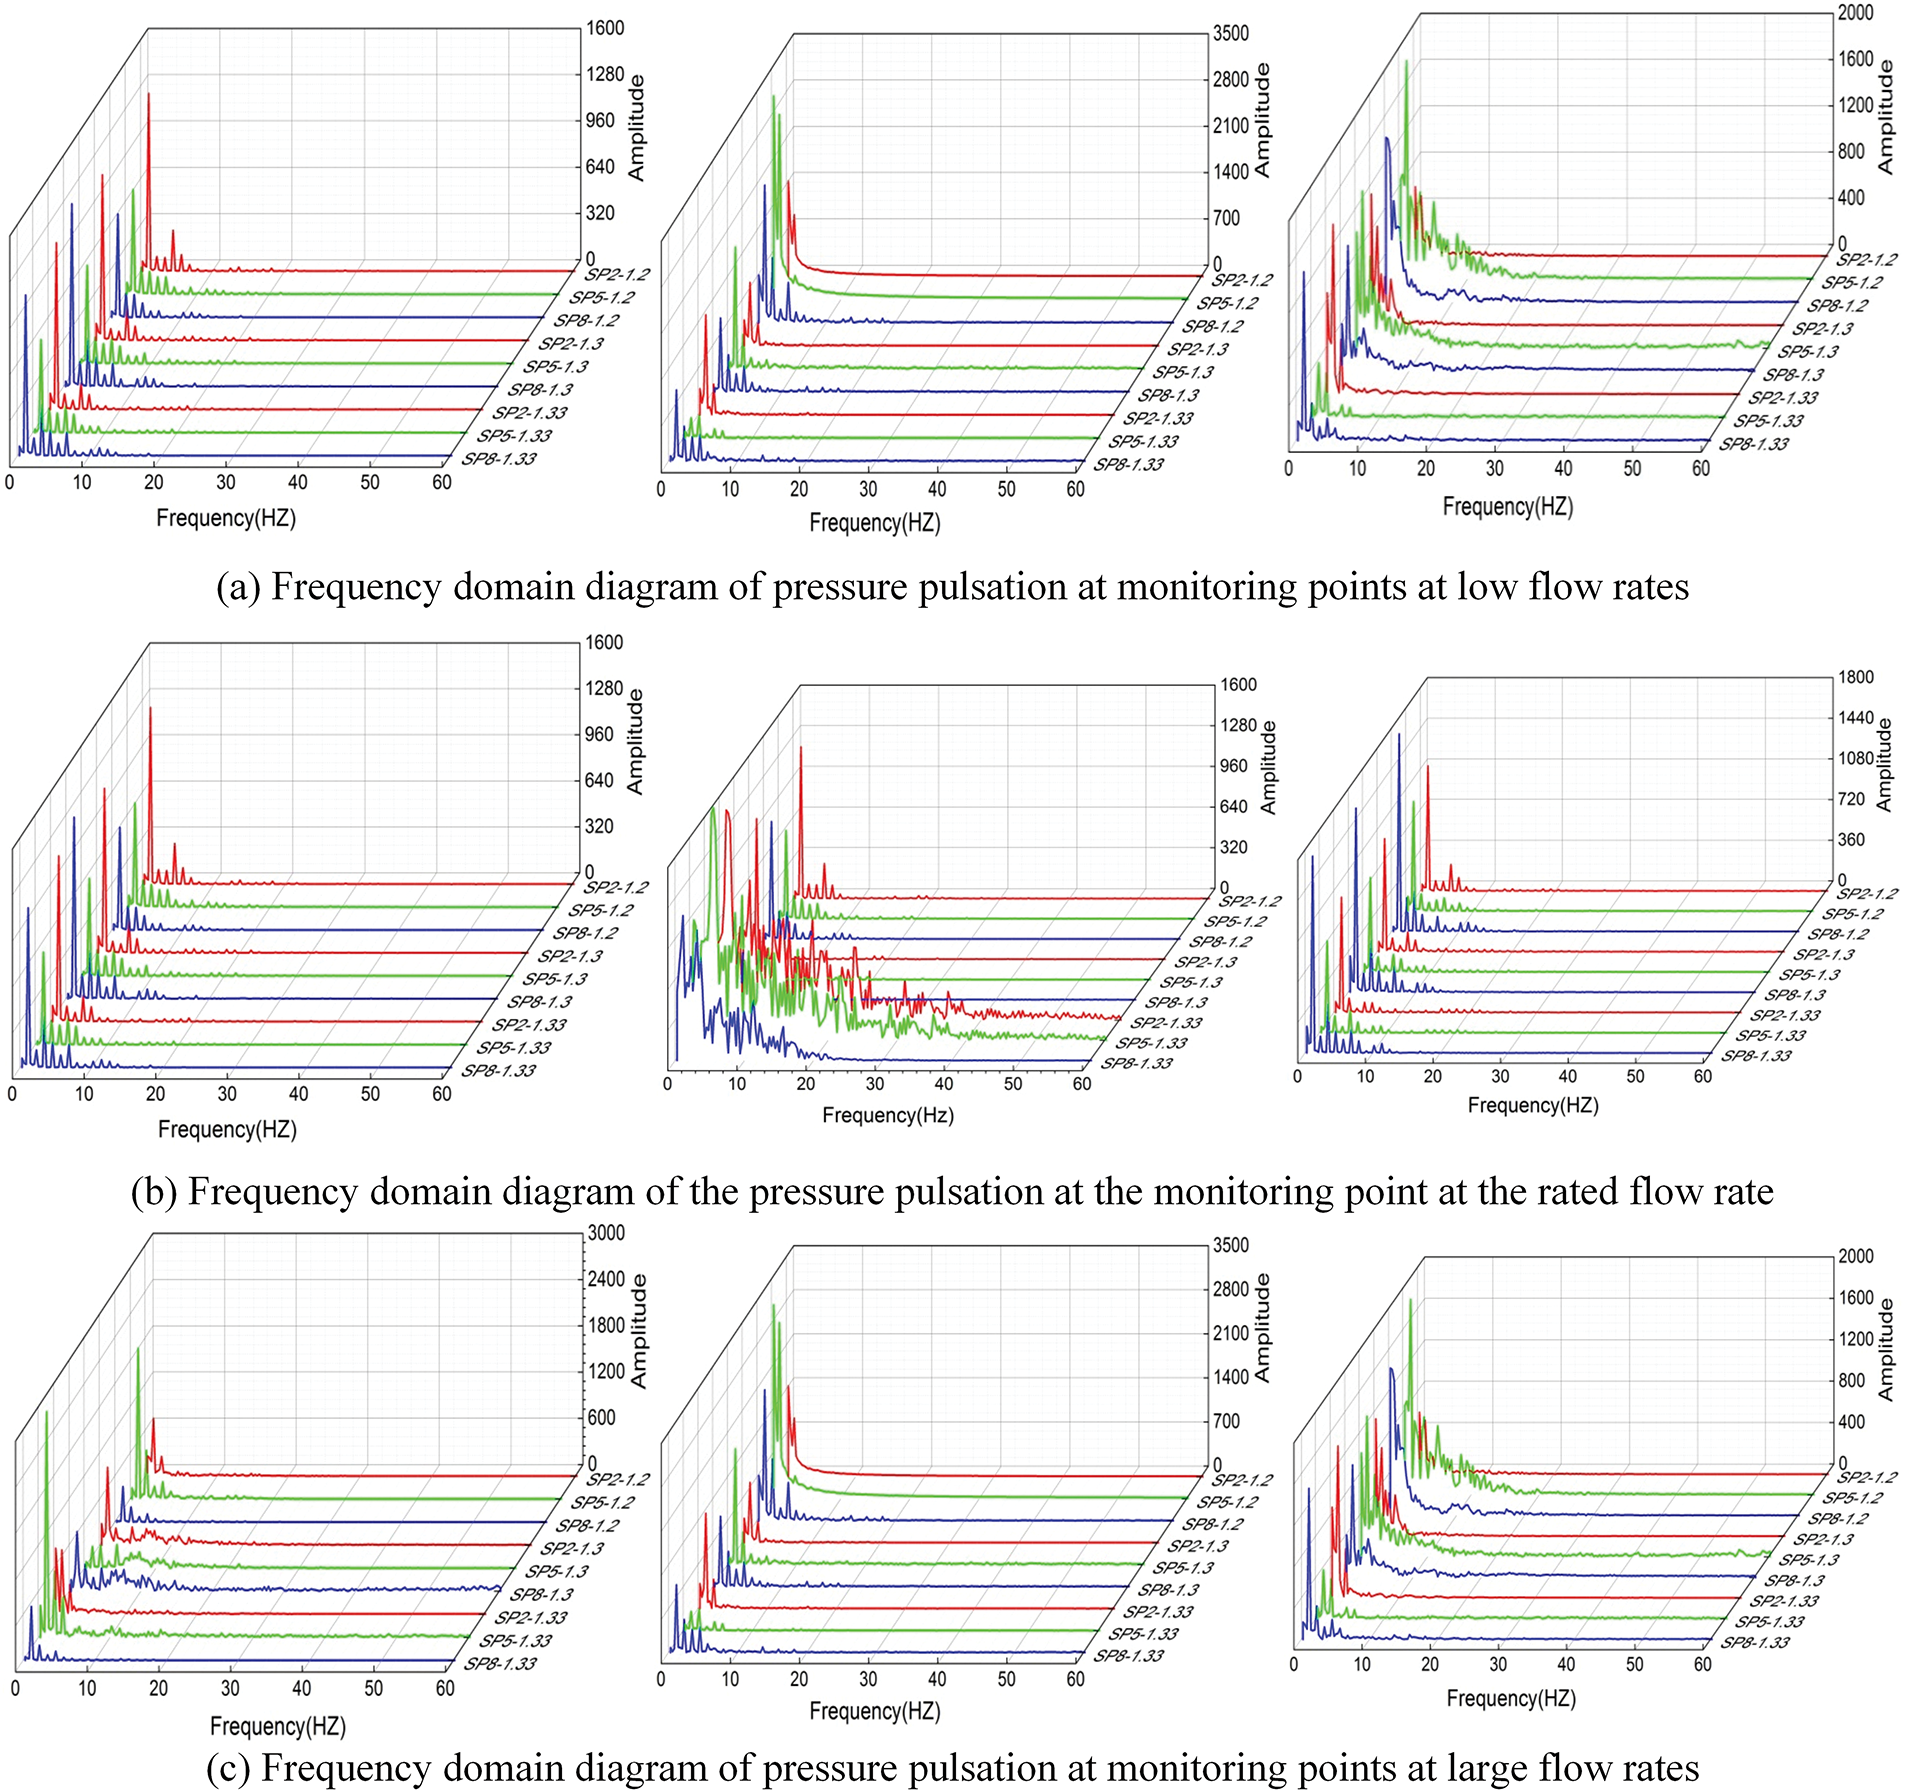
Figure 8: Frequency domain distribution of pressure pulsation at some monitoring points
From Fig. 8, it is evident that pressure pulsation spectra at the blade suction side exhibit clear patterns. From hub to tip, pulsation amplitudes increase progressively, with maximum amplitudes remaining below 5000 Pa. The dominant frequencies are concentrated in the low-frequency range (1–20 Hz), primarily aligned with the blade passing frequency (BPF = 4.5455 Hz) and its subharmonics (typically 0.3–0.5× BPF), indicating that the pressure pulsations are primarily driven by rotor rotation.
As the cavitation number decreases, pressure pulsation amplitudes increase across all monitoring points, with the tip region (SP8) showing the most significant rise—approximately 1.2 times that at the hub. This is because the tip region is prone to forming low-pressure zones, which, when coupled with the high pressure on the pressure side of the trailing edge, intensify cavitation. As cavitation strengthens, local pressure is clamped near vapor pressure, producing a wave-clipping effect: the pulsation waveform flattens at the trough, while the peak values remain relatively stable over the cavitation cycle.
Flow rate variation also significantly affects pressure pulsations. At low flow conditions, amplitudes at all three monitoring points are higher than those under rated and high-flow conditions. The mid-span and tip regions, in particular, exhibit stronger unsteady characteristics. For example, under the design clearance of 4.5 mm, the hub’s peak amplitude at low flow is 1.1–1.5× that of the rated condition; the mid-span amplitude is approximately four times greater; and the tip region shows an increase of around 1.8×. In contrast, the difference between low and high flow conditions is smaller, indicating that the blade is more sensitive to low-flow operations. Hence, avoiding off-design conditions is crucial for ensuring operational stability.
Under rated flow, tip clearance variation also significantly impacts pulsation responses. Taking 4.5 mm as the baseline, at tip clearances of 1.5, 3.0, and 6.0 mm, the hub amplitude decreases by 23.5%, 4.3%, and 18%, respectively. Meanwhile, mid-span amplitudes increase by 32%, 9%, and 25%, and the tip amplitudes increase by 2.5×, 0.5×, and 1.9×, respectively. This highlights the high sensitivity of the tip region to tip clearance changes.
Further analysis reveals that when the tip clearance is fixed at 4.5 mm and the cavitation number decreases from 1.33 to 1.2, the dominant frequency at the suction side monitoring points shifts upward—from 1.2× BPF to 2× BPF. This shift indicates that the primary mechanism of pulsation transitions from rotor rotation to cavitation vortex dynamics. As clearance increases, leakage flow intensifies, making vortex formation and collapse the dominant source of pressure pulsation. This effect is particularly prominent near the blade tip, which is the most sensitive region to unsteady flow disturbances.
Therefore, reducing the pressure pulsation amplitude in the tip region not only enhances operational stability but also validates the importance of optimizing tip clearance in improving the overall performance and cavitation resistance of bulb-type hydro turbines.
This study systematically investigates the operational characteristics of a bulb-type hydro turbine under varying tip clearance and cavitation number conditions through numerical simulation. A comprehensive three-dimensional computational domain was established to analyze pressure distribution, velocity field structure, and energy characteristics within the runner region. Additionally, transient pressure monitoring points were deployed and integrated with FFT (Fast Fourier Transform) spectral analysis to examine how different clearance levels and cavitation numbers influence pressure pulsation behavior. The findings offer theoretical guidance for optimizing tip clearance design and improving both cavitation resistance and the operational stability of bulb-type hydro turbines. The main conclusions are as follows:
• As the tip clearance increases, leakage flow in the blade tip region becomes more intense, and local flow velocity rises, leading to the expansion of low-pressure areas on the blade suction side and more severe cavitation development. Variations in flow rate also significantly alter the pressure and velocity distribution on the blades; under low-flow conditions, the high-pressure region at the blade leading edge intensifies, while cavitation risk increases near the hub and mid-span regions.
• When the cavitation number remains constant, increased tip clearance aggravates leakage flow and energy loss, resulting in reduced turbine efficiency—an effect that is especially pronounced under off-design flow conditions. Conversely, under constant clearance, a further decrease in cavitation number leads to progressively lower efficiency, as intensified cavitation deteriorates flow stability and increases the extent of vapor accumulation near the blade surface.
• The dominant frequency of pressure pulsation is mainly centered around the blade passing frequency and its harmonics, exhibiting clear periodic characteristics. Both reduced cavitation number and increased tip clearance significantly elevate the amplitude of pressure pulsations in the blade tip region and can induce the “wave-clipping” phenomenon. This indicates that the tip area is the most sensitive to flow disturbances and has the greatest influence on turbine stability. Therefore, optimizing tip clearance design is crucial for suppressing detrimental pulsations and improving cavitation resistance.
In addition, the study has some limitations. This study is limited by the reliance on numerical simulations without experimental validation; future work will focus on integrating experimental measurements and broader operating conditions to further verify and extend the applicability of the findings.
Acknowledgement: Not applicable.
Funding Statement: Funded by the National Natural Science Foundation of China (52066011), Jiuquan Science and Technology Plan Project University-Level Key Project (2024XJKXM03) and Foundation of Key Laboratory of Solar Power System (Grant No. 2024SPKL03).
Author Contributions: Conceptualization, Feng Zhou and Qifei Li; Methodology, Lu Xin; Software, Shiang Zhang; Validation, Yang Liu and Ming Guo. All authors reviewed the results and approved the final version of the manuscript.
Availability of Data and Materials: Data available on request from the authors.
Ethics Approval: Not applicable.
Conflicts of Interest: The authors declare no conflicts of interest to report regarding the present study.
References
1. Song H, Xie W, Han W, Wang S, Huang X, Qiu H, et al. Study on vibration and failure of transverse flow turbine based on fluid-structure interaction. Int J Str Stab Dyn. 2024:2550263. doi:10.1142/s0219455425502633. [Google Scholar] [CrossRef]
2. Bichanich M, Bharath A, O’Byrne P, Monahan M, Ross H, Raye R, et al. In-situ blade strain measurements and fatigue analysis of a cross-flow turbine operating in a tidal flow. Renew Energy. 2025;239(9):121977. doi:10.1016/j.renene.2024.121977. [Google Scholar] [CrossRef]
3. Ham S, Adeeb E, Lee JW, Ha H. Numerical evaluation of low-head inverted cross-flow turbine design method: a comprehensive study. Energy Convers Manag. 2024;311:118521. doi:10.1016/j.enconman.2024.118521. [Google Scholar] [CrossRef]
4. Snortland A, Hunt A, Williams O, Polagye B. Influence of the downstream blade sweep on cross-flow turbine performance. J Renew Sustain Energy. 2025;17(1):013301. doi:10.1063/5.0230563. [Google Scholar] [CrossRef]
5. Zarei H, Passandideh Fard M. Numerical investigation of lucid spherical cross-axis flow turbine with asymmetric airfoil sections and the effect of different parameters of blades on its performance. J Appl Fluid Mech. 2024;17(1):176–91. doi:10.47176/jafm.17.1.1978. [Google Scholar] [CrossRef]
6. Cheng C, Li Z, Shen C, Gu S, Zeng C, Bai C, et al. Exploration of the mechanism of cavitation vortex rope and vortex development in the draft tube of tubular turbine units. Int J Agric Biol Eng. 2024;17(1):163–71. doi:10.25165/j.ijabe.20241701.8143. [Google Scholar] [CrossRef]
7. Favrel A, Liu Z, Khozaei MH, Irie T, Miyagawa K. Anti-phase oscillations of an elliptical cavitation vortex in Francis turbine draft tube. Phys Fluids. 2022;34(6):064112. doi:10.1063/5.0091210. [Google Scholar] [CrossRef]
8. Zhao Z, Qian Z, Guo Z, Dong J. Erosion wear on the runner shroud of a francis turbine. J Energy Eng. 2021;147(6):04021048. doi:10.1061/(asce)ey.1943-7897.0000799. [Google Scholar] [CrossRef]
9. Hong S, Shi X, Lin J, Wu Y, Li J, Zheng Y. Microstructure and cavitation-silt erosion behavior of two HVOF-sprayed hardfacing coatings for hydro-turbine applications. Alex Eng J. 2023;69(S1):483–96. doi:10.1016/j.aej.2023.02.010. [Google Scholar] [CrossRef]
10. Krzemianowski Z, Steller J. High specific speed Francis turbine for small hydro purposes—design methodology based on solving the inverse problem in fluid mechanics and the cavitation test experience. Renew Energy. 2021;169(2):1210–28. doi:10.1016/j.renene.2021.01.095. [Google Scholar] [CrossRef]
11. Zhao H, Zhu B, Jiang B. Comprehensive assessment and analysis of cavitation scale effects on energy conversion and stability in pumped hydro energy storage units. Energy Convers Manag. 2025;325(5):119370. doi:10.1016/j.enconman.2024.119370. [Google Scholar] [CrossRef]
12. Shrivastava N, Rai AK. Hydro-abrasive erosion in Pelton turbines: comprehensive review and future outlook. Renew Sustain Energy Rev. 2025;207(1):114957. doi:10.1016/j.rser.2024.114957. [Google Scholar] [CrossRef]
13. Jošt D, Lipej A, Mežnar P. Numerical prediction of efficiency, cavitation and unsteady phenomena in water turbines. Eng Syst Des Anal. 2008;48388:157–66. doi:10.1115/esda2008-59563. [Google Scholar] [CrossRef]
14. Wang Z, Zhang B. Cracking mechanism of CA6NM hydro turbine steel in cavitation erosion. Tribol Int. 2025;202:110325. doi:10.1016/j.triboint.2024.110325. [Google Scholar] [CrossRef]
15. Praveen S, Marimuthu S, Alqahtani B, Bharathiraja G, Gokilakrishnan G. Enhancing bulb turbine performance assessing air injection for vibration mitigation and hydrofoil cavitation. J Appl Fluid Mech. 2024;17(11):2313–32. doi:10.47176/jafm.17.11.2686. [Google Scholar] [CrossRef]
16. Gao Y, Liu H, Guo G, Lin Y, Gu Y, Ni Y. Effect of cavitation evolution on power characteristics of tidal current turbine. Phys Fluids. 2023;35(1):013307. doi:10.1063/5.0131906. [Google Scholar] [CrossRef]
17. Altintas B, Ayli E, Celebioglu K, Aradag S, Tascioglu Y. Mitigating cavitation effects on Francis turbine performance: a two-phase flow analysis. Ocean Eng. 2025;317(4):120018. doi:10.1016/j.oceaneng.2024.120018. [Google Scholar] [CrossRef]
18. Capone A, DiFelice F, Salvatore F, Maddukkari H, Kaufmann N, Starzmann R. Impact of cavitation and inflow perturbation on the performance of a horizontal-axis tidal turbine. J Ocean Eng Mar Energy. 2023;9(4):731–43. doi:10.1007/s40722-023-00296-9. [Google Scholar] [CrossRef]
19. Satou E, Ikeda T, Uchiyama T, Okayama T, Miyazawa T, Takamure K, et al. Development of an undershot cross-flow hydraulic turbine resistant to snow and ice masses flowing in an installation canal. Renew Energy. 2022;200(3):146–53. doi:10.1016/j.renene.2022.09.062. [Google Scholar] [CrossRef]
20. Sarma KC, Biswas A, Nath B, Misra RD. Experimental study of the effect of gap between the stages of a double-stage Savonius Hydrokinetic turbine with end plates and blade overlapping at low water currents. Energy Sources A Recov Util Environ Eff. 2024;46(1):10557–78. doi:10.1080/15567036.2024.2386092. [Google Scholar] [CrossRef]
21. Zeng YS, Qi X, Bai MM, Zhou LJ, Yao ZF. How the radial gap affects the runner’s hydrodynamic damping characteristic of a pump-turbine: a physical experiment on a rotating disc. J Hydrodyn. 2023;35(4):736–45. doi:10.1007/s42241-023-0058-3. [Google Scholar] [CrossRef]
22. Liu L, Li J, Feng Z. A numerical method for simulation of attached cavitation flows. Int J Numer Methods Fluids. 2006;52(6):639–58. doi:10.1002/fld.1192. [Google Scholar] [CrossRef]
23. Pan S, Zhao Y, Wang J, Wang Z, Ren C, Zhang Z, et al. Design and transient flow analysis of a novel gear-claw hydrogen circulating pump with new auxiliary working chamber. Appl Therm Eng. 2025;272(59):126430. doi:10.1016/j.applthermaleng.2025.126430. [Google Scholar] [CrossRef]
24. Li W, Li Z, Han W, Li D, Yan S, Zhou J. Study of the flow characteristics of pumped media in the confined morphology of a ferrofluid pump with annular microscale constraints. J Fluids Eng. 2025;147(2):021201. doi:10.1115/1.4066486. [Google Scholar] [CrossRef]
25. Li W, Li Z, Han W, Wang Y, Zhao J, Zhou J. Morphologic transformation of ferrofluid during micropump driving under field control. Ann New York Acad Sci. 2025;1543(1):194–203. doi:10.1111/nyas.15261. [Google Scholar] [PubMed] [CrossRef]
26. Yu A, Li L, Zhou D. Large eddy simulation of the cavity shedding characteristics of ventilated cavitation around the underwater vehicle. Ocean Eng. 2024;301:117546. doi:10.1016/j.oceaneng.2024.117546. [Google Scholar] [CrossRef]
27. Fu XL, Li DY, Wang HJ, Cheng YG, Wei XZ. Hydraulic fluctuations during the pump power-off runaway transient process of a pump turbine with consideration of cavitation effects. J Hydrodyn. 2021;33(6):1162–75. doi:10.1007/s42241-022-0105-5. [Google Scholar] [CrossRef]
28. Gohil PP, Saini RP. Investigation into cavitation damage potentiality using pressure pulsation phenomena in a low head Francis turbine for small hydropower schemes. Ocean Eng. 2022;263(5):112230. doi:10.1016/j.oceaneng.2022.112230. [Google Scholar] [CrossRef]
29. Shamsuddeen MM, Park J, Choi YS, Kim JH. Unsteady multi-phase cavitation analysis on the effect of anti-cavity fin installed on a Kaplan turbine runner. Renew Energy. 2020;162(6):861–76. doi:10.1016/j.renene.2020.08.100. [Google Scholar] [CrossRef]
30. Fahlbeck J, Nilsson H, Arabnejad MH, Salehi S. Performance characteristics of a contra-rotating pump-turbine in turbine and pump modes under cavitating flow conditions. Renew Energy. 2024;237(1):121605. doi:10.1016/j.renene.2024.121605. [Google Scholar] [CrossRef]
31. Qiu N, Xun D, Zhu H, Xu P, Che B, Li M, et al. Impact of re-entrant jet and shedding cloud cavity on the distribution of cavitation erosion. Ocean Eng. 2024;307(3):118111. doi:10.1016/j.oceaneng.2024.118111. [Google Scholar] [CrossRef]
32. Li W, Li Z, Qin Z, Yan S, Wang Z, Peng S. Influence of the solution pH on the design of a hydro-mechanical magneto-hydraulic sealing device. Eng Fail Anal. 2022;135(2):106091. doi:10.1016/j.engfailanal.2022.106091. [Google Scholar] [CrossRef]
33. Zhou W, Su H, Liu H, Zhang Y, Qiu N, Gao B. Leakage and rotordynamic performance of a semi-Y labyrinth seal structure for centrifugal pump based on multifrequency whirl method. J Eng Gas Turbines Power. 2025;147(10):101022. doi:10.1115/1.4069144. [Google Scholar] [CrossRef]
34. Zhou W, Ma J, Ma Z, Yu W, Gao B. Multi-scale fluid-induced vibration characteristics of centrifugal pump based on fluid-structure interaction method. Phys Fluids. 2025;37(2):027163. doi:10.1063/5.0255811. [Google Scholar] [CrossRef]
35. Xu L, Zhang Y, Xu J, Wang Y, Feng C, Yang Y, et al. Towards the integration of new-type power systems: hydraulic stability analysis of pumped storage units in the S-characteristic region based on experimental and CFD studies. Energy. 2025;329(5):136755. doi:10.1016/j.energy.2025.136755. [Google Scholar] [CrossRef]
36. Xu L, Yan X, Zhang Y, Xu J, Zheng Y. A rortex-enhanced mean kinetic energy method for assessing hydraulic losses in the hump region of pump-turbines. Sustain Energy Technol Assess. 2025;82(6):104495. doi:10.1016/j.seta.2025.104495. [Google Scholar] [CrossRef]
37. Li W, Li Z, Han W, Tan S, Yan S, Wang D, et al. Time-mean equation and multi-field coupling numerical method for low-Reynolds-number turbulent flow in ferrofluid. Phys Fluids. 2023;35(12):125145. doi:10.1063/5.0179961. [Google Scholar] [CrossRef]
38. Zhao H, Zhu B, Wang C, Han Y. A prospective assessment of vortex evolution mechanisms and pressure fluctuation coupling in novel low-head pumped hydro energy storage units. Energy Convers Manag. 2025;342(1):120136. doi:10.1016/j.enconman.2025.120136. [Google Scholar] [CrossRef]
39. Zhao H, Zhu B, Xu R, Tan L, Zhang H, Chen L, et al. Evaluating the predictive potential of modeling frameworks for Pelton turbine energy performance and guiding engineering modeling in hydroelectric applications. Energy. 2025;330(6):136861. doi:10.1016/j.energy.2025.136861. [Google Scholar] [CrossRef]
40. Zeng Y, Qian Z, Ye W, Zhang Y, Puga D, Luo X. Internal flow mechanism for a pump-turbine operated in pump mode under double humps condition. Sci China Technol Sci. 2025;68(3):1320104. doi:10.1007/s11431-024-2820-2. [Google Scholar] [CrossRef]
41. Li W, Li Z, Han W, Li R, Zhang Y. Mechanism of bubble generation in ferrofluid micro-pumps and key parameters influencing performance. Powder Technol. 2026;467(1):121562. doi:10.1016/j.powtec.2025.121562. [Google Scholar] [CrossRef]
42. Ren Z, Qin Y, Meng Z, Jia Z, Zhou W, Khoo BC. Interplay of oscillatory and migratory behavior in bubble-pair interactions. Phys Fluids. 2025;37(7):073388. doi:10.1063/5.0280644. [Google Scholar] [CrossRef]
43. Ren Z, Li D, Meng Z, Liu N, Khoo BC. Spatial-temporal correlation and fluctuating propagation characteristics of bubbles based on a coupled model of oscillation and migration. Appl Ocean Res. 2025;161(20):104677. doi:10.1016/j.apor.2025.104677. [Google Scholar] [CrossRef]
Cite This Article
 Copyright © 2025 The Author(s). Published by Tech Science Press.
This work is licensed under a Creative Commons Attribution 4.0 International License , which permits unrestricted use, distribution, and reproduction in any medium, provided the original work is properly cited.
 Downloads
 Citation Tools