
 Submit a Paper
 Propose a Special lssue
 Open Access
ARTICLE

A Multimodal Learning Framework to Reduce Misclassification in GI Tract Disease Diagnosis
1 Department of Computer Science, COMSATS University Islamabad, Wah Campus, Wah Cantt, 47040, Pakistan
2 Department of Management Information Systems, College of Business Administration—Hawtat Bani Tamim, Prince Sattam bin Abdulaziz University, Al-Kharj, 11942, Saudi Arabia
* Corresponding Author: Fadl Dahan. Email:
Computer Modeling in Engineering & Sciences 2025, 145(1), 971-994. https://doi.org/10.32604/cmes.2025.070272
Received 11 July 2025; Accepted 15 September 2025; Issue published 30 October 2025
 View Full Text
 Download PDF
Abstract
The human gastrointestinal (GI) tract is influenced by numerous disorders. If not detected in the early stages, they may result in severe consequences such as organ failure or the development of cancer, and in extreme cases, become life-threatening. Endoscopy is a specialised imaging technique used to examine the GI tract. However, physicians might neglect certain irregular morphologies during the examination due to continuous monitoring of the video recording. Recent advancements in artificial intelligence have led to the development of high-performance AI-based systems, which are optimal for computer-assisted diagnosis. Due to numerous limitations in endoscopic image analysis, including visual similarities between infected and healthy areas, retrieval of irrelevant features, and imbalanced testing and training datasets, performance accuracy is reduced. To address these challenges, we proposed a framework for analysing gastrointestinal tract images that provides a more robust and secure model, thereby reducing the chances of misclassification. Compared to single model solutions, the proposed methodology improves performance by integrating diverse models and optimizing feature fusion using a dual-branch CNN transformer architecture. The proposed approach employs a dual-branch feature extraction mechanism, where in the first branch, features are extracted using Extended BEiT, and EfficientNet-B5 is utilized in the second branch. Additionally, cross-entropy loss is used to measure the error of prediction at both branches, followed by model stacking. This multimodal framework outperforms existing approaches across multiple metrics, achieving 94.12% accuracy, recall and F1-score, as well as 94.15% precision on the Kvasir dataset. Furthermore, the model successfully reduced the false negative rate to 5.88%, enhancing its ability to minimize misdiagnosis. These results highlight the adaptability of the proposed work in clinical practice, where it can provide fast and accurate diagnostic assistance crucial for improving the early diagnosis of diseases in the gastrointestinal tract.Keywords
In the human body, the gastrointestinal (GI) tract is a vital organ system that plays a significant role in the processes of food absorption, digestion and evacuation. Various gastrointestinal disorders or anomalies can adversely affect an individual’s health [1]. The GI system originates at the oral cavity and proceeds through the esophagus, abdominal area, intestines, and ultimately terminates at the rectum. Several gastrointestinal infections, such as polyps, coeliac disease, ulcers, and Crohn’s disease, can lead to abdominal bleeding. Nevertheless, diseases affecting the GI tract significantly contribute to a high percentage of cancer-related fatalities on a global scale [2]. Globally, cancer is a leading cause of death, and gastrointestinal cancer is the most prevalent type. Gastrointestinal cancer is the fourth leading cause of mortality globally, resulting in approximately 1.8 million deaths each year, as reported by the World Health Organisation (WHO) [3].
Endoscopy is a medical technique used to diagnose, examine, and treat disorders of the GI tract. An elongated tube with a camera at the tip, known as an endoscope, is inserted into the patient’s digestive tract through the mouth. At this point, a GI specialist can observe the images of the gastrointestinal tract on a screen and identify any abnormalities. The diagnosis of GI conditions such as polyps, bleeding, and gastric ulcers is also facilitated by an innovative medical imaging technology called wireless capsule endoscopy (WCE) [4]. The capsule endoscopy technique involves using a small, wireless camera to capture images of the digestive tract. The patient undergoes an enhanced non-invasive examination with a capsule that captures a series of diverse and unusual images as the camera traverses the GI tract, and transmits them to a recorder on a belt worn by the patient around the waist. Experts can visualize the digestive tract more effectively with capsule endoscopy compared to traditional endoscopic methods. Endoscopic data analysis is often time-consuming, requires high levels of attention, and is prone to errors. Automated identification systems offer benefits in terms of efficiency, cost and attribute classification [5]. Clinical imaging plays a fundamental role in the diagnosis of different medical conditions. A vast amount of image data is a challenge for radiologists and other clinical experts to handle, which increases the chances of error in their clinical evaluations [6]. This complicates the process of image analysis and leads to time inefficiencies. If it is not properly managed, it may result in misdiagnosis or inappropriate therapy, significantly impacting patient health and survival prospects.
In recent years, computer-aided diagnostic (CAD) systems have gained significance in this area. With the advancement of artificial intelligence tools, there has been a growing focus on automating processes in all areas of diagnostics. Algorithms for deep learning (DL) and machine learning (ML) play a significant role in these advancements. Computer vision has achieved significant success in the medical domain, particularly in detecting abnormalities in different parts of the human body, for example, identifying tumours in MRI scans, detecting skin cancer, and detecting GI malignancies [7]. A Comparison of deep learning models for lung cancer detection shows that InceptionV4 achieves the best accuracy with a great computational efficiency, providing valuable perspectives to choose proper models for medical images [8]. Despite these advancements, traditional convolutional neural networks (CNNs) show limitations in understanding global or long-range dependencies within images or in the interpretation of complex features. Moreover, existing algorithms typically classify diseases without providing insight into the specific features or locations within the images that lead to these classifications, limiting their explainability and interpretability.
To address these challenges, there has been a transition from CNNs to Transformers in computer vision. A recent study has revealed that transformers, which provide the state-of-the-art performance in language understanding tasks that heavily rely on relationship understanding in textual data, are equally effective in visual tasks. There are examples like the Vision Transformer (ViT), where images are divided into tiny patches, integrated with positional information, and processed through the Transformer network for image classification. So, this approach is more effective in handling the complex nature of visual patterns and relationships. It demonstrates how attention mechanisms can revolutionize image classification and create new opportunities in computer vision [9].
Explainable AI is also frequently employed in the clinical diagnosis and management of multiple disorders. With technological advancements, improving accuracy using multimodal techniques has captured the interest of a lot of researchers [10]. With the recent advancements, Explainable Vision Transformer (XViT) highlights the dual necessity of high accuracy achievement along with transparent interpretability in medical image analysis [11]. However, the potential to differentiate between true negative rate and false negative when assessing the performance highlights the potential risks of a classification model. This causes insecure diagnoses and loss of treatment opportunities, as there is a lower rate of identification of gastrointestinal disorders. To handle this issue, a multiple-model stacking technique is proposed for GI tract disorder classification. The main contribution of this proposed technique is:
• A framework is developed that utilizes dual-branch, visual transformers (Extended BEiT) and EfficientNet-B5 to extract robust features from endoscopic images, supporting accurate, effective, and timely computer-assisted diagnosis for GI tract diseases.
• Proposed technique applies cross-entropy loss at dual branches that effectively reduce error in prediction and optimizes the feature extracted from Extended BEiT and EfficientNet-B5.
• Multimodal stacking classifiers that include SVM integrate the extracted features, enhancing the model’s ability to detect GI disorders accurately.
• The model outperformed across multiple metrics and reduced the false negative rate to 5.88% which improves early disease detection and minimizes the risk of misdiagnosis in the clinical setting.
Gastrointestinal (GI tract) disease identification has been the focus of extensive research in recent years. Scientists have created numerous CAD models to automatically detect and classify diseases. They have used a wide range of techniques such as machine learning, deep learning, and explainable AI to improve the classification of GI tract diseases.
Deep learning facilitates improved performance in the diagnosis and classification of gastrointestinal disorders by examining complex patterns present in endoscopic images. The study [12] employed a DL based CNN to autonomously detect protruding lesions in wireless capsule endoscopy (WCE) images. The CNN, trained on a significant dataset of 30,584 images from 292 patients, attained notable results, including an area under the receiver operating characteristic curve (AUC) of 0.911, a sensitivity of 90.7%, and a specificity of 79.8%. This research has limitations, including a restricted test set and potential biases in the identified lesion types, which may have led to some false negatives in the detection procedure. Study [13] investigated self-supervised learning to improve the classification of GI tract diseases, particularly in identifying neoplasia in Barrett’s esophagus. The model achieved a sensitivity level of 80.1%, which highlights the possibility of false negatives that potentially lead to an undetected diagnosis. One of the challenges with using deep learning techniques, especially CNNs, is their limited ability to capture spatial relationships due to the inherent structure of CNNs. The difficulty in employing DL techniques, particularly CNNs, lies in the limited use of spatial information resulting from the fundamental architecture of CNNs. Another research [14] proposed the use of spatial attention to enhance the classification effectiveness of gastrointestinal disorders. It implemented a deep CNN-based spatial attention mechanism with encoder-decoder layers. In terms of mean accuracy, the model achieved superior results as compared to other state-of-the-art models, with an accuracy of 93.19%. Although the spatial attention mechanism helped to improve classification, the CNN framework still struggles with the integration of global patterns, which affects robustness.
The Vision Transformer (ViT) has emerged as a powerful competitor in Computer Vision due to its exceptional performance across several tasks. Due to this high ranking, the study [15] used a transformer neural network architecture, including a spatial pooling configuration. The self-attention mechanism of the transformer facilitates the efficient collection of long-range information, while the analysis of ViT’s spatial structure by pooling can enhance its performance on a comparatively small dataset of the capsule endoscopy dataset. This multi-classification task secured an accuracy of 79.15%. For multi-class GI classification, the study [16] provided the evaluation results for a DL network that had been developed using the EfficientNet framework. Research has demonstrated that GI images can be accurately classified with an accuracy of 93.5%. While these models have potential, they don’t fully meet the practical needs of clinical settings due to their high computational cost. This highlights the need for more efficient AI methods to improve early cancer detection.
The results section of the study (Section 4) also provides detailed information on the class-based classification results for eight diseases. Despite having high accuracy, it does not properly address the potential issues of overfitting and the limited diversity of features within the dataset. Study [17] evaluated the efficacy of three Region-based Convolutional Neural Network (RCNN) models, which were Cascade RCNN, Faster RCNN, and Mask RCNN, for early detection of gastric cancer (EGC). The dataset consists of 3659 gastroscopic images, including 1434 EGC images. The accuracy for all three models was similar, at around 93.5%. Although these models have potential, they fall short of completely fulfilling the requirements of clinical practice since they are computationally expensive. This highlights the need for more advanced AI methods to enhance early cancer detection. For the classification of gastrointestinal disorders, the study [18] employed deep transfer learning models on the Kvasir dataset. The used dataset consists of images across five different classes, and it compares models like DenseNet201, EfficientNetB4, and Xception. In study [19], the CE-YOLOv5 model, an improved YOLOv5 framework, was specifically developed to detect small intestinal lesions in capsule endoscopy recordings. After training on an extensive collection of images and testing on a distinct group of patients, the model achieved remarkable results, identifying abnormalities with an accuracy exceeding 90% for all categories. The model overall performs well, but faces challenges while classifying lesion types and is also sensitive to the quality of the input images.
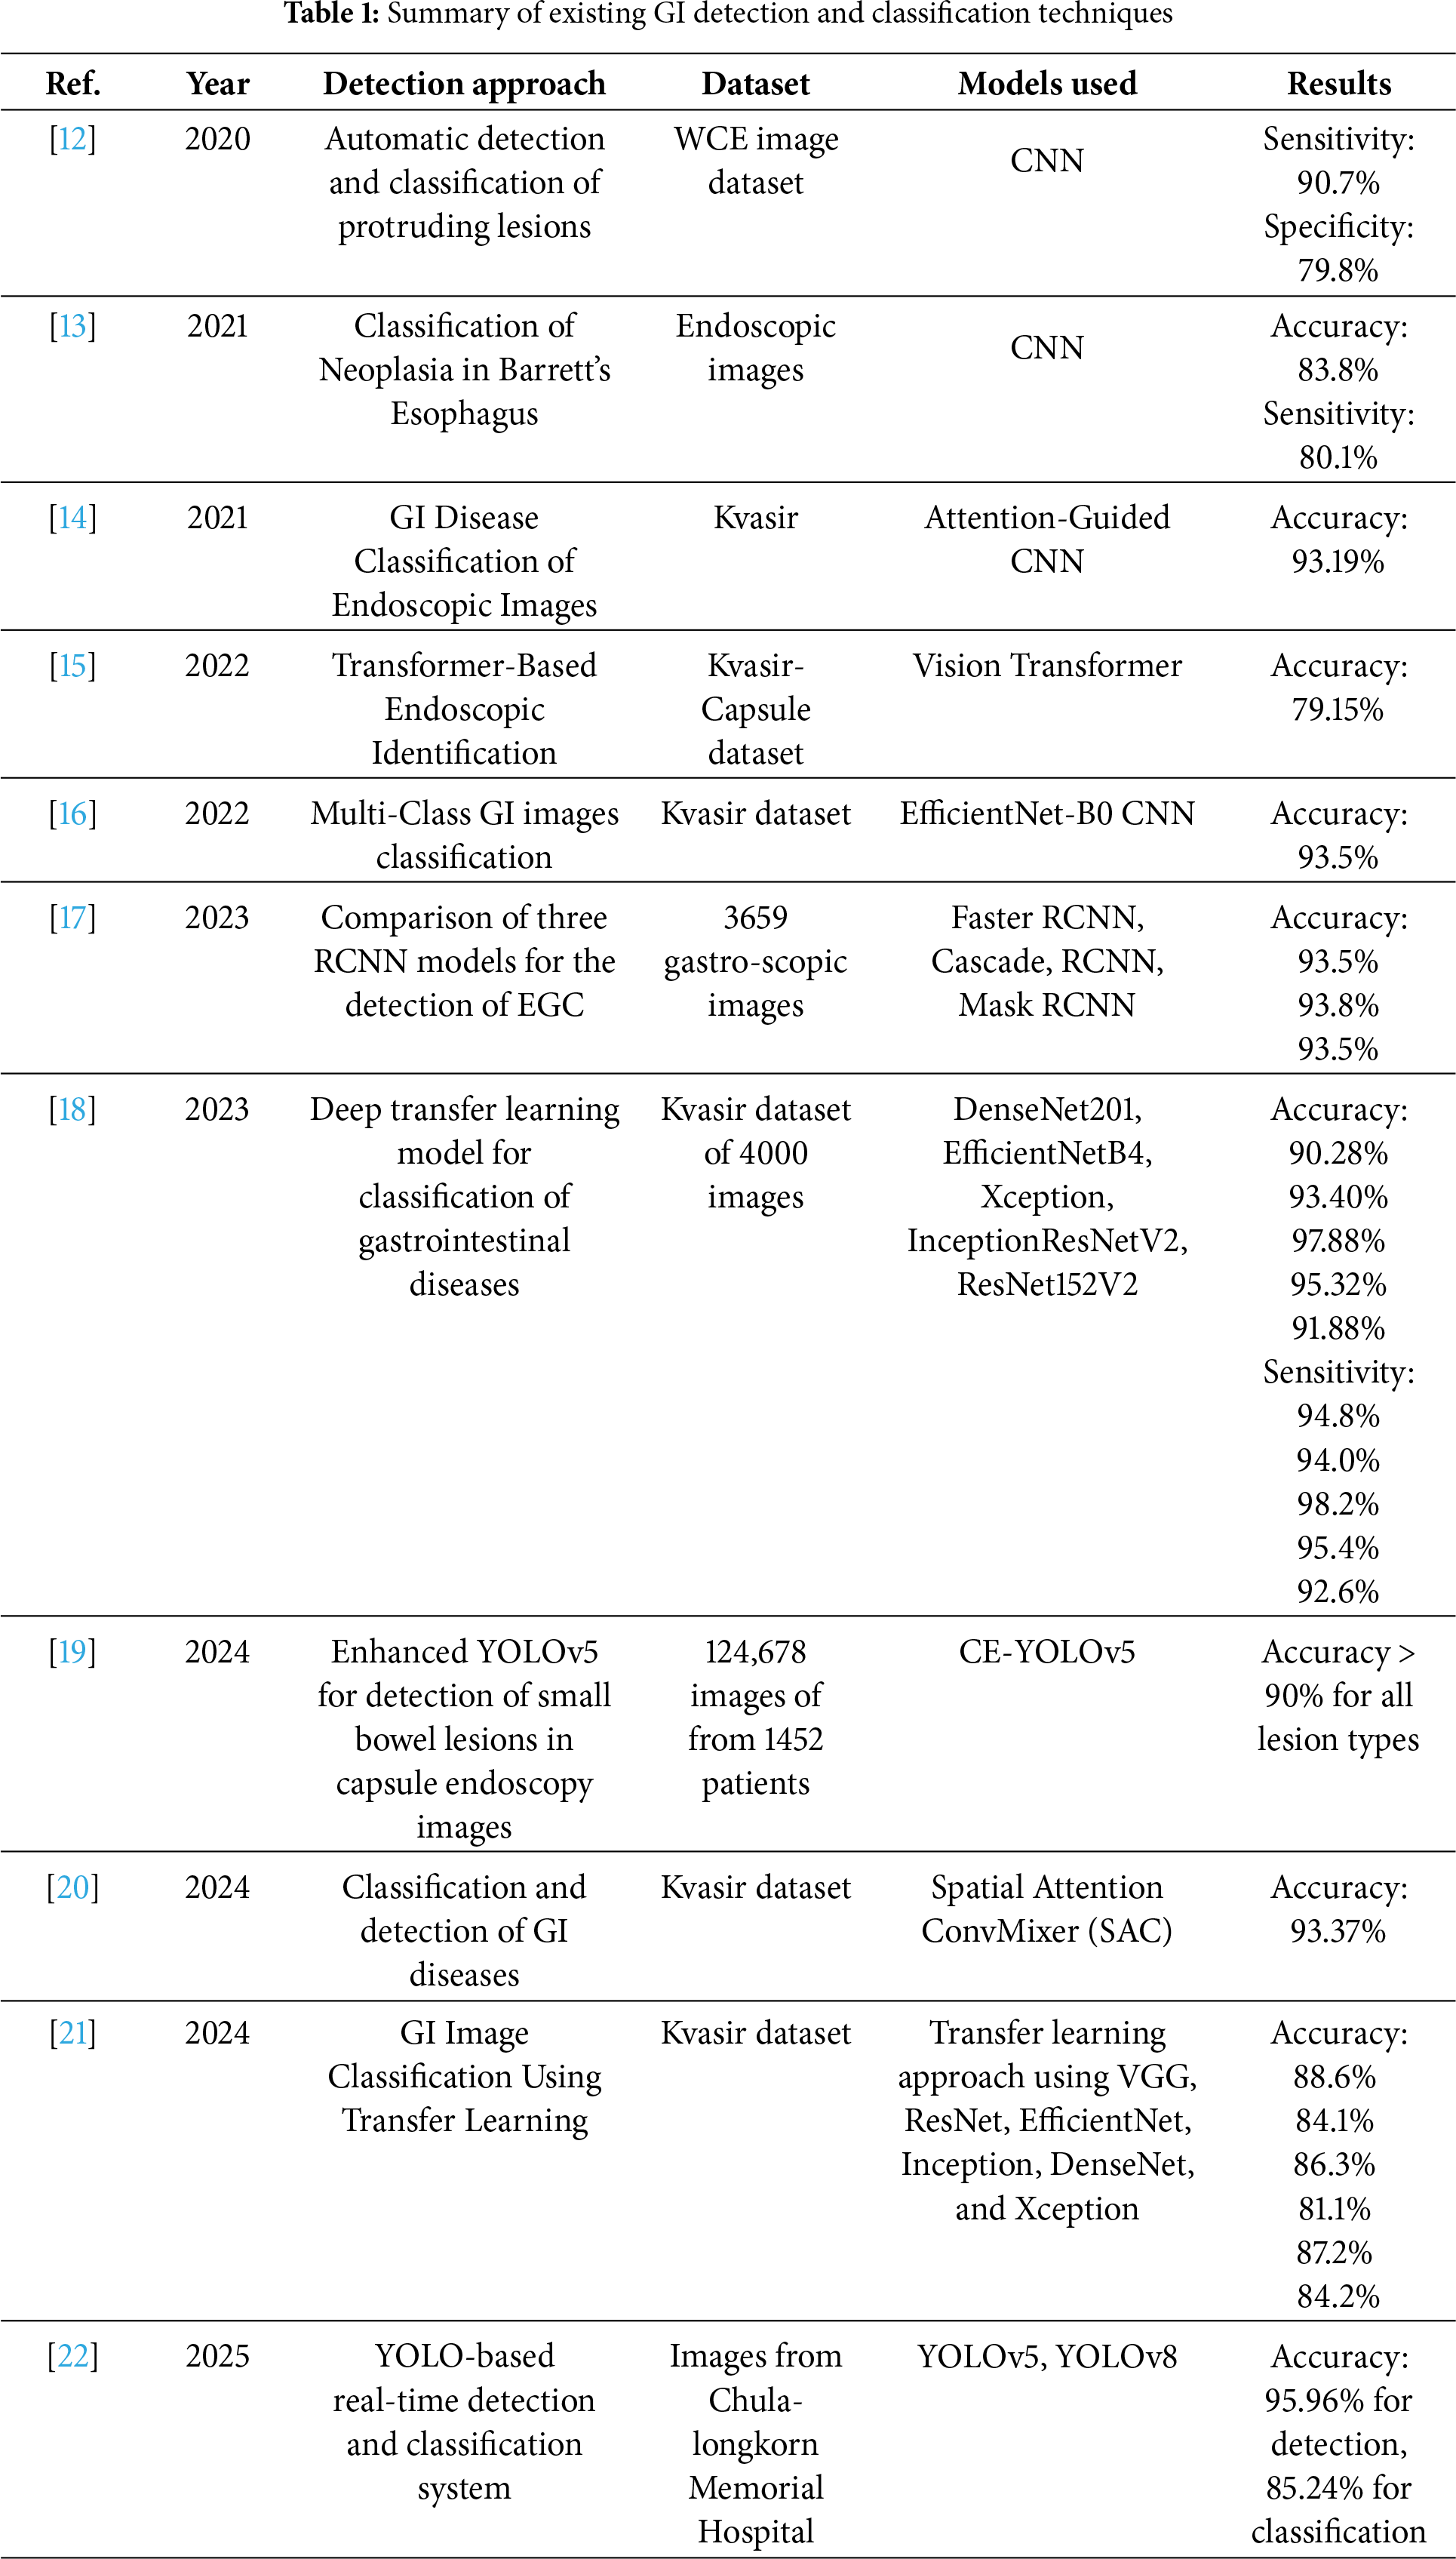
A novel architecture [20] introduced Spatial Attention ConvMixer (SAC) to facilitate research on computer-assisted diagnostics of gastrointestinal diseases. The SAC framework enhances the ConvMixer patch extraction method by including a spatial attention mechanism (SAM). The SAM allows the network to preferentially focus on the most meaningful regions, assigning significance to specific geographic areas within the feature maps. Using the SAC approach on the Kvasir dataset, the ConvMixer framework achieves a 93.37% accuracy rate, which is higher than the state-of-the-art methodologies. SAC limitations show its struggle with scalability and diverse datasets. Another research [21] examines how to classify GI images utilizing deep learning algorithms. The annotated medical images utilized in the studies are accessible in the publicly available Kvasir dataset. The deep learning techniques utilize the following Convolutional Neural Network designs in conjunction with transfer learning: ResNet50V2, DenseNet201, ResNet152V2, VGG19, EfficientNetV2B3, EfficientNetV2B0, InceptionV3, and Xception. The prediction accuracy of 88.6% was achieved by the VGG19 model, which outperformed the other DL models in the experiments performed using the same dataset. In [22], YOLOv5- and YOLOv8-based real-time detection systems were used for detecting, classifying, and estimating the size of polyps during colonoscopies, which can assist doctors. But there still remains the presence of misclassification for different polyps, and the model is also sensitive to input image quality variations and lacks robustness for complex GI tract anomalies. The model achieved impressive F1-scores of 95.96% for detection and 85.24% for classification. Table 1 provides a summary of existing detection and classification techniques using deep learning.
Despite promising research results in previous methods proposed for GI tract diagnosis, there remain significant limitations, such as misclassification, insufficient utilization of spatial and semantic features, presence of false negatives, and limited generalization. Most of the existing research requires large datasets for model training and therefore relies on annotated datasets, which are often difficult to collect from clinical settings, thus reducing the practical use. Additionally, many models have neglected the integration of local and global features, which are crucial to detect early-stage accurately and multi-class classification. To overcome these limitations, the proposed study combines advanced optimization techniques, Transformer-based models, and CNN architectures. It incorporates more effective models capable of handling and utilizing both spatial attention and optimized features together to enhance classification, making them suitable even for small datasets. Furthermore, the robust pipeline minimizes false negatives and improves class-wise accuracy, which supports real-world diagnostics in gastroenterology.
This section outlines potential methodology for the classification of GI disorders, with image processing and stacking ensemble techniques. The aim of this proposed approach is to minimize the misclassification by first preprocessing the GI tract image, followed by dual-branch feature extraction with an extended BEiT Transformer and EfficientNet-B5. The BEiT splits images into patches, performs linear projection onto the image data, and passes it through multiple Transformer Encoder Layers. Each encoder contains Multi-Head Self-Attention, Feed-Forward Networks, and Add & Norm Layers. After that, Global Average Pooling, Dropout, and a Fully Connected (FC) layer are applied to further refine the extracted features. EfficientNet-B5 is employed that uniformly scales all the dimensions, including depth, width, and resolution, to extract fine-grained low-level spatial features for detailed visual understanding using its effective compound coefficient. The final stack is a multiple modal stack, which combines the SVM, Gradient Boosting, Logistic Regression, and Multilayer Perceptron (MLP) classifiers, and uses a meta-learner (Logistic Regression) to obtain predictions for final classification. The combination of past knowledge from a BEiT model, fine-tuning, regularization, and ensemble learning helps to improve the overall performance of the system. The proposed approach for GI tract classification is presented below in Fig. 1.
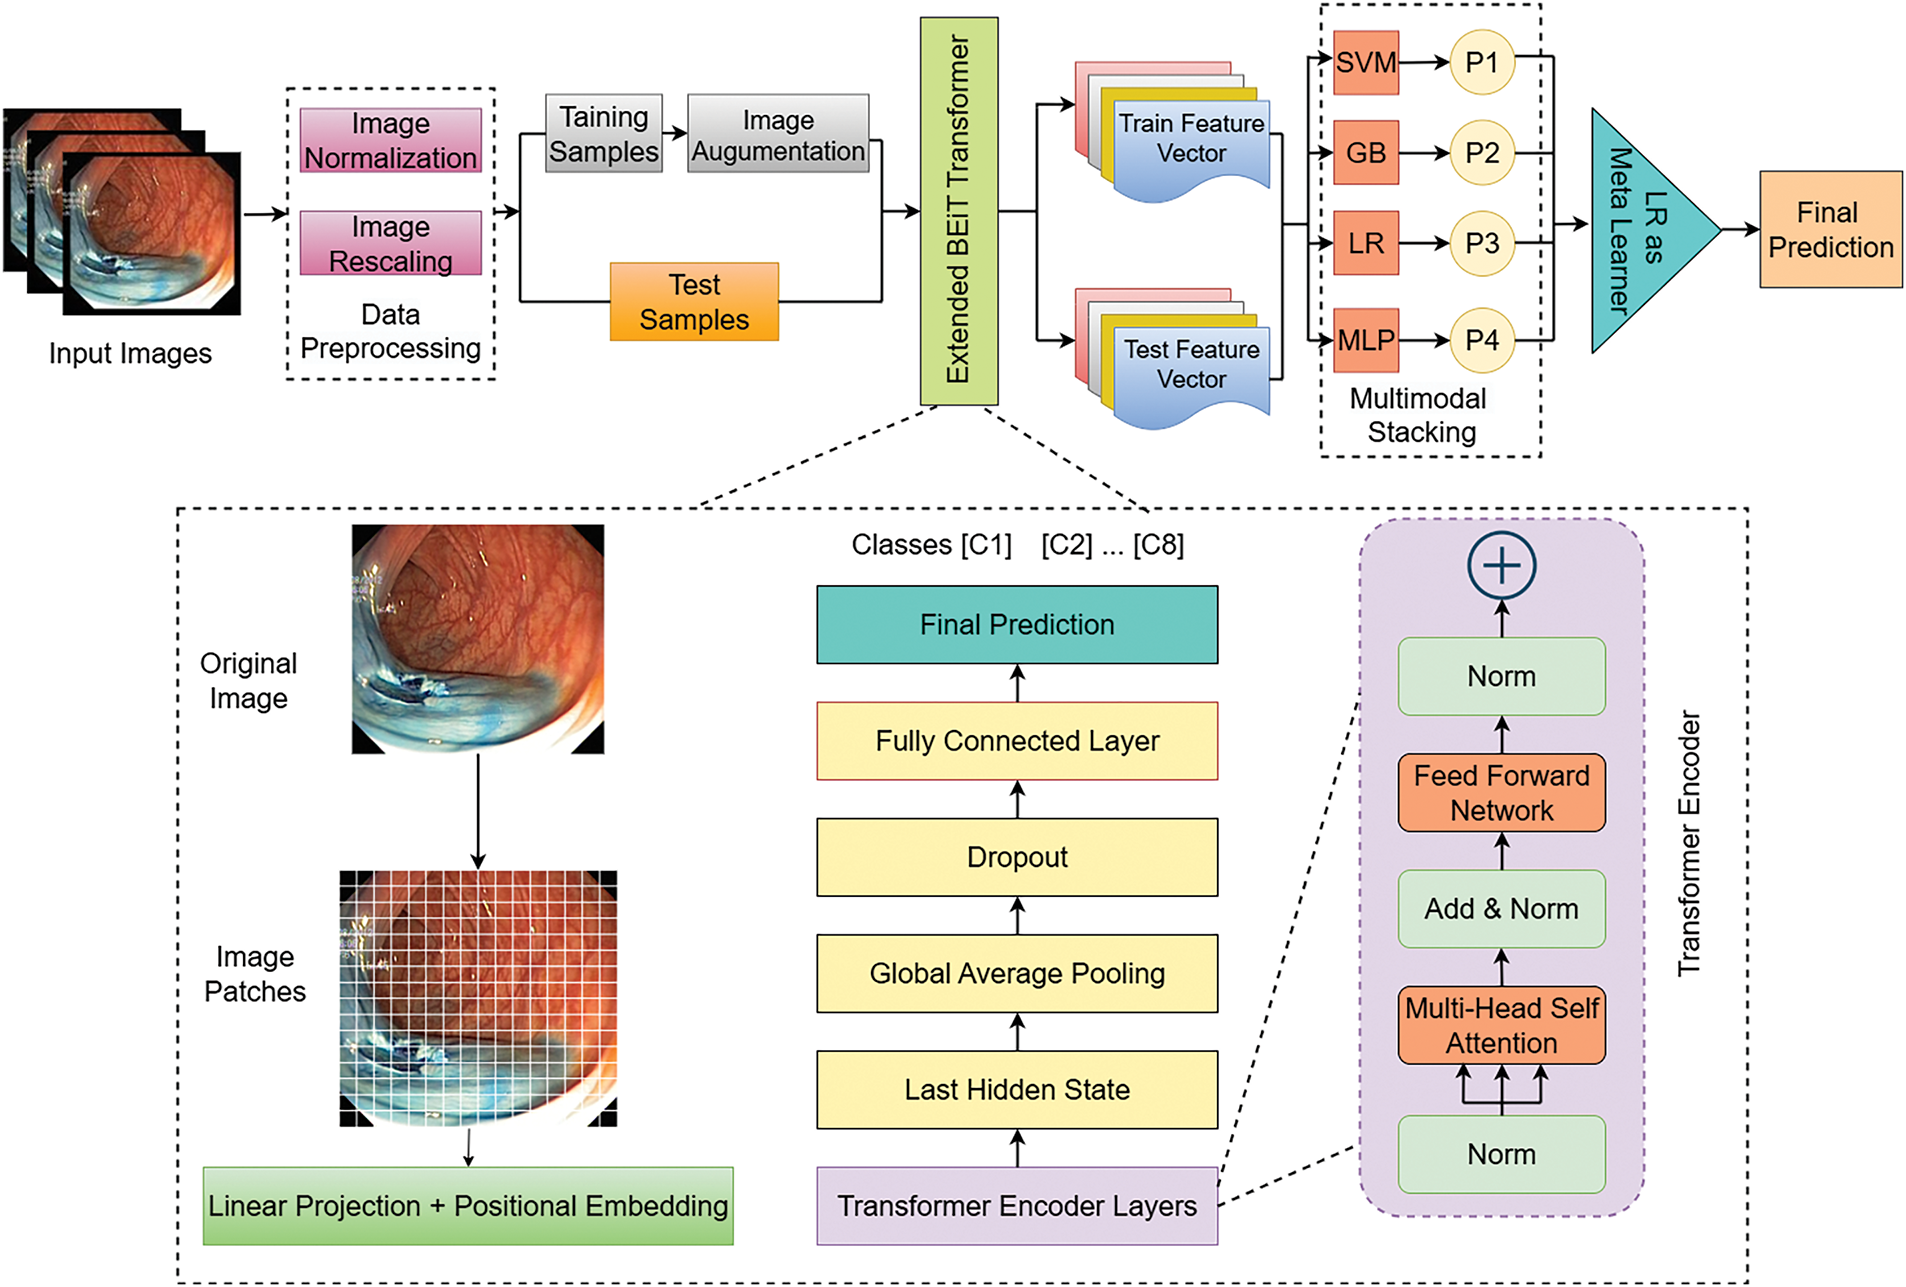
Figure 1: Proposed extended BEiT transformer based model for GI tract
Image preprocessing comprises changes in the attributes of images to enhance the way they appear for human perception and machine interpretation [23]. It is a crucial first phase in managing gastrointestinal tract images due to intrinsic issues such as inadequate contrast, illumination variations, varying resolution, and unwanted noise [24]. Since the Kvasir dataset contains images with different sizes ranging from 720 × 576 to 1920 × 1072, the preprocessing technique applied was for image size normalization in order to feed deep learning models efficiently.
Images of the Kvasir dataset are in different sizes and resolutions that include 720 × 576, 800 × 600, 1920 × 1072, etc, and these images are resized to be of size 224 × 224 pixels. This makes all the input images similar to images that are in other pre-trained models, thus minimizing computational intensity. Let the original image be 1280 × 1024 and resized into 224 × 224. The result of our dataset is presented in Fig. 2. The operation preserves the aspect ratio and scales the image to the desired dimensions. Mathematically, resizing can be expressed as:
where
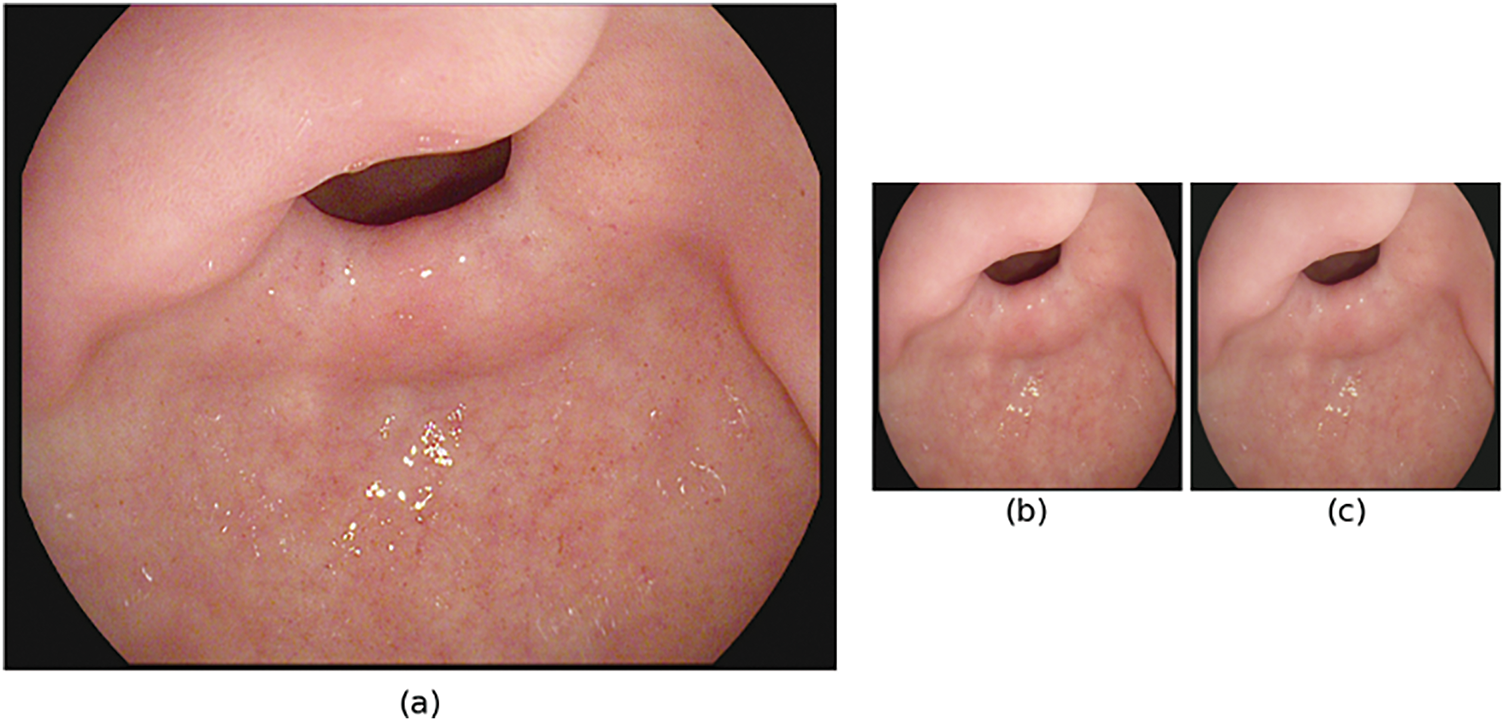
Figure 2: Preprocessing stages of GI tract images for model input (a) original image (1280 × 1024), (b) resized image (224 × 224) and (c) normalized image
Further, to standardize the intensities of image pixels, normalization is applied, which is particularly important to fine-tune the weights of the models. The applied normalization is as follows:
where
Moreover, to enhance the robustness of the model and to get better generalized results, data augmentation is performed on the training data separately. Fig. 3 shows the applied techniques such as bright adjustment, Gaussian Blur, Horizontal and vertical flip for generalization. All these augmentation techniques are used to add variability and prevent overfitting; however, the validation and the test datasets remained intact to test the model on real and unseen scenarios.
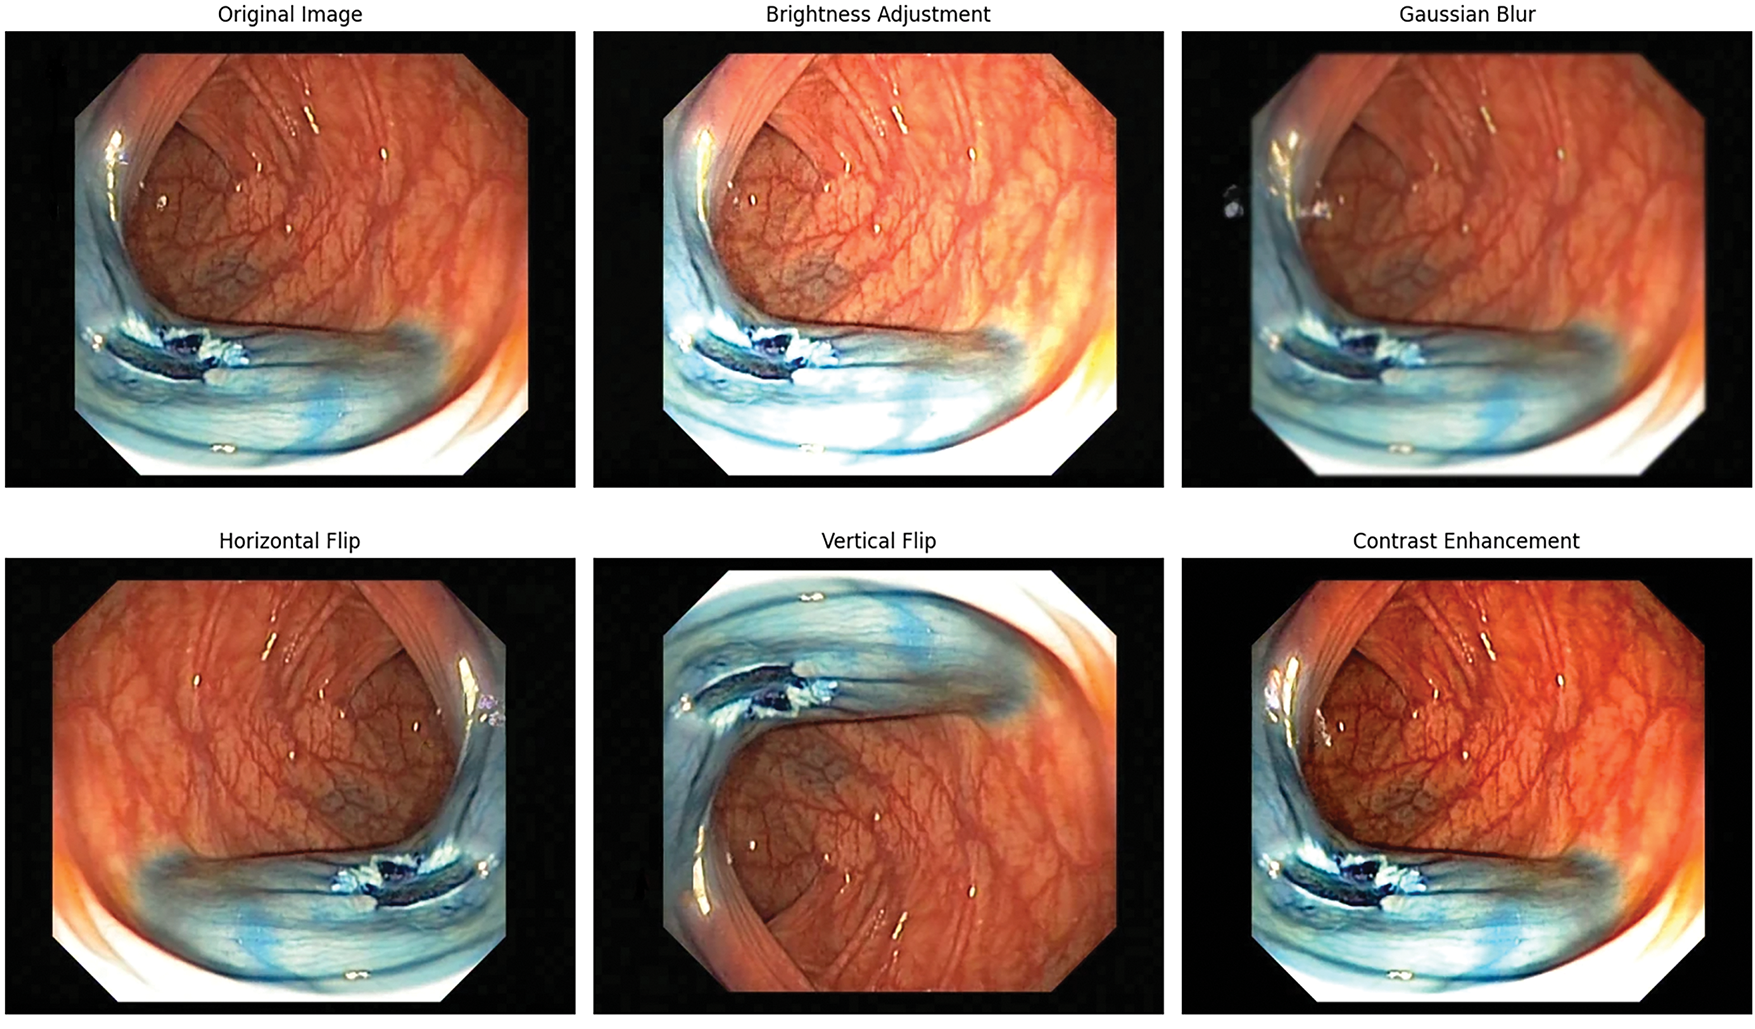
Figure 3: Data augmentation techniques applied on GI tract images
3.2 Dual-Branch Feature Extraction
In this phase, dual feature extraction is designed to combine the strengths of both transformer- and CNN-based architectures. In the first branch, a transformer-based BEiT model is employed, where its self-attention mechanism extracts global contextual features, such as the organ shape, bleeding spread, as well as captures high-level semantic features, such as identifying tumors, their edges, and colors. Meanwhile, the second branch utilizes CNN models like EfficientNet-B5, which primarily focus on the extraction of both low-level features. By integrating features extracted from both of these branches, the model develops a deeper understanding of what is present in the image, not just how the image appears. Integration of both branches enhances the ability of the model to automatically detect and classify abnormalities in the GI tract. Fig. 4 illustrates the flow of the dual-branch feature extraction module.
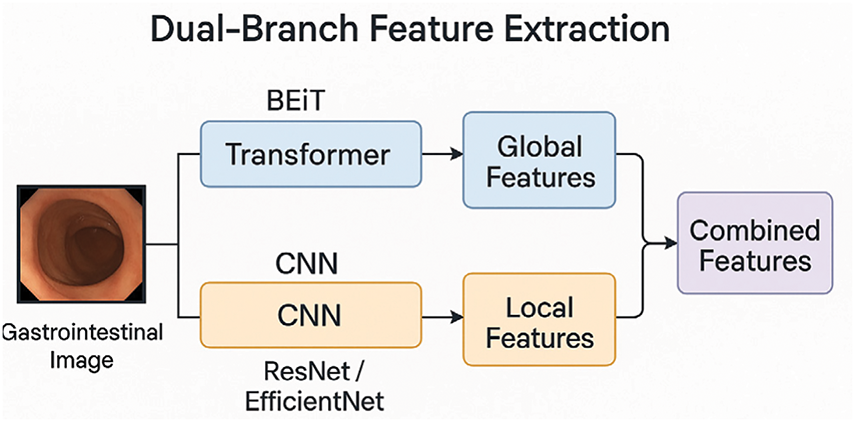
Figure 4: Workflow of dual-branch feature extraction
3.2.1 First Branch: Transformer-Based BEiT
The BEiT (Bidirectional Encoder representation from Image Transformers) model, a vision transformer (ViT), is employed for extracting the image representation of the Kvasir dataset. An input image of size 224 × 244 is split into (224/16) × (224/16) patches, and subsequently transforms them into a sequence of embeddings. Multi-head self-attention is used to capture dependencies at various resolutions throughout the image. After that, non-linear layers along with a classification head are used to process attention outputs and to predict class probabilities.
However, the base BEiT model is fine-tuned for the classification of GI tract diseases by adding a fully connected (FC) layer. This customized architecture allows the model to utilize pre-trained BEiT attributes while adapting to the GI disorders classification for the Kvasir dataset. To obtain the global image features, the mean of the last hidden states from the transformer is used as the pooled output.
where
Moreover, this pooled vector is then passed through a linear layer to map the pooled features into the output space, which corresponds to the number of GI disease classes in the dataset.
where
After image preprocessing, the dataset is divided using stratified sampling to preserve the distribution of classes, where the ratio is 80:20 for training and testing. In addition, several data augmentation techniques are applied only on the training dataset to replicate real-world variation while improving model tolerance against overfitting. During the training process, the model generates predictions by transferring the image tensor T through the transformer and a fully connected layer
where
The cross-entropy loss is used to measure the error of prediction to ensure the model accurately learns the differences between the probability of the classes and the true labels. Besides that, the Adam optimizer is applied to iteratively update the parameters of the model to gain a better learning rate and effect. The trained model undergoes evaluation on the validation set employing different classification metrics.
To extract robust features from the image data, the BEiT is switched to ensure consistency by suppressing stochastic components such as dropout layers. The BEiT backbone processed the images, and the final hidden state is utilized to extract patch-wise feature embeddings, which is defined as:
where H ∈
where the feature vector for the ith image is represented as
The resulting feature vector
where
This matrix is then fed as input to subsequent machine learning procedures, such as classification, to underscore the BEiT model’s capacity to generate both semantically rich representations while also being compact visually. This technique made it possible to get the features that contain a large amount of semantic interpretation of the input images, which can be crucial for improving the performance of various tasks, such as multimodal learning or disease classification.
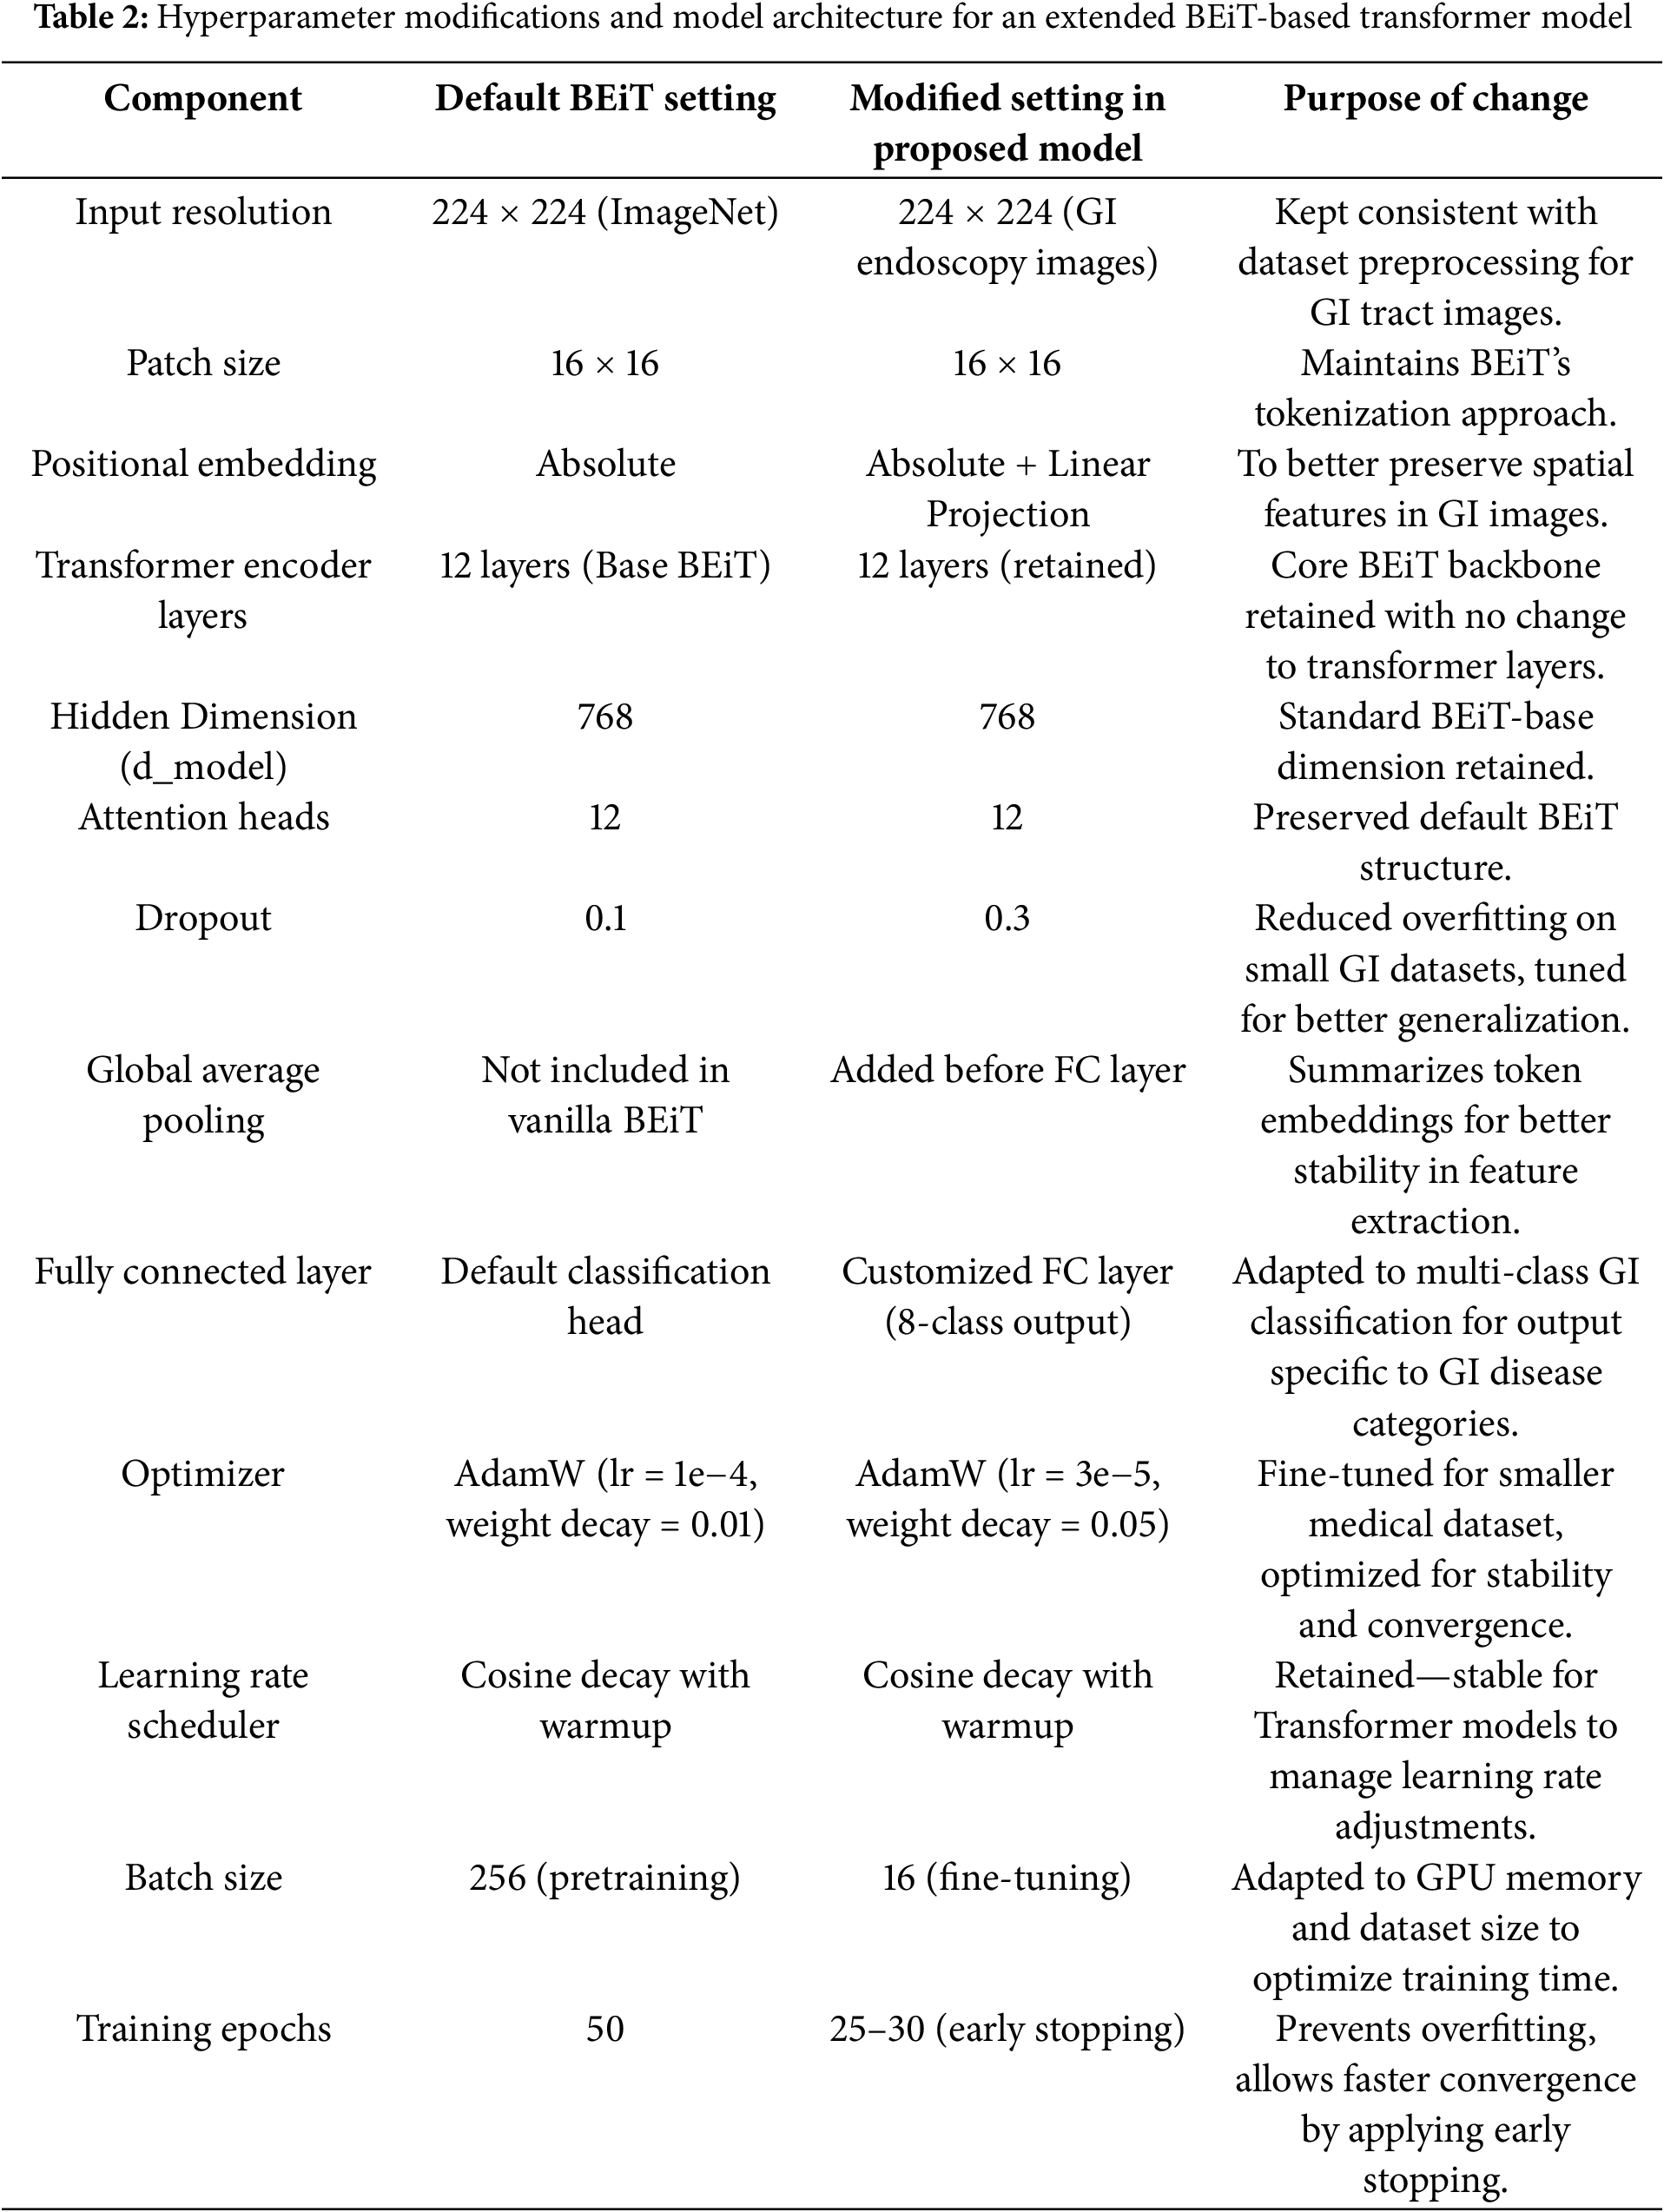
To provide a clear overview of the model’s architecture and the adjustments made to enhance performance for GI tract classification, the table below summarizes the key hyperparameters and settings used in the proposed BEiT-based Transformer model. Table 2 highlights the modifications and why each change was necessary to optimize the model for the unique characteristics of the GI disease dataset.
3.2.2 Second Branch: CNN-Based (EfficientNet-B5)
In this branch, CNN models such as EfficientNet-B5 are employed to extract fine-grained low-level spatial features are extracted for detailed visual understanding. These features include structural localization, shape, and edge identification of the organ. Hierarchical layers of CNN models are especially designed for capturing low-level details. These features add more detailed features that complement the high-level features extracted from the first branch.
For model processing, input images require some standard preprocessing steps, such as image resizing into a standard 244 × 244 dimension, which is then passed through the CNN layers that progressively extract complex patterns into a feature map. To obtain this feature vector first, input the image,
This equation represents the process where
For further classification, global average pooling is applied, which compacts this feature map
Global average pooling aggregates all values in the
This
from where
Similarly, at the first branch where the transformer is trained, CNN models are trained across class entropies such as:
where
Moreover, this CNN branch is designed to obtain optimized local features, where parameter optimization
3.3 Multimodal Attention-Based Feature Fusion
This multimodal attention-based feature fusion is performed to integrate the optimized feature vectors obtained from both the first branch Transformer mode (BEiT)
After feature extraction next step is to project the features obtained from both branches into a common embedding space that helps to align their dimension. This embedding is performed by learnable linear layers:
The next step is to compute attention weights for each branch. To compute the attention weight of the first branch
where the attention score of both branches must be as
After calculating the attention weights, they are fused with the feature vector and transformed into a single fused feature vector
This fused vector
where
3.4 Multimodal Stacking Classification
To enhance the classification performance of gastrointestinal tract diseases, the obtained fused feature vector
Let
where
These predictions are then passed to a Logistic Regression meta-classifier, which forms the final predictions based upon combining the results of the base-learners. To provide robust and reliable training while reducing the risk of overfitting, the 5-fold cross-validation technique is used for the training of the meta-classifier. The data is divided into five subsets, and for each fold k ∈ {1, 2, 3, 4, 5}, the model is trained on the other four subsets and validated on the remaining one. Thus, each data point is used for both training and validation, ensuring a thorough and generalizable meta-classifier. During this phase, the predictions (meta-features) generated by the base models in each fold are combined to form the final input for the meta-classifier. These combined meta-features are represented as follows:
where
This step ensures that all meta-features are derived from unseen data within each fold. It results in a robust and unbiased dataset for training the meta-classifier. The training process starts by normalizing the features of the inputs to maintain consistency among all classifiers. After training the base classifiers and the meta-classifier on the scaled data, the stacking model integrates their strengths to predict the test data. This method enhances the final result by efficiently using the distinct strengths of each classifier in the ensemble.
A comprehensive analysis and discussion of the results obtained from conducting multiple experiments on both the proposed methods and pre-trained models is presented below. This section provides an in-depth understanding of the findings and conclusions that have been derived from the applied experiments.
The Kvasir dataset [25], which comprises images from the gastrointestinal (GI) tract, is employed in this research. The images are categorised into three clinically significant results and three significant anatomical landmarks. Furthermore, it includes two distinct groups of images that are associated with the removal of endoscopic polyps. The Kvasir dataset is presented as shown in Table 3.
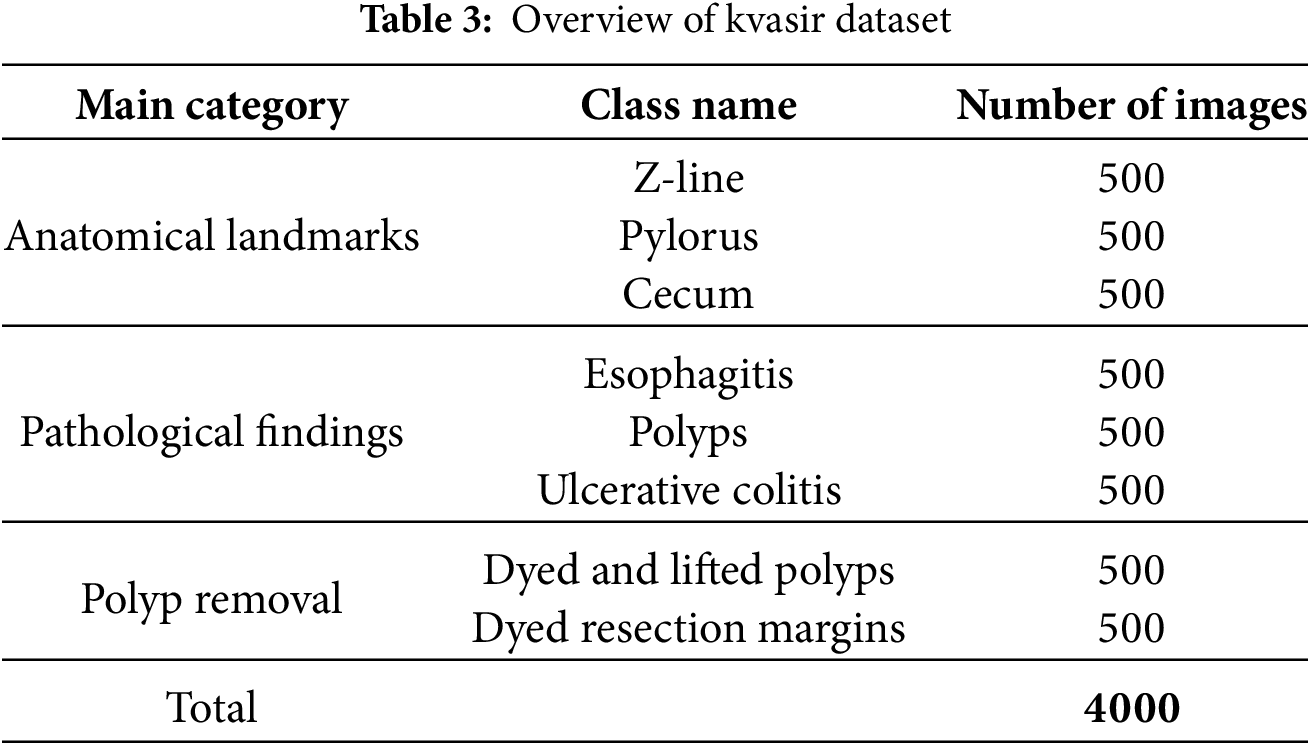
The dataset contains four thousand images, labelled and validated by clinical professionals (seasoned endoscopists). It consists of eight distinct classes depicting anatomical landmarks, pathological abnormalities, or endoscopic activities within the gastrointestinal system, with 500 images allocated to each category. The anatomical markers comprise the pylorus, Z-line, and cecum, whereas the pathological findings encompass esophagitis, ulcerative colitis, and polyps. Additionally, two sets of images about the removal of polyps, known as the “dyed and lifted polyp” and the “dyed resection margins,” are provided. The dataset includes images with varying resolutions ranging from 720 × 576 to 1920 × 1072 pixels, systematically organised into distinct folders labelled according to their information.
Although the Kvasir dataset is a reliable benchmark, it is also restricted in size and in the balanced class distribution and may not fully capture real clinical conditions. These are factors that can restrict the generalization of the model in different classes of imbalanced clinical data. In the future, external validation studies with more diverse and larger datasets are needed.
In this phase of the Section 4, a comprehensive evaluation of the proposed model is performed. The impact of integrating dual-branch features with model stacking is analysed. The model is trained using a learning rate Scheduler, a batch size of 16, the Adam optimizer, and cross-entropy loss, over 25 epochs. The proposed model is evaluated on a 5-fold stratified cross-validation on the complete GI tract dataset. Furthermore, the performance of the proposed model is also illustrated through the confusion matrix and Grad-CAM visualization. Finally, an ablation study is conducted that highlights the effectiveness and contribution of each module.
To evaluate the efficiency of the proposed model, the overall model performance is presented in Table 4. The mean and standard values reported in this table are calculated from the full cross-validation process to ensure more reliable and robust results. In this table, the complete model is compared with the individual CNN branch, the transformer branch, and the dual branch feature extraction approach. This table further highlights the impact of integrating the dual branch with attention feature fusion. Finally, the proposed model, which includes class entropy optimization and stacking, achieved the best performance of 94.3% accuracy with 96.8% AUC-ROC, which proves its effectiveness.
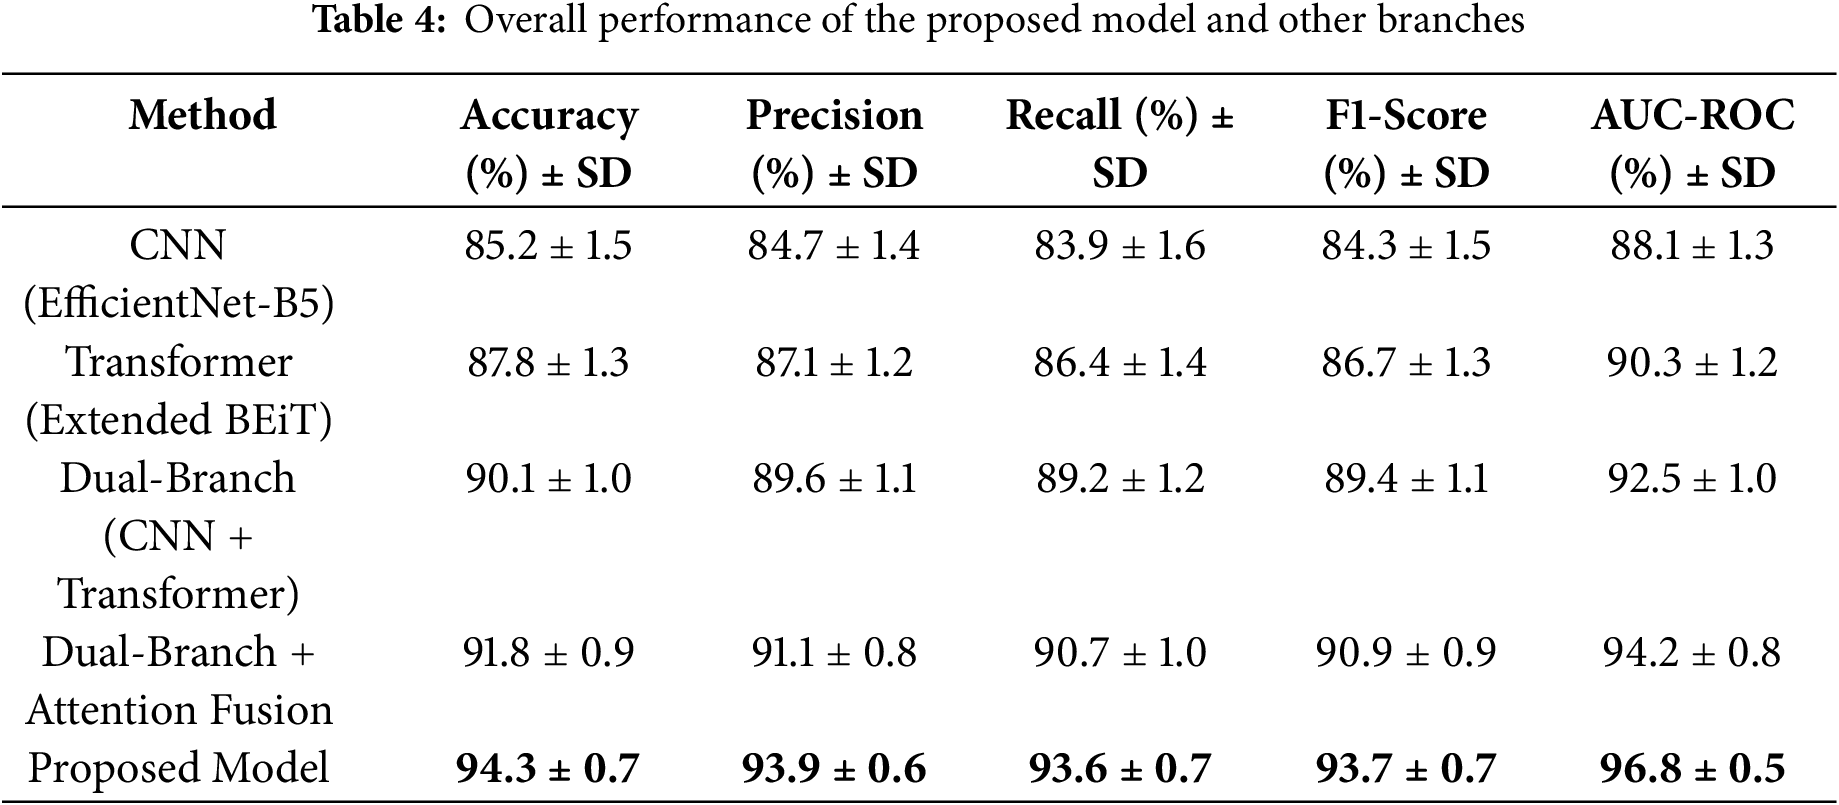
The results in Table 4 clearly show that combining CNN and Transformer features, along with attention fusion and stacking, leads to noticeable improvements in all performance metrics. The proposed model achieves high accuracy and recall, meaning it can reliably detect GI diseases while reducing missed cases. Compared to using individual branches alone, this ensemble approach strengthens predictions and makes the model more practical for real-world clinical use.
The heatmap in Fig. 5 shows the parts of the endoscopic images that the proposed framework focuses on when making predictions. The Grad-CAM visualizations highlight the region of images the model considers most important, helping us understand how it interprets the images during both the feature extraction and classification steps. The heatmap overlay reveals how the model looks at both local and global features, improving the accuracy of its predictions. The Grad-CAM maps offer a better understanding of the model’s decision-making as well as highlight the areas of the image that are key to its final prediction.
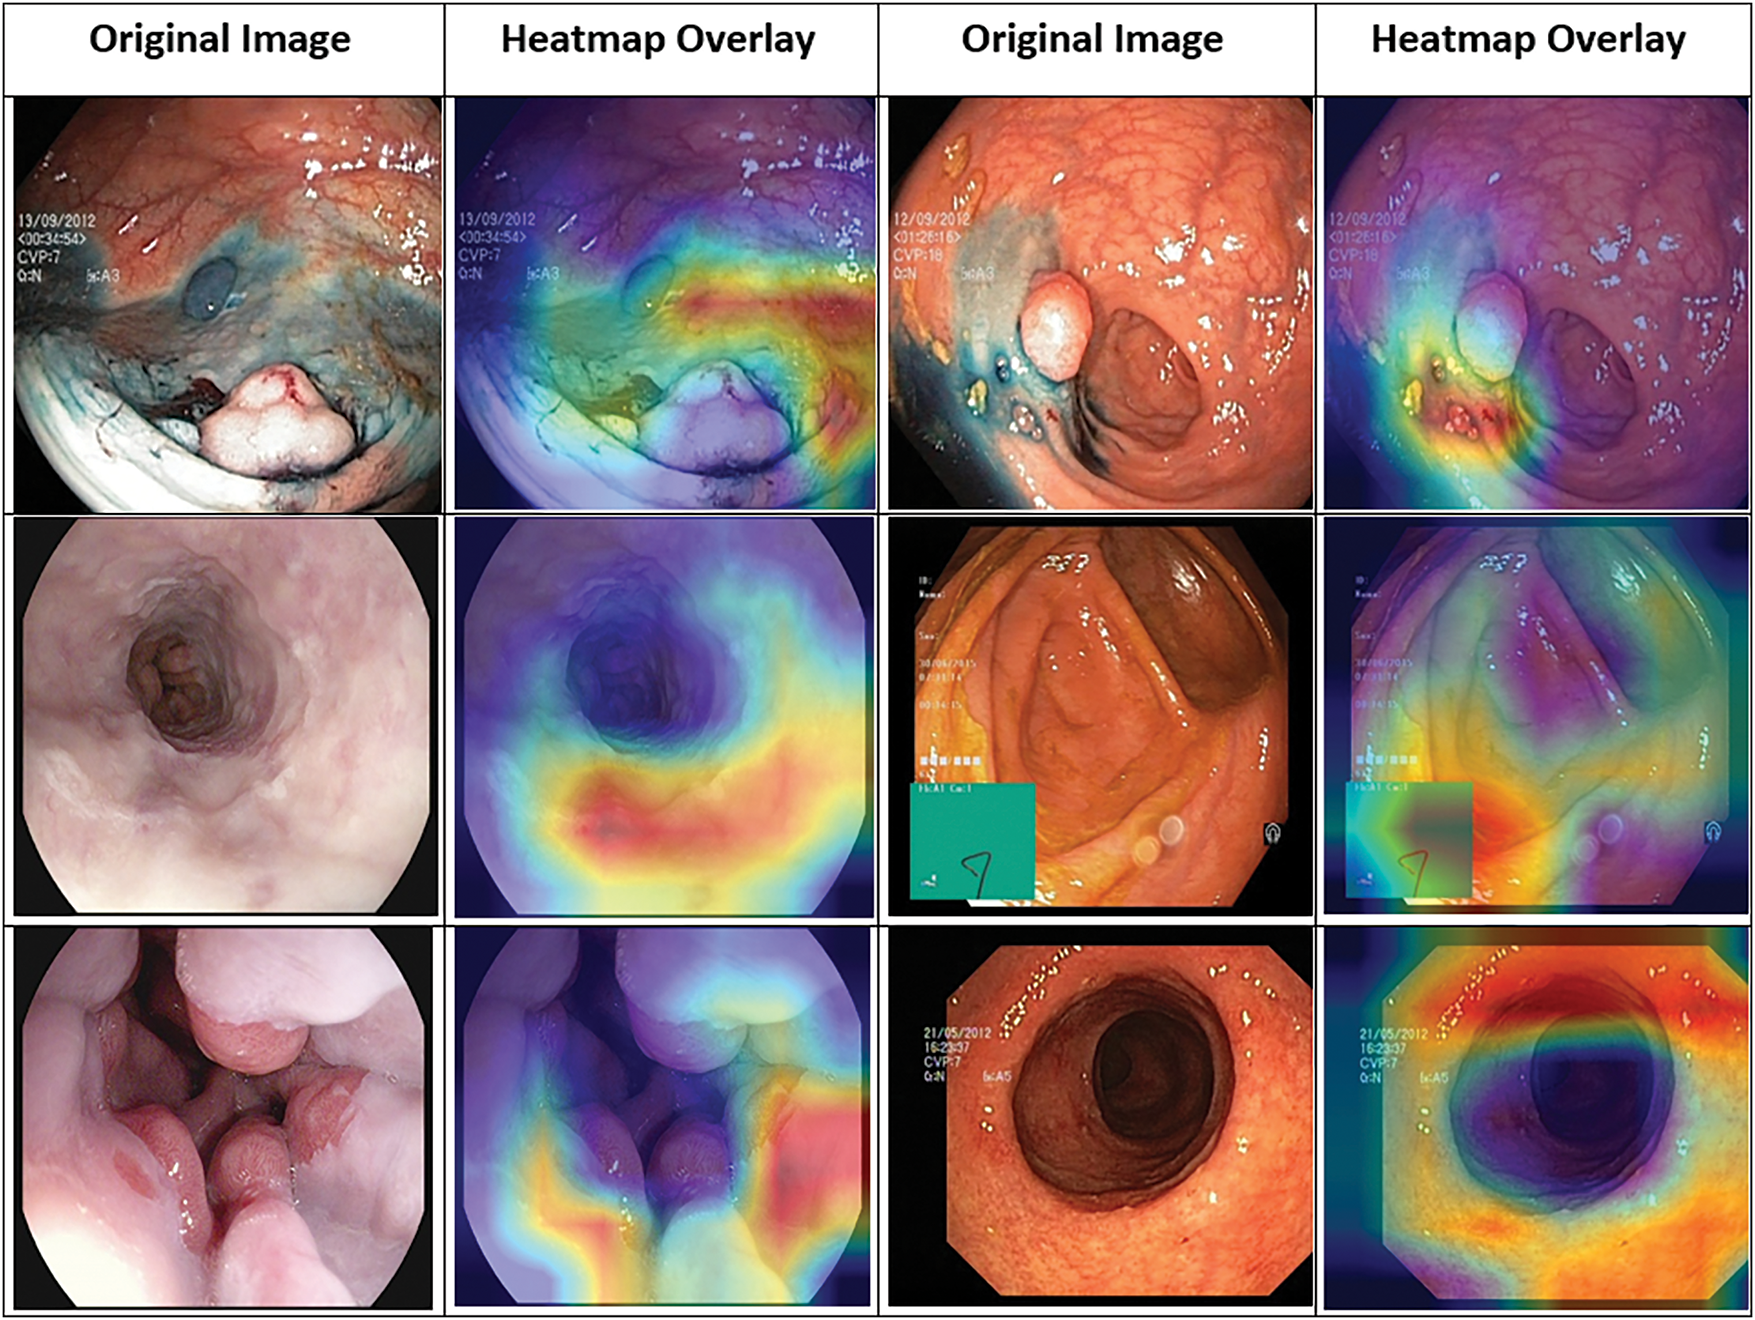
Figure 5: Grad-CAM visualization highlighting focus areas in Kvasir images
Fig. 6 demonstrates the GI tract classification performance of different variants through a confusion matrix. In this matrix, each row represents the actual classes (positive and negative), and each column represents the predicted class. The diagonal of the confusion matrix (top left to bottom right) represents the number of samples classified correctly by each category. A high count in the diagonal plots represents the model’s ability to differentiate between the disease classes of the GI tract.
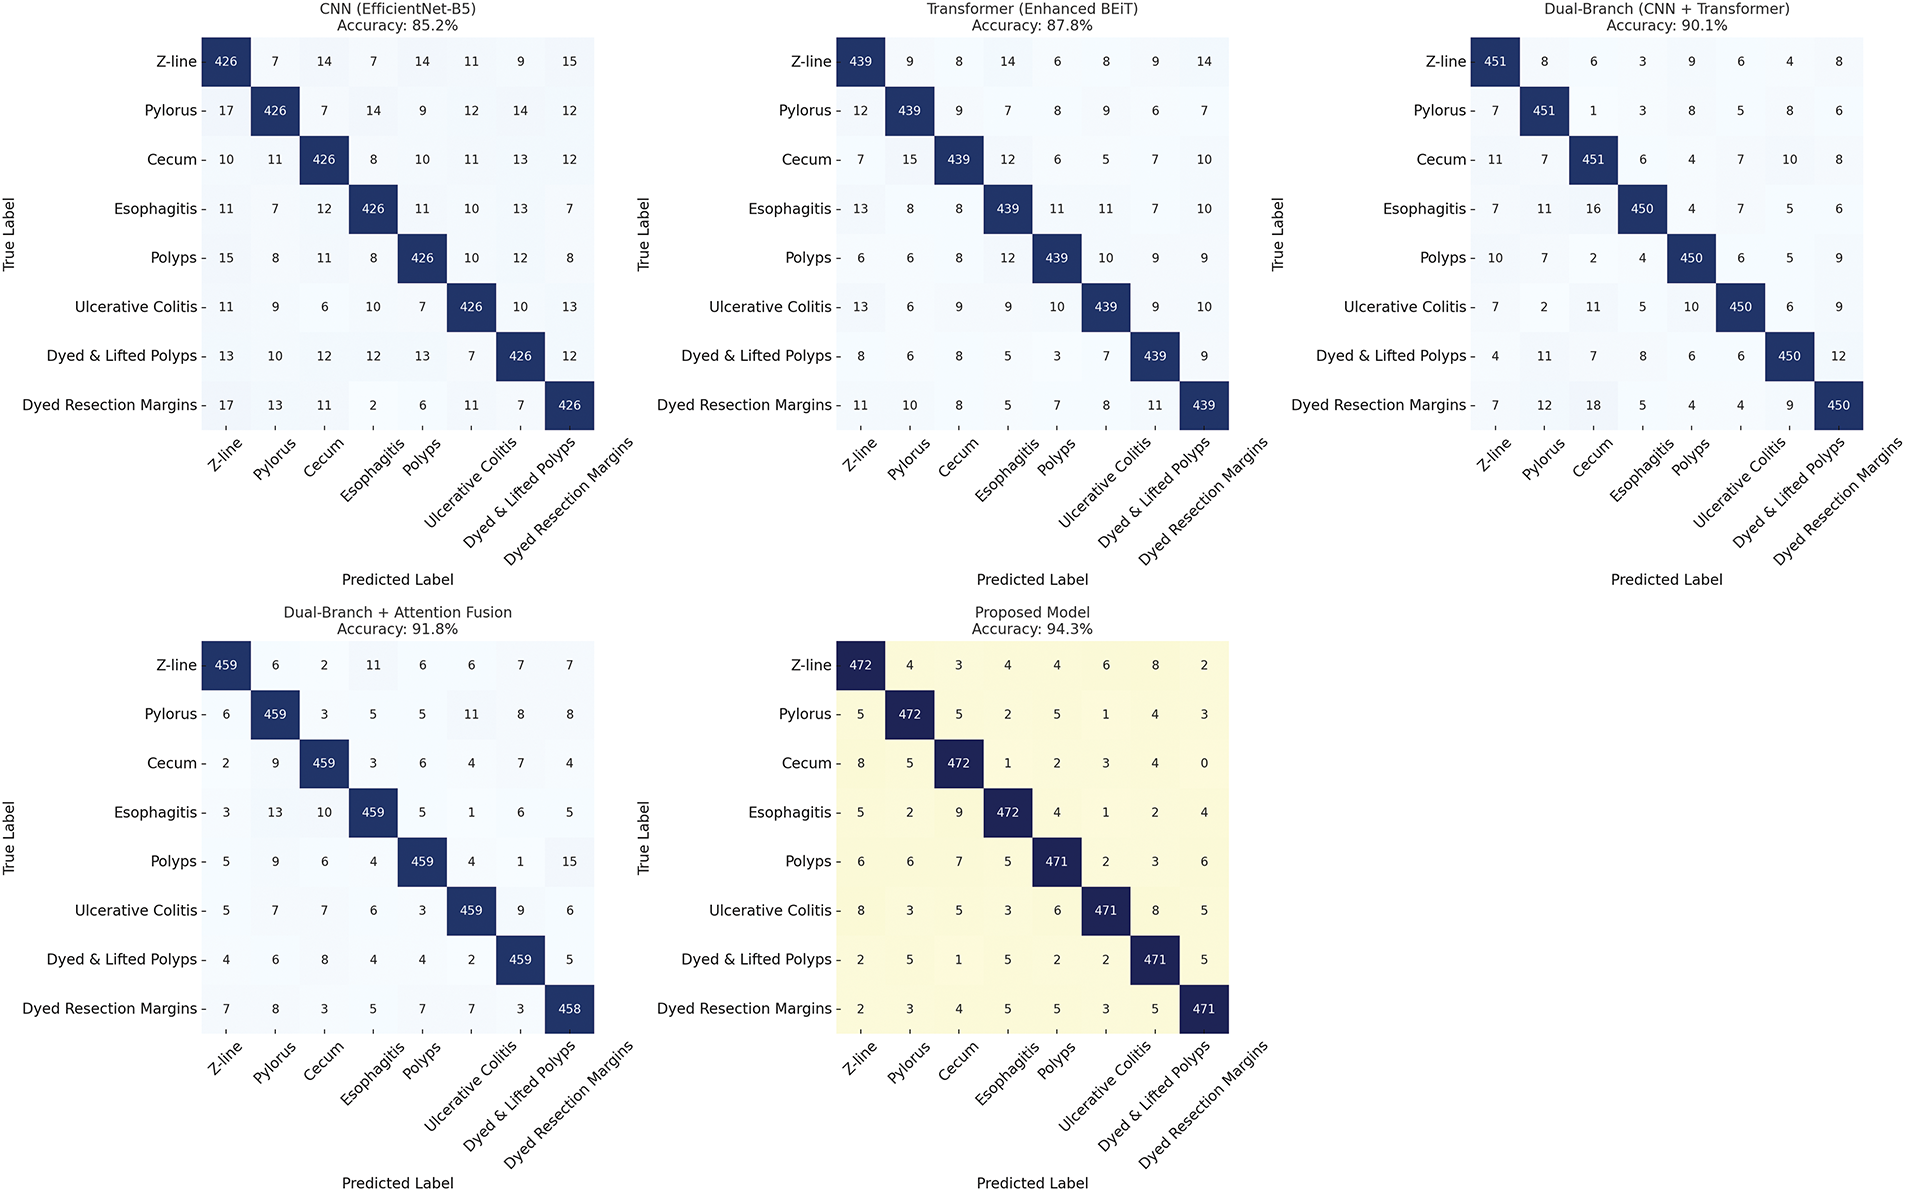
Figure 6: Confusion matrix comparison of different classification variants
To provide a deep insight into the model’s performance on each class, the performance analysis is presented on Table 5. The estimated overall accuracy is 94.12%, which indicates high classification performance for all eight categories. The overall F1 scores are high for most of the classes, with normal-pylorus having the highest score at 1.00, followed by normal-cecum and Ulcerative-colitis, both at 0.98. The perfect result for the Normal-pylorus class is due to its distinct and uniform features within the dataset, due to which the model classifies it accurately. There is a slightly lower recall for normal-z-line (0.87), demonstrating occasional misclassifications. The precision values show how well the model avoids false positives for each class, while recall indicates how accurately it identifies true positives. For example, Dyed-lifted-polyps has a precision of 0.93 and a recall of 0.94, meaning the model correctly identifies most polyp instances with very few errors. Normal-cecum achieves perfect recall (1.00) because of its distinct visual features, so the model detects every instance of this class without missing any. The slightly lower recall for Normal-z-line reflects some visual overlap with other classes, which leads to occasional misclassifications. F1-scores balance precision and recall, showing that the model performs reliably across all classes. Support values, with 500 samples per class, confirm that these results are consistent and unbiased. Nonetheless, the model maintained a good balance between precision and recall. This high precision and recall suggest that the model correctly identifies both TP (true positives) and minimizes FP (false positives) and FN (false negatives), which leads to accurate classification and minimizes misclassification across each class. These results show the efficiency of the model and the fact that it easily differentiates between Kvasir dataset classes with low error rates.
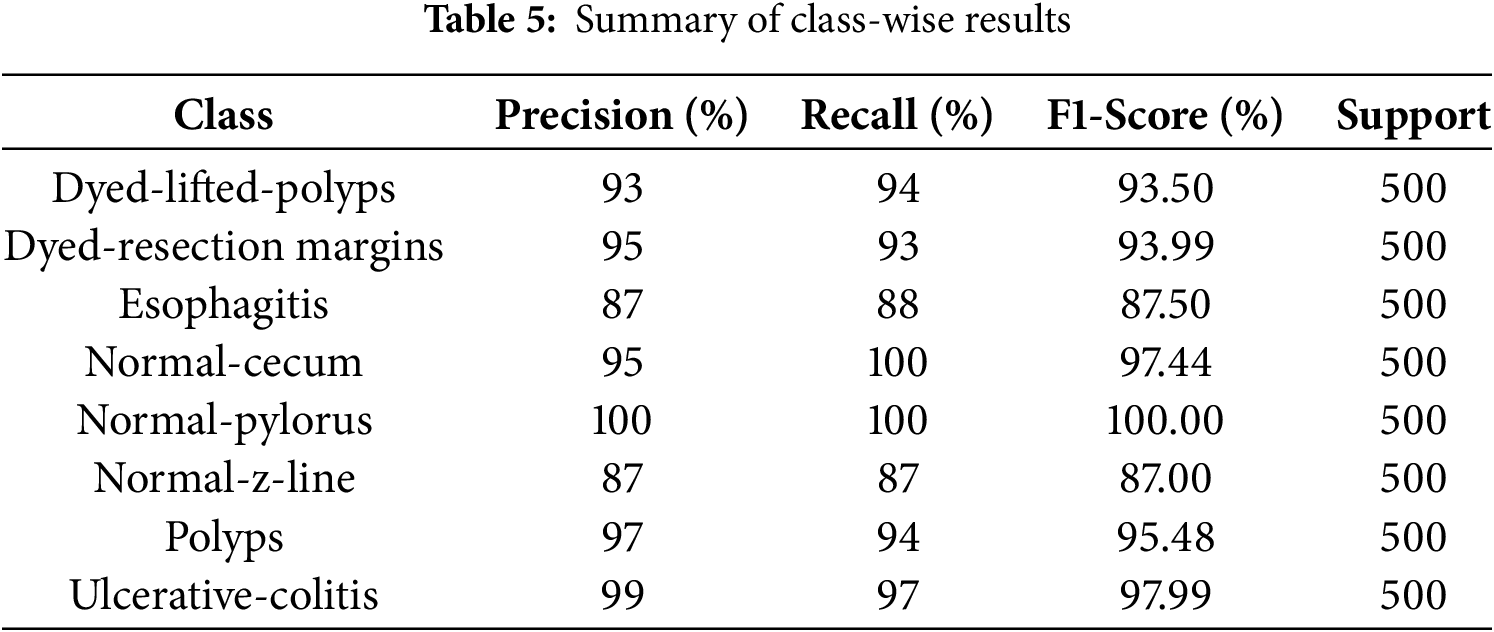
Fig. 7 depicts the bar graph representing false negatives for different classes, consisting of recall values and fixed support per class. False negatives refer to class instances that the model fails to predict correctly. This visualization shows that the proposed model achieves strong performance regardless of class type, with high recall and support values. Classes like Esophagitis and Normal-z-line exhibit higher false negatives. These two classes also show minimal visual distinction from other GI conditions and have inter-class similarities, which makes them challenging for the model to predict. However, the results reveal the model’s strength in capturing distinguishing features. As illustrated in the graph, there are two classes, Normal-pylorus and Normal-cecum, that show zero false negatives due to achieving 100% recall and support. This indicates that these two classes have low intra-class similarity and minimal overlap with other categories. However, the presence of class imbalance and dataset anomalies must also be considered. Some classes exhibit consistent and repetitive visual features, making them easier for the model to learn compared to others. Overall, these values indicate that the model is highly accurate in two aspects, avoiding most misclassification errors and significantly reducing false negatives.
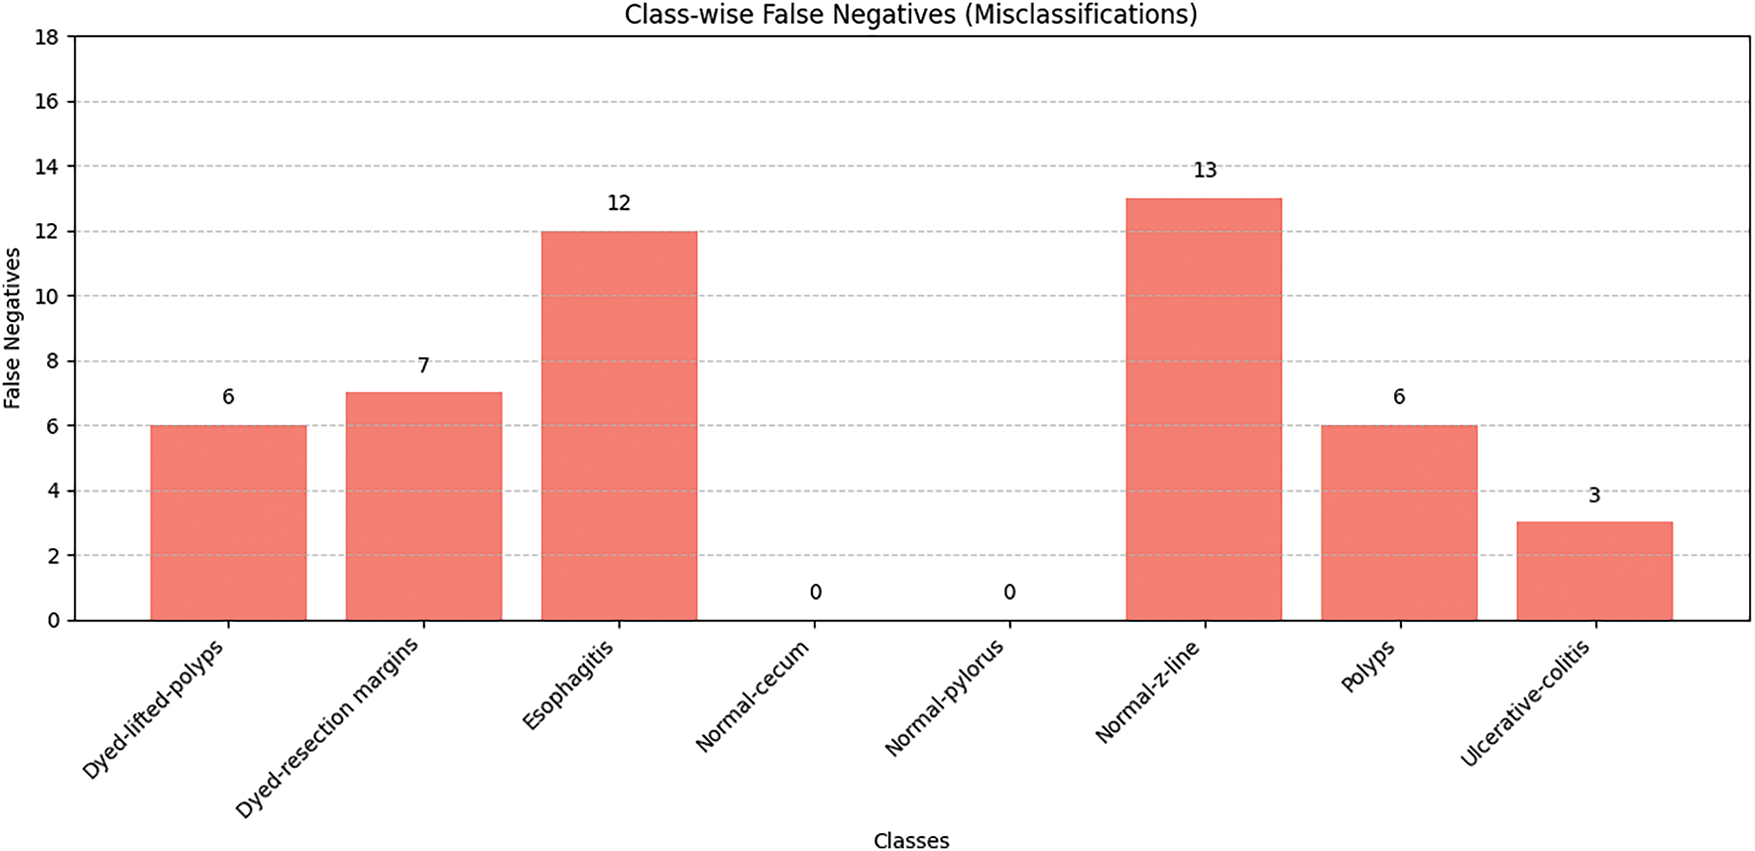
Figure 7: Class-wise false negative results
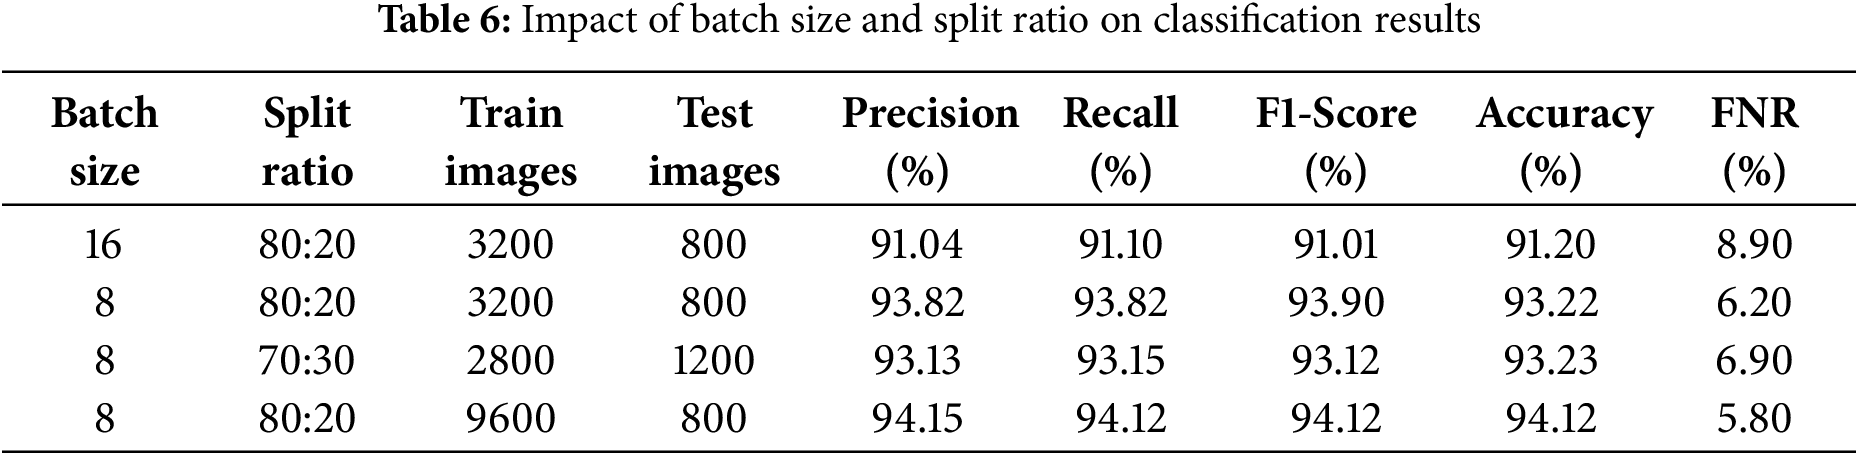
To improve the classification model’s performance, various values for batch size, split ratio, and the number of training and test images are tested. From the results presented in Table 6, it is clear that a batch size of 8 outweighs a batch size of 16 in terms of precision, recall, F1-score, and accuracy. Additionally, improving the number of training images to 9600 through data argumentation with testing images of 2400 is considered optimal to improve model generalization, with yields of precision: 0.941, recall 0.941, F1-score 0.941 as well as a low false negative rate (FNR) of 0.058 and high accuracy of 94.1%. On this basis, the final values of the parameters are chosen to build the model.
While tuning the hyperparameters, the impact of changing the patch size on the performance of the BEiT model was also observed. As depicted in the Table 7, decreasing the patch size from 32 × 32 to 8 × 8 increases the number of patches, which is beneficial for the model as it allows it to capture more fine-grained details from the image. This change improves the model’s accuracy from 91.20% to 94.12%.
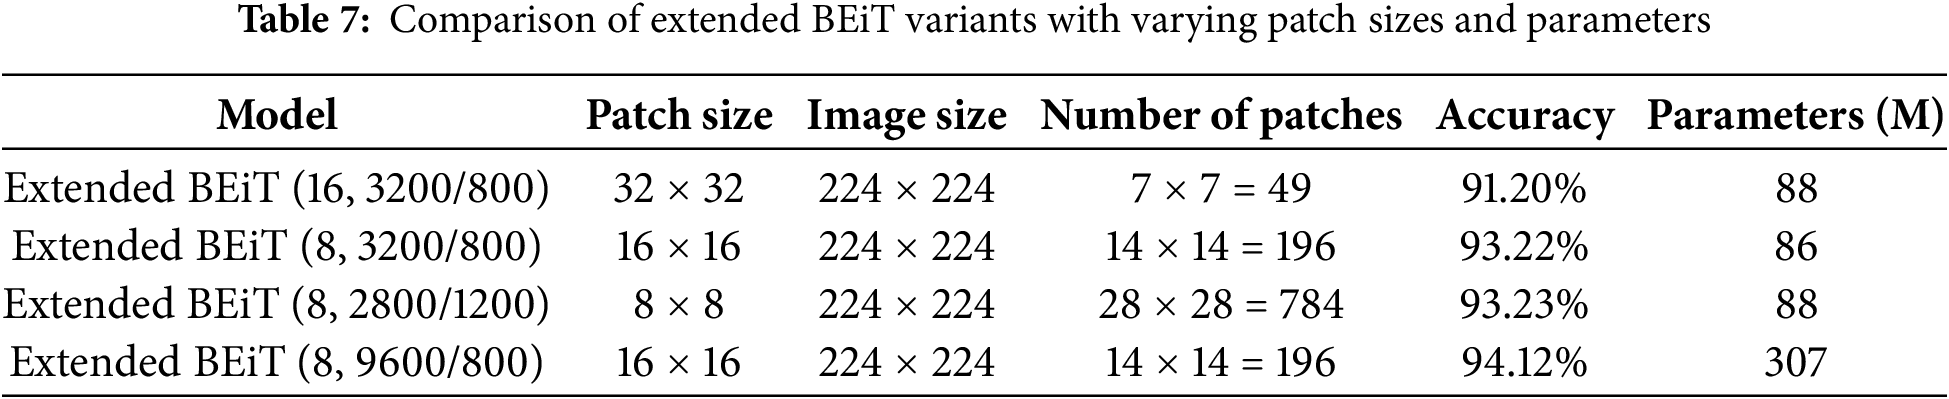
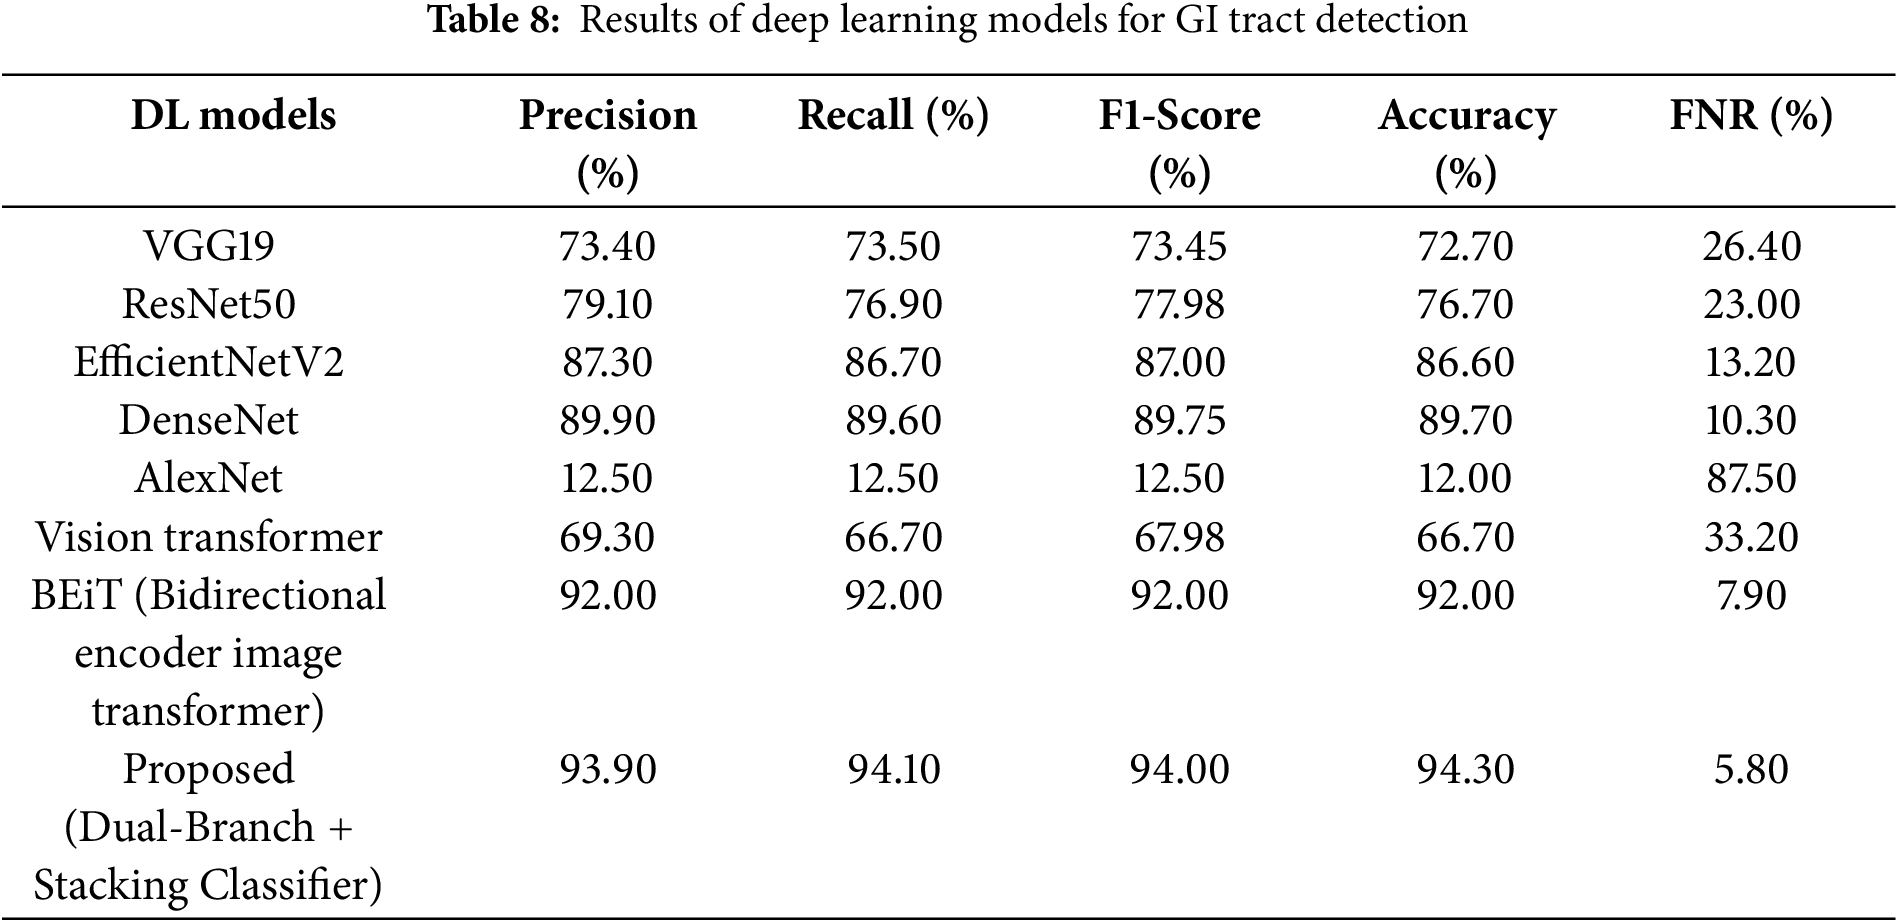
Table 8 presents a comparative analysis of some deep learning models, which show that the proposed model achieved better results compared to all the other models in terms of different performance measures. In the compared models, BEiT showed high effectiveness with the accuracy of 92,07% and FNR, equal to 7,94%; DenseNet with the accuracy of 89,75% and EfficientNetV2 with the accuracy of 86,62%. On the other hand, the models such as AlexNet and Vision Transformer are less accurate and showed the poorest performance in terms of the metrics accuracy of 12.01% and FNR of 87.50% for AlexNet, highlighting the effectiveness of the proposed model in addressing the classification problem.
A heatmap for the comparison results of different deep learning models is presented in Fig. 8. All the DL models are represented in the y-axis and the evaluation metrics on the x-axis, where the colour change from blue to red shows the increase in performance scores.
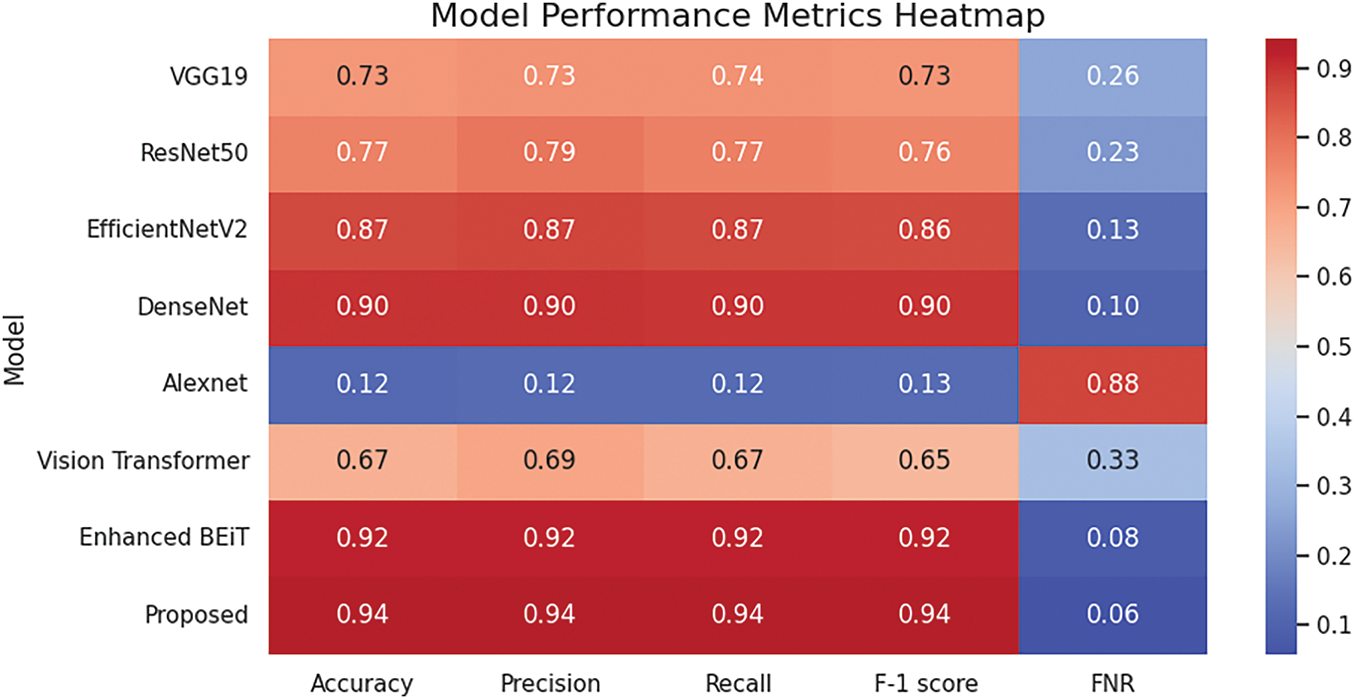
Figure 8: Heatmap of performance metrics across different DL models
Ablation study of the proposed model with its results is presented in Table 9. This table starts from a baseline model CNN model that utilizes a simple EfficientNet-B5 and then integrates step by step with other components. At the first step, the CNN model is combined with a transformer branch, then attention-based feature fusion, and at the end, the effect of class entropy optimization is highlighted. The final model employs stacking classification that combines outputs from base models. The accuracy demonstrates the effectiveness of each component.
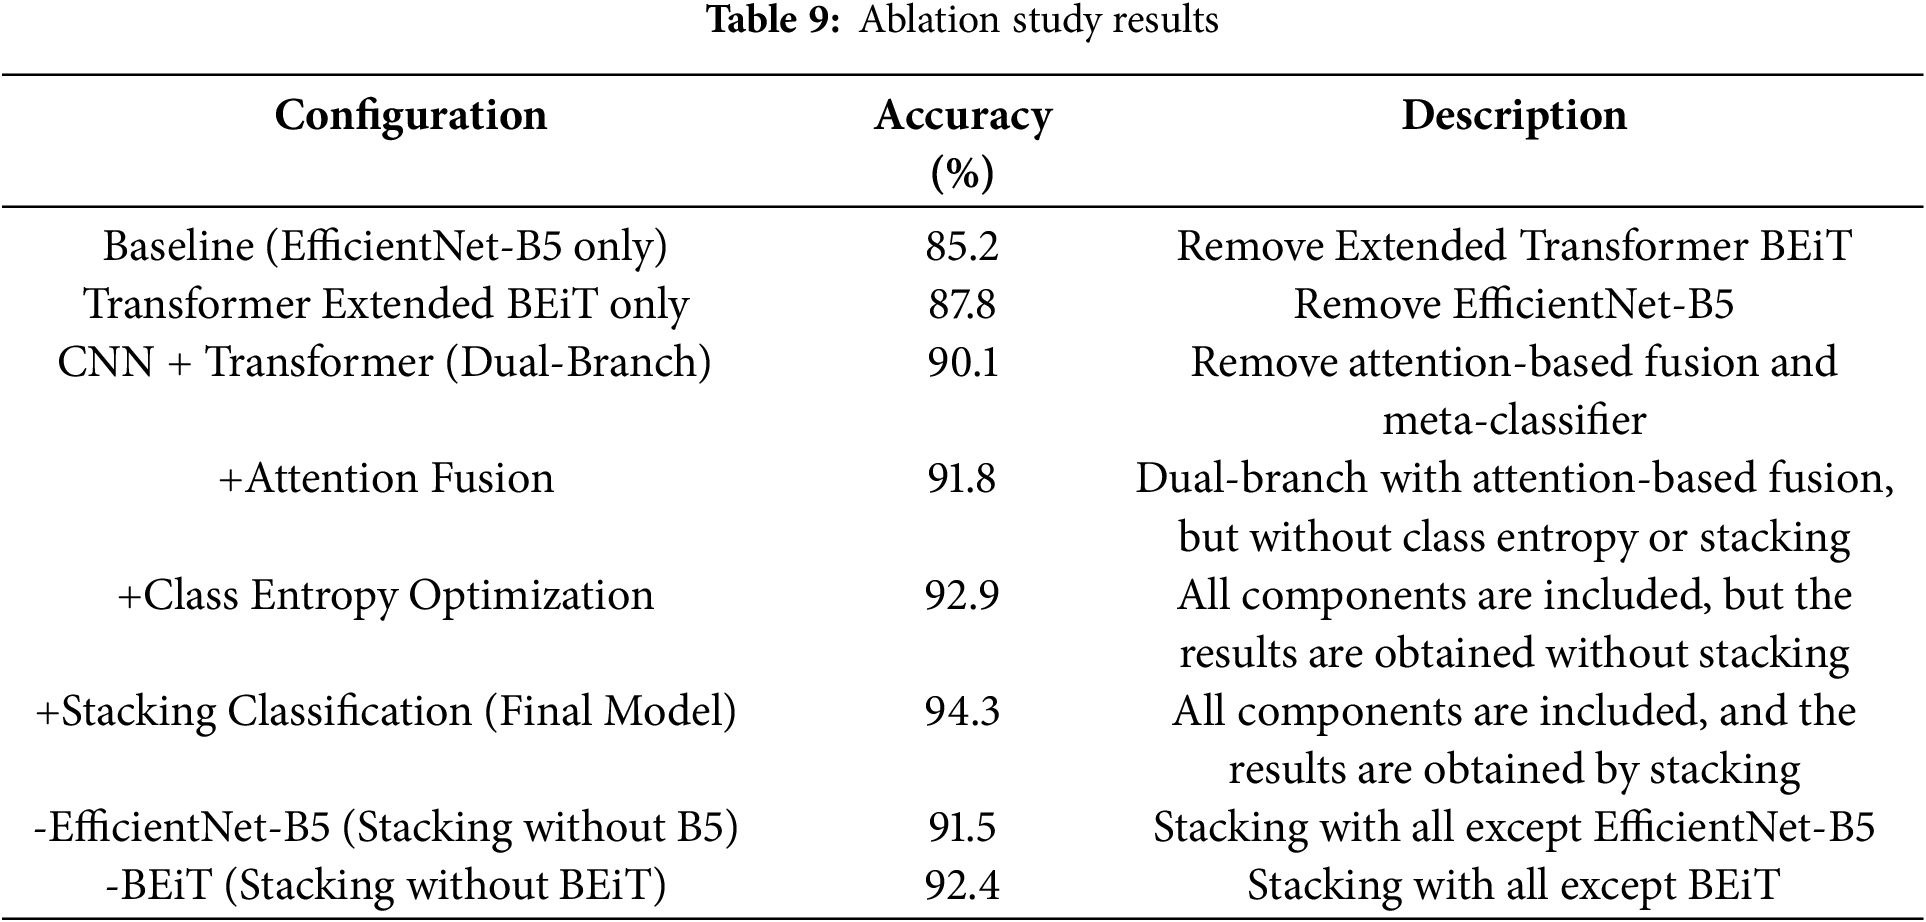
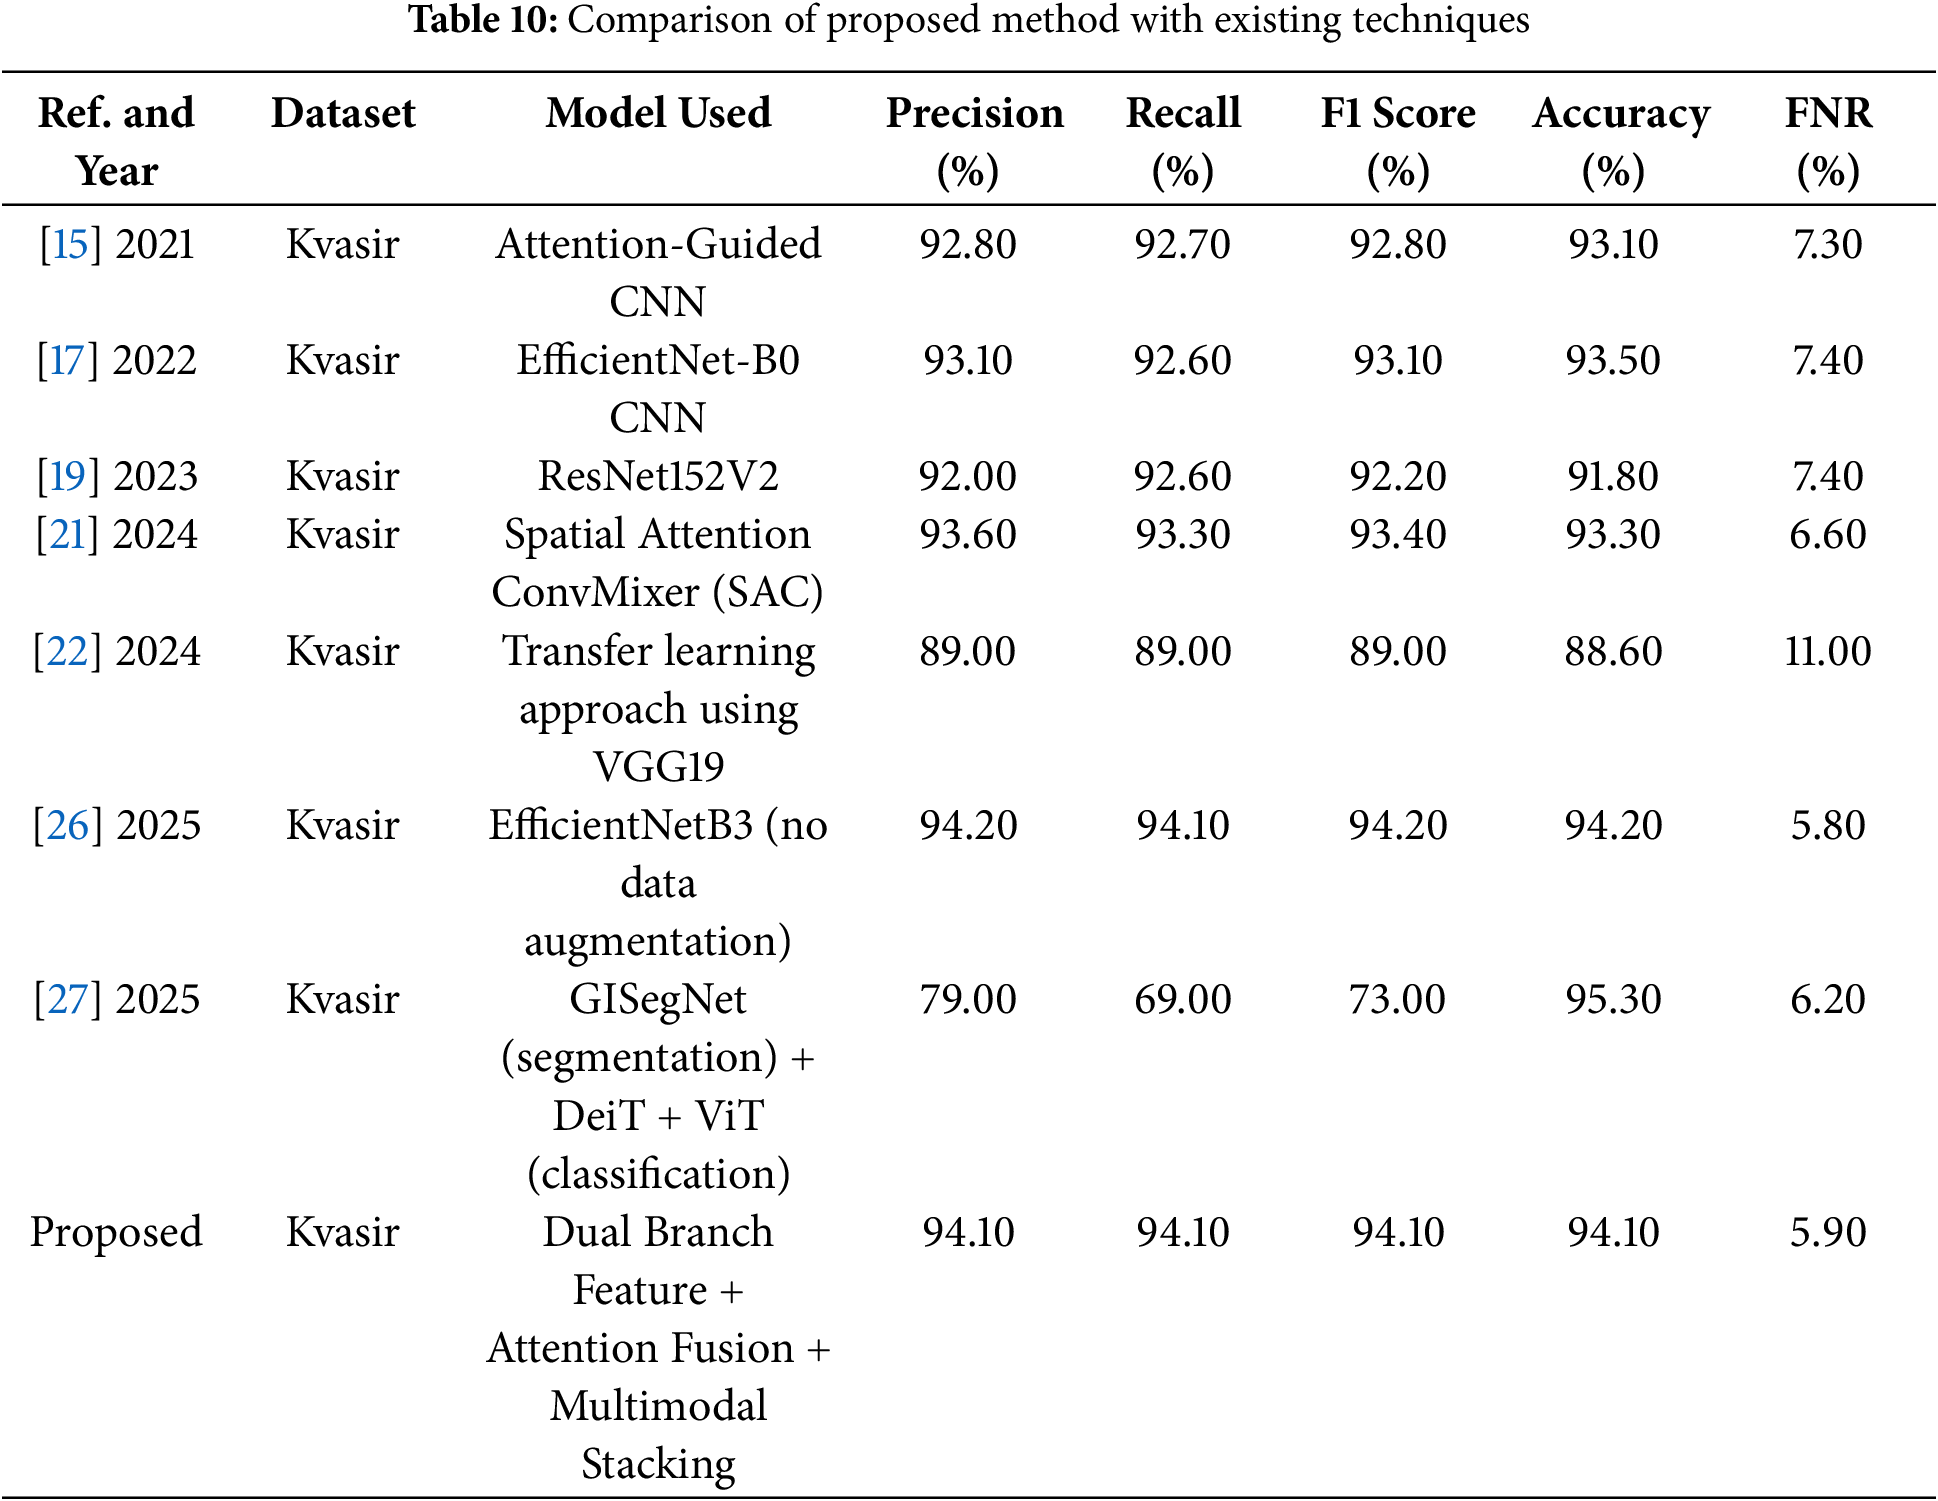
Table 10 shows the comparison of the proposed model with past work on the Kvasir dataset. The performance of the proposed model outperforms the models reported in the existing literature and significantly surpasses benchmark techniques.
The proposed framework addresses important challenges in endoscopic image analysis. It offers great benefits for real clinical practices of diagnosing GI diseases by reducing misclassification and false negative cases. This helps medical professionals to automate the identification of pathological findings and reduce the possibility of critical conditions being overlooked. In practice, it facilitates quicker diagnoses, more efficient allocation of resources and better patient care. Moreover, the flexible nature of the framework enables adaptation to other medical imaging analysis and thus can be usefully applicable to a wide range of healthcare domains.
This research aimed to address a critical aspect of healthcare diagnostics by minimizing delayed diagnosis and treatment using reduced false negative rates for the analysis of gastrointestinal tract images. Endoscopic analysis is crucial for diagnosing various gastrointestinal disorders, and automating this process via multimodal stacking can significantly enhance the efficiency and accuracy of these assessments. The proposed research technique utilised various computer vision techniques to reduce misclassifications in gastrointestinal visuals. The proposed technique represents a significant improvement in the precision of early-stage diagnosis of gastrointestinal (GI) tract disorders. The model comprises a modified BEiT architecture that improves feature representation via mean pooling of hidden states. A classification layer follows to provide accurate predictions, hence enhancing diagnostic reliability. These features are then passed to a stacking ensemble, which combines the strengths of multiple base models to boost overall performance. This method achieved an outstanding 94.12% classification accuracy and recall, outperforming current benchmarks. Additionally, it significantly lowered the false negative rate to just 5.85%, demonstrating its ability to reduce misdiagnosis and improve reliability. The proposed model offers a meaningful clinical impact, particularly in the early detection of GI diseases, and can act as a practical assistive tool for healthcare professionals in everyday clinical practice. It is also effective with smaller datasets, making it suitable for use even in resource-limited settings. However, the model has used the Kvasir dataset, which has balanced class distribution and size limitations. Therefore, in the future, external validation studies with more diverse and larger datasets are needed.
Acknowledgement: The authors extend their appreciation to Prince Sattam bin Abdulaziz University for funding for funding this research work through the project number (PSAU/2024/01/30782).
Funding Statement: The authors extend their appreciation to Prince Sattam bin Abdulaziz University for funding for funding this research work through the project number (PSAU/2024/01/30782).
Author Contributions: The authors confirm contribution to the paper as follows: Study conception and design, Jamal Hussain Shah and Samia Riaz; experiment design, Sadia Fatima; methodology, Fadl Dahan and Mohammed Aloqaily; software designing, Refan Almohamedh and Mohammed Aloqaily; data collection, Sadia Fatima; analysis and interpretation of results, Jamal Hussain Shah and Fadl Dahan; draft manuscript preparation, Sadia Fatima and Jamal Hussain Shah; writing—review & editing, Refan Almohamedh; proof reading, Fadl Dahan; supervision, Samia Riaz. All authors reviewed the results and approved the final version of the manuscript.
Availability of Data and Materials: The original contributions presented in the study are included in the article, further inquiries can be directed to the corresponding author.
Ethics Approval: Not applicable.
Conflicts of Interest: The authors declare no conflicts of interest to report regarding the present study.
References
1. Pillai R, Sharma N, Gupta R. Detection & classification of abnormalities in GI tract through MobileNetV3 transfer learning model. In: Proceedings of the 2023 14th International Conference on Computing Communication and Networking Technologies (ICCCNT); 2023 July 6–8; Delhi, India. p. 1–6. [Google Scholar]
2. Lafraxo S, El Ansari M. Gastronet: abnormalities recognition in gastrointestinal tract through endoscopic imagery using deep learning techniques. In: Proceedings of the 2020 8th International Conference on Wireless Networks and Mobile Communications (WINCOM); 2020 Oct 27–29; Reims, France. p. 1–5. [Google Scholar]
3. Talebi A, Celis-Morales CA, Borumandnia N, Abbasi S, Pourhoseingholi MA, Akbari A, et al. Predicting metastasis in gastric cancer patients: machine learning-based approaches. Sci Rep. 2023;13(1):4163. doi:10.1038/s41598-023-31272-w. [Google Scholar] [PubMed] [CrossRef]
4. Ionescu AG, Glodeanu AD, Ionescu M, Zaharie SI, Ciurea AM, Golli AL, et al. Clinical impact of wireless capsule endoscopy for small bowel investigation. Exp Ther Med. 2022;23(4):262. [Google Scholar] [PubMed]
5. Gamage C, Wijesinghe I, Chitraranjan C, Perera I. GI-Net: anomalies classification in gastrointestinal tract through endoscopic imagery with deep learning. In: Proceedings of the 2019 Moratuwa Engineering Research Conference (MERCon); 2019 Jul 3–5; Moratuwa, Sri Lanka. p. 66–71. [Google Scholar]
6. Nigatu AM, Yilma TM, Gezie LD, Gebrewold Y, Gullslett MK, Mengiste SA, et al. Medical imaging consultation practices and challenges at public hospitals in the Amhara regional state, Northwest Ethiopia: a descriptive phenomenological study. BMC Health Serv Res. 2023;23(1):787. doi:10.1186/s12913-023-09652-9. [Google Scholar] [PubMed] [CrossRef]
7. Okagawa Y, Abe S, Yamada M, Oda I, Saito Y. Artificial intelligence in endoscopy. Dig Dis Sci. 2022;67(5):1553–72. doi:10.1007/s10620-021-07086-z. [Google Scholar] [PubMed] [CrossRef]
8. Çakmak Y, Maman A. Deep learning for early diagnosis of lung cancer. Comput Syst Artif Intell. 2025;1(1):20–5. [Google Scholar]
9. Arkin E, Yadikar N, Xu X, Aysa A, Ubul K. A survey: object detection methods from CNN to transformer. Multimed Tools Appl. 2023;82(14):21353–83. doi:10.1007/s11042-022-13801-3. [Google Scholar] [CrossRef]
10. Hoffman A, Manner H, Rey JW, Kiesslich R. A guide to multimodal endoscopy imaging for gastrointestinal malignancy—an early indicator. Nat Rev Gastroenterol Hepatol. 2017;14(7):421–34. doi:10.1038/nrgastro.2017.46. [Google Scholar] [PubMed] [CrossRef]
11. Mir AN, Rizvi DR, Ahmad MR. Enhancing histopathological image analysis: an explainable vision transformer approach with comprehensive interpretation methods and evaluation of explanation quality. Eng Appl Artif Intell. 2025;149:110519. doi:10.1016/j.engappai.2025.110519. [Google Scholar] [CrossRef]
12. Saito H, Aoki T, Aoyama K, Kato Y, Tsuboi A, Yamada A, et al. Automatic detection and classification of protruding lesions in wireless capsule endoscopy images based on a deep convolutional neural network. Gastrointest Endosc. 2020;92(1):144–51. doi:10.1016/j.gie.2020.01.054. [Google Scholar] [PubMed] [CrossRef]
13. Cornelissen S, van der Putten JA, Boers T, Jukema JB, Fockens KN, Bergman J, et al. Evaluating self-supervised learning methods for downstream classification of neoplasia in barrett’s esophagus. In: Proceedings of the 2021 IEEE International Conference on Image Processing (ICIP); 2021 Sep 19–22; Anchorage, AK, USA. p. 66–70. [Google Scholar]
14. Lonseko ZM, Adjei PE, Du W, Luo C, Hu D, Zhu L, et al. Gastrointestinal disease classification in endoscopic images using attention-guided convolutional neural networks. Appl Sci. 2021;11(23):11136. doi:10.3390/app112311136. [Google Scholar] [CrossRef]
15. Bai L, Wang L, Chen T, Zhao Y, Ren H. Transformer-based disease identification for small-scale imbalanced capsule endoscopy dataset. Electronics. 2022;11(17):2747. doi:10.3390/electronics11172747. [Google Scholar] [CrossRef]
16. UÇan M, Kaya B, Kaya M. Multi-class gastrointestinal images classification using EfficientNet-B0 CNN model. In: Proceedings of the 2022 International Conference on Data Analytics for Business and Industry (ICDABI); 2022 Oct 25–26; Sakhir, Bahrain. p. 1–5. [Google Scholar]
17. Su X, Liu Q, Gao X, Ma L. Evaluation of deep learning methods for early gastric cancer detection using gastroscopic images. Technol Health Care. 2023;31(1 Suppl):313–22. doi:10.3233/thc-236027. [Google Scholar] [PubMed] [CrossRef]
18. Bhardwaj P, Kumar S, Kumar Y. A comprehensive analysis of deep learning-based approaches for the prediction of gastrointestinal diseases using multi-class endoscopy images. Arch Comput Methods Eng. 2023;30(7):4499–516. doi:10.1007/s11831-023-09951-8. [Google Scholar] [CrossRef]
19. Li L, Yang L, Zhang B, Yan G, Bao Y, Zhu R, et al. Automated detection of small bowel lesions based on capsule endoscopy using deep learning algorithm. Clin Res Hepatol Gastroenterol. 2024;48(5):102334. doi:10.1016/j.clinre.2024.102334. [Google Scholar] [PubMed] [CrossRef]
20. Demirbaş AA, Üzen H, Fırat H. Spatial-attention ConvMixer architecture for classification and detection of gastrointestinal diseases using the Kvasir dataset. Health Inf Sci Syst. 2024;12(1):32. doi:10.1007/s13755-024-00290-x. [Google Scholar] [PubMed] [CrossRef]
21. Korkmaz İ, Soygazi F. Gastrointestinal image classification using deep learning architectures via transfer learning. In: Proceedings of the 2024 Medical Technologies Congress (TIPTEKNO); 2024 Oct 10–12; Bodrum, Turkey. p. 1–4. [Google Scholar]
22. Sunthornwetchapong P, Hombubpha K, Tiankanon K, Aniwan S, Jakkrawankul P, Nupairoj N, et al. Real-time multi-task deep learning model for polyp detection, characterization, and size estimation. IEEE Access. 2025;13(4):8469–81. doi:10.1109/access.2025.3527720. [Google Scholar] [CrossRef]
23. Kour A, Yadav VK, Maheshwari V, Prashar D. A review on image processing. Int J Electron Commun Comput Eng. 2013;4(1):270–5. [Google Scholar]
24. Ali H, Sharif M, Yasmin M, Rehmani MH, Riaz F. A survey of feature extraction and fusion of deep learning for detection of abnormalities in video endoscopy of gastrointestinal-tract. Artif Intell Rev. 2020;53(4):2635–707. doi:10.1007/s10462-019-09743-2. [Google Scholar] [CrossRef]
25. Pogorelov K, Randel KR, Griwodz C, Eskeland SL, de Lange T, Johansen D, et al. Kvasir: a multi-class image dataset for computer aided gastrointestinal disease detection. In: Proceedings of the 8th ACM on Multimedia Systems Conference; 2017 Jun 20–23; Taipei, Taiwan. p. 164–9. [Google Scholar]
26. Kamble A, Karandikar A, Patil M, Jain R, Agrawal R. Enhanced multi-class classification of gastrointestinal endoscopic images with interpretable deep learning model. arXiv:250300780. 2025. [Google Scholar]
27. Şener A, Ergen B. Automatic detection of gastrointestinal system abnormalities using deep learning-based segmentation and classification methods. Health Inf Sci Syst. 2025;13(1):1–25. doi:10.1007/s13755-025-00354-6. [Google Scholar] [PubMed] [CrossRef]
Cite This Article
 Copyright © 2025 The Author(s). Published by Tech Science Press.
This work is licensed under a Creative Commons Attribution 4.0 International License , which permits unrestricted use, distribution, and reproduction in any medium, provided the original work is properly cited.
 Downloads
 Citation Tools