
 Submit a Paper
 Propose a Special lssue
 Open Access
ARTICLE

Optimal Location, Sizing and Technology Selection of STATCOM for Power Loss Minimization and Voltage Profile Using Multiple Optimization Methods
1 Department of Electrical Engineering, Higher National School of Engineering of Tunis (ENSIT), University of Tunis, Tunis, 1008, Tunisia
2 Department of Electrical Engineering, Laboratory of Automatic, Signal and Image Processing (LARATSI), National School of Engineers of Monastir (ENIM), University of Monastir, Monastir, 5019, Tunisia
3 Department of Electrical Engineering, Higher Institute of Applied Science and Technology of Kairouan (ISSAT Kairouan), University of Kairouan, Kairouan, 3100, Tunisia
4 Department of Electrical Engineering, Laboratory of Control and Energy Management, National Engineering School of Sfax, University of Sfax, Sfax, 3038, Tunisia
5 Faculty of Computers and Information Technology, University of Tabuk, Tabuk, 71491, Saudi Arabia
6 Applied College, University of Tabuk, Tabuk, 71491, Saudi Arabia
* Corresponding Author: Okba Taouali. Email:
Computer Modeling in Engineering & Sciences 2025, 145(1), 571-596. https://doi.org/10.32604/cmes.2025.071642
Received 09 August 2025; Accepted 09 October 2025; Issue published 30 October 2025
 View Full Text
 Download PDF
Abstract
Several optimization methods, such as Particle Swarm Optimization (PSO) and Genetic Algorithm (GA), are used to select the most suitable Static Synchronous Compensator (STATCOM) technology for the optimal operation of the power system, as well as to determine its optimal location and size to minimize power losses. An IEEE 14 bus system, integrating three wind turbines based on Squirrel Cage Induction Generators (SCIGs), is used to test the applicability of the proposed algorithms. The results demonstrate that these algorithms are capable of selecting the most appropriate technology while optimally sizing and locating the STATCOM to reduce power losses in the network. Specifically, the optimized STATCOM allocation using the Particle Swarm Optimization (PSO) achieves a 7.44% reduction in total active power loss compared to the optimized allocation using the Genetic Algorithm (GA). Furthermore, the voltage magnitudes at buses 4, 9, and 10, which initially had exceeded the upper voltage limit, were reduced and brought within acceptable ranges, thereby improving the system’s overall voltage profile. Consequently, the optimal allocation of the STATCOM significantly enhances the efficiency and performance of the power network.Keywords
Voltage stability is a major issue in electrical systems because voltage is an essential factor for the optimal functioning of electrical devices. Voltage drops can cause serious problems or damage to lighting fixtures. To avoid disruption, the effective organization of these efforts is essential. The increasing demand for electricity, coupled with growing environmental concerns, has led to the gradual integration of renewable energy into electricity distribution networks. Managing voltages can be complex due to their fluctuations and weather conditions. It is therefore crucial to maintain constant monitoring of the voltage profile and use regulation methods to ensure a stable and reliable electricity supply. In addition, increasing energy conservation initiatives and switching to more environmentally friendly energy sources aim to reduce reliance on fossil fuels while minimizing greenhouse gas emissions. However, this transformation also requires more advanced grid management to efficiently integrate renewable energies, while maintaining voltage stability and meeting increasing needs.
Thus, this context raises the technical and environmental challenges faced by engineers and grid managers in maintaining voltage stability while promoting more sustainable energy production. Natural inexhaustible sources such as water, the sun, the wind, and biomass, especially wood, for example, are the sources of renewable energy. A hybrid energy plant is an embedded energy system that uses two or more renewable energy sources [1]. The voltage profile of the conventional power generation system deteriorates for a number of reasons when the load is increased to satisfy the consumer’s demand [2]. This might be the consequence of the lines is declining power. In order to improve wind power integration and increase overall system performance, power system utilities have given priority to stability issues over power quality issues [3,4]. The primary goal of voltage stability analysis is to forecast the system’s potential fault or point of voltage collapse. Wind power integration may also have an impact on power stability and quality. The system’s power transfer capacity also decreases as a result of increased and varying wind penetration [5]. One way to improve the stability of the voltage of a wind system integrated into a network is to install a Flexible AC Transmission System (FACTS) and choose the best location for it. In general, the FACTS system is a collection of control systems rather than a single high-power controller [6]. It is capable of cooperating with other control systems to regulate several interdependent parameters that affect the transmission system operation, such as the line current, the shunt impedance, the line series impedance, the nodal voltage magnitude, and the angular difference. The FACTS devices can alter the routes that the energy takes when it passes through a power grid is transmission lines by altering the reactance of the transmission lines as well as the bus voltage magnitudes and phase angle. Therefore, requiring that power flows be moved via routes that do not contribute to congestion issues is a good way to successfully eliminate or limit transmission line congestion. It can be difficult to choose the best kind, quantity, location, and dimensions of FACTS devices.
The following sections describe the primary contribution of this current research project. GA and PSO are two methods used in this study to optimally allocate the STATCOM, aiming to reduce active power losses and voltage amplitude variations in order to enhance system performance. An IEEE 14 bus network has been modeled for the simulations.
The paper is subdivided into various sections. The introduction is included in Section 1. Section 2 is dedicated to the review of previously published papers. In Section 3, the voltage stability study is presented. In Section 4, the integration of wind energy is introduced. Section 5 presents the study of STATCOM. In Section 6, the problem formulation and optimization approaches using PSO and GA is depicted. Section 7 shows the results of the experimental analysis. Finally, the conclusion of the paper is addressed in Section 8.
According to the relevant literature on FACTS devices, considered in the energy market, several studies have confirmed the impact of FACTS devices on optimizing the operation of power systems. However, these works have not yet focused on developing algorithms to determine the optimal number and categories of these devices. In other words, they only provide the analysis that has been done with these devices and have not done anything to help with the placement strategies for a specific number of FACTS devices. The following are some published studies on FACTS devices.
Magadum et al. [7] addressed power quality problems in power lines by utilizing high-speed operating power electronic equipment. By compensating for the network’s reactive power demand with STATCOM, the author has reduced overall power loss in the power line between 20%–35% and enhanced the network’s voltage profile. The author also compared the outcomes of losses with regard to STATCOM placement in this article and displayed the effects of placing STATCOM at various network nodes for the ideal voltage magnitude.
The application of STATCOM for transmission line reactive power dispatch optimization has been investigated by Bhongade et al. [8]. The most appropriate combination of management parameters for a transmission line to lower losses and enhance the network voltage profile is determined by a complex factor called optimal reactive power dispatch. For this, researchers have placed STATCOM on the network using the collapse prediction index approach and the BAT algorithm. There, the authors have also contrasted the outcomes of the PSO algorithm and the BAT method. According to the modeling results in the article, the BAT algorithm with STATCOM suggested by the authors produces better results than the PSO method.
Jaiswal et al. [9] suggested that a shunt compensator, the STATCOM, be integrated into the system, resulting in a significant enhancement of the voltage profile. Identifying the optimal location with the highest voltage stability within the grid ensures a well-maintained voltage profile, thereby improving voltage security.
Chirani et al. [10] proved the efficiency of FACTS devices, such as STATCOM, in enhancing power grid performance by minimizing losses and maximizing power flow. To find the best location and capacity for a STATCOM in IEEE 14 and IEEE 30 bus systems, a method based on the Grey Wolf Optimizer (GWO) algorithm was put forth. MATLAB/Simulink was used for all simulations.
In order to improve the power system’s performance, STATCOM allocation with energy storage was presented and optimized by Ghahremani et al. [11]. To do this, the authors have employed a genetic algorithm to identify and optimize the STATCOM power system’s characteristics in conjunction with its energy storage capacity. In order to increase network power transmission while decreasing transmission line losses, the study suggested a novel optimization method. The effectiveness of the innovative optimization approach in identifying the best device locations across a range of test networks was shown by the simulation results in the article.
Okelola et al. [12] suggested PSO as a technique for efficiently assigning the STATCOM on the power line. The system’s voltage magnitudes have been improved, and the active power losses have been reduced by about 6.90% thanks to the suggested particle swarm optimization algorithm.
To improve grid planning and operation, Zhang et al. [13] have suggested a useful computational tool. They used the Benders decomposition method to assess the transmission line’s capacity in the initial step. To increase the computational efficiency of the first phase, they also employed a parallel calculation method. The transmission line problem has been effectively resolved by this approach. Both the convergence speed and the asynchronous grid’s transmission capacity have increased, demonstrating that STATCOM has a beneficial impact on the asynchronous grid transmission capacity.
The goal of Salbi et al. [14] was to improve voltage variations, to reduce apparent power losses, and to maintain voltage within predetermined limits. By reducing the injected or absorbed reactive power while respecting the stability restrictions, the location and size of STATCOMs have been optimized. The best locations and sizes for STATCOMs have been determined via Genetic Algorithm optimization. After testing the technique on the IEEE 14 bus network, it was implemented in various seasonal load situations on the INSHVG network (400 kV, Iraq).
Oyiogu et al. [15] provided a comparative analysis and review of FACTS devices, including the Static Var Compensator (SVC), the Thyristor Controlled Series Capacitor (TCSC), the Unified Power Flow Controller (UPFC), and STATCOM in enhancing voltage stability and reducing power losses in power system ne works. The performance of these FACTS devices has been evaluated through simulations using NEPLAN Engineering software. The results demonstrated that UPFC achieved the highest voltage stability and the most significant reduction in power losses. STATCOM, SVC, and TCSC also contributed to improving voltage stability and loss reduction, with STATCOM performing better than SVC and TCSC.
Voltage stability refers to the ability of the electrical device to maintain constant acceptable voltages on each bus of the device under normal conditions, following a disturbance [16,17]. Voltage stability can be assessed either online or offline, but offline analysis is generally preferred because of its lower risk [18]. Normally, offline voltage stability assessment is performed during the planning process, allowing one to get an early insight into the system load status. Therefore, it is necessary to take proper precautions and use compensation methods to avoid such accidents or many unwanted errors in the system. Several major malfunctions caused by power system instability have been analyzed so far, highlighting the significance of these phenomena [19,20]. Various types of voltage stability, their classification, and transient stability have been studied to limit and design the voltage instability problem [21,22].
In order to examine the dynamic response of the system, the voltage stability analysis is based on state-space modeling, obtained by linearization around the operating equilibrium point. The general model is presented in the form:
where A is the system state matrix, describing the system’s own dynamics; B designates the input matrix, which depends on disturbances to the internal states of the system; μ is the input vector, including external disturbances or control actions applied to the network such as load variations or adjustments of compensation devices;
The observed electrical quantities are represented in the output vector y, defined as:
where C is the output matrix, such as the measured voltages or powers; D designates the control matrix, which translates the direct influence of inputs on outputs. The choice of outputs is essential to ensure that the observed quantities allow instability signals to be identified and appropriate corrective actions to be put in place.
The system’s stability is then examined using the eigenvalues of matrix A, which are found by solving:
With A designates the state matrix; I is the identity matrix; λ denotes the eigenvalue.
System eigenvalues are determined by solving this equation, if they exhibit negative real parts, then the system is stable; otherwise, it denotes the occurrence of voltage instability.
The incorporation of wind energy causes a change in the voltage profile of the system [23]. The Power System Analysis Toolbox (PSAT) simulink library includes the wind system, featuring various configurations of grid-connected induction generators (IGs). The constant increase in wind energy penetration leads to voltage instability in the power grid, due to the considerable range of power fluctuations from wind farms [24]. An increase in wind energy penetration could also harm the security and stability of the electricity system [17].
In this paper, we use wind turbines equipped with a squirrel cage asynchronous generator (SCIG). The parameters of the wind turbine using an SCIG are presented in Table 1. This type of wind turbine is often directly connected to the grid. The generator rotor must be driven by a mechanical system at quasi-constant speed, as shown in Fig. 1.
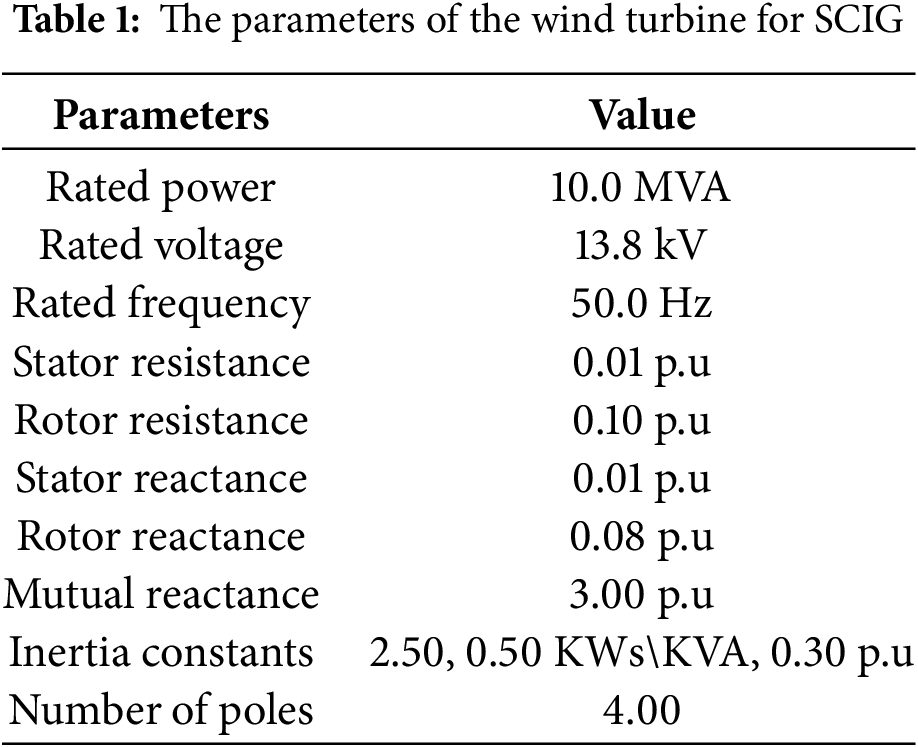
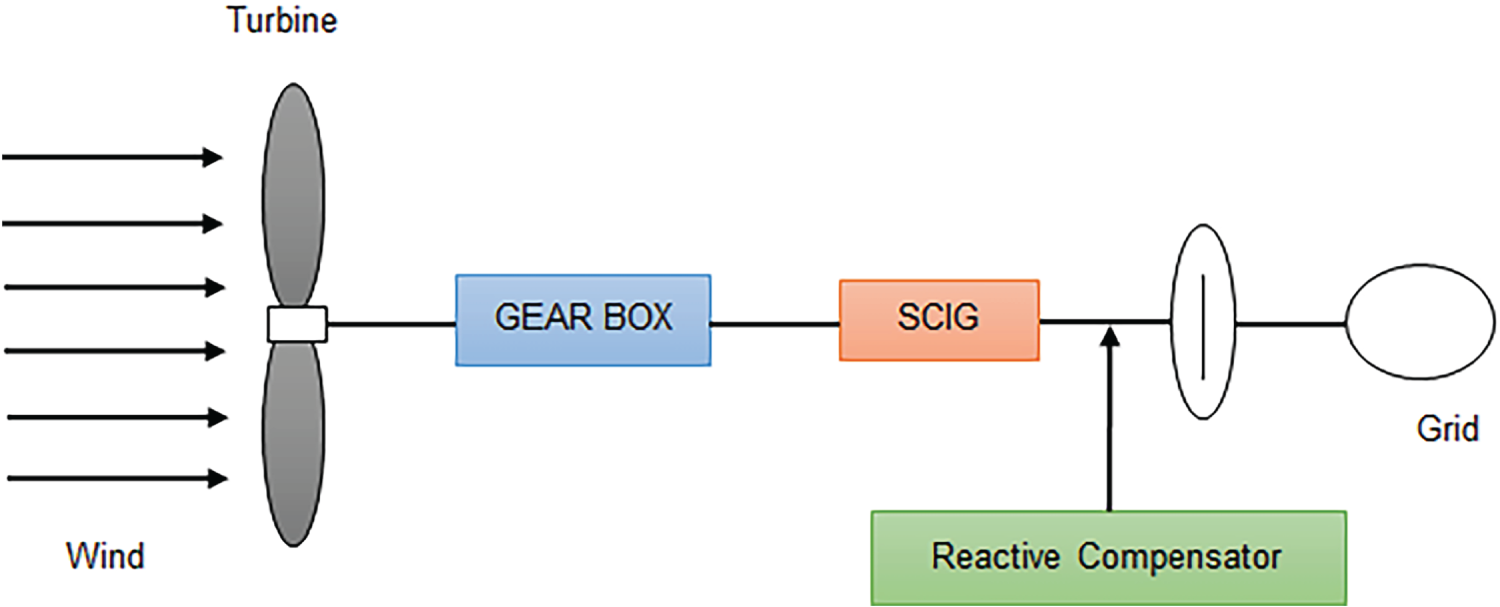
Figure 1: Schematic illustration of a squirrel-cage asynchronous generator
The speed of the inverter must exceed the synchronous speed, denoted Ωs. In this case, the slip will be less than zero, allowing the machine to operate as an autonomous generator when not connected to the grid, or as a non-autonomous generator when it injects current into a grid at a constant frequency and defined voltage amplitude. One way to adjust the quality of the power produced is to control the rotation speed of the rotor [25–27].
The most common design of modern wind turbines is the three-bladed horizontal-axis wind turbine. The output power generated by the turbine blades due to the kinetic energy of the wind can be expressed by the following equations [28–30]:
and
where
In general, the concept of the working of these induction generators can be explained by analyzing them in two axes, the d-q coordinate axis. The mathematical models of the induction generator can be expressed in the following form of equations [31]:
and
Such as
where vdr and vqr designate the d-axis and q-axis rotor voltages, respectively; vqs and vds denote the stator voltages in the d and q axes, respectively; Idr and Iqr are the rotor currents in the d and q axes, respectively; Ids and Iqs denote the current of the rotor in the d and q axes, respectively; ϕdr and ϕqr are the flux of the rotor in the d and q axes, respectively; ϕds and ϕqs represent the flux of the stator in the d and q axes, respectively; d and q are the direct and quadrature axis components, and w corresponds to the angular velocity; lm is the mutual inductance; ls and lr designate the stator and rotor leakage inductance, respectively; lls and llr are the leakage inductances of the stator and rotor in some simplified models, respectively.
The expressions of torque, active power, and reactive power generated by the generator can be derived from the following equations:
where p is the number of generator pole pairs.
5 Static Synchronous Compensator (STATCOM)
The STATCOM is a shunt-connected controller and a type of static VAR generator that employs a switching converter. It can inject or absorb reactive power by changing its switching patterns, without depending on capacitor or inductor banks [6]. It is strategically located within the transmission network to provide reactive power support, which reduces losses and improves the voltage profile.
Fig. 2 shows the basic structure of a STATCOM. The main electronic part is the Voltage Source Converter (VSC). It changes the DC voltage into a series of AC output voltages with specific frequency, magnitude, and phase angle [7,8].
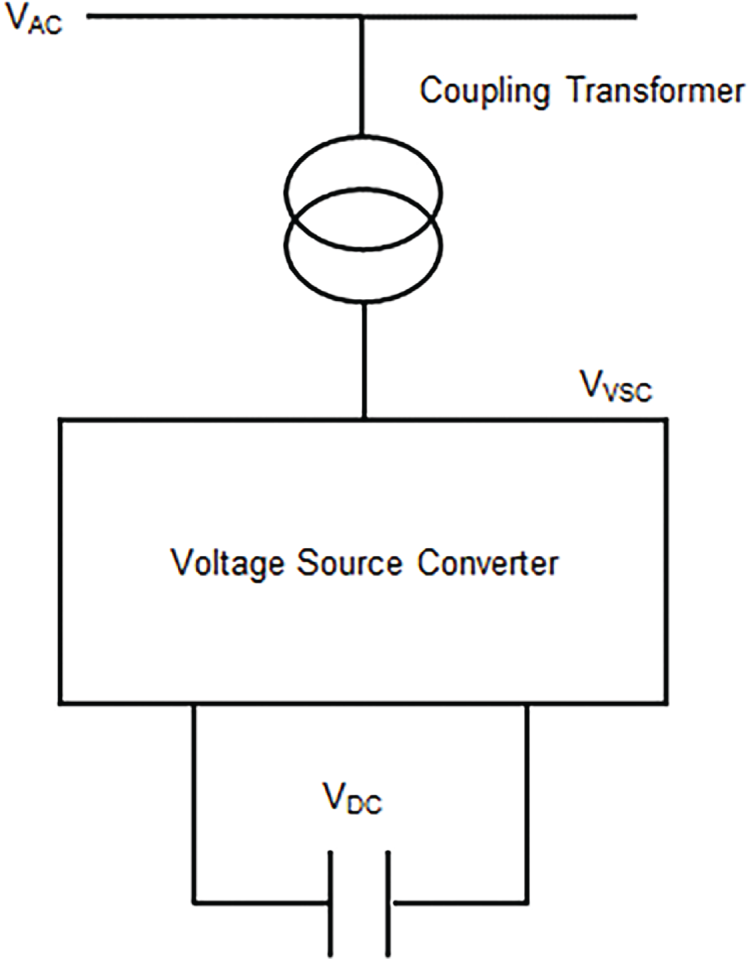
Figure 2: Schematic illustration of a STATCOM of a STATCOM
The reactive power exchange between the converter and the power system is controlled by changing the amplitude of the converter’s three-phase output voltage, VVSC.
When the converter output voltage VVSC exceeds the ac bus voltage VAC, the STATCOM injects reactive power into the network. Conversely, when VVSC < VAC, it absorbs reactive power from the system. Furthermore, when the magnitudes of VVSC and VAC are equal, the STATCOM operates in standby mode. The power flow equations governing the STATCOM are presented as follows [9]:
where Pn and Qn designate the real and reactive powers at bus n; Psh and Qsh represent the real and reactive power at the bus where the STATCOM is connected; Gsh, Bsh, and Ysh denote the conductance, the susceptance, and the admittance of the STATCOM, respectively; Ynm is the admittance of the line between bus n and m; k is the number of buses connected to bus n; Vn and θn are the voltage and phase angle at bus n, respectively; Vsh and θsh designate injected shunt voltage and its corresponding phase angle, respectively.
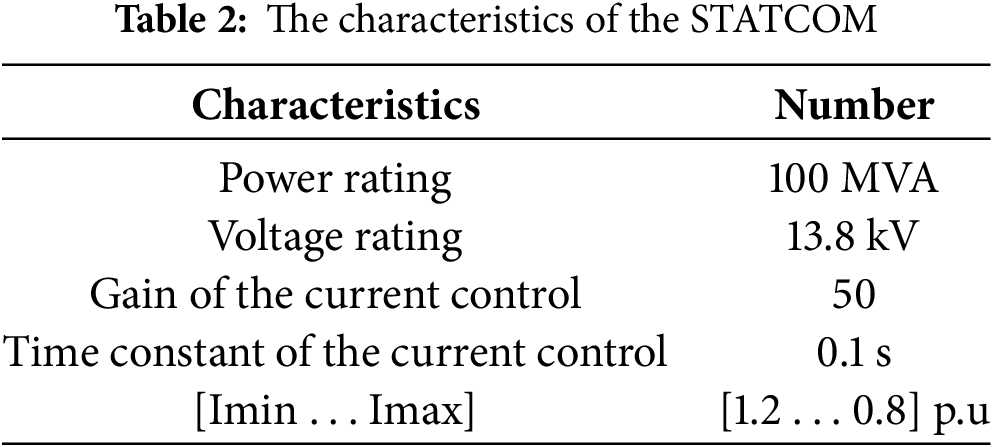
The physical configuration of the STATCOM used in this study is detailed in Table 2. It includes a three-phase voltage source converter connected to the power system through a coupling transformer. The STATCOM is rated at 100 MVA, with an operating voltage of 13.8 kV, and is equipped with a DC capacitor that functions as an energy storage element. The current control loop features a gain of 50 p.u and a time constant of 0.1 s, with an operating current range between 0.8 and 1.2 p.u. This configuration allows the STATCOM to deliver fast and precise reactive power compensation, contributing to voltage stabilization at the connected bus.
6 Problem Formulation and Optimization Approaches Using PSO and GA
This section presents in detail the formulation of the optimization problem for the optimal allocation of STATCOM, as well as an in-depth description of the two optimization algorithms used in this work: PSO and GA.
To improve stability and reduce losses in distribution networks, the integration of a STATCOM must be carefully planned. Its effectiveness depends heavily on its location. Therefore, it is essential to formulate an optimization problem to determine the optimal position of the STATCOM in the network.
Three objective functions are defined in the following expression: Floss that reduces active power losses, Fvoltage that enhances the voltage profile, and Ftotal is a weighted combination of both.
where n and m are the number of buses in the network; rnm designates the resistance of the line between bus n and bus m; inm is the current of the line between bus n and bus m; vmag (n) denotes the voltage magnitude at bus n; vref represents the reference voltage, equal to 1.0 p.u; Nbus is the total number of buses in the network; ωp1 and ωp2 designate the weighting coefficients; Floss, max and Fvoltage, max denote the maximum values of each objective function.
6.1.2 Variables of Optimization
STATCOM Placement: refers to the bus in the power grid where the STATCOM is installed.
STATCOM Capacity: represents the level of reactive power compensation injected by the STATCOM.
The following equation describes the active power transfer in the lines, as well as the constraints related to the maximum permissible current limits.
where Pnm and Inm are the active power and the current of the line between bus n and bus m, respectively; Pnm, max and Inm, max denote the maximum values of the active power and the current of the line, respectively.
The following equation defines the bus voltage profile, as well as the constraints imposed by the STATCOM’s reactive power capability.
where vn is the magnitude voltage at bus n; vmin and vmax designate the minimum and maximum voltage levels, respectively, at 0.95 and 1.05 p.u.; QSTATCOM, n is the reactive power of the STATCOM at bus n; Qmin and Qmax represent the reactive power of the STATCOM, with limits of −100 and +100 Mvar, respectively.
The active and reactive power injected into bus n are written as follows:
where vn and vm designate voltage modules at buses n and m, respectively; θn and θm represent the voltage angles at buses n and m, respectively; Gnm and Bnm are the conductance and susceptance of the line between buses n and m, respectively.
6.2 Optimization Using Particle Swarm Optimization (PSO) Algorithm
Kennedy and Eberhart proposed a PSO algorithm in 1995 [29,31]. This algorithm is part of the field of traffic congestion intelligence. In other words, the algorithm is based on the principle of sharing information and experiences. The principle of the search point in PSO is illustrated in Fig. 3. PSO was developed by simulating basic versions of the enterprise. The system operates as follows [32,33]:
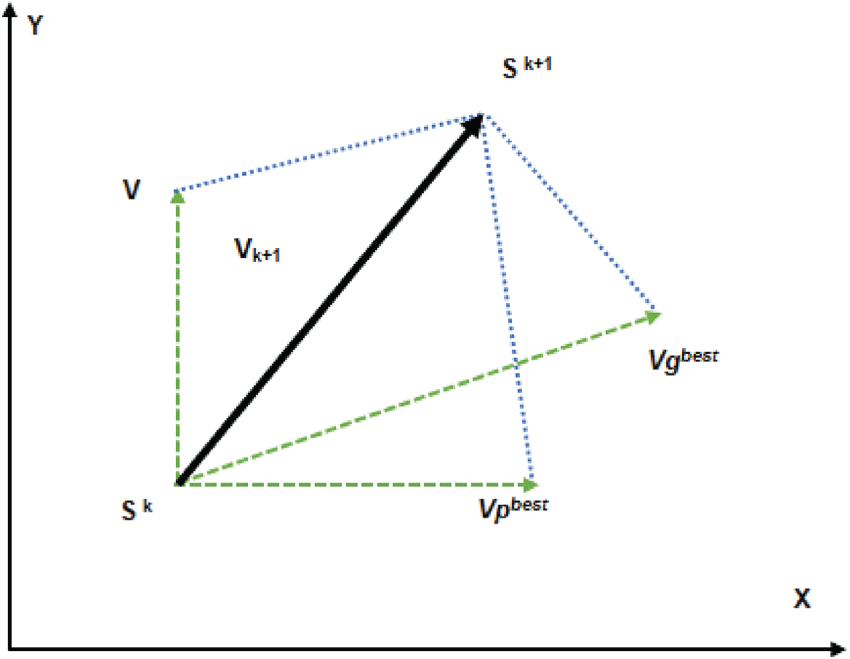
Figure 3: Representation of the search point concept in PSO
• This method is used to study swarms such as schools of fish and flocks of birds.
• It is based on simple ideas. It thus requires little memory, and the computation time is fast.
• It was first developed using continuous variables to solve nonlinear optimization problems.
The PSO was selected for solving this optimization problem in light of its simplicity, soundness, and well-established use for power system applications. It is particularly powerful for solving nonlinear, non-convex problems, such as STATCOM placement and sizing, in the absence of gradient information. Furthermore, PSO yields fast convergence and is easy to implement, and it has shown good efficiency for similar applications in minimizing power losses, enhancing the voltage profile, and increasing the overall system security [34]. These benefits make the PSO an appropriate and effective method for this work.
This change can be expressed using the velocity equation, and the velocity of each agent can be changed using the following equations:
where j = 1, 2, 3, …, n; vj (k + 1) is the velocity updating of particle j; vj (k) denotes the velocity current; c1 and c2 designate the cognitive coefficients;
The inertia weight is calculated using the following expression:
where ωma and ωmi designate the maximum and minimum weights; iter and iterma are the current and maximum iteration, respectively.
The algorithm for the PSO methodology consists of the following steps:
• Step 0: Start
• Step 1: Initialize IEEE 14 bus network data.
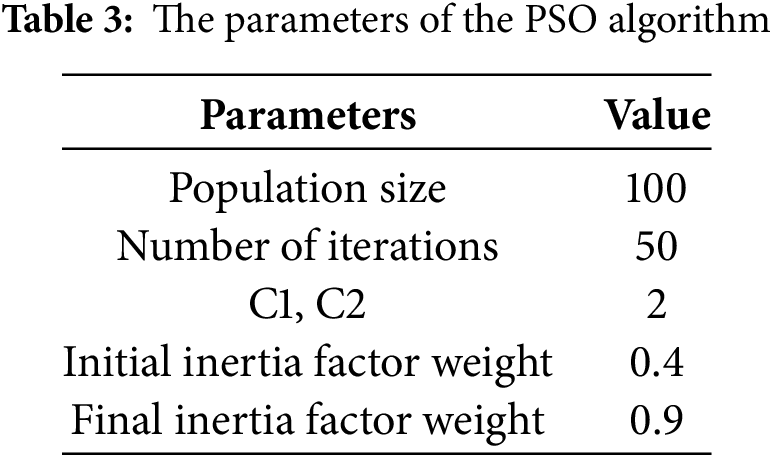
• Step 2: Initialize the parameters of the PSO as shown in Table 3.
• Step 3: Initialize the STATCOM parameters:
Capacity: Qmin≤ QSTATCOM, n ≤ Qmax
Number: 1 STATCOM
• Step 4: Generate an initial population with random positions and velocities.
• Step 5: Calculate losses and fitness function for each particle.
• Step 6: Set iteration = 0.
• Step 7: Identify personal best (pbest) and global best (gbest).
• Step 8: While iteration < Maximum iteration
If yes, proceed to the next step 9.
If not, go directly to step 14.
• Step 9: Calculate inertia weight by Eq. (16).
• Step 10: Update the velocity and position of each particle by Eq. (15).
• Step 11: Calculate new fitness for each particle.
• Step 12: Update pbest and gbest.
• Step 13: Set iteration = iteration + 1.
• Step 14: Display the optimization results, including the optimal location of the STATCOM and the optimal size.
• Step 15: End.
The parameters of the PSO algorithm are presented in Table 3.
Fig. 4 shows the different steps to follow in performing the optimization using the PSO algorithm, in order to determine the optimal location of the STATCOM and reduce transmission line losses.
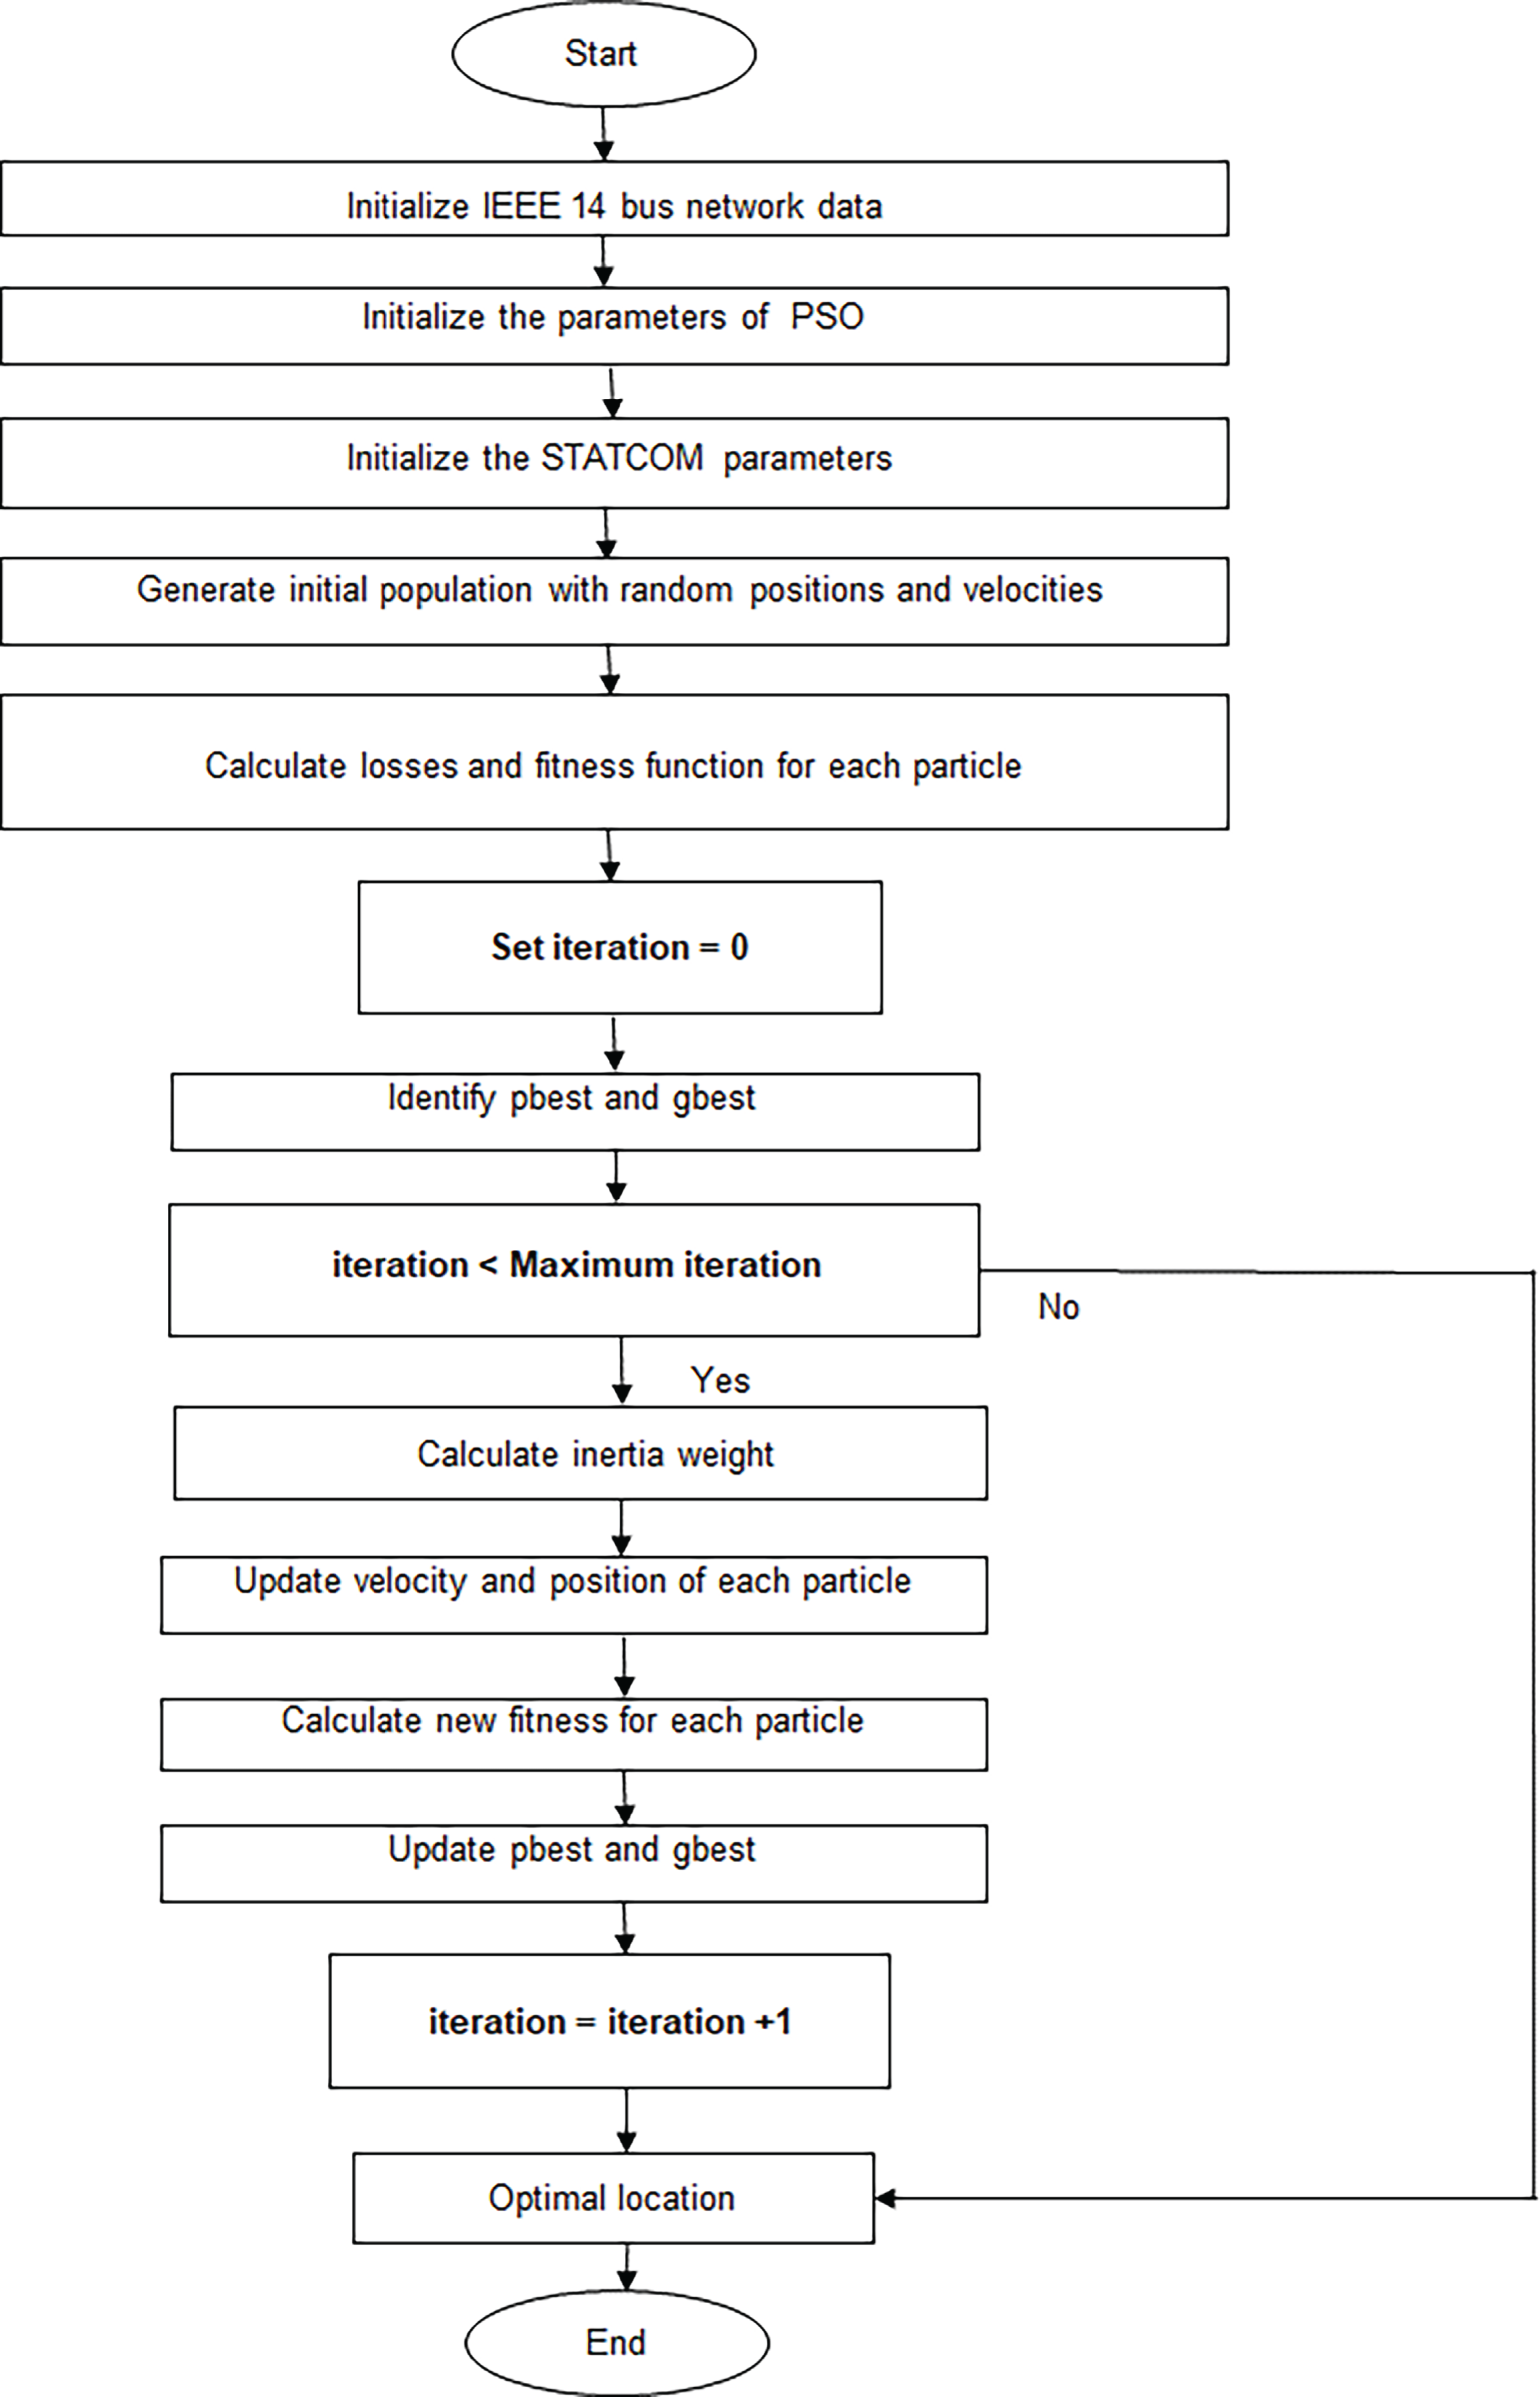
Figure 4: Flowchart of the particle swarm optimization for STATCOM allocation
6.3 Optimization Using Genetic Algorithm (GA)
Genetic Algorithms (GAs) are a fundamental approach to evolutionary computing that was inspired by Darwin’s theory of evolution and the “survival of the fittest.” In natural environments, individuals compete for limited resources, and thus the fittest individuals dominate the less adapted individuals [35–39].
The algorithm for the GA methodology consists of the following steps:
• Step 0: Start
• Step 1: Initialize IEEE 14 bus network data.
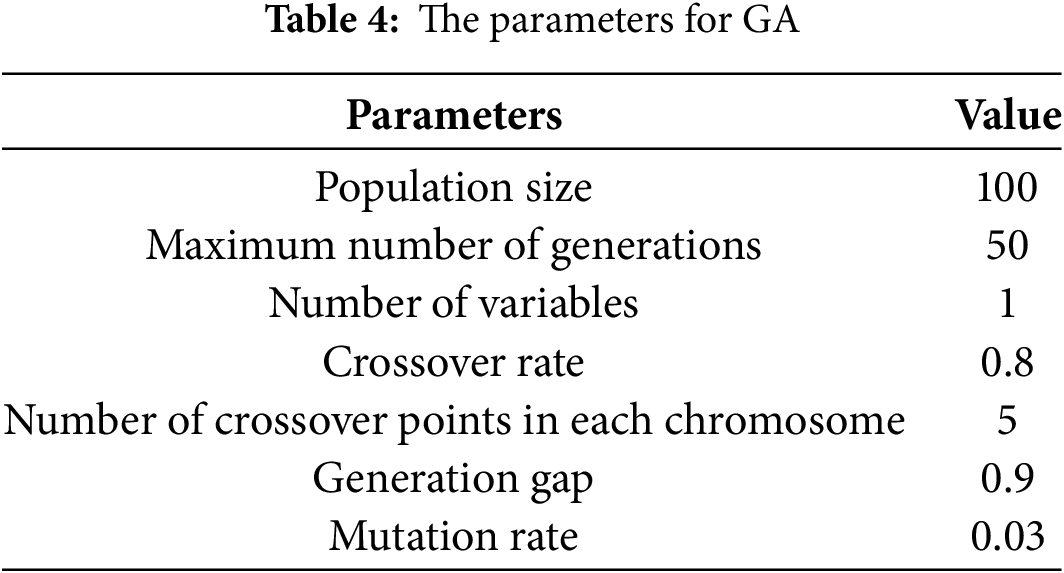
• Step 2: Initialize the parameters of the genetic algorithm as shown in Table 4.
• Step 3: Initialize the STATCOM parameters:
Capacity: Qmin≤ QSTATCOM, n ≤ Qmax
Number: 1 STATCOM
• Step 4: Generate the initial population of potential solutions and evaluate the objective function for each individual. The initial population of solution candidates receives evaluation through a fitness function.
• Step 5: Calculate losses and the fitness function for each chromosome
• Step 6: Set generation = 0.
• Step 7: Rank the chromosomes based on fitness, and apply selection, crossover, and mutation.
• Step 8: Calculate other values for losses and calculate the fitness function for each chromosome.
• Step 9: Perform reinsertion: The new solutions are inserted into the population for the next generation.
• Step 10: Objective function test:
If the objective condition is reached, proceed to the next step.
Otherwise, return to step 8 to continue the iterations.
• Step 11: Set generation = generation + 1.
• Step 12: Set generation = Maximum Generation
If yes, display the best chromosome.
If not, return to step 8 to continue optimization.
• Step 13: Optimal location and Size of the STATCOM.
• Step 14: End.
The parameters of the GA algorithm are presented in Table 4.
Fig. 5 shows the detailed description of the different steps in flowchart form:
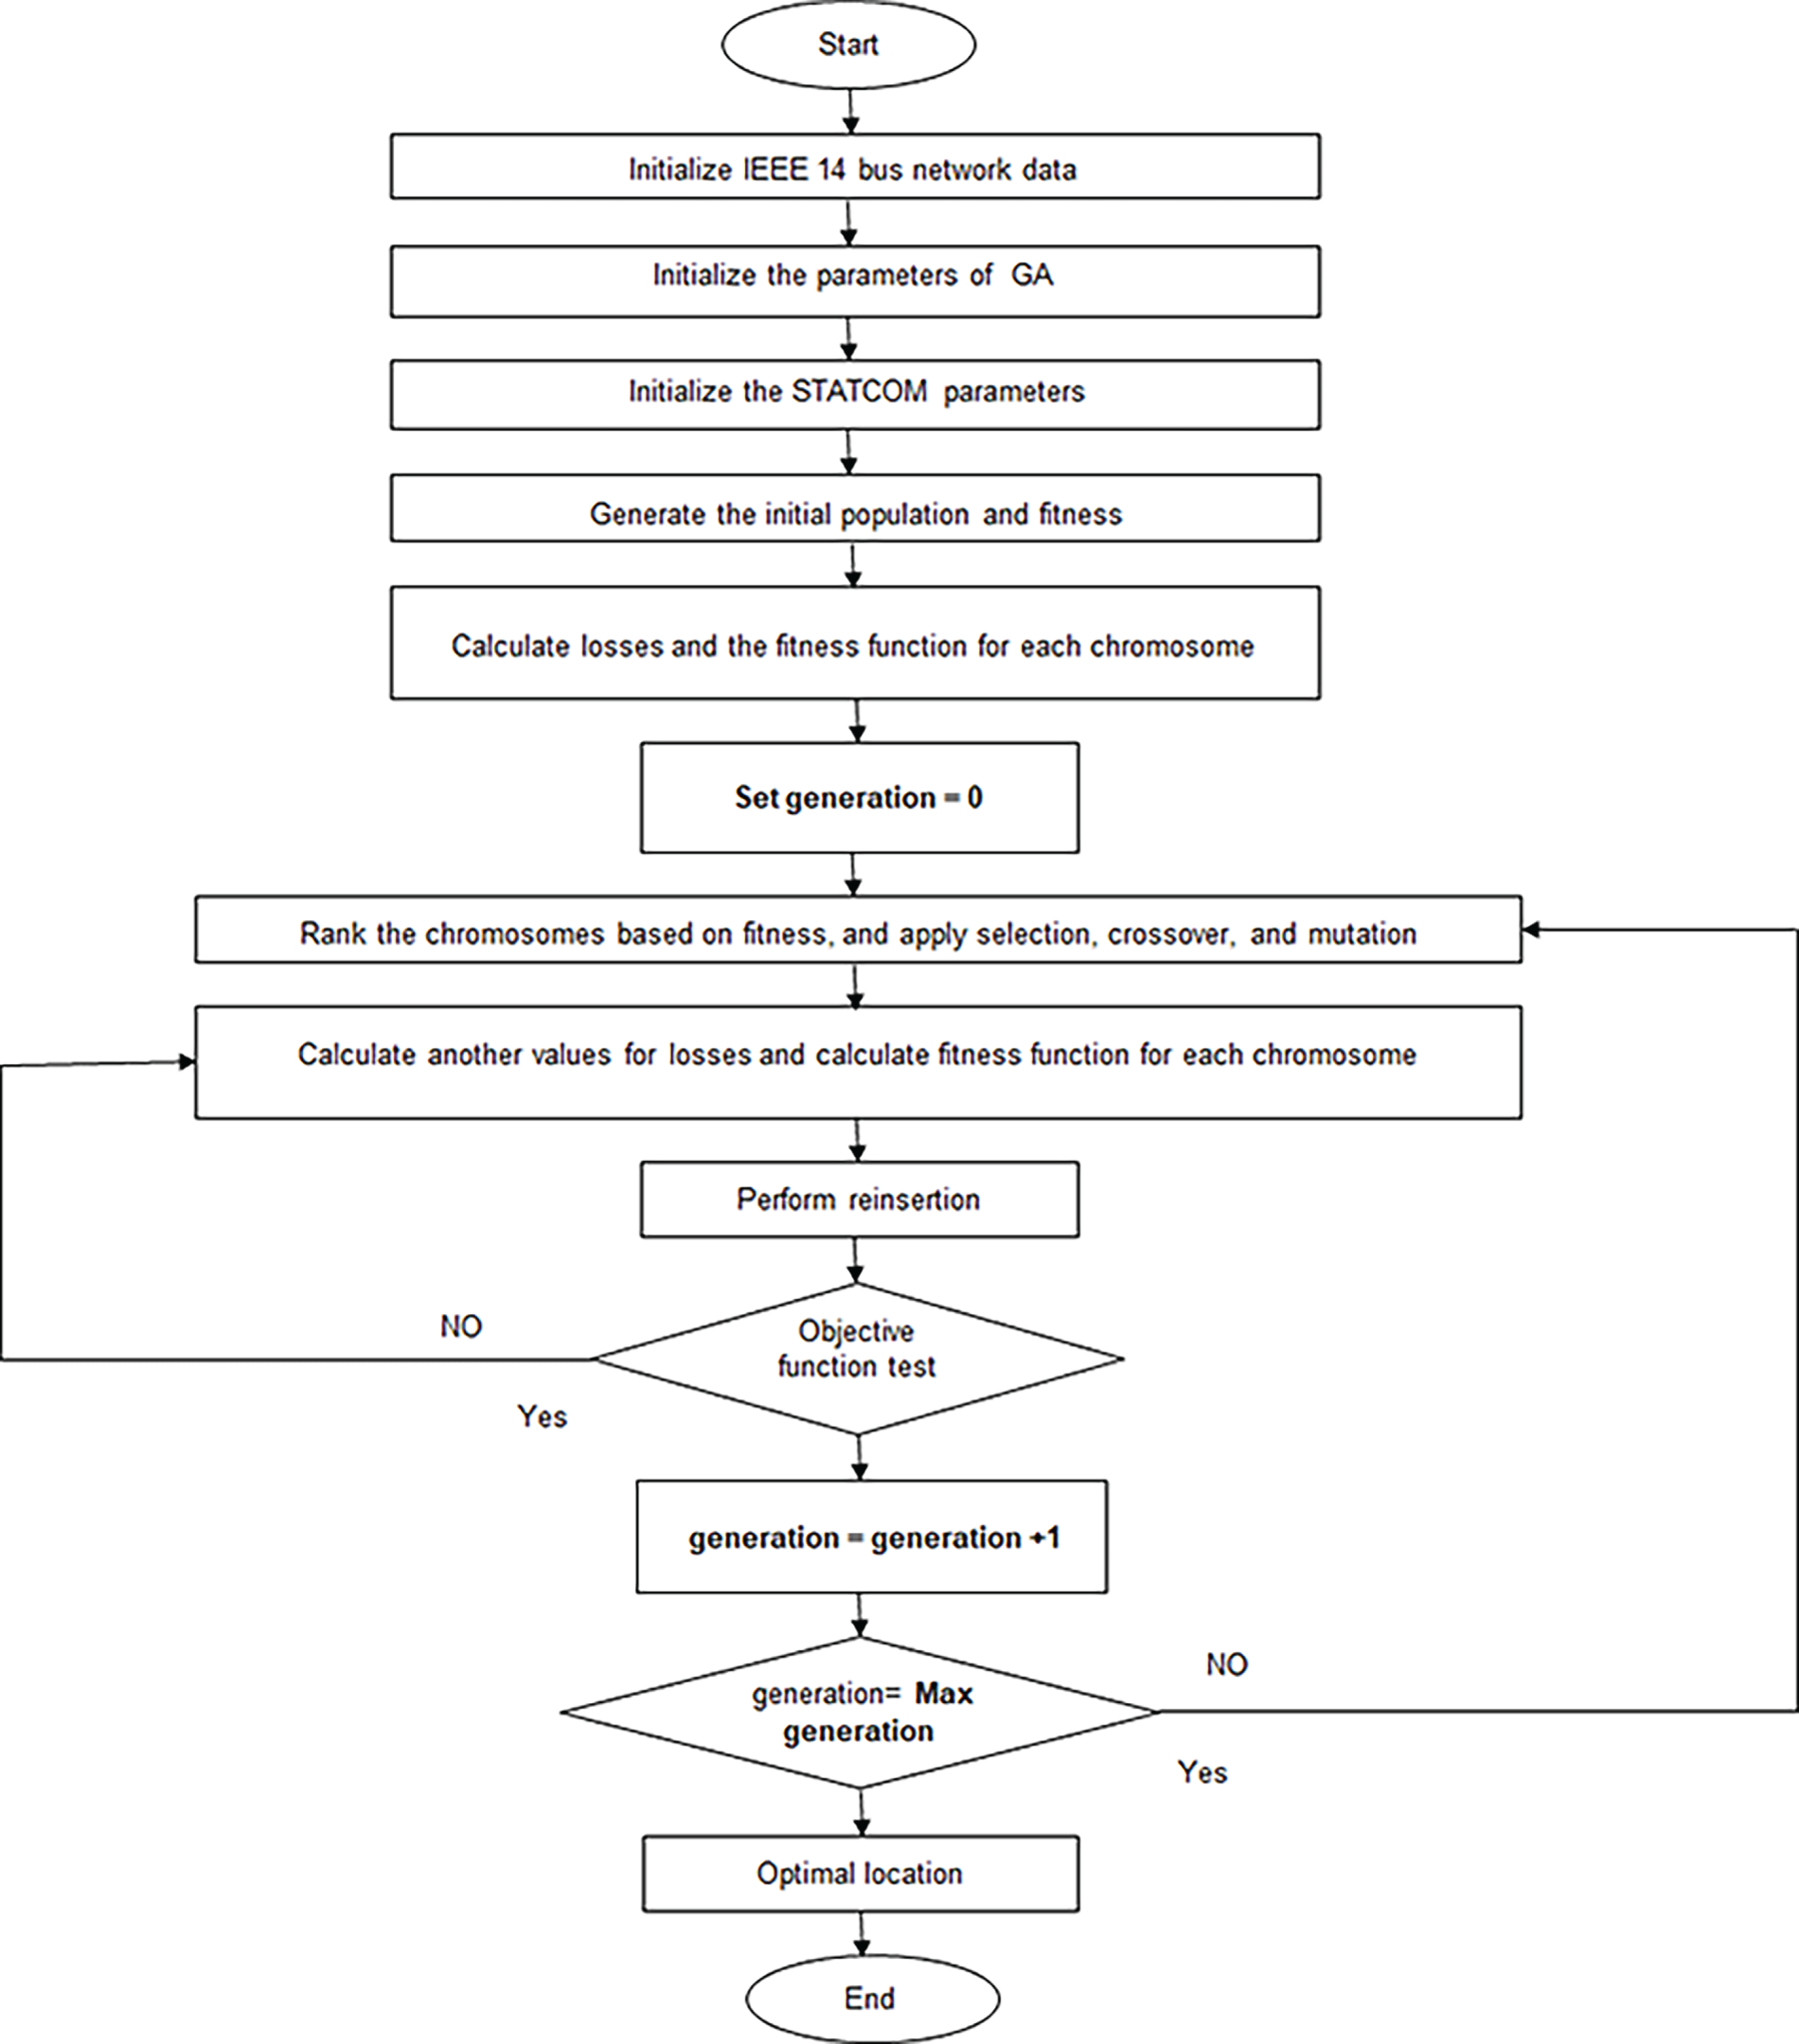
Figure 5: Flowchart of the genetic algorithm optimization for STATCOM allocation
This work is divided into three scenarios: the first consists of detailing our IEEE 14 bus network. The second scenario consists of integrating three wind turbines equipped with a squirrel cage asynchronous generator into the network. Finally, in the third scenario, the disturbances identified in the second scenario are corrected by integrating a STATCOM into the network.
7.1 Scenario 1: Case Study of IEEE 14 Bus
The IEEE 14 bus test network, as demonstrated in Fig. 6, was used to verify the algorithm. Network information was collected using [40,41]. The load flow function of the Power System Toolbox (PST), based on MATLAB, was used to solve the power flow problem [41].
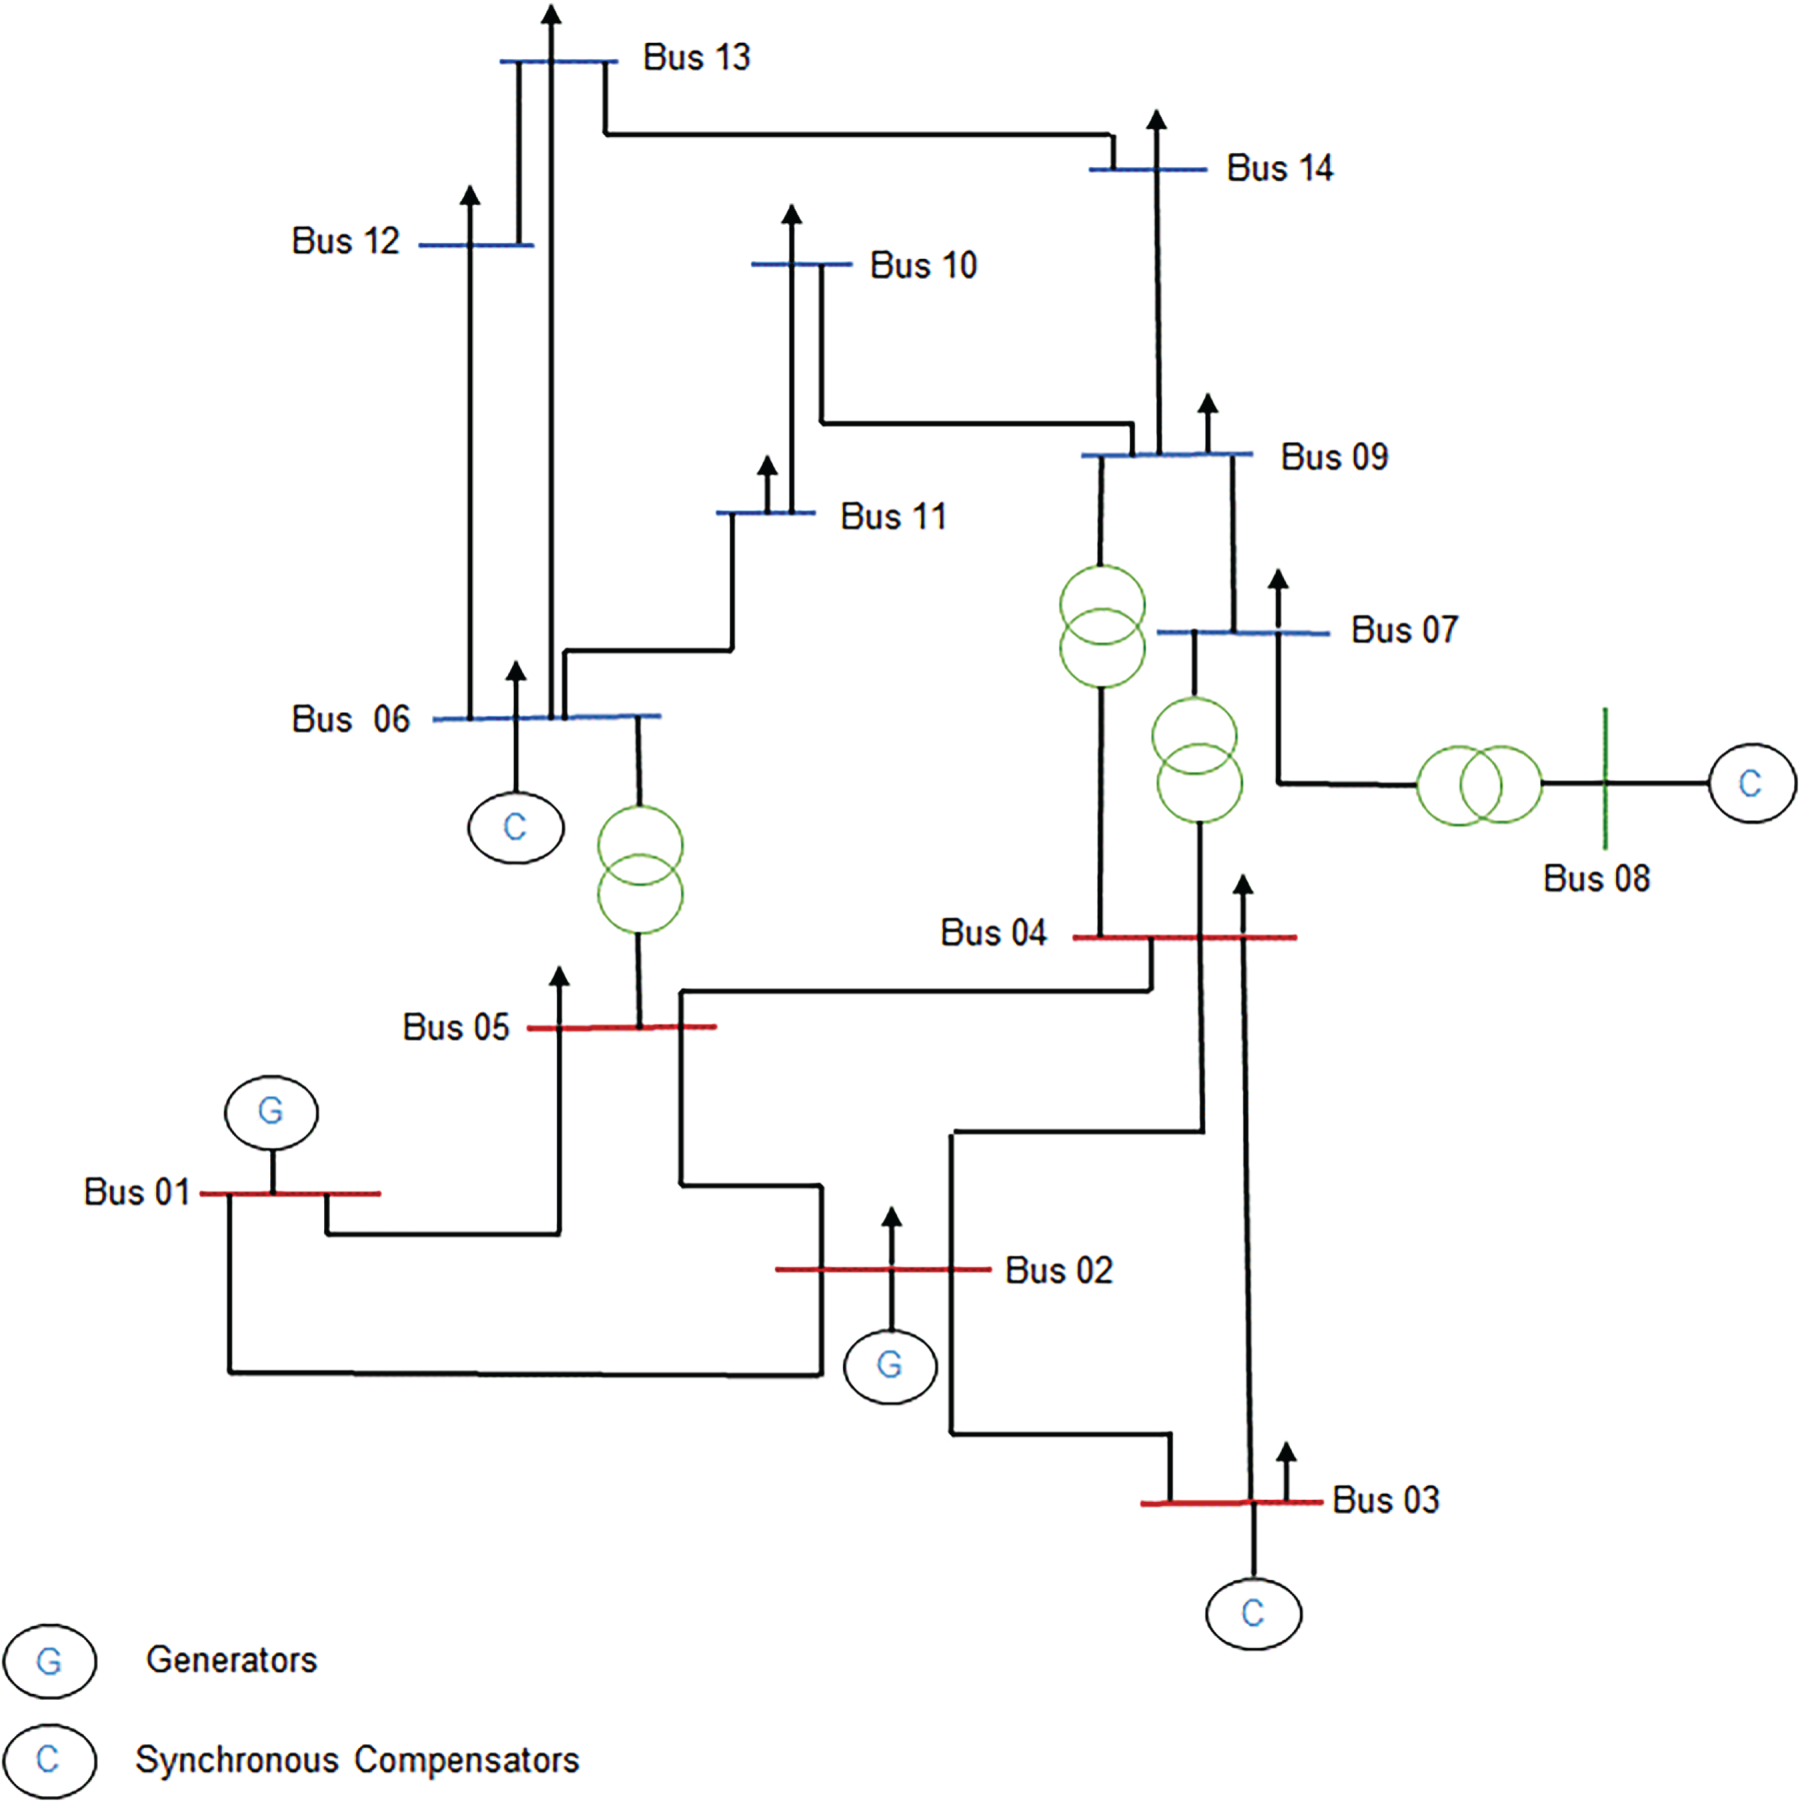
Figure 6: IEEE 14 bus standard network
This section may be divided by subheadings. It should provide a concise and precise description of the experimental results, their interpretation, as well as the experimental conclusions that can be drawn.
Table 5 below shows the number of each type of element making up the network.

Table 6 shows the parameters of the various buses of the IEEE 14 bus network before the integration of wind turbines, carried out using the toolbox for power system analysis software (PSAT). This information facilitates the examination of the load profile and the power distribution within the network.

Table 7 below shows the characteristics of the transmission lines in the analyzed network.

7.2 Scenario 2: Case Study on Integrating Multiple Wind Turbines into an IEEE 14 Bus Network
In this part, the three wind farms based on asynchronous generators were installed at buses 6, 7, and 14. The objective of this configuration is to analyze how the addition of wind turbines affects the grid stability. This work also allows us to observe the voltage fluctuations due to renewable sources and grid disturbances.
Fig. 7 shows the three wind speeds based on the Weibull distribution that are used for the wind turbines in the network.
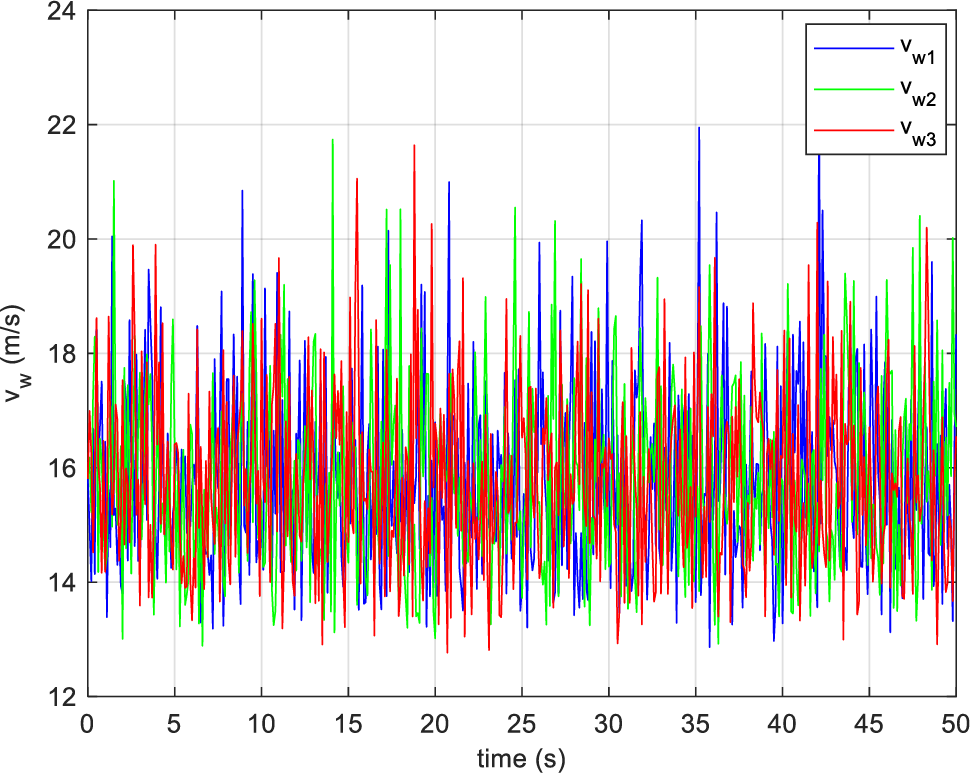
Figure 7: The three wind speeds used for wind turbines
As shown in Fig. 7, the three curves exhibit highly fluctuating and random behavior, reflecting the turbulent nature of the wind. The values mainly oscillate between 14 and 20 m/s, with some peaks slightly exceeding 20 m/s. Despite these instantaneous variations, the three profiles maintain a similar trend, highlighting an overall consistency among the different wind speeds. These fluctuations must be taken into account in the modeling and analysis of wind turbine performance, as they directly influence the power produced and the stability of the network.
The following figure illustrates the voltage measurements on various network buses, before and after the addition of the wind turbines. This allows us to analyze the device’s effect on voltage stability.
As shown in Fig. 8, the voltages decrease with distance from the generators, indicating voltage dips. This can be attributed to the fact that the squirrel cage asynchronous generator consumes reactive power to produce electricity, which results in losses in the transmission lines.
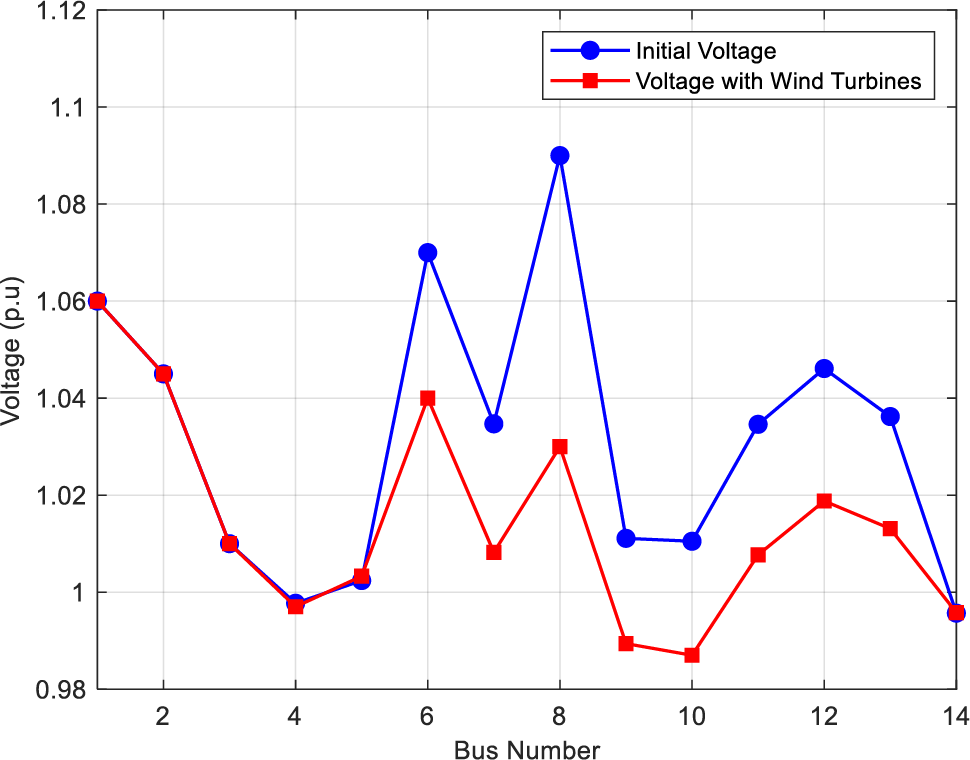
Figure 8: Voltage profile with and without wind turbines at different buses of the IEEE 14 bus network
7.3 Scenario 3: Case Study on Adding a STATCOM to a Network
This section focuses on determining the best location for STATCOM installation within an electrical power distribution network. The study uses two different situations to measure the impact of placement strategies on network performance. In the first scenario, the placement is determined through Genetic Algorithm optimization, which is called optimized STATCOM allocation using GA, and the second scenario uses PSO for placement optimization, which is called optimized STATCOM allocation using PSO. The evaluation of these different approaches allows measuring the effectiveness of each method in improving voltage profiles and minimizing power losses across the entire network.
Table 8 presents the contribution of STATCOM to optimizing the voltage and power factor in the different buses.

The comparative analysis of the results presented in Table 8 highlights distinct behaviors depending on the STATCOM device allocation method, namely the genetic algorithm (GA), with an implementation on bus 14, and particle swarm optimization (PSO), with an implementation on bus 9.
First, it should be noted that buses 1, 2, 3, 6, and 8 show no significant variation, either in terms of voltage (p.u) or power factor, between the two optimization strategies. This stability can be explained by the fact that these buses are directly connected to the generators or already equipped with reactive compensation means, such as static capacitors. Under these conditions, the addition of a STATCOM produces only a marginal, if any, effect.
On the other hand, notable variations are recorded on other network buses, particularly buses 4, 7, 9, 10, 11, 12, 13, and 14, demonstrating the differentiated impact of the two methods on voltage regulation and power factor correction.
In the case of genetic algorithm (GA) allocation, although some improvements are noticeable, they remain limited. For example, the voltage at bus 10 remains below the nominal value, at 0.9998 p.u, indicating insufficient reactive compensation at this location. The voltages at buses 9 (1.0016 p.u), 11 (1.0128 p.u), 13 (1.0145 p.u), and 14 (1.0023 p.u), although above 1.0 p.u in some cases, do not reach an optimal level. Furthermore, the phase angles suggest that the power factor is not sufficiently improved on these buses.
Conversely, STATCOM allocation using the PSO algorithm produces significantly more satisfactory results. A significant increase in voltage is observed on the critical buses: 1.0720 p.u on bus 9, 1.0543 p.u on bus 10, 1.0416 p.u on bus 11, 1.0246 p.u on bus 13, and 1.0475 p.u on bus 14. These values indicate more targeted reactive support. Furthermore, the higher absolute values of the phase angles reflect a significant power factor, which contributes to improved stability and reduced losses in the network.
As shown in Table 8, the average power factor obtained after optimization with PSO and GA algorithms is higher than that obtained in the initial state of the IEEE 14 bus network without STATCOM, as shown in Table 6. These results show that the integration of a STATCOM improves the energy efficiency of the network, in particular, the reactive power consumption. Furthermore, the improvement of the power factor results in a reduction of transmission losses and a more stable and efficient operation of the power network. Consequently, the integration of a STATCOM associated with evolutionary optimization methods makes it possible to optimize the stability and quality of the electrical network.
In conclusion, the obtained results clearly demonstrate the superiority of PSO optimization in STATCOM allocation. This method allows not only a more efficient regulation of the voltage profile but also an improvement in the power factor, ensuring better reactive compensation and a more stable and efficient overall performance of the electrical network.
Table 9 shows the variation of total active power in different cases.

Fig. 9 compares the variations in power losses of the network compared to the initial state.
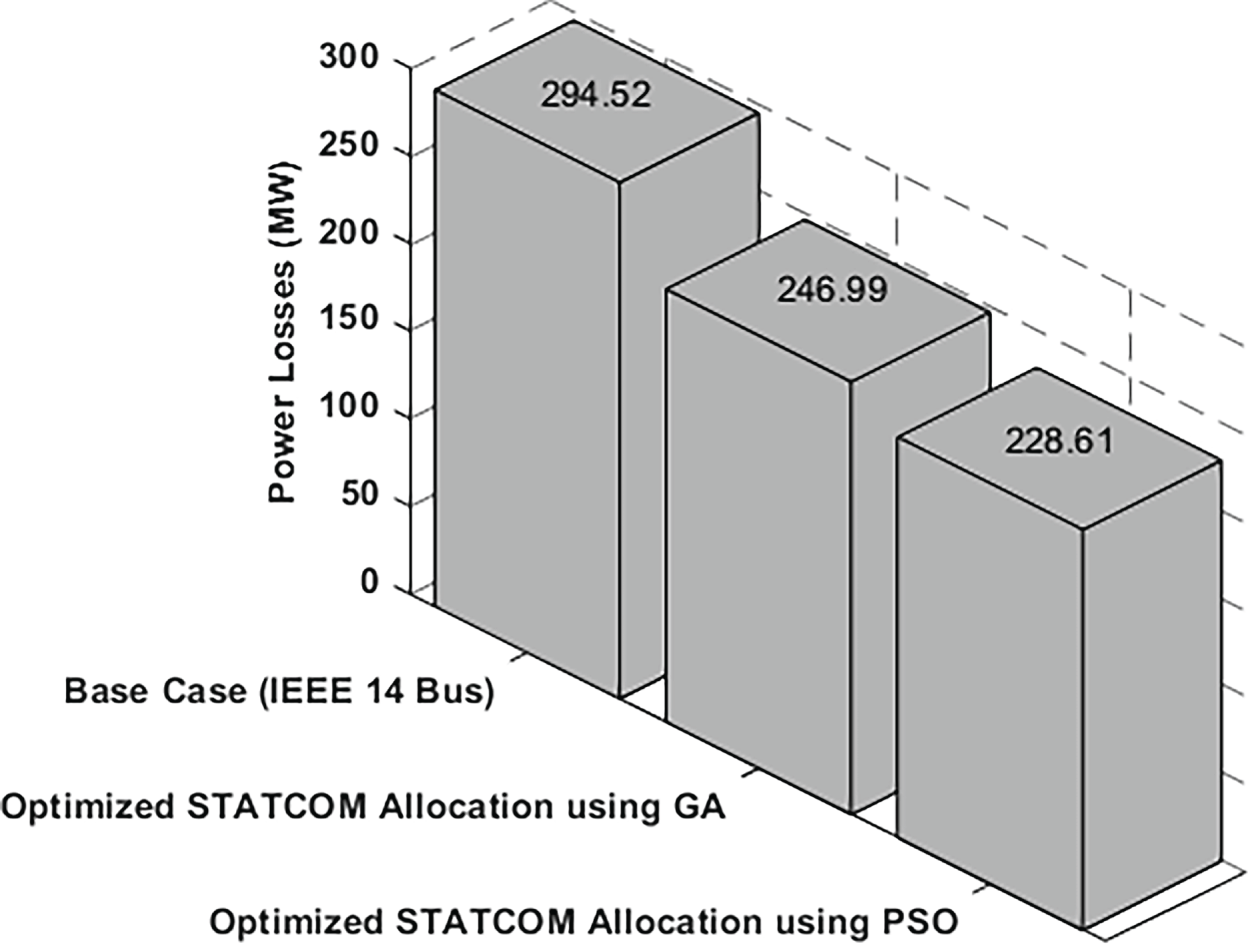
Figure 9: Results of the active power losses
Table 9 and Fig. 9 clearly illustrate the progressive reduction of active power losses on the network thanks to the STATCOM allocation, which allows, compared to the initial network without STATCOM (294.52 kW), to reduce the losses that the allocation optimized by the genetic algorithm (GA) allows a reduction of 16.14%, while the optimization by the PSO algorithm leads to a greater reduction of 22.38%.
A comparative analysis of the two optimization techniques reveals that the PSO approach has an additional 7.44% over the GA algorithm. These results demonstrate that the PSO algorithm performs best for STATCOM allocation in the IEEE 14 bus network, with maximum loss reduction. Bus 9, chosen by the PSO, is therefore identified as the optimal location for STATCOM.
The integration of a STATCOM was carried out to evaluate its impact on the dynamic stability of the power grid. This evaluation is based on a comparison between two scenarios: the first one corresponds to a network with three wind turbines without a FACTS device, while the second scenario integrates a STATCOM whose placement was optimized using the PSO algorithm. The STATCOM parameters used are detailed in Table 2. Table 10 presents the system eigenvalues in the complex plane for both scenarios, showing an improvement in stability with the STATCOM, although some buses may still exhibit oscillations close to the stability limits.
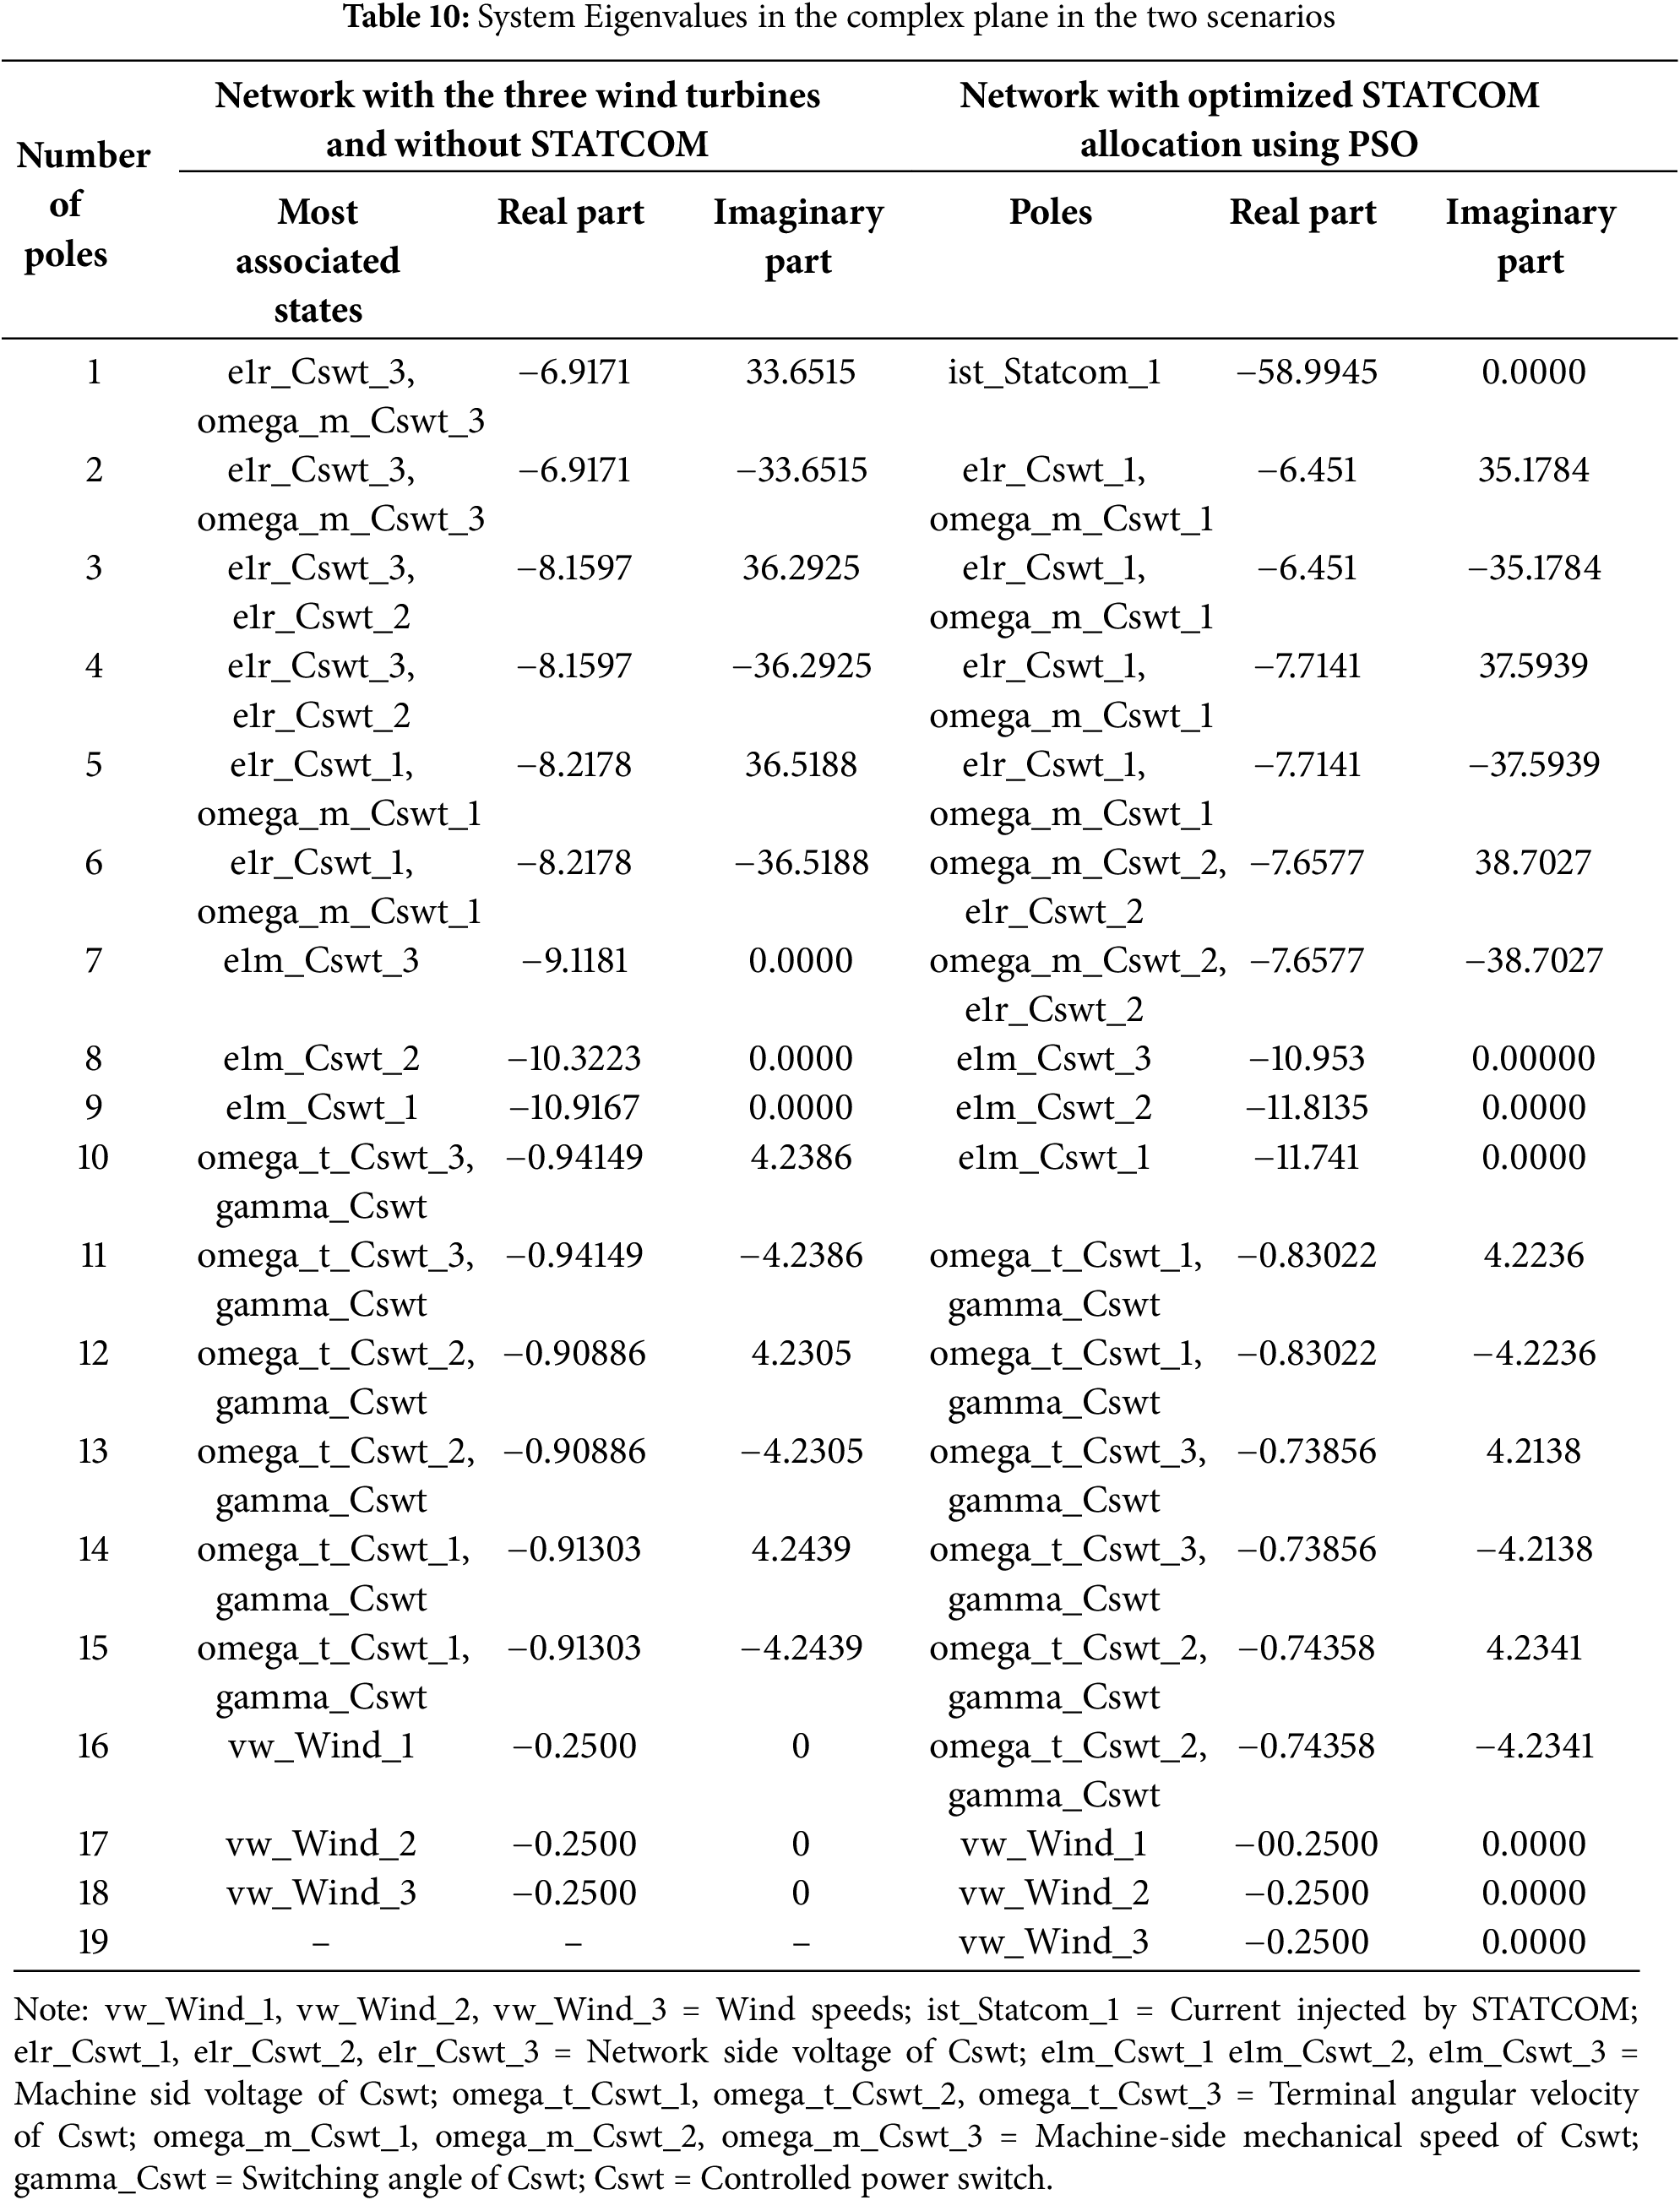
The specific values of the nodal admittance matrix in the complex context are illustrated in Fig. 10.
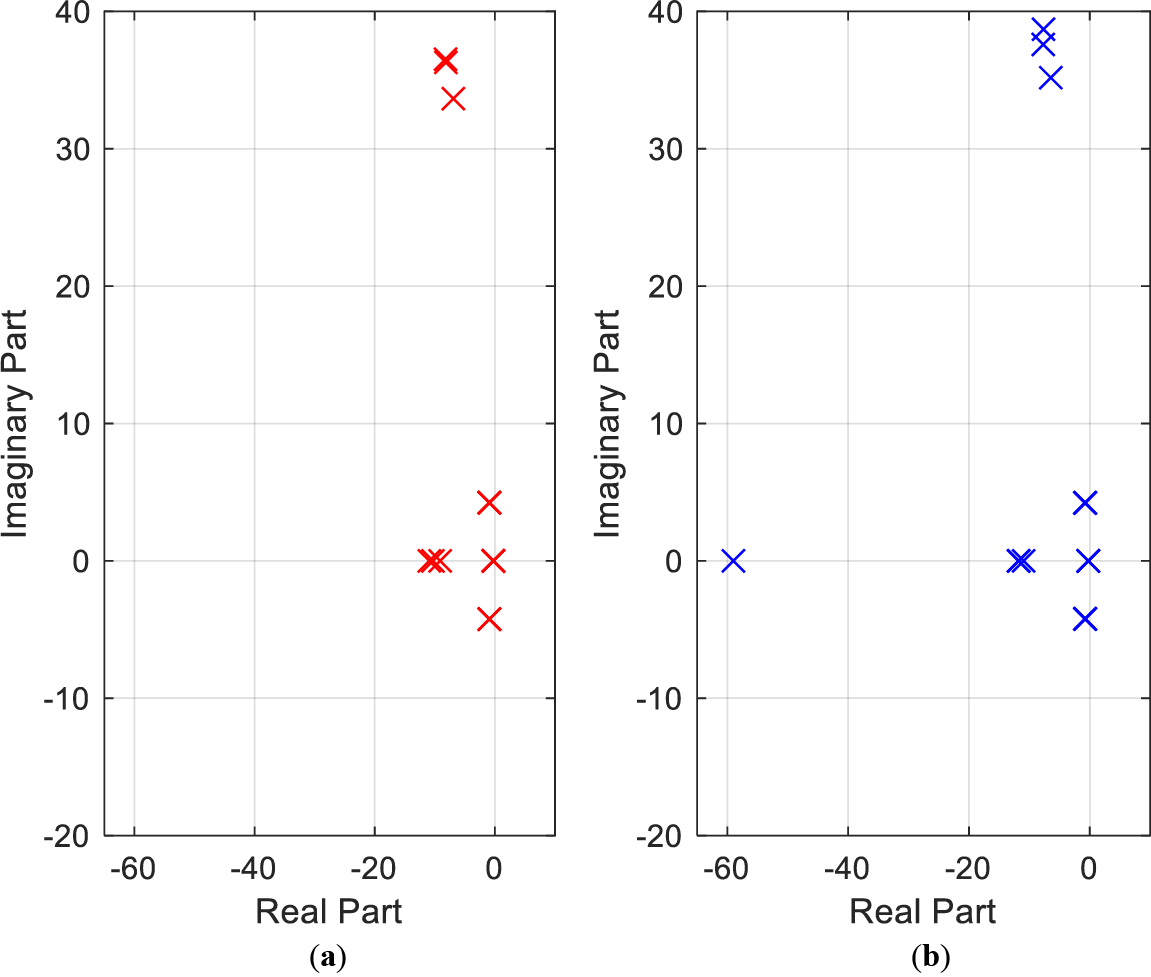
Figure 10: Location of eigenvalues in the two scenarios: (a) The IEEE 14 bus network without STATCOM; (b) The IEEE 14 bus network with optimized STATCOM allocation using PSO
According to Table 10 and Fig. 10, one studied the stability of two scenarios: the first scenario, shown in Fig. 10a, probably represents an IEEE 14 bus network with integration of wind turbines and without STATCOM. This figure shows that the majority of eigenvalues have a real part close to zero, but slightly negative, which indicates that the system could be stable but with a risk of small depreciations. The second scenario in Fig. 10b represents the same network, but with improvements, such as adding an optimal STATCOM location. Fig. 10b shows that the eigenvalues are more widely distributed, with a greater proportion having negative real parts, indicating improved system stability. One therefore concludes that optimal STATCOM placement by PSO improves stability and reduces oscillations.
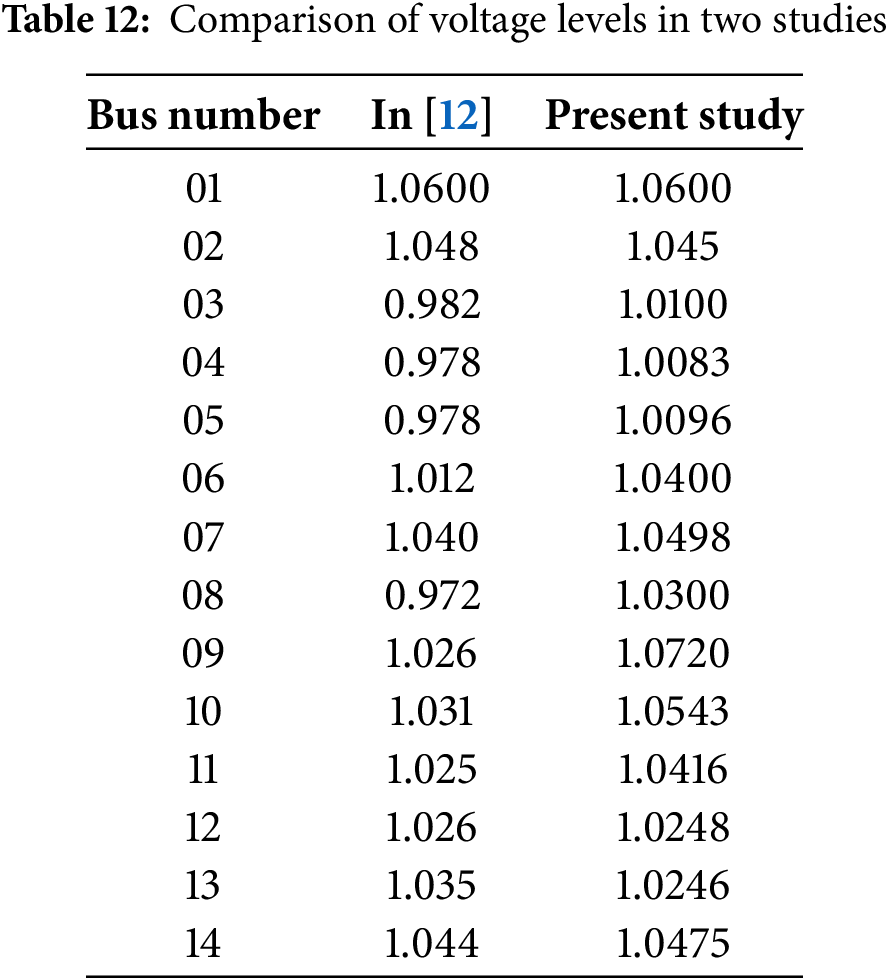
The following two tables present a comparative study of active power and voltage, using the PSO algorithm to optimize STATCOM placement.
Analysis of the results presented in Tables 11 and 12 shows a significant improvement in voltage levels and active losses in the current study. Indeed, the voltages of the 14 network buses are all above 1.00 p.u, indicating a better overall voltage profile. By comparison, in [12], the voltages at buses 3, 4, 5, and 8 are below 1.00 p.u, indicating a voltage weakening at these points in the network. Furthermore, the current study shows a significant reduction in total active losses, reaching 22.38%, compared to only 6.9% in [12].

Most studies addressing the optimal allocation of STATCOM focus primarily on identifying its optimal location and sizing to reduce network power losses. In this work, two optimization approaches are proposed that simultaneously determine the placement and size of the STATCOM with the objective of minimizing active power losses. The PSO algorithm showed superior performance in identifying optimal configurations when compared to the GA algorithm, demonstrating faster convergence and higher solution quality. Moreover, the results indicate that simultaneous optimization of both location and size yields more effective loss reduction than approaches that treat these parameters separately. These findings highlight the potential of PSO as a robust tool for enhancing power system efficiency through strategic FACTS device placement.
This work opens up several potential areas for further investigation:
• Use of large networks.
• Integration of multiple STATCOM devices.
• Optimization including distributed sources (DG).
• Adoption of optimization techniques based on artificial intelligence.
• Implementation of adaptive controllers capable of reacting in real time to system variations.
Acknowledgement: Not applicable.
Funding Statement: The authors received no specific funding for this study.
Author Contributions: Conceptualization, Hajer Hafaiedh and Yahia Saoudi; methodology, Hajer Hafaiedh and Adel Mahjoub; software, Hajer Hafaiedh; validation, Okba Taouali, Anouar Benamor, Kamel Zidi and Wad Ghaban; writing—original draft preparation, Hajer Hafaiedh and Adel Mahjoub; writing—review and editing, Adel Mahjoub, Yahia Saoudi and Anouar Benamor; visualization, Hajer Hafaiedh; supervision, Anouar Benamor, Kamel Zidi and Wad Ghaban; project administration, Okba Taouali. All authors reviewed the results and approved the final version of the manuscript.
Availability of Data and Materials: Data is contained within the article.
Ethics Approval: Not applicable.
Conflicts of Interest: The authors declare no conflicts of interest to report regarding the present study.
References
1. Stoian I, Marichescu A, Gordan M, Gavrea V. Computer based modeling and simulation for wind energy systems. In: 2008 IEEE International Conference on Automation, Quality and Testing, Robotics; 2008 May 22–25; Cluj-Napoca, Romania. p. 337–42. doi:10.1109/AQTR.2008.4588940. [Google Scholar] [CrossRef]
2. Polisetty VK, Jetti SR, Venayagamoorthy GK, Harley RG. Intelligent integration of a wind farm to an utility power network with improved voltage stability. In: Conference Record of the 2006 IEEE Industry Applications Conference Forty-First IAS Annual Meeting; 2006 Oct 8–12; Tampa, FL, USA. p. 1128–33. doi:10.1109/IAS.2006.256674. [Google Scholar] [CrossRef]
3. Fadaeinedjad R, Moschopoulos G, Moallem M. A new wind power plant simulation method to study power quality. In: 2007 Canadian Conference on Electrical and Computer Engineering; 2007 Apr 22–26; Vancouver, BC, Canada. p. 1433–6. doi:10.1109/CCECE.2007.360. [Google Scholar] [CrossRef]
4. Reis C, Maciel Barbosa FP. Line indices for voltage stability assessment. In: 2009 IEEE Bucharest PowerTech; 2009 Jun 28–Jul 2; Bucharest, Romania. p. 1–6. doi:10.1109/PTC.2009.5282003. [Google Scholar] [CrossRef]
5. Melo ACG, Granville S, Mello JCO, Oliveira AM, Domellas CRR, Soto JO. Assessment of maximum loadability in a probabilistic framework. In: IEEE Power Engineering Society 1999 Winter Meeting; 1999 Jan 31–Feb 4; New York, NY, USA. p. 263–8. doi:10.1109/PESW.1999.747464. [Google Scholar] [CrossRef]
6. Hingorani NG. Flexible AC transmission. IEEE Spectr. 1993;30(4):40–5. doi:10.1109/6.206621. [Google Scholar] [CrossRef]
7. Magadum RB, Sudhakar CJ, Deshpande AV, Dodamani SN. Optimal placement of multiple STATCOM and it’s impact on voltage stability. In: 2021 7th International Conference on Advanced Computing and Communication Systems (ICACCS); 2021 Mar 19–20; Coimbatore, India. p. 238–42. doi:10.1109/icaccs51430.2021.9441920. [Google Scholar] [CrossRef]
8. Bhongade S, Tomar A. Optimal reactive power dispatch optimization using STATCOM. J Inst Eng Ind Ser B. 2021;102(2):277–93. doi:10.1007/s40031-021-00537-1. [Google Scholar] [CrossRef]
9. Jaiswal SP, Lata S, Singh S, Singh SK, Singh J. Operating strategies optimization of STATCOM for improvement of voltage profile. In: 2021 International Conference on Computing, Communication, and Intelligent Systems (ICCCIS); 2021 Feb 19–20; Greater Noida, India. p. 840–4. doi:10.1109/ICCCIS51004.2021.9397120. [Google Scholar] [CrossRef]
10. Chirani AA. Identification of the optimal location and capacity of STATCOM using grey wolf optimizer. Majlesi J Electr Eng. 2024;18(3):1–13. doi:10.57647/j.mjee.2024.180339. [Google Scholar] [CrossRef]
11. Ghahremani E, Kamwa I. Optimal allocation of STATCOM with energy storage to improve power system performance. In: 2014 IEEE PES T&D Conference and Exposition; 2014 Apr 14–17; Chicago, IL, USA. p. 1–5. doi:10.1109/TDC.2014.6863431. [Google Scholar] [CrossRef]
12. Okelola MO, Ayanlade SO, Ogunwole EI. Particle swarm optimization for optimal allocation of STATCOM on transmission network. J Phys Conf Ser. 2021;1880(1):012035. doi:10.1088/1742-6596/1880/1/012035. [Google Scholar] [CrossRef]
13. Zhang B, Wu H. Research of available transfer capacity of power grid considering optimal location-allocation of STATCOM. IOP Conf Ser Earth Environ Sci. 2021;692(2):022119. doi:10.1088/1755-1315/692/2/022119. [Google Scholar] [CrossRef]
14. Salbi HA, Tuaimah FM. Optimal placement of STATCOM for Iraqi national (400 kV) super high voltage grid system genetic algorithm based approach. 2021;1076(1):012009. doi:10.1088/1757-899X/1076/1/012009. [Google Scholar] [CrossRef]
15. Oyiogu DC, Obiora-Okeke CA, Aniagboso AO. A comparative analysis of STATCOM, SVC, TCSC and UPFC for voltage stability and power loss reduction in power system network. IRE J. 2024;7(7):500–10. doi:10.13140/RG.2.2.14675.96800. [Google Scholar] [CrossRef]
16. Zhao J, Li X, Hao J, Lu J. Reactive power control of wind farm made up with doubly fed induction generators in distribution system. Electr Power Syst Res. 2010;80(6):698–706. doi:10.1016/j.epsr.2009.10.036. [Google Scholar] [CrossRef]
17. Kumar S, Kumar A, Sharma NK. A novel method to investigate voltage stability of IEEE-14 bus wind integrated system using PSAT. Front Energy. 2020;14(2):410–8. doi:10.1007/s11708-016-0440-8. [Google Scholar] [CrossRef]
18. Feijoo AE, Cidras J. Modeling of wind farms in the load flow analysis. IEEE Trans Power Syst. 2000;15(1):110–5. doi:10.1109/59.852108. [Google Scholar] [CrossRef]
19. de Souza ACZ, de Souza JCS, da Silva AML. On-line voltage stability monitoring. IEEE Trans Power Syst. 2000;15(4):1300–5. doi:10.1109/59.898105. [Google Scholar] [CrossRef]
20. Vassell GS. The northeast blackout of 1965. Public Util Fortn. 1990;126(8):5244283. doi:10.1109/MPER.1991.88621. [Google Scholar] [CrossRef]
21. Kundur P, Paserba J, Ajjarapu V, Andersson G, Bose A, Canizares C, et al. Definition and classification of power system stability IEEE/CIGRE joint task force on stability terms and definitions. IEEE Trans Power Syst. 2004;19(3):1387–401. doi:10.1109/TPWRS.2004.825981. [Google Scholar] [CrossRef]
22. Shahni A, Qazi SH, Kaloi GS, Ullah R. Review on performance analysis of SCIG and PMSG-based wind energy conversion system systems. Int J Electron Commun Eng. 2019;6(7):1–12. doi:10.14445/23488549/ijece-v6i7p101. [Google Scholar] [CrossRef]
23. Livani H, Rouhi J, Karimi-Davijani H. Voltage stabilization in connection of wind farms to transmission network using VSC-HVDC. In: 2008 43rd International Universities Power Engineering Conference; 2008 Sep 1–4; Padua, Italy. p. 1–5. [Google Scholar]
24. Milano F. An open source power system analysis toolbox. IEEE Trans Power Syst. 2005;20(3):1199–206. doi:10.1109/TPWRS.2005.851911. [Google Scholar] [CrossRef]
25. Tounsi A, Abid H, Elleuch K. On the wind energy conversion systems. In: 2018 15th International Multi-Conference on Systems, Signals & Devices (SSD); 2018 Mar 19–22; Yasmine Hammamet, Tunisia. p. 1271–9. doi:10.1109/SSD.2018.8570704. [Google Scholar] [CrossRef]
26. Hafaiedh H, Saoudi Y, Benamor A, Chrifi Alaoui L. Study of the impact of SCIG Wind farm integration and the effect of the location bus in dynamic grid enhancement. In: 2022 10th International Conference on Systems and Control (ICSC); 2022 Nov 23–25; Marseille, France. p. 114–8. doi:10.1109/ICSC57768.2022.9993873. [Google Scholar] [CrossRef]
27. Nid A, Sayah S, Zebar A. Power fluctuation suppression for grid connected permanent magnet synchronous generator type wind power generation system. Electr Eng Electromech. 2024;5(5):70–6. doi:10.20998/2074-272x.2024.5.10. [Google Scholar] [CrossRef]
28. Sharma S, Gupta S, Zuhaib M, Bhuria V, Malik H, Almutairi A, et al. A comprehensive review on STATCOM: paradigm of modeling, control, stability, optimal location, integration, application, and installation. IEEE Access. 2024;12:2701–29. doi:10.1109/ACCESS.2023.3345216. [Google Scholar] [CrossRef]
29. Gad AG. Particle swarm optimization algorithm and its applications: a systematic review. Arch Comput Meth Eng. 2022;29(5):2531–61. doi:10.1007/s11831-021-09694-4. [Google Scholar] [CrossRef]
30. Tiwari S, Kumar A. Advances and bibliographic analysis of particle swarm optimization applications in electrical power system: concepts and variants. Evol Intell. 2023;16(1):23–47. doi:10.1007/s12065-021-00661-3. [Google Scholar] [CrossRef]
31. Zine HKE, Abed K. Smart current control of the wind energy conversion system based permanent magnet synchronous generator using predictive and hysteresis model. Electr Eng Electromech. 2024;2(2):40–7. doi:10.20998/2074-272x.2024.2.06. [Google Scholar] [CrossRef]
32. Singh A, Sharma A, Rajput S, Bose A, Hu X. An investigation on hybrid particle swarm optimization algorithms for parameter optimization of PV cells. Electronics. 2022;11(6):909. doi:10.3390/electronics11060909. [Google Scholar] [CrossRef]
33. Freitas D, Lopes LG, Morgado-Dias F. Particle swarm optimisation: a historical review up to the current developments. Entropy. 2020;22(3):362. doi:10.3390/e22030362. [Google Scholar] [PubMed] [CrossRef]
34. Mohd Yamin MN, Ab Aziz K, Siang TG, Ab Aziz NA. Particle swarm optimisation for emotion recognition systems: a decade review of the literature. Appl Sci. 2023;13(12):7054. doi:10.3390/app13127054. [Google Scholar] [CrossRef]
35. Zhao P, Zhang Y, Hua Q, Li H, Wen Z. Bio-inspired optimal dispatching of wind power consumption considering multi-time scale demand response and high-energy load participation. Comput Model Eng Sci. 2022;134(2):957–79. doi:10.32604/cmes.2022.021783. [Google Scholar] [CrossRef]
36. Papazoglou G, Biskas P. Review and comparison of genetic algorithm and particle swarm optimization in the optimal power flow problem. Energies. 2023;16(3):1152. doi:10.3390/en16031152. [Google Scholar] [CrossRef]
37. Cui EH, Zhang Z, Chen CJ, Wong WK. Applications of nature-inspired metaheuristic algorithms for tackling optimization problems across disciplines. Sci Rep. 2024;14(1):9403. doi:10.1038/s41598-024-56670-6. [Google Scholar] [PubMed] [CrossRef]
38. Al Mindeel T, Spentzou E, Eftekhari M. Energy, thermal comfort, and indoor air quality: multi-objective optimization review. Renew Sustain Energy Rev. 2024;202:114682. doi:10.1016/j.rser.2024.114682. [Google Scholar] [CrossRef]
39. Nallolla CA, Vijayapriya P, Chittathuru D, Padmanaban S. Multi-objective optimization algorithms for a hybrid AC/DC microgrid using RES: a comprehensive review. Electronics. 2023;12(4):1062. doi:10.3390/electronics12041062. [Google Scholar] [CrossRef]
40. Hajer H, Yahia S, Anouar B, Larbi CA, Taouali O. The dynamic of the grid with the presence of WF and the AVR for power quality enhancement. In: 2025 4th International Conference on Computing and Information Technology (ICCIT); 2025 Apr 13–14; Tabuk, Saudi Arabia. p. 629–32. doi:10.1109/ICCIT63348.2025.10989368. [Google Scholar] [CrossRef]
41. Milano F. Power system modelling and scripting. Berlin/Heidelberg, Germany: Springer; 2010. doi:10.1007/978-3-642-13669-6. [Google Scholar] [CrossRef]
Cite This Article
 Copyright © 2025 The Author(s). Published by Tech Science Press.
This work is licensed under a Creative Commons Attribution 4.0 International License , which permits unrestricted use, distribution, and reproduction in any medium, provided the original work is properly cited.
 Downloads
 Citation Tools