
 Submit a Paper
 Propose a Special lssue
 Open Access
ARTICLE

Structure-Aware Malicious Behavior Detection through 2D Spatio-Temporal Modeling of Process Hierarchies
System Security Research Center, Chonnam National University, Gwangju, 61186, Republic of Korea
* Corresponding Author: Ieck-Chae Euom. Email:
(This article belongs to the Special Issue: Cutting-Edge Security and Privacy Solutions for Next-Generation Intelligent Mobile Internet Technologies and Applications)
Computer Modeling in Engineering & Sciences 2025, 145(2), 2683-2706. https://doi.org/10.32604/cmes.2025.071577
Received 07 August 2025; Accepted 17 October 2025; Issue published 26 November 2025
 View Full Text
 Download PDF
Abstract
With the continuous expansion of digital infrastructures, malicious behaviors in host systems have become increasingly sophisticated, often spanning multiple processes and employing obfuscation techniques to evade detection. Audit logs, such as Sysmon, offer valuable insights; however, existing approaches typically flatten event sequences or rely on generic graph models, thereby discarding the natural parent-child process hierarchy that is critical for analyzing multiprocess attacks. This paper proposes a structure-aware threat detection framework that transforms audit logs into a unified two-dimensional (2D) spatio-temporal representation, where process hierarchy is modeled as the spatial axis and event chronology as the temporal axis. In addition, entropy-based features are incorporated to robustly capture obfuscated and non-linguistic strings, overcoming the limitations of semantic embeddings. The model’s performance was evaluated on publicly available datasets, achieving competitive results with an accuracy exceeding 95% and an F1-score of at least 0.94. The proposed approach provides a promising and reproducible solution for detecting attacks with unknown indicators of compromise (IoCs) by analyzing the relationships and behaviors of processes recorded in large-scale audit logs.Keywords
The rapid evolution of information technology has increased the complexity of cyber threats [1], particularly with the rise of hybrid threats targeting critical infrastructures like the Industrial Internet of Things (IIoT) [2]. These threats are unauthorized attempts to access internal systems with malicious intent, posing risks to organizational assets and sensitive information. Cyber threats can also arise internally, such as insider threats exploiting zero-day vulnerabilities that traditional security systems fail to detect [3]. To counter these threats, many organizations rely on audit logs for threat analysis and incident investigations [4]. Audit logs provide detailed event records generated within a system and play a critical role in effective risk management by offering valuable insights for identifying malicious behavior [5]. While organizations employ firewalls and intrusion prevention mechanisms, the need for advanced technologies to identify malicious activities within the network remains critical.
However, manually analyzing extensive, chronologically ordered audit logs is a significant challenge [6,7]. While automated techniques that analyze static file features such as converting binaries into images for similarity comparison [8] can detect malware variants, they may miss dynamic runtime behaviors. Conversely, existing dynamic log analysis often processes logs as flat sequences or simple dependency graphs, failing to capture the complex interplay between the natural parent-child process hierarchy and the temporal sequence of events [9]. This results in the loss of valuable contextual information crucial for detecting sophisticated, multi-process attacks.
To address this gap, this study proposes a paradigm shift to structure-aware behavioral detection. Our key contribution is a novel methodology that transforms audit logs into a unified two-dimensional (2D) data representation, where the parent-child process hierarchy is treated as a ‘spatial’ dimension and the chronological event sequence as a ‘temporal’ dimension. This ‘Spatio-Temporal’ approach, which is the core of our work’s title, allows a deep learning model to capture complex malicious behaviors that span multiple related processes.
This study contributes to the domain of anomaly detection through the following advancements:
• Novel Spatio-Temporal Data Representation: We introduce a method to transform hierarchical audit logs into a unified 2D data structure. By analyzing the process hierarchy (spatial) and event order (temporal) simultaneously, the model can identify sophisticated attacks that are missed by traditional sequential analysis.
• High-Performance Detection with Host-Only Logs: Our model achieves competitive and robust detection performance using only host-level audit logs. This ensures its applicability in network-isolated environments, such as industrial control systems, where external data sources are unavailable.
• Enhanced Reproducibility: The model’s performance is validated using a publicly available dataset, addressing a common limitation in studies that rely on proprietary data and thereby enhancing transparency and reproducibility in the field.
Numerous methodologies for audit log analysis have been developed to detect malicious behavior, ranging from the analysis of specific log artifacts [10] and system performance characteristics [11,12] to broader behavioral classification using various deep learning techniques [13–15]. Table 1 provides a comprehensive comparison of these key studies from four different perspectives.
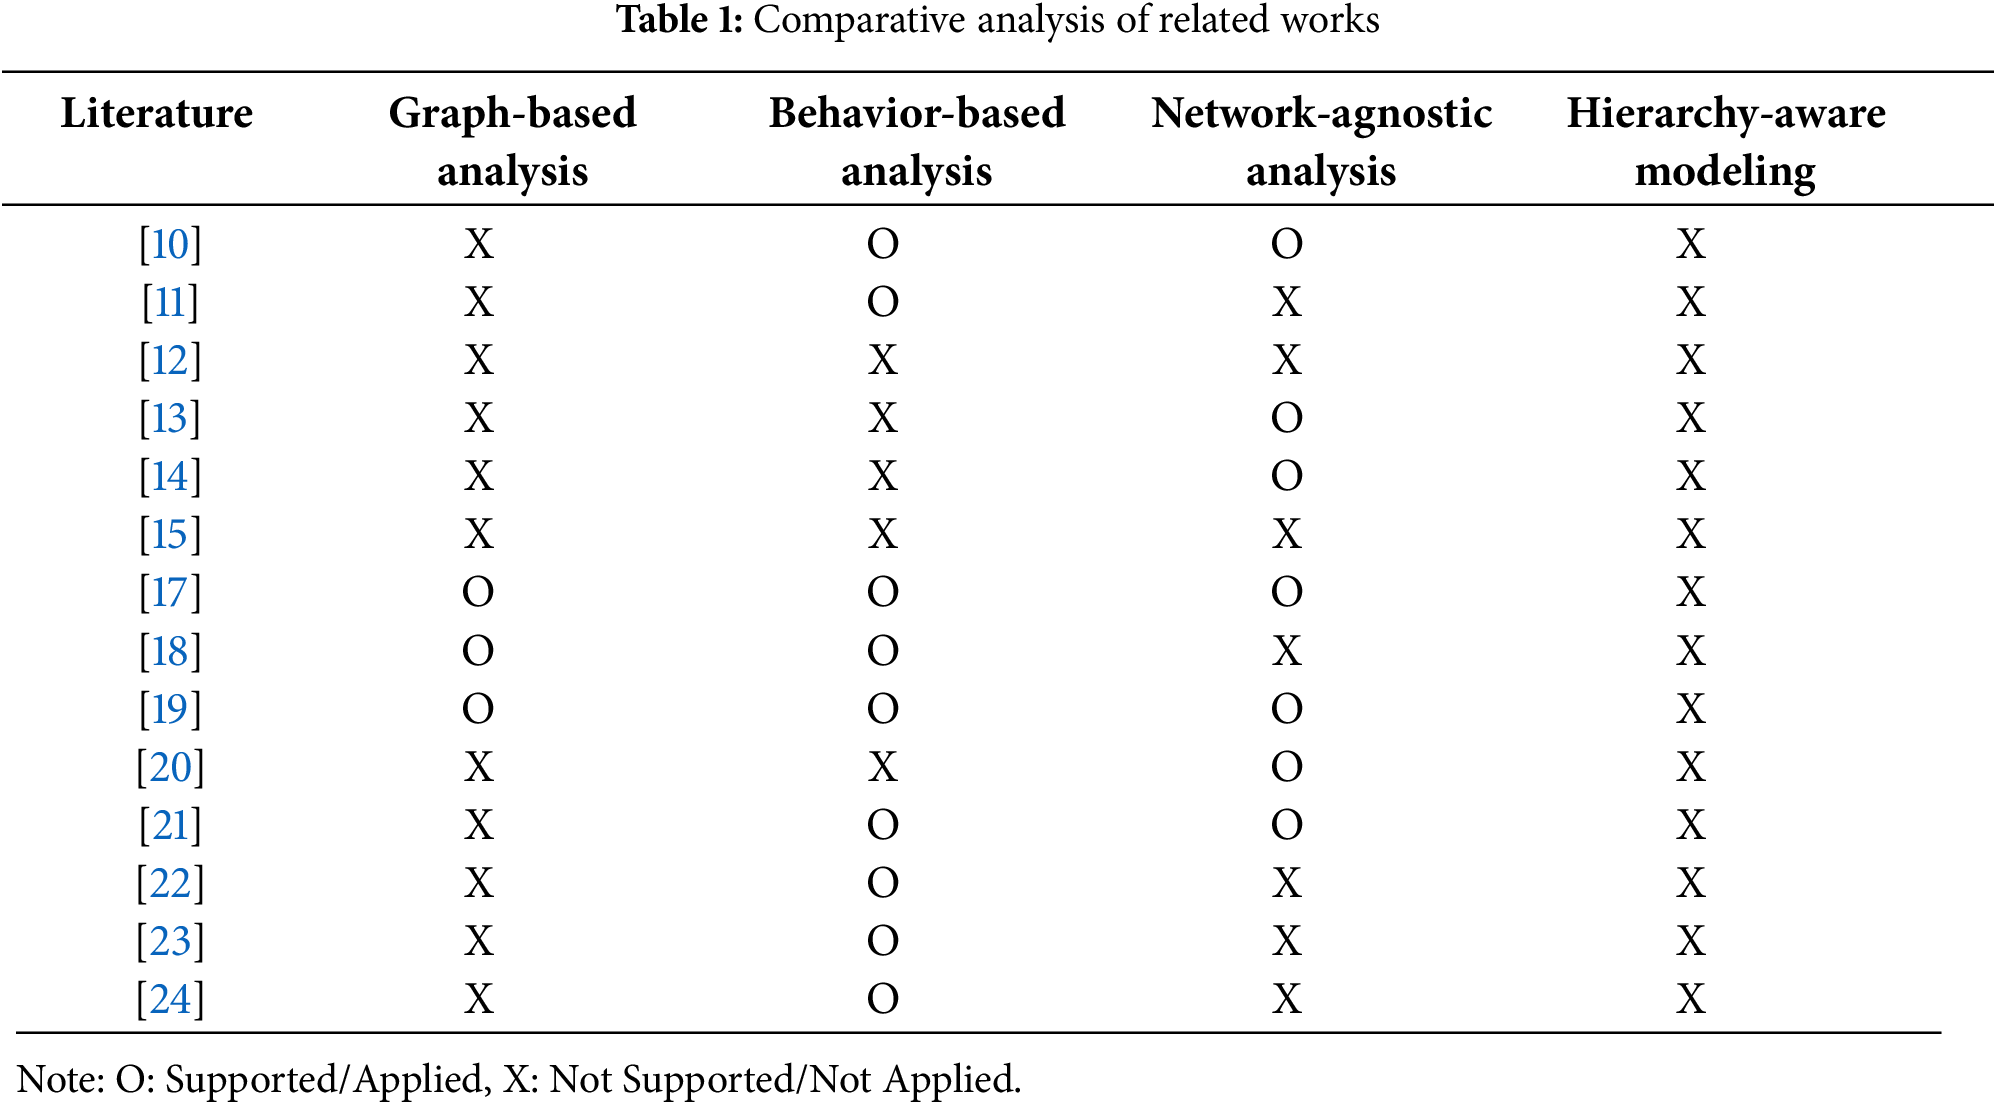
In this table, Graph-based analysis indicates whether log information was viewed from a graph perspective; Behavior-based analysis shows if the recorded information was analyzed based on behavioral patterns; Network-agnostic analysis assesses whether the methodology can operate without external network data; and Hierarchy-Aware Modeling indicates whether the modeling was constructed by considering the parent-child structure of processes. The analysis of this hierarchical structure is particularly important, as malicious behavior is rarely confined to a single process but often spans multiple related processes [16].
One advanced technique leverages graph-based representations of system activities. Zhang et al. [17] built causal graphs to identify malicious processes using a random walk algorithm. Similarly, Xiao et al. [18] and Kurniawan et al. [19] used graph neural networks (GNNs) and knowledge graphs, respectively, to model relationships between system objects. While powerful, these graph-based methods capture general dependencies and do not explicitly preserve the strict, natural parent-child hierarchy that is central to our proposed model.
Other studies have treated audit logs as time-series data. Ring et al. [20], for example, applied Long Short-Term Memory (LSTM) networks to sequences of Windows audit logs. However, by processing events as a flat, one-dimensional timeline, this approach fails to utilize the spatial information inherent in the process hierarchy, which our work explicitly models. Recently, research has expanded to include different data sources and architectures, from hardware traces for CNN-based classification [21] to federated learning frameworks for insider threat detection [22].
The broader field of anomaly detection has also seen significant progress with machine learning, with applications in areas such as advanced 6G networks [23] and other complex systems [24]. These studies demonstrate the power of various algorithms in identifying anomalous patterns from diverse data sources.
To bridge this gap, our work introduces structure-aware behavioral detection, which transforms logs into a two-dimensional (2D) spatio-temporal representation that captures both the temporal sequence and the structural hierarchy simultaneously, enabling more effective spatio-temporal analysis of sophisticated multiprocess attacks.
Compared to graph-based approaches such as causal graphs and graph neural networks (GNNs), which capture broader dependencies among system entities, our method explicitly preserves the strict parent-child hierarchy that governs process execution in Sysmon logs. This distinction is critical because multiprocess malware frequently exploits hierarchical relationships that can be obscured when reduced to generalized graph embeddings.
In contrast, hardware-trace-based techniques, such as Intel Processor Trace (IPT), provide fine-grained control-flow information but require privileged hardware access, specialized instrumentation, and substantial storage overhead, which limit their applicability in enterprise and industrial control system domains. Our approach offers a balanced and practical solution: it preserves structural fidelity while relying only on Sysmon logs, rendering it both reproducible and readily deployable in real-world environments.
3 Structure-Aware 2D Spatio-Temporal Modeling for Threat Detection
Malware frequently exploits the natural parent-child hierarchy of system processes to enhance persistence and evade detection. Since sophisticated attacks often leverage the entire process tree rather than operating in isolation, analyzing activities within this structural context is critical for effective threat detection. This analytical challenge is the primary motivation for our work.
This study introduces a malicious behavior detection model designed to overcome the limitations identified in previous research, with its general workflow depicted in Fig. 1. While the figure outlines the complete process, the primary technical innovations of this paper lie in the Feature Extraction (Step 2) and Data Rearranging (Step 3) stages. In these crucial stages, we first employ a novel entropy-based method to convert log entries into robust numerical features, and then transform these features into a unique two-dimensional data structure that simultaneously represents the temporal sequence of events and the spatial hierarchy of processes. The model’s operation is structured into four primary stages, each detailed in this section.
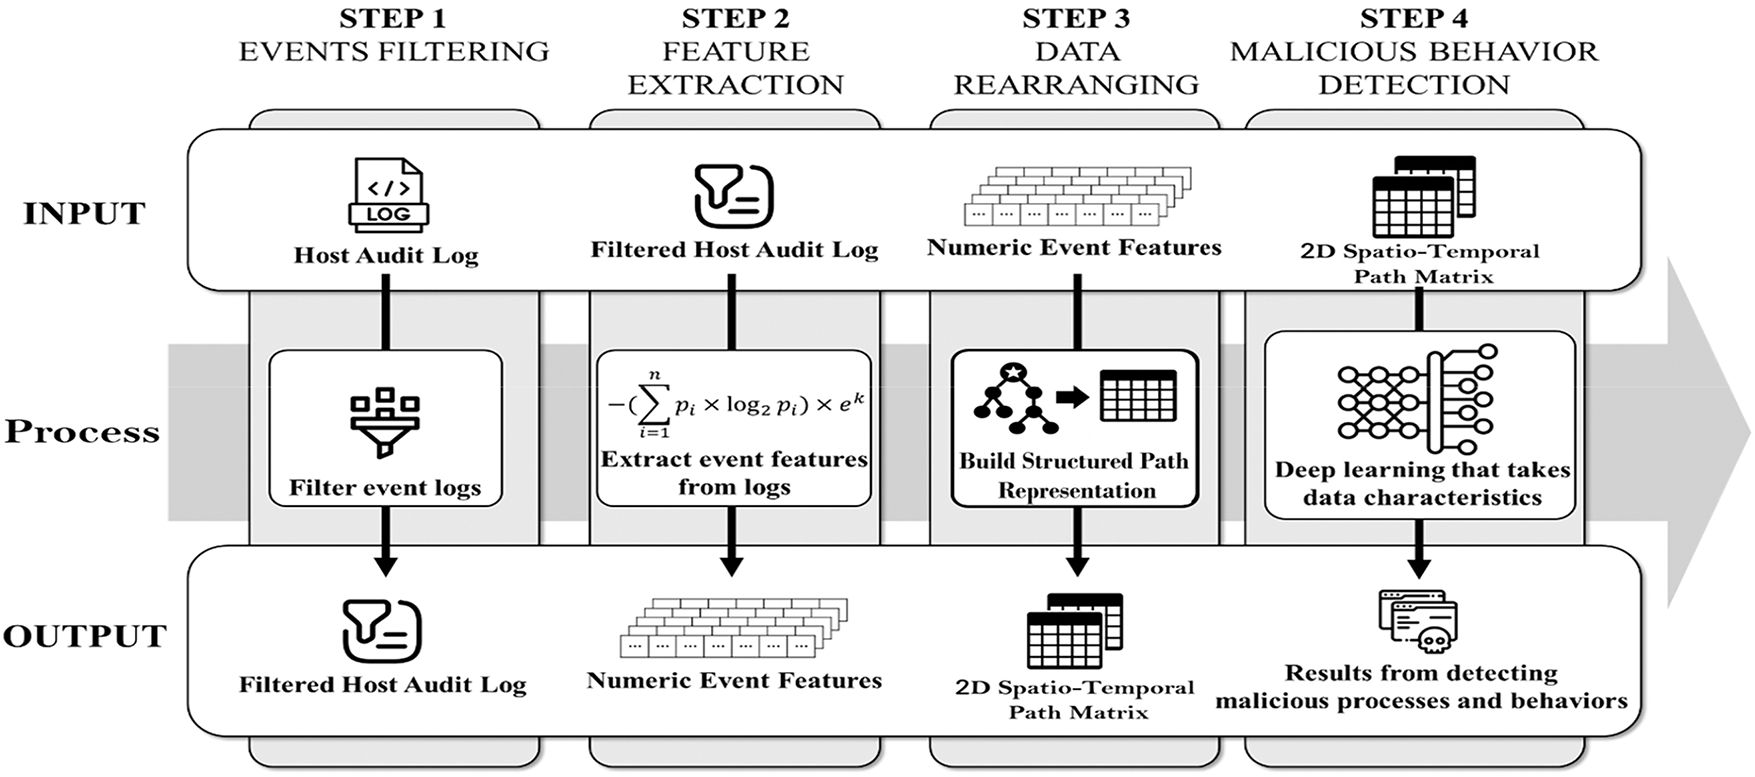
Figure 1: Framework for structure-aware threat detection from audit logs
Audit logs contain critical information that aids security administrators in identifying and analyzing artifacts associated with cyberattacks. However, as the volume of Sysmon logs grows, challenges such as extended analysis times and increased complexity arise. It is essential to enhance analysis efficiency by selecting only event logs relevant to malicious activities to address these challenges.
To achieve this, the study references mitigations documented in the MITRE ATT&CK framework, a globally-accessible knowledge base of adversary tactics and techniques [7]. In this framework, mitigation encompasses conceptual and technical measures designed to prevent the execution of techniques commonly used in cyberattacks. Among the 44 mitigation items, the identifier M1047 is particularly relevant for identifying potential vulnerabilities through audit logs and related data. M1047 outlines techniques and sub-techniques associated with malicious behavior that can be mitigated by analyzing audit logs. Through this analysis, 40 techniques were identified as strongly correlated with audit data. A detailed explanation of this is provided in Appendix A.
In this study, we propose filtering events in audit logs based on the command, file, and process categories. Additionally, network events are included in the analysis to investigate and identify supplementary network activities. Notably, this approach does not require packet-level analysis for network events; instead, it relies on information that can be extracted from host audit logs. As a result, the analysis focuses on events with IDs 1, 3, 5, 11, and 23 in the Sysmon logs.
This approach encompasses 30 of the 40 identified techniques. Techniques excluded from the filtering scope primarily involve cloud services and applications. Upon analyzing the remaining 10 techniques, we found that they often require information beyond the capabilities of host audit logs.
The feature extraction phase focuses on deriving features highly relevant to malicious behavior from the selected event data. Since most information in Sysmon logs is recorded in string format, it cannot be directly utilized for machine learning without preprocessing. Consequently, a transformation into numerical data is required.
While semantic embedding methods such as Word2Vec, Bidirectional Encoder Representations from Transformers (BERT), or FastText are commonly employed, they are often unsuitable for the unique characteristics of audit log data. Audit logs are comprised of non-natural language features like system-specific terminology, registry keys, and obfuscated strings where semantic meaning is absent. Malicious actors frequently exploit this by using deliberate randomization and obfuscation to evade semantic analysis. Recent research has highlighted that pre-trained language models like BERT, while trained on extensive text data, may not be appropriate for semantic extraction in domain-specific data such as audit logs [25].
Therefore, this study adopts an entropy-based feature extraction method. This approach is specifically chosen to target the structural randomness inherent in such data. It effectively quantifies the complexity of obfuscated file paths or command lines used by malware, providing a more robust feature for detection than semantic methods that would fail to interpret this structural chaos. These considerations, along with the computational efficiency of entropy, support our choice for large-scale audit log analysis.
Entropy-based features specifically target these structural patterns and randomness characteristics, providing computational efficiency for real-time processing while maintaining interpretability for security analysts. The computational efficiency of our entropy-based approach is particularly relevant for real-time malware detection in constrained environments, as demonstrated in recent studies on resource-aware malware detection systems [26]. These considerations support our choice of entropy-based features over more computationally intensive semantic embedding methods for large-scale audit log analysis. This approach aligns with previous findings that malware can be identified based on structural naming patterns rather than semantic meaning [27].
Entropy, a measure of randomness in a dataset, quantifies irregular character arrangements within a string. In addition to entropy, Eq. (1) incorporates information about the frequency of character type changes. Characters in a string are broadly classified into five categories: uppercase letters, lowercase letters, numbers, special characters, and others. The variable pi in Eq. (1) denotes the probability of a specific character i appearing, calculated as the frequency of that character divided by the total length of the string. As the sum of all pi for a given string is always 1, it constitutes a properly normalized probability distribution. The variable k represents the number of times character types change within that string, a value calculated directly from the input, not a pre-set hyperparameter. Eq. (1) calculates the traditional entropy value and multiplies it by a term derived from k.
This formula is designed to capture the unique structural properties of strings, such as filenames, used by malicious actors. Previous research has demonstrated that malware can be identified solely based on file names [28], which inspired our focus on string characteristics over semantic analysis. Our complexity measure advances this concept; the scaling factor ek acts as a heuristic weight that specifically amplifies the structural chaos found in obfuscated strings. While standard Shannon entropy measures the randomness of character distribution, the ek term applies an exponential penalty to the frequency of character type changes (e.g., from uppercase to numbers). This design allows the model to more effectively learn and distinguish these unique structural patterns, which might otherwise be lost in a simple entropy calculation.
Preprocessing is performed for each field in event logs, as outlined in Table 2, to preserve their distinct characteristics and extract string complexity based on the types of string information in Sysmon log events. The preprocessing results for each field yield one or more numerical values.
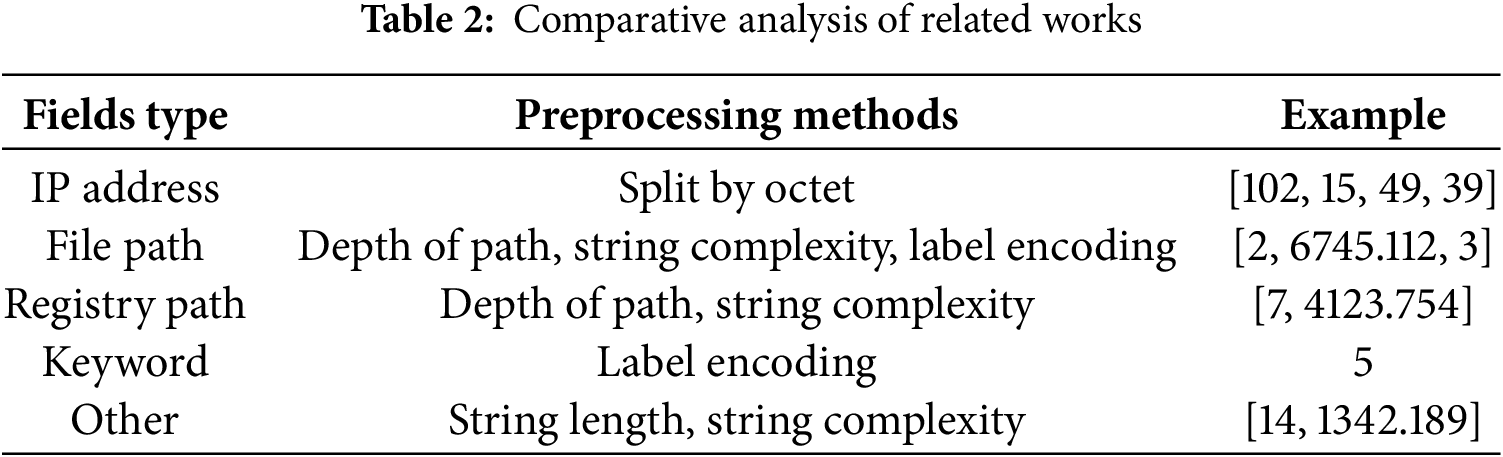
IP addresses are processed by splitting them into octets. Path information undergoes several processing steps: extracting folder depth, performing label encoding for file extensions, and calculating string complexity for file names. For registry path information, both the path depth and the string complexity of key names are computed.
If a field contains multiple paths, preprocessing involves determining the number of file paths and calculating the average string complexity of all file names. Label encoding alone suffices for keyword-type strings with limited possible labels. All other strings are preprocessed by calculating their length and string complexity.
The results of these preprocessing steps are stored as key-value pairs, where each represents the information of a single event. This preprocessing phase focuses on fields directly or indirectly associated with malicious behaviors. Relevant fields are identified based on criteria such as whether they indicate the state of devices, files, registries, processes, or users involved in these behaviors or whether they record changes to the state of these objects as strings or integers.
The features extracted in the preceding steps are derived from individual event logs. To enable effective malicious behavior detection using Sysmon logs, these features must be reorganized to reflect the data’s sequential characteristics. Sysmon logs exhibit two sequential characteristics: temporal order and process tree hierarchy. All event logs must be arranged chronologically to process information reflecting sequential malicious behaviors.
Sysmon logs include the process ID (PID) and the image path of the process initiating the behavior, allowing for constructing a hierarchical structure known as the process tree [9]. This tree represents parent-child relationships between processes. This stage aims to utilize the features extracted earlier to generate two-dimensional data that incorporates this hierarchical structure. Each node in the process tree is uniquely identified. Events with matching globally unique identifier (GUID) and PID values are assumed to originate from the same process, and this pair serves as the key for constructing the tree. The process tree is organized into nodes, as shown in Fig. 2.
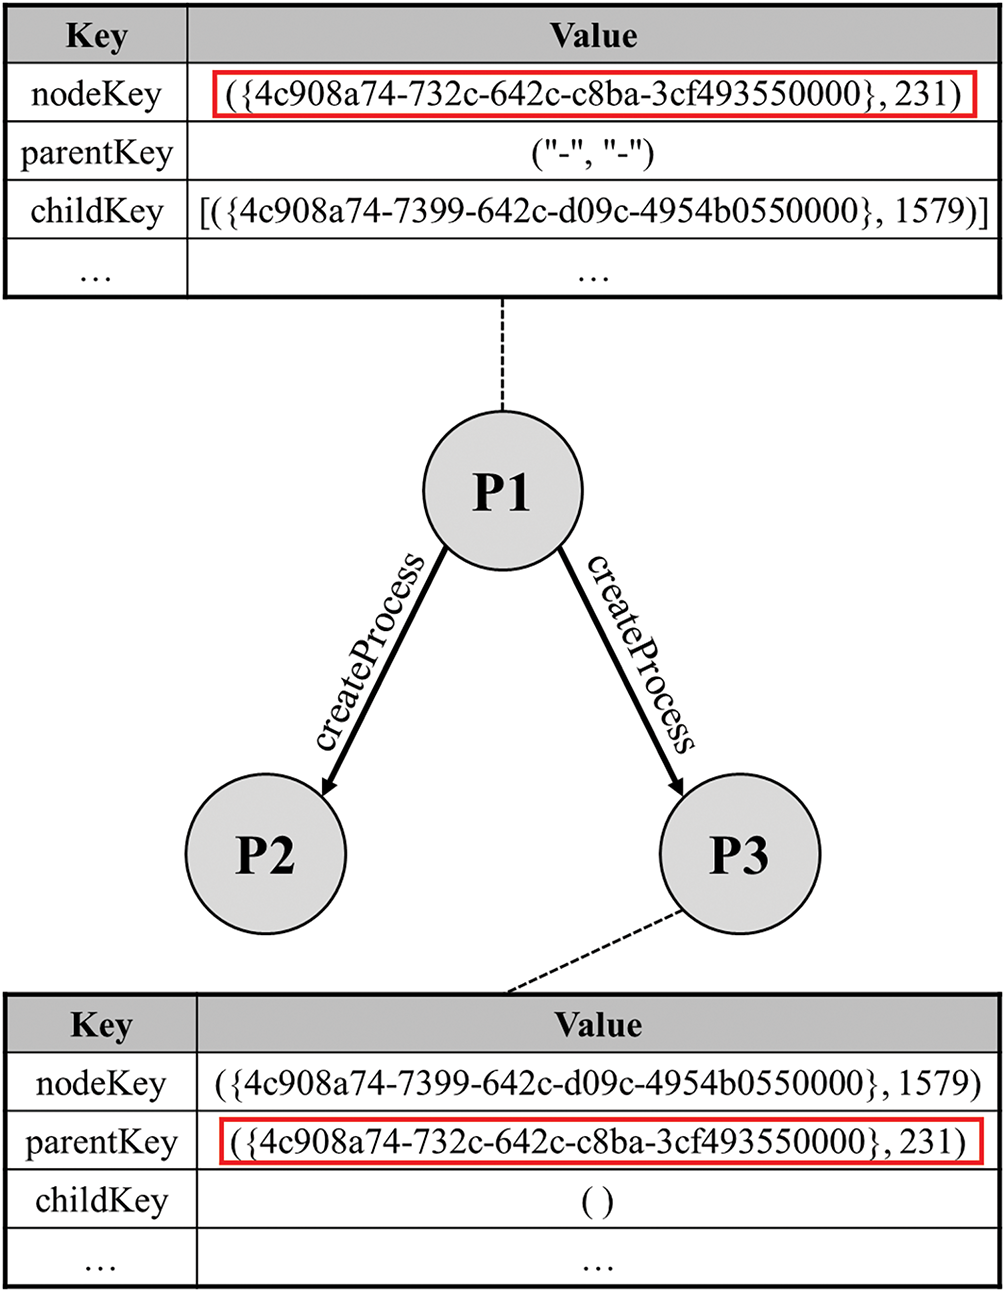
Figure 2: Node component of a process tree representing hierarchical structures
The nodeKey, which serves as the identifier for a node, is a tuple comprising a ProcessGuid and a PID. The childKey and parentKey define its relationship with other nodes. The eventID and eventField store the ID and numeric features of the event for which the process is responsible and are recorded chronologically. Lastly, eventLabel is a field reserved for model training, where the maliciousness of each event log is annotated. The interconnected process trees, depicted in Fig. 3, facilitate easier referencing and analysis of the hierarchical nature of processes by classifying relationships between them.
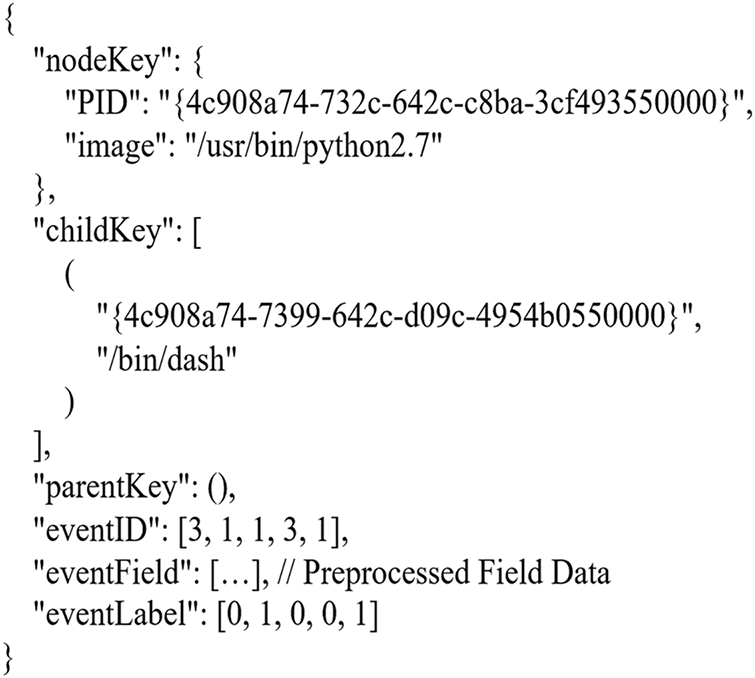
Figure 3: An example of a process tree implementation for expressing a hierarchical process structure
The data extracted in the previous step is derived from individual event logs. However, the number of key-value pairs and the total numerical data obtained from each event log vary depending on the event ID. To address this, this stage first serializes all feature information from individual event logs and applies padding to ensure a uniform length. A natural number representing the event ID is prepended to the padded data, creating a one-dimensional numerical representation of consistent length for each event log.
Event logs associated with a specific process are then arranged chronologically, with the most recent 10 event logs serialized. This approach captures state changes in the host device caused by a process as one-dimensional data.
Processes manage tasks efficiently through parent-child relationships, a characteristic that malware exploits to carry out malicious activities. To incorporate such hierarchical features, one-dimensional data derived from each process is arranged to identify and classify hidden cyberattacks within the Sysmon log effectively.
Data is placed higher in the hierarchy for processes closer to ancestors and lower for those closer to descendants. Consequently, a data processing step derives two-dimensional data from event logs. This derived data serves as input for the deep learning algorithm described in the next section and is utilized as training data for detecting malicious behavior. The pseudocode is described in Algorithm 1.
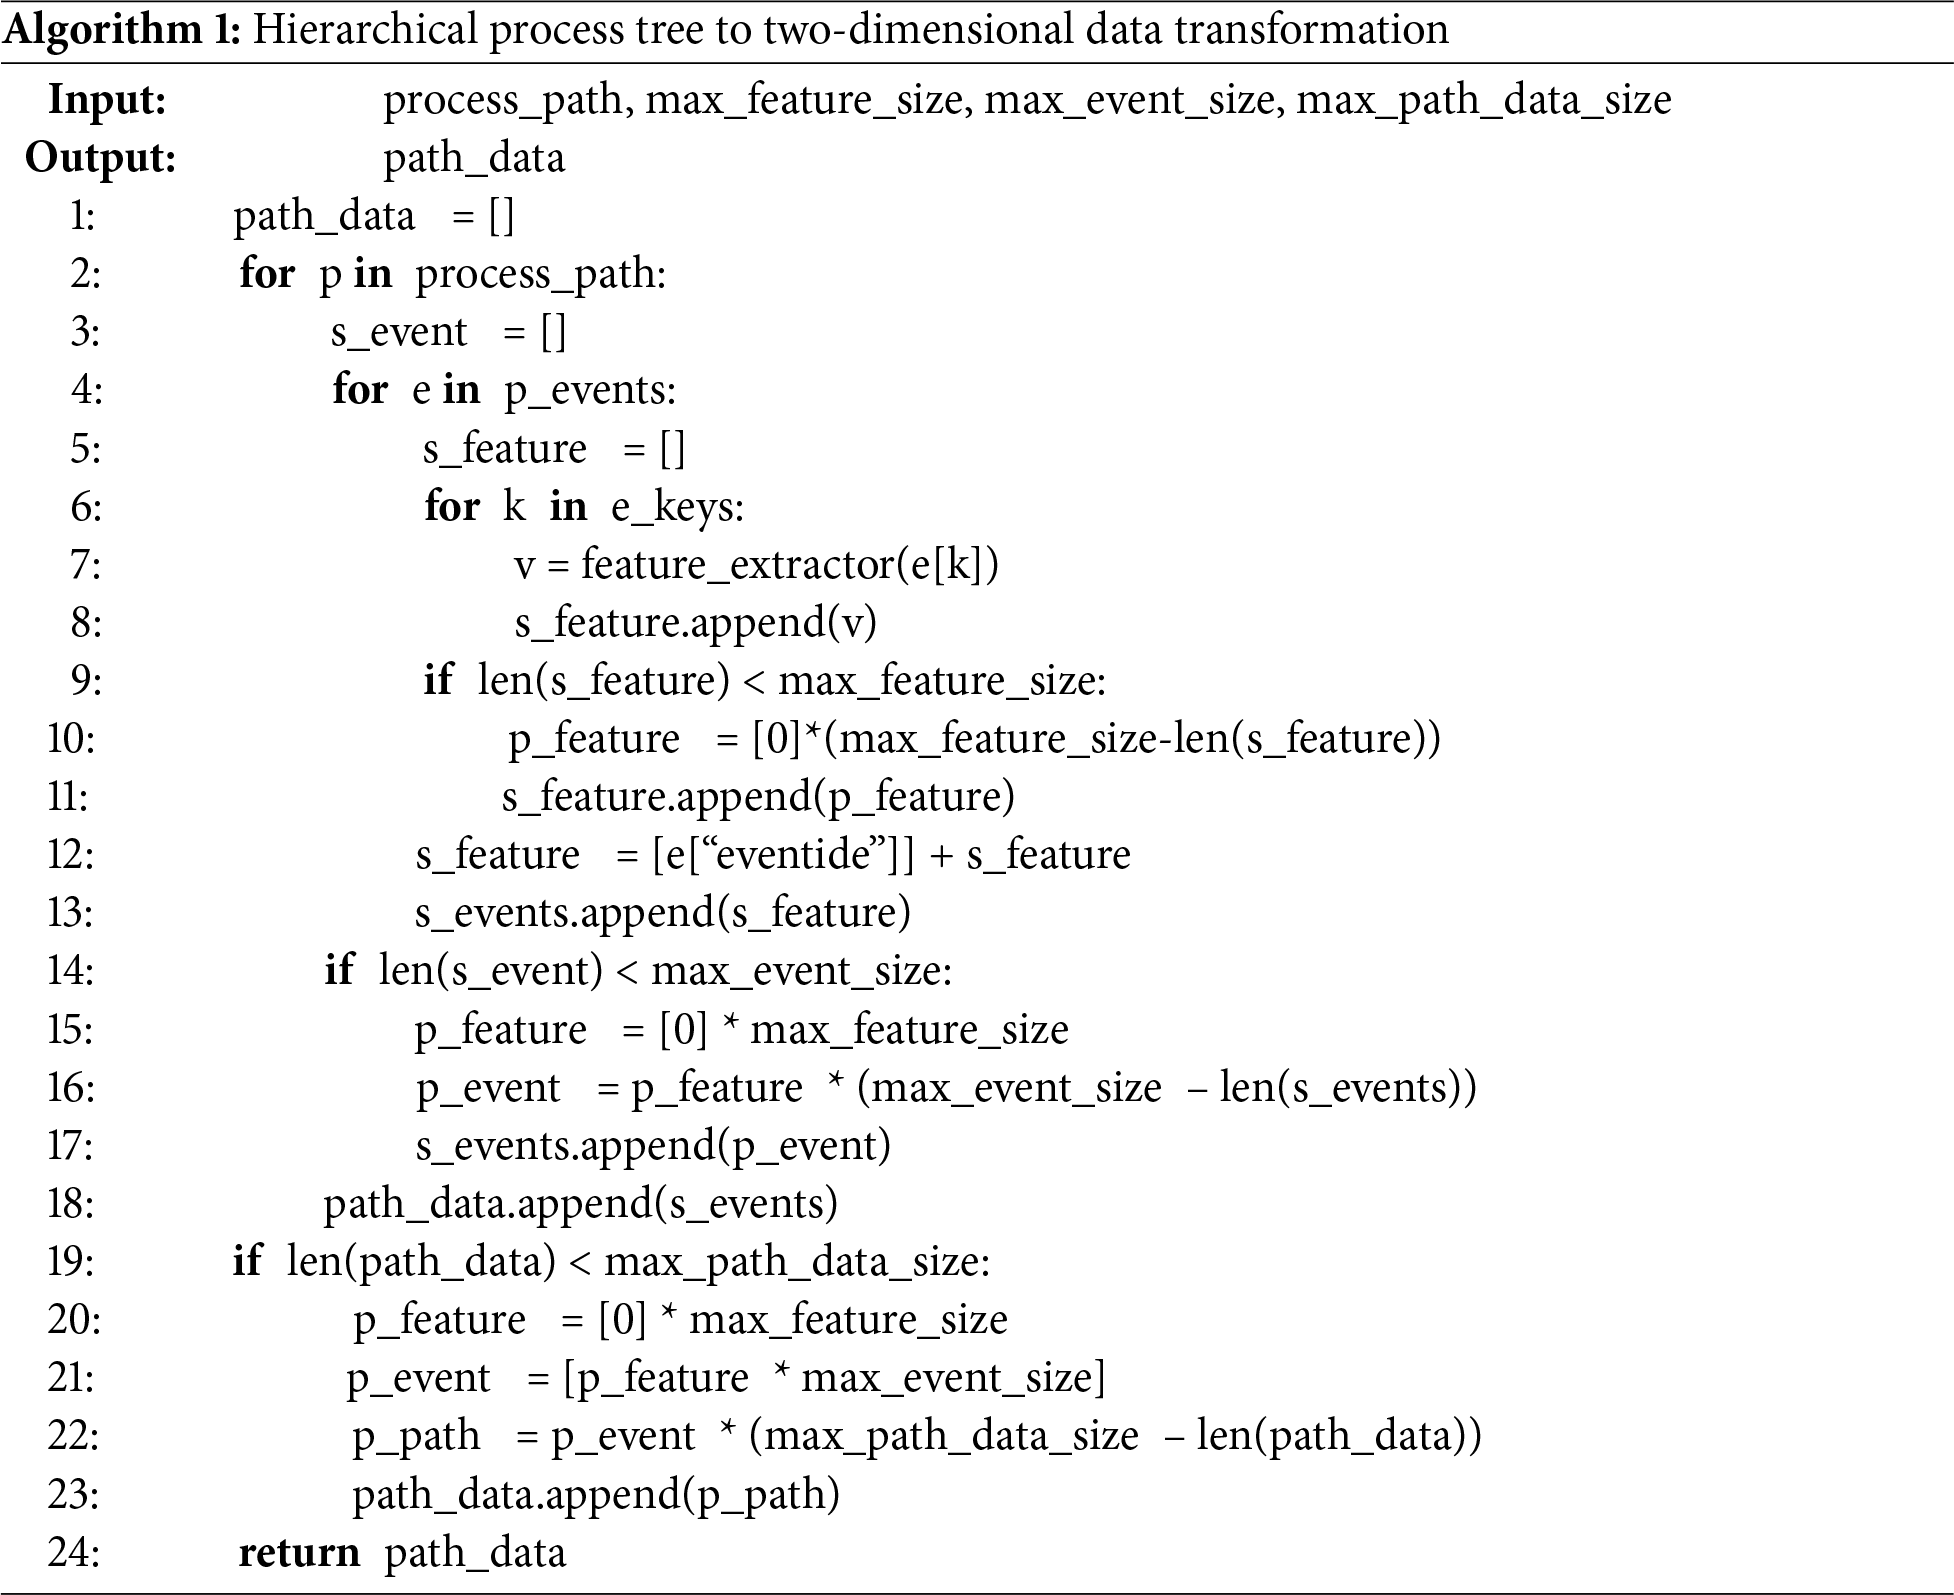
The hierarchical process structure is mathematically represented using an adjacency matrix A ∈ {0, 1}(n × n), where A[i, j] = 1 if process i is the parent of process j, and 0 otherwise. Process paths π = (p1, p2, ..., pk) are extracted following parent-child relationships where A[pi, pi+1] = 1 for all i ∈ [1, k − 1], enabling systematic transformation of hierarchical relationships into two-dimensional data representations.
Algorithm 1 has five inputs and one output. process_path is a single path derived from the process tree. It is a piece of data consisting of information about each process, along with the event information that the process is responsible for. max_feature_size, max_event_size, and max_path_data_size are variables used to adjust the size of the output data, and can be set according to the dimensionality of the input data of the deep learning model.
The field values of each event are preprocessed through the feature_extractor function and finally converted into a two-dimensional form. A schematic and explanation of this process is described in Appendix B.
3.4 Malicious Behavior Detection
The final stage of the proposed methodology involves detecting malicious behavior by applying machine learning models to the path-specific data generated in prior steps. These models process the two-dimensional data representations derived from process trees.
To identify the most effective model for this task, this study evaluates three architectures. The core goal is not to develop a novel architecture, but to validate our proposed 2D data representation by testing its different characteristics. Therefore, each model was chosen for a specific purpose: the Convolutional Neural Network (CNN) was selected to evaluate the ability to extract meaningful spatial patterns from the 2D process hierarchy, while the Long Short-Term Memory (LSTM) was used to assess the capacity to learn from the temporal sequence of events. A Hybrid CNN+LSTM model was also included to test the hypothesis that combining both features would improve performance. This hybrid architecture, in particular, has already shown promise in cybersecurity applications where spatial and temporal features must be captured simultaneously [29].
The model with the best performance metrics is selected for deployment. Evaluation metrics include accuracy, precision, recall, and F1-score, ensuring the chosen model effectively identifies patterns indicative of malicious activity. Malicious behavior detection relies on the frequency of malicious events embedded within the path-specific dataset. A threshold value is established to classify paths; if the count of malicious events in a path-specific dataset exceeds this predefined threshold, the corresponding path is labeled as containing malicious processes and events. This threshold-based classification is designed to be highly sensitive to potential threats, and the resulting trade-off with precision will be discussed further in Section 4.
This section evaluates the proposed model’s performance in detecting malicious behavior using a publicly available Sysmon log dataset containing records of malicious activities. The dataset we used for our experiments is BarongTrace [30], a Sysmon dataset released in 2024, which contains key behavioral information from executable files collected for malicious activity detection, and was created and released to classify events associated with malicious activity. The dataset includes Sysmon logs collected and analyzed using Cuckoo Sandbox. It comprises logs from benign software and logs derived from malware in the VirusShare_ELF_20190212 ZIP file released on VirusShare in 2019, a collection known for aggregating a wide variety of malware families to represent diverse real-world threats.
To classify malicious behavior using the proposed model, the following steps are applied to the dataset:
1. Event Filtering Module: The dataset undergoes event ID filtering to reduce the number of logs analyzed, focusing on those relevant for detecting malicious behavior.
2. Feature Extraction Module: A module extracts numerical data from fields within each log, converting individual event logs into one-dimensional representations.
3. Process Tree Derivation Module: A process tree derivation module identifies and utilizes hierarchical relationships among processes. This module maps relationships between processes in the dataset.
By leveraging these modules, two-dimensional data is extracted for each path in the process tree. A deep learning model trained on this data then classifies the paths to determine whether they involve malicious behavior. This workflow demonstrates the proposed model’s effectiveness in automating malicious behavior detection from Sysmon logs.
While detection using audit logs has been well researched, there are few datasets that provide information about sysmon behavior. Most researchers have conducted experiments based on proprietary audit logs and have not disclosed the datasets they used. While using proprietary datasets has the advantage of providing a clearer measure of performance in environments that meet the goals of the experiment, it also has the disadvantage of making it impossible to validate the utility of the dataset. By training on a dataset that is publicly available online, this study provides transparency into the dataset.
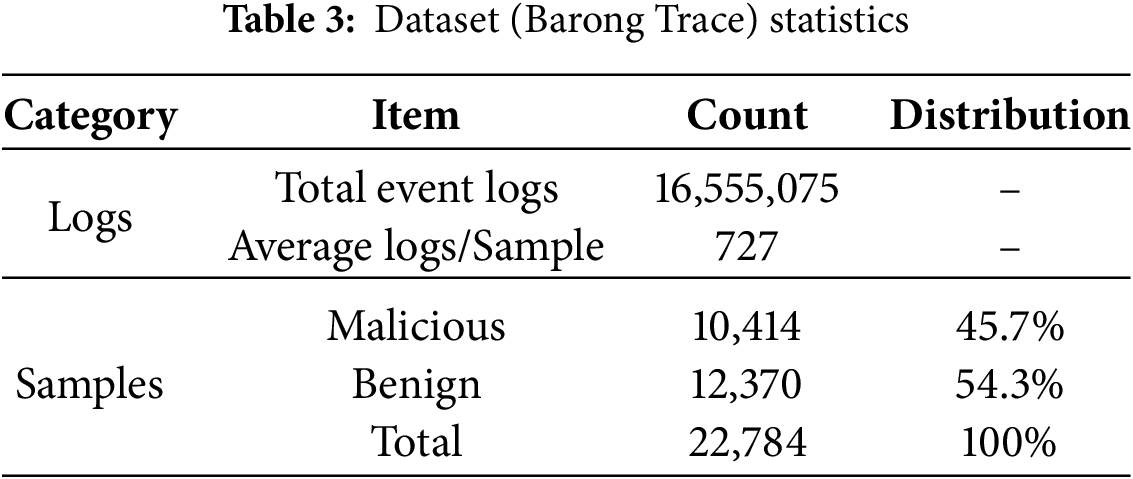
The dataset used in this study is Barong Trace, a publicly available Sysmon log dataset released in 2024 for malicious activity detection research. It was generated by executing a wide variety of malware and benign software samples from VirusShare in a Cuckoo Sandbox environment. For our experiment, we focused on five critical event IDs (1, 3, 5, 11, and 23) relevant to malicious behavior. Table 3 provides a detailed statistical summary of the dataset’s composition.
From the 42 available fields, we selected 10 attributes highly relevant to detecting malicious behavior after excluding less pertinent information such as time stamps and company names. The selection of these fields, detailed below, is critical for the model’s ability to identify suspicious patterns.
The CommandLine field records the arguments passed to an executable, providing insights into its execution’s purpose and nature. This field is particularly valuable for detecting living-off-the-land (LotL) attacks, where legitimate tools are used for malicious activities. In such cases, analyzing execution arguments is essential.
The Image field, representing a process’s file path, offers direct information about its origin and location, making it a cornerstone for identifying malicious processes. Fields related to network activity, such as DestinationHostname and DestinationIP, are critical for identifying abnormal communications, while the IntegrityLevel field is vital for detecting privilege escalation attempts. Finally, the TargetFilename field provides insights into file manipulation actions, such as the creation of malicious binaries.
Prior to model training, several preprocessing steps were applied to enhance data quality and stabilize model convergence. Continuous numerical features were normalized using min-max scaling to the range [0, 1], ensuring comparability across heterogeneous attributes. Missing values were handled by zero-padding for numerical fields and by assigning an “unknown” category for categorical fields, which mitigated potential bias introduced by incomplete log entries. Regarding class distribution, the dataset was relatively balanced (45.7% malicious vs. 54.3% benign), and thus severe imbalance was not a concern. Nevertheless, class-weight adjustments were incorporated into the loss function to reduce residual skewness and ensure unbiased optimization.
For experimental validation, the dataset was split into training, validation, and test sets using a 60:20:20 ratio. The training set (60%) was used for model parameter optimization, the validation set (20%) for hyperparameter tuning and model selection, and the test set (20%) for final performance evaluation, ensuring robust and unbiased assessment of the proposed approach.
The detection process is structured around three distinct deep-learning models, as illustrated in Fig. 4. The CNN model architecture includes three Conv2D layers for extracting spatial features from two-dimensional data, followed by two fully connected (FF) layers for classification. The LSTM model, tailored for sequential data processing, comprises three LSTM layers that capture temporal dependencies, followed by two FF layers for final classification. The hybrid CNN+LSTM model combines the strengths of both approaches, integrating two Conv2D layers for spatial feature extraction, one LSTM layer for temporal analysis, and two FF layers for classification.
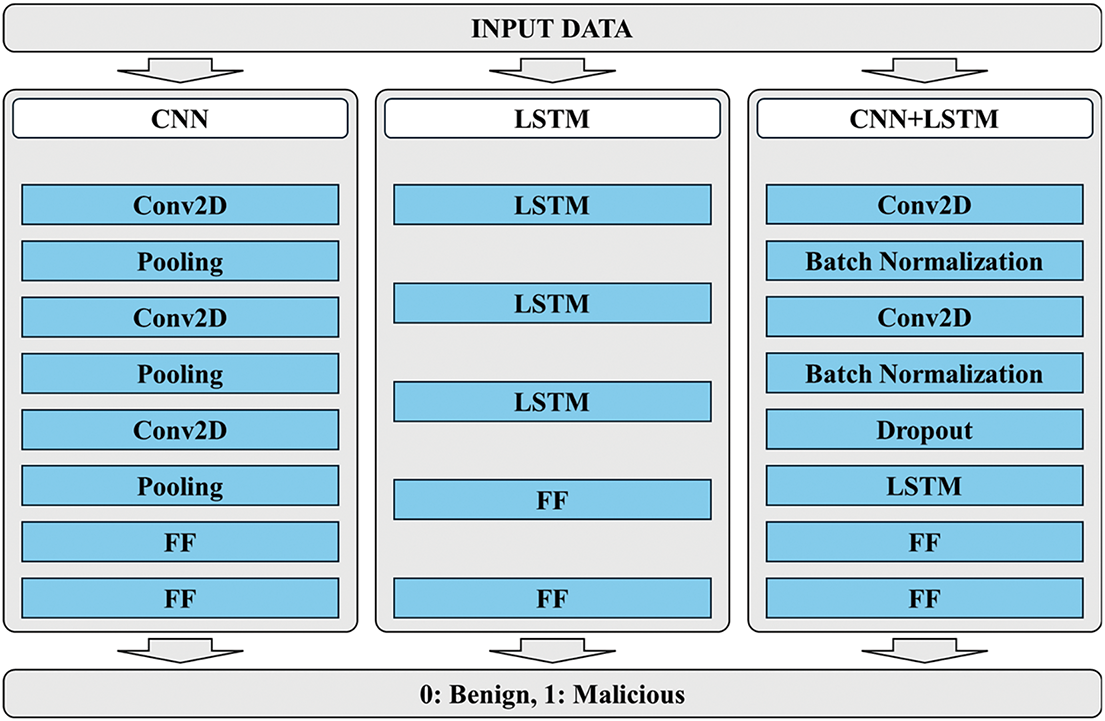
Figure 4: Configuration of three types of deep learning networks used in the experiment
The models were implemented using PyTorch, leveraging its flexibility and scalability for deep learning applications. To ensure robust performance and avoid manual tuning bias, hyperparameter optimization was systematically performed using the Optuna framework. For each model, 100 trials were conducted to explore a predefined search space, which included parameters such as learning rate, batch size, number of layers, and dropout rates. The selection criterion for the optimal configuration was the maximization of validation accuracy.
The final hyperparameters for each model were determined through this systematic optimization process. For example, the CNN model achieved its best performance with a learning rate of 0.0018 and three convolutional layers, while the LSTM model performed optimally with a learning rate of 0.0012 and three LSTM layers. A detailed summary of the hyperparameter search spaces and the selected optimal configurations for all three architectures is provided in Appendix C.1.
A key component of the detection process is the threshold for classifying a dataset as malicious. The threshold for the number of malicious events was set to 1, meaning that even a single detected suspicious event triggers a flag for further analysis by security administrators. This low threshold prioritizes sensitivity, minimizing the risk of overlooking potential threats. This choice deliberately prioritizes high recall (sensitivity) over precision to ensure all potential threats are flagged for analyst review. The implications of this trade-off are analyzed further in the following section.
The models’ performance detecting malicious behavior is evaluated using four key metrics: accuracy, precision, recall, and F1 score. These metrics collectively offer a comprehensive assessment of the models’ effectiveness, capturing their correctness, reliability, and sensitivity. Accuracy measures the overall correctness of predictions, precision evaluates the reliability of positive predictions, recall assesses the model’s sensitivity to true positives, and the F1 score provides a balanced measure of precision and recall. Through this rigorous evaluation framework, the study ensures that the selected model achieves high performance and meets the practical requirements of cybersecurity systems, such as reliability in flagging threats and minimizing false negatives.
Each event log is serialized into a dataset comprising 21 numeric data values, including the event ID, with padding applied as described in the previous section. Each process is represented by the last 10 events, resulting in a dataset of 210 numeric values per process. After deriving the process tree, the numeric data is arranged in a two-dimensional plane, with paths restricted to a maximum height of 16. This approach represents the process tree paths containing 3360 numeric data points. Detailed training curves and convergence analysis for the three deep learning models are provided in Appendix C.2.
Fig. 5 shows an example of the derived data. The data is stored in JSON format and characterized using three types of information:
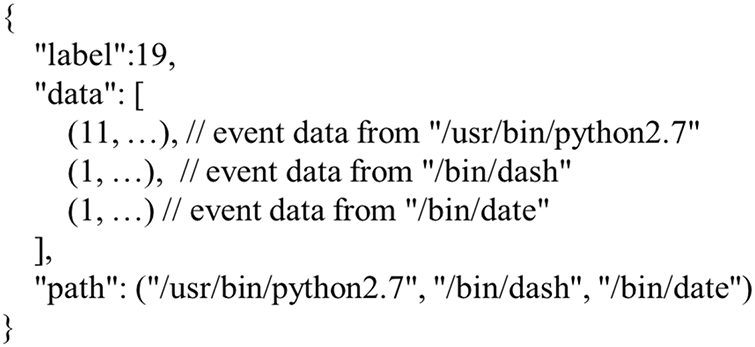
Figure 5: An example of a JSON file derived from a dataset
• Label: An integer indicating the number of malicious events within the corresponding two-dimensional data.
• Data: Path data information consisting of 3360 numeric values.
• Path: A list of images representing the processes that comprise the path, listed in order.
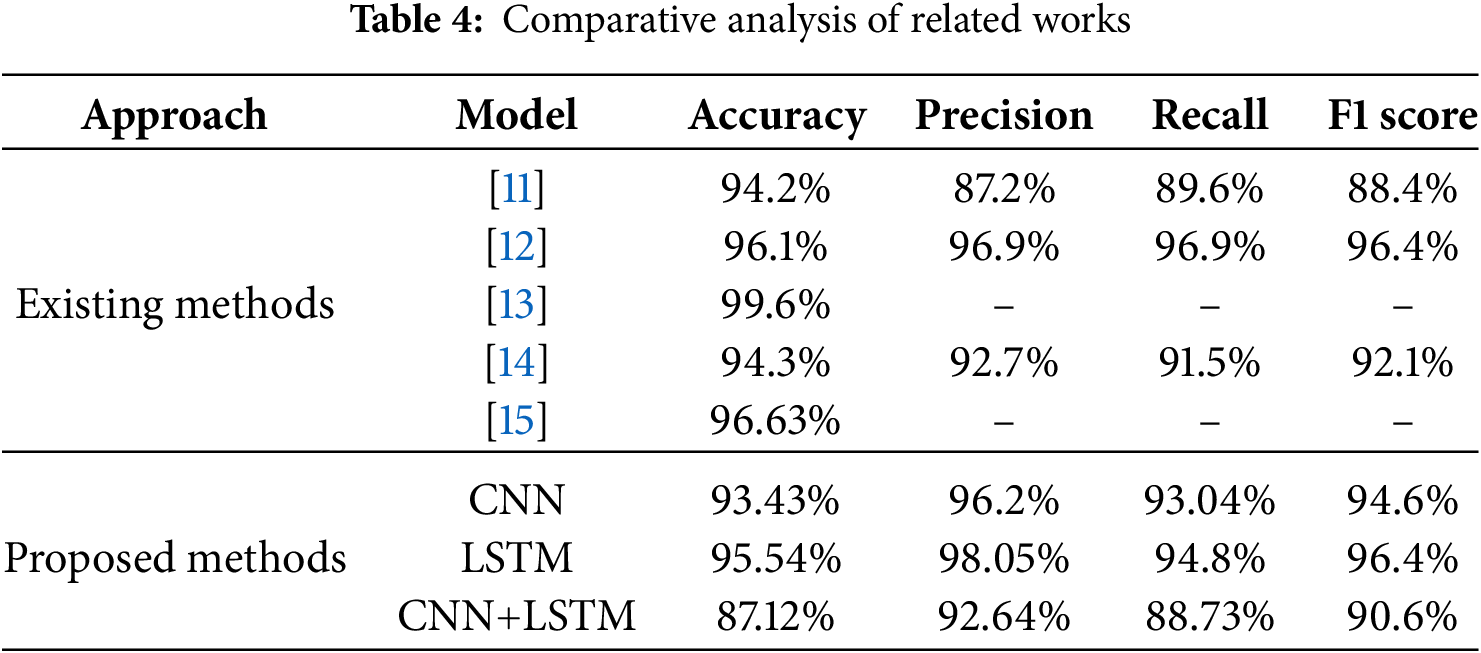
Table 4 presents a comprehensive comparison of our proposed models with related works. Our LSTM model achieved the highest performance with 95.54% accuracy and a 0.9640 F1-score. To validate this superiority, we conducted paired t-tests on the results from five independent training runs with different random seeds. The tests confirmed that the LSTM model’s performance was statistically significant compared to both the CNN (p = 0.0032) and the CNN+LSTM (p = 0.0018) models. This statistical validation, detailed further in Appendix C.3, substantiates that the observed performance gap is not due to random chance. While this accuracy is numerically comparable to some prior studies [12,13], it is crucial to note two aspects of our results. First, this performance was achieved using only host-level audit logs, confirming its viability in network-isolated or air-gapped environments. Second, our validation on the publicly available BarongTrace dataset enhances transparency and reproducibility, addressing a common limitation in many studies that rely on proprietary data.
Direct numerical comparison with some studies [10,17] is challenging as they do not report comprehensive accuracy metrics. For instance, prior work [17] focuses on false positive rate reduction (1.98%) rather than overall accuracy, while another study [10] emphasizes feature identification and extraction methodologies without detailed performance metrics.
Notably, most comparative studies [10–13,15,17] utilize proprietary datasets or specialized environments (Cuckoo Sandbox), limiting reproducibility and direct comparison. Our use of the publicly available BarongTrace dataset enhances experimental transparency and enables future comparative studies.
For baseline comparisons, we referred to the BarongTrace study [30], which reported results for Random Forest (RF), Isolation Forest (IF), One-Class SVM (OC-SVM), and Local Outlier Factor (LOF). Specifically, RF was configured with 100 trees and a maximum depth of 20, IF with 100 estimators and a contamination parameter of 0.1, OC-SVM with an RBF kernel (ν = 0.1, γ = scale), and LOF with 20 neighbors. The baseline performance values shown in Fig. 6 are consistent with those reported in [30] and are included here to contextualize the effectiveness of our proposed approach.
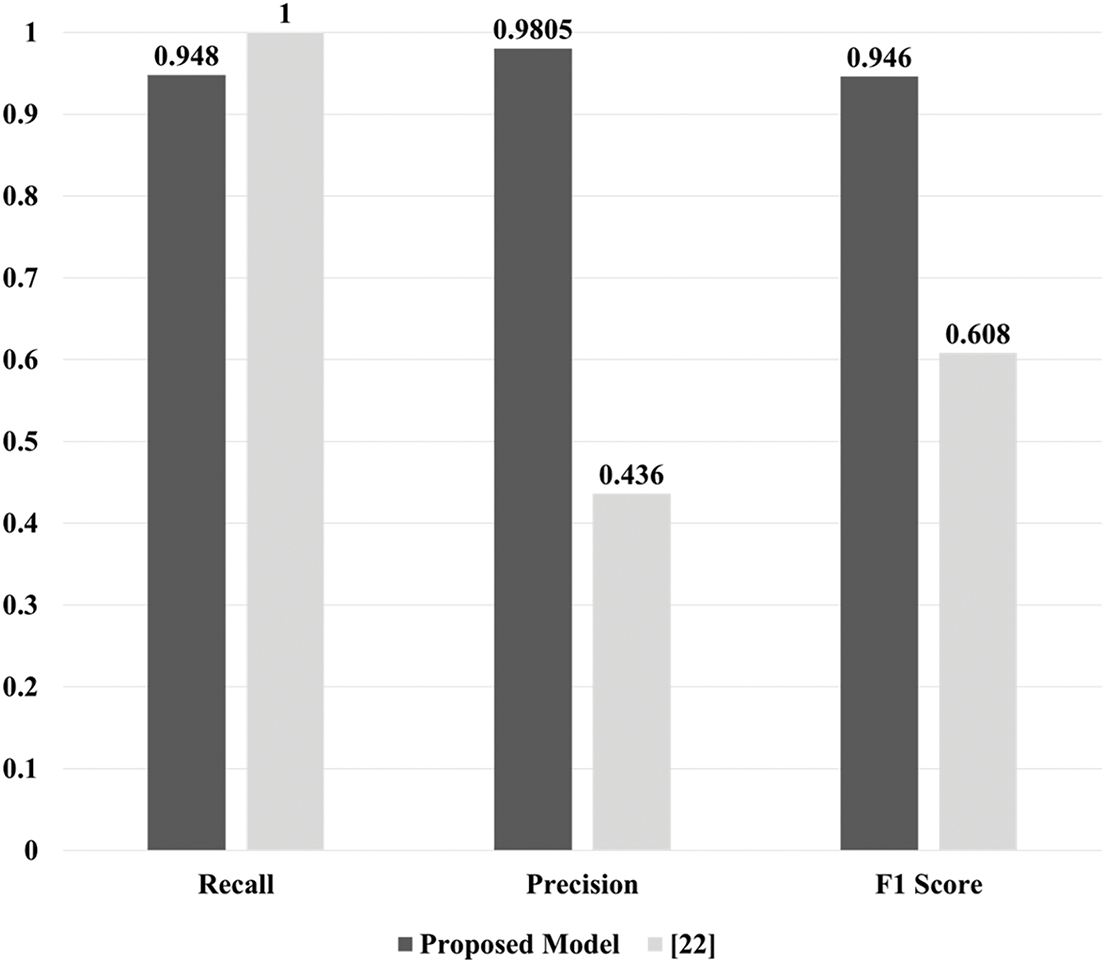
Figure 6: Performance comparison with existing experiments on the same dataset
A notable observation from these results is the importance of understanding the sequence in which malicious activities occur. Here, “sequence” refers to the chronological order of events along a temporal axis and their hierarchical order based on structural relationships. Models in the comparative study excluded these sequential characteristics, instead using four algorithms—random forest, isolation forest, one-class support vector machine (SVM), and local outlier factor—to evaluate performance. These models exhibited strong detection performance for malicious activities but showed lower precision relative to recall, indicating a higher likelihood of false positives for certain benign events.
In contrast, while the proposed model’s detection rate for malicious activities was slightly lower than those of these baseline methods, it enhanced overall reliability and trustworthiness. These results indicate that improving data representation embedded in two-dimensional space could further enhance the model’s performance in future research.
5.1 Strength & Implications of Hierarchical Analysis
The experimental results highlight the efficacy of our hierarchical analysis. A key distinguishing feature is the two-dimensional structuring of audit logs, which allowed the model to achieve high accuracy using only host-based audit logs. This is particularly significant as it demonstrates the potential of our approach in environments with limited data sources, such as network-isolated industrial control systems or infrastructures where comprehensive network monitoring is not feasible. Our findings confirm that rich, actionable context for threat detection can be extracted exclusively from host-level process hierarchies, reducing the reliance on external data sources.
Another distinctive aspect is our reliance on entropy-based features over semantic embeddings. As argued in Section 4.2, this choice was tailored for the non-natural language and often obfuscated structure of audit log strings, such as randomly generated executable names or encoded command-line arguments. While our study did not include a direct empirical comparison against embedding techniques—a recognized limitation—we hypothesize that our approach is more robust for identifying such structurally-random patterns common in modern malware. Verifying this through comparative experiments remains a key direction for future work.
5.2 Analysis of Model Performance
To further demonstrate the interpretability of the proposed framework, we present a case study based on a multi-process malicious chain extracted from the BarongTrace dataset. Fig. 7 illustrates the proposed two-dimensional (2D) spatio-temporal representation for the process path powershell.exe → mshta.exe → regsvr32.exe → rundll32.exe → cmd.exe. The vertical axis encodes the parent–child process hierarchy, while the horizontal axis represents event chronology. Each cell denotes an aggregated normalized feature activation, derived from multiple preprocessed indicators including string entropy, file-path and registry-path complexity, extension encoding, IP–octet decomposition, keyword/length statistics, and event-type flags.
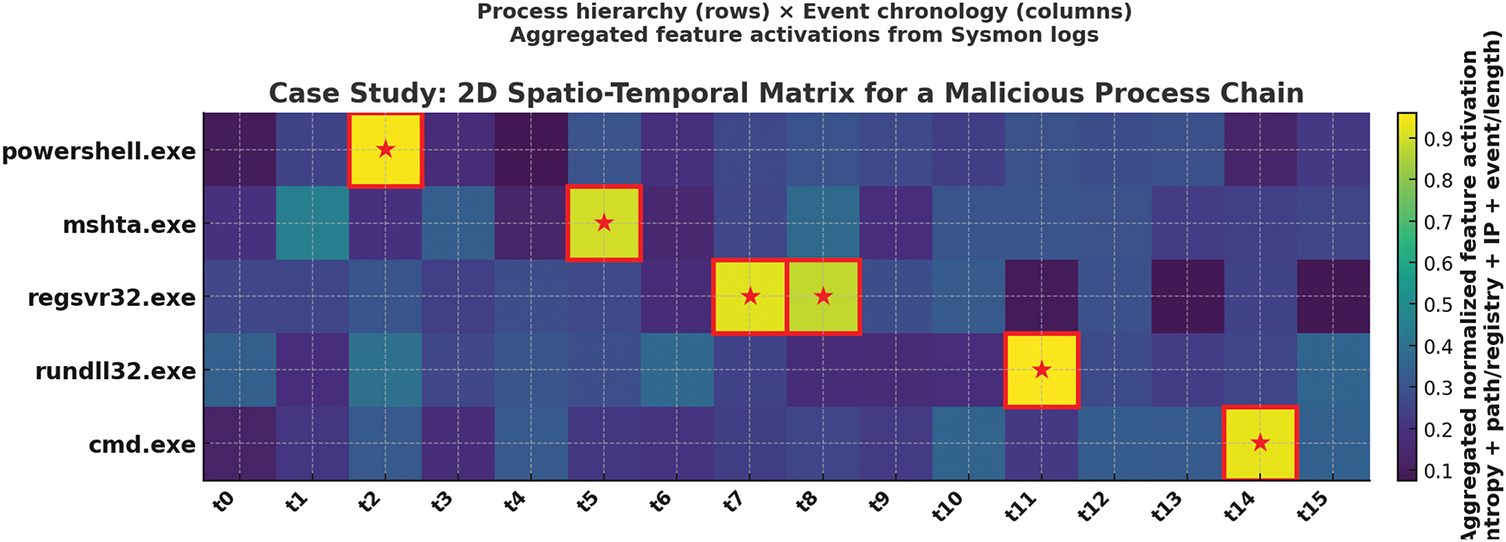
Figure 7: 2D spatio-temporal representation of a malicious process chain
In this example, powershell.exe at t2 exhibits a markedly high entropy score due to Base64 obfuscation in its command-line string. At t5, mshta.exe triggers abnormal network-related features (DestinationHostname and IP octets) indicative of a potential C2 connection. regsvr32.exe at t7–t8 reveals increased registry-path complexity, while rundll32.exe at t11 highlights anomalous DLL loading patterns. Finally, cmd.exe at t14 produces token- and length-based anomalies consistent with privilege escalation attempts. By aggregating heterogeneous indicators across both structural (process hierarchy) and temporal (event sequence) dimensions, the proposed representation exposes coordinated, multi-process attack patterns that would likely remain hidden in flat sequence-based models.
A notable outcome of our experiments was the comparatively poor and unstable performance of the hybrid CNN+LSTM model. As shown in Table 4 and the training curves in Appendix C, this model not only achieved the lowest accuracy but also exhibited the most significant overfitting, with a validation accuracy gap of over 3%. Two primary technical challenges likely contributed to this result.
First, the combination of convolutional and recurrent layers substantially increases the model’s complexity and total number of trainable parameters. While powerful, such complex architectures require vast amounts of data to generalize well and are highly susceptible to overfitting on moderately-sized datasets. The model likely learned to memorize noise and artifacts specific to the training data rather than a generalizable representation of malicious behavior, as evidenced by its poor validation performance.
Second, and perhaps more critically, is the inherent architectural challenge of effectively fusing features from the two different network types. The CNN layers excel at extracting spatially-local patterns from the 2D data representation, outputting a set of feature maps. However, the LSTM layer requires a sequential, one-dimensional input. The transition between these data shapes is a critical design step. A simple flattening of the CNN’s output can destroy the spatial context the convolutional filters learned, providing the LSTM with a less meaningful sequence. This information bottleneck at the fusion point is a common hurdle in hybrid models and likely hindered the model’s ability to synergize the spatial and temporal patterns effectively.
To mitigate these limitations, we recommend several strategies. Regularization techniques such as dropout (p = 0.5), L2 weight decay, and early stopping can reduce overfitting risks associated with the large parameter space. Furthermore, process-tree-level data augmentation (e.g., randomized subtree sampling) could enhance generalization. Architectural refinements, such as preserving spatial information through sequence-preserving pooling instead of simple flattening, or simplifying the network depth and hidden dimensions, may also help overcome the information bottleneck. These adjustments would enable hybrid architectures to retain their theoretical advantages while achieving more stable performance on Sysmon-scale datasets.
5.3 Performance Comparison with Related Works
In Section 2, we reviewed representative graph-based approaches for detecting malicious behavior [17–19]. We also examined behavioral and sequence-based approaches that model temporal execution patterns, including representative studies [10,11,21]. Additional behavioral studies were also considered to broaden the comparison [22–24]. The key analytical perspectives and the differences between these studies and our proposed model are summarized in Table 1, which highlights the technical advantages of our approach.
However, several limitations were identified during the analysis process. First, the performance evaluation metrics adopted in each study were different, making it difficult to perform a simple numerical comparison. For example, some studies focused on Precision and Recall, while others used metrics such as F1-score or AUC-ROC. These differences acted as factors that undermined the objectivity of performance comparisons.
Second, the types of malicious behaviors targeted for detection varied across studies, limiting the scope of quantitative comparisons. Some studies focused on specific attack types such as ransomware or cryptojacking, while others aimed at detecting more generalized abnormal behaviors. As a result, the scope of application and detection accuracy of the models were set under different criteria, making it difficult to determine superiority under the same criteria.
Nevertheless, the proposed model demonstrated high detection performance against various types of malicious behavior by analyzing event log data and adopting a structure that effectively reflects time-series information. In particular, the quantitative results presented in the experiments showed superior performance compared to some previous studies conducted under similar conditions. This suggests that the approach of this study can achieve competitive performance even in more generalized environments.
In summary, by comparing with existing studies, we have identified the technical strengths and practical advantages of the proposed model, and this analysis can serve as a foundation for designing more sophisticated benchmarking environments in the future.
5.4 Performance Changes over Thresholds
Our model classifies a path as malicious based on a threshold of a single malicious event. To quantitatively analyze the implications of this choice, we evaluated the model’s performance at varying thresholds. As shown in Fig. 8, the graph illustrates a classic precision-recall trade-off: increasing the detection threshold results in higher precision but lower recall.
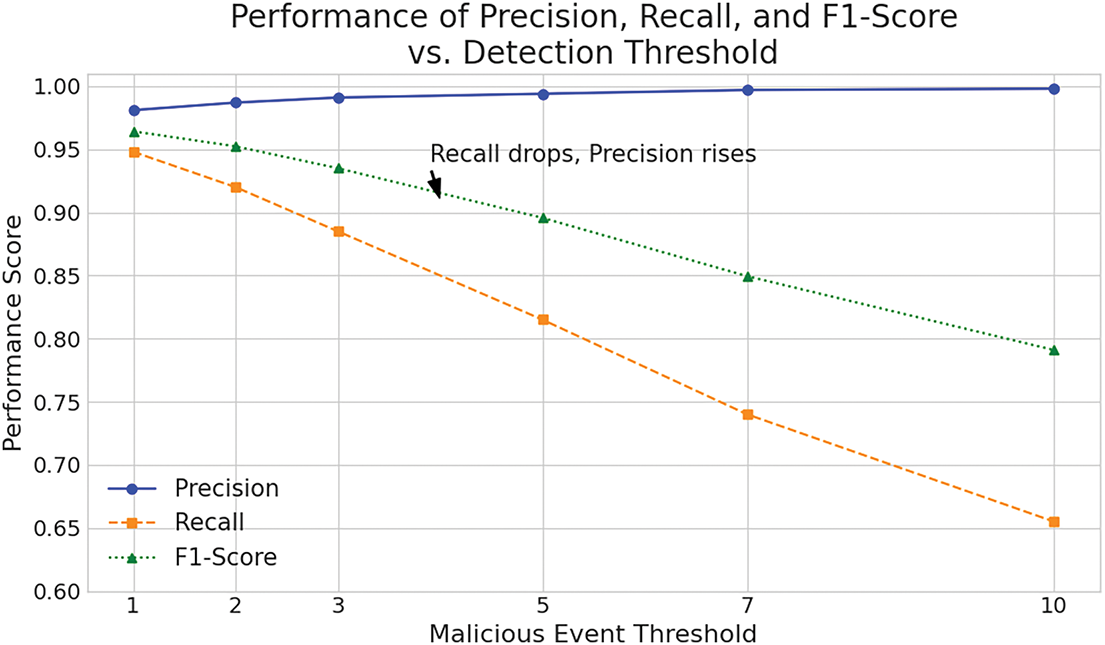
Figure 8: Performance of precision, recall, and F1-score vs. detection threshold
This analysis confirms that our low-threshold approach is a deliberate strategy to minimize false negatives, ensuring that potential threats are not overlooked. This method enhances responsiveness in hostile environments by alerting security professionals to all possible threat scenarios, which is reflected in the high recall achieved at the lowest threshold.
However, this sensitivity comes with a trade-off. As the number of events classified as malicious increases, detection systems risk becoming less reliable and inefficient in terms of time and resource usage, potentially leading to analyst fatigue. This highlights the critical challenge of balancing comprehensive detection with operational efficiency. The clear trend in Fig. 8 demonstrates that the model is tunable, allowing organizations to adjust the threshold to meet their specific risk tolerance and operational capacity.
5.5 Limitations and Future Work
This study, while demonstrating a promising approach, has several limitations that present clear opportunities for future research.
First, our validation was conducted on a single public dataset, BarongTrace. While this dataset is diverse, certain event details were omitted during its creation, resulting in incomplete behavioral information. The general scarcity of large-scale, publicly available Sysmon datasets with preserved process hierarchies makes it challenging to claim universal applicability and fully test the model’s generalization capabilities against a wider range of threats.
Second, while our proposed complexity measure showed strong empirical results, this study lacks a direct ablation study to isolate the specific contribution of the ek scaling factor. Furthermore, we did not perform a comparative analysis against other well-established feature extraction baselines, such as standard Shannon entropy or normalized entropy. Therefore, while our theoretical rationale for targeting structural randomness is strong, the superiority of our specific formula over these alternatives remains a well-founded hypothesis rather than a proven fact. Conducting these comparative experiments is a critical task for our future work.
Finally, our study did not evaluate metrics essential for practical deployment in a Security Operations Center (SOC). Issues of scalability, such as inference time per event sequence and memory consumption, were not measured. Therefore, the model’s feasibility in a high-throughput, real-time enterprise environment remains an open question. In particular, while Appendix C reports training time and memory consumption, we did not evaluate inference latency or throughput under realistic enterprise workloads, which represents an additional limitation. Another limitation concerns adversarial evasion: attackers may suppress or tamper with logging services, inject benign-looking processes, or manipulate parent–child relationships to obscure malicious behavior. Although not examined in our current experiments, these evasion vectors pose practical risks to deployment.
To address these limitations, our future work will proceed in several key directions. First, we plan to develop a framework for generating new labeled Sysmon datasets and will validate our model’s generalization capabilities across these and other benchmarks.
Second, we will enhance our modeling and feature analysis. This includes conducting a direct empirical comparison of our entropy-based features against modern embedding techniques. We also plan to expand our detection framework beyond the current path-based model by implementing the proposed process-centric and event-centric models. Combining these three perspectives could create a robust detection ensemble. Furthermore, we will explore the innovative approach of transforming the 2D path data into grayscale images. This would allow the application of powerful computer vision models, such as You Only Look Once (YOLO) v4, to identify abnormal pixel patterns that correspond to malicious events [31].
Third, we clarify that future studies will systematically conduct ablation experiments to isolate the contribution of (i) hierarchical process representation, (ii) entropy-based features, and (iii) architectural variants (CNN, LSTM, CNN+LSTM), thereby providing empirical evidence for the necessity of each design choice.
Finally, we will focus on refining the model for practical deployment and classification. This involves optimizing the architecture for computational efficiency to measure and improve inference time and memory usage. Future experiments will address this gap by profiling end-to-end inference efficiency and by exploring strategies such as model pruning, batch inference, and lightweight encoders to reduce computational overhead in high-volume SOC environments. In parallel, we plan to incorporate robustness assessments and adversarial training strategies to strengthen detection against adversarial manipulations such as log suppression, process injection, and parent–child spoofing.
Cyber threats often evade detection by exploiting the complex parent-child relationships among processes. To address this, this study introduced structure-aware behavioral detection, a novel paradigm for analyzing audit logs. Our key contribution is a methodology that transforms the spatial process hierarchy and the temporal event sequence into a unified two-dimensional (2D) data representation. By applying a deep learning model to this structure, we enable a more holistic analysis of malicious behaviors that span multiple related processes.
We validated our model’s effectiveness using a large, publicly available Sysmon dataset, demonstrating competitive performance using only host-level logs. This confirms the approach’s viability for incident analysis in diverse environments, including those with network restrictions. While this research establishes a strong proof-of-concept, we acknowledge its limitations regarding empirical comparisons, generalization, and real-time deployment, as detailed in Section 5.
This research lays the foundation for more sophisticated threat detection systems. Future work will focus on expanding this framework by developing a multi-perspective detection ensemble, exploring advanced feature representations like computer vision techniques, and optimizing the model for scalability and integration with SIEM systems. Ultimately, our goal is to advance the state of the art in cyber threat detection, providing a robust solution for identifying previously unknown zero-day attacks and insider threats.
Acknowledgement: We would like to express our sincere gratitude to our colleagues at the System Security Research Center in Chonnam National University for their helpful discussions and support.
Funding Statement: This work was supported by the Nuclear Safety Research Program through Korea Foundation of Nuclear Safety (KoFONS) using the financial resource granted by the Nuclear Safety and Security Commission (NSSC) of the Republic of Korea (Grant number: 2106061, 50%). and This research was supported by the Institute of Information & Communications Technology Planning & Evaluation (IITP) grant funded by the Korea government (MSIT) (RS-2025-25394739, Development of Security Enhancement Technology for Industrial Control Systems Based on S/HBOM Supply Chain Protection, 50%).
Author Contributions: The authors confirm contribution to the paper as follows: conceptualization, Seong-Su Yoon and Ieck-Chae Euom; methodology, Seong-Su Yoon; validation, Seong-Su Yoon, Dong-Hyuk Shin and Ieck-Chae Euom; investigation, Seong-Su Yoon; data curation, Seong-Su Yoon; resources, Dong-Hyuk Shin; writing—original draft, Seong-Su Yoon; writing—review & editing, Dong-Hyuk Shin and Ieck-Chae Euom; visualization, Dong-Hyuk Shin; supervision, Ieck-Chae Euom; project administration, Ieck-Chae Euom; funding acquisition, Ieck-Chae Euom. All authors reviewed the results and approved the final version of the manuscript.
Availability of Data and Materials: The data that support the findings of this study are publicly available at https://github.com/bazz-066/linux-malware-dataset (accessed on 14 October 2025). Additional data and materials can also be obtained from the first authors upon reasonable request.
Ethics Approval: Not applicable.
Conflicts of Interest: The authors declare no conflicts of interest to report regarding the present study.
Appendix A Techniques Associated with Data Source
Each technique in the frame specifies data sources most relevant for its detection. These sources provide artifacts essential for analyzing the execution of specific techniques—an in-depth review of the 40 techniques identified 29 data sources with substantial relevance. Table A1 summarizes these data sources, categorized into four groups: host, application, network, and others.
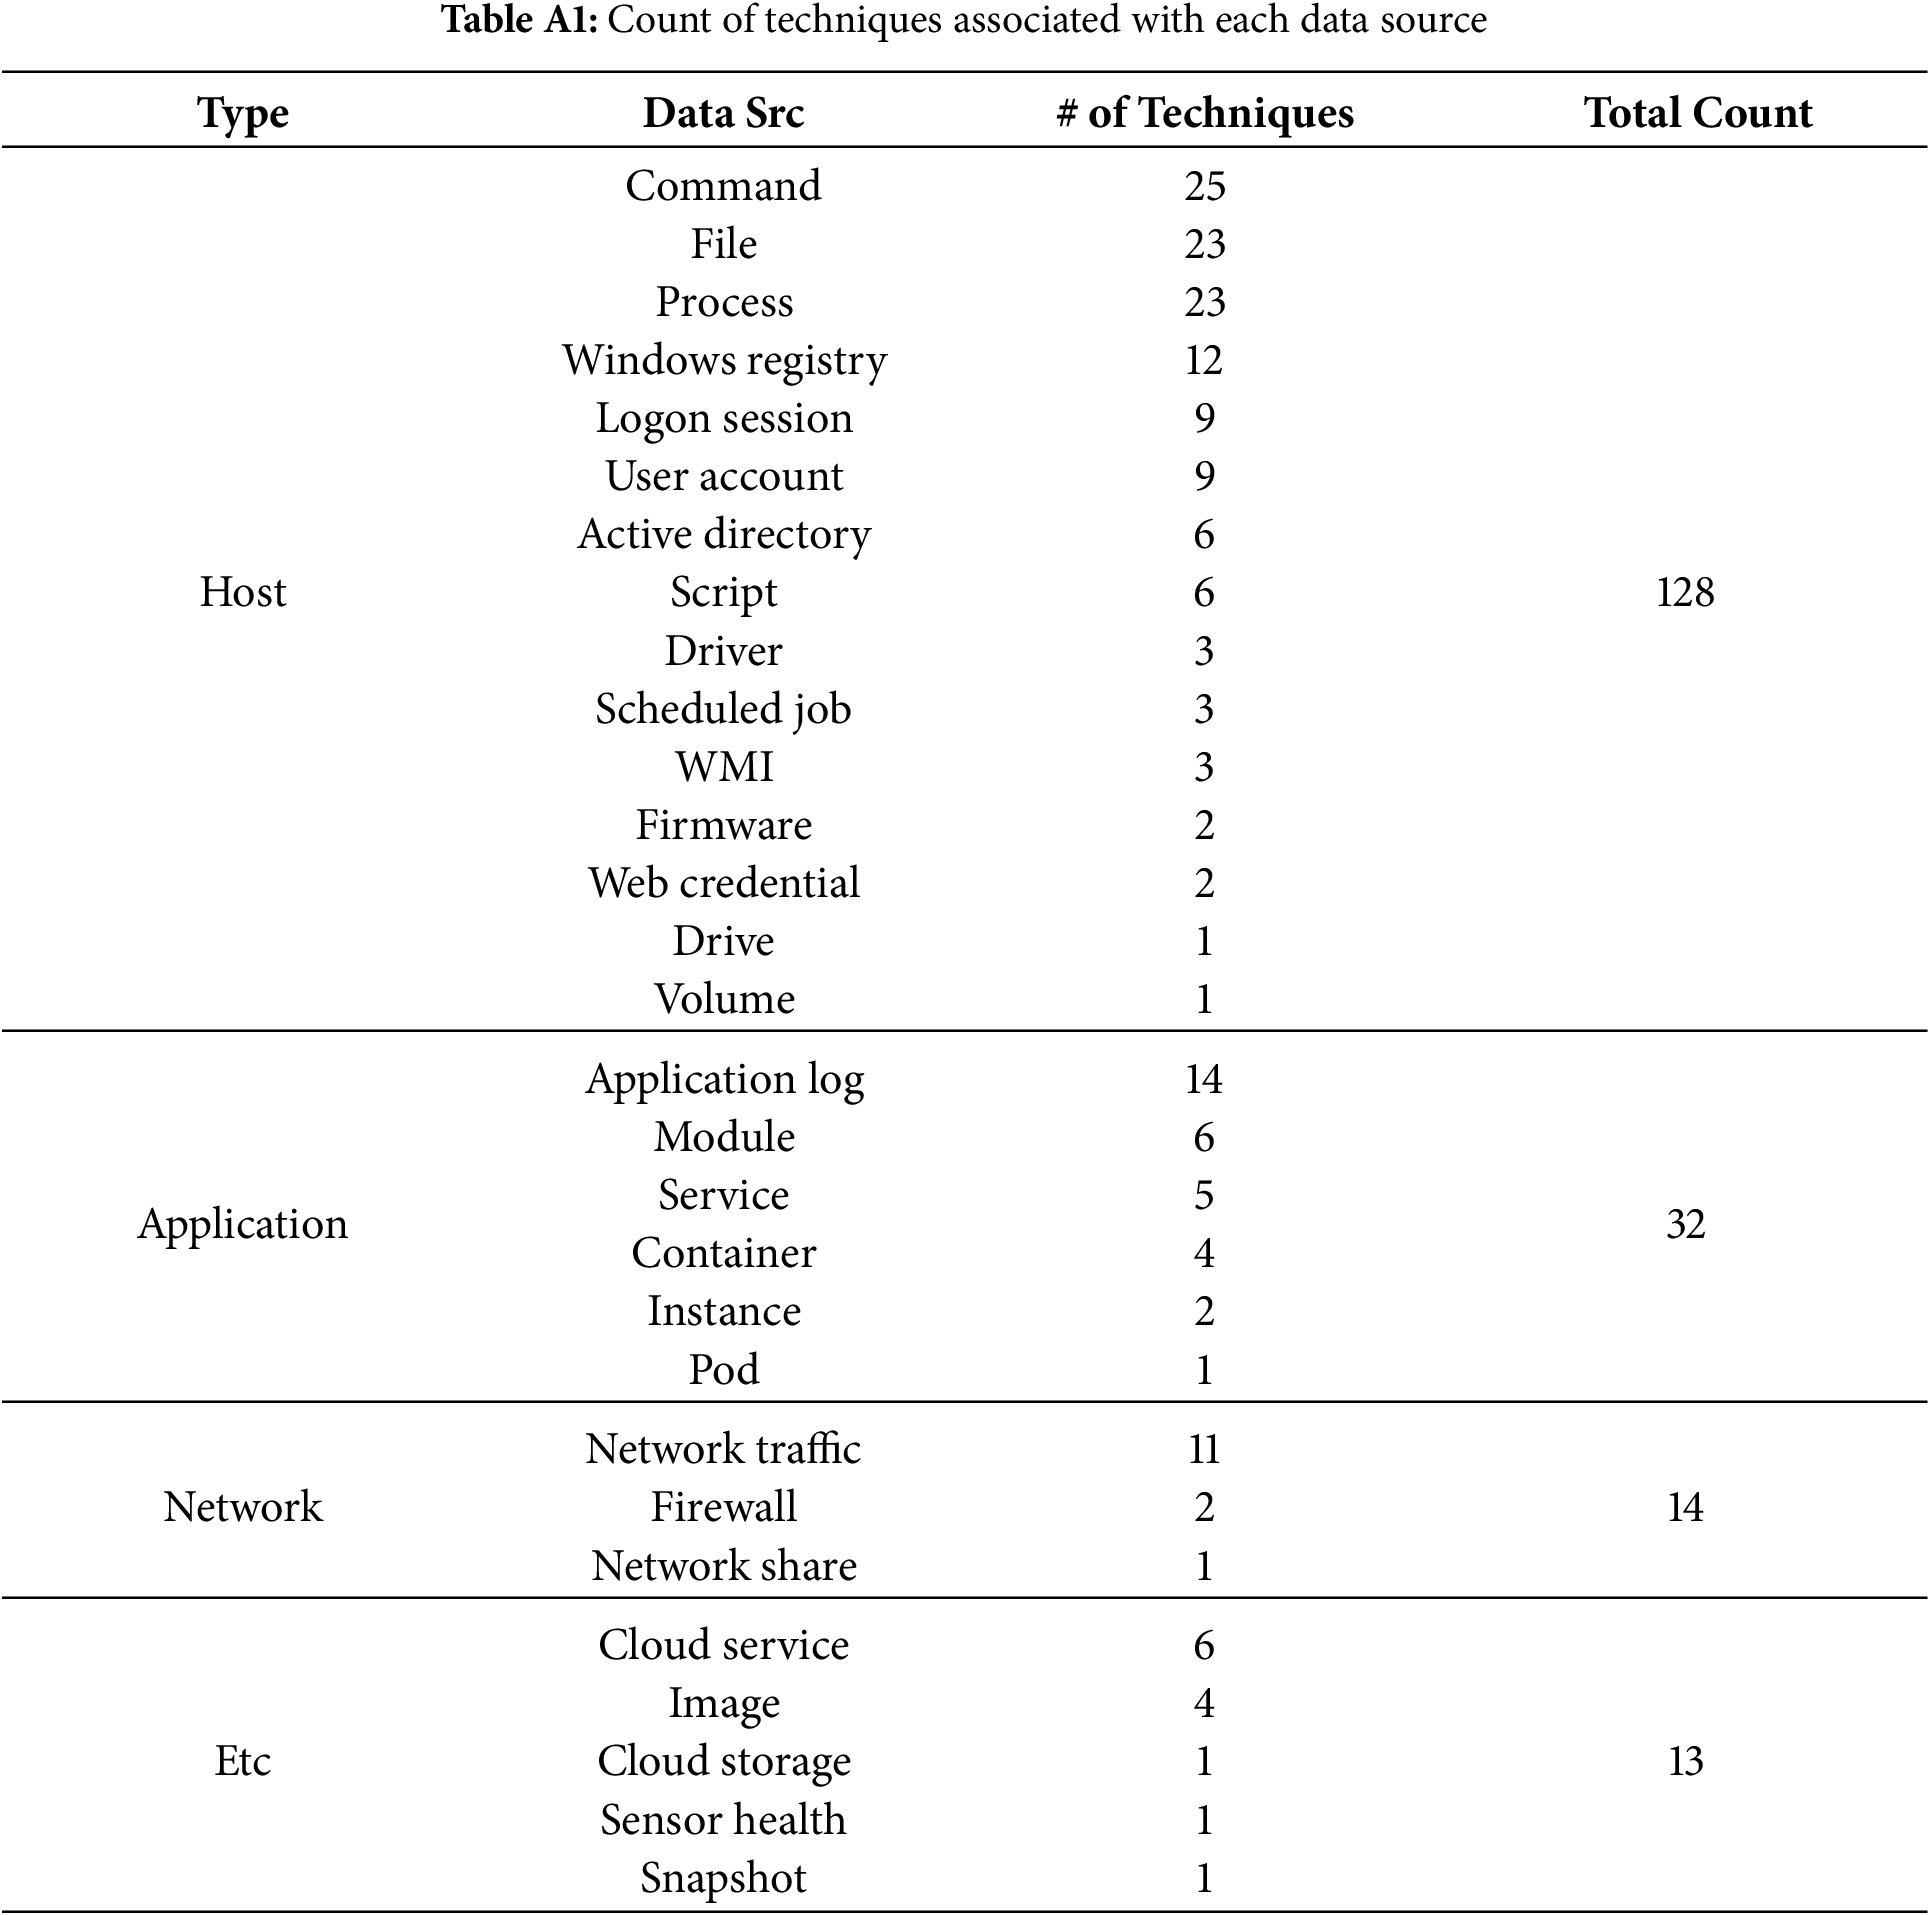
“Host” tracks local system and user activity. “Application” captures application status and event data but is less effective in monitoring systemic device elements. “Network” includes data on network connections and traffic, such as communication with external devices. “Other” encompasses lesser-known environments and operational conditions, such as cloud-based data.
Among these, the data source containing the most artifacts related to malicious techniques is “command,” followed by “file” and “process.” “Command” refers to directives issued to a computer program or interpreter to execute specific tasks. “File” represents a computer resource managed by the I/O system, used for storing data types such as text, images, and executable programs. “Process” refers to instances of programs executed by one or more threads. Each process includes allocated memory regions containing executables, modules (e.g., dynamic link libraries (DLLs) or shared libraries), user input, and application-specific data structures.
Appendix B Example of a Process Tree Implementation
Fig. A1 depicts the process of extracting two-dimensional data from audit logs. Audit logs consist of various fields, each of which is represented by a key-value pair. The values of each field are converted to numeric data using a predefined method and represented as new key-value pairs.
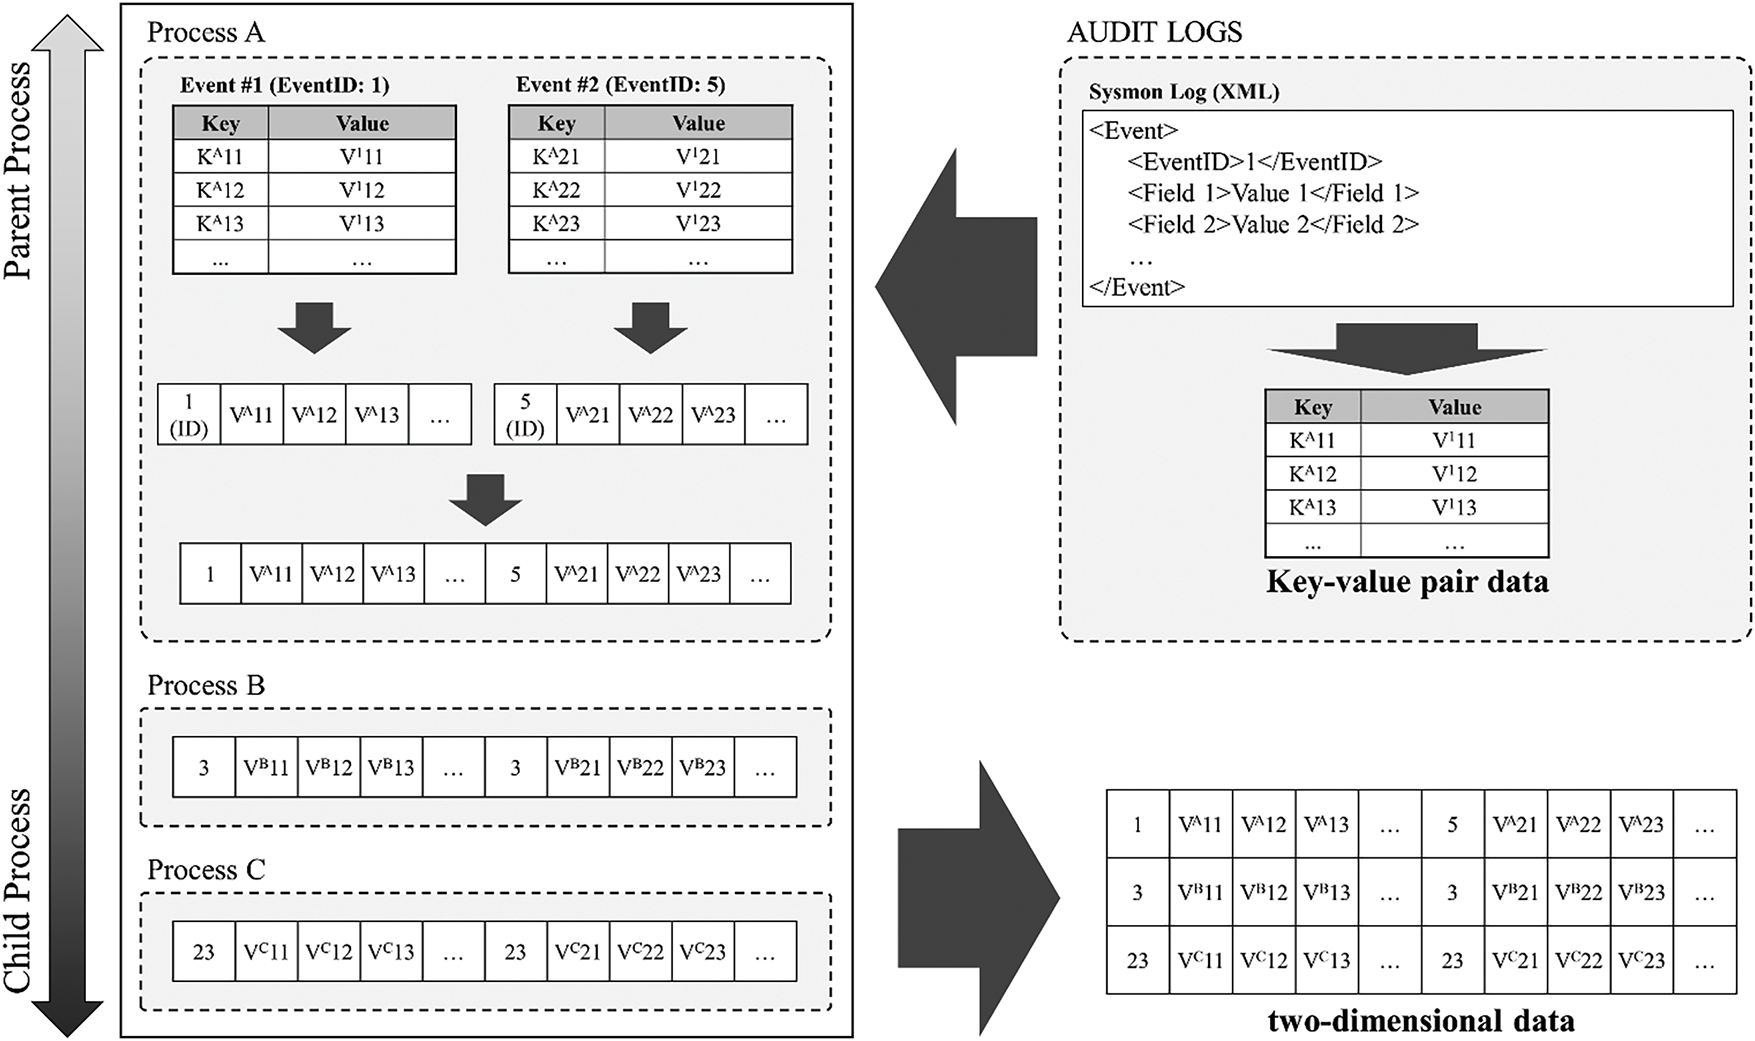
Figure A1: An example of a process tree implementation for expressing a hierarchical process structure
Each value is then serialized so that an event is stored in a one-dimensional form. A process can contain multiple events. Therefore, the behavioral information of a process is represented by sequentially arranging the event information in the one-dimensional form derived earlier. By concatenating different event information, the process information expressed in one-dimensional form is mapped to each node of the process tree and stored. Then, each process information in one-dimensional form is sequentially arranged in consideration of the hierarchical structure defined by the parent-child relationship of the process tree. The parent process is placed at the top, and the closer it is to the terminal process, the lower it is placed. This form of two-dimensional data consequently contains sequential characteristics in both time and space.
Appendix C: Training Curves and Model Convergence Analysis
This appendix provides training curves and convergence analysis for the three deep learning models, offering deeper insights into model convergence behavior and experimental transparency.
Appendix C.1 Hyperparameter Optimization with Optuna
We employed Optuna framework for systematic hyperparameter optimization over 100 trials per model. The search spaces included learning rate [1e−5, 1e−2], batch size [16, 32, 64, 128], and architecture-specific parameters. For CNN models, we optimized 2–4 convolutional layers with filter sizes [16–256] and dropout rates [0.1–0.5]. LSTM models used hidden sizes [32–256], 1–4 layers, and dropout [0.0–0.4]. The hybrid model combined both parameter spaces with fusion strategies.
Optimal configurations: CNN achieved best performance with learning rate 0.0018, batch size 32, three layers [32, 64, 128 filters], and dropout 0.31. LSTM used learning rate 0.0012, batch size 32, three layers [64, 128, 64 units], and dropout 0.22. CNN+LSTM employed learning rate 0.0015, batch size 32, two CNN layers [32, 64] plus one LSTM layer [64 units], with dropout 0.25.
Appendix C.2 Training Curves Analysis
Fig. A2 presents training and validation curves for loss and accuracy across 50 epochs with early stopping. As shown in Fig. A2a, the loss convergence patterns reveal distinct characteristics for each model, while Fig. A2b demonstrates the corresponding accuracy progression throughout training.
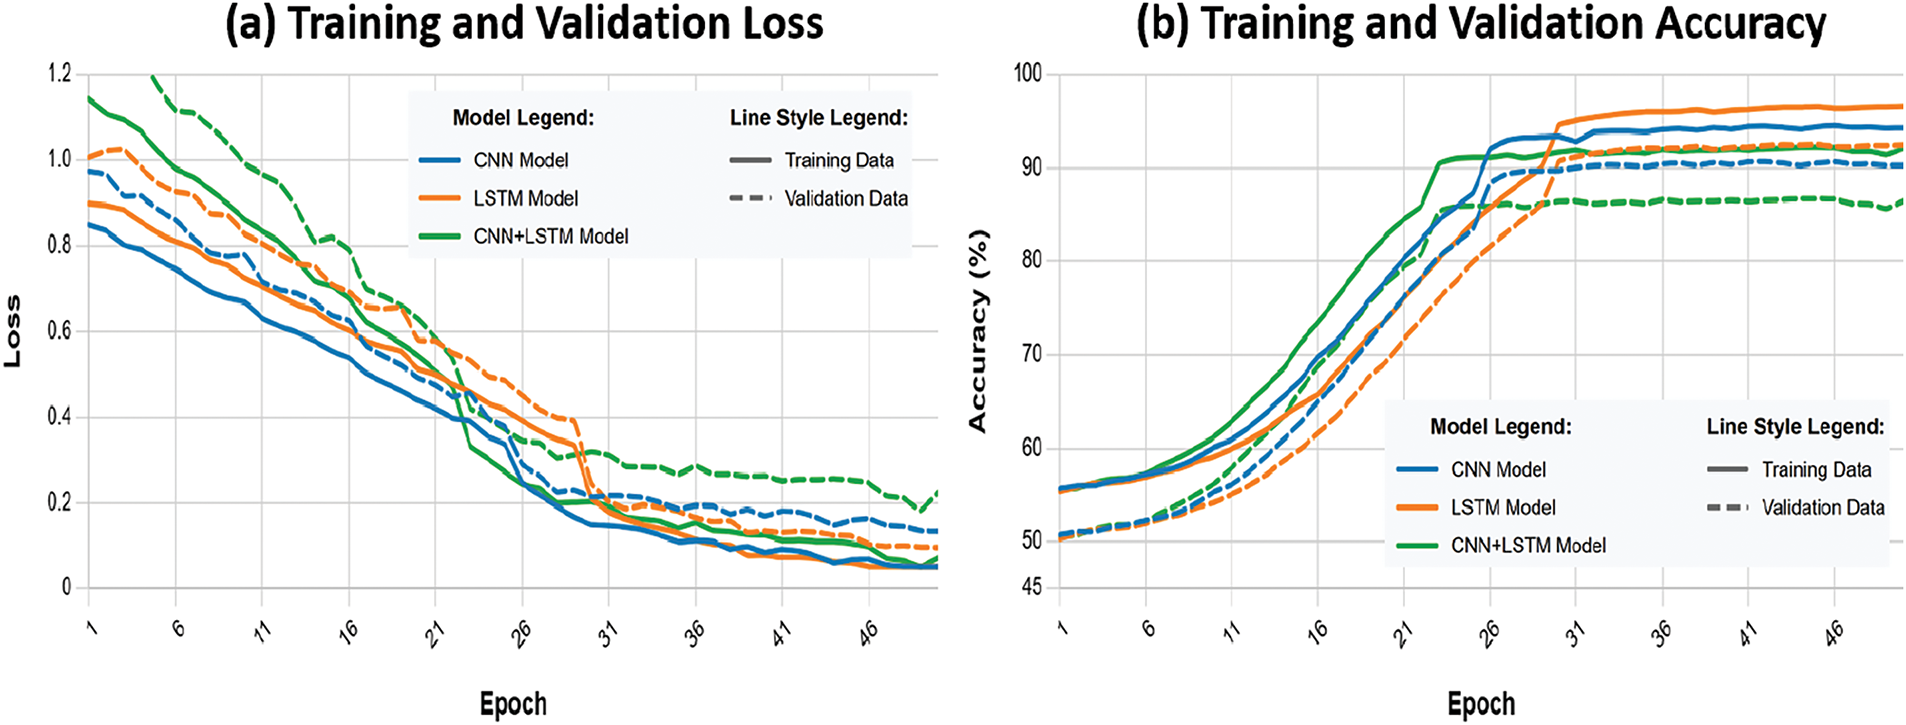
Figure A2: Training curves for malicious behavior detection models
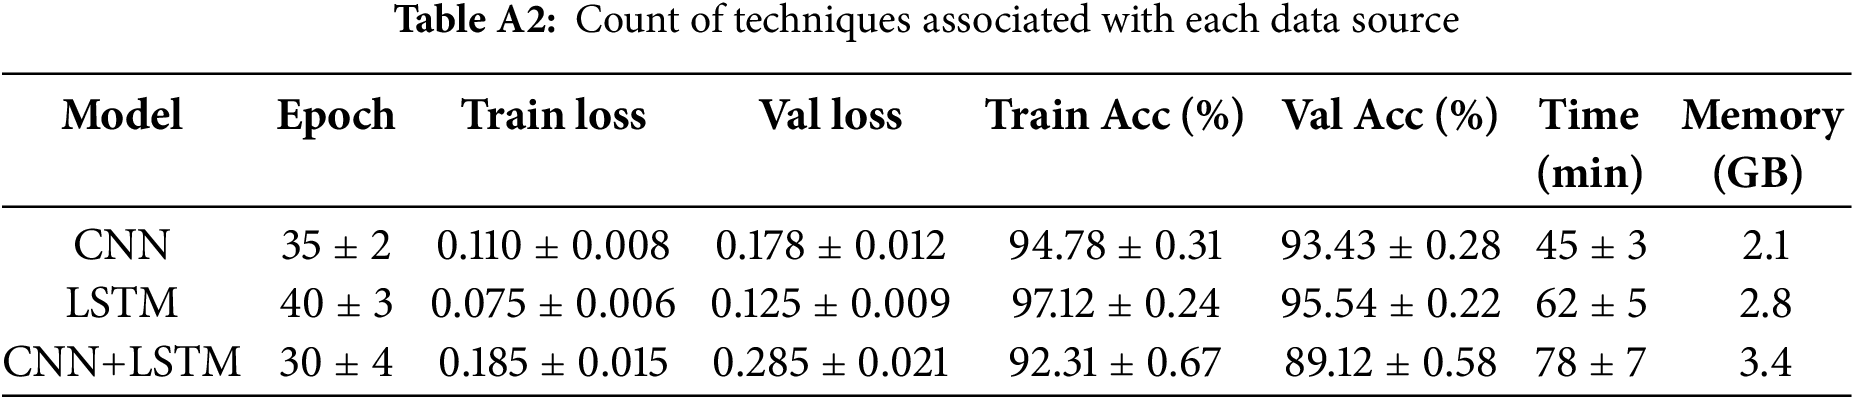
LSTM Model: Demonstrates stable convergence with training loss decreasing from 0.92 to 0.075 and validation loss to 0.125. Achieves 97.12% training accuracy and 95.54% validation accuracy with minimal overfitting (1.58% gap). Convergence occurs around epoch 40.
CNN Model: Shows faster initial convergence but earlier overfitting onset around epoch 28. Training loss decreases from 0.85 to 0.110, validation loss to 0.178. Final accuracies are 94.78% (training) and 93.43% (validation) with a 1.35% gap.
CNN+LSTM Hybrid: Exhibits the most unstable training dynamics with significant overfitting from epoch 22. Training loss decreases from 1.15 to 0.185, validation loss to 0.285. Achieves 92.31% training and 89.12% validation accuracy with a substantial 3.19% gap.
Learning rate scheduler effects are visible at epochs 15 and 30, with LSTM showing the most resilient response to these adjustments.
Appendix C.3 Statistical Validation and Computational Efficiency
We conducted five independent training runs with different random seeds (42, 123, 456, 789, 1024). Paired t-tests confirmed statistical significance of LSTM superiority over CNN (p = 0.0032) and CNN+LSTM (p = 0.0018). The coefficient of variation for validation accuracy was 0.8% (LSTM), 1.2% (CNN), and 2.1% (CNN+LSTM), confirming LSTM’s superior stability.
Training times averaged 45 min (CNN), 62 min (LSTM), and 78 min (CNN+LSTM) with memory usage of 2.1 GB, 2.8 GB, and 3.4 GB, respectively. Despite 38% longer training time, LSTM delivers superior accuracy and stability, making the additional computational cost worthwhile for high-accuracy malicious behavior detection. Table A2 summarizes these comprehensive training statistics across all evaluated metrics.
References
1. Tzavara V, Vassiliadis S. Tracing the evolution of cyber resilience: a historical and conceptual review. Int J Inf Secur. 2024;23(3):1695–719. doi:10.1007/s10207-023-00811-x. [Google Scholar] [CrossRef]
2. Liu Y, Li S, Wang X, Xu L. A review of hybrid cyber threats modelling and detection using artificial intelligence in IIoT. Comput Model Eng Sci. 2024;140(2):1233–61. doi:10.32604/cmes.2024.046473. [Google Scholar] [CrossRef]
3. Ali S, Rehman SU, Imran A, Adeem G, Iqbal Z, Kim KI. Comparative evaluation of AI-based techniques for zero-day attacks detection. Electronics. 2022;11(23):3934. doi:10.3390/electronics11233934. [Google Scholar] [CrossRef]
4. Zengy J, Wang X, Liu J, Chen Y, Liang Z, Chua TS, et al. SHADEWATCHER: recommendation-guided cyber threat analysis using system audit records. In: 2022 IEEE Symposium on Security and Privacy (SP); 2022 May 22–26; San Francisco, CA, USA. p. 489–506. doi:10.1109/SP46214.2022.9833669. [Google Scholar] [CrossRef]
5. Bhattarai B, Huang H. SteinerLog: prize collecting the audit logs for threat hunting on enterprise network. In: Proceedings of the 2022 ACM on Asia Conference on Computer and Communications Security. New York, NY, USA: The Association for Computing Machinery (ACM); 2022. p. 97–108. doi:10.1145/3488932.3523261. [Google Scholar] [CrossRef]
6. Wurzenberger M, Höld G, Landauer M, Skopik F. Analysis of statistical properties of variables in log data for advanced anomaly detection in cyber security. Comput Secur. 2024;137:103631. doi:10.1016/j.cose.2023.103631. [Google Scholar] [CrossRef]
7. Nankya M, Chataut R, Akl R. Securing industrial control systems: components, cyber threats, and machine learning-driven defense strategies. Sensors. 2023;23(21):8840. doi:10.3390/s23218840. [Google Scholar] [PubMed] [CrossRef]
8. An B, Yang J, Kim S, Kim T. Malware detection using dual Siamese network model. Comput Model Eng Sci. 2024;141(1):563–84. doi:10.32604/cmes.2024.052403. [Google Scholar] [CrossRef]
9. Xu Z, Fang P, Liu C, Xiao X, Wen Y, Meng D. DEPCOMM: graph summarization on system audit logs for attack investigation. In: 2022 IEEE Symposium on Security and Privacy (SP); 2022 May 22–26; San Francisco, CA, USA. p. 540–57. doi:10.1109/SP46214.2022.9833632. [Google Scholar] [CrossRef]
10. Mahmoud RV, Anagnostopoulos M, Pastrana S, Pedersen JM. Redefining malware sandboxing: enhancing analysis through sysmon and ELK integration. IEEE Access. 2024;12:68624–36. doi:10.1109/ACCESS.2024.3400167. [Google Scholar] [CrossRef]
11. Keyogeg B, Thompson M, Dawson G, Wagner D, Johnson G, Elliott B. Automated detection of ransomware in windows active directory domain services using log analysis and machine learning. Authorea. 2024. doi:10.22541/au.172779663.36925703/v1. [Google Scholar] [CrossRef]
12. Rana S, Kumar N, Handa A, Shukla SK. Automated windows behavioral tracing for malware analysis. Secur Priv. 2022;5(6):e253. doi:10.1002/spy2.253. [Google Scholar] [CrossRef]
13. Javed SMZ, Amjad MF. Enhancing malware classification through dynamic behavioral analysis, SIEM integration, and deep learning. In: 2024 International Seminar on Intelligent Technology and Its Applications (ISITIA); 2024 Jul 10–12; Mataram, Indonesia. p. 663–8. doi:10.1109/ISITIA63062.2024.10667741. [Google Scholar] [CrossRef]
14. Gwak JY, Wakodikar P, Wang M, Yan G, Shu X, Stoller SD, et al. Debugging malware classification models based on event logs with explainable AI. In: 2023 IEEE International Conference on Data Mining Workshops (ICDMW); 2023 Dec 1–4; Shanghai, China. p. 939–48. doi:10.1109/ICDMW60847.2023.00125. [Google Scholar] [CrossRef]
15. Brzeźniak A. Situation-aware malware detection on Windows OS based on environmental information. TechRxiv. 2024. doi:10.36227/techrxiv.171625916.68626958/v1. [Google Scholar] [CrossRef]
16. Gupta S, Crispo B. Towards autonomous device protection using behavioural profiling and generative artificial intelligence. IET Cyber Phys Syst Theory Appl. 2025;10(1):e12102. doi:10.1049/cps2.12102. [Google Scholar] [CrossRef]
17. Zhang Z, Shi K, Wang M, Jiang A. Malicious process identification via system audit logs analysis. In: 2023 4th International Conference on Big Data & Artificial Intelligence & Software Engineering (ICBASE); 2023 Aug 25–27; Nanjing, China. p. 302–6. doi:10.1109/ICBASE59196.2023.10303222. [Google Scholar] [CrossRef]
18. Xiao J, Yang L, Zhong F, Wang X, Chen H, Li D. Robust anomaly-based insider threat detection using graph neural network. IEEE Trans Netw Serv Manage. 2023;20(3):3717–33. doi:10.1109/tnsm.2022.3222635. [Google Scholar] [CrossRef]
19. Kurniawan K, Ekelhart A, Kiesling E, Quirchmayr G, Tjoa AM. KRYSTAL: knowledge graph-based framework for tactical attack discovery in audit data. Comput Secur. 2022;121(13):102828. doi:10.1016/j.cose.2022.102828. [Google Scholar] [CrossRef]
20. Ring M, Schlör D, Wunderlich S, Landes D, Hotho A. Malware detection on windows audit logs using LSTMs. Comput Secur. 2021;109(2):102389. doi:10.1016/j.cose.2021.102389. [Google Scholar] [CrossRef]
21. Tian D, Ying Q, Jia X, Ma R, Hu C, Liu W. MDCHD: a novel malware detection method in cloud using hardware trace and deep learning. Comput Netw. 2021;198(5):108394. doi:10.1016/j.comnet.2021.108394. [Google Scholar] [CrossRef]
22. Zhi QW, Wang H, El Saddik A. FedITD: a federated parameter-efficient tuning with pre-trained large language models and transfer learning framework for insider threat detection. IEEE Access. 2024;12(1):160396–417. doi:10.1109/ACCESS.2024.3482988. [Google Scholar] [CrossRef]
23. Saeed M, Saeed R, Abdelhaq M, Alsaqour R, Hasan M, Mokhtar R. Anomaly detection in 6G networks using machine learning methods. Electronics. 2023;12(15):3300. doi:10.3390/electronics12153300. [Google Scholar] [CrossRef]
24. Gadal S, Mokhtar R, Abdelhaq M, Alsaqour R, Ali ES, Saeed R. Machine learning-based anomaly detection using K-mean array and sequential minimal optimization. Electronics. 2022;11(14):2158. doi:10.3390/electronics11142158. [Google Scholar] [CrossRef]
25. Zhang W, Zhang Q, Yu E, Ren Y, Meng Y, Qiu M, et al. Leveraging RAG-enhanced large language model for semi-supervised log anomaly detection. In: 2024 IEEE 35th International Symposium on Software Reliability Engineering (ISSRE); 2024 Oct 28–31; Tsukuba, Japan. p. 168–79. doi:10.1109/ISSRE62328.2024.00026. [Google Scholar] [CrossRef]
26. Wajahat A, He J, Zhu N, Mahmood T, Nazir A, Ullah F, et al. An effective deep learning scheme for Android malware detection leveraging performance metrics and computational resources. Intell Decis Technol. 2024;18(1):33–55. doi:10.3233/idt-230284. [Google Scholar] [CrossRef]
27. Nguyen AT, Raff E, Sant-Miller A. Would a file by any other name seem as malicious? In: 2019 IEEE International Conference on Big Data (Big Data); 2019 Dec 9–12; Los Angeles, CA, USA. p. 1322–31. doi:10.1109/bigdata47090.2019.9006132. [Google Scholar] [CrossRef]
28. Bazz-066, “GitHub—bazz-066/linux-malware-dataset” 2024 [Internet]. [cited 2025 Aug 19]. Available from: https://github.com/bazz-066/linux-malware-dataset. [Google Scholar]
29. Wajahat A, He J, Zhu N, Mahmood T, Saba T, Khan AR, et al. Outsmarting Android malware with cutting-edge feature engineering and machine learning techniques. Comput Mater Contin. 2024;79(1):651–73. doi:10.32604/cmc.2024.047530. [Google Scholar] [CrossRef]
30. Pratomo BA, Kosim SA, Studiawan H, Prabowo AO. BarongTrace: a malware event log dataset for linux. In: Advanced information networking and applications. Cham, Switzerland: Springer Nature; 2024. p. 48–60. doi:10.1007/978-3-031-57916-5_5. [Google Scholar] [CrossRef]
31. Cheng S, Zhao Y, Geng S, Feng Y. Visual malicious code classification based on target detection algorithm. In: ICMLCA 2021; 2nd International Conference on Machine Learning and Computer Application; 2021 Dec 17–19; Shenyang, China. p. 1–5. [Google Scholar]
Cite This Article
 Copyright © 2025 The Author(s). Published by Tech Science Press.
This work is licensed under a Creative Commons Attribution 4.0 International License , which permits unrestricted use, distribution, and reproduction in any medium, provided the original work is properly cited.
 Downloads
 Citation Tools