
 Submit a Paper
 Propose a Special lssue
 Open Access
ARTICLE

Efficient Time-Series Feature Extraction and Ensemble Learning for Appliance Categorization Using Smart Meter Data
College of Engineering and Technology, American University of the Middle East, Egaila, 54200, Kuwait
* Corresponding Author: Saeed Mian Qaisar. Email:
(This article belongs to the Special Issue: Advanced Artificial Intelligence and Machine Learning Methods Applied to Energy Systems)
Computer Modeling in Engineering & Sciences 2025, 145(2), 1969-1992. https://doi.org/10.32604/cmes.2025.072024
Received 18 August 2025; Accepted 13 October 2025; Issue published 26 November 2025
 View Full Text
 Download PDF
Abstract
Recent advancements in smart-meter technology are transforming traditional power systems into intelligent smart grids. It offers substantial benefits across social, environmental, and economic dimensions. To effectively realize these advantages, a fine-grained collection and analysis of smart meter data is essential. However, the high dimensionality and volume of such time-series present significant challenges, including increased computational load, data transmission overhead, latency, and complexity in real-time analysis. This study proposes a novel, computationally efficient framework for feature extraction and selection tailored to smart meter time-series data. The approach begins with an extensive offline analysis, where features are derived from multiple domains—time, frequency, and statistical—to capture diverse signal characteristics. Various feature sets are fused and evaluated using robust machine learning classifiers to identify the most informative combinations for automated appliance categorization. The best-performing fused features set undergoes further refinement using Analysis of Variance (ANOVA) to identify the most discriminative features. The mathematical models, used to compute the selected features, are optimized to extract them with computational efficiency during online processing. Moreover, a notable dimension reduction is secured which facilitates data storage, transmission, and post processing. Onward, a specifically designed LogitBoost (LB) based ensemble of Random Forest base learners is used for an automated classification. The proposed solution demonstrates a high classification accuracy (97.93%) for the case of nine-class problem and dimension reduction (17.33-fold) with minimal front-end computational requirements, making it well-suited for real-world applications in smart grid environments.Keywords
In recent years, our growing dependence on electrically powered devices has led to a steady increase in overall energy demand worldwide. While each household appliance typically consumes only a modest amount of electricity, the sheer number of these devices and their frequent use make it critical to understand and monitor consumption patterns more closely. Traditional metering technologies often lack the level of detail needed for this purpose, which has driven the widespread adoption of smart meters [1,2].
Unlike conventional meters, smart meters do more than just record electricity usage, they also support remote monitoring and control of power supply [3]. With advancements in technology, these modern meters have gradually replaced outdated systems and have become an essential part of smart grid infrastructure. Their ability to address social, environmental, and economic challenges makes them valuable to both energy providers and consumers. In addition, the widespread deployment of smart meters has enabled the collection of large volumes of detailed consumption data, offering new opportunities for energy management and optimization [4].
Recent studies have also emphasized the role of smart meter data in appliance-level categorization and load disaggregation. For example, Pereira et al. introduced a labeled residential dataset that supports reproducible research in appliance identification and demand analysis [5]. Okereke et al. applied k-means clustering with time-domain features to categorize household electricity users, highlighting the value of unsupervised methods for consumer profiling [6]. More recently, Irani Azad et al. proposed a transformer-based deep learning approach with temporal pooling to improve non-intrusive load monitoring, showing how modern architectures can capture complex appliance-specific patterns with higher accuracy [7].
However, despite their advantages, smart meters also present new challenges related to high volume of data storage, transmission, and real-time analysis. Addressing these issues has become a key focus within ongoing smart grid research. The smart grid itself represents an advanced integration of information and communication technologies (ICT), combining sensors and smart meters that connect to energy servers or the cloud via wired or wireless networks [3,4]. Moreover, the low power embedded realizations are also paving a way in this regard [8]. Additionally, enumerated insights generation is beneficial for demand flexibility clustering and effective energy management [9]. This setup allows electricity to be monitored and managed far more effectively than in traditional power grids, paving the way for smarter, better quality, and more flexible plus dynamic energy systems [10].
Household smart meters measure electricity use in real time and with great detail, making them a key part of building a fully digital electricity grid in the future. They are being rolled out widely across the world because of the many benefits they offer to both energy providers and consumers. Cutting down on electricity use during peak hours is especially important, and by giving people regular feedback on how much power they are using, smart meters help them become more aware of their habits and encourage smarter energy use [4,11,12].
In this context, figuring out which appliances are running just by looking at their unique electricity patterns is becoming an interesting new focus. This approach could make electricity billing much more detailed and accurate, instead of relying on a single general measurement from the main household meter. It could also make it easier to manage which devices can be turned on or off, depending on how much power is available locally or across the grid as a whole. Moreover, it can also help identify the occupancy and signatures of occupants and could be particularly beneficial for seamless monitoring and service providing to the elderly persons. However, the clients’ privacy must be preserved throughout the process, ensuring that personal data and behaviors are protected while still enabling the benefits of these innovations [13].
Datasets also play a crucial role in advancing this field. The ACS-F2 database [2] provides a publicly available, plug-level dataset that supports reproducibility and benchmarking. By offering a standardized resource, it enables researchers to compare different methods under consistent conditions and fosters the development of more generalizable solutions. In a similar direction, Irani Azad et al. introduced a labeled residential dataset that offers appliance-level annotations, which has become a valuable resource for reproducible Non-Intrusive Load Monitoring (NILM) and appliance categorization studies [7]. Moreover, studies such as [14] that focus on local datasets (for example, a Turkish appliance dataset) underscore the importance of regional context. Tailoring models to local appliances and user behaviors can further improve accuracy and user acceptance, highlighting a potential direction for future research.
One prominent research direction involves detecting the presence or absence of specific appliances within households. For instance, the study presented in [15] introduced an Appliance Detection Framework (ADF) designed to identify appliance usage patterns from long and variable-length consumption time series, thereby facilitating more precise demand-side management strategies.
Another key area focuses on forecasting electricity consumption using advanced machine learning techniques. In [16], the authors proposed a hybrid methodology that integrates clustering and supervised learning to predict both individual appliance-level consumption and overall household demand, taking into account variations in user behavior. Their approach employs R for clustering electricity consumption patterns and MATLAB for preprocessing and forecasting, utilizing CLARA clustering (Clustering Large Applications, a scalable clustering technique designed to handle large datasets efficiently) followed by SVM (Support Vector Machine, a supervised learning model that finds the optimal boundary separating different classes). Similarly, in [17], time series forecasting was performed using ensemble methods and LSTM networks (Long Short-Term Memory networks, a type of recurrent neural network capable of learning long-term dependencies in sequential data), achieving improved prediction accuracy.
Complementary to these approaches, feature extraction and dimensionality reduction techniques have become essential for enhancing the compression, quality and interpretability of smart meter data. For example, Ref. [18] conducted an analysis on residential and small enterprise consumption data to investigate load profile variations across different time intervals. By combining k-means clustering (a popular unsupervised algorithm that partitions data into distinct groups based on similarity) with Singular Value Decomposition (SVD) for feature extraction, the study aimed to maximize the informational content of the data while minimizing feature set complexity.
Furthermore, recent studies have explored novel feature engineering approaches to advance smart meter analytics and strengthen security measures. In [19], for example, the authors proposed a text classification-inspired technique that interprets meter data as sequential “text-like” signals to improve user segmentation, although methodological details remain limited. Study [20] emphasized the use of carefully designed hand-crafted features alongside models such as Naïve Bayes, k-Nearest Neighbor (kNN) and Support Vector Machine (SVM). The Random Forest (an ensemble learning method that builds multiple decision trees and merges their outputs to improve accuracy and reduce overfitting), Artificial Neural Networks (ANN), and SVM for appliance identification, demonstrating the importance of expert-driven feature design [1]. In [18], the authors focused on extracting multi-domain features from residential and small enterprise consumption data, applying dimensionality reduction techniques such as Singular Value Decomposition (SVD) to generate a compact and informative feature set. The prepared feature set can then be used with various classifiers, resulting in improved performance and interpretability.
Another major trend, in the automated appliance categorization, is the growing reliance on deep learning approaches, which have proven highly effective at capturing complex, nonlinear patterns in electricity consumption data. For example, studies utilizing convolutional neural networks (CNNs) and advanced architectures like residual networks (ResNets) [21,22] consistently achieved accuracy levels above 95%, sometimes even exceeding 98%. These methods excel at automatically learning useful features directly from raw signals or transformed representations such as spectrograms, reducing the need for manual feature engineering. More recently, Irani Azad et al. introduced a transformer-based attention model with temporal pooling to further enhance NILM, showing that deep learning architectures continue to evolve and provide higher accuracy for appliance recognition [7].
While deep learning models offer impressive accuracy, they often come with high computational demands and require substantial resources plus a large volume of labelled data for effective training. To address this, researchers in [23] focused on creating lightweight CNN models that can run on tiny microcontrollers (MCUs). This work demonstrated that it is possible to achieve strong performance (up to 98.6% accuracy on WHITED) while staying within strict memory and processing constraints, paving the way for real-time appliance recognition in embedded systems.
On the other hand, traditional machine learning techniques continue to play an important role, especially when combined with careful feature selection. For instance, the work in [23] showed that using feature selection methods such as ANOVA and mutual information can significantly boost classification accuracy when paired with classifiers like SVM or gradient boosting machines (GBM). These approaches strike a balance between interpretability, simplicity, and performance, making them attractive for practical deployments where computational resources may be limited.
Several studies have also highlighted the importance of feature engineering in improving recognition performance. In [20,24], the authors demonstrated how advanced feature mining and dimensionality reduction techniques, including Principal Component Analysis (PCA), can lead to robust appliance identification using smart meter data. By reducing data complexity without losing key information, these methods allow for more efficient model training and inference.
Another interesting direction is the use of hybrid models that integrate deep learning with traditional feature-based methods. The study in [21], for example, combined high-resolution wireless sensor networks with deep learning models to enable real-time, detailed pattern recognition in home environments. This integration not only improved classification accuracy but also offered valuable insights into consumption behaviors, supporting better energy management strategies.
Taken together, these studies illustrate the diverse and evolving strategies used to analyze smart meter data. While they share a common goal of enhancing data-driven insights within smart grids, they differ significantly in application focus, spanning user profiling, appliance detection, and fraud prevention, and in their respective approaches to feature engineering, which range from automated embeddings to expertly crafted, dimensionally reduced feature sets.
1.2 Research Gap and Contribution
From the aforementioned discussion, in Section 1.1, it is clear that while deep learning approaches dominate recent studies due to their superior performance, combining these methods with classical techniques and thoughtful feature engineering often yields practical advantages and ease of implementation with limited resources. Hybrid approaches can enhance interpretability and reduce costs, while lightweight implementations enable real-time applications even on constrained hardware. Together, these diverse strategies illustrate a rich and evolving landscape in smart home energy analytics, where accuracy, efficiency, and usability are all critical factors shaping future developments.
While recent studies on appliance identification and load recognition have shown remarkable progress, several key challenges remain. Such as the deep learning approaches [21,22], although highly accurate, rely heavily on large, labeled datasets, which are costly and time-consuming to create. These models also require significant computational resources, making real-time deployment on low-power devices difficult despite recent efforts to create lightweight versions [23]. Traditional machine learning methods [20,24], on the other hand, often depend on manual feature engineering, which requires expert knowledge and may not generalize well to new appliances or different households. Hybrid approaches that combine various techniques [25] offer a balance but introduce additional system complexity and can be challenging to maintain or integrate. Another major gap is the lack of standardized datasets and evaluation protocols. Differences in sampling rates, appliance diversity, and household conditions make it hard to compare models fairly. Moreover, many datasets do not fully reflect real-world scenarios, such as overlapping appliance usage or noisy environments.
This study aims to bridge certain of these gaps by proposing a hybrid feature extraction method that combines temporal and statistical feature extraction techniques, achieving a balance between accuracy and resource efficiency. The approach not only improves classification performance but also reduces data dimensionality and computational complexity. It makes this approach favorable for real-time smart meter applications. By designing an ensemble learning framework and intelligently separating front-end and cloud-based processing, this work contributes to more cost-effective, scalable, and practical energy management solutions for smart homes.
In this study, we build upon our previous work [1], where we used all feature extraction domains (time, frequency, and statistical) available in the Time-Series Feature Extraction Library (TSFEL) together with machine learning (ML) based classifiers for the appliances categorization. The contributions of this study are:
• To opt a targeted offline approach by carefully analyzing each individual feature extraction domain (statistical, temporal, and spectral/frequency), available in the TSFEL, as well as their pairwise combinations. To identify and demonstrate that fusing the mined features from the statistical and temporal domains offers the best trade-off between classification accuracy and data dimension reduction. It makes the approach even more practical for smart meter applications where front-end data storage and transmission towards cloud efficiencies are critical.
• To deduce and demonstrate the computational effectiveness of the devised method. This ensures that the method could realistically be deployed in large-scale, resource-limited environments. By removing higher-complexity features, we were able to maintain strong classification performance while keeping the overall complexity to at most
• To design an ensemble learning framework that combines Random Forest classifiers with LogitBoost (a boosting algorithm that iteratively adjusts weights on difficult-to-classify samples using a logistic regression framework to improve overall accuracy). This strategy helps correct errors iteratively and focus on harder-to-classify cases, leading to a more robust and reliable system than relying on a single classifier.
• To introduce a system architecture that clearly separates front-end (on-device) preprocessing from cloud-based analysis. This design allows real-time data reduction at the device level while keeping the classification logic flexible and scalable in the cloud.
Altogether, these contributions offer a practical, efficient, and robust solution for appliance identification and load monitoring in future smart grid environments.
This section presents the devised methodology and the studied dataset. It includes the description of the considered dataset, time-series feature extraction library (TSFEL), and considered machine learning (ML) and ensemble learning (EL) algorithms. The block level diagram of the proposed scheme is shown in Fig. 1. The blue shaded modules are already implemented in the considered dataset. The yellow shaded modules present the offline processing blocks, implemented for a robust analysis and feature selection. Green shaded blocks present the online processing modules, optimized based on the offline analysis. It is clear from Fig. 1 that the online processing modules are divided in the front-end processing and cloud processing. Such a realization can lead towards an optimized front-end module which keeps the classification task easily configurable on the cloud. A description of different implemented modules is provided in the following sub-sections.
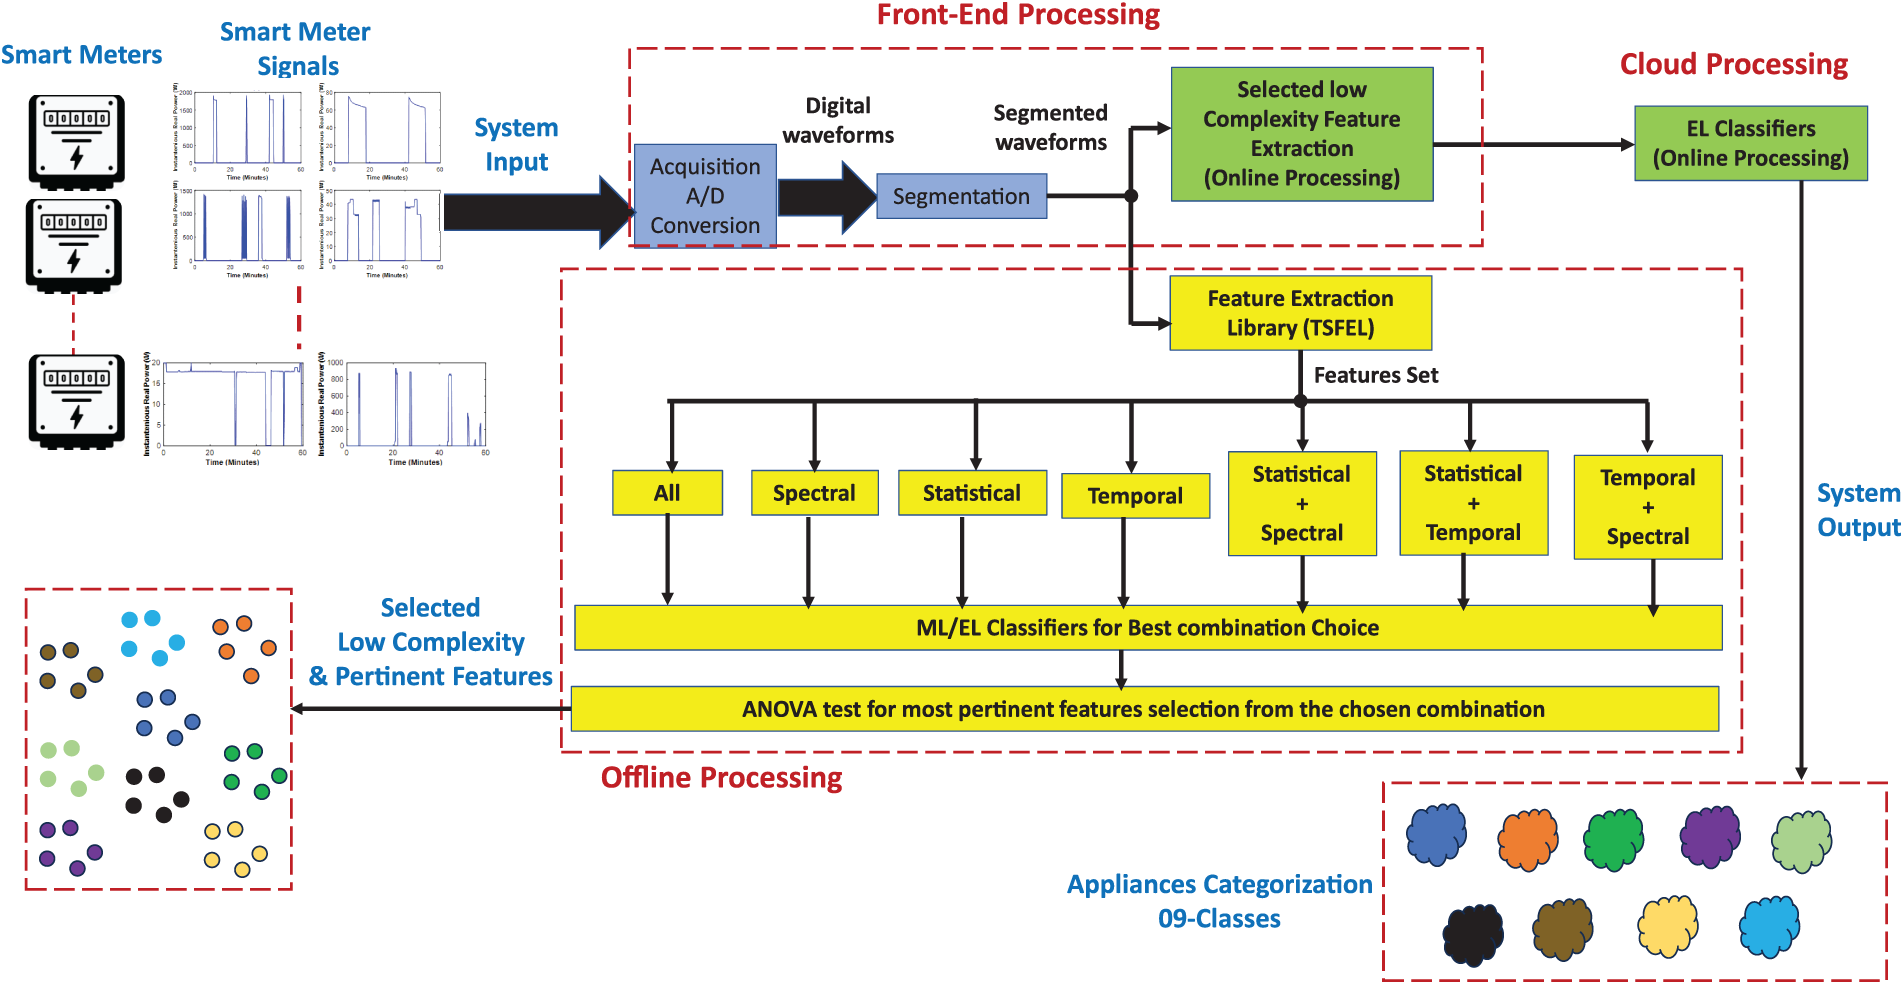
Figure 1: The system block diagram. Here, machine learning is (ML), ensemble learning is (EL), time-series feature extraction library is (TSFEL), analog-to-digital conversion is (A/D Conversion), and analysis of variance is (ANOVA)
Electricity consumption metrics for nine distinct appliance categories are studied in this paper. Among the considered appliance categories are Coffee machines, Computer Stations, Fans, Fridges & Freezers, Kettles, Lamps, Microwaves, Printers, and Shavers. The identical appliances from 15 brands make up each considered category. As a result, the information under consideration contains consumption data for 135 appliances over nine distinct categories. Fig. 2 helps to illustrate the procedure.
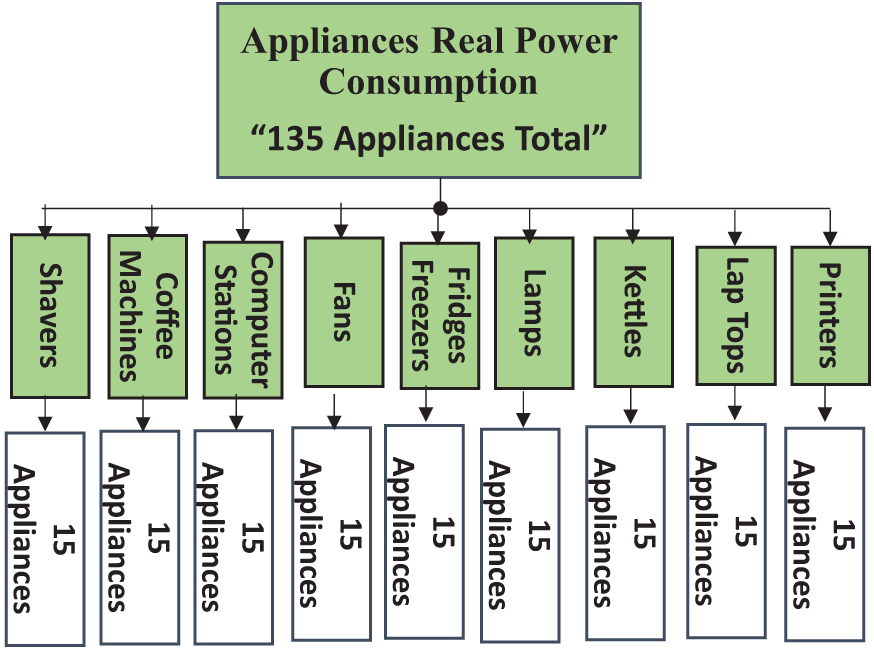
Figure 2: The appliances categories in the considered dataset
For each of these 135 appliances the consumption parameters are recorded during two utilization sessions. Each session is of 60 min duration. During each utilization session, the registered parameters are the real power, root-mean-square (RMS) current, reactive power, phase voltage, RMS voltage, and frequency. These parameters are recorded at an acquisition rate of 0.1 Hz, and the recordings are conducted in a disaggregated manner. In this study only the real power consumption patterns of the intended appliances are considered for further analysis. In this manner in total 270 instances are considered. A detailed description of this dataset is provided by the authors in Ref. [2].
The considered dataset is prepared with a purpose for appliance classification and energy disaggregation in residential contexts. It features realistic usage scenarios, including active and standby modes, and includes appliances from 15 brands, for each category, with diverse power ratings and behaviors. The data is recorded under controlled conditions that closely resemble real homes. It offers a robust and representative basis for practical research. It is enriched with metadata such as brand and model identifiers, supporting reproducibility and future studies in transfer learning and generalization.
The dataset is divided into a 70%–30% train-test split using the stratified option for consistency. Therefore, 189 instances are used for the training set and the remaining 81 instances are used for testing. The stratified option ensures that each appliance is equally represented in the training set, avoiding bias.
2.2 Offline Analysis for Feature Selection
2.2.1 TSFEL and Feature Extraction Domains
For the time series, many different functions for analysis have been collected in Time Series Feature Extraction Library (TSFEL), see [26]. In TSFEL library, 60 different functions are divided into 3 main domains, 17 for Temporal, 17 for Statistical and 26 for Spectral domains.
In our previous note [1], we used all domains to analyze the time series and reduced the dimensionality of data by a factor of 4.091 per instance. In this current note, instead of using all available domains, we compared the performance of each individual domain functions, and also pairwise combinations of domains to reduce the data size further without sacrificing from the performance of classification. In total, 7 different scenarios were studied. These scenarios include each domain alone, all pairs, and the combination of all three.
For almost all of the classification algorithms (kNN, ANN, RF, SVM, XGB), the Statistical domain feature extraction functions perform the best among other single domains (Spectral, Temporal). When studied in pairs, Statistical and Temporal domains together outperform with the rest of 6 scenarios (including All domains). Moreover, the number of features extracted by these two domains also improves the dimensionality reduction. This also significantly reduces the data storage and data transmission from front-end devices to cloud-based servers.
In aforementioned discussion, the kNN, SVM, RF, XGB, and ANN represent k-Nearest Neighbor, Support Vector Machine, Random Forest, eXtreme Gradient Boosting, and Artificial Neural Network classification algorithms, respectively.
The number of features extracted based on different domain combinations is summarized below in Table 1.

Further improvements and reductions will be given in the next sections, such as selection based on the computational complexity, further reduction with ANOVA, and improving the performance with ensemble methods in order to reach a desirable and acceptable solution.
2.2.2 Analysis of Variance (ANOVA)
The relevance of the chosen fusion of statistical and temporal features is assessed through the analysis of variance (ANOVA) test. This method works by partitioning the total variability in the data into separate components, each corresponding to different contributing factors. The mathematical framework for one-way ANOVA can be expressed as follows:
where, the Total Sum of Squares (
The p-values of all mined features are computed. According to the authors in [27], the features exhibiting distinct distributions, have relatively low p-values, and demonstrate strong discriminatory power. It is well-established that features with p-values below 0.05 are considered to have excellent discrimination capability [27]. Therefore, in this study, we select only those features with p-values under 0.05 and exclude the rest. As a result, 21 features are discarded from the initial set of 45, leaving 24 features for further analysis using classifiers. A graphical representation of p-values vs. features is provided in Fig. 3, which permits to graphically visualize the selected features in correspondence to their −10 × log10(p-values) plots.
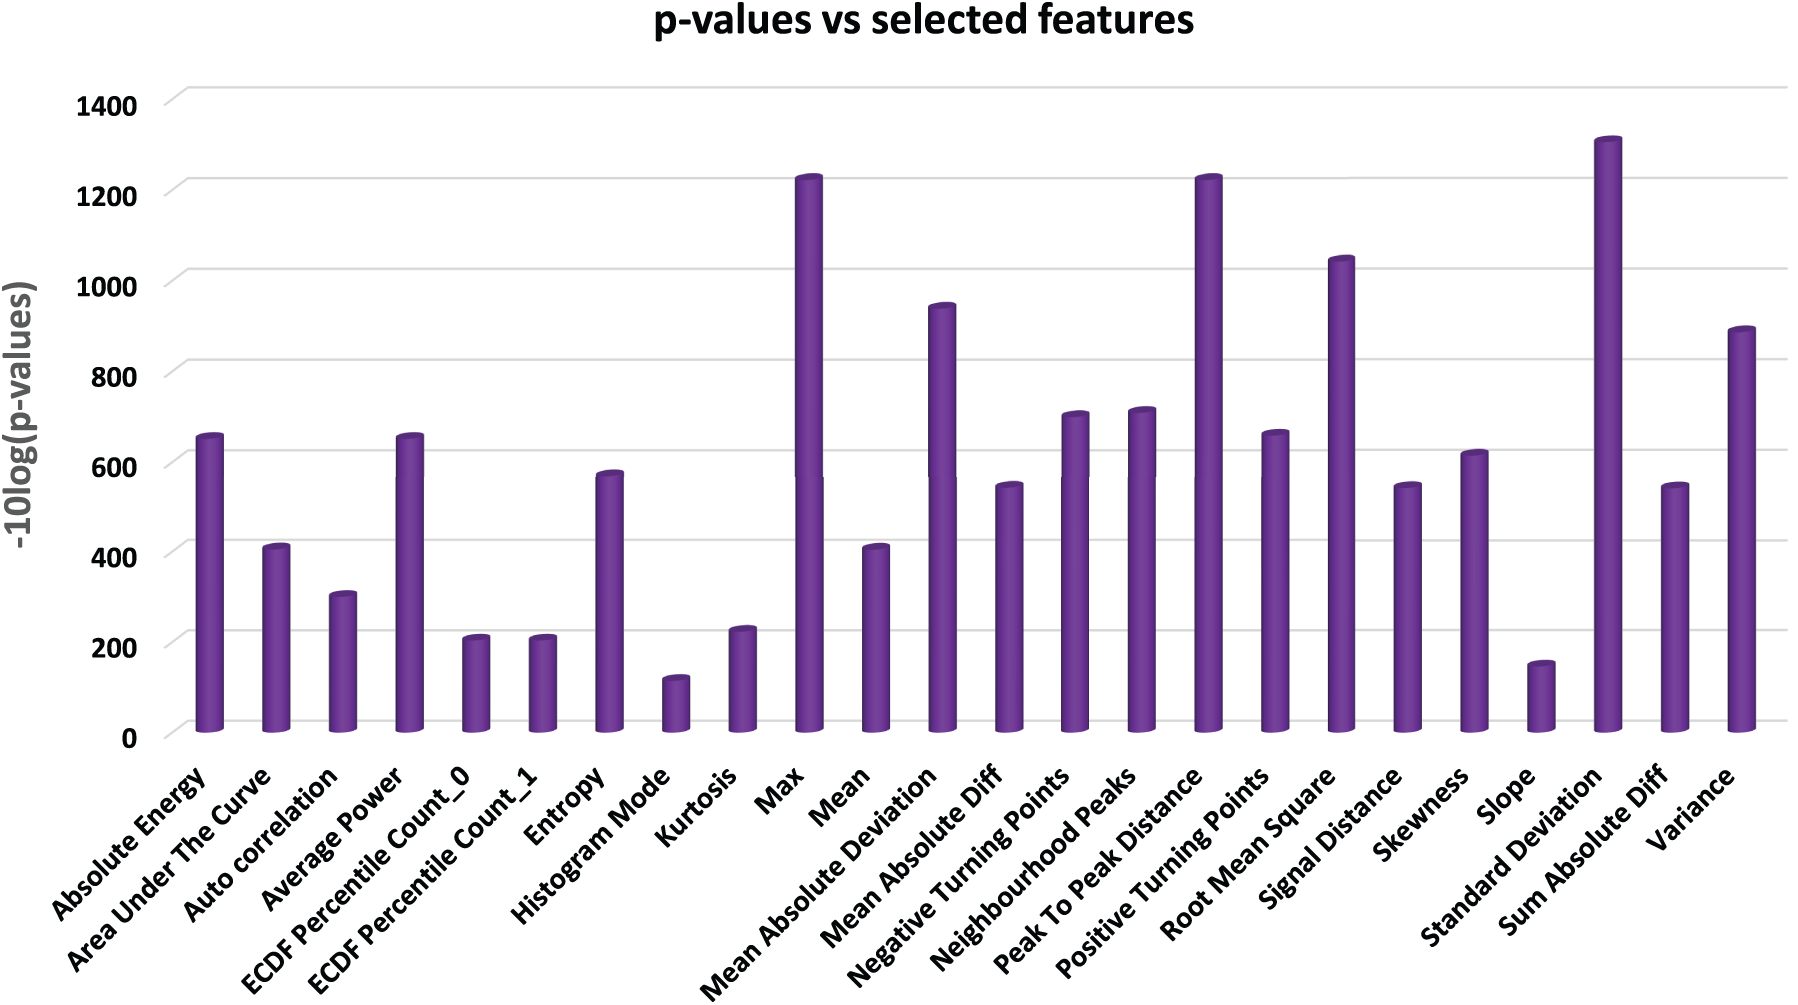
Figure 3: The computed −10 × log10(p-values) vs. selected features
The computational complexity of each function used in TSFEL is one of the following: linear, loglinear, or quadratic, i.e.,
The mean of a time series of length
For the vectorized sum, there are
2.3.2 Log-Linear Complexity:
Empirical cumulative distribution function (ECDF) percentile count is calculated for 20-percentile and 80-percentile by TSFEL. In order to calculate ECDF, time series should be sorted (generally, in increasing order). The sorting algorithm has complexity
2.3.3 Quadratic Complexity:
Autocorrelation function uses naïve autocorrelation for time series of length maximum 450. Since our data set has length 364, the calculations are done as per the below formula:
For
2.4 Classification for Feature Domain(s) Selection
Various classification algorithms are used, and their performances are compared. In this section, these classification algorithms are introduced shortly, and parameters used are given. The comparison of these algorithms on features extracted is given in Section 3.
2.4.1 Support Vector Machine (SVM)
Support Vector Machines (SVM) are powerful supervised learning algorithms commonly applied to both classification and regression tasks. In the context of time series analysis, such as modeling and forecasting power consumption, SVM offers several advantages due to its ability to handle complex, nonlinear relationships within the data. The core principle of SVM is to find the optimal hyperplane that best separates data points from different classes, to find a function that approximates the underlying relationship between input features and the target variable. This is achieved by maximizing the margin between support vectors which are data points closest to the decision boundary.
For power consumption forecasting, SVM is particularly useful because it is robust to outliers, can effectively handle high-dimensional feature spaces, and supports the use of kernel functions to capture nonlinear patterns commonly present in time series data. By appropriately selecting kernel functions and tuning model parameters, SVM can capture daily, weekly, or seasonal patterns and other temporal dependencies in power consumption series. As a result, SVM and its variants have become widely used tools for energy demand forecasting, anomaly detection, and load classification tasks in smart grid and energy management applications. For the time series used in this note, all kernels (linear, rbf, polynomial, and sigmoid) were considered during the training and cross validation, and the best performing kernel (linear) is used for further analysis.
Random Forests are an ensemble learning method that combines the predictions of multiple decision trees to improve accuracy and robustness in both classification and regression tasks. In the context of power consumption time series analysis, Random Forests are particularly advantageous due to their ability to model complex and nonlinear relationships inherent in temporal energy data. The core idea is to construct a multitude of decision trees, each trained on different random subsets of the data and features. The final prediction is typically obtained by majority voting for classification, which helps to mitigate overfitting and enhances generalization performance.
One of the key strengths of Random Forests in time series forecasting is their capacity to handle high-dimensional feature spaces and automatically estimate the importance of each predictor, such as historical consumption values, weather variables, or calendar effects. Additionally, Random Forests are robust to noise and outliers, making them well-suited for practical power consumption datasets that often contain irregularities and missing values. Owing to their flexibility and interpretability, Random Forests have been widely applied in energy demand forecasting, load profiling, and anomaly detection in smart grid and energy management systems.
2.4.3 K-Nearest Neighbor (kNN)
The k-Nearest Neighbors (kNN) algorithm is a simple yet effective non-parametric method commonly used for classification and regression tasks. In the context of power consumption time series analysis, kNN is often employed for forecasting, anomaly detection, and load pattern recognition. The fundamental principle of kNN is to make predictions based on the behavior of the
kNN offers several advantages in power consumption modeling, including its straightforward implementation, ability to capture local patterns, and flexibility in handling complex and nonlinear relationships without the need for an explicit model structure. Additionally, kNN can naturally incorporate multiple features into the similarity calculation. However, its effectiveness can be influenced by the choice of distance metric, the value of
In this study, various parameters were tested to determine the optimal performance, such as for weight, ‘uniform’, ‘distance’ options are considered. For the algorithm parameter, ‘auto’, ‘ball_tree’, ‘kd_tree’, and ‘brute’ were used. Finally, and the most importantly, for number of neighbours,
2.4.4 Artificial Neural Network (ANN)
Artificial Neural Networks (ANNs) are a class of powerful machine learning models inspired by the structure and function of the human brain. They are widely used for classification tasks due to their ability to model complex, nonlinear relationships between input features and output classes. In the context of power consumption time series, ANNs can effectively capture intricate patterns and dependencies within the data, making them well-suited for tasks such as load classification and event detection.
In this study, a feedforward ANN architecture was employed for classification, consisting of two dense (fully connected) layers. Each dense layer utilized the rectified linear unit (ReLU) activation function, which introduces nonlinearity and helps the network to learn complex mappings by allowing only positive activations to pass through. The kernel (weight) initializer was set to ‘uniform’, ensuring that the initial weights are drawn from a uniform distribution, which can help promote stable and efficient training. The network architecture was configured with 256, 128, and 64 units in successive layers, providing the capacity to learn hierarchical representations of the input data.
For model optimization, the Adam algorithm was used due to its effectiveness and adaptability in handling sparse gradients and noisy data. The loss function was categorical cross-entropy, which is suitable for multi-class classification problems and measures the divergence between the true and predicted class distributions. Model performance was evaluated using the accuracy metric, reflecting the proportion of correctly classified instances. This configuration allows the ANN to robustly classify power consumption patterns, accommodating the complexity often observed in time series energy data.
2.4.5 Extreme Gradient Boosting (XGBoost)
Extreme Gradient Boosting (XGBoost) is a highly efficient and scalable ensemble learning algorithm that has gained widespread adoption for classification tasks across a variety of domains, including power consumption time series analysis. XGBoost operates by sequentially building an ensemble of decision trees, where each tree aims to correct the errors made by the previous ones, thereby optimizing overall model performance. This approach allows XGBoost to effectively capture complex, nonlinear relationships within the data while maintaining robustness to noise and overfitting.
In this study, XGBoost was configured for multi-class classification using two objective functions: ‘multi:softmax’ and ‘multi:softprob’. The ‘multi:softmax’ objective directly assigns each instance to the class with the highest predicted probability, yielding discrete class labels. In contrast, ‘multi:softprob’ produces the predicted probabilities for each class, which can be useful for further analysis or threshold-based decisions. Model performance was evaluated using several metrics, including area under the ROC curve (AUC), log loss (logloss), multiclass classification error rate (merror), multiclass log loss (mlogloss), and area under the precision-recall curve (AUC-PR). Among these, the best results were achieved using the ‘multi:softmax’ objective in combination with the AUC metric, indicating both strong classification accuracy and the ability to discriminate between classes effectively.
This configuration demonstrates the adaptability and strong predictive power of XGBoost for classifying patterns in power consumption time series data, making it a valuable tool for smart grid applications and energy management systems.
2.5 Ensemble Classification for Online Processing
Ensemble learning techniques enable the integration of multiple robust classifiers, which are commonly applied across various classification tasks. In ensemble classification, multiple classifiers collaborate to solve the same problem, with methods like voting and averaging used to combine their outputs. This approach reduces the likelihood of misclassifications compared to relying on a single classifier [27]. In this study an effective ensemble of Random Forest (RF) classifiers is designed using the LogitBoost (LB). It is a well-known ensemble learning techniques. The core idea behind LB is to iteratively train base classifiers in a way that corrects the errors of the previous ones. This process helps to minimize the classification error by focusing on hard-to-classify instances. LB specifically uses a logistic regression framework to adjust the weights of misclassified instances during each iteration.
The overall workflow for LB based ensemble classification framework is depicted in Fig. 4. The procedure starts with an initial base learner model and refines it through each iteration. Mathematically, it can be defined as:
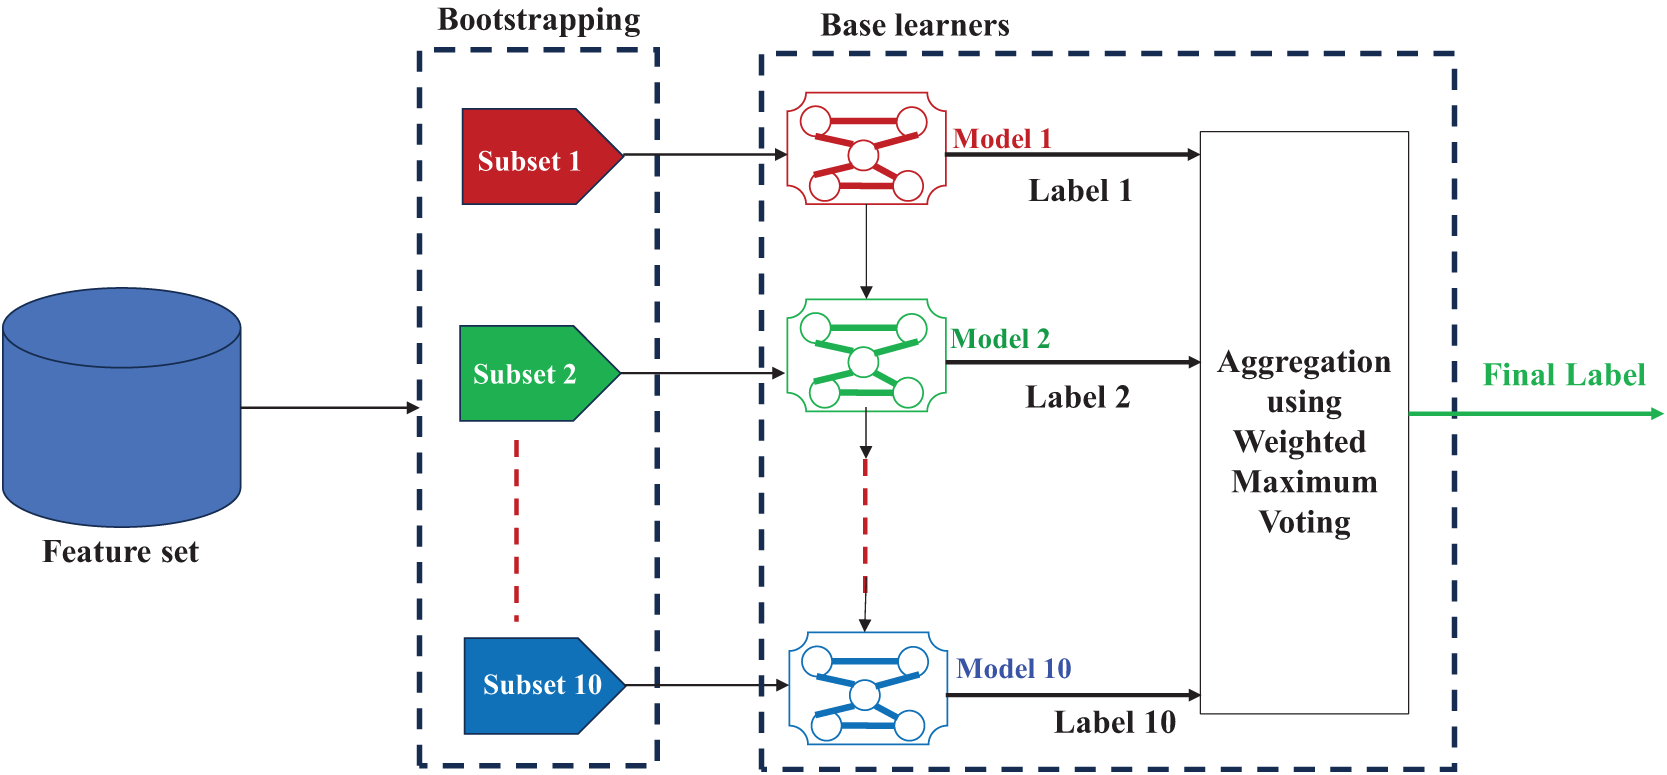
Figure 4: LB based ensemble classification framework
Eq. (4) presents the feature vectors of the dataset and Eq. (5) presents the class labels. In the studied case,
In Eq. (6),
In each boosting iteration, LB updates the model by fitting a new base learner (RF in our case) on the weighted error of the previous classifier. The weight update follows a logistic regression approach, focusing on improving the prediction of misclassified instances. The update rule at iteration
In Eq. (7),
The model improves iteratively by reducing the loss, given by:
In Eq. (8),
After training
Eq. (9) shows that the final classification is given by the weighted majority voting of the
The overall process of LB based ensemble classification is depicted with the help of Fig. 4. In this research, an ensemble classification model, utilizing LB is developed. It employs Random Forest (RF) as base classifiers. The number of base learners is set to
The following mathematical expressions define the procedures for calculating the evaluation metrics used in this study: Accuracy, F1-score, area under the curve (AUC), Specificity, and Cohen’s Kappa (κ). To provide a comprehensive assessment of model performance in multi-class classification tasks, these metrics offer complementary perspectives on predictive accuracy, class discrimination, and agreement with the true labels.
Accuracy measures the proportion of correctly classified instances among all samples:
where TP is true positives, TN is true negatives, FP is false positives, and FN is false negatives.
Specificity quantifies the model’s ability to correctly identify negative instances:
The F1-score is the harmonic mean of precision and recall, providing a balance between the two:
where
Cohen’s kappa measures the agreement between predicted and true labels, adjusted for agreement occurring by chance:
where
2.6.5 Area under the Curve (AUC)
AUC refers to the area under the Receiver Operating Characteristic (ROC) curve and summarizes the model’s ability to distinguish between classes across all thresholds. AUC can be approximated as the sum of areas of trapezoids under the ROC curve:
where TPR is the true positive rate and FPR is the false positive rate.
2.7 Dimensionality Reduction (DR)
Dimensionality reduction (DR) techniques are applied to decrease the number of input features while preserving the most informative aspects of the data. This process improves model efficiency and can help mitigate overfitting, especially in high-dimensional time series. The dimensionality reduction rate can be quantified as the ratio of the number of selected features to the original length of the time series:
The computational complexity of each function to be embedded in small smart meters should be selected wisely to reduce the large-scale installation costs and for faster computations. For this reason, the second important step in this process is to evaluate the performance of each feature by its computational complexity.
Based on the computational complexity of each function available in TSFEL, we compared the performance of each classification algorithm by calculating the various metrics, such as accuracy, specificity, F1-score, Kappa score, and AUC score. Among the 24 extracted features after ANOVA, 1 of them has quadratic computational complexity, and 2 of them have log-linear complexity. After removing these 3 features, the remaining 21 features performed comparatively well. Because of the implications mentioned above, these 3 features were removed to provide an efficient, fast and cheap solution with computational complexity at most

Further reduction in the number of selected features reduces the performance of the classification algorithms. For this reason, the optimal solution is found to be linear complexity, which is suitable and efficient for our purposes.
3.1 Offline Processing Results: Comparing Domains
The best performance is obtained by using the features listed within domains Statistical and Temporal. The comparison of different combinations of such domains is given in Table 1. In all 5 classification algorithms (kNN, SVM, RF, ANN, XGBoost), Statistical and Temporal pair gives the best performance, hence reducing the number of features from original length 364 to 45. This gives


It is evident that, RF classifier performs the best among other classifiers. XGB and ANN perform similarly, while kNN performing with the least accuracy. It is recommended to compare the results of RF for different domains which are represented in Table 1, previously.
Selecting the features after ANOVA generally improved the accuracy of most of the classifiers, except kNN and ANN. ANN works better with more data, and the decrease in the performance is reasonable. Similarly, with fewer features kNN performed slightly lower.
Selecting the features with the lowest complexity even improved the accuracy of most of the classifiers, except SVM. The improvement here is not vital, as long as performance results are close enough to results given in Table 4, as the primary aim here is to reduce the computational time on front-end smart-meter devices. Nevertheless, RF has still the superior performance results, even when compared to results given in Tables 4 and 5.
For fast processing of power consumption signals, it is important to choose the features which require less computational complexity. Based on our observations, it is possible to limit the complexity of the features selected by

Reducing the number of features to 21 with minimal complexity, when compared with the count of samples, 364, in the time-series of each instance it increases the dimensionality reduction to
The main outcome of the offline processing modules (cf. Fig. 1) is the selection of pertinent and low complexity features set. Based on this rigorous analysis, during online front-end processing, only these identified features are mined form the incoming segmented smart meters real power consumption waveforms. By following this approach only 21 minimal complexity and most pertinent features are mined in place of all possible features, in total 156, available in the TSFEL. This method is particularly appealing for the realization of efficient and effective front-end embedded processors for wireless transmission of data towards cloud servers. Such solutions have stringent constraints in terms of the size, computational cost, power consumption, and transmission activity. The key design challenges are to keep the system efficient without compromising the performance in terms of accuracy and latency.
In this context, in real-time processing, only the short listed pertinent features are computed at the front-end level and then these are communicated towards the specifically designed LB based ensemble classifier for an automated categorization of intended appliances. To avoid any limitation in the count of instances in the available dataset, the five-fold cross validation strategy is used. Moreover, multiple evaluation measures are employed to evade any biasness in findings.
The classification results for the selected and low complexity features are outlined in Table 3. Here, C1 to C9 are respectively presenting the Coffee machines, Computer Stations, Fans, Fridges & Freezers, Kettles, Lamps, Microwaves, Printers, and Shavers.
Table 7 shows that the highest classification accuracy of 99.595% is secured for C2 and the lowest classification accuracy of 96.471% is attained for C8. The average accuracy score of 97.930% is attained for the intended nine-class appliances categorization. The system has demonstrated consistent performance by securing a specificity value of 100% for C2. While the lowest specificity value of 97.768% is attained for C7. The solution attained an average specificity value of 98.801%. A persistent behavior is maintained by the system by securing the highest F1 score of 98.305% for the case of C2. The lowest F1 score of 84.211% is obtained for the case of C8. The average F1 score of 91.272% is achieved for the nine-class problem. The highest Kappa value of 99.538% is also achieved for the case of C2 and the lowest Kappa value of 95.874% is achieved for C8. The average Kappa value of 97.6% is obtained. Similarly, the highest and lowest AUC values of 99.9% and 98.0% are respectively secured for C2 and C8. The average AUC value of 99.4% is obtained for the intended nine-class problem.

Table 8 outlines that the highest classification accuracy of 99.593% is secured for C2 and the lowest classification accuracy of 96.078% is attained for C7. The avelrage accuracy score of 97.792% is attained for the intended nine-class appliances categorization. The system has demonstrated consistent performance by securing a specificity value of 100% for C2. While the lowest specificity value of 97.748% is attained for C4 and C5. The solution attained an average specificity value of 98.747%. A persistent behavior is maintained by securing the highest F1 score of 98.305% for the case of C2. The lowest F1 score of 82.759% is obtained for the case of C7. The average F1 score of 90.72% is achieved for the nine-class problem. The highest Kappa value of 99.535% is also achieved for the case of C2 and the lowest Kappa value of 96.769% is achieved for C5, C6, and C8. The average Kappa value of 97.435% is obtained. Similarly, the highest and lowest AUC values of 99.9% and 98.0% are respectively secured for C2 and C8. The average AUC value of 99.444% is obtained for the intended nine-class problem.
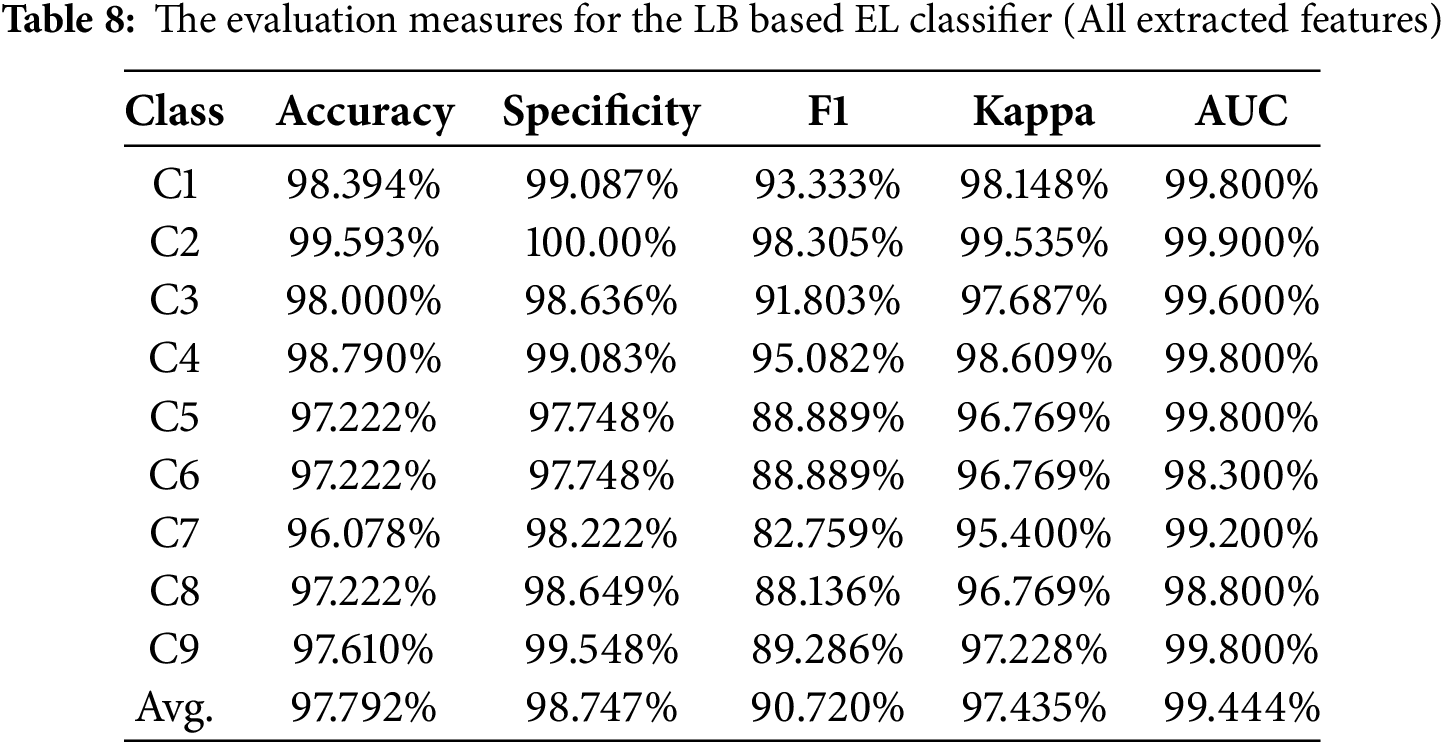
The results, outlined in Tables 7 and 8 confirm robustness of the devised TSFEL based feature extraction, domain fusion based features preparation, ANOVA based feature selection, and LB based ensemble of RF classifiers for an automated identification of appliances by solely processing their real power consumption patterns. It is evident from Tables 7 and 8 that average values of all intended evaluation measures are above 90%, which assures the strength of designed solution for the targeted application.
It is also evident that the devised feature selection mechanism not only results in 17.33-fold dimension reduction and 4.27-fold latency diminishing compared to the case when full features set, extracted using TSFEL, is employed for the considered classification task. Additionally, the average classification accuracy is 0.138% higher for the selected feature set as compared to the case when all-features set is used. It assures that the designed solution not only favorable in terms of the diminishing of dimensionality and computational cost but also reduces the confusion by avoiding confusing attributes among the all-feature set. Furthermore, the solution is promising for an efficient data transmission and cloud-based classifier computational effectiveness, as it has to deal with 17.33-fold lower dimension data compared to the case when the considered time-series data is conveyed and processed. Finally the solution is also appealing in terms of a lower latency.
The performance of devised solution is compared with key existing methodologies. These findings are summarized in Table 9.

When comparing the proposed method with the considered studies (cf. Table 9), several key differences in waveforms, feature extraction techniques, classification problems, classifiers, and accuracy are evident. The proposed method utilizes real power data with features selected from statistical and temporal domains, focusing on a 9-class classification problem, achieving an accuracy of 97.93%. In contrast, studies like [2,28] use real power, reactive power, and RMS current/voltage waveforms, with traditional techniques such as delta coefficients and Gaussian Mixture Models (GMM) or Random Forests (RF), resulting in accuracies of 89.78% and 75.65%, respectively. Deep learning approaches, such as [14,21,22,29] employ current and voltage waveforms with architectures like GA + Bi-LSTM, CNNs, or Residual CNNs, achieving high accuracy (94%–98%) but requiring substantial computational resources, making them less practical for real-time, resource-constrained systems. Lightweight CNN approaches, like [23], attempt to reduce computational load while maintaining performance, achieving 95% accuracy. Feature reduction combined with ensemble classifiers, as in [24], demonstrates another strategy to balance accuracy and efficiency, achieving 95.88%. The proposed ensemble framework with LogitBoost-based Random Forest classifiers outperforms these methods in both accuracy and computational efficiency, making it highly suitable for large-scale, low-latency applications. Additionally, by reducing data dimensionality and optimizing front-end processing, the proposed approach offers a practical advantage over more complex systems, supporting real-time appliance recognition in diverse operational environments.
The devised method offers certain benefits, making it a robust smart home energy analytics solution. Its generic nature allows for easy adaptation to various potential applications beyond appliance identification, making it highly versatile. The method ensures high accuracy and computational efficiency by leveraging statistical and temporal features crucial for real-time, resource-limited environments. The scalable architecture, which separates front-end processing from cloud-based analysis, ensures flexibility and low-latency performance, which are crucial for large-scale deployments.
In particular, the proposed framework supports scalability by decoupling feature extraction (at the edge) from classification (in the cloud), allowing parallel processing across households and geographic regions. This modular design enables integration into nationwide smart grid infrastructures, where high-frequency, large-volume data streams can be processed concurrently without bottlenecks. Furthermore, ensemble learning methods like Random Forests and LogitBoost inherently support parallelization, making them suitable for distributed execution in cloud-based environments.
Furthermore, combining Random Forests with LogitBoost, the ensemble learning framework improves robustness and classification accuracy, making the system more reliable and adaptive to varying household conditions. As validated in our complexity analysis, the system’s ability to maintain performance in high-dimensional settings further supports its suitability for deployment in real-world, large-scale scenarios. Ultimately, this methodology advances intelligent appliance identification and significantly contributes to smarter energy management and decision support systems, enabling more efficient and sustainable energy consumption in smart homes.
In this study, we proposed a comprehensive and efficient framework for automatic household appliance identification based on smart meter data. By carefully analyzing individual and paired feature domains from the Time-Series Feature Extraction Library (TSFEL), we demonstrated that combining statistical and temporal features offers an optimal balance between classification accuracy and dimensionality reduction. This selective feature strategy not only improves data transmission and storage efficiency but also significantly reduces computational complexity, making the method suitable for real-world deployment on resource-constrained smart meter devices. Additionally, we introduced a robust ensemble learning approach using Random Forest classifiers enhanced with LogitBoost, which effectively corrects misclassifications and improves overall system reliability. The separation of on-device preprocessing and cloud-based analysis further enhances the system’s flexibility and scalability, supporting real-time applications and simplified future updates. The proposed solution has attained an impressive classification accuracy of 97.93% for a nine-class problem, coupled with a 17.33-fold dimensionality reduction and 4.27-fold latency diminishing. Its minimal computational demands on the front end make it particularly well-suited for practical deployment in real-world smart grid applications.
Despite the promising results and the demonstrated efficacy of our proposed framework, certain limitations remain to be addressed in future research. These limitations relate to the scope of the data, the environmental conditions, privacy, real-world implementation, and the specific appliance categories considered in this study. One limitation of this study is its reliance on a limited dataset for model training and evaluation. While the proposed framework achieved high classification accuracy and computational effectiveness, its generalizability to diverse real-world conditions such as varying appliance types, user behaviors, and noise environments remains untested. Also the inclusion of environmental and contextual factors and their impact on the performance of proposed model need to be considered. Another limitation is the lack of investigation in industrial settings, where reactive power and harmonic distortions are significant. Moreover, practical deployment of the devised method in a real-world smart grid environment needs to be validated. An additional limitation is the potential privacy and security risks associated with collecting detailed appliance-level data and needs to be explored.
In future studies, we plan to test the proposed framework on different and larger-scale datasets, which may include varying appliance types, user behaviors, noise, overlapping usage scenarios, and regional characteristics. The environmental and contextual factors will also be considered. The cross-dataset validation will also be considered to demonstrate the robustness of the proposed approach. Moreover, the inclusion of reactive power and harmonics with real power consumption can also be considered for cases involving heavy industrial machinery. This will help validate the generalizability and adaptability of the method across diverse real-world settings. The privacy preservation and security related aspects will also be investigated. Furthermore, future work will include implementing the proposed framework on embedded hardware platforms to evaluate computational load, memory usage, and energy consumption in practical scenarios. This will allow us to further optimize the system for resource-constrained environments. In addition, integrating additional advanced machine learning, ensemble learning, and deep learning techniques and exploring their potential to further enhance performance remain interesting directions for future research. Overall, the proposed approach provides a solid foundation for developing practical, accurate, and efficient appliance recognition systems, contributing to smarter energy management and more intelligent grid operations.
Acknowledgement: The authors are thankful to the American University of the Middle East for providing the technical and logistic support.
Funding Statement: The authors received no specific funding for this study.
Author Contributions: The authors confirm contribution to the paper as follows: Conception and design: Ugur Madran, Saeed Mian Qaisar; Methodology: Saeed Mian Qaisar, Ugur Madran; Data collection: Saeed Mian Qaisar; Software: Saeed Mian Qaisar, Ugur Madran; Visualisation: Saeed Mian Qaisar; Analysis and interpretation of results: Ugur Madran, Saeed Mian Qaisar, Duygu Soyoglu; Draft manuscript preparation: Ugur Madran, Saeed Mian Qaisar, Duygu Soyoglu. All authors reviewed the results and approved the final version of the manuscript.
Availability of Data and Materials: The data that support the findings of this study are openly available in ACS-F2 dataset at https://icosys.ch/acs-f2 (accessed on 16 October 2024).
Ethics Approval: Not applicable.
Conflicts of Interest: The authors declare no conflicts of interest to report regarding the present study.
References
1. Qaisar SM, Madran U, Soyoglu D. Time series analysis with machine learning for smart meter data based appliances categorization. In: Proceedings of the 2025 Eighth International Women in Data Science Conference at Prince Sultan University (WiDS PSU); 2025 Apr 13–14; Riyadh, Saudi Arabia. Piscataway, NJ, USA: IEEE; 2025. p. 1–6. doi:10.1109/WiDS-PSU64963.2025.00015. [Google Scholar] [CrossRef]
2. Ridi A, Gisler C, Hennebert J. ACS-F2—a new database of appliance consumption signatures. In: Proceedings of the 2014 6th International Conference of Soft Computing and Pattern Recognition (SoCPaR); 2014 Aug 11–14; Tunis, Tunisia. Piscataway, NJ, USA: IEEE; 2014. p. 145–50. doi:10.1109/socpar.2014.7007996. [Google Scholar] [CrossRef]
3. Sun Q, Li H, Ma Z, Wang C, Campillo J, Zhang Q, et al. A comprehensive review of smart energy meters in intelligent energy networks. IEEE Internet Things J. 2016;3(4):464–79. doi:10.1109/JIOT.2015.2512325. [Google Scholar] [CrossRef]
4. Alahakoon D, Yu X. Smart electricity meter data intelligence for future energy systems: a survey. IEEE Trans Ind Inform. 2016;12(1):425–36. doi:10.1109/TII.2015.2414355. [Google Scholar] [CrossRef]
5. Pereira L, Costa D, Ribeiro M. A residential labeled dataset for smart meter data analytics. Sci Data. 2022;9:134. doi:10.1038/s41597-022-01252-2. [Google Scholar] [PubMed] [CrossRef]
6. Okereke GE, Bali MC, Okwueze CN, Ukekwe EC, Echezona SC, Ugwu CI. K-means clustering of electricity consumers using time-domain features from smart meter data. J Electr Syst Inf Technol. 2023;10(1):2. doi:10.1186/s43067-023-00068-3. [Google Scholar] [CrossRef]
7. Irani Azad M, Rajabi R, Estebsari A. Nonintrusive load monitoring (NILM) using a deep learning model with a transformer-based attention mechanism and temporal pooling. Electronics. 2024;13(2):407. doi:10.3390/electronics13020407. [Google Scholar] [CrossRef]
8. Papaioannou A, Dimara A, Kouzinopoulos CS, Krinidis S, Anagnostopoulos CN, Ioannidis D, et al. LP-OPTIMA: a framework for prescriptive maintenance and optimization of IoT resources for low-power embedded systems. Sensors. 2024;24(7):2125. doi:10.3390/s24072125. [Google Scholar] [PubMed] [CrossRef]
9. Dormido R, Duro N, Bañales S. Multi-step clustering of smart meters time series: application to demand flexibility characterization of SME customers. Comput Model Eng Sci. 2025;142(1):869–907. doi:10.32604/cmes.2024.054946. [Google Scholar] [CrossRef]
10. Wang Z, Zhang H, Deconinck G, Song Y. A unified model for smart meter data applications. IEEE Trans Smart Grid. 2025;16(3):2451–63. doi:10.1109/TSG.2025.3553173. [Google Scholar] [CrossRef]
11. Barnicoat G, Danson M. The ageing population and smart metering: a field study of householders’ attitudes and behaviours towards energy use in Scotland. Energy Res Soc Sci. 2015;9:107–15. doi:10.1016/j.erss.2015.08.020. [Google Scholar] [CrossRef]
12. Thunshirn P, Mlinaric I, Berg J. A qualitative analysis of consumer motivations and barriers towards active smart meter utilization. Energy Policy. 2025;203:114623. doi:10.1016/j.enpol.2025.114623. [Google Scholar] [CrossRef]
13. Li J, Xi X, Li S, Wu S, Qiao T. DPP-GAN: a decentralized and privacy-preserving GAN system for collaborative smart meter data generation. Energy Build. 2025;333:115489. doi:10.1016/j.enbuild.2025.115489. [Google Scholar] [CrossRef]
14. Küçükyildiz G. Derin öğrenme tabanlı Elektrikli Ev Aletleri Veri Setinin Sınıflandırılması. Int J Eng Technol Appl Sci. 2023;6(1):75–80. doi:10.53448/akuumubd.1288738. [Google Scholar] [CrossRef]
15. Petralia A, Charpentier P, Palpanas T. ADF & TransApp: a transformer-based framework for appliance detection using smart meter consumption series. arXiv:2401.05381. 2023. doi:10.14778/3632093.3632115. [Google Scholar] [CrossRef]
16. Abera FZ, Khedkar V. Machine learning approach electric appliance consumption and peak demand forecasting of residential customers using smart meter data. Wirel Pers Commun. 2020;111(1):65–82. doi:10.1007/s11277-019-06845-6. [Google Scholar] [CrossRef]
17. Tripathy HK, Talukdar S, Hussain SA, Mallik S. Appliance energy prediction using time series forecasting: a comparative analysis of different machine learning algorithms. 2025 [Online]. [cited 2025 Jan 1]. Available from: https://sciety.org/articles/activity/10.21203/rs.3.rs-6257198/v1. [Google Scholar]
18. Shamim G, Rihan M. Multi-domain feature extraction for improved clustering of smart meter data. Technol Econ Smart Grids Sustain Energy. 2020;5(1):10. doi:10.1007/s40866-020-00080-w. [Google Scholar] [CrossRef]
19. Li Q, Zhao F, Li Z, Qiu Z, Wu X. Feature extraction method of electric power user-side metering data based on text classification. In: Proceedings of the 2024 9th International Conference on Cyber Security and Information Engineering; 2024 Sep 15–17; Kuala Lumpur, Malaysia. New York, NY, USA: ACM; 2024. p. 852–7. doi:10.1145/3689236.3695400. [Google Scholar] [CrossRef]
20. Al Talib R, Qaisar SM, Fatayerji H, Waqar A. Features mining and machine learning for home appliance identification by processing smart meter data. In: Proceedings of the 2023 1st International Conference on Advanced Innovations in Smart Cities (ICAISC); 2023 Jan 23–25; Jeddah, Saudi Arabia. Piscataway, NJ, USA: IEEE; 2023. p. 1–6. doi:10.1109/ICAISC56366.2023.10085074. [Google Scholar] [CrossRef]
21. Ulloa-Vásquez F, Heredia-Figueroa V, Espinoza-Iriarte C, Tobar-Ríos J, Aguayo-Reyes F, Carrizo D, et al. Model for identification of electrical appliance and determination of patterns using high-resolution wireless sensor NETWORK for the efficient home energy consumption based on deep learning. Energies. 2024;17(6):1452. doi:10.3390/en17061452. [Google Scholar] [CrossRef]
22. Qu L, Kong Y, Li M, Dong W, Zhang F, Zou H. A residual convolutional neural network with multi-block for appliance recognition in non-intrusive load identification. Energy Build. 2023;281:112749. doi:10.1016/j.enbuild.2022.112749. [Google Scholar] [CrossRef]
23. Pau D, Marc RD, Denaro D. Electric current classification with tiny machine learning for home appliances. In: Proceedings of the 2022 IEEE International Workshop on Metrology for Industry 4.0 & IoT (MetroInd4.0&IoT); 2022 Jun 7–9; Trento, Italy. Piscataway, NJ, USA: IEEE; 2022. p. 149–54. doi:10.1109/MetroInd4.0IoT54413.2022.9831563. [Google Scholar] [CrossRef]
24. Cabral TW, Neto FB, de Lima ER, Fraidenraich G, Meloni LGP. Analysis of variance combined with optimized gradient boosting machines for enhanced load recognition in home energy management systems. Sensors. 2024;24(15):4965. doi:10.3390/s24154965. [Google Scholar] [PubMed] [CrossRef]
25. Cabral TW, Neto FB, de Lima ER, Fraidenraich G, Meloni LGP. Load recognition in home energy management systems based on neighborhood components analysis and regularized extreme learning machine. Sensors. 2024;24(7):2274. doi:10.3390/s24072274. [Google Scholar] [PubMed] [CrossRef]
26. Barandas M, Folgado D, Fernandes L, Santos S, Abreu M, Bota P, et al. TSFEL: time series feature extraction library. SoftwareX. 2020;11:100456. doi:10.1016/j.softx.2020.100456. [Google Scholar] [CrossRef]
27. Qaisar SM, Khan SI, Dallet D, Tadeusiewicz R, Pławiak P. Signal-piloted processing metaheuristic optimization and wavelet decomposition based elucidation of arrhythmia for mobile healthcare. Biocybern Biomed Eng. 2022;42(2):681–94. doi:10.1016/j.bbe.2022.05.006. [Google Scholar] [CrossRef]
28. Ghorbanpour S, Mallipeddi R. Significance of classifier and feature selection in automatic identification of electrical appliances. In: Proceedings of the 2018 IEEE International Conference on Systems, Man, and Cybernetics (SMC); 2018 Oct 7–10; Miyazaki, Japan. Piscataway, NJ, USA: IEEE; 2019. p. 4184–9. doi:10.1109/SMC.2018.00709. [Google Scholar] [CrossRef]
29. Salazar-González JL, Luna-Romera JM, Carranza-García M, Álvarez-García JA, Soria-Morillo LM. Enhancing smart home appliance recognition with wavelet and scalogram analysis using data augmentation. Integr Comput Aided Eng. 2024;31(3):307–26. doi:10.3233/ica-230726. [Google Scholar] [CrossRef]
Cite This Article
 Copyright © 2025 The Author(s). Published by Tech Science Press.
This work is licensed under a Creative Commons Attribution 4.0 International License , which permits unrestricted use, distribution, and reproduction in any medium, provided the original work is properly cited.
 Downloads
 Citation Tools