
 Submit a Paper
 Propose a Special lssue
 Open Access
ARTICLE

A Meta-Learning Model for Mortality Prediction in Patients with Chronic Cardiovascular Disease
1 Department of Information Science, University of North Texas, Denton, TX 76201, USA
2 Department of Merchandising and Digital Retailing, University of North Texas, Denton, TX 76201, USA
* Corresponding Author: Bugao Xu. Email:
Computer Modeling in Engineering & Sciences 2025, 145(2), 2383-2399. https://doi.org/10.32604/cmes.2025.072259
Received 22 August 2025; Accepted 22 October 2025; Issue published 26 November 2025
 View Full Text
 Download PDF
Abstract
Cardiovascular diseases (CVD) remain a leading cause of mortality worldwide, highlighting the need for precise risk assessment tools to support clinical decision-making. This study introduces a meta-learning model for predicting mortality risk in patients with CVD, classifying them into high-risk and low-risk groups. Data were collected from 868 patients at Tabriz Heart Hospital (THH) in Iran, along with two open-access datasets—the Cleveland Heart Disease (CHD) and Faisalabad Institute of Cardiology (FIC) datasets. Data preprocessing involved class balancing via the Synthetic Minority Over-Sampling Technique (SMOTE). Each dataset was then split into training and test sets, and 5-fold cross-validation was employed to validate generalizability. Several machine-learning algorithms were stacked as base classifiers to generate meta-features, which were then input to a meta-learner combining their predictive strengths through soft voting. An ablation experiment was performed to identify the optimal configuration with two base classifiers—Random Forest (RF) and Support Vector Machine (SVM)—and two boosting classifiers—AdaBoost (ADB) and XGBoost (XGB). The model achieved 88% accuracy, 91% AUC, and 79.1% sensitivity on the THH dataset; 82.77% accuracy, 89.37% AUC, and 93.72% sensitivity on the CHD dataset; and 81.8% accuracy, 82.8% AUC and 78.8% sensitivity the FIC dataset, demonstrating the model’s generalizability across diverse datasets. To further enhance interpretability, Shapley Additive Explanations (SHAP) were applied to quantify each attribute’s contribution to predicted CVD risk, providing both global and local insights to help clinicians identify key risk factors and guide personalized care.Keywords
Cardiovascular diseases (CVD), including coronary artery disease and congestive heart failure, remain critical global health challenges. Patients with a history of heart attacks face elevated risks of subsequent cardiovascular events, underscoring the need for accurate risk assessment tools. Traditional methods have relied on factors such as age and gender for risk assessment [1]. Gattringer et al. [2] employed logistic regression to predicted mortality. Verma et al. [3] identified heart rate as a mortality predictor using correlation tests. Cheng et al. [4] compared estimated pulse wave velocity with traditional risk factors using Cox models and Kaplan-Meier analysis. Other studies used age-standardized mortality rates in meta-analyses to predict risk [5].
Recent advancements in machine learning offer new predictive modeling possibilities. Machine learning methods excel in capturing complex, non-linear interactions within data. Shallow learning algorithms such as SVM, RF, gradient boosting (GB), and XGB have demonstrated effectiveness CVD prediction [6,7]. Moridani et al. [8] used heart rate variables to predict CVD through a hybrid model combining fuzzy logic and neural networks. Chandrasekhar and Peddakrishna [6] highlighted the capability of RF, SVM, and GB to handle high-dimensional data, while Ahmed et al. [9] showed that decision trees, k-nearest neighbors (KNN), XGB, and SVM could predict health status. Gündoğdu [10] employed XGB and RF for early-stage diabetes prediction. Olawade et al. [11] conducted a comparative study of KNN, SVM, RF and logistic regression for CVD prediction, however their research was limited to utilization of only one algorithm which was performing better than the others. Agrawal et al. [12] devised a machine learning model to predict mortality risk in patients with Takotsubo cardiomyopathy.
Deep learning methods have also been applied in predicting mortality and heart disease. García-Ordás et al. [13] used a sparse autoencoder for data argumentation and a convolutional neural network (CNN) for heart disease risk prediction, achieving up to 90% precision. Lee et al. [14] developed a deep learning model for heart failure and mortality prediction among hypertensive patients, outperforming traditional methods. Several well-known datasets, including the Cleveland, Hungary, Switzerland, and Long Beach datasets, were used to train these models. However, the evaluation metrics reported for some of these studies indicated limited accuracy and precision [15].
To create a robust model suitable for both large and small datasets, combining traditional benchmarks through ensemble learning and meta-learning can be effective. Ensemble techniques, e.g., bagging, boosting, stacking, and voting, improve model performance by integrating features from multiple models. Mohammed and Kora [16] demonstrated that stacking outperforms other ensemble methods, while voting strategies have also shown promise in creating robust predictive models [17]. Certain machine learning models appear to be more effective in handling high-dimensional data and capturing non-linear patterns. Random forests (RF) are particularly adept at reducing variance, while gradient-boosting methods help minimizing bias [18]. Ensemble approaches, such as those combining ADB and XGB, can strengthen weak learners while providing robust regularization [19].
Data preprocessing plays a crucial role in medical data analysis. High-dimensional data is common due to the multifaceted nature of human biology. PCA can reduce dimensionality and multicollinearity to improve model stability. Tamal et al. [20] showed improved performance using PCA in heart disease prediction. Addressing class imbalance in datasets is another important challenge. Techniques such as SMOTE generate synthetic samples to balance training data, thereby enhancing predictive accuracy [7].
This research aims to address the above-mentioned challenges by implementing a meta-learning model to predict mortality among patients with a history of heart attacks. The model integrates the predictions from base machine-learning algorithms as meta-features and uses them as input for a meta-learner consisting of boosting classifiers. By framing mortality prediction as a binary classification problem, the model simplifies the complex task of predicting mortality and provides healthcare professionals with a practical tool for informed, personalized treatment decisions. Multiple performance metrics, including accuracy, area under the curve (AUC), sensitivity, specificity, geometric mean (G-Mean), and Matthews correlation coefficient (MCC), have been used to ensure comprehensive evaluation on the proposed model. To enhance generalizability, the model was trained using one proprietary dataset collected specifically for this study, along with two publicly available datasets widely used in related research [7,21].
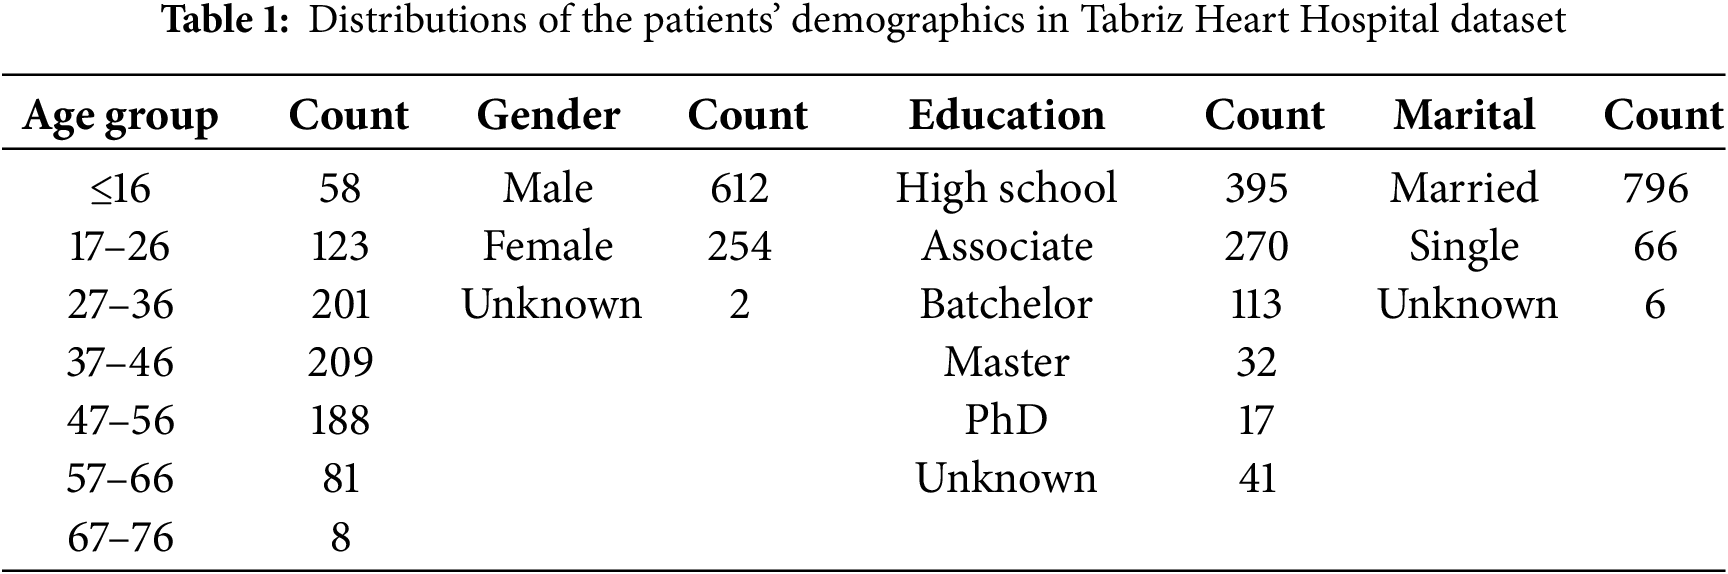
This research uses data collected from 868 patients with a history of stroke or other various heart diseases from the Tabriz Heart Hospital (THH) in Iran, spanning from 2016 to 2019. The dataset includes attributes categorized into four critical areas for predicting cardiovascular outcomes: patient demographics, clinical conditions, blood tests, and medications. Table 1 presents the demographic distribution of patients, including age, gender, education, and marital status. In this dataset, the number of male patients was more than twice that of female patients. Most patients were between 27 and 56 years old, married, and had an educational background of either high school or an associate degree.
In the category of clinical conditions, diabetes mellitus, hypertension, and smoking status were included in the THH dataset because of their well-established association with cardiovascular disease [22]. Poor glycemic control in diabetes contributes to vascular damage, while hypertension increases cardiac workload and promotes arterial stiffness [1]. Smoking is another major risk factor, accelerating atherosclerosis and heightening thrombotic risk [22]. In addition, categorical cardiac indicators, such as chest pain type (CP), number of major coronary vessels visualized (CA), resting blood pressure (Trestbp), and maximum heart rate achieved (Thalach), and exercise induced angina (Exang) were recorded into the dataset. Key biochemical parameters were also collected, including cholesterol and creatine phosphokinase (CPK) and existing diabetes condition. Furthermore, the dataset included information on medications commonly prescribed for cardiovascular management, such as Heparin, Diuretics and Beta-blockers. This is because beta-blockers and calcium channel blockers can treat hypertension and angina by lowering cardiac output and dilating blood vessels, while ACE inhibitors and diuretics may prevent heart failure by reducing blood pressure and alleviating fluid overload [22].
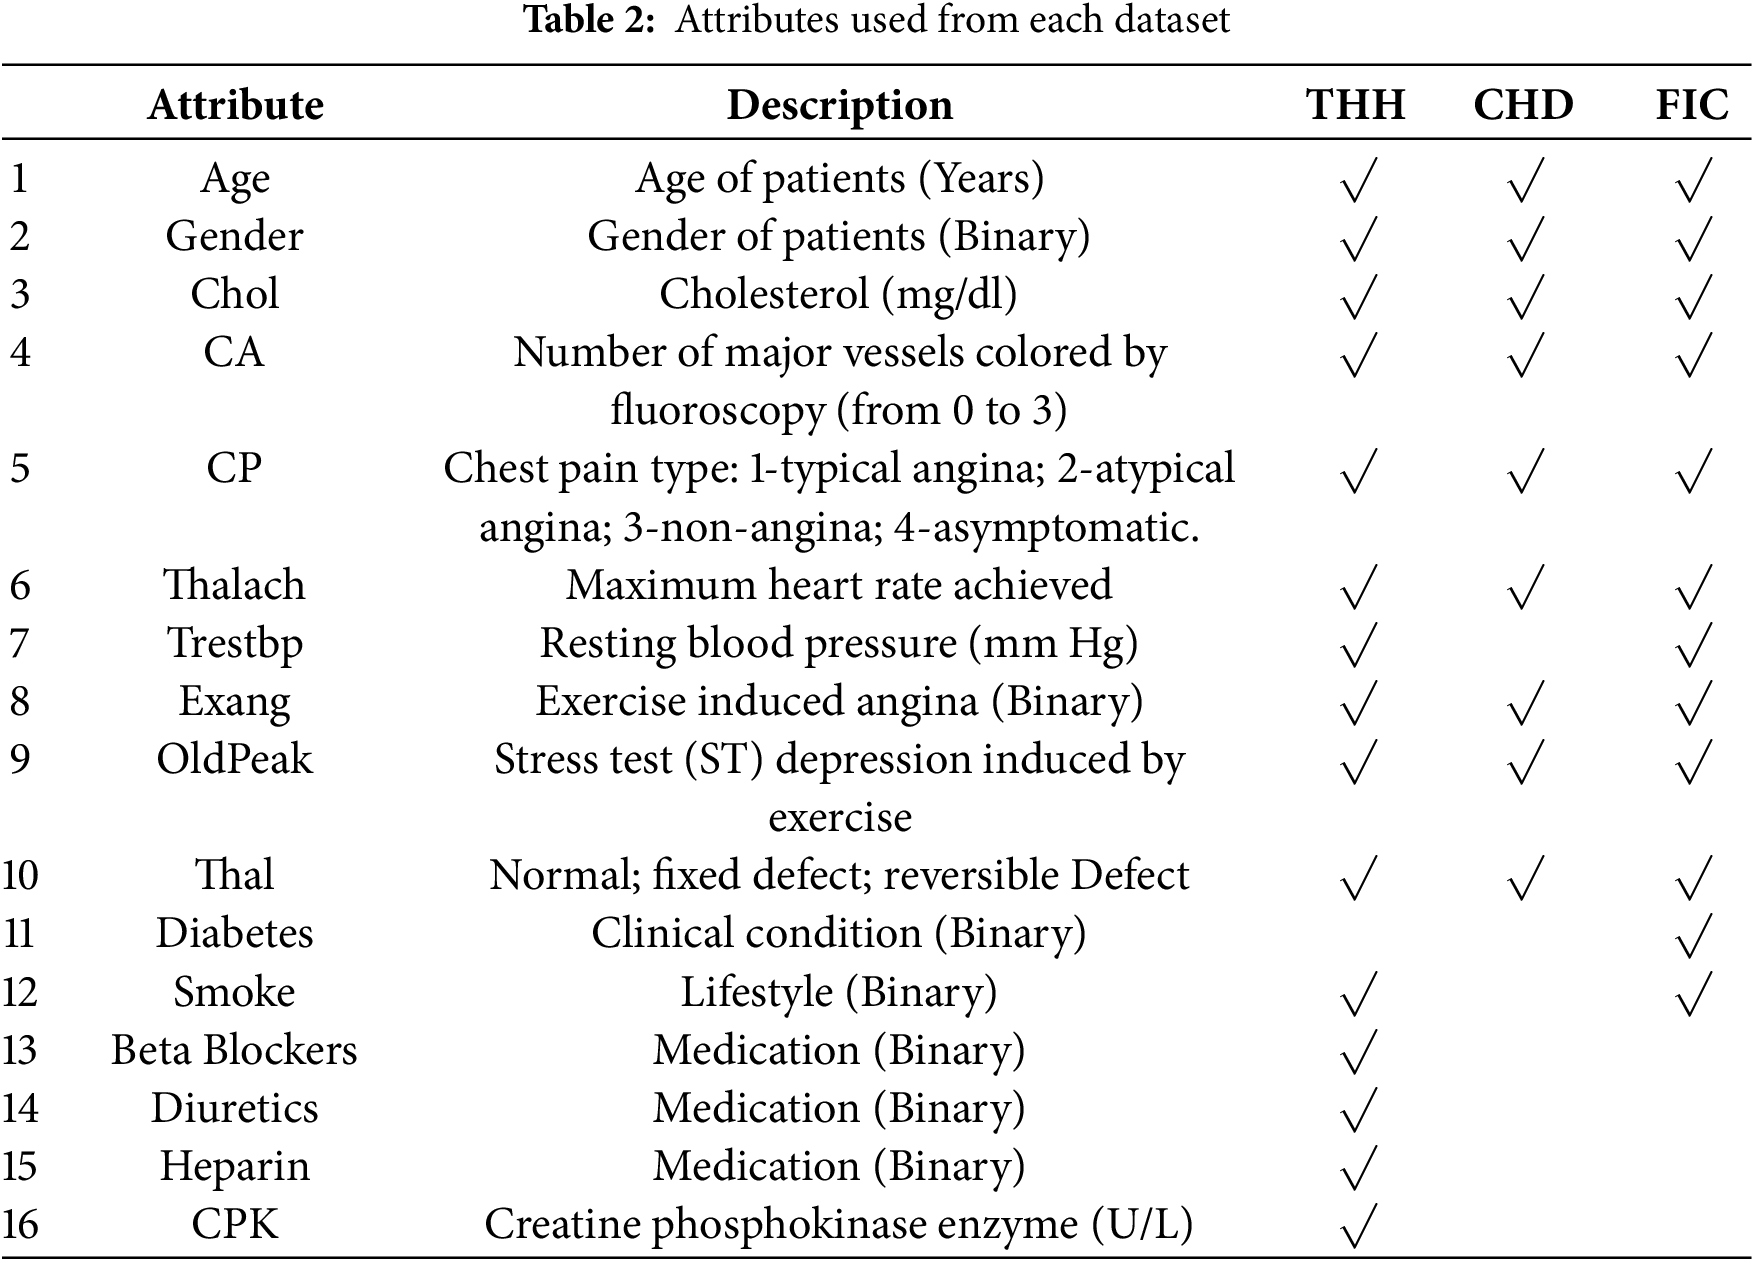
In addition to THH, the open-access datasets, CHD [23] and FIC [7], were also used to test the generalizability of the suggested meta learning model. Collected by the Cleveland Clinic Foundation, CHD is widely used in research related to coronary artery disease. It includes 303 samples and 14 attributes, including patients’ demographics, complete blood count (CBC) and cardiac indicators mentioned before. FIC, obtained from Faisalabad Institute of Cardiology, includes attributes from CBC along with similar cardiac indicators and demographic attributes. Table 2 lists the attributes used from each of the three dataset.
The following outlines the key steps in developing a predictive model for mortality in heart attack patients, including data preprocessing, base model training, meta-learning, and evaluation.
Data pre-processing is crucial for analyzing heart attack risk factors, as data quality directly impacts accuracy and reliability. Raw data often contains errors and inconsistencies due to missing values. In this study, mean value imputation was used to handle missing values, thereby preserving dataset integrity with minimal information loss [24]. To mitigate data imbalance, where one class significantly outnumbers the other, the SMOTE technique was applied to enhance model robustness and accuracy [25]. Fig. 1 illustrates the number of samples before and after SMOTE.
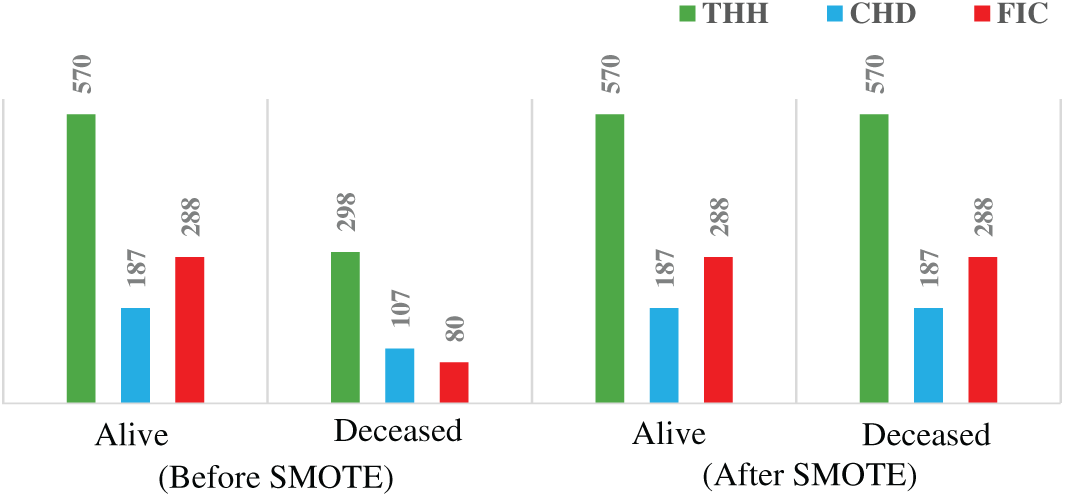
Figure 1: Minority class enhancement result, before and after using SMOTE
Normalization and scaling were applied to place variables with diverse ranges on a common scale [26,27]. In the model evaluation, each dataset was divided into training and testing subsets using an 80–20 split. Additionally, 5-fold cross-validation (CV) was performed to ensure robust model assessment and to generate meta-features, while preserving class distribution across folds [28].
Various machine learning algorithms can be utilized to analyze the datasets to reveal complex patterns and relationships among various risk factors for heart disease. Commonly used models include RF, GB, AdaBoost, XGBoost, and SVM, each offering distinct advantages in predictive accuracy [29]. However, when applied individually, these algorithms may fail to capture the full scope of predictive potential of the data. To address this limitation, ensemble learning methods have gained prominence for their ability to integrate the outputs of multiple models, thereby enhancing both accuracy and robustness. Techniques such as stacking, voting, and bagging have proven particularly effective in heart disease prediction, as they enable multiple algorithms to complement one another, mitigate individual model weakness and deliver more reliable outcomes [30]. Building on this ensemble approach, meta-learning offers a more advanced framework by using the predictions of base learners as inputs for a second-stage meta-learner that synthesizes insights from individual models.
In the first stage of the meta-learning model, various base classifier candidates, namely RF, SVM, LR, and KNN, are employed to generate predictions. RF combines multiple decision trees to create a robust predictive model capable of handling high-dimensional data and capturing complex interactions among risk factors. This approach reduces overfitting and improves prediction accuracy, making it valuable in medical applications [31]. Bhagat and Bakariya [32] used SVM with linear, polynomial, and RBF kernels to find the optimal decision boundary that separates patients at different risk levels, leveraging SVM’s flexibility to capture various data relationships. Jaya et al. [33] utilized KNN for its simplicity and effectiveness in handling non-linear relationships, combining KNN, RF, and Decision Tree Classifiers with K-Fold Cross-Validation to improve diagnostic accuracy. Logistic Regression, another widely used method in heart disease detection, models binary outcomes and provides insights into the influence of various risk factors [34].
2.3.2 Boosting Classifier Stack
Boosting is a sequential modeling technique in which each new model aims to correct the errors of the previous one. This iterative process progressively enhances the model’s predictive performance. AdaBoost is a popular boosting method that assigns greater weight to misclassified instances during each round of training. This helps the model focus on difficult cases, reducing both bias and variance [35]. AdaBoost builds a stronger model even in complex classifications. Boosting algorithms iteratively improves weak classifiers by focusing on misclassified instances. Chandrasekhar and Peddakrishna [6] indicated that AdaBoost reduces bias and variance by adjusting the weights of misclassified instances, enhancing the model’s focus on difficult cases. GB improves prediction accuracy by sequentially applying weak models to the residuals of previous models, effectively reducing bias and handling complex, non-linear relationships [10]. Chen and Guestrin [19] used XGB and LightGBM as scalable and efficient implementations of gradient boosting to prevent overfitting and handle large-scale data efficiently. In a meta learning approach, stacking boosting classifiers like AdaBoost and XGBoost combines their strengths, creating a robust model capable of capturing nuanced patterns. This is especially valuable in areas like cardiovascular risk prediction, where subtle patterns in the data are crucial for accurate predictions.
2.3.3 Meta Learning and Voting
Meta-learning enhances the learning process by enabling models to learn from previous predictions and adapt to new tasks efficiently. Meta-learning involves two levels: base classifiers and a meta-learner. The base classifiers generate diverse predictions and meta features which then would be used to enhance training of the meta-learner [17,36]. In this research, boosting algorithm candidates, including AdaBoost (ADB), Gradient Boosting (GB), LightGBM (LGBM), and XGBoost (XGB), were used as stacked classifiers of meta learner. Their predictions is combined as meta learner output using a voting mechanism. We applied soft voting, using probabilistic outputs from each boosting classifier to make more accurate and robust predictions. The model process is illustrated in Fig. 2.
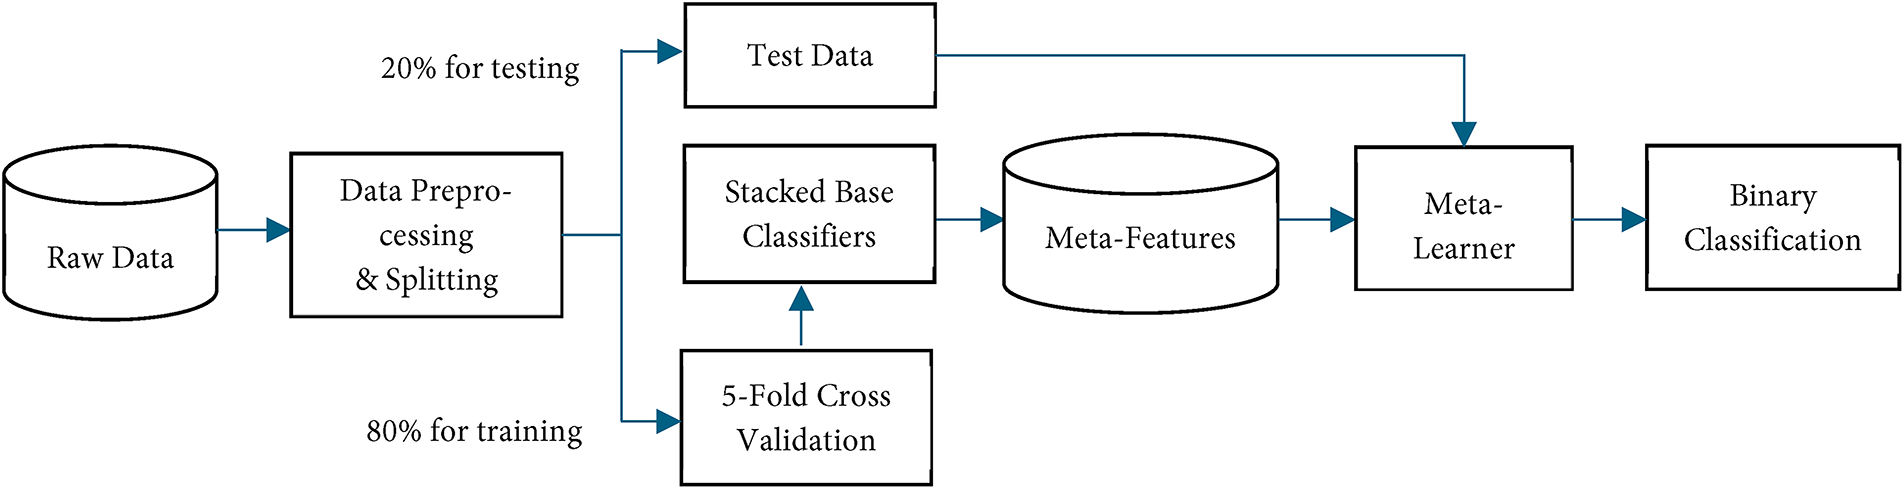
Figure 2: Flowchart of meta-learning model
After addressing multicollinearity, various machine-learning classifiers, including RF, SVM, KNN, and LR, were implemented to predict patient mortality as base classifiers. Each base classifier was trained using 5-fold CV. During each fold, a subset of data was used for training, and predictions were made on the holdout fold, known as out-of-fold predictions. This approach prevents data leakage and maintains the model’s generalizability by ensuring each instance is evaluated with unseen models. Out-of-fold predictions from all folds were combined to create meta-features, forming a new dataset where each instance corresponds to an original instance with columns representing predictions from different classifiers.
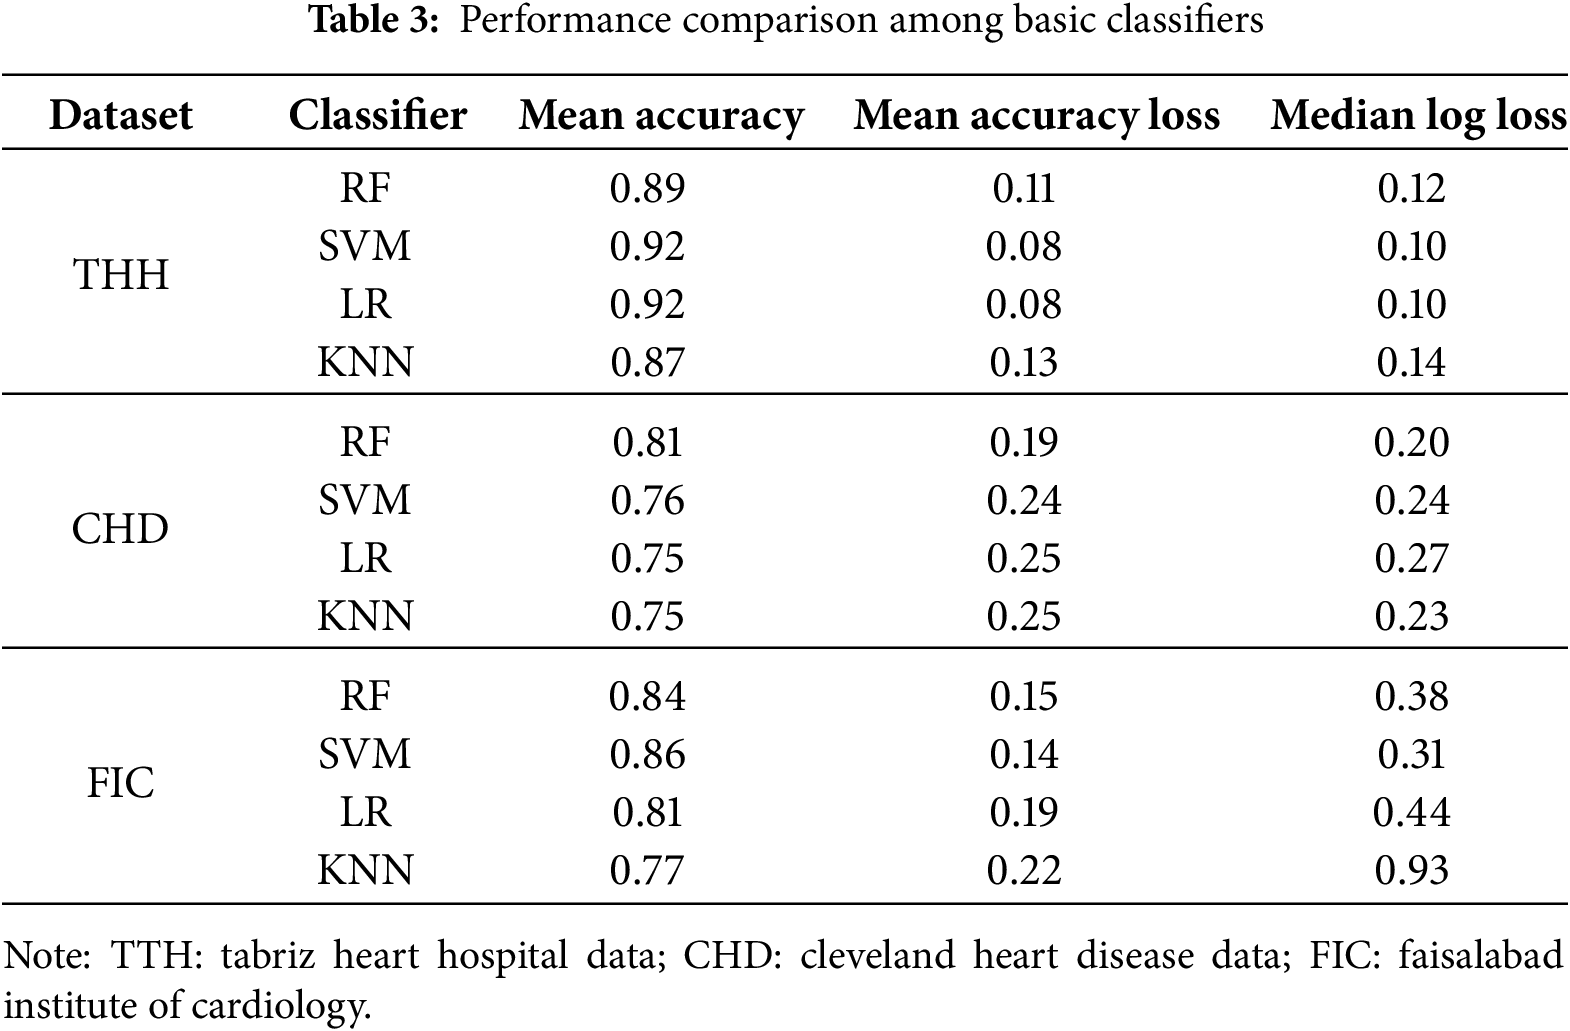
To identify best performing base classifiers an ablation study was conducted. The accuracy, accuracy loss, and log loss of each classifier within each fold were compared to evaluate the model’s generalizability and stability across different data subsets, as shown in Table 3. This approach helped identify potential overfitting or underfitting issues and ensured the model’s performance was not dependent on a specific data subset. Based on results from the THH dataset, RF achieved a mean accuracy of 0.89, while SVC showed a mean accuracy of 0.92. The accuracy loss for RF was approximately 0.11, and for SVC, it was approximately 0.08. KNN and LR also demonstrated reasonable performance, with mean accuracies of approximately 0.87 and 0.92, respectively. The consistency in accuracy and low accuracy loss across folds indicated robustness and generalizability. For the CHD dataset, RF consistently achieved high accuracy across all folds, ranging from 0.77 to 0.85, with the lowest accuracy loss between 0.15 and 0.22. SVC also performed well, with accuracies between 0.70 and 0.82, and accuracy loss ranging from 0.18 to 0.27. KNN and LR showed accuracies ranging from 0.70 to 0.83 and 0.65 to 0.85, respectively. For the FIC dataset, RF also achieved relatively high accuracy around 0.8 as well as SVM, in this dataset accuracy for LR and KNN were lowest. The acceptable range of accuracy and accuracy loss across folds indicates stable and non-overfitted performance. Consequently, the meta-features created with these base classifiers should be valid and generalizable.
Following the ablation study, which assessed the performance of individual candidates to refine the number of base classifiers, the most impactful algorithms were selected for inclusion in the final base stack model. In this research, RF and SVM classifiers performed significantly better than the others, so they were used as the final base stacked models. The structure of the base classifiers stack is visible in Fig. 3.
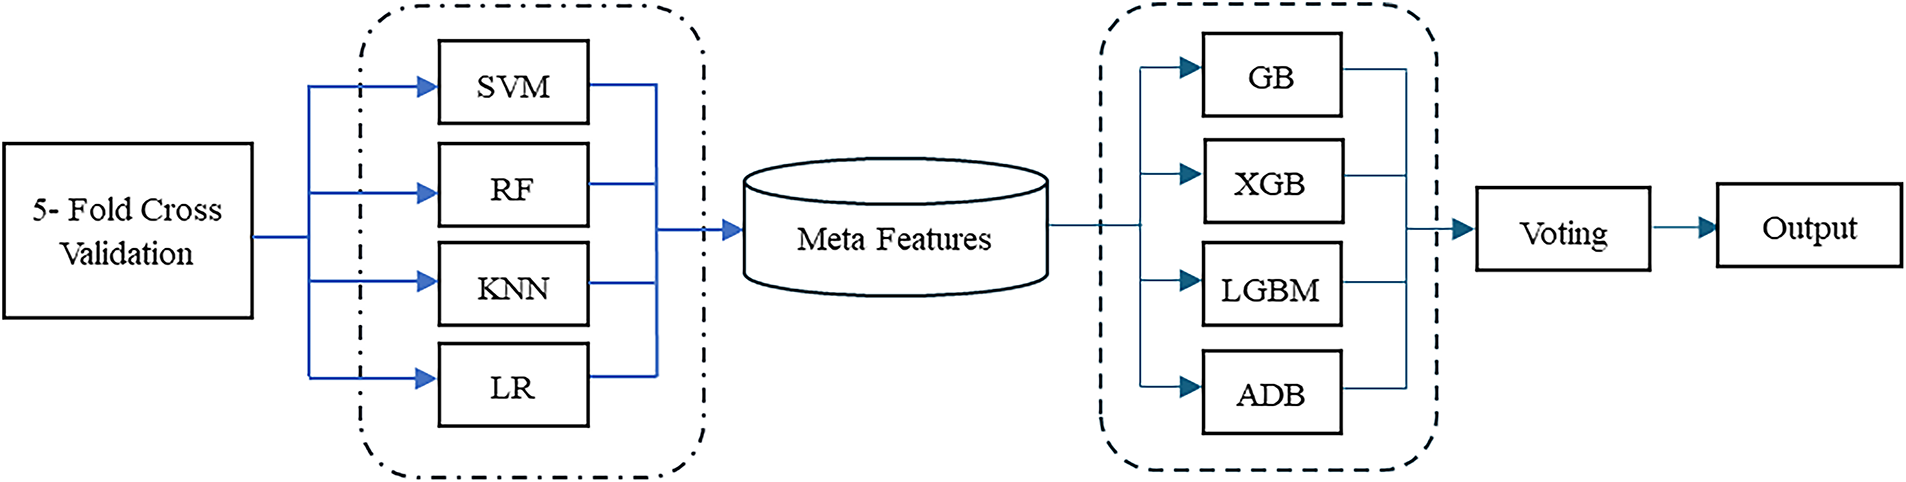
Figure 3: Stacked base classifier candidates
Additionally, to evaluate the contribution of each boosting algorithm to the overall meta-learning model and to identify the best performing candidates, an ablation study was conducted. The performance of each boosting classifier candidate was assessed individually, with the results summarized in Table 4 below.
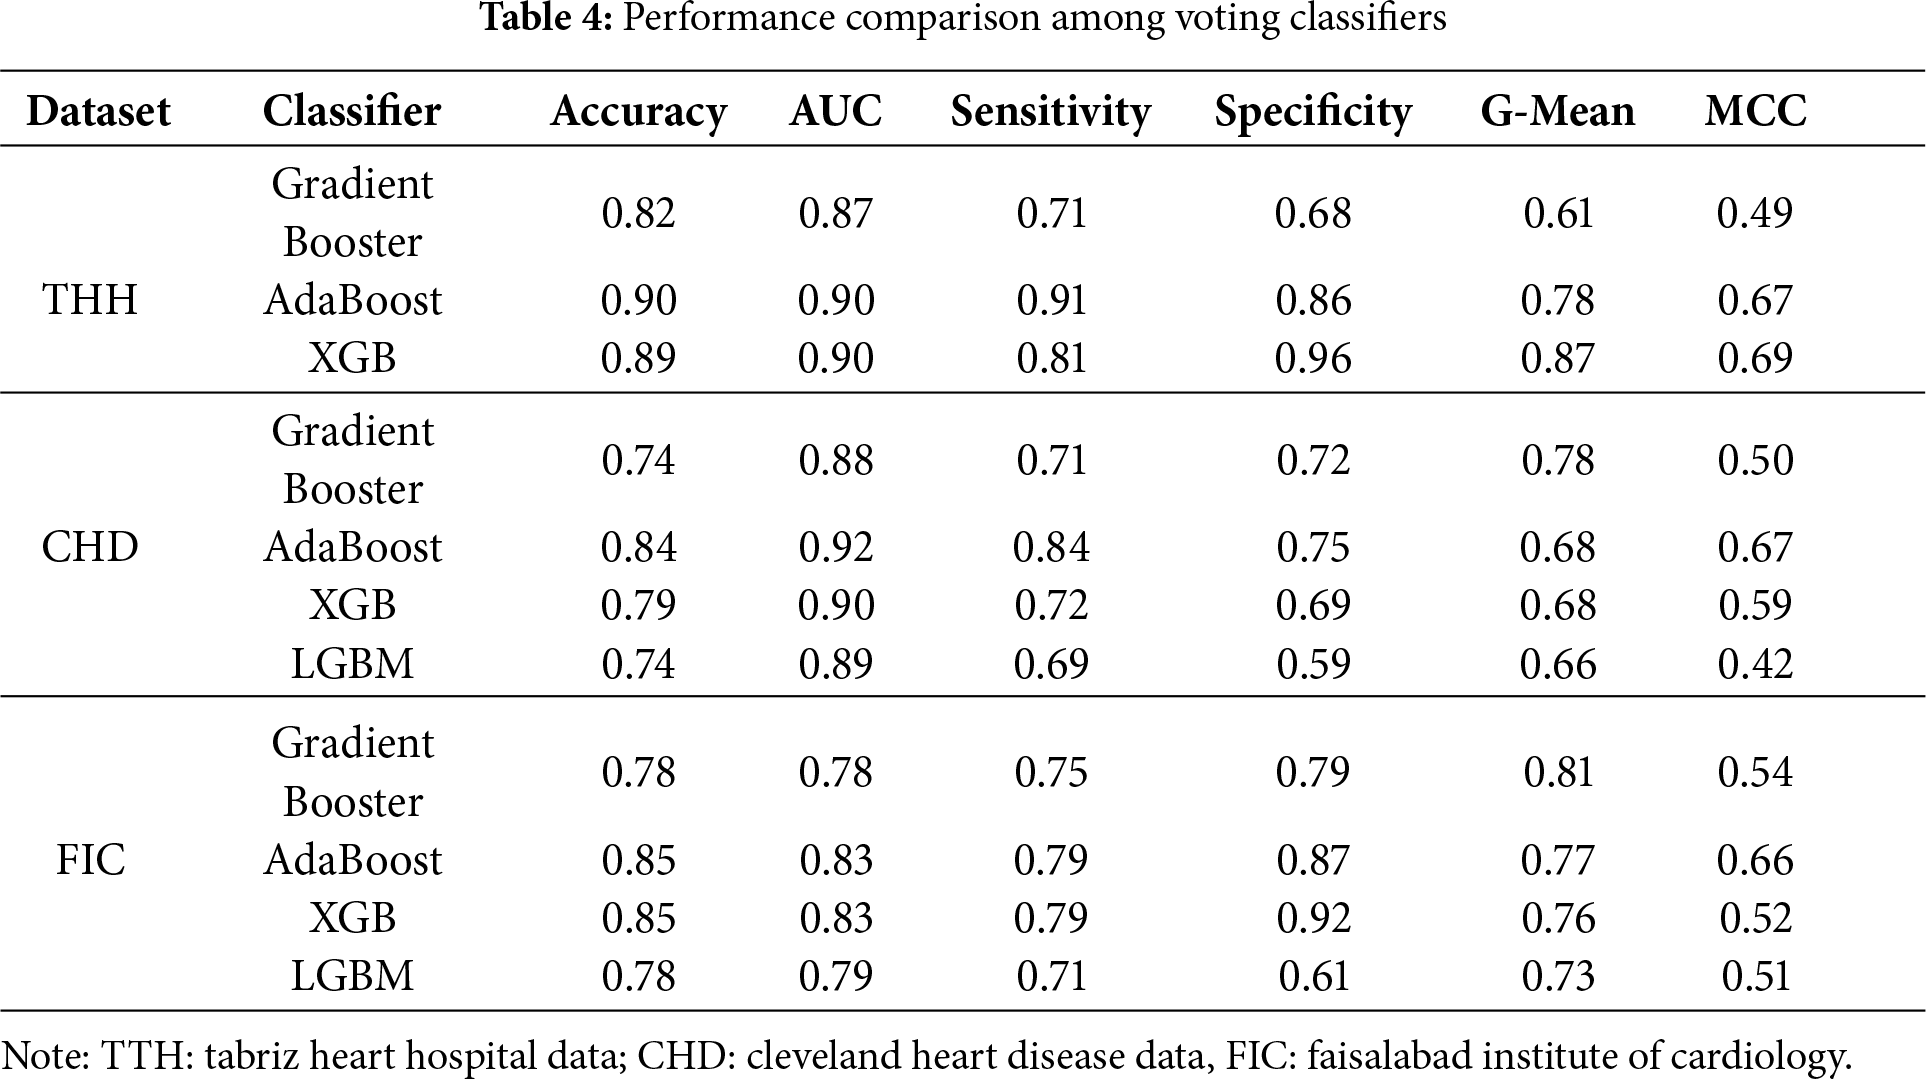
XGB and AdaBoost achieved the highest accuracy and AUC among all the algorithms. Additionally, AdaBoost demonstrated significantly higher sensitivity than the other classifiers, followed by XGB across both datasets. The AUC values for each meta-learning model, evaluated using each dataset in voting classifier, are illustrated in Fig. 4.
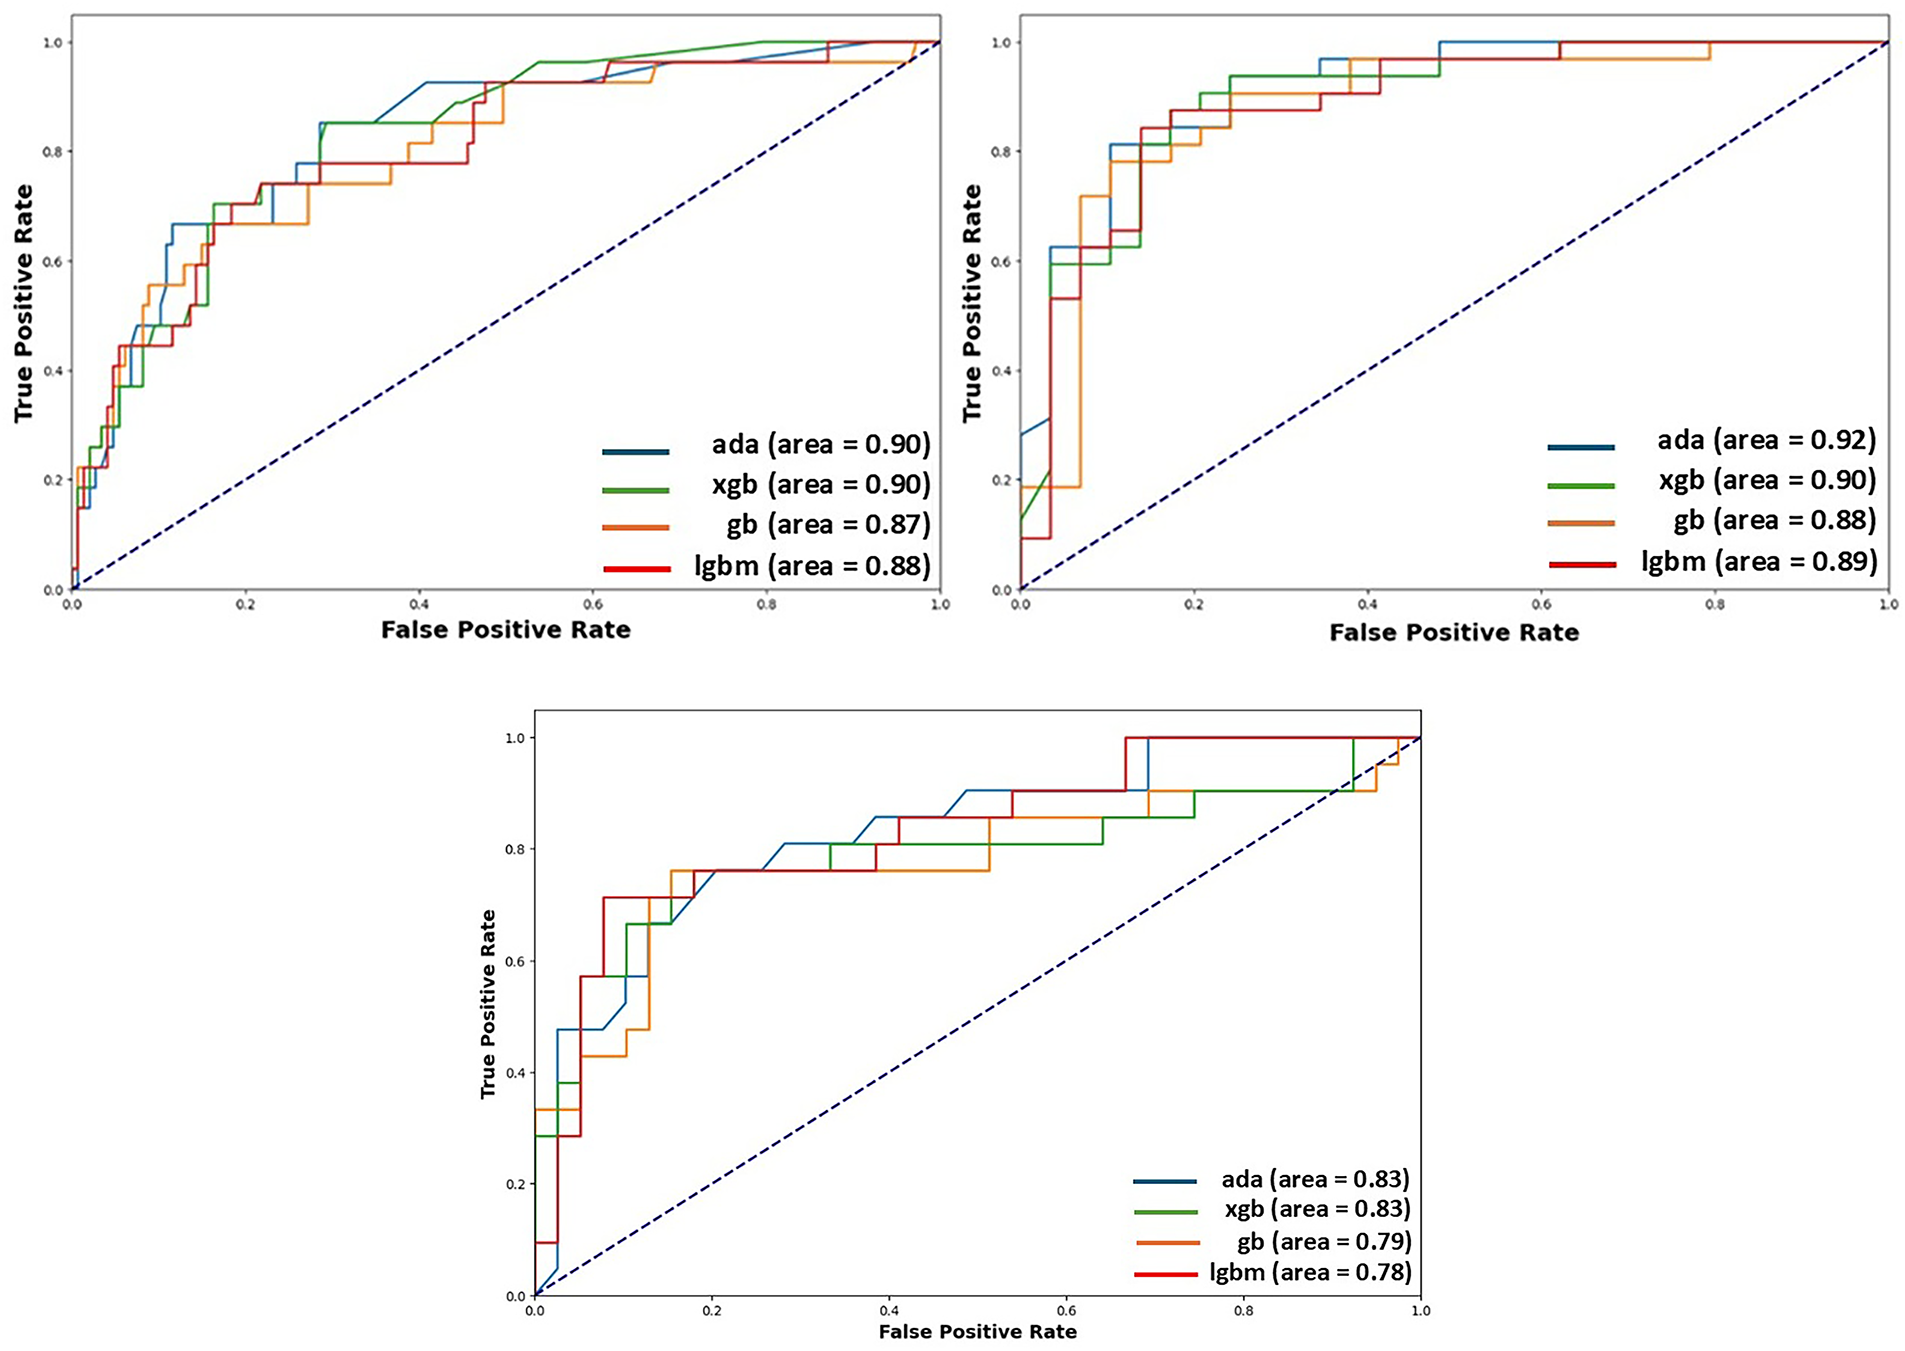
Figure 4: AUC plot of each classifier used in meta-learner, showing the ability of each model to discriminate between the positive and negative classes in the THH, CHD and FIC datasets. On the left results from THH, on the right results from CHD and at the bottom results from FIC are visible
The final meta-learner was constructed using the best-performing base and boosting classifiers identified in the ablation study. In the next stage, the meta-features generated from the chosen base classifiers were used to train the meta-learner. Ada boost and XGB, the two top-performing boosting classifiers, were chosen as voting classifiers in the meta-learner model due to their high performance. Using the meta-features dataset, the meta-learner was trained to optimally combine the predictions of the base classifiers to enhance overall performance. The outputs of the chosen boosters were combined through soft voting, which averages the predicted probabilities of the classifiers and selects the class with the highest average probability as the final prediction. As illustrated in Fig. 3, this approach leverages the complementary strengths of different classifiers, resulting in more robust predictions.
To evaluate the performance of the proposed meta-learner model, six key metrics were employed, each offering distinct insights. Accuracy represents the overall rate of correctly classified instances, offering a general view of model performance but often failing to capture nuances in imbalanced datasets. The AUC score gauges the model’s ability to distinguish between positive and negative classes, making it particularly valuable in binary classification tasks. Sensitivity (or Recall) quantifies the proportion of true positives correctly identified by the model, which is especially relevant in medical diagnoses where missing positive cases could result in untreated patients. Specificity, in contrast, measures the proportion of true negatives accurately classified, helping minimize false positives and thereby avoiding unnecessary treatments. The G-Mean balances Sensitivity and Specificity, ensuring reliable performance across both classes when false positives and false negatives carry significant consequences. Lastly, the MCC provides a balanced performance measure by accounting for all four categories in the confusion matrix, reducing the risk of misleading interpretations that can occur when relying solely on accuracy. A comparison of the proposed meta-learning model with the benchmark models across different datasets is presented in Table 5.
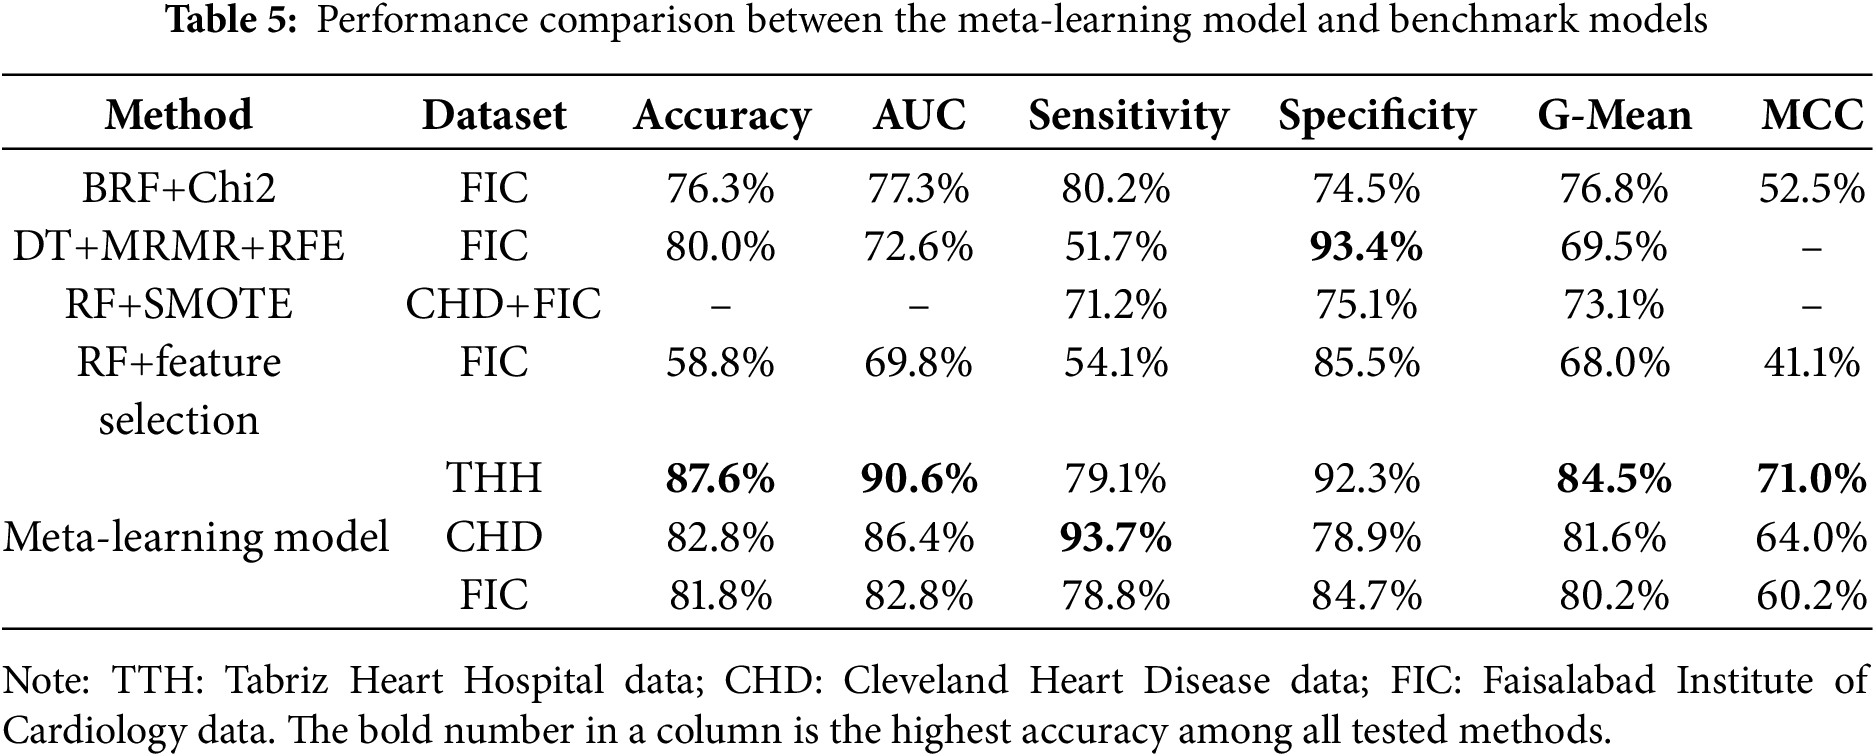
Based on the THH data, the proposed meta-learning model outperformed the other models, including RF+SMOTE and RF+feature selection, previously recommended by Kim et al. [36] and Chicco and Jurman [37], in terms of accuracy, AUC, G-mean, and MCC. For Sensitivity, the difference between our proposed model and BRF+Chi2 [38] was minimal, while the DT+MRMR+RFE model [7] slightly surpassed the proposed model. When evaluating the CHD dataset, the proposed model also outperformed the RF+SMOTE model. It achieved an accuracy of 82.8%, indicating that the majority of cases were correctly classified, and an AUC score of 86.4%, reflecting strong discriminative power in distinguishing patients with and without heart disease. This high AUC score suggests that the model is well-calibrated and effective in ranking cases by their likelihood of being positive. A sensitivity of 93.7% highlights the model’s effectiveness in detecting patients with heart disease, thereby minimizing false negatives. On the FIC dataset, the meta-learner achieved an accuracy of 81.8% and an AUC of 82.8%, showing a clear advantage over other benchmark models. In terms of sensitivity and specificity, the meta-learner ranked second among the five models tested on the FIC dataset. In terms of MCC and G-mean metrics, suggested model performed better than base line models as well.
To evaluate the effects of individual attributes in each dataset on the predication model, we applied Shapley Additive Explanations (SHAP) [39] to quantify each attribute’s contribution. Grounded in cooperative game theory, SHAP assigns a fair share of the prediction to each variable by averaging its marginal effect across all possible feature coalitions, producing consistent, model-agnostic importance scores. SHAP values are calculated on the model’s predicted probability of the positive class, representing additive change from the baseline. This approach provides both global insights, through a ranked list of key drivers and their directional impact on risk, and local insights, offering case-by-case explanations of why a specific patient received a given score. As for global insights drawn by the meta learner model, we used the mean absolute SHAP values to rank the attributes in each dataset, and focused on the top nine attributes with the highest impact on model predictions.
Fig. 5 displays the SHAP values of the top 9 attributes used from the CHD dataset. The first attribute is OldPeak, which seems to have the highest impact on the model’s prediction capabilities. Low OldPeak values (close to 0 mm) indicate small heart disease risk predicted by the model, while its high values (above ~2 mm) lead to positive SHAP values, indicating a strong contribution to increased risk. The second most influential attribute is cholesterol. Results show that higher cholesterol levels (Chol > 240 mg/dL, green points) are mostly positioned on the positive side, yielding higher SHAP values and strongly contributing to elevated CVD prediction. The next important cardiac indicators are CA and CP. Patients with CA = 0, meaning no major vessels affected, are clustered on the left with mostly negative SHAP values, indicating this condition strongly lowers predicted risk. In contrast, patients with CA = 1, 2, or 3 appear on the right with positive SHAP values, showing that one or more diseased vessels substantially increased risk prediction. Similarly, CP = 3 or 4 cases are concentrated on the left with negative SHAP values, reflecting these chest pain types are associated with lower risk. By contrast, CP = 1 or 2 cases cluster on the right side with positive SHAP values, indicating that typical and atypical angina chest pains strongly elevate predicted risk. Additionally, Patients with reversible defects also cluster on the right with positive SHAP values, reflecting higher predicted risk since reversible ischemia signals active coronary blockage under stress. Fixed defects fall in between, contributing moderately positive SHAP values but less strongly than reversible defects. The effects of the rest of attributes such as Age, Gender, Thalach and Exang are also depicted in the Fig. 5 for similar analyses.
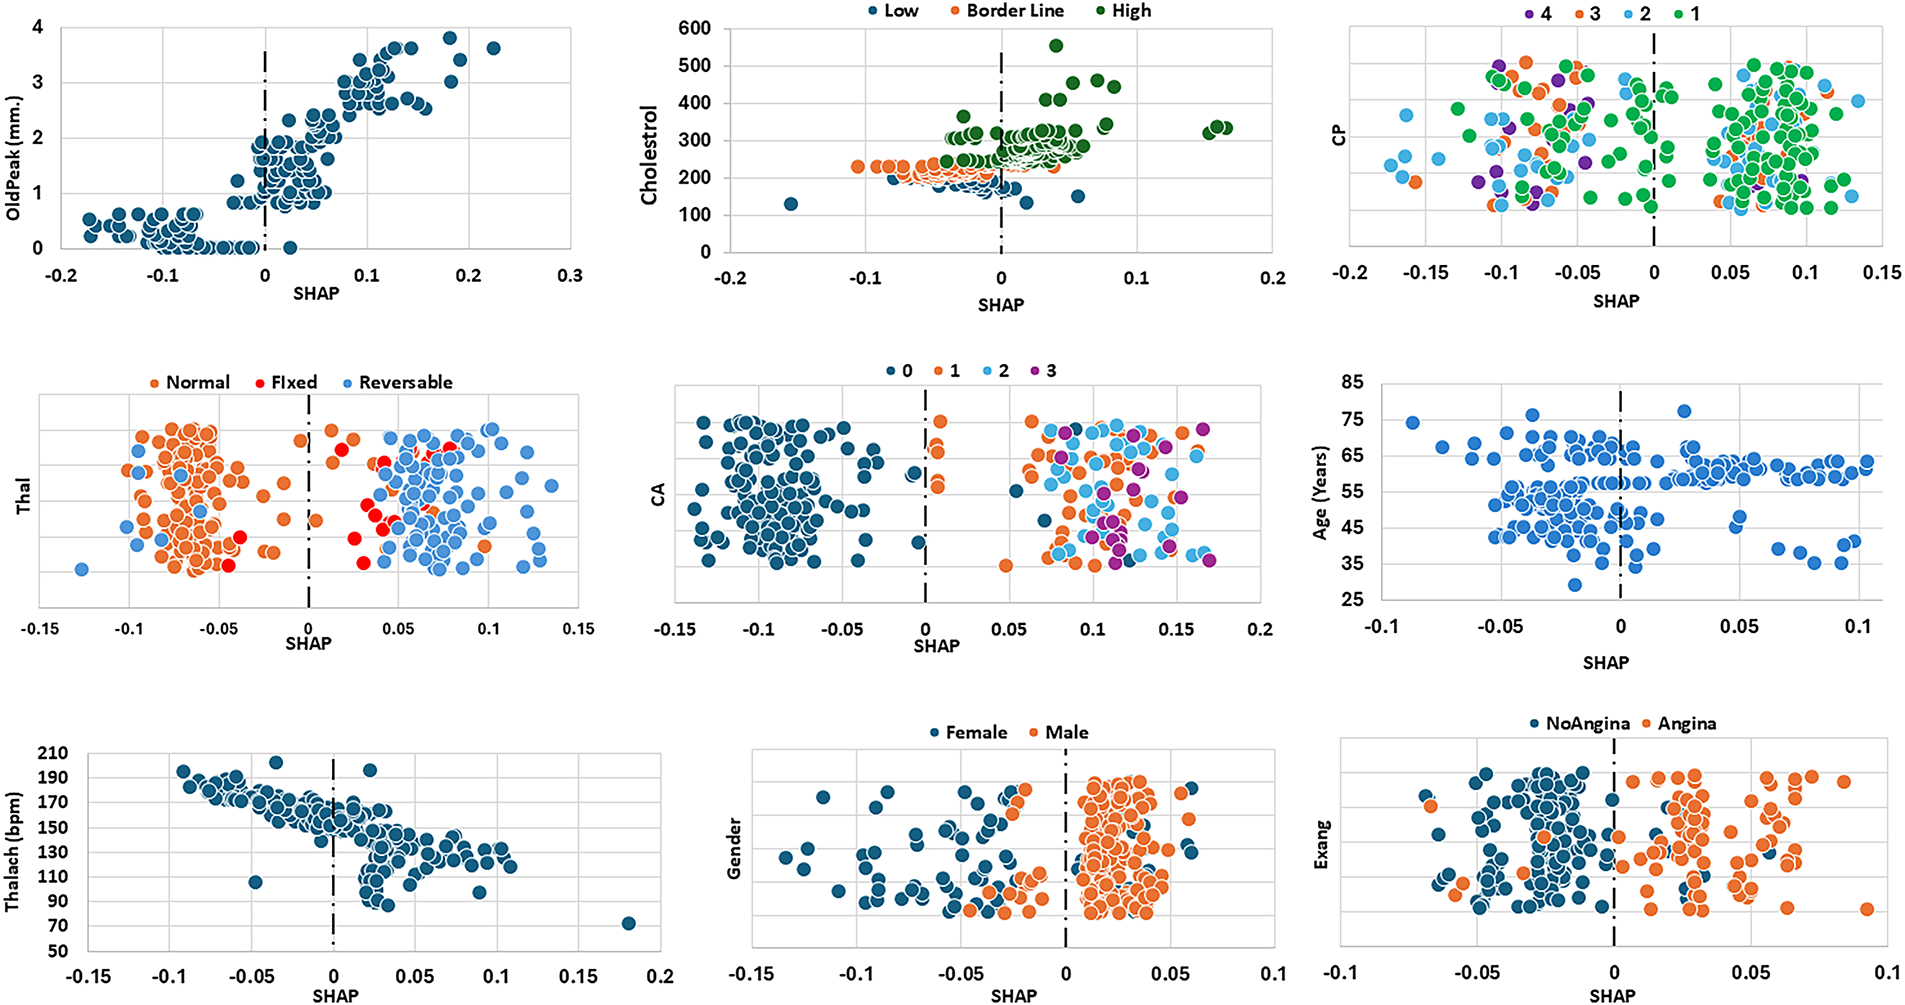
Figure 5: SHAP values of the top nine attributes for CHD dataset
The SHAP plots for the top nine attributes in the FIC dataset are presented in Fig. 6. The most impactful attribute is diabetes. The Diabetes plot shows that with non-diabetic patients (blue) have negative SHAP values, reflecting low predicted risk of heart disease, whereas most diabetic patients (orange) exhibit positive SHAP values, indicating an increased risk. The second most influential attribute in this dataset is cholesterol. The Cholesterol plot shows that lower cholesterol values are generally associated with negative SHAP scores (i.e., reduced predicted risk), while higher cholesterol values correspond to positive SHAP scores (i.e., elevated risk). Cholesterol values near the borderline lie closer to the center, suggesting minimal effect on the model’s prediction. In other words, maintaining lower cholesterol levels appears to have a protective effect. Attributes such as CA (coronary arteries) and Thal have the same level of impact on the model’s prediction as cholesterol. A high CA category (indicating more blocked arteries) significantly increases the predicted risk of mortality, while a lower Thalach value (maximum heart rate achieved in stress testing) is also associated with higher risk. Thus, the model primarily flags patients with poor coronary health and low exercise capacity as high risk. The SHAP plots for existing angina (Exang), smoking and resting blood pressure (Trstbp) reveal similar effects on the model’s prediction—patients with angina, high Trstbp or a smoking habit are more likely to be classified as at higher risk of mortality. The rest of the features included in Table 2 had lower impact in the prediction of the model hence their graphs were not included in Fig. 6 below.
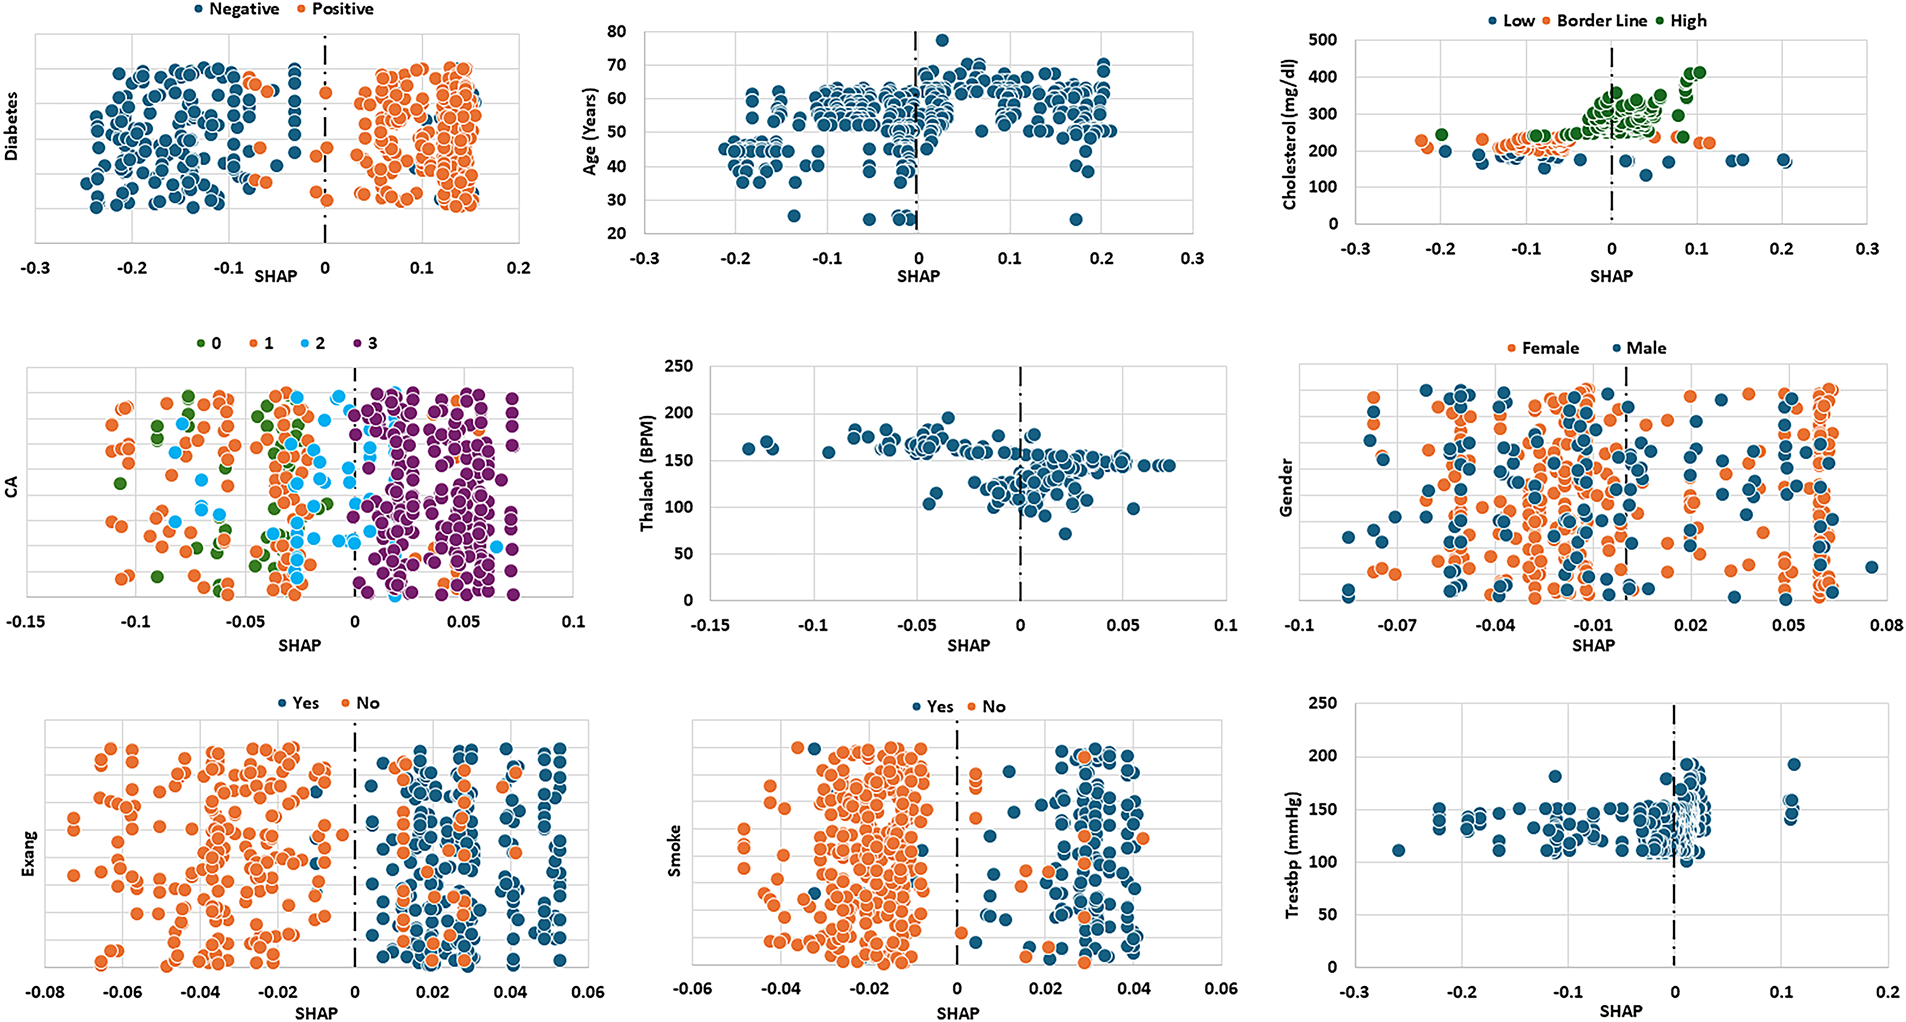
Figure 6: SHAP values of the top nine attributes for FIC dataset
Fig. 7 presents the SHAP values of the top eight attributes in the THH dataset, which contains the medications taken by the patients, Diuretics, Beta Blocker and Heparin. Both diuretics and heparin are associated with lower predicted risk, as indicated by their negative SHAP values. The use of beta blockers shows a mixed effect—some patients exhibit decreased SHAP values (lower risk), while others show increased values (higher risk). However, patients not taking beta blockers generally display positive SHAP values, indicating a higher predicted risk. Elevated CPK levels (>400 U/L, red) are generally associated with positive SHAP values, indicating that increased enzyme activity in the blood adversely affects heart condition and contributes to a higher predicted risk. Regarding the impact of chest pain types, typical angina (CP = 1) is associated with negative SHAP values, indicating lower predicted risk, while atypical angina (CP = 2) corresponds to positive SHAP values, suggesting higher risk. Non-anginal pain (CP = 3) and asymptomatic cases (CP = 4) show similar SHAP ranges, reflecting comparable effects on the model’s predictions. Male patients generally exhibit lower SHAP values than female patients, while older patients show a wider range of SHAP values. Most non-smoking patients have lower SHAP values compared to their smoking counterparts, although some non-smokers overlap with smokers at the higher end of the SHAP scale.
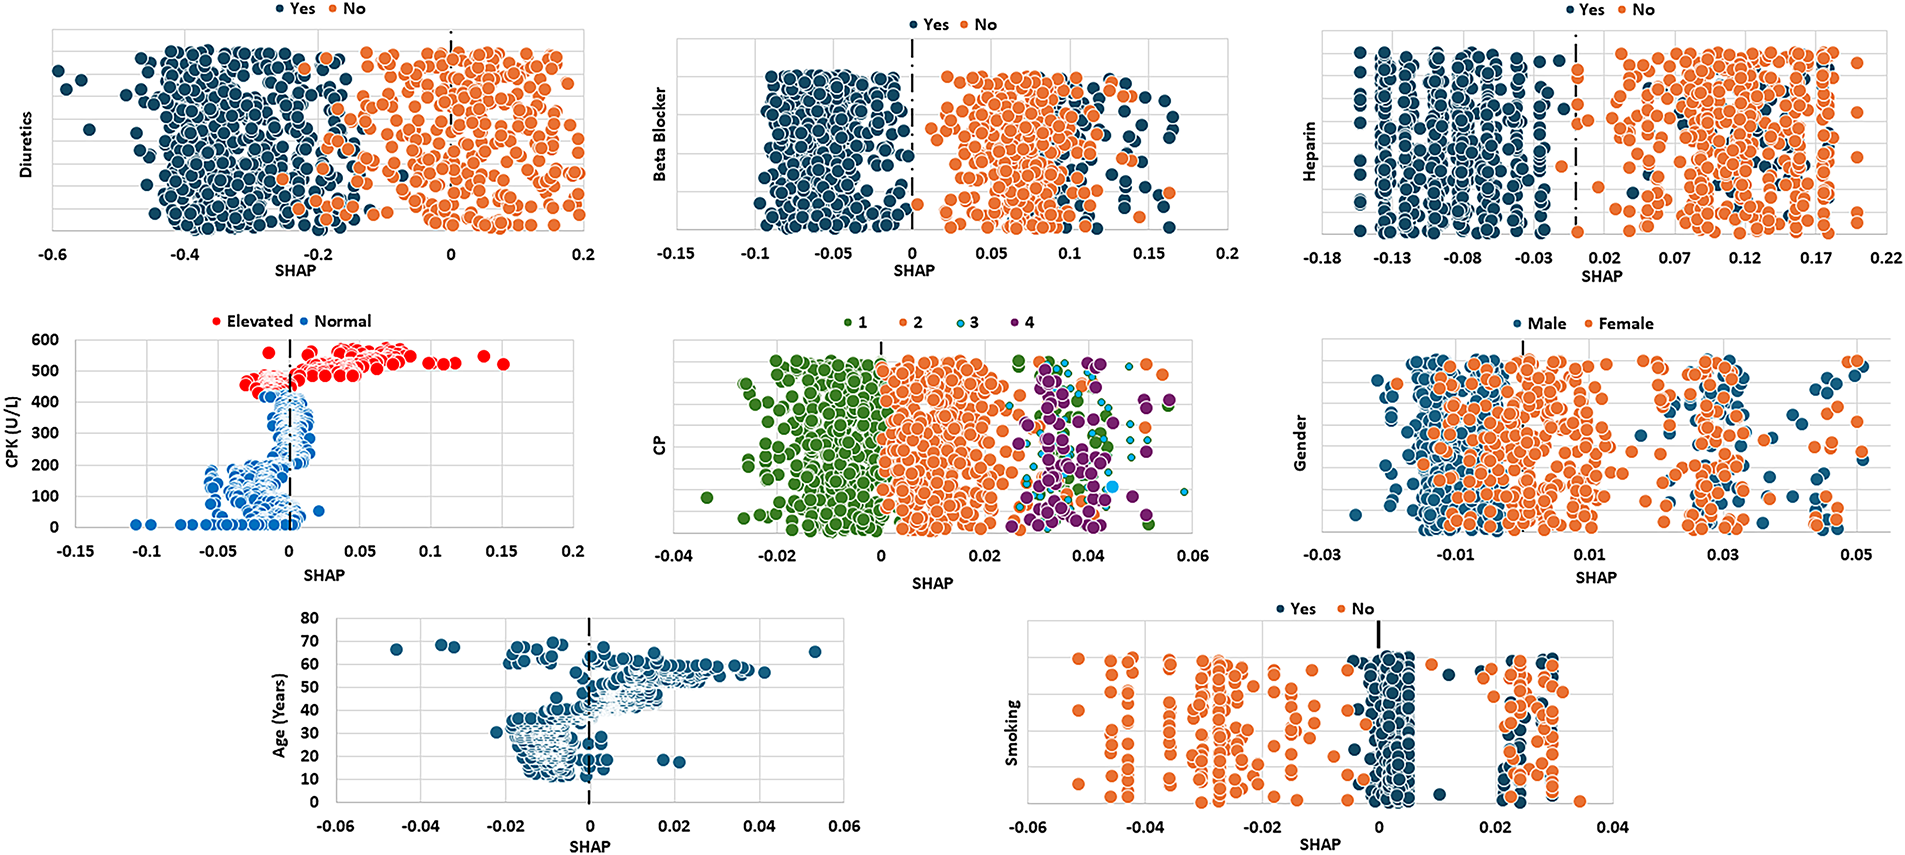
Figure 7: SHAP values of the top eight attributes for THH dataset
Local SHAP is used to explain individual predictions by showing how each feature contributes to a single patient’s outcome. It helps identify which clinical factors most influenced that patient’s risk level. This case-by-case SHAP analysis is used to support personalized medical decisions. For local explanations on individual patients, we randomly selected two patients from each dataset (Fig. 8). The first patient from the CHD dataset was a 59-year-old male with cholesterol at the borderline, Thalach of 150, OldPeak of 2.3, CA of 3, non-angina chest pain, and a normal Thal. According to the clinical record, this patient was diagnosed with CVD. As shown in Fig. 8, the local SHAP analysis shows that CA contributes most postive (red bar) to the predicted CVD risk, while CP, Thalach, Thal, and OldPeak contribute protectively (blue bars). Minor positive contributions from Gender and Exang slightly increased risk, overall SHAP value is aligned with patients record. The second CHD patient was a 62-year-old male with non-anginal chest pain, borderline cholesterol, Thalach of 108, OldPeak of 1.5, CA of 0, and fixedThal, who was not diagnosed with CVD. CP and CA act as strong protective factors, reducing the predicted CVD risk. On the other hand, Thal and Gender slightly increase the risk, while Chol, Age, and Exang further lower it. The overall negative SHAP values correspond with the non-CVD status. In the FIC dataset, the first selected patient was a 59-year-old alive female, whose attributes were non-diabetic, CA of 0, Trestbps of 130, high cholesterol, Thalach of 140, non-smoker, and no Exang. The patient was flagged “alive” in the dataset. The absence of diabetes has the strongest protective effect, greatly reducing the predicted mortality risk. Although Age slightly increases the risk, most of the other attributes, such as Exang, CA, Trestbps, and smoking, contribute negatively to SHAP, indicating protections. Overall, the dominant negative SHAP values correspond with an “alive” outcome prediction. The second FIC patient was a 69-year-old female with diagnosed diabetes, CA of 0, Trestbps of 125, high cholesterol, Thalach of 169, smoker status, no Exang, and a deceased status. The main risk factors are Diabetes and Age, with smaller pushes from Smoking and Cholesterol. Protective factors, such as zero CA, no Exang, low Trestbps, and high Thalach, lower predicted risk (negative SHAP). However, the positive factors slightly outweigh these protective factors, leading to a higher mortality risk.
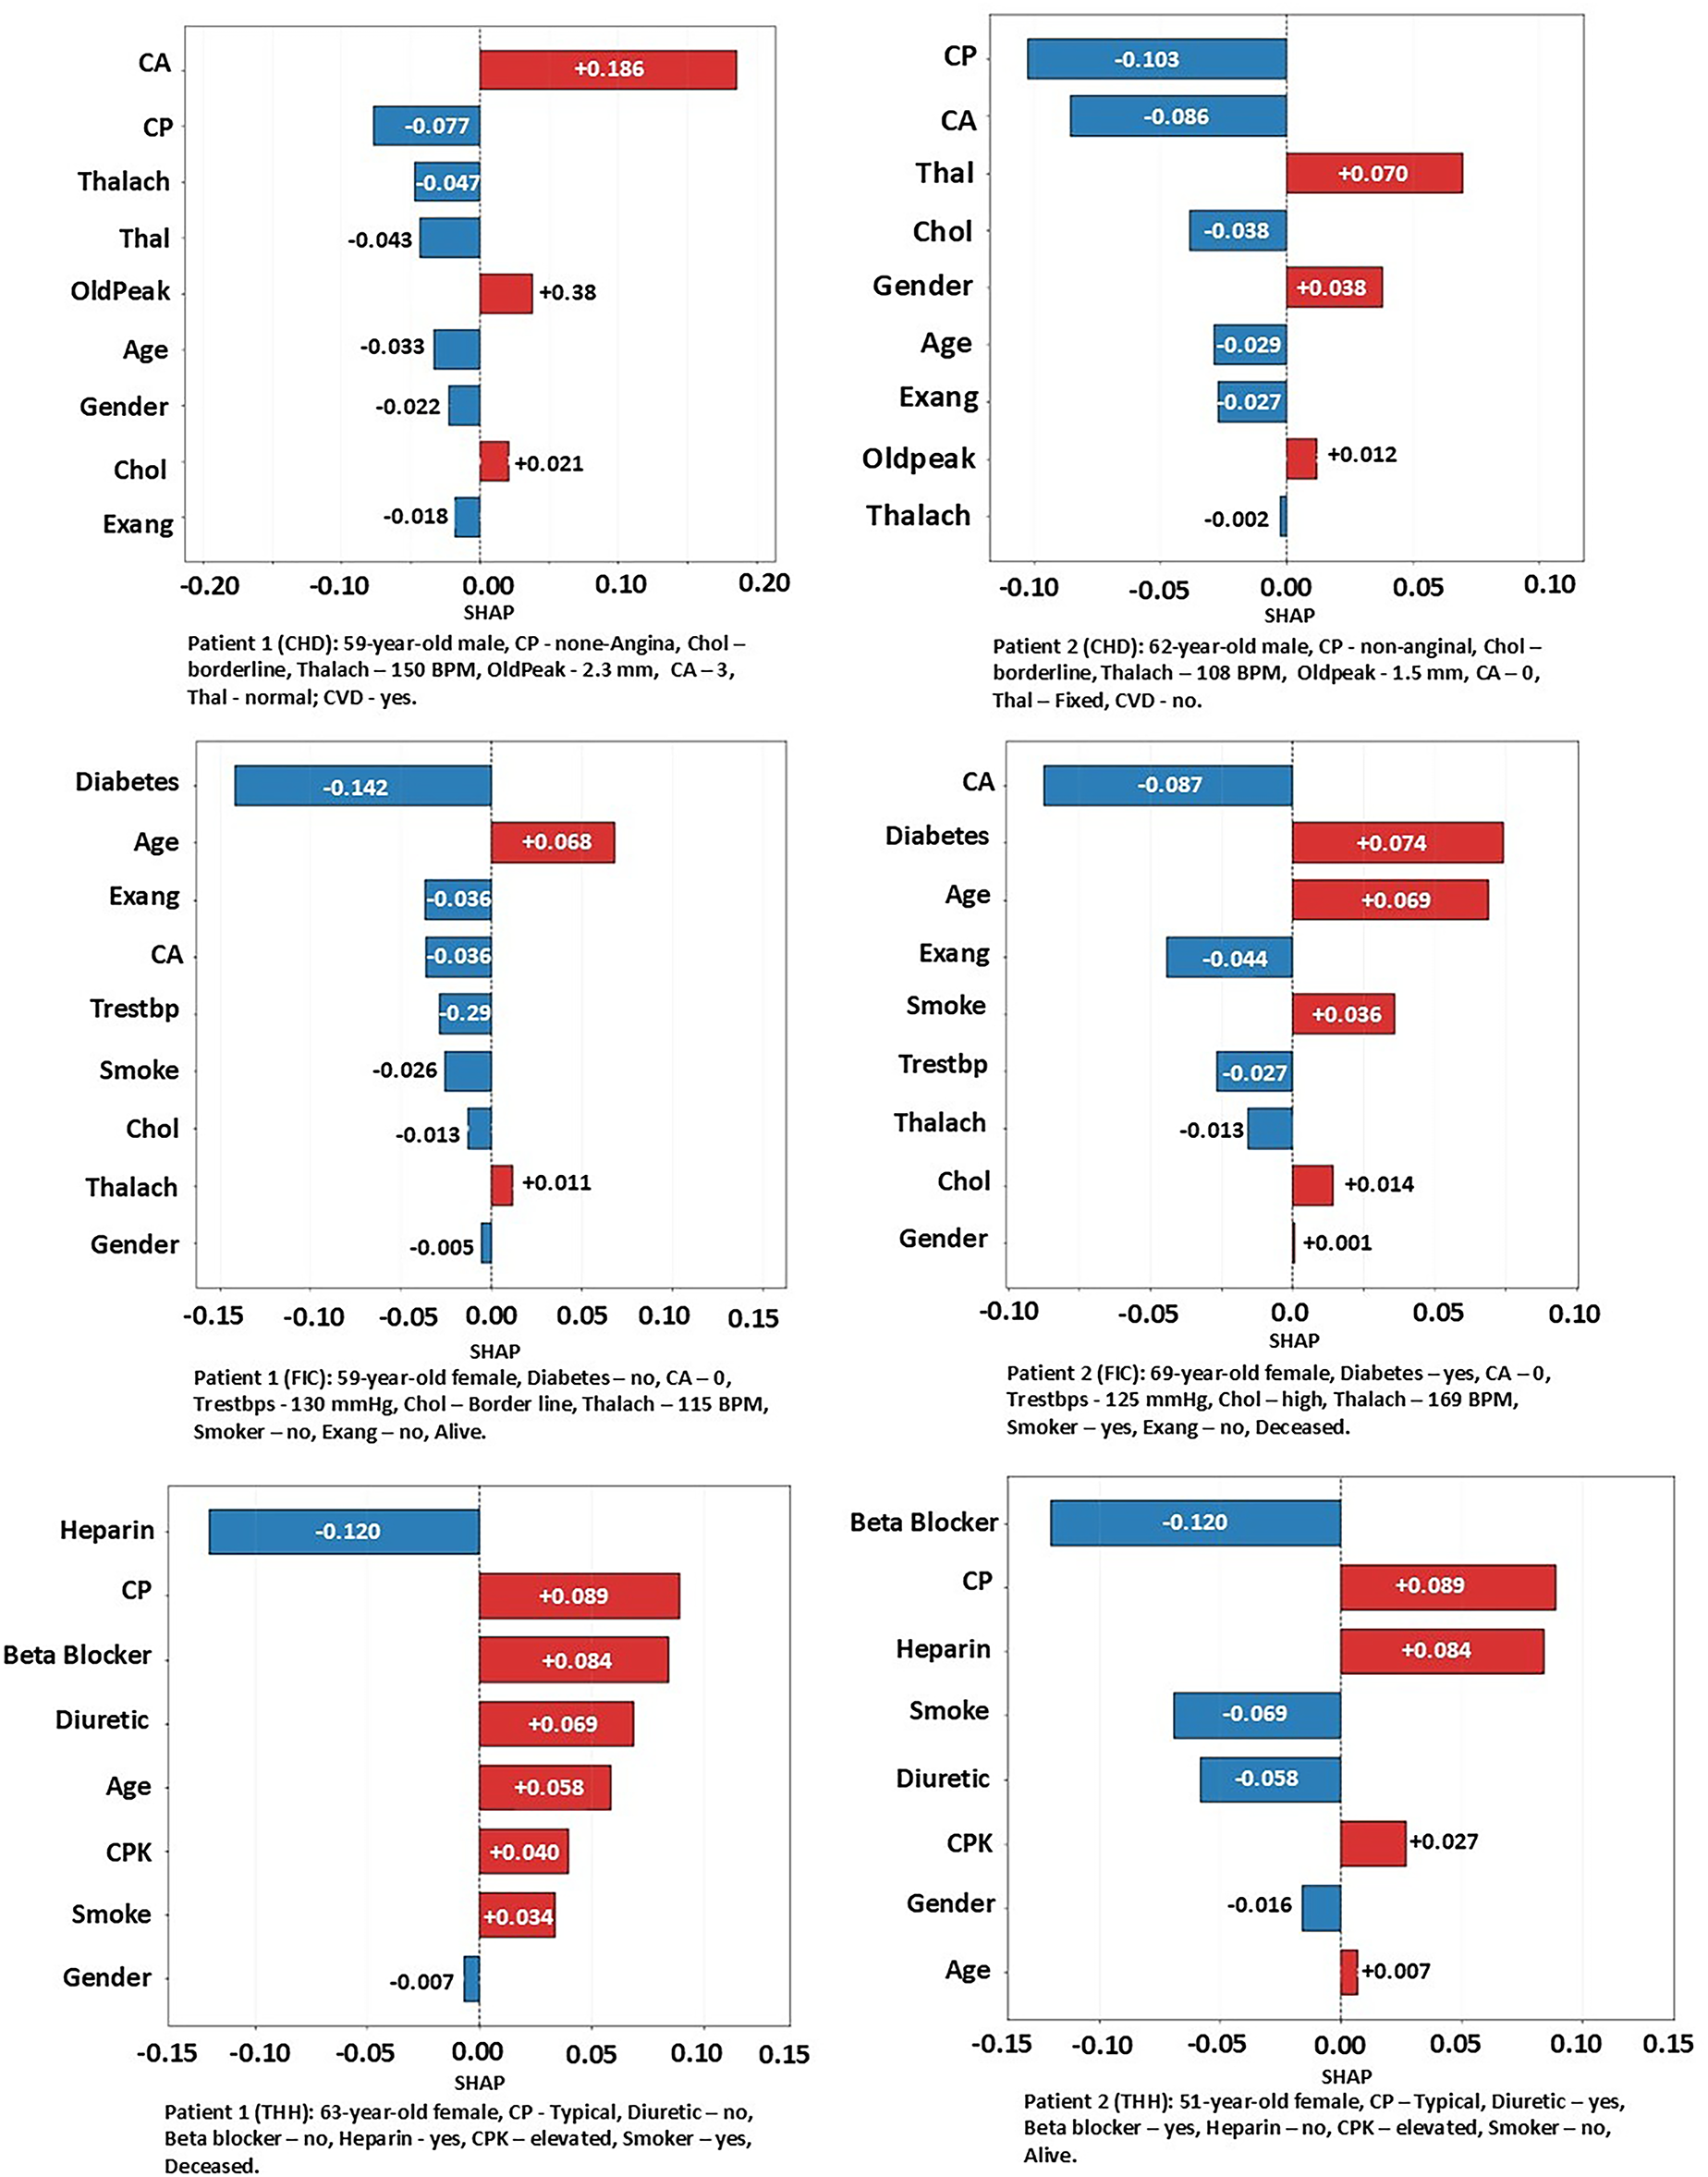
Figure 8: Case by case analysis using SHAP values
For the THH dataset, the first patient was a 63-year-old female, smoker, with angina-type chest pain, elevated CPK levels, and treated only with Heparin. This patient was flagged as “deceased.” As shown in Fig. 8, angina contributed the most to the mortality prediction, followed by the absence of beta blockers and diuretics, age, and elevated CPK levels. On the other hand, Heparin treatment had the strongest protective effect. The cumulative positive effects outweigh the protection; the model predicts a high likelihood of mortality for this patient. The second THH patient was a 51-year-old female, non-smoker, with angina, elevated CPK, and receiving beta blockers and diuretics, who was flagged as alive. For this patient, angina and the absence of Heparin were the main adverse predictors. In contrast, the use of beta blockers and diuretics, along with non-smoking status, provided the most protective effects in the model’s prediction.
The proposed meta-learning framework for cardiovascular mortality prediction demonstrates potential for integration into real-world clinical practice. One of its main advantages is its compatibility with electronic health records (EHRs), where it can automatically analyze patient demographics, blood test results, and other clinical indicators to provide clinicians with immediate risk assessments. When incorporated into clinical decision support systems (CDSS), the model has the capacity to flag high-risk patients who require urgent attention, thereby improving the timeliness and accuracy of clinical decision-making. Furthermore, the model is well-suited for deployment in remote monitoring and telemedicine platforms. This enables clinicians to extend diagnostic and prognostic support to patients in rural or underserved areas, improving healthcare accessibility and ensuring that specialized care is not limited to major urban centers. Beyond professional use, the framework can also be adapted into patient-facing interfaces, where individuals input their health data and receive real-time feedback on their cardiovascular risk. Such applications empower patients to engage in proactive self-management, which can contribute to early intervention and potentially reduce emergency admissions.
The operational efficiency of the system is also notable. The framework employs ensemble learning methods in combination with SHAP explanations, allowing it to deliver rapid and accurate predictions without compromising performance, a feature that is crucial in time-sensitive clinical environments. Its implementation relies on widely adopted machine learning, which ensures compatibility with existing hospital IT infrastructures and lowers the barriers for clinical adoption. A key strength of the model lies in its interpretability, as SHAP values provide both global and local explanations of predictions, allowing clinicians to visualize which clinical features such as age, cholesterol level, or vessel blockage most strongly contribute to risk outcomes. This transparency facilitates clinical decision-making. Finally, the modular design of the framework supports scalability, enabling retraining and fine-tuning on different datasets and across diverse patient populations with minimal overhead, making it adaptable to a wide range of healthcare settings.
This study demonstrated the potential of machine learning algorithms in predicting mortality among patients with cardiovascular disease. One proprietary dataset (THH) and two open-access datasets (CHD and FIC) were used to train and validate a meta-learning model that integrates the strengths of multiple machine learning algorithms. via ablation experiments, Support Vector Machine (SVM) and Random Forest (RF) were selected as base classifiers, while AdaBoost (ADB) and XGBoost (XGB) were chosen as boosting classifiers for the meta-learner, which generated predictions via a soft voting mechanism. The proposed model achieved robust performance across three datasets: an accuracy of 87.6%, AUC of 90.6%, and sensitivity of 79.1% on the THH dataset; 82.8% accuracy, 89.4% AUC and 93.7% sensitivity on the CHD dataset; and 81.8% accuracy, 82.8% AUC, and 78.8% sensitivity on the FIC dataset. These results consistently outperformed the benchmark models. The meta-learner also showed strong G-Mean and Matthews Correlation Coefficient (MCC) values, although its specificity was slightly lower than that of the benchmarks.
In addition to its strong predictive performance, the model incorporates SHAP-based interpretations at both global and local levels. The global SHAP analysis reveals the relative importance of attributes such as age, cholesterol, thalassemia type, and vessel blockage, identifying the most influential predictors of mortality across the population. In contrast, the local SHAP analysis provides transparent, case-by-case explanations that highlight how specific attributes contribute to an individual patient’s predicted risk. This two-level interpretability not only strengthens clinicians’ trust in the model’s predictions but also enhances its practicality and usefulness in real-world clinical settings.
Although the proposed meta-learning framework demonstrated strong predictive performance across three datasets, several limitations should be acknowledged. While SMOTE was used to correct class imbalance, synthetic oversampling may not fully reflect the biological variability of minority cases, and subtle correlations among features might have been altered. Additionally, the model was trained and evaluated on retrospective data; therefore, its performance in real-time clinical environments remains to be verified through prospective validation or randomized clinical trials. Furthermore, the present work focused on structured tabular data and excluded unstructured information such as electrocardiogram signals, imaging data, or physician notes, which could further improve prediction accuracy if integrated in future research. Future studies should address these limitations by incorporating longitudinal monitoring and multimodal data integration to improve both the robustness and clinical applicability of the proposed approach.
Acknowledgement: Not applicable.
Funding Statement: The authors received no specific funding for this study.
Author Contributions: Sam Rahimzadeh Holagh: conceptualization, methodology, investigation, data collection, data analysis, software, writing—original draft; Bugao Xu: conceptualization, investigation, supervision, writing—reviewing and editing. All authors reviewed the results and approved the final version of the manuscript.
Availability of Data and Materials: Unidentifiable personal data can be available on request.
Ethics Approval: The THH dataset was originally collected with patients’ informed consent by Tabriz Heart Hospital for research purposes. The dataset does not contain any personal identifiable info, and is in compliance with institutional ethical standards and data protection regulation. We obtained the data via a request to THH only for secondary analysis. Throughout our research, we did not have any intervention or direct contact with patients. We have not seen any ethics issue with this dataset.
Conflicts of Interest: The authors declare no conflicts of interest to report regarding the present study.
References
1. Emerging Risk Factors Collaboration. Separate and combined associations of body-mass index and abdominal adiposity with cardiovascular disease: collaborative analysis of 58 prospective studies. Lancet. 2011;377(9771):1085–95. doi:10.1016/S0140-6736(11)60105-0. [Google Scholar] [PubMed] [CrossRef]
2. Gattringer T, Posekany A, Niederkorn K, Knoflach M, Poltrum B, Mutzenbach S, et al. Predicting early mortality of acute ischemic stroke. Stroke. 2019;50(2):349–56. doi:10.1161/strokeaha.118.022863. [Google Scholar] [PubMed] [CrossRef]
3. Verma S, Mazer CD, Yan AT, Mason T, Garg V, Teoh H, et al. Effect of empagliflozin on left ventricular mass in pa-tients with type 2 diabetes mellitus and coronary artery disease. Circulation. 2019;140(21):1693–702. doi:10.1161/circulationaha.119.042375. [Google Scholar] [PubMed] [CrossRef]
4. Cheng W, Kong F, Pan H, Luan S, Yang S, Chen S. Superior predictive value of estimated pulse wave velocity for all-cause and cardiovascular disease mortality risk in U.S. general adults. BMC Public Health. 2024;24(1):600. doi:10.1186/s12889-024-18071-2. [Google Scholar] [PubMed] [CrossRef]
5. Hasani WSR, Muhamad NA, Hanis TM, Maamor NH, Chen XW, Omar MA, et al. The global estimate of premature cardiovascular mortality: a systematic review and meta-analysis of age-standardized mortality rate. BMC Public Health. 2023;23(1):1561. doi:10.1186/s12889-023-16466-1. [Google Scholar] [PubMed] [CrossRef]
6. Chandrasekhar N, Peddakrishna S. Enhancing heart disease prediction accuracy through machine learning techniques and optimization. Processes. 2023;11(4):1210. doi:10.3390/pr11041210. [Google Scholar] [CrossRef]
7. Al Mehedi Hasan M, Shin J, Das U, Yakin Srizon A. Identifying prognostic features for predicting heart failure by using machine learning algorithm. In: Proceedings of the 2021 11th International Conference on Biomedical Engineering and Technology; 2021 Mar 17–20. Tokyo, Japan. New York, NY, USA: Association for Computing Machinery; 2021. p. 40–6. doi:10.1145/3460238.3460245. [Google Scholar] [CrossRef]
8. Moridani MK, Setarehdan SK, Nasrabadi AM, Hajinasrollah E. A novel approach to mortality prediction of ICU cardiovascular patient based on fuzzy logic method. Biomed Signal Process Control. 2018;45:160–73. doi:10.1016/j.bspc.2018.05.019. [Google Scholar] [CrossRef]
9. Ahmed S, Shaikh S, Ikram F, Fayaz M, Alwageed HS, Khan F, et al. Prediction of cardiovascular disease on self-augmented datasets of heart patients using multiple machine learning models. J Sens. 2022;2022:3730303. doi:10.1155/2022/3730303. [Google Scholar] [CrossRef]
10. Gündoğdu S. Efficient prediction of early-stage diabetes using XGBoost classifier with random forest feature selection technique. Multimed Tools Appl. 2023;82(22):34163–81. doi:10.1007/s11042-023-15165-8. [Google Scholar] [PubMed] [CrossRef]
11. Olawade DB, Soladoye AA, Omodunbi BA, Aderinto N, Adeyanju IA. Comparative analysis of machine learning models for coronary artery disease prediction with optimized feature selection. Int J Cardiol. 2025;436:133443. doi:10.1016/j.ijcard.2025.133443. [Google Scholar] [PubMed] [CrossRef]
12. Agrawal A, Bhagat U, Arockiam AD, Haroun E, Faulx M, Desai MY, et al. Machine learning risk-prediction model for in-hospital mortality in Takotsubo cardiomyopathy. Int J Cardiol. 2025;430:133181. doi:10.1016/j.ijcard.2025.133181. [Google Scholar] [PubMed] [CrossRef]
13. García-Ordás MT, Bayón-Gutiérrez M, Benavides C, Aveleira-Mata J, Benítez-Andrades JA. Heart disease risk prediction using deep learning techniques with feature augmentation. Multimed Tools Appl. 2023;82(20):31759–73. doi:10.1007/s11042-023-14817-z. [Google Scholar] [CrossRef]
14. Lee SJ, Lee SH, Choi HI, Lee JY, Jeong YW, Kang DR, et al. Deep learning improves prediction of cardiovascular disease-related mortality and admission in patients with hypertension: analysis of the Korean national health information database. J Clin Med. 2022;11(22):6677. doi:10.3390/jcm11226677. [Google Scholar] [PubMed] [CrossRef]
15. Schlesinger DE, Stultz CM. Deep learning for cardiovascular risk stratification. Curr Treat Options Cardio Med. 2020;22(8):15. doi:10.1007/s11936-020-00814-0. [Google Scholar] [CrossRef]
16. Mohammed A, Kora R. A comprehensive review on ensemble deep learning: opportunities and challenges. J King Saud Univ Comput Inf Sci. 2023;35(2):757–74. doi:10.1016/j.jksuci.2023.01.014. [Google Scholar] [CrossRef]
17. Mahajan P, Uddin S, Hajati F, Ali Moni M. Ensemble learning for disease prediction: a review. Healthcare. 2023;11(12):1808. doi:10.3390/healthcare11121808. [Google Scholar] [PubMed] [CrossRef]
18. Hossain S, Hasan MK, Faruk MO, Aktar N, Hossain R, Hossain K. Machine learning approach for predicting cardiovascular disease in Bangladesh: evidence from a cross-sectional study in 2023. BMC Cardiovasc Disord. 2024;24(1):214. doi:10.1186/s12872-024-03883-2. [Google Scholar] [PubMed] [CrossRef]
19. Chen T, Guestrin C. XGBoost: a scalable tree boosting system. In: Proceedings of the 22nd ACM SIGKDD International Conference on Knowledge Discovery and Data Mining; 2016 Aug 13–17; San Francisco, CA, USA. p. 785–94. doi:10.1145/2939672.2939785. [Google Scholar] [CrossRef]
20. Tamal MA, Saiful M, Jisan M, Abdul M, Miah P, Mohammed K. Heart disease prediction based on external factors: a machine learning approach. Int J Adv Comput Sci Appl. 2019;10(12):446–51. doi:10.14569/ijacsa.2019.0101260. [Google Scholar] [CrossRef]
21. Detrano R, Janosi A, Steinbrunn W, Pfisterer M, Schmid JJ, Sandhu S, et al. International application of a new probability algorithm for the diagnosis of coronary artery disease. Am J Cardiol. 1989;64(5):304–10. doi:10.1016/0002-9149(89)90524-9. [Google Scholar] [PubMed] [CrossRef]
22. DiNicolantonio JJ, Fares H, Niazi AK, Chatterjee S, D’Ascenzo F, Cerrato E, et al. β-blockers in hypertension, diabetes, heart failure and acute myocardial infarction: a review of the literature. Open Heart. 2015;2(1):e000230. doi:10.1136/openhrt-2014-000230. [Google Scholar] [PubMed] [CrossRef]
23. Subasi A. Data preprocessing. In: Practical machine learning for data analysis using python. Amsterdam, The Netherlands: Elsevier; 2020. p. 27–89. doi:10.1016/b978-0-12-821379-7.00002-3. [Google Scholar] [CrossRef]
24. Chawla NV, Bowyer KW, Hall LO, Kegelmeyer WP. SMOTE: synthetic minority over-sampling technique. Jair. 2002;16:321–57. doi:10.1613/jair.953. [Google Scholar] [CrossRef]
25. Jolliffe IT. Principal component analysis. 2nd ed. Berlin, Germany: Springer; 2010. [Google Scholar]
26. Kuhn M, Johnson K. Applied predictive modeling. New York, NY, USA: Springer; 2013. doi:10.1007/978-1-4614-6849-3. [Google Scholar] [CrossRef]
27. Stone M, Brooks RJ. Continuum regression: cross-validated sequentially constructed prediction embracing ordinary least squares, partial least squares and principal components regression. J R Stat Soc Ser B Methodol. 1990;52(2):237–58. doi:10.1111/j.2517-6161.1990.tb01786.x. [Google Scholar] [CrossRef]
28. Guleria P, Naga Srinivasu P, Ahmed S, Almusallam N, Alarfaj FK. XAI framework for cardiovascular disease prediction using classification techniques. Electronics. 2022;11(24):4086. doi:10.3390/electronics11244086. [Google Scholar] [CrossRef]
29. Ganie SM, Pramanik PKD, Zhao Z. Ensemble learning with explainable AI for improved heart disease prediction based on multiple datasets. Sci Rep. 2025;15(1):13912. doi:10.1038/s41598-025-97547-6. [Google Scholar] [PubMed] [CrossRef]
30. Alam MM. An efficient random forest algorithm-based telemonitoring framework to predict mortality and length of stay of patients in ICU. Multimed Tools Appl. 2024;83(17):50581–600. doi:10.1007/s11042-023-17239-z. [Google Scholar] [CrossRef]
31. Shah SMS, Ali Shah F, Hussain SA, Batool S. Support vector machines-based heart disease diagnosis using feature subset, wrapping selection and extraction methods. Comput Electr Eng. 2020;84:106628. doi:10.1016/j.compeleceng.2020.106628. [Google Scholar] [CrossRef]
32. Bhagat M, Bakariya B. Prediction of heart disease through KNN, random forest, and decision tree classifier using K-fold cross-validation. In: Artificial intelligence and sustainable computing. Singapore: Springer Nature; 2022. p. 67–75. doi:10.1007/978-981-19-1653-3_6. [Google Scholar] [CrossRef]
33. Jaya T, Mohan M, Alam MS. Effective heart disease prediction using machine learning—modified KNN. In: Soft computing for security applications. Singapore: Springer Nature; 2022. p. 479–89. doi:10.1007/978-981-19-3590-9_37. [Google Scholar] [CrossRef]
34. Florek P, Zagdański A. Benchmarking state-of-the-art gradient boosting algorithms for classification. arXiv: 2305.17094. 2023. [Google Scholar]
35. Liu FY, Qian C. Prediction guided meta-learning for multi-objective reinforcement learning. In: Proceedings of the 2021 IEEE Congress on Evolutionary Computation (CEC); 2021 Jun 28–Jul 1; Kraków, Poland. p. 2171–78. doi:10.1109/cec45853.2021.9504972. [Google Scholar] [CrossRef]
36. Kim YT, Kim DK, Kim H, Kim DJ. A comparison of oversampling methods for constructing a prognostic model in the patient with heart failure. In: Proceedings of the 2020 International Conference on Information and Communication Technology Convergence (ICTC); 2020 Oct 21–23; Jeju, Republic of Korea. p. 379–83. doi:10.1109/ictc49870.2020.9289522. [Google Scholar] [CrossRef]
37. Chicco D, Jurman G. Machine learning can predict survival of patients with heart failure from serum creatinine and ejection fraction alone. BMC Med Inform Decis Mak. 2020;20(1):16. doi:10.1186/s12911-020-1023-5. [Google Scholar] [PubMed] [CrossRef]
38. Newaz A, Ahmed N, Shahriyar Haq F. Survival prediction of heart failure patients using machine learning techniques. Inform Med Unlocked. 2021;26:100772. doi:10.1016/j.imu.2021.100772. [Google Scholar] [CrossRef]
39. Dharmarathne G, Bogahawaththa M, McAfee M, Rathnayake U, Meddage DPP. On the diagnosis of chronic kidney disease using a machine learning-based interface with explainable artificial intelligence. Intell Syst Appl. 2024;22:200397. doi:10.1016/j.iswa.2024.200397. [Google Scholar] [CrossRef]
Cite This Article
 Copyright © 2025 The Author(s). Published by Tech Science Press.
This work is licensed under a Creative Commons Attribution 4.0 International License , which permits unrestricted use, distribution, and reproduction in any medium, provided the original work is properly cited.
 Downloads
 Citation Tools