
 Submit a Paper
 Propose a Special lssue
 Open Access
ARTICLE
Numerical Analysis of Pressure Propagation Emitted by Collapse of a Single Cavitation Bubble near an Oscillating Wall
1 Institute of Mechanics, Vietnam Academy of Science and Technology, Hanoi, 100000, Vietnam
2 School of Mechanical Engineering, Pusan National University, Busan, 46241, Republic of Korea
3 Graduate University of Science and Technology, Vietnam Academy of Science and Technology, Hanoi, 100000, Vietnam
4 University of Engineering and Technology, Vietnam National University, Hanoi, 100000, Vietnam
* Corresponding Authors: The-Duc Nguyen. Email: ; Van-Tu Nguyen. Email:
# These authors contributed equally to this work as the first author
(This article belongs to the Special Issue: Modeling and Applications of Bubble and Droplet in Engineering and Sciences)
Computer Modeling in Engineering & Sciences 2025, 145(3), 3433-3452. https://doi.org/10.32604/cmes.2025.070570
Received 19 July 2025; Accepted 10 November 2025; Issue published 23 December 2025
 View Full Text
 Download PDF
Abstract
This study presents a numerical analysis of the effects of a rigid flat wall with oscillating motion on the pressure wave propagation during a single spherical cavitation bubble collapse at different initial bubble positions. Different nondimensional distancesGraphic Abstract
Keywords
Understanding and controlling the dynamics of cavitation bubbles is vital across a wide range of sectors, including underwater research, hydraulic systems, water treatment processes, the shipping sector, and healthcare. Numerous studies have highlighted the importance of understanding and managing cavitation bubble behavior across various applications. Researchers have explored the dynamics of cavitation bubbles through theoretical, numerical, and experimental approaches, taking into account different environmental conditions, such as it has been studied in a free field and near a rigid wall [1,2] in a narrow tube [3], surrounding a free-moving object [4–7], in an acoustic field [8–12], inside a droplet [13,14], in a soft matter [15], near a fiber [16], near a rigid surface with a hole [17–19], between the free surface and a rigid wall [20]. The intense pressures and high temperatures produced when bubbles collapse can lead to considerable harm to machinery [21]. The impact of the pressure wave induced by a bubble collapse near a solid structure plays a key role in the damage to the solid structure due to cavitation erosion [22–25].
Recent research has focused on the numerical analysis of pressure propagation resulting from cavitation bubble collapse near solid and oscillating walls. Nguyen et al., 2023 [26] examined shock wave modeling and fluid-material interactions but lacked long-term erosion assessments for industrial applications. Despite these limitations, the collective findings contribute to refining erosion prediction models and enhancing engineering applications. Zhao et al., 2024 [27] highlighted the generation of localized high-pressure zones contributing to material erosion, but their study mainly relied on numerical simulations without experimental validation. Nguyen et al., 2024 [28] examined ambient pressure influences on shock waves and supersonic jets, but did not account for complex material responses to cavitation forces. These studies examine critical factors, including shock waves, jet formation, and impact pressure, with some emphasizing the effects of ambient pressure and fluid-material interactions.
In recent years, various studies have attempted to explore the effects of bubbles on a boundary or the boundary effects on the collapse of laser- and spark-induced bubbles near boundaries, revealing critical insights into fluid–structure interactions and energy focusing mechanisms in various studies, considering a fixed wall a deformable wall, a movable wall, for solid and flexible boundaries [29–38]. Li et al. (2019) [29] and Hu et al. (2021) [30] delve into fluid–structure interactions, presenting models that capture the complex behavior of pulsating bubbles near movable or deformable structures. Andrews et al. (2020) [31] and Trummler et al. (2020) [32] explore cavity and bubble collapse near slot and crevice geometries, revealing how surface features influence jet formation and pressure concentration. Cao et al. (2021) [33] extend this by examining the role of acoustic impedance in shock-induced collapse, highlighting material-dependent energy transfer. Koch et al (2021) explore the dynamics and examine the behavior of mushroom-shaped bubbles and the fast jet during oscillation of a laser-induced bubble above the flat top of a solid cylinder [34]. Lin et al. (2022) studied single-bubble dynamics with the influence of a mesoscale surface [35], and cavitating flow surrounding a flexible hydrofoil [36]. Zhang et al. (2024) introduce a theoretical model for compressible bubble dynamics that considers phase transition and migration, accounting for the effects of a rigid wall [37]. Sun et al. (2025) investigated the control of cavitation bubble collapse and jet formation on demand using a setup with both free and rigid boundaries [38]. Together, these studies emphasize the significance of boundary conditions, material properties, and structural mobility in shaping collapse dynamics, offering valuable insights for simulations involving oscillatory motion and cavitation phenomena.
In many applications, the cavitation bubble size is small compared to the solid body [39], and the motion of the walls is dominated by the main flow surrounding the solid structure [36,40]. The presence of bubbles near vibrating walls can be observed in pump operations, hydrofoils, control valves, ultrasonic horns, and propellers [39–42]. The examination of oscillatory wall effects on bubble collapse dynamics provides valuable insights for addressing erosion, managing cavitation, and enhancing various cavitation-bubble applications. Scholarly research has demonstrated that the pressure distribution within the surrounding environment significantly influences cavitation behavior [28]. Few experimental observations have revealed that controlled oscillating rigid walls can affect the behavior of bubble collapse [43,44]. In these studies, the dynamics of an air bubble attached to a rigid wall [43] and a single laser cavitation bubble [43,44] have been studied. They found that the laser-induced cavitation bubble collapse near the oscillating wall can be sped up by 15%. Furthermore, a bubble collapse under the effects of a plate approaching was faster than that of a plate-retracting bubble. Numerical simulations of a single cavitation bubble collapse near a controlled oscillating wall were performed with flat [45] and curved shapes [46]. Numerical results indicated that the physical mechanism driving the acceleration or deceleration of bubble motion cycles near oscillating walls was a consequence of the in-phase or out-of-phase condition. These motions resulted in the compression or expansion of the surrounding fluid, respectively. This phenomenon led to heightened pressure differentials between the bubble’s interior and exterior during in-phase movements and reduced pressure differentials during out-of-phase movements. The observed variations in bubble collapse behavior during the study can be attributed to these pressure changes. However, these investigations primarily focused on bubble dynamics under specific motion conditions at a single standoff condition
This study aims to explore the propagation of pressure waves and their impact on the oscillating rigid wall, considering the effects of standoff conditions by numerical investigation. A numerical investigation of the propagation of pressure waves generated during a single bubble collapse is performed to explore the effects of the standoff condition on pressure propagation during a bubble collapse near an oscillating rigid wall. To investigate the pressure wave propagation during a single bubble collapse near an oscillating wall, a sinusoidal function
–
–
–
To the best of the authors’ knowledge, this study is the first to examine the effects of oscillating walls on pressure wave propagation during cavitation bubble collapse, considering the influence of different standoff conditions. Fig. 1 portrays a cavitation bubble near an oscillating rigid plate in a flat shape.
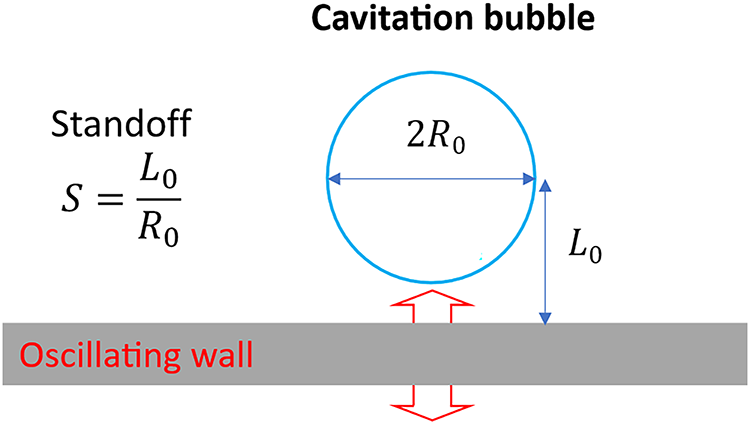
Figure 1: Schematic view of a cavitation bubble near an oscillating surface. Considered standoff values:
Computational simulations employ a proprietary code for a compressible two-phase flow model that incorporates the VOF interface-sharpening methodology. This model, designed to operate on a generalized curvilinear moving grid, was developed in FORTRAN by researchers at the Computational Fluid Dynamics Laboratory at the School of Mechanical Engineering, Pusan National University, Busan, Republic of Korea. The accuracy of the numerical model was verified in our previous works [45,46,48,49].
For the reader’s convenience, the remaining content of the paper is structured as follows: Section 2 describes the methodology for simulating compressible two-phase flow. Section 3 details the verification of the numerical model against published data. Section 4 presents the numerical analyses and provides an in-depth discussion of the mechanism of pressure wave propagation in the presence of a rigid wall, under both in-phase and out-of-phase conditions. Finally, concluding remarks are provided.
This study used a compressible two-phase flow model to investigate pressure propagation during the collapse of a cavitation bubble near an oscillating wall. The numerical model is based on the Volume of Fluid (VOF) method to accurately capture the sharp bubble interface [48]. A moving-grid algorithm was employed to simulate the effects of wall vibration, and its accuracy has been validated in our previous studies with oscillating flat wall [45] and curved wall [46] and impact problem of free surface and water [49].
The governing equations of liquid-gas flow are given as follows:
where
where
The VOF equation of scalar field α for determining the advection of the liquid-gas interface is expressed in Cartesian coordinates as
Eqs. (6) and (7) are expressions of the Tait equations of state for the liquid and gas phases, respectively.
The speed of sound
where
In this study,
The effect of surface tension is neglected, as the flow during the collapse of small cavitation bubbles is primarily governed by inertia over short timescales. For instant, in cavitation bubble collapse, surface tension has no significant effect on small bubble collapse [52], and an important role only in the growth stage, and for the bubble size
A comparison between the present numerical simulations and the published literature of Reuter (2022) [59] for initial cavitation bubble collapse near a rigid wall is conducted to verify the numerical model. The computational domain was axisymmetric with a width of
The mesh configuration and convergence study were validated with experimental data in our previous work [45] for
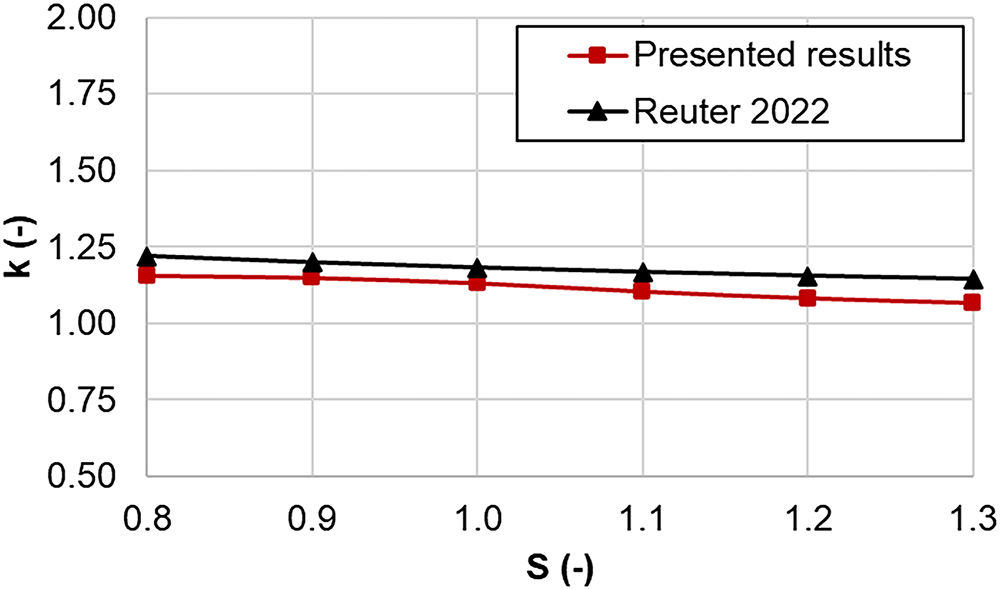
Figure 2: Rayleigh prolongation factor in comparison with the numerical results from the literature [59]
As can be seen in Fig. 2, the results for various standoff distance (S = 0.8–1.3) are well-represented by a polynomial fit of the data from Reuter (2022) [59]. The maximum deviation in the Rayleigh prolongation factor is approximately 6%, indicating a good agreement with the reference data.
4 Numerical Results and Discussion
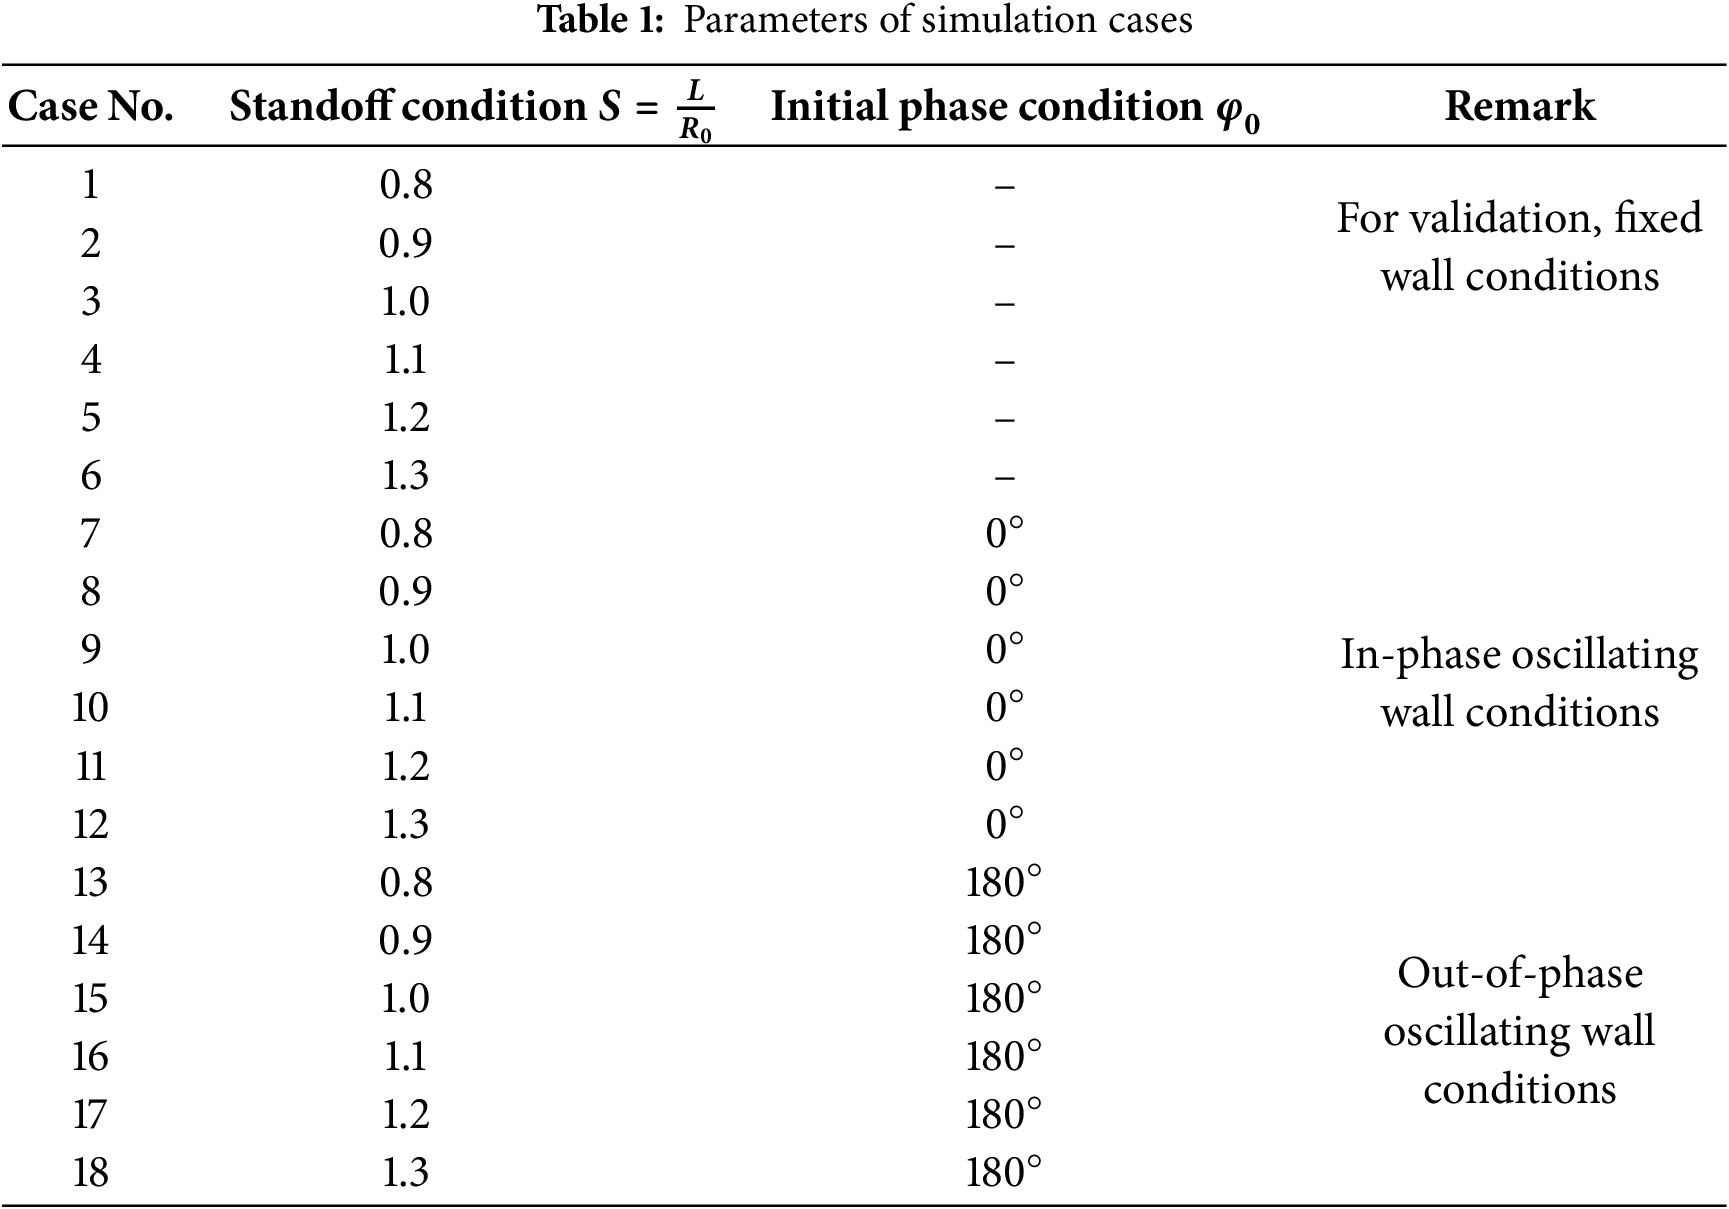
This section describes the numerical analysis of bubble dynamics and pressure propagation induced by a single bubble collapse near a rigid wall. Numerical simulations were conducted under various wall oscillation conditions for six standoff ratios (
At the moment of the maximum bubble size, i.e., rest state, the bubble is assumed to be in a quasi-static state, allowing us to approximate the internal pressure as uniformly distributed. This simplification helps streamline the simulation while still capturing the essential deformation behavior. Therefore, much literature considers only the collapse stage. Thus, in our current model, we did not explicitly consider the initial pressure distribution due to the complexity of bubble conditions and wall motion. Although this, we acknowledge that pressure gradients may arise during the bubble expansion stage of the full-cycle bubble. During the bubble expansion phase, a shock wave can be emitted from the bubble induction position and reflect after impact on the rigid wall. The reflected shock wave can impact the bubble boundary. This leads to non-uniform distributions that could significantly influence the deformation and stress fields. However, due to the movement of the rigid wall and bubble interface, the interaction of the system oscillating wall-liquid-bubble is a strong nonlinear phenomenon and causes much confuse to understand bubble behavior and requires, firstly, a good understanding of the interaction between the oscillating wall and cavitation bubble in the collapse phase, i.e., the remain phase of the full cycle of bubble.
The oscillation parameters are chosen as
The effects of in-phase and out-of-phase oscillating walls on the propagation of pressure waves and jet formation are discussed in Section 4.1. Section 4.2 provides a discussion of the evolution of pressure load on a rigid wall during the interaction of the bubble collapse process and the oscillating wall. The migration of the bubble and the resulting pressure peak resulting from the shock wave’s impact on the rigid wall are discussed in Section 4.3.
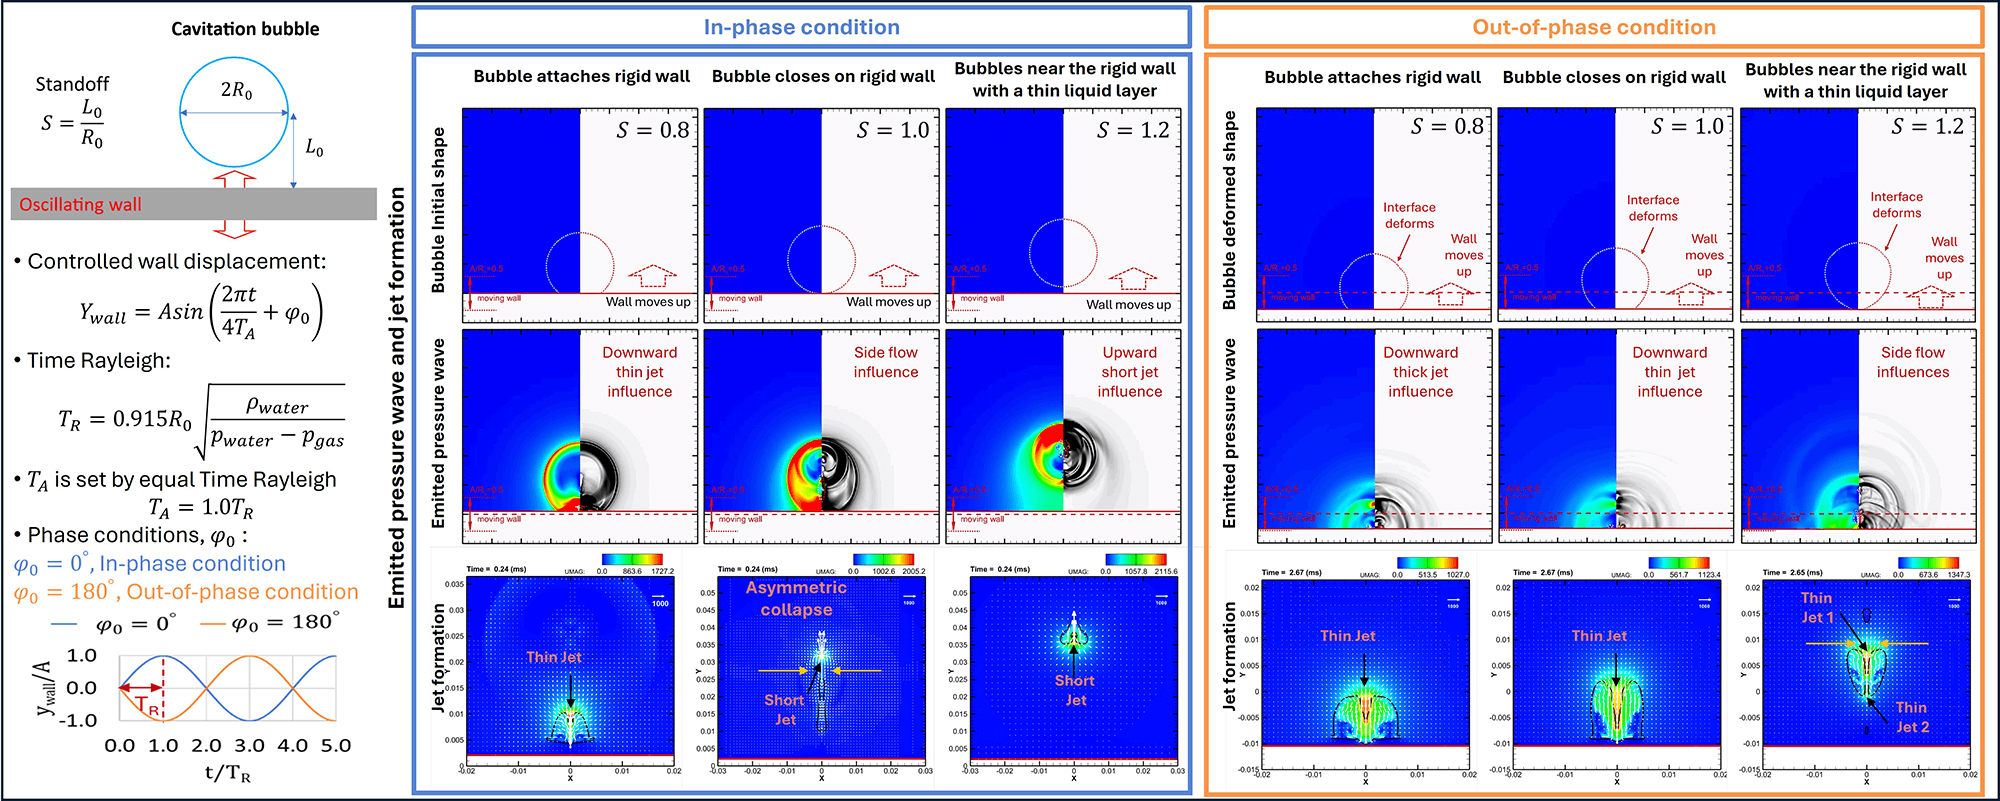
4.1 Effects of Initial In-Phase and Out-of-Phase Conditions on Pressure Wave Propagation
Figs. 3 and 4 show the propagation of pressure waves generated during the cavitation bubble collapse with
Figure 3: Typical snapshots of Schlieren-type images of pressure distribution at conditions
Figure 4: Typical snapshots of Schlieren-type images of pressure distribution at conditions
In Fig. 3, the in-phase oscillating walls significantly affect the bubble behaviors and the pressure propagation. Under the influence of in-phase oscillating walls, the cavitation bubble collapses rapidly, forming an upward jet at its bottom. During jet development, the jet flow interacts with the topmost point of the bubble interface, generating a pressure wave. Due to the resistance at the bubble interface, there is a difference in pressure between the upper and lower sides of the pressure wave. The generated pressure wave propagates in the flow field during bubble collapse, with the stronger side moving upward and away from the bubble and the rigid wall, while the weaker side moves toward the rigid wall. At lower standoff conditions, the generated pressure wave is stronger than that at higher standoff conditions.
In Fig. 4, the out-of-phase oscillating wall causes different bubble behavior and pressure propagation compared to the in-phase condition, as shown in Fig. 3. In all standoff conditions, the cavitation bubble deforms slowly as the rigid wall moves far away from the original position until the wall changes its motion direction after reaching maximum oscillation amplitude at time
Fig. 5 illustrates the jet formation under the oscillating-wall effects compared with the fixed-wall condition at different S. Under the fixed-wall condition (top row), the bubble collapse produces symmetrical, long, and thick jets directed toward the rigid wall. In contrast, oscillating-wall conditions (middle and bottom rows) generate complex flow structures that are strongly influenced by both the standoff distance and the phase angle.
Figure 5: Jet formation under the effects of different standoff conditions of fixed walls and oscillating walls
As
Overall, the figure illustrates how the wall motion and spacing can significantly affect jet behavior and pressure propagation, providing valuable insights for applications in fluid control, propulsion, and mixing. We currently believe this is the first attempt to study pressure propagation during the collapse of a single cavitation bubble near a controlled oscillating wall. Hence, no experimental study is available to confirm our results. The numerical results in this study are consistent with similar published experiments [43,44], which indicates that the controlled oscillating wall results in reduced collapse time [44] and a strong deformation on the bubble interface [43].
4.2 Pressure Load Evolution on the Rigid Wall under the Effects of the Oscillating Wall
As discussed above, due to differences in the propagation of pressure waves and jet formation during bubble collapse near oscillating walls, the pressure peaks on the wall are affected by the oscillation condition. Fig. 6 shows the effects of in-phase and out-of-phase conditions on the time evolution of pressure load on the wall at different standoff conditions S = 0.8–1.3. The effects of oscillation conditions and pressure peaks on the wall vary with different standoff conditions.
Figure 6: The time evolution of pressure load on the wall during bubble collapse under the effects of an oscillating wall with (a) in-phase (
For both in-phase and out-of-phase conditions, the highest-pressure peaks were found in the case of standoff
4.3 Bubble Migration with Jet Formation and Pressure Peaks under the Effects of Oscillating Walls
This section discusses the correspondence between the pressure peaks on a rigid wall and bubble migration with jet formation under the oscillating-wall effects, based on quantitative analysis of the numerical results. Fig. 7 presents a comparison of the pressure peaks generated by the impact of pressure waves on the rigid wall under oscillating- and fixed-wall conditions. Both in-phase (
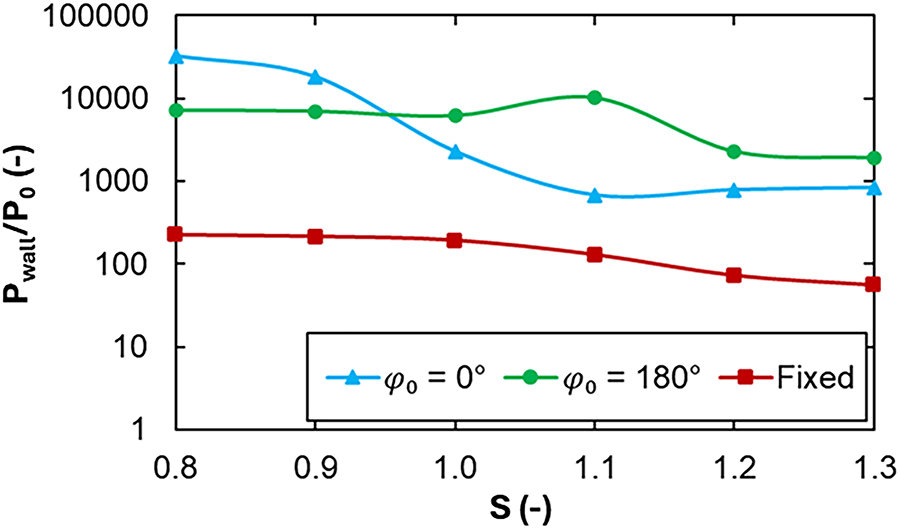
Figure 7: Comparison of the pressure peak due to the impact of pressure on the rigid wall under the effects of an oscillating wall with in-phase (
The variations of the pressure peaks show a significant difference between oscillating- and fixed-wall conditions. Generally, the pressure peak decreases as the standoff distance increases. However, under both in-phase (
The differences in the variations of the pressure peaks under in-phase and out-of-phase oscillating-wall conditions can be attributed to the behavior of bubble migration. Figs. 8 and 9 show the time evolution of bubble migration in terms of the normalized displacement of the bubble center
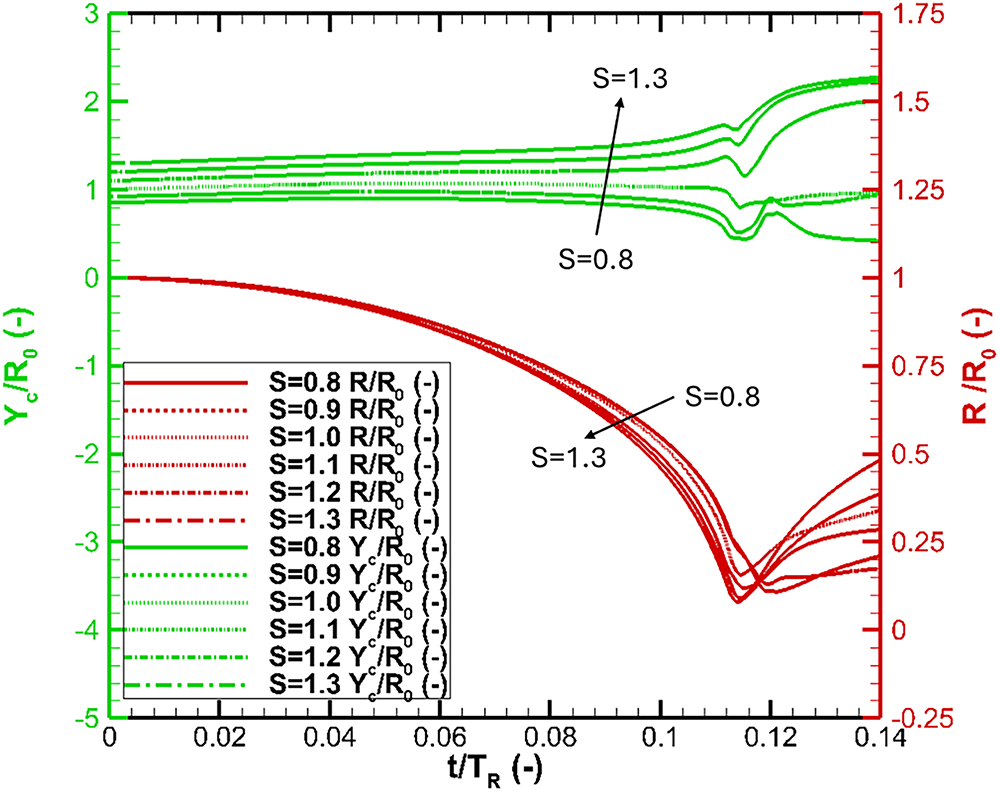
Figure 8: Collapse and migration of cavitation bubble under the effects of in-phase (
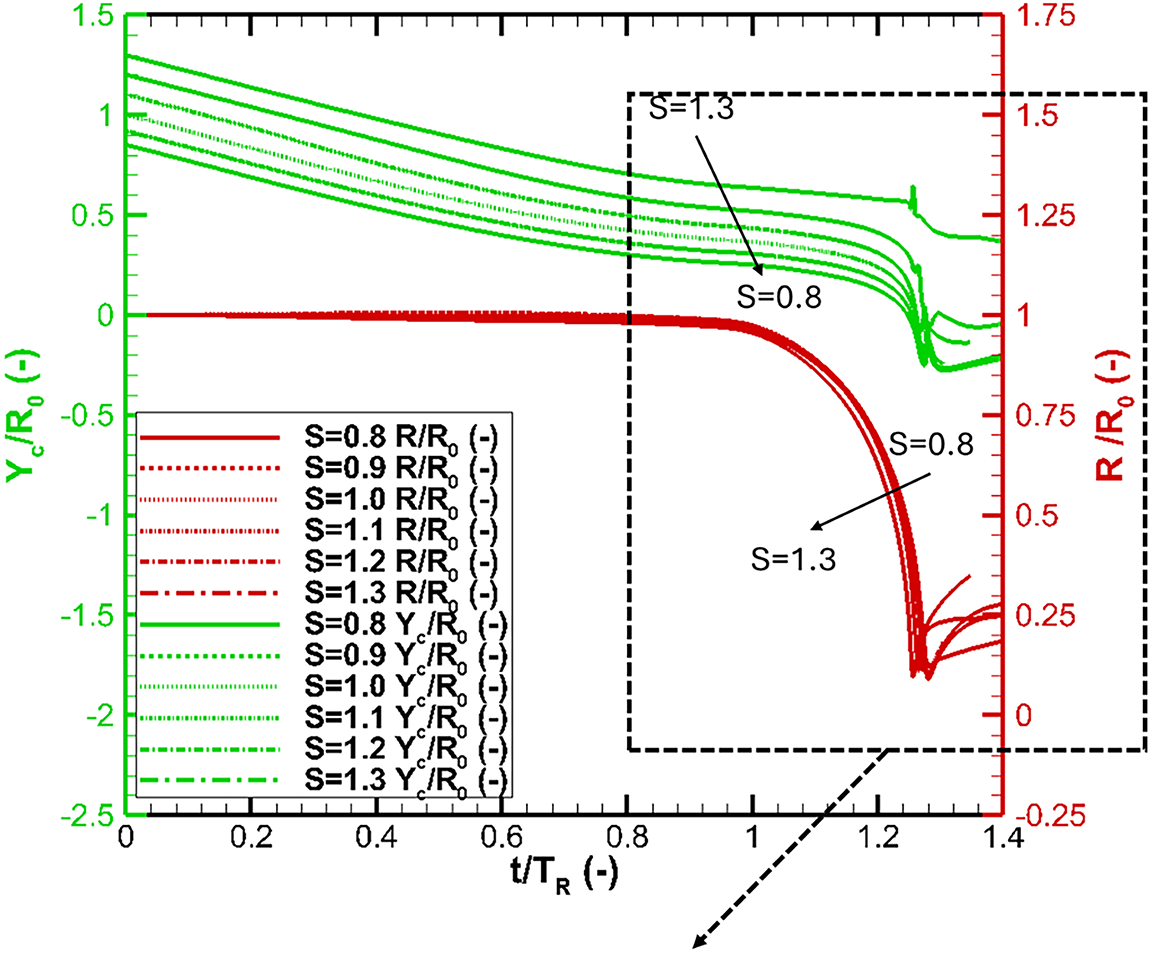
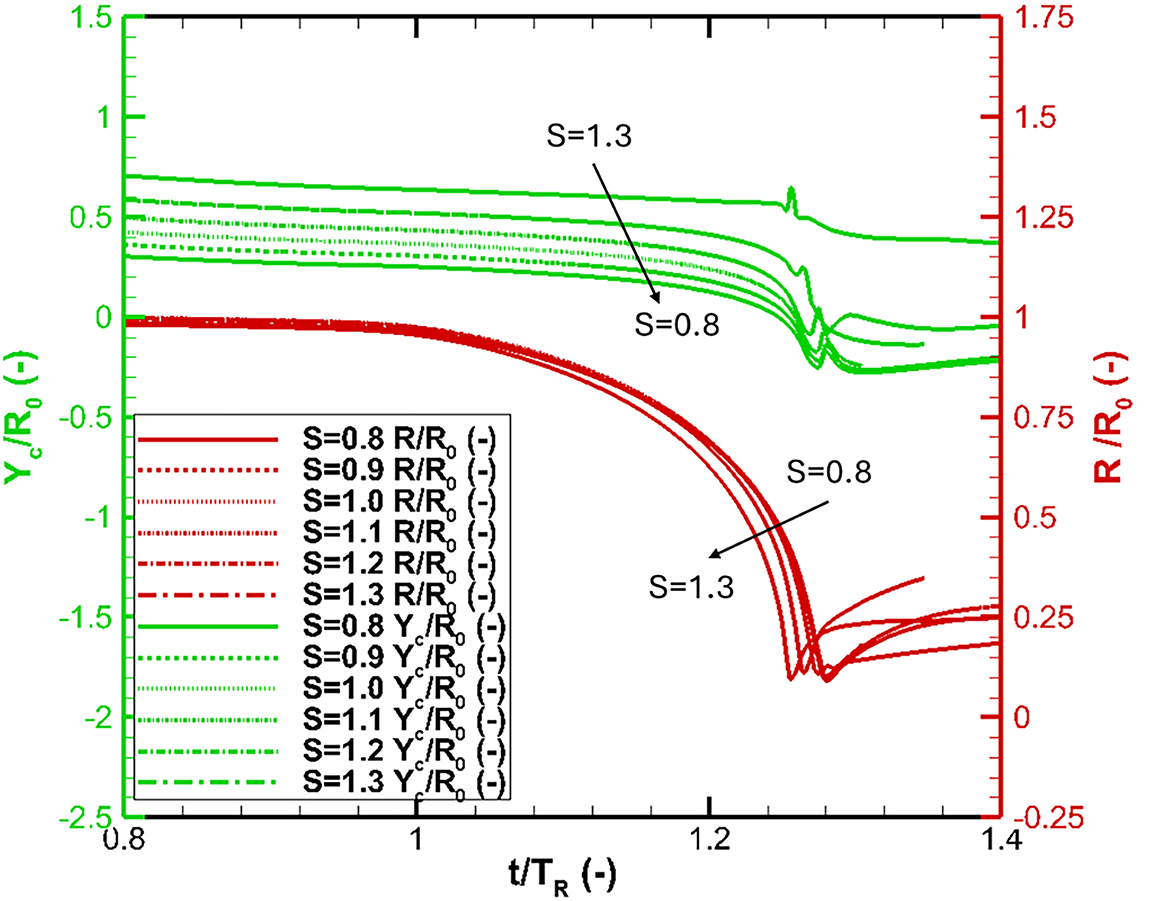
Figure 9: Collapse and migration of cavitation bubble under the effects of out-of-phase (
For the in-phase condition, as shown in Fig. 8, the bubble migration behavior can be classified into two types: (Type 1) movement toward the rigid wall for S = 0.8–1.0; and (Type 2) movement away from the rigid wall for S = 1.0–1.3. The former (Type 1) results in a stronger pressure-wave impact on the rigid wall compared with the latter (Type 2). This bubble-migration behavior accounts for the observed difference in the pressure peak variation on the rigid wall under in-phase conditions, as shown in Fig. 7.
For the out-of-phase conditions, we can see a complex migration of bubbles under the oscillating-wall condition at different S (Fig. 9). The bubble migration behaviors remain similar across all standoff conditions for
Fig. 10 presents the trendlines of jet velocity under the effect of an oscillating wall in comparison with the effects of fixed wall conditions that vary with different standoff values. The jet velocity is determined by
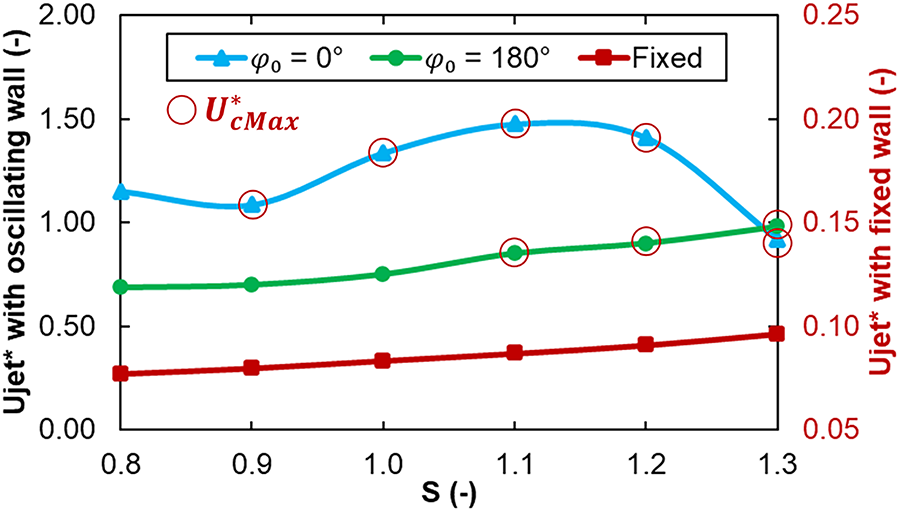
Figure 10: Jet maximum velocity under the effects of out-of-phase (
The trend of velocity has correlated with jet flow behavior, as shown in Fig. 5 and the trend line of the pressure peak on the wall, as shown in Fig. 7. The fixed wall condition shows a gradual increase in the trend lines of jet velocity at varying
Overall, the numerical results indicate that wall motion significantly influences the pressure wave generated during cavitation bubble collapse. Under fixed-wall conditions, the pressure response varies with the standoff distance, whereas under oscillating-wall conditions, it is affected by both the standoff distance and the initial phase of wall motion. In practical cases, solid structures are usually not as simple as the rigid flat wall considered in this study. Strong interaction between elastic surfaces and movable particles was reported in the literature [29,61,62]. In particular, the time collapse of bubbles under the effects of oscillating walls shows a good agreement with the experimental observation of Sagar et al., 2024 [44], confirming the validity of the present numerical approach. Further investigation is required to achieve a more comprehensive understanding of these coupled fluid–structure interactions and their implications for practical cavitation control.
In this research, we numerically investigated how oscillating wall conditions affect pressure wave propagation during near-wall bubble collapse at different standoff distances. Numerical simulations were conducted using a compressible two-phase flow based on the VOF method and a sharpening technique. The numerical results and experimental data are in good agreement. This demonstrates the numerical model’s accuracy. Some conclusions have been drawn as follows:
– The propagation of pressure waves generated during bubble collapse under the effects of in-phase and out-of-phase oscillating wall conditions was observed at different standoff conditions S = 0.8–1.3and discussed throughout the paper.
– The numerical analysis showed the significant effects of oscillating wall conditions on the propagation of pressure waves. Extreme pressure wave emissions are observed during bubble collapse under oscillatory wall conditions.
– Quantitative parameters have been analyzed to facilitate an in-depth discussion on bubble migration behaviors and the pressure peaks induced by the impact of pressure waves on a rigid wall. Examinations of pressure peaks on the wall show that the effects of oscillation conditions vary with different standoff conditions. The stronger pressure impact is found in the case of the out-of-phase oscillating walls with
– The paper provides a numerical analysis of pressure wave propagation during bubble collapse near oscillating walls with some limitations, and further research, such as the below, is needed:
+ The wall motion is assumed to undergo a controlled sinusoidal oscillation; deformation of the solid surface that happens in reality is neglected; the influence of heat transfer and phase change during bubble collapse is not considered; standoff conditions are considered in the range of 0.8–1.3 for typical distance conditions only; rigid surface geometry is assumed as a flat wall only.
+ Studies on parameters such as characteristics of shock energy and jet flow behavior should be further considered.
+ In the study, a cavitation bubble is initiated at a maximum size and in a spherical shape. However, an expanding bubble can be significantly deformed from a spherical shock wave emitted at cavitation inception and a reflection wave after impact on the rigid wall. A further study of the expansion stage is required to comprehensively understand the phenomenon.
Overall, this study represents an initial investigation into the pressure propagation during the collapse of a single cavitation bubble near a controlled oscillating wall. Our numerical results align with published experiments, suggesting that the controlled oscillating wall results in shorter collapse time and significant deformation of the bubble interface. The study enhances our understanding of pressure propagation and bubble-structure interaction within the phenomenon. While it is a fundamental study, the findings provide valuable insights into pressure wave propagation and bubble dynamics under oscillating wall conditions. Further research is necessary to examine the relationships between selected oscillation frequencies and bubble sizes, and to assess their application to real-world systems, such as ultrasonic devices and propeller-induced cavitation, to clarify the practical significance of the results.
Acknowledgement: None.
Funding Statement: This work was sponsored by the Vietnam Academy of Science and Technology (VAST), granted to Prof. Duong Ngoc Hai under Project No. VAST01.02/22-23 and by the National Research Foundation (NRF) of the Republic of Korea, granted to Prof. Warn-Gyu Park under Project No. RS-2023-00248070.
Author Contributions: The authors confirm contribution to the paper as follows: study conception and design: Quang-Thai Nguyen, Van-Tu Nguyen; data collection: Quang-Thai Nguyen, Van-Tu Nguyen, The-Duc Nguyen; analysis and interpretation of results: Quang-Thai Nguyen, Van-Tu Nguyen, The-Duc Nguyen, Duong Ngoc Hai, Jinyul Hwang Hwang, Warn-Gyu Park; draft manuscript preparation: Quang-Thai Nguyen, Van-Tu Nguyen, Duong Ngoc Hai, Jinyul Hwang Hwang. All authors reviewed the results and approved the final version of the manuscript.
Availability of Data and Materials: The authors confirm that the data supporting the findings of this study are available within the article.
Ethics Approval: Not applicable.
Conflicts of Interest: The authors declare no conflicts of interest to report regarding the present study.
Abbreviations
| Term/Symbol | Description | Unit |
| CFD | Computational Fluid Dynamics | - |
| VOF | Volume of Fluid | - |
| CFL | Courant–Friedrichs–Lewy | - |
| MUSCL | Monotone Upstream-centered Schemes for Conservation Laws | - |
| Initial distance between the bubble center and the rigid wall | ||
| Initial bubble radius (maximum bubble radius at rest condition) | ||
| S | Standoff, | - |
| TR | Rayleigh time | |
| TA | Controlled oscillation time of the rigid wall | |
| Tc | Collapse time of the cavitation bubble | |
| Initial phase parameter of the controlled oscillating wall | - | |
| p | Pressure | |
| Pressure on rigid wall at center | ||
| Ambient pressure | ||
| Mixture density (partial liquid and gas densities: | ||
| Mixture viscosity (partial liquid and gas viscosities: | Pa·s | |
| Physical time | ||
| Flow velocity vector, | ||
| Identity tensor | - | |
| Viscous stress tensor, | - | |
| R | Bubble radius | |
| Liquid volume fraction | - | |
| Specific heat ratio ( | - | |
| Speed of sound ( | ||
| B | Bulk modulus, | |
| Rayleigh prolongation factor, | - | |
| Equivalient bubble center position | ||
| Note | “-” indicates dimensionless. |
References
1. Nguyen VT, Phan TH, Duy TN, Park WG. Numerical modeling for compressible two-phase flows and application to near-field underwater explosions. Comput Fluids. 2021;215:104805. doi:10.1016/j.compfluid.2020.104805. [Google Scholar] [CrossRef]
2. My NV, Tien LA, Nam PH, Khanh NQ, Than CV, Hoang PT. On the behavior of nonlinear hydrodynamic coefficients of a submerged cylinder beneath the water surface. Vietnam J Mech. 2021;43(4):371–87. doi:10.15625/0866-7136/16613. [Google Scholar] [CrossRef]
3. Wang Z, Tong AY. Deformation and oscillations of a single gas bubble rising in a narrow vertical tube. Int J Therm Sci. 2008;47(3):221–8. doi:10.1016/j.ijthermalsci.2007.02.011. [Google Scholar] [CrossRef]
4. Nguyen TT, Hai DN, Thai NQ, Phuong TT. Experimental measurements of the cavitating flow after horizontal water entry. Fluid Dyn Res. 2017;49(5):055508. doi:10.1088/1873-7005/aa885d. [Google Scholar] [CrossRef]
5. Nguyen TT, Duong HN, Nguyen TQ, Kikura H. CFD simulations of the natural cavitating flow around high-speed submerged bodies. In: Proceedings of the International Conference on Advances in Computational Mechanics 2017; 2017 Aug 2–4; Phu Quoc Island, Vietnam. p. 851–73. doi:10.1007/978-981-10-7149-2_60. [Google Scholar] [CrossRef]
6. Xu F, Liu Y, Chen M, Luo J, Bai L. Continuous motion of particles attached to cavitation bubbles. Ultrason Sonochem. 2024;107:106888. doi:10.1016/j.ultsonch.2024.106888. [Google Scholar] [PubMed] [CrossRef]
7. Le AD. Experimental and numerical evaluation of thermodynamic effect on NACA0015 hydrofoil cavitation in hot water. Vietnam J Mech. 2021;43(3):253–64. doi:10.15625/0866-7136/15764. [Google Scholar] [CrossRef]
8. Yasui K. Acoustic cavitation. In: Acoustic cavitation and bubble dynamics. Cham, Switzerland: Springer; 2017. p. 1–35. doi:10.1007/978-3-319-68237-2_1. [Google Scholar] [CrossRef]
9. Žnidarčič A, Mettin R, Dular M. Modeling cavitation in a rapidly changing pressure field—application to a small ultrasonic horn. Ultrason Sonochem. 2015;22(2):482–92. doi:10.1016/j.ultsonch.2014.05.011. [Google Scholar] [PubMed] [CrossRef]
10. Kim TH, Kim HY. Disruptive bubble behaviour leading to microstructure damage in an ultrasonic field. J Fluid Mech. 2014;750:355–71. doi:10.1017/jfm.2014.267. [Google Scholar] [CrossRef]
11. Ma X, Huang B, Li Y, Chang Q, Qiu S, Su Z, et al. Numerical simulation of single bubble dynamics under acoustic travelling waves. Ultrason Sonochem. 2018;42(4):619–30. doi:10.1016/j.ultsonch.2017.12.021. [Google Scholar] [PubMed] [CrossRef]
12. Qiu S, Ma X, Huang B, Li D, Wang G, Zhang M. Numerical simulation of single bubble dynamics under acoustic standing waves. Ultrason Sonochem. 2018;49(1–2):196–205. doi:10.1016/j.ultsonch.2018.08.006. [Google Scholar] [PubMed] [CrossRef]
13. Rosselló JM, Reese H, Raman KA, Ohl CD. Bubble nucleation and jetting inside a millimetric droplet. J Fluid Mech. 2023;968:A19. doi:10.1017/jfm.2023.542. [Google Scholar] [CrossRef]
14. Nguyen TT, Hoang VT, Luu DB, Tran NH, Tran MS, Do LHT. Study on the velocity of droplet at steady state in contraction microchannels by numerical simulation. Vietnam J Mech. 2023;45(4):287–95. doi:10.15625/0866-7136/18918. [Google Scholar] [CrossRef]
15. Dollet B, Marmottant P, Garbin V. Bubble dynamics in soft and biological matter. Annu Rev Fluid Mech. 2019;51(1):331–55. doi:10.1146/annurev-fluid-010518-040352. [Google Scholar] [CrossRef]
16. Fursenko RV, Chudnovskii VM, Minaev SS, Okajima J. Mechanism of high velocity jet formation after a gas bubble collapse near the micro fiber immersed in a liquid. Int J Heat Mass Transf. 2020;163:120420. doi:10.1016/j.ijheatmasstransfer.2020.120420. [Google Scholar] [CrossRef]
17. Yin J, Zhang Y, Qi X, Tian L, Gong D, Ma M. Numerical investigation of the cavitation bubble near the solid wall with a gas-entrapping hole based on a fully compressible three-phase model. Ultrason Sonochem. 2023;98(9):106531. doi:10.1016/j.ultsonch.2023.106531. [Google Scholar] [PubMed] [CrossRef]
18. Duy TN, Nguyen VT, Phan TH, Nguyen QT, Park SH, Park WG. Numerical study of bubble dynamics near a solid wall with a gas-entrapping hole. Ocean Eng. 2023;285(3):115344. doi:10.1016/j.oceaneng.2023.115344. [Google Scholar] [CrossRef]
19. Chen Y, Yao X, Cui X, Gou Y. Experimental investigation of bubble dynamics near a double-layer plate with a circular hole. Ocean Eng. 2021;239:109715. doi:10.1016/j.oceaneng.2021.109715. [Google Scholar] [CrossRef]
20. Nguyen QT, Kadivar E, Phan TH, Nguyen VT, el Moctar O, Park WG. Effects of free surface on dynamics of a laser-induced cavitation bubble near horizontal rigid wall. Ocean Eng. 2025;319:120258. doi:10.1016/j.oceaneng.2024.120258. [Google Scholar] [CrossRef]
21. Brennen CE. Fundamentals of multiphase flow. Cambridge, UK: Cambridge University Press; 2009. [Google Scholar]
22. Philipp A, Lauterborn W. Cavitation erosion by single laser-produced bubbles. J Fluid Mech. 1998;361:75–116. doi:10.1017/s0022112098008738. [Google Scholar] [CrossRef]
23. Ohl SW, Klaseboer E, Khoo BC. Bubbles with shock waves and ultrasound: a review. Interface Focus. 2015;5(5):1–15. doi:10.1098/rsfs.2015.0019. [Google Scholar] [PubMed] [CrossRef]
24. Bourne NK. On the collapse of cavities. Shock Waves. 2002;11(6):447–55. doi:10.1007/s001930200128. [Google Scholar] [CrossRef]
25. Chahine GL, Franc JP, Karimi A. Cavitation and cavitation erosion. In: Advanced experimental and numerical techniques for cavitation erosion prediction. Dordrecht, The Netherlands: Springer; 2014. p. 3–20. doi:10.1007/978-94-017-8539-6_1. [Google Scholar] [CrossRef]
26. Nguyen VT, Phan TH, Park WG. Modeling of shock wave produced by collapse of cavitation bubble using a fully conservative multiphase model. Phys Fluids. 2023;35(11):116102. doi:10.1063/5.0167338. [Google Scholar] [CrossRef]
27. Zhao D, Zhang L, Deng F, Li Y, Shao X. A comprehensive study of the impact pressure induced by a single cavitation bubble collapsing near a solid wall. Phys Fluids. 2024;36(7):073327. doi:10.1063/5.0213166. [Google Scholar] [CrossRef]
28. Nguyen VT, Phan TH, Park SH, Duy TN, Nguyen QT, Park WG. Numerical study of shock waves and supersonic jets triggered by cavitation bubble collapse in different pressurized ambiences. J Mech Sci Technol. 2024;38(8):4167–73. doi:10.1007/s12206-024-0714-8. [Google Scholar] [CrossRef]
29. Li S, Zhang AM, Han R, Ma Q. 3D full coupling model for strong interaction between a pulsating bubble and a movable sphere. J Comput Phys. 2019;392:713–31. doi:10.1016/j.jcp.2019.05.001. [Google Scholar] [CrossRef]
30. Hu ZY, Li S, Wang SP, Zhang AM. The role of fluid-structure interaction in pulsating bubble dynamics near a movable structure. Ocean Eng. 2021;238(1):109650. doi:10.1016/j.oceaneng.2021.109650. [Google Scholar] [CrossRef]
31. Andrews ED, Rivas DF, Peters IR. Cavity collapse near slot geometries. J Fluid Mech. 2020;901:A29. doi:10.1017/jfm.2020.552. [Google Scholar] [CrossRef]
32. Trummler T, Bryngelson SH, Schmidmayer K, Schmidt SJ, Colonius T, Adams NA. Near-surface dynamics of a gas bubble collapsing above a crevice. J Fluid Mech. 2020;899:A16. doi:10.1017/jfm.2020.432. [Google Scholar] [CrossRef]
33. Cao S, Wang G, Coutier-Delgosha O, Wang K. Shock-induced bubble collapse near solid materials: effect of acoustic impedance. J Fluid Mech. 2021;907:A17. doi:10.1017/jfm.2020.810. [Google Scholar] [CrossRef]
34. Koch M, Rosselló JM, Lechner C, Lauterborn W, Mettin R. Dynamics of a laser-induced bubble above the flat top of a solid cylinder—mushroom-shaped bubbles and the fast jet. Fluids. 2022;7(1):2. doi:10.3390/fluids7010002. [Google Scholar] [CrossRef]
35. Kadivar E, el Moctar O, Sagar HJ. Experimental study of the influence of mesoscale surface structuring on single bubble dynamics. Ocean Eng. 2022;260:111892. doi:10.1016/j.oceaneng.2022.111892. [Google Scholar] [CrossRef]
36. Lin Y, Kadivar E, el Moctar O, Neugebauer J, Schellin TE. Experimental investigation on the effect of fluid-structure interaction on unsteady cavitating flows around flexible and stiff hydrofoils. Phys Fluids. 2022;34(8):083308. doi:10.1063/5.0099776. [Google Scholar] [CrossRef]
37. Zhang AM, Li SM, Xu RZ, Pei SC, Li S, Liu YL. A theoretical model for compressible bubble dynamics considering phase transition and migration. J Fluid Mech. 2024;999:A58. doi:10.1017/jfm.2024.954. [Google Scholar] [CrossRef]
38. Sun Y, Fan Y, Yao Z, Wang F, Ohl CD. On demand controlling of cavitation bubble collapse and jet formation through a free and rigid boundary arrangement. Ultrason Sonochem. 2025;121(2):107560. doi:10.1016/j.ultsonch.2025.107560. [Google Scholar] [PubMed] [CrossRef]
39. Wang SP, Zhang AM, Liu YL, Zhang S, Cui P. Bubble dynamics and its applications. J Hydrodyn. 2018;30(6):975–91. doi:10.1007/s42241-018-0141-3. [Google Scholar] [CrossRef]
40. Wu Q, Wang Y, Wang G. Experimental investigation of cavitating flow-induced vibration of hydrofoils. Ocean Eng. 2017;144:50–60. doi:10.1016/j.oceaneng.2017.08.005. [Google Scholar] [CrossRef]
41. Kaneko S, Nakamura T, Inada F, Kato M, Ishihara K, Nishihara T, et al. Preface. In: Flow-induced vibrations. Amsterdam, The Netherlands: Elsevier; 2014. p. xi–ii. doi:10.1016/b978-0-08-098347-9.00013-8. [Google Scholar] [CrossRef]
42. Tan KL, Yeo SH. Bubble dynamics and cavitation intensity in milli-scale channels under an ultrasonic horn. Ultrason Sonochem. 2019;58(4):104666. doi:10.1016/j.ultsonch.2019.104666. [Google Scholar] [PubMed] [CrossRef]
43. Kim D, Park JK, Kang IS, Kang KH. Mechanism of bubble detachment from vibrating walls. Phys Fluids. 2013;25(11):112108. doi:10.1063/1.4829895. [Google Scholar] [CrossRef]
44. Sagar HJ, Lin Y, el Moctar O. Dynamics of a single cavitation bubble near an oscillating boundary. Sci Rep. 2024;14(1):22031. doi:10.1038/s41598-024-73540-3. [Google Scholar] [PubMed] [CrossRef]
45. Nguyen QT, Nguyen VT, Phan TH, Duy TN, Park SH, Park WG. Numerical study of dynamics of cavitation bubble collapse near oscillating walls. Phys Fluids. 2023;35(1):013306. doi:10.1063/5.0132049. [Google Scholar] [CrossRef]
46. Nguyen QT, Nguyen VT, Sagar H, el Moctar O, Park WG. Effects of oscillating curved wall on behavior of a collapsing cavitation bubble. Phys Fluids. 2025;37(1):013312. doi:10.1063/5.0245434. [Google Scholar] [CrossRef]
47. Rayleigh LVIII. On the pressure developed in a liquid during the collapse of a spherical cavity. Lond Edinb Dublin Philos Mag J Sci. 1917;34(200):94–8. doi:10.1080/14786440808635681. [Google Scholar] [CrossRef]
48. Nguyen VT, Phan TH, Duy TN, Kim DH, Park WG. Modeling of the bubble collapse with water jets and pressure loads using a geometrical volume of fluid based simulation method. Int J Multiph Flow. 2022;152:104103. doi:10.1016/j.ijmultiphaseflow.2022.104103. [Google Scholar] [CrossRef]
49. Nguyen VT, Nguyen NT, Phan TH, Park WG. Efficient three-equation two-phase model for free surface and water impact flows on a general curvilinear body-fitted grid. Comput Fluids. 2020;196:104324. doi:10.1016/j.compfluid.2019.104324. [Google Scholar] [CrossRef]
50. Koukouvinis P, Gavaises M, Supponen O, Farhat M. Simulation of bubble expansion and collapse in the vicinity of a free surface. Phys Fluids. 2016;28(5):052103. doi:10.1063/1.4949354. [Google Scholar] [CrossRef]
51. Nguyen VT, Phan TH, Duy TN, Kim DH, Park WG. Fully compressible multiphase model for computation of compressible fluid flows with large density ratio and the presence of shock waves. Comput Fluids. 2022;237:105325. doi:10.1016/j.compfluid.2022.105325. [Google Scholar] [CrossRef]
52. Huang Y, Zhang L, Chen J, Zhu X, Liu Z, Yan K. Experimental observation of the luminescence flash at the collapse phase of a bubble produced by pulsed discharge in water. Appl Phys Lett. 2015;107(18):184104. doi:10.1063/1.4935206. [Google Scholar] [CrossRef]
53. Samiei E, Shams M, Ebrahimi R. A novel numerical scheme for the investigation of surface tension effects on growth and collapse stages of cavitation bubbles. Eur J Mech Fluids. 2011;30(1):41–50. doi:10.1016/j.euromechflu.2010.09.002. [Google Scholar] [CrossRef]
54. Obreschkow D, Tinguely M, Dorsaz N, Kobel P, de Bosset A, Farhat M. Universal scaling law for jets of collapsing bubbles. Phys Rev Lett. 2011;107(20):204501. doi:10.1103/physrevlett.107.204501. [Google Scholar] [PubMed] [CrossRef]
55. Phan TH, Nguyen VT, Duy TN, Kim DH, Park WG. Influence of phase-change on the collapse and rebound stages of a single spark-generated cavitation bubble. Int J Heat Mass Transf. 2022;184:122270. doi:10.1016/j.ijheatmasstransfer.2021.122270. [Google Scholar] [CrossRef]
56. Park SH, Phan TH, Nguyen VT, Duy TN, Nguyen QT, Park WG. Numerical simulation of wall shear stress and boundary layer flow from jetting cavitation bubble on unheated and heated surfaces. Int J Heat Mass Transf. 2024;222:125189. doi:10.1016/j.ijheatmasstransfer.2024.125189. [Google Scholar] [CrossRef]
57. Liu S, Nitto K, Supponen O, Kamata S, Nakajima T, Farhat M, et al. Plasma-based identification of gases in a laser-induced cavitation bubble. Appl Phys Lett. 2023;123(9):094102. doi:10.1063/5.0164732. [Google Scholar] [CrossRef]
58. Zhong X, Eshraghi J, Vlachos P, Dabiri S, Ardekani AM. A model for a laser-induced cavitation bubble. Int J Multiph Flow. 2020;132:103433. doi:10.1016/j.ijmultiphaseflow.2020.103433. [Google Scholar] [CrossRef]
59. Reuter F, Zeng Q, Ohl CD. The Rayleigh prolongation factor at small bubble to wall stand-off distances. J Fluid Mech. 2022;944:A11. doi:10.1017/jfm.2022.475. [Google Scholar] [CrossRef]
60. Yu Q, Ma X, Xu Z, Zhao J, Wang D, Huang Z. Thermodynamic effect of single bubble near a rigid wall. Ultrason Sonochem. 2021;71:105396. doi:10.1016/j.ultsonch.2020.105396. [Google Scholar] [PubMed] [CrossRef]
61. Dong Y, Han W, Li R, Nan H, Shen X, Yang S, et al. Dynamics of a two-phase bubble near a kinematic elastic-plastic boundary. Int J Mech Sci. 2025;287:109978. doi:10.1016/j.ijmecsci.2025.109978. [Google Scholar] [CrossRef]
62. Goh BHT, Gong SW, Ohl SW, Khoo BC. Spark-generated bubble near an elastic sphere. Int J Multiph Flow. 2017;90:156–66. doi:10.1016/j.ijmultiphaseflow.2016.03.021. [Google Scholar] [CrossRef]
Cite This Article
 Copyright © 2025 The Author(s). Published by Tech Science Press.
This work is licensed under a Creative Commons Attribution 4.0 International License , which permits unrestricted use, distribution, and reproduction in any medium, provided the original work is properly cited.
 Downloads
 Citation Tools