
 Submit a Paper
 Propose a Special lssue
 Open Access
ARTICLE
HTM: A Hybrid Triangular Modeling Framework for Soft Tissue Feature Tracking
1 School of Artificial Intelligence, Guangzhou Huashang College, Guangzhou, 511300, China
2 Research Institute of AI Convergence, Hanyang University ERICA, Ansan-Si, 15577, Republic of Korea
3 Department of Computer Science and Engineering, Hanyang University, Ansan-Si, 15577, Republic of Korea
4 School of Automation, University of Electronic Science and Technology of China, Chengdu, 610054, China
* Corresponding Authors: Jiawei Tian. Email: ; Bo Yang. Email:
(This article belongs to the Special Issue: Emerging Artificial Intelligence Technologies and Applications-II)
Computer Modeling in Engineering & Sciences 2025, 145(3), 3949-3968. https://doi.org/10.32604/cmes.2025.071869
Received 13 August 2025; Accepted 22 October 2025; Issue published 23 December 2025
 View Full Text
 Download PDF
Abstract
In endoscopic surgery, the limited field of view and the nonlinear deformation of organs caused by patient movement and respiration significantly complicate the modeling and accurate tracking of soft tissue surfaces from endoscopic image sequences. To address these challenges, we propose a novel Hybrid Triangular Matching (HTM) modeling framework for soft tissue feature tracking. Specifically, HTM constructs a geometric model of the detected blobs on the soft tissue surface by applying the Watershed algorithm for blob detection and integrating the Delaunay triangulation with a newly designed triangle search segmentation algorithm. By leveraging barycentric coordinate theory, HTM rapidly and accurately establishes inter-frame correspondences within the triangulated model, enabling stable feature tracking without explicit markers or extensive training data. Experimental results on endoscopic sequences demonstrate that this model-based tracking approach achieves lower computational complexity, maintains robustness against tissue deformation, and provides a scalable geometric modeling method for real-time soft tissue tracking in surgical computer vision.Keywords
Artificial intelligence (AI) has significantly reshaped the field of medical imaging and pathology by enabling data-driven analysis and real-time surgical assistance [1–4]. In the domain of minimally invasive surgery (MIS), the application of AI technologies has improved the accuracy, flexibility, and safety of robotic procedures [5]. A critical component of these systems is the ability to accurately track soft tissue surfaces during surgery. Such tracking enables robotic arms to adapt to tissue deformation, supports intraoperative navigation, and facilitates applications such as 3D reconstruction [6], surgical simulation [7], and outcome evaluation [8].
However, tracking soft tissue is a challenging task due to its intrinsic elasticity, nonlinear deformation, and motion caused by respiration or heartbeat. These factors make consistent surface localization and 3D reconstruction particularly difficult. Early approaches sought to capture tissue motion through external hardware. For example, Hoff et al. [9] utilized triaxial accelerometers stitched onto the pig heart surface to record cardiac motion, and Nakamura et al. [10] introduced heartbeat-synchronized robotics to improve surgical precision. Although effective in measuring motion, these hardware-based techniques are invasive and incompatible with standard MIS workflows.
Image-based methods, in contrast, offer a non-invasive alternative by extracting motion cues directly from video. Lau et al. [11] proposed a stereo-based tracking system using endoscopic imagery to reconstruct heart surface deformation. Stoyanov et al. [12] further developed a dense 3D recovery framework that integrated illumination compensation with constrained parallax registration, demonstrating robust performance on both synthetic and real tissue models. Despite their advantages, such techniques often require dense stereo correspondence and sophisticated image registration, making them computationally intensive and sensitive to imaging conditions.
To alleviate computational complexity, feature-based soft tissue tracking approaches have gained traction. These rely on identifying and tracking salient visual features across frames. Traditional handcrafted methods such as Scale-Invariant Feature Transform (SIFT), Speed Up Robust Features (SURF), and Oriented Fast and Rotated Brief (ORB) [13,14] are widely used, yet they struggle in noisy or texture-deficient surgical scenes. More recently, deep learning-based models have enabled end-to-end learning of feature representations and matching functions. Notably, the Learned Invariant Feature Transform (LIFT) architecture proposed by Yi et al. [15] combines detection, orientation estimation, and descriptor learning in a unified pipeline. Similar works such as MatchNet [16] and Siamese networks [17] achieve strong performance by learning pairwise similarity. However, these methods require large-scale annotated datasets and significant computational resources, which may not be available in surgical environments.
Compared to corner features, blob-like regions offer greater spatial continuity and robustness to local deformation, making them attractive for soft tissue tracking. Blobs represent distinct areas of grayscale or color variation and can provide stable landmarks even when the tissue undergoes shape change. Therefore, they are well-suited for modeling soft anatomical surfaces. Fig. 1 outlines the typical process of soft tissue feature detection and tracking from endoscopic image sequences.
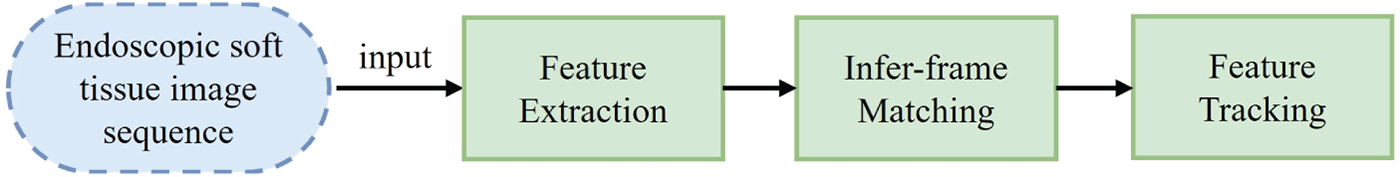
Figure 1: Soft tissue surface feature tracking process
The process begins with feature detection, where blob-like structures are extracted as salient regions from endoscopic images. These features are then used to construct a geometric representation of the tissue surface through triangulation. In the subsequent feature matching and tracking stages, geometric correspondences between frames are established and updated, enabling the system to monitor tissue motion over time. Each module in the pipeline reflects a step in this structured, interpretable approach to real-time tissue tracking.
In this paper, we propose a novel Hybrid Triangular Matching (HTM) approach that leverages blob-based features and triangulated geometry to achieve robust and real-time soft tissue tracking in endoscopic surgery. This method addresses key limitations in conventional trackers, which often rely on texture-dependent features, supervised training, or dense stereo correspondence, and are thus vulnerable to tissue deformation and illumination variability. HTM begins by applying the Watershed algorithm to detect blob-like features that offer stronger spatial continuity and robustness to deformation than traditional corners. These blobs are then organized into a geometric mesh using Delaunay triangulation, ensuring spatial regularity and optimal connectivity based on the empty circumcircle property of triangle construction [18,19]. To handle non-rigid deformation between image frames, a triangle search segmentation algorithm is developed to reconstruct inter-frame triangular correspondences based on angle and length constraints. Furthermore, the use of barycentric coordinate theory enables each pixel within a triangle to be represented as a linear combination of its vertices, allowing for stable and efficient inter-frame correspondence under deformation without requiring texture descriptors, fiducial markers, or annotated training data [20,21].
By integrating geometric modeling with feature tracking, HTM offers several important advantages. It reduces computational complexity through localized mesh-based matching, enhances robustness to soft tissue deformation via blob-level modeling, and operates in real time without the need for pretraining or prior knowledge. Compared to conventional pipelines, HTM is both lightweight and interpretable, making it well-suited for integration into surgical computer vision systems where accuracy, speed, and reproducibility are critical. Experimental results on publicly available endoscopic heart sequences validate the approach, demonstrating high inter-frame tracking accuracy, low computational cost (under 2.5 ms per frame), and strong resilience against tissue deformation. By bridging the gap between appearance-independent modeling and geometric correspondence, HTM provides a scalable and general-purpose framework for soft tissue tracking under challenging surgical conditions.
The experimental evaluation in this paper is conducted using publicly available endoscopic video sequences provided by the Hamlyn Centre Laparoscopic/Endoscopic Video Dataset, hosted by Imperial College London. This dataset comprises a wide range of high-resolution laparoscopic and endoscopic recordings captured under realistic surgical conditions. It is widely used in research on tissue tracking, depth estimation, and surgical scene understanding.
In this study, we utilize an endoscopic heart image sequence extracted from the dataset to simulate the dynamic deformation of soft tissues caused by physiological motion such as heartbeat and respiration. The selected sequence consists of RGB frames with a spatial resolution of 288 × 360 pixels. Although the original data is in color, grayscale conversion is applied prior to blob detection and matching operations to enhance robustness in intensity-based segmentation and reduce computational load.
A total of at least 170 frames are used in the experiments. The first frame is designated as the marker frame, from which blob features are extracted using the Watershed algorithm and triangulated using Delaunay triangulation. Subsequent frames are processed with the proposed triangle search segmentation and barycentric coordinate-based blob matching method, as described in Section 3.
Fig. 2 illustrates four sample frames (
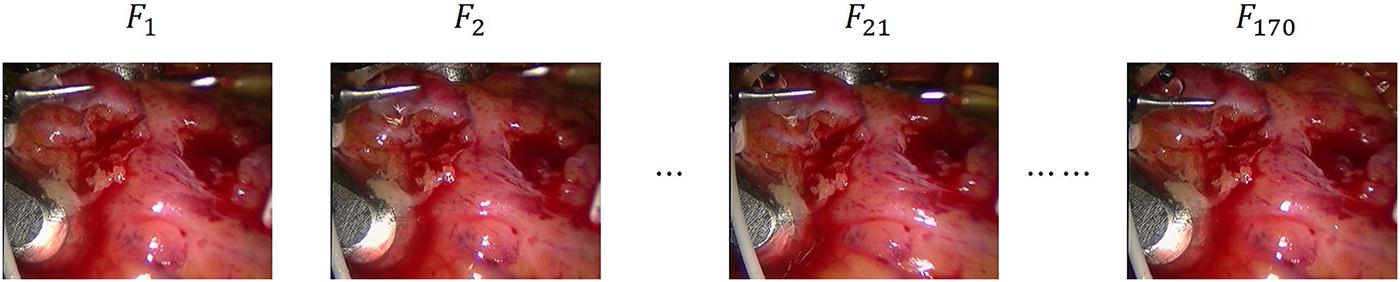
Figure 2: Sample frames from the endoscopic video sequence used in our experiments
The dataset is openly accessible and can be downloaded from the Hamlyn Centre Vision website at: https://hamlyn.doc.ic.ac.uk/vision/ (accessed on 01 June 2025).
In this section, we propose a novel HTM that achieves fast and accurate feature tracking and matching the soft tissues, as shown in Fig. 3.
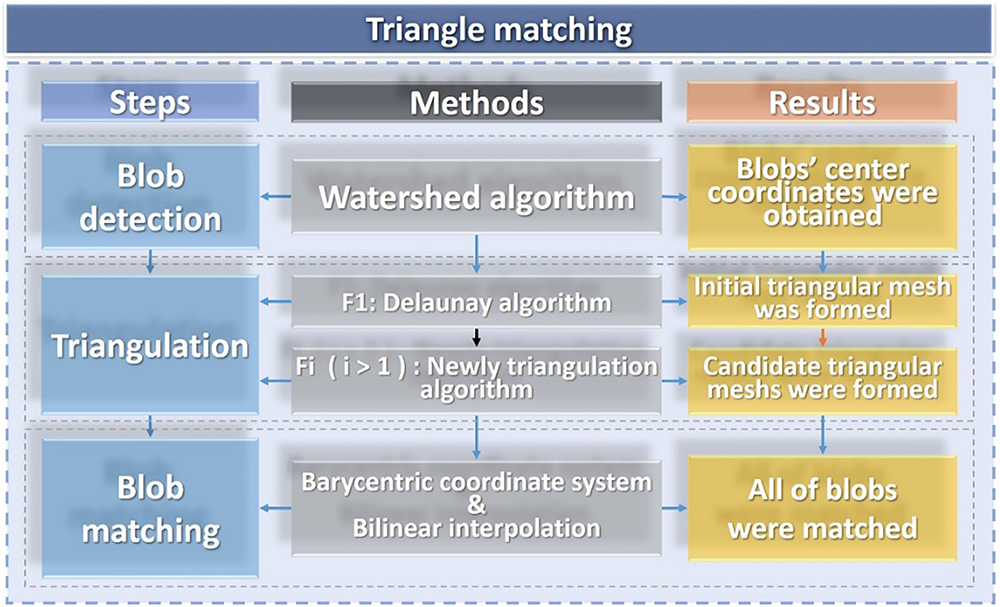
Figure 3: Flow chart of our triangle matching algorithm
Specifically, we first applied the Watershed algorithm to achieve the blob detection on two-dimensional grayscale images. After the blob detection, the blob’s location coordinates, and the grayscale value of each pixel are extracted. Despite the challenges posed by the nonlinear deformation of soft tissue surfaces, the grayscale values of pixels within a consistent area of soft tissue remain unchanged. Utilizing the barycentric coordinate system, each pixel within a triangular region can be represented using barycentric coordinates. This representation allows for the calculation of pixel coordinates in subsequent frames based on the center coordinates of detected blobs—essentially, the vertices of the triangle. Therefore, we propose a new triangulation algorithm to find candidates for triangular meshes. Furthermore, given that the calculated pixel coordinates may be non-integer values, bilinear interpolation is employed to derive integer pixel coordinates to achieve blob matching. This facilitates the comparison of pixels within corresponding triangles across adjacent. The errors derived from this comparison are used to identify and select candidate triangles in the subsequent frame.
In HTM, only the first frame of soft tissue is needed as the marker frame to realize accurate and fast tracking of the target area, which greatly addresses the limitations of existing feature tracking methods.
For feature detection, blob features are more readily extracted from the surfaces of human soft tissues. In recent advances, blob-level feature segmentation has become critical for improving both explainability and robustness in medical image analysis. For example, Nambisan et al. [22] proposed an approach to segment dermoscopic structures like dots and globules using both pixel- and blob-based metrics, highlighting how blob-based metrics can better account for the perceptual uncertainty in object boundaries. Their study demonstrated that blob-level agreement metrics outperformed traditional pixel-wise evaluation, especially in tasks where structural precision is paramount.
The following steps implement the Watershed algorithm process of extracting local extrema from images:
Step 1: Grayscale Image Conversion: The grayscale image is transformed into a series of binary images through a series of thresholds t with the same interval. The threshold range is greater than or equal to T1 and less than or equal to T2.
Step 2: Contour Identification: For each binary image, the contour tracking algorithm proposed by Suzuki is used to find the boundary of the binary image set, and the center of each contour is calculated [23].
Step 3: Blob Identification: Based on the classification of the central coordinates of all blobs in a binary image, spatially contiguous pixels with similar grayscale values are aggregated into distinct regions. Within the binary image, blobs whose center coordinates are within a predefined distance threshold, denoted as Tb, are considered part of the same grayscale image blob. These blobs, which are within the specified distance range, are identified as feature centroids and are grouped together, corresponding to the same blob feature.
Step 4: Blob Positioning and Sizing: The precise location and radius of the identified blobs are determined by calculating the weighted average of the centroid coordinates of all contributing binary image blobs within the grayscale image.
Step 5: Feature Point Filtering: The identified feature points (blobs) are then subjected to various filtering criteria, such as area and roundness, to refine the selection of significant features.
During the blob detection process, we need to adjust its parameters to obtain ideal blobs that meet our requirements. The blob roundness is shown as Eq. (1):
where
Therefore, the inertia rate of the circle is equal to 1. The closer the inertia rate is to 1, the higher the circle’s degree. In a plane, a convex graph means that all parts of a graph are inside the area surrounded by the tangent. Convexity is used to express the degree of the bump of blobs, convexity
where
The threshold for binarization is set at 0 (T1) and 255 (T2). From the analysis of endoscopic soft tissue images, it can be observed that our goal is to identify spots with lower grayscale values, hence the grayscale threshold for spots is set to 0. To adapt to the deformation of the soft tissue surface, we set smaller values for the convexity, inertia ratio, and roundness of the spots, respectively set to 0.4, 0.1, and 0.4, to ensure the accurate extraction of spots.
It can be seen from Fig. 4 that in the two adjacent frames, for the sake of the subsequent calculation of matching and the complexity of the triangle search segmentation, the parameters of the first frame
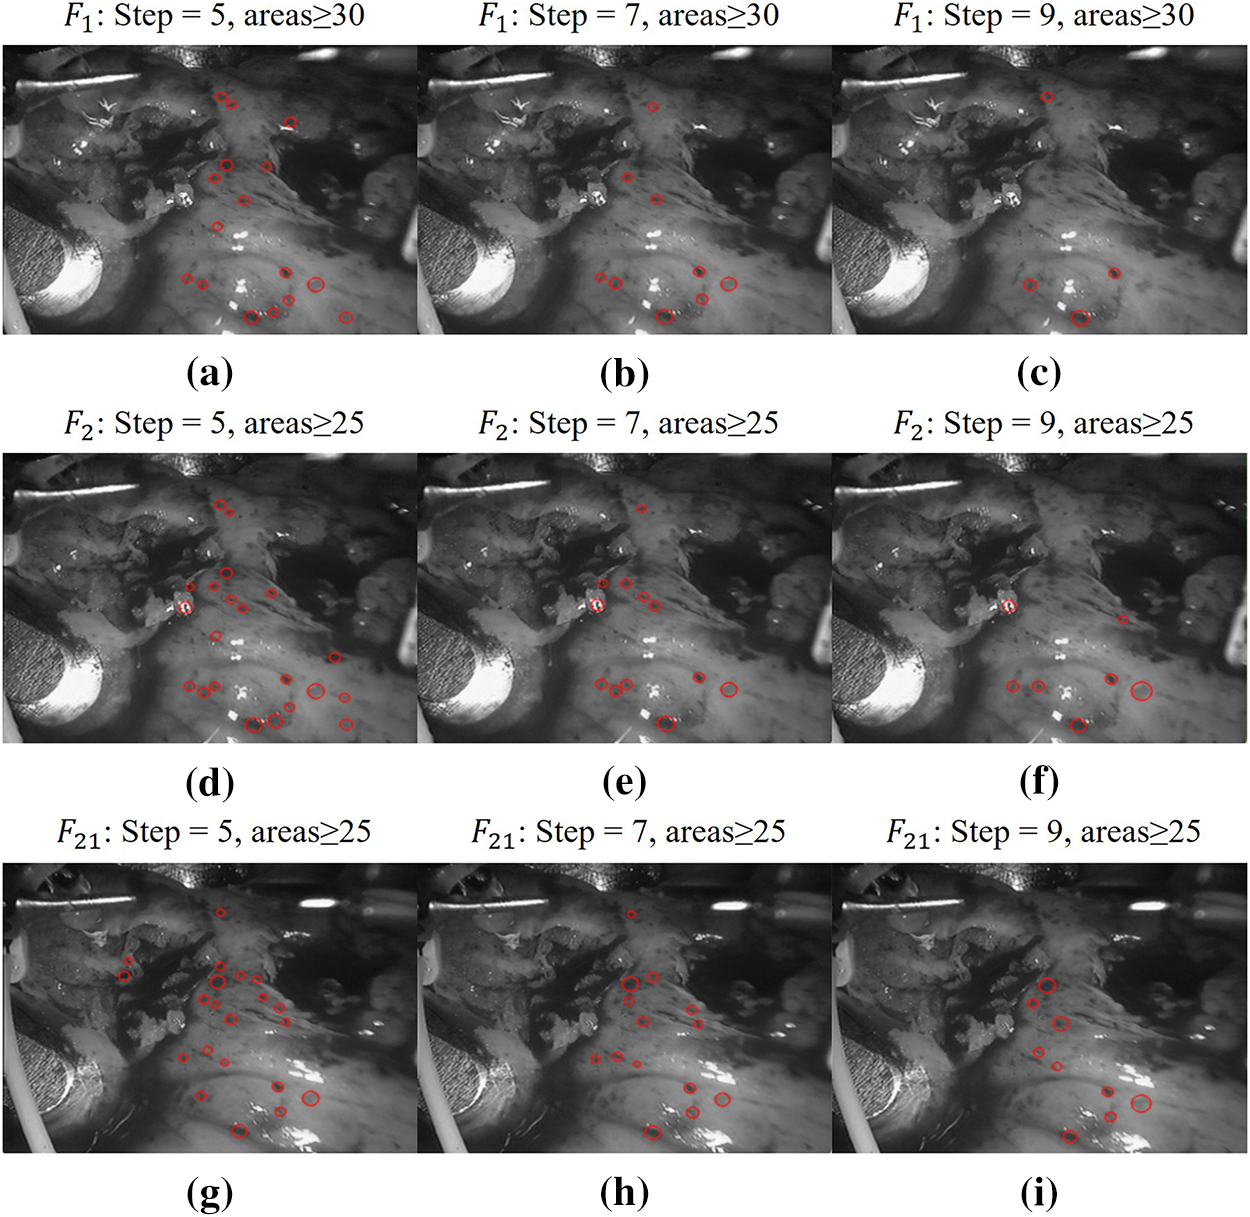
Figure 4: Schemes follow the same formatting. Limit determination of blob parameter step size and minimum area. (a)
After blob detection, we extract the center coordinates
Formally, let
Delaunay triangulation is a special type of triangulation that satisfies the empty circle property, meaning that for any triangle in the triangulation, there exists a circumcircle that passes through its vertices and contains no other point from
This approach yields several desirable geometric properties. The resulting triangulation is unique for a given point set and connects the closest three points to form non-overlapping triangles. It also tends to maximize the minimum angles in the mesh, avoiding narrow triangles and ensuring numerical stability. In addition, exchanging the diagonals of two adjacent triangles forming a convex quadrilateral does not increase the smallest internal angle, which supports its optimality. The local nature of the structure ensures that adding, deleting, or moving a vertex only affects nearby triangles, and the boundary of the triangulation naturally forms the convex hull of the point set.
With the detection parameters defined, we use the Delaunay triangulation algorithm [24] to generate the initial mesh on the first frame, as shown in Fig. 5. This serves as the reference partition for the subsequent matching procedure.
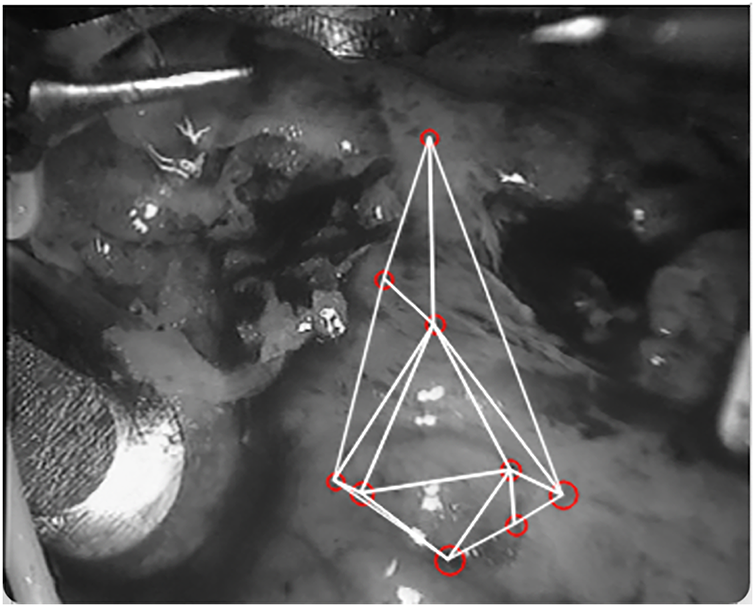
Figure 5: A schematic diagram of the triangulation of the first frame
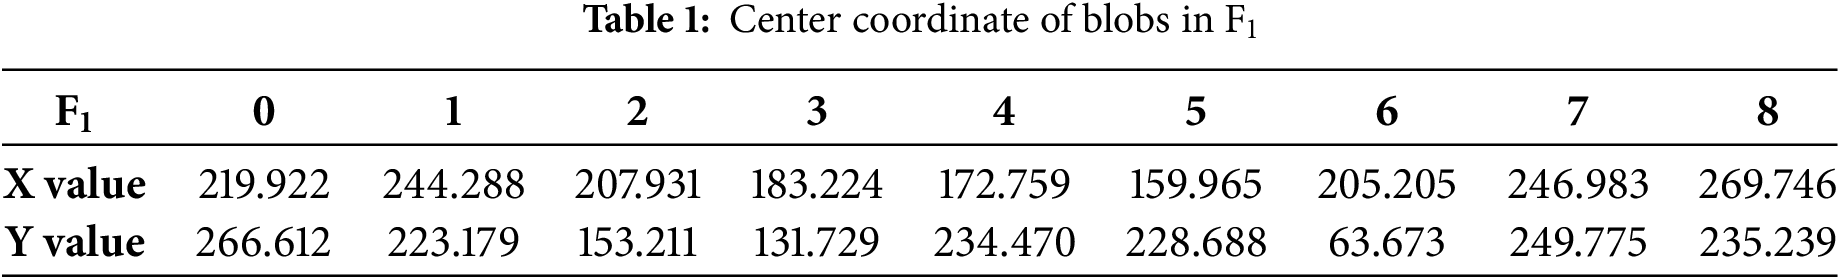
In the first frame, 9 blobs are detected when the threshold step size is 7, the minimum area of blobs is 30, convexity is 0.4, the inertia rate is 0.1, and roundness is 0.4, the specific coordinates are shown in Table 1.
The more blobs detected in the first frame, the more it is necessary to adjust the parameters to detect more blobs in subsequent frames to compensate for the deformation of the soft tissue surface. As the number of detected blobs increases, the number of vanishing and emerging points also increases, which in turn increases the complexity of triangulation in subsequent frames and the number of errors in calculating the triangular regions between frames. This also leads to an increase in the time complexity of the algorithm, resulting in excessively long matching times between frames and reducing the efficiency of inter-frame matching. Considering that the step size for subsequent frames is set to 3 and the minimum area for blobs is 25, new blobs will be detected in subsequent frames. Therefore, the detection of 9 blobs in the first frame is logical and meets the requirements. The center coordinates of the blobs in
If the subsequent frames continue to use the Delaunay algorithm to divide the triangular mesh, due to the disappearance of the blobs, the triangle obtained by the Delaunay algorithm to divide the subsequent frame
We select the center coordinates of any blob in
Therefore, we get Rule 1: If none of the three vertices match, in
In subsequent frames, all initial point searches are performed with the known point in the first frame as the search origin, which is also the starting point of a triangular grid. Even if the triangle mesh is broken, the starting point is always the starting point of a triangle. As long as a blob in the first frame does not match and the search for subsequent frames is not completed, there is a case of re-determining the initial point. You need to repeatedly use rule one to determine the initial point of the triangle mesh.
Fig. 6 shows a schematic diagram of Rule 1.
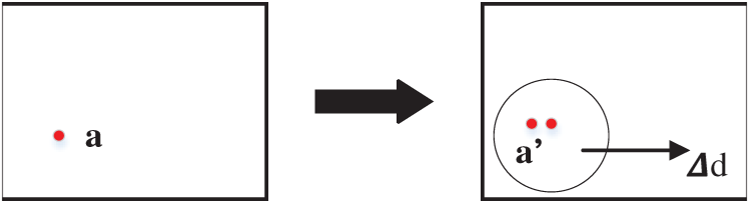
Figure 6: Schematic diagram of determining the initial point
After searching for the initial point, we need to find the next point of the triangle. We start from one vertex of the triangle and look for the other two vertices. We use the angle θ and length L constraints of the triangle to be matched in
where
Thus, Rule 2: If a vertex has been matched, without losing generality. Assuming a′ has been matched with a, we search for all feature point pairs
Fig. 7 shows the schematic diagram of Rule 2.
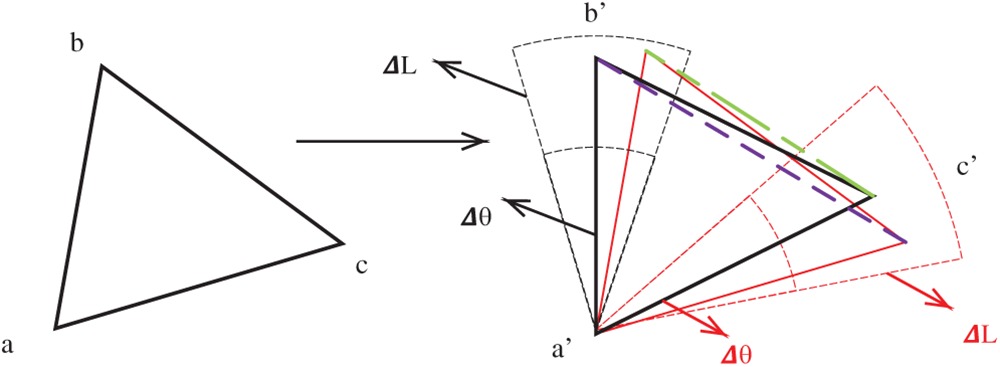
Figure 7: Schematic diagram of finding the second and third vertices at the initial point
To search for the third vertex, there are two cases. The first case is that only two points are found in the composition triangle before finding the third point. The second is that a triangle has been found and determined before finding the third point. Furthermore, add a constraint as Eq. (8).
where
Thus, Rule 3: If two vertices have been matched without losing generality, let
Figs. 8 and 9 show the two cases.
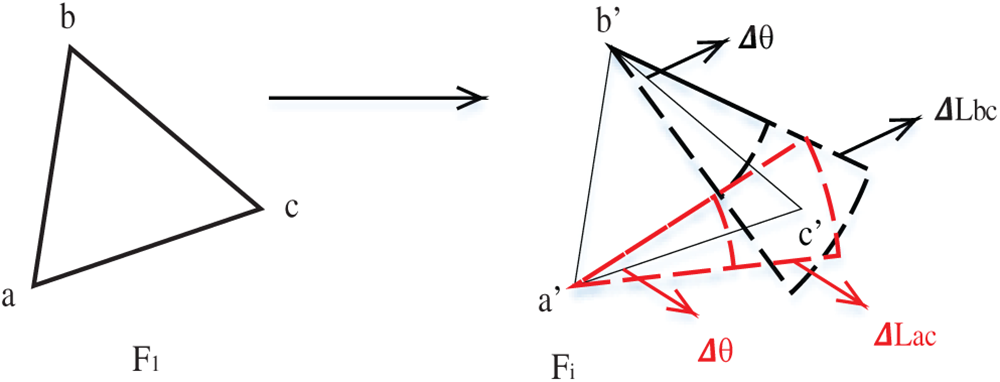
Figure 8: Schematic diagram of case 1 starting from two points to find the third point
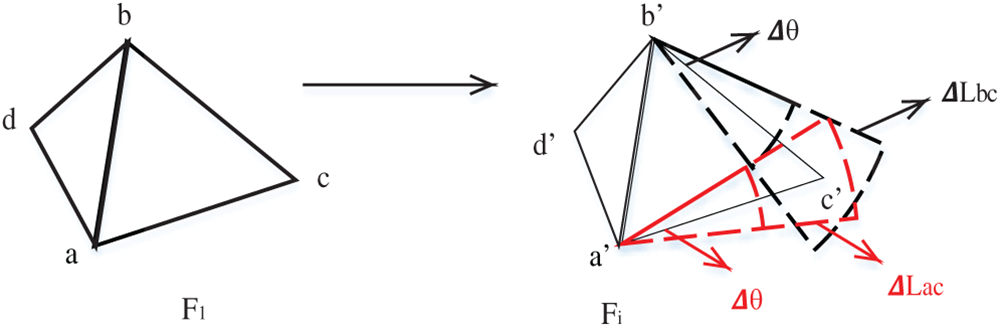
Figure 9: Schematic diagram of case 2 starting from two points to find the third point
In Rule 2, the three conditions determine two points, as shown in Fig. 6. In this step, Eqs. (5) and (7) determine the corresponding point b′ of point b, and Eqs. (6) and (7) determine the corresponding point
In Rule 3, as shown in Figs. 8 and 9, in the process of constructing triangular mesh, case 1 is often that the first triangle of triangular mesh is not formed. However, two corresponding points have been found in subsequent frames, and the process of finding the third vertex corresponds to case 1. In case 2, when the triangular mesh grows downward, there are already triangles. Therefore, only one side of the triangle and the two vertices associated with its edges must find the third vertex. The third vertex is found in Eqs. (5)–(8). Given the additional constraints in this step compared to Rule 1, fewer blobs are typically involved, reducing the number of times the matching criteria must be applied and thus shortening the duration of this step.
In finding the vertices of the triangle, the initial point is replaced if any point is not found. Rule 1 is returned to find the vertices (blobs) of the triangle again, as shown in Fig. 10. After the above process of searching for candidate triangles, the candidate triangles corresponding to
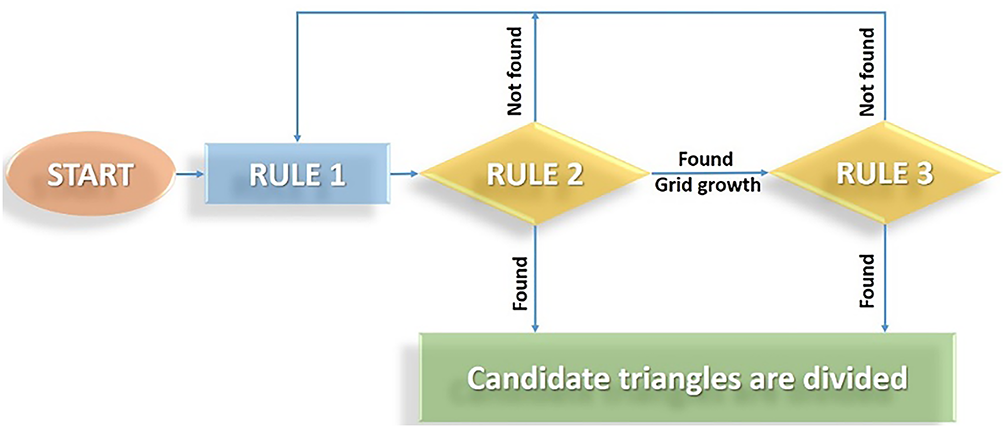
Figure 10: Flow chart of searching candidate triangles
Feature detection and matching serve as the cornerstone of image correspondence in computer vision. According to Ma et al. [26], the classical image matching pipeline is typically composed of three main stages: feature detection, feature description, and feature matching, where blob-like structures provide stable and repeatable keypoints due to their invariance to scale and rotation. This structured pipeline ensures the robustness and interpretability of correspondence across frames, especially under local deformation and texture ambiguity. In the context of soft tissue tracking, one of the primary challenges lies in the nonlinear deformation occurring on the tissue surface. Despite such geometric distortion, the intensity value of each pixel in a local neighborhood remains relatively stable, which allows the application of center-of-gravity coordinate systems for tracking.
Based on this observation, the center-of-gravity coordinate system is integrated into the HTM framework to facilitate correspondence between matched blobs. Furthermore, a barycentric coordinate system is employed to define a triangular region matching criterion, enabling reliable pixel-wise mapping within triangle pairs across frames. This coordinate system preserves spatial relationships under affine transformations and supports interpolation within triangular domains. The overall matching process is illustrated in Fig. 11, which outlines the geometric flow from blob detection to inter-frame triangle correspondence.
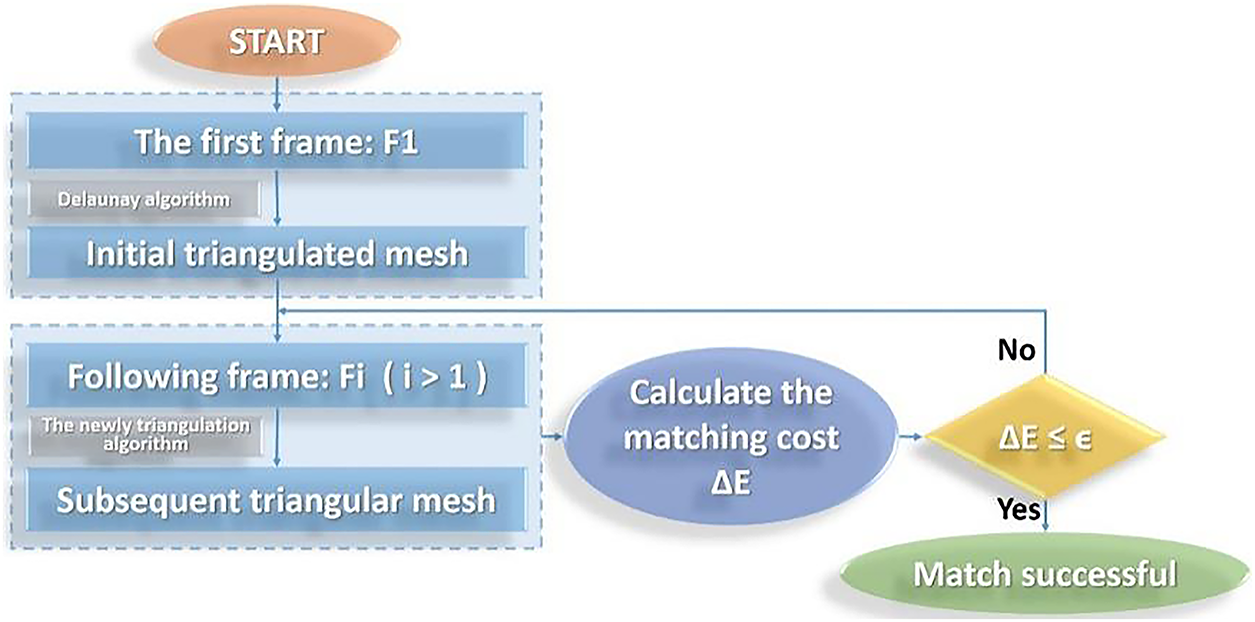
Figure 11: Flow chart of inter-frame matching
Given the three-point coordinates A, B, and C of a triangle, a point (x, y) in the plane can be written as a linear combination of these three-point coordinates, i.e.,
Based above, we calculate the center of gravity coordinates of each pixel in triangle ABC of
Then, the corresponding points
Through bilinear interpolation [27], we can find each pixel value of the point. Compared with the corresponding pixel value of the point
It can be calculated that the root mean square error [28] of grayscale pixel value in two triangles is shown in Eq. (11):
where
Select valid candidate triangles whose matching cost satisfies
Then select the next unmatched triangle in the
We perform experiments using a sequence of endoscopic heart images to evaluate the HTM method. The images have dimensions of 288 by 360 pixels, with 3 color channels, and the experimental tools are Python 3.7, the OpenCV library, and a graphics card 1080ti. Since the experiments are conducted based on the first frame for blob detection and only the first frame is treated as the marker frame, the process of detecting blobs in the first frame is detailed below. Given the threshold step size is 7, the minimum blob area is 30, the inertia degree is 0.4, the step size used for subsequent frames is 3, and the minimum blob area is 25. The nine blobs are detected in the first frame align with the logical requirement.
The Delaunay algorithm divides the nine points into 10 triangles, each composed of three vertices consisting of three vertices of the triangle, and we can know the edge length of each triangle and the vertex angle. Similarly, we can obtain which vertex of each triangle is extracted by the Delaunay algorithm.
First, we obtain an accurate triangle network of the first frame
As shown in Fig. 12, we found the initial point by applying Rule 1 in
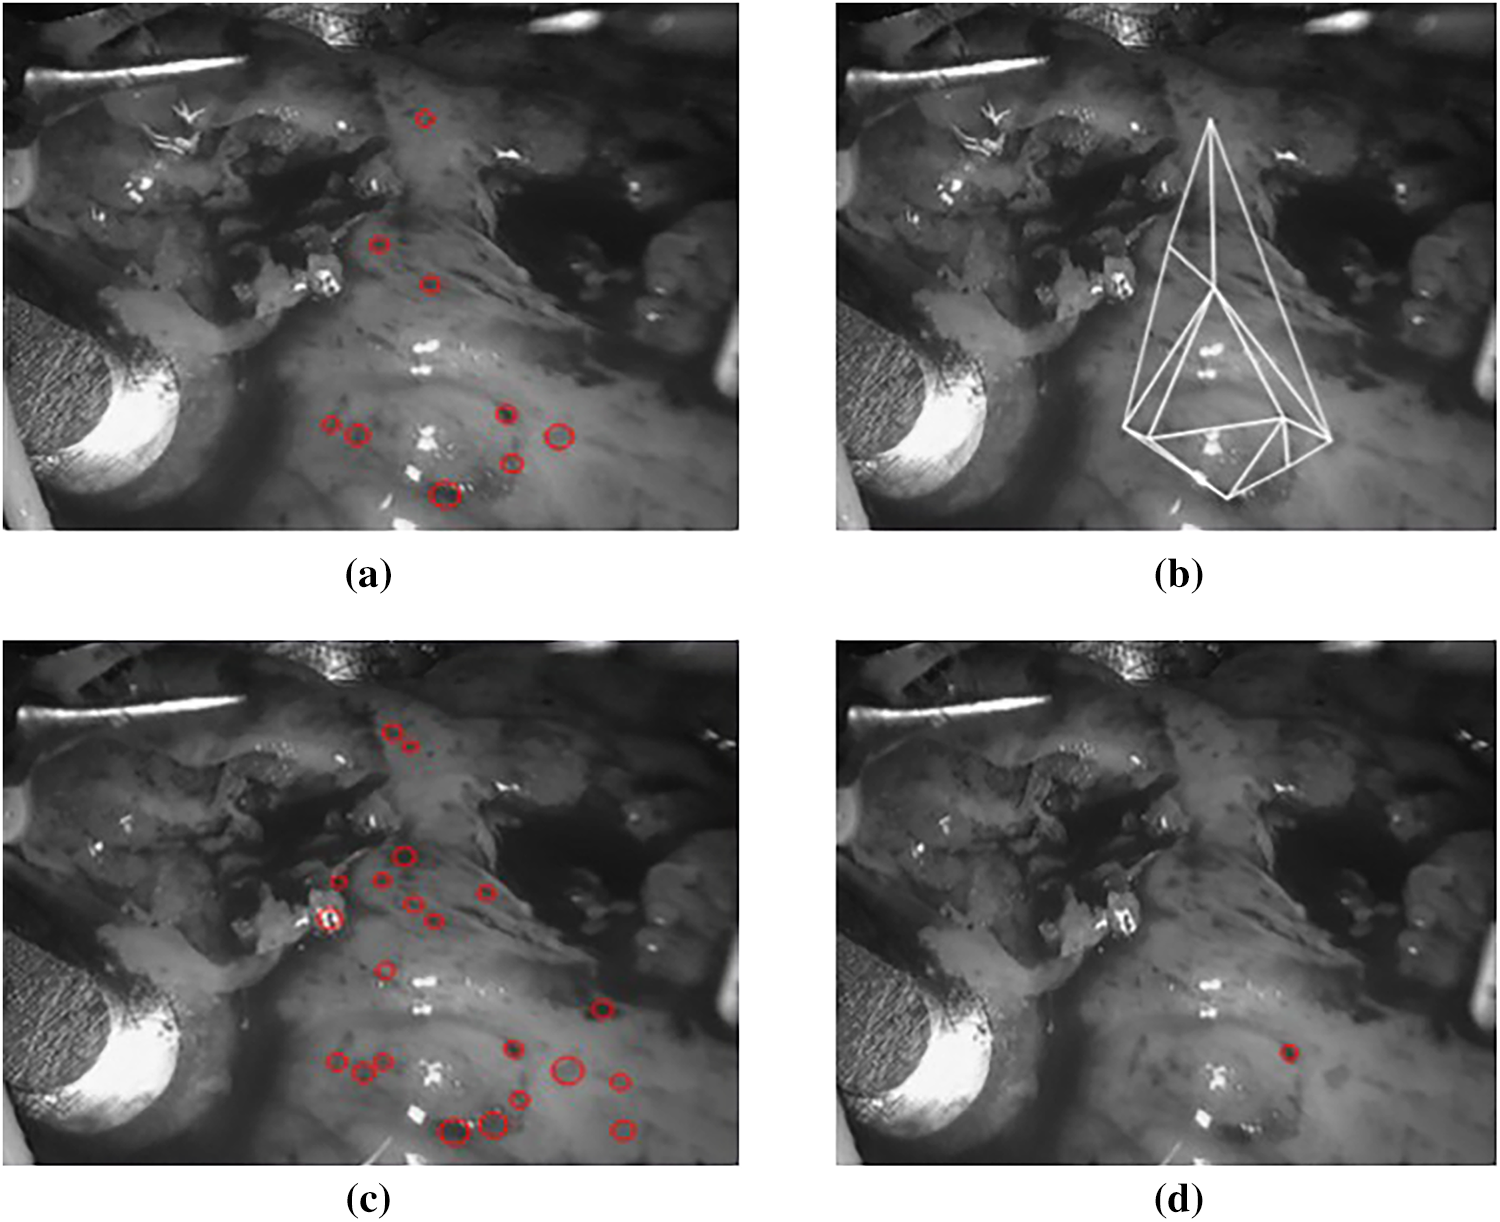
Figure 12: (a) The blobs detected by
With

As shown in Fig. 13, HTM can maintain the consistency of the triangular mesh between frames. This characteristic provides the primary conditions for calculating the matching error between the triangular regions between frames. First, it completes the triangular matching. Then, the blobs between frames complete the matching.
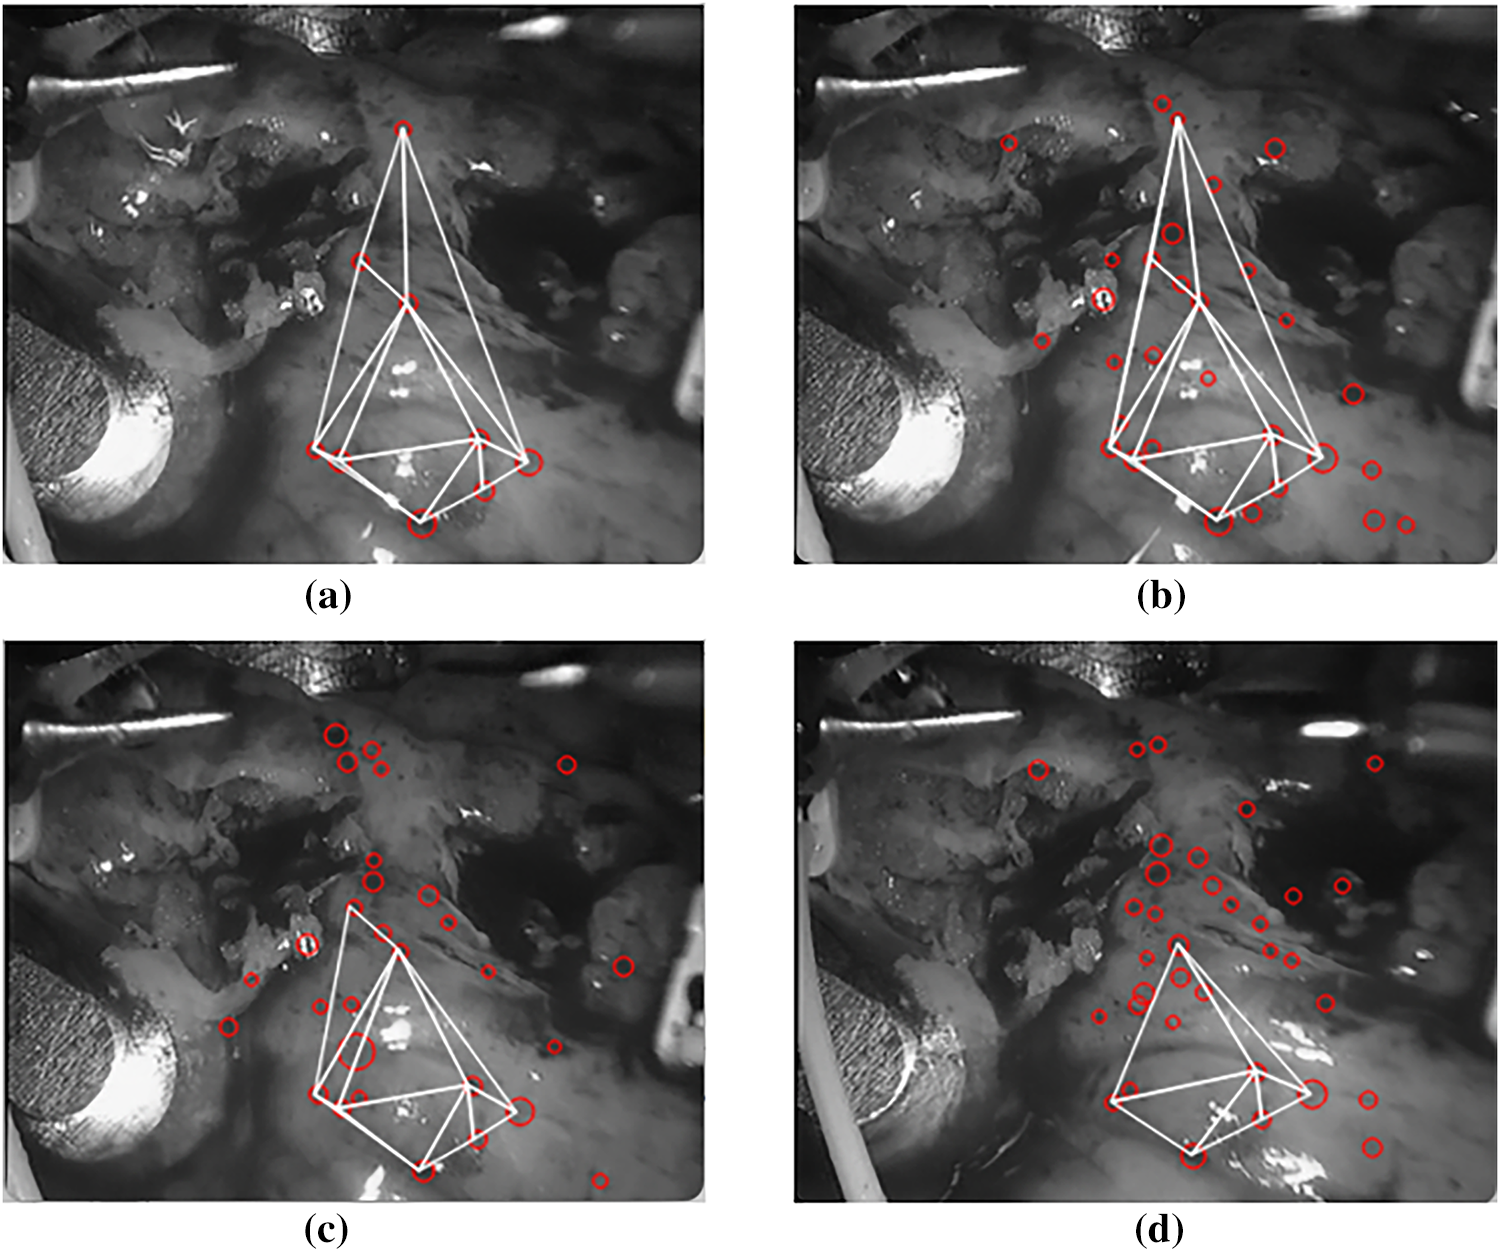
Figure 13: Triangular matching results of subsequent frames. (a)
To balance the contradiction between the comprehensiveness of soft tissue surface tracking and time efficiency, we chose the tracking of 9 blobs in the first frame. Next, the real-time performance of time is tested.
Firstly, each matching error in the triangular region is calculated in time. Then, after experiments, the time-consuming process of calculating the matching times of triangular regions is shown in Table 3. Moreover, the time-consuming statistics of inter-frame matching are shown in Table 4.
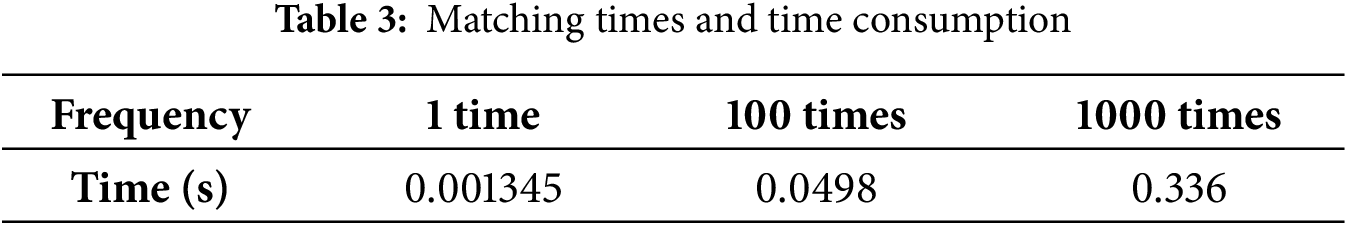
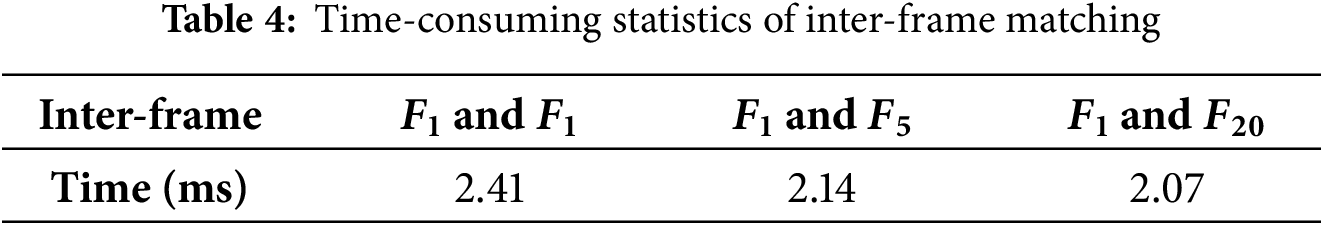
Fig. 13 shows the triangular matching result map of detected blobs obtained by HTM of
To observe the rapidity of matching more intuitively, the time-consuming diagram of calculating matching errors in the triangular region is drawn.
In Fig. 14, the horizontal axis is the number of times to calculate the matching error of two triangles. The vertical axis is the calculation time, varying with the number of times in seconds (s).
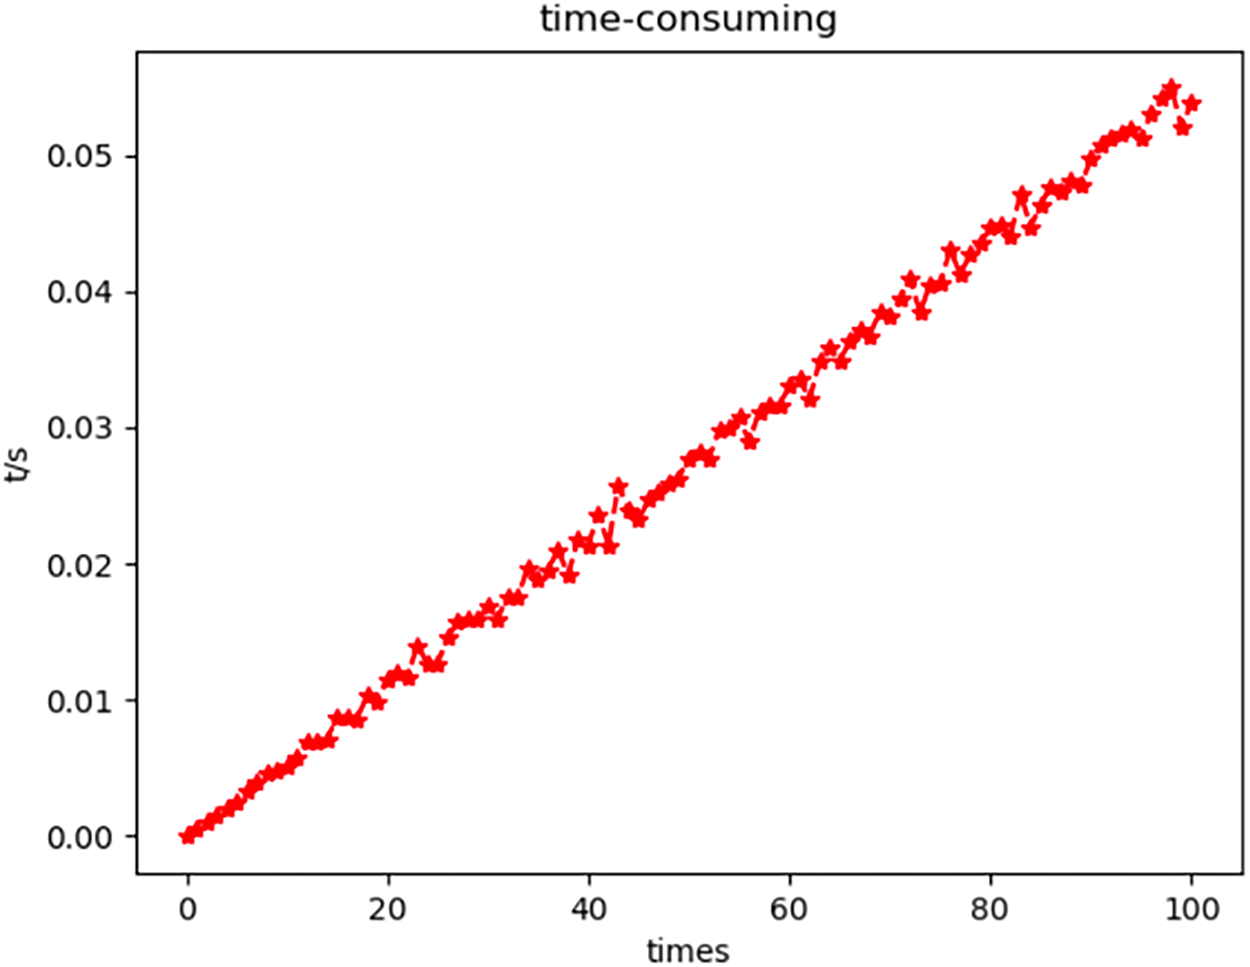
Figure 14: Time-consuming diagram of matching error calculation in the triangular region
Given the rapid matching within triangular regions, additional experiments assessing the frame-to-frame matching speed are necessary, considering the variations in triangular meshes between frames. Furthermore, the effectiveness of HTM can be seen through time-consuming inter-frame matching because, even if the matching between triangular regions is successful and fast, the inter-frame triangular matching algorithm is not as feasible as the theory. Therefore, time-consuming inter-frame matching will appear.
To more intuitively observe the time-consuming triangular matching between frames, the time-consuming curve of inter-frame matching with the increase in the number of frames is drawn, as shown in Fig. 15.
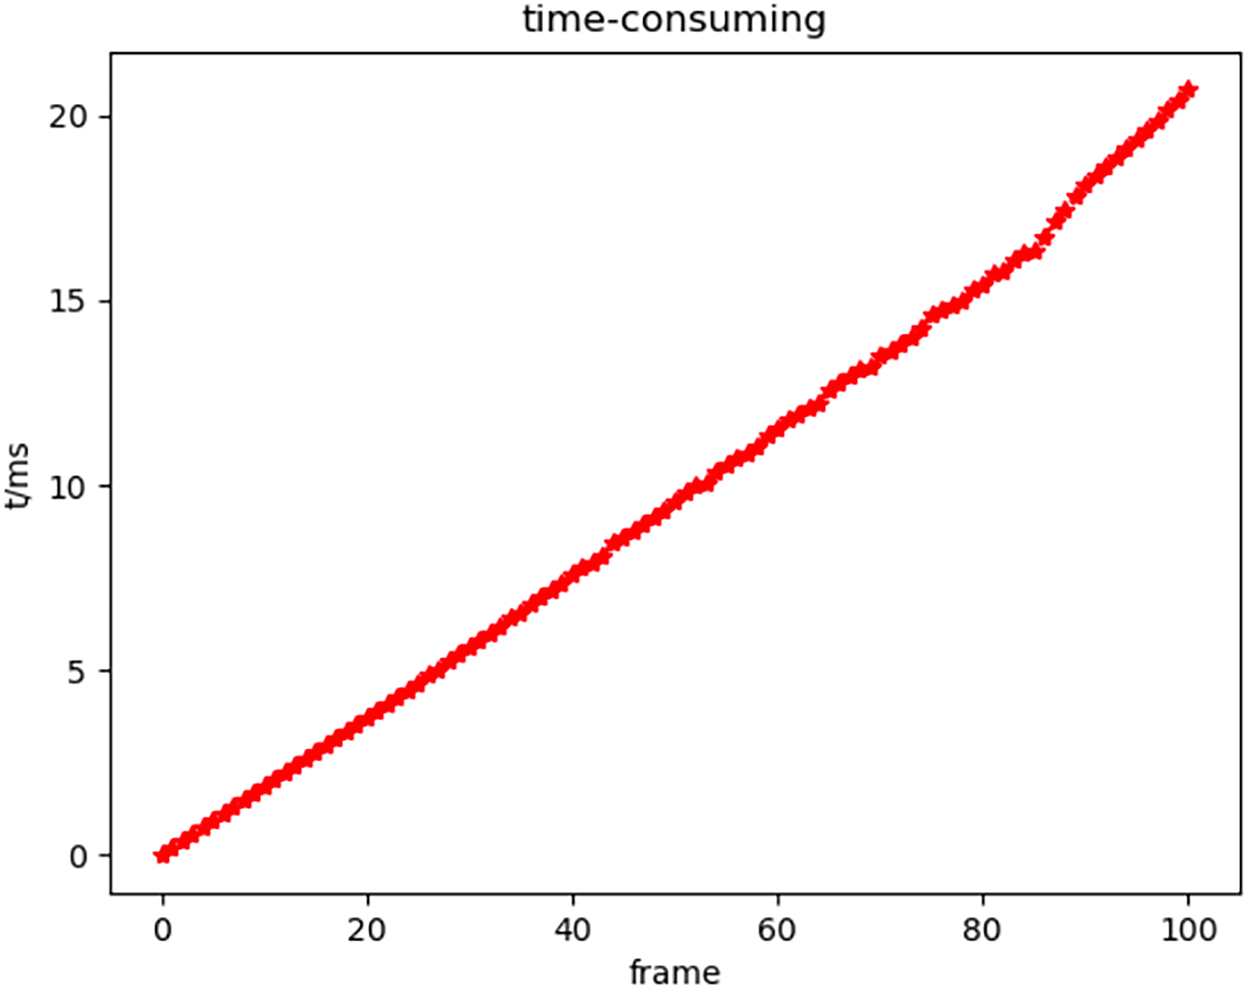
Figure 15: Time-consuming diagram of inter-frame matching
In Fig. 15, the horizontal axis is the number of frames, and the vertical axis is the change in the time taken for inter-frame matching with the increased number of frames. The time unit is millisecond (ms).
It can be seen from Fig. 15 that the time-consuming inter-frame matching is relatively stable and fast. The time consumption of every two frames is between 2 and 2.5 ms, which changes linearly with the increase in the number of frames. This also reflects the stability of the inter-frame triangular matching algorithm. The influence of vanishing and appearing points on inter-frame matching can be almost ignored. Further, the parameter setting for soft tissue surface blob detection is relatively excellent. It stably detects the blobs to be tracked within the frame.
Fig. 15 illustrates the tracking trajectory of the blob initially identified as sequence number 1 in the first frame. The graph’s horizontal axis corresponds to the frame count, while the vertical axis represents the pixel coordinates of the blob. The left panel of the figure displays the X-coordinate of the pixel, and the right panel presents the Y-coordinate. The pixel coordinate system is anchored at the top-left corner of the image, with the X and Y axes being the inverse of the row and column indices typically used to index into a two-dimensional image matrix.
As shown in Fig. 16, in the first 170 frames, the first blob tracking is obtained using the triangular matching algorithm. The change of pixel coordinates is shown in the figure. The vertical axis is the pixel coordinates, and the horizontal axis is the number of frames. From the pixel coordinates, the beating range of the heart surface differs by more than 30-pixel distances. It also shows that we set
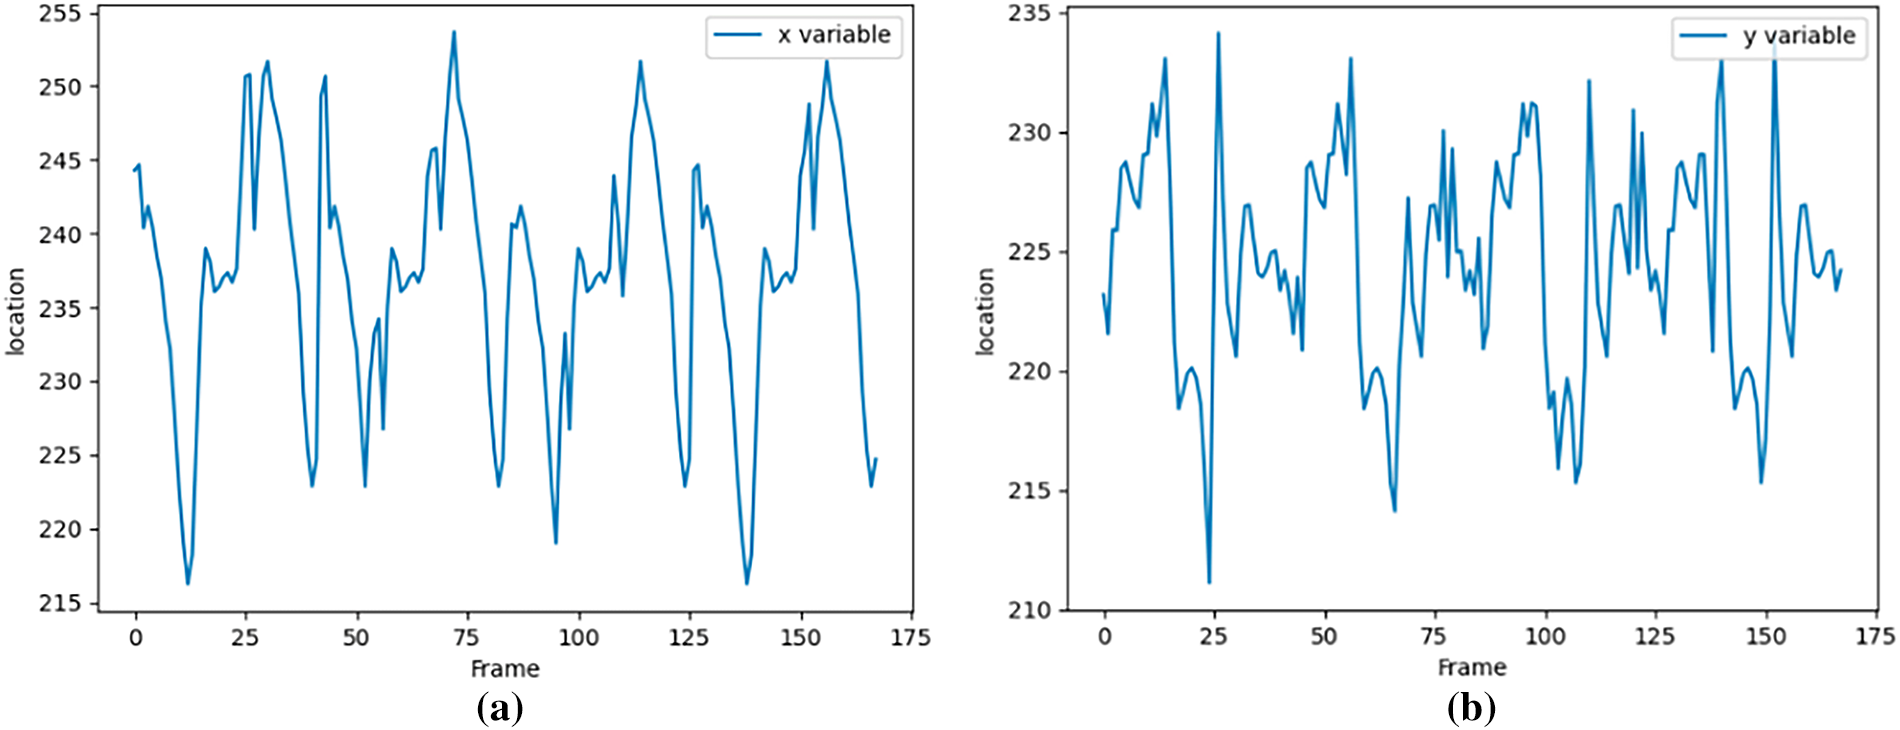
Figure 16: First blob tracking result. (a) x-coordinate variation; (b) y-coordinate variation
The experimental results described in the previous sections demonstrate that when the deformation between consecutive frames is relatively small, the proposed matching criterion—based on the computation of barycentric coordinates—achieves accurate one-to-one correspondence between feature points. This confirms that the HTM framework can effectively model and track soft tissue surfaces in endoscopic image sequences, providing a reliable geometric representation of local deformations.
During the feature-tracking experiments on consecutive frames, some blobs detected in the initial frame occasionally disappeared in subsequent frames. However, this mismatch did not disrupt the overall tracking process. The proposed triangulation strategy automatically ignores unmatched blobs and continues to construct consistent triangular meshes with the remaining points. Consequently, the matching of other blobs is not affected, and the method maintains inter-frame continuity even when certain feature points vanish or reappear later.
The analysis of matching error calculations indicates that the computation within each triangular region is performed rapidly, ensuring near real-time performance. Each matching step only requires the vertex coordinates and pixel information within a small triangular area, resulting in low computational overhead and fast processing speed. Time-consumption evaluations across sequences further confirm that the method remains efficient even as the number of frames increases. Processing times consistently remained within a few milliseconds per frame, reflecting stable and scalable performance. This is critical for real-time surgical navigation and intraoperative assistance.
The trajectory analysis of tracked blobs across the image sequence reveals that the motion of feature points on the heart surface follows certain regular patterns. This observation validates the initial parameter settings regarding maximum deformation thresholds and confirms their suitability for practical applications. Overall, the triangulation-based matching method demonstrates strong reproducibility, stability, and robustness to soft tissue deformation, achieving both accurate geometric modeling and efficient tracking.
In addition to algorithmic performance, the current study also highlights important methodological considerations. Unlike deep learning–based trackers that require large, annotated datasets and pretraining, the HTM framework is a fully unsupervised, geometry-driven method that operates directly on grayscale image sequences without relying on dataset-specific priors. This makes it inherently independent of data diversity or volume, and thus, the use of a single public dataset is appropriate for demonstrating feasibility and robustness.
Furthermore, we did not conduct quantitative benchmarking against SIFT, ORB, or deep learning-based trackers because these methods are built upon fundamentally different assumptions. The primary goal of this paper is to introduce and validate a novel matching paradigm based on triangulated mesh deformation, rather than to outperform or replace existing approaches in metric-driven evaluations.
Compared to feature-based methods such as ORB and SIFT, the proposed HTM framework avoids dependency on texture-rich key points and descriptor matching. ORB-based approaches like Pyramid ORB Zhang et al. [29] achieve multi-scale matching but are sensitive to illumination variation and deformation. In contrast, HTM’s triangulation-based correspondence is geometry-driven and more resilient under tissue motion.
Recent deep learning-based tracking methods, such as the deep matching network proposed by Lu et al. [30], demonstrate high accuracy by training on speckled datasets derived. However, these approaches require curated training sets and pre-trained weights, which limit deployment flexibility. Although this study does not present formal runtime benchmarks, the HTM framework operates without deep learning inference, iterative optimization, or dense correspondence. Its operations—such as blob detection, Delaunay triangulation, and triangle matching—are lightweight and scale linearly with the number of detected blobs, making it inherently suitable for real-time application.
Despite these results, the current approach also has several limitations. First, the method relies on the quality of blob detection in the first frame. If the initial detection misses key features, subsequent matching accuracy can be affected. Second, the method is designed for two-dimensional grayscale images; therefore, its direct extension to complex three-dimensional tissue structures or volumetric data may not be straightforward. Additionally, while the algorithm tolerates moderate nonlinear deformation, extreme deformation or occlusion may reduce matching accuracy, as the triangular relationships between frames may no longer hold.
Beyond these structural limitations, the system also operates under various sources of uncertainty, both internal and external. Internal uncertainties stem from biological factors such as unpredictable tissue deformation, elasticity variation, and partial visibility, while external uncertainties include lighting changes, imaging noise, and camera movement. These uncertainties are typically non-parametric and difficult to quantify in real time. Although our approach does not explicitly model such uncertainties, its geometry-based design provides a degree of resilience. By avoiding reliance on fixed templates or statistical priors, the method is able to maintain performance under variable and noisy conditions.
To overcome these limitations, future work can explore several directions. One promising avenue is to integrate deep learning–based feature detection or tracking modules into the HTM framework to improve initial blob detection robustness, particularly in challenging imaging conditions. Another direction is to extend the current method to 3D surface modeling by incorporating stereo vision or depth sensing, enabling volumetric soft tissue modeling and tracking. Moreover, adaptive triangulation strategies that dynamically update parameters in response to tissue deformation could further improve performance. From a clinical perspective, the HTM framework is particularly suitable for integration into real-time surgical environments. Its training-free nature, low computational footprint, and exclusive use of grayscale input make it adaptable for deployment in embedded surgical platforms. In intraoperative scenarios, HTM could assist in tracking tissue deformation in real time, enabling dynamic adjustment of augmented overlays for navigation or tool–tissue interaction prediction. Because HTM does not rely on prior annotation or learning-based models, it offers a practical and interpretable solution for safety-critical applications where real-time robustness and transparency are essential.
In summary, the proposed HTM approach offers a lightweight yet effective framework for geometric modeling and feature tracking of soft tissues. By addressing current limitations and exploring the proposed future directions, this method has the potential to evolve into a more generalizable tool for surgical computer vision and beyond.
This paper first studies regional triangulation and proposes HTM, including the triangulation algorithm and introducing the center of gravity coordinates. Specifically, for triangulation, the Delaunay algorithm is used in the first frame. Subsequent frame triangle meshes are then constructed, adhering to the angle and length constraints of the triangulation network to ensure continuity and consistency across frames. Then, the center of gravity coordinates is introduced to calculate the matching error, and the result of blob matching between frames is obtained. We analyzed the
Additionally, a time-consuming statistical analysis of blob matching between frames was conducted. We tracked the first 170 frames of the blob with sequence number 0. The results demonstrate that triangle-matching-based soft tissue tracking simplifies complex problems, requires less labeled data, and exhibits robustness against soft tissue deformation. Triangular tracking has been a well-established and widely accepted technique for tracking movement; by adapting this method to soft tissue images, this paper will extend its applicability to related studies and broaden the scope in the field.
This article is based on the blobs on the soft tissue surface image. In order to realize the tracking of a single sample, the center of gravity coordinates is introduced. However, a triangulation algorithm is proposed due to the instability of blob detection and the matching of blobs between frames. The research direction is to focus on stably detecting the blobs in each frame to clear the obstacles for subsequent blob matching.
Acknowledgement: Not applicable.
Funding Statement: Support by Sichuan Science and Technology Program [2023YFSY0026, 2023YFH0004].
Author Contributions: The authors confirm contribution to the paper as follows: study conception and design: Bo Yang, Jiawei Tian; data collection: Fupei Guo, Xiang Zhang; analysis and interpretation of results: Lijuan Zhang, Yu Zhou, Xiang Zhang; draft manuscript preparation: Lijuan Zhang, Fupei Guo; edit and review: Jiawei Tian, Yu Zhou; supervision: Bo Yang, Jiawei Tian. All authors reviewed the results and approved the final version of the manuscript.
Availability of Data and Materials: The data used in this paper is open-source data provided by the Hamlyn Centre Laparoscopic/Endoscopic Video Datasets. This data can be found here: https://hamlyn.doc.ic.ac.uk/vision/ (accessed on 01 June 2025).
Ethics Approval: Not applicable.
Conflicts of Interest: The authors declare no conflicts of interest to report regarding the present study.
References
1. Lu M, Yin J, Zhu Q, Lin G, Mou M, Liu F, et al. Artificial intelligence in pharmaceutical sciences. Engineering. 2023;27(6):37–69. doi:10.1016/j.eng.2023.01.014. [Google Scholar] [CrossRef]
2. Rajpurkar P, Lungren MP. The current and future state of AI interpretation of medical images. N Engl J Med. 2023;388(21):1981–90. doi:10.1056/NEJMra2301725. [Google Scholar] [PubMed] [CrossRef]
3. McGenity C, Clarke EL, Jennings C, Matthews G, Cartlidge C, Freduah-Agyemang H, et al. Artificial intelligence in digital pathology: a systematic review and meta-analysis of diagnostic test accuracy. npj Digit Med. 2024;7(1):114. doi:10.1038/s41746-024-01106-8. [Google Scholar] [PubMed] [CrossRef]
4. Han Y, Chen W, Heidari AA, Chen H, Zhang X. A solution to the stagnation of multi-verse optimization: an efficient method for breast cancer pathologic images segmentation. Biomed Signal Process Control. 2023;86(8):105208. doi:10.1016/j.bspc.2023.105208. [Google Scholar] [CrossRef]
5. Dagnino G, Kundrat D. Robot-assistive minimally invasive surgery: trends and future directions. Int J Intell Robot Appl. 2024;8(4):812–26. doi:10.1007/s41315-024-00341-2. [Google Scholar] [CrossRef]
6. Wang Y, Long Y, Fan SH, Dou Q. Neural rendering for stereo 3D reconstruction of deformable tissues in robotic surgery. In: Proceedings of the Medical Image Computing and Computer Assisted Intervention—MICCAI 2022; 2022 Sep 18–22; Singapore. p. 431–41. doi:10.1007/978-3-031-16449-1_41. [Google Scholar] [CrossRef]
7. Lungu AJ, Swinkels W, Claesen L, Tu P, Egger J, Chen X. A review on the applications of virtual reality, augmented reality and mixed reality in surgical simulation: an extension to different kinds of surgery. Expert Rev Med Devices. 2021;18(1):47–62. doi:10.1080/17434440.2021.1860750. [Google Scholar] [PubMed] [CrossRef]
8. Salazar D, Rossouw PE, Javed F, Michelogiannakis D. Artificial intelligence for treatment planning and soft tissue outcome prediction of orthognathic treatment: a systematic review. J Orthod. 2024;51(2):107–19. doi:10.1177/14653125231203743. [Google Scholar] [PubMed] [CrossRef]
9. Hoff L, Elle OJ, Grimnes MJ, Halvorsen S, Alker HJ, Fosse E. Measurements of heart motion using accelerometers. In: Proceedings of the 26th Annual International Conference of the IEEE Engineering in Medicine and Biology Society; 2024 Sep 1–5; San Francisco, CA, USA. p. 2049–51. doi:10.1109/IEMBS.2004.1403602. [Google Scholar] [PubMed] [CrossRef]
10. Nakamura Y, Kishi K, Kawakami H. Heartbeat synchronization for robotic cardiac surgery, Seoul, Republic of Korea. In: Proceedings of the 2001 IEEE International Conference on Robotics and Automation (ICRA); 2001 May 21–26; Seoul, Republic of Korea. p. 2014–9. doi:10.1109/ROBOT.2001.932903. [Google Scholar] [CrossRef]
11. Lau WW, Ramey NA, Corso JJ, Thakor NV, Hager GD. Stereo-based endoscopic tracking of cardiac surface deformation. In: Proceedings of the Medical Image Computing and Computer-Assisted Intervention—MICCAI 2004; 2024 Sep 26–29; Saint-Malo, France. p. 494–501. doi:10.1007/978-3-540-30136-3_61. [Google Scholar] [CrossRef]
12. Stoyanov D, Darzi A, Yang GZ. Dense 3D depth recovery for soft tissue deformation during robotically assisted laparoscopic surgery. In: Proceedings of the Medical Image Computing and Computer-Assisted Intervention—MICCAI 2004; 2024 Sep 26–29; Saint-Malo, France. p. 41–8. doi:10.1007/978-3-540-30136-3_6. [Google Scholar] [CrossRef]
13. Harris C, Stephens M. A combined corner and edge detector. In: Proceedings of the 4th Alvey Vision Conference 1988; 1988 Aug 31–Sep 2; Manchester, UK. p. 147–51. doi:10.5244/c.2.23. [Google Scholar] [CrossRef]
14. Gong S, Long Y, Chen K, Liu J, Xiao Y, Cheng A, et al. Self-supervised cyclic diffeomorphic mapping for soft tissue deformation recovery in robotic surgery scenes. IEEE Trans Med Imaging. 2024;43(12):4356–67. doi:10.1109/TMI.2024.3439701. [Google Scholar] [PubMed] [CrossRef]
15. Yi KM, Trulls E, Lepetit V, Fua P. LIFT: learned invariant feature transform. In: Proceedings of the Computer Vision—ECCV 2016; 2016 Oct 11–14; Amsterdam, The Netherlands. p. 467–83. doi:10.1007/978-3-319-46466-4_28. [Google Scholar] [CrossRef]
16. Han X, Leung T, Jia Y, Sukthankar R, Berg AC. MatchNet: unifying feature and metric learning for patch-based matching. In: Proceedings of the 2015 IEEE Conference on Computer Vision and Pattern Recognition (CVPR); 2015 Jun 7–12; Boston, MA, USA. p. 3279–86. doi:10.1109/CVPR.2015.7298948. [Google Scholar] [CrossRef]
17. Zagoruyko S, Komodakis N. Learning to compare image patches via convolutional neural networks. In: Proceedings of the 2015 IEEE Conference on Computer Vision and Pattern Recognition (CVPR); 2015 Jun 7–12; Boston, MA, USA. p. 4353–61. doi:10.1109/CVPR.2015.7299064. [Google Scholar] [CrossRef]
18. Su T, Wang W, Liu H, Liu Z, Li X, Jia Z, et al. An adaptive and rapid 3D Delaunay triangulation for randomly distributed point cloud data. Vis Comput. 2022;38(1):197–221. doi:10.1007/s00371-020-02011-3. [Google Scholar] [CrossRef]
19. Chang TH, Watson LT, Lux TCH, Li B, Xu L, Butt AR, et al. A polynomial time algorithm for multivariate interpolation in arbitrary dimension via the Delaunay triangulation. In: Proceedings of the ACMSE, 2018 Conference; 2018 Mar 29–31; Richmond, KY, USA. p. 1–8. doi:10.1145/3190645.3190680. [Google Scholar] [CrossRef]
20. Nguyen CM, Rhodes PJ. Delaunay triangulation of large-scale datasets using two-level parallelism. Parallel Comput. 2020;98(5):102672. doi:10.1016/j.parco.2020.102672. [Google Scholar] [CrossRef]
21. Bodonyi A, Kunkli R. Efficient object location determination and error analysis based on barycentric coordinates. Vis Comput Ind Biomed Art. 2020;3(1):18. doi:10.1186/s42492-020-00052-y. [Google Scholar] [PubMed] [CrossRef]
22. Nambisan AK, Lama N, Phan T, Swinfard S, Lama B, Smith C, et al. Deep learning-based dot and globule segmentation with pixel and blob-based metrics for evaluation. Intell Syst Appl. 2022;16(5):200126. doi:10.1016/j.iswa.2022.200126. [Google Scholar] [CrossRef]
23. Bertinetto L, Valmadre J, Henriques JF, Vedaldi A, Torr PHS. Fully-convolutional siamese networks for object tracking. In: Proceedings of the Computer Vision—ECCV, 2016 Workshops; 2016 Oct 11–14; Amsterdam, The Netherlands. p. 850–65. doi:10.1007/978-3-319-48881-3_56. [Google Scholar] [CrossRef]
24. Lee DT, Schachter BJ. Two algorithms for constructing a Delaunay triangulation. Int J Comput Inf Sci. 1980;9(3):219–42. doi:10.1007/BF00977785. [Google Scholar] [CrossRef]
25. Brondsted A. An introduction to convex polytopes. New York, NY, USA: Springer Science & Business Media; 2012. [Google Scholar]
26. Ma J, Jiang X, Fan A, Jiang J, Yan J. Image matching from handcrafted to deep features: a survey. Int J Comput Vis. 2021;129(1):23–79. doi:10.1007/s11263-020-01359-2. [Google Scholar] [CrossRef]
27. Yan F, Zhao S, Venegas-Andraca SE, Hirota K. Implementing bilinear interpolation with quantum images. Digit Signal Process. 2021;117(7):103149. doi:10.1016/j.dsp.2021.103149. [Google Scholar] [CrossRef]
28. Karunasingha DSK. Root mean square error or mean absolute error? Use their ratio as well. Inf Sci. 2022;585(1):609–29. doi:10.1016/j.ins.2021.11.036. [Google Scholar] [CrossRef]
29. Zhang Z, Wang L, Zheng W, Yin L, Hu R, Yang B. Endoscope image mosaic based on pyramid ORB. Biomed Signal Process Control. 2022;71(7):103261. doi:10.1016/j.bspc.2021.103261. [Google Scholar] [CrossRef]
30. Lu S, Liu S, Hou P, Yang B, Liu M, Yin L, et al. Soft tissue feature tracking based on deep matching network. Comput Model Eng Sci. 2023;136(1):363–79. doi:10.32604/cmes.2023.025217. [Google Scholar] [CrossRef]
Cite This Article
 Copyright © 2025 The Author(s). Published by Tech Science Press.
This work is licensed under a Creative Commons Attribution 4.0 International License , which permits unrestricted use, distribution, and reproduction in any medium, provided the original work is properly cited.
 Downloads
 Citation Tools