
 Submit a Paper
 Propose a Special lssue
 Open Access
ARTICLE
XGBoost-Based Active Learning for Wildfire Risk Prediction
1 School of Automation Engineering, University of Electronic Science and Technology of China, Chengdu, 611731, China
2 Sichuan Provincial Institute of Forest and Grassland Survey and Planning, Chengdu, 610081, China
3 Southwest Forestry University, Kunming, 650224, China
4 Guangxi University, Nanning, 530004, China
5 Guangxi Institute of Industrial Technology for Space-Time Information Co., Ltd., Nanning, 530201, China
* Corresponding Author: Hang Geng. Email:
(This article belongs to the Special Issue: Incomplete Data Test, Analysis and Fusion Under Complex Environments)
Computer Modeling in Engineering & Sciences 2025, 145(3), 3701-3721. https://doi.org/10.32604/cmes.2025.073513
Received 19 September 2025; Accepted 15 October 2025; Issue published 23 December 2025
 View Full Text
 Download PDF
Abstract
Machine learning has emerged as a key approach in wildfire risk prediction research. However, in practical applications, the scarcity of data for specific regions often hinders model performance, with models trained on region-specific data struggling to generalize due to differences in data distributions. While traditional methods based on expert knowledge tend to generalize better across regions, they are limited in leveraging multi-source data effectively, resulting in suboptimal predictive accuracy. This paper addresses this challenge by exploring how accumulated domain expertise in wildfire prediction can reduce model reliance on large volumes of high-quality data. An active learning algorithm is proposed based on XGBoost for wildfire risk assessment that autonomously identifies low-confidence predictions and seeks re-labeling through a human-in-the-loop or physics-based correction approach. This corrected data is reintegrated into the model, effectively preventing catastrophic forgetting. Experimental results demonstrate that the proposed human-in-the-loop approach significantly enhances labeling accuracy, predictive performance, and preserves the model’s ability to generalize. These findings highlight the value of incorporating human expertise into machine learning models, offering a practical solution to mitigate data quality challenges and improve model reliability in wildfire risk prediction.Keywords
Forest fires are among the most frequent and devastating natural disasters. Every year, numerous forest fires occur worldwide, with countries such as China, Australia, the United States, Russia, and Canada facing significant challenges in managing and preventing them [1,2]. Forest fires not only cause widespread damage to vegetation but also pose an irreversible threat to biodiversity within forest ecosystems, impacting the genetic diversity of both plant and animal species [3,4]. In addition to environmental destruction, these fires lead to severe economic losses and can even endanger human lives [5]. Currently, the trend of global warming has led to an increased frequency of forest fires, with the fire-prone areas in boreal and temperate zones significantly expanding [6,7]. Given the magnitude of these challenges, effectively predicting forest and grassland fires and issuing early warnings has become an urgent scientific and societal problem.
Many of the primary forest fire risk warning methods are based on the accumulated experience and knowledge over time, identifying key factors that are believed to be closely related to fire risk [8]. For instance, the Fire Danger Index (FDI) [9], developed by the Australian Bureau of Meteorology, and the National Fire Danger Rating System (NFDRS) [10], developed by the U.S. Forest Service, focus on weather-related factors such as temperature, humidity, wind speed, and fuel moisture to assess the likelihood of a fire occurring. Similarly, the Fire Weather Index (FWI), developed by the Canadian Forest Service, uses factors like temperature, relative humidity, wind speed, and precipitation to estimate fire danger [11]. These models rely on well-established relationships between these variables and fire risk, often using predefined thresholds to trigger warnings. However, these traditional approaches are limited in scope, as they generally consider only a small number of factors. The thresholds set by humans may not always be precise or adaptable to varying conditions, leading to potential inaccuracies in fire risk predictions. As a result, the reliability of these factor-based models can sometimes be compromised.
Machine learning has emerged as a promising solution to the limitations of traditional fire risk prediction models [12–14]. These approaches facilitate the integration of multi-source data, enabling the inclusion of a wide range of variables that influence fire risk. By learning from historical data, machine learning models can autonomously identify complex, nonlinear relationships between these factors and fire risk [15]. This ability to process and analyze a broader set of variables—and adapt to evolving data patterns—has made machine learning a key focus in current forest fire risk prediction research. Its potential to improve prediction accuracy and provide more dynamic, reliable fire risk warnings is immense.
Researchers from various institutions have explored a range of machine learning-based methods for fire risk prediction. For instance, Reference [16] discusses the deployment of rechargeable wireless sensor networks in forest areas to monitor real-time climate changes, utilizing an enhanced fuzzy inference algorithm to analyze the collected data for fire risk prediction. In References [17,18], Logistic Regression model is applied to analyze factors such as terrain, vegetation, weather, and human activity [19], leading to more accurate forest fire predictions. Reference [20] addresses the issue that previous studies have predominantly focused on climate and terrain factors, while insufficiently considering socioeconomic variables. It uses logistic regression and Random Forest (RF) models to evaluate the impact of biophysical and anthropogenic factors on human-caused forest fires in northern China. Reference [21] combines Geographic Information System (GIS) analysis and Artificial Neural Network (ANN) modeling to assess the fire susceptibility of forest areas in central Portugal. Reference [22] uses Generalized Additive Models (GAMs) as a predictive model for a human-caused wildfire prediction system in Ontario, Canada, incorporating various influential factors and achieving strong predictive performance. Reference [23] introduces a calibrated machine learning model and compares it with statistical models. The results show that the logistic GAM model performs competitively and is easier to interpret. Reference [24] evaluates the evolution characteristics of forest fires using the Mann-Kendall mutation test and standard deviation ellipses, proposing hybrid ensemble models to overcome the limitations of individual models and enhance prediction outcomes. The Random Forest algorithm can automatically select important variables and, when analyzing the factors influencing wildfires, it determines the significance of each factor by calculating variable importance scores. Additionally, it has the advantages of being less prone to overfitting and having good stability, making it highly favored by researchers. In Reference [25], Random Forest is selected as the model for predicting fire occurrence, with an analysis of key factors revealing that the normalized vegetation index and climate variables (e.g., temperature and solar radiation) are critical drivers of fire risk. Reference [26] uses wildfire data, meteorological data, vegetation data, and terrain data from New South Wales, Australia, spanning from 1981 to 2020. Through correlation analysis and Random Forest regression, the study explores the relationship between wildfires and influencing factors, as well as the relative importance of each factor. Reference [27] investigates the performance of several machine learning models, including Random Forest, in forest fire prediction, finding that vegetation features and combustible factors have a greater impact on fire occurrence in Changsha than meteorological factors, while surface temperature plays a minimal role. Reference [28] employs the Bayesian averaging method to combine the prediction results of the support vector machine with a radial basis function kernel and the prediction results of Random Forest based on the average output of multiple classification trees, thereby constructing an ensemble model that addresses both data imbalance and feature redundancy issues. Reference [29] combines frequency ratio with machine learning models to construct various hybrid machine learning algorithms, namely Frequency Ratio-Random Forest (RF-FR), Frequency Ratio-Support Vector Machine (SVM-FR), Frequency Ratio-Multilayer Perceptron (MLP-FR), Frequency Ratio-Classification and Regression Tree (CART-FR), and Frequency Ratio-Logistic Regression (LR-FR). All models have AUC values greater than 0.8, indicating their effectiveness in identifying fire-prone areas. Reference [30] uses models such as Support Vector Machine (SVM) and Gradient Boosting Decision Tree (GBDT) to predict the probability of forest fires in Hunan Province and create risk maps, providing valuable references for forest fire prevention and control management.
Despite the growing interest and research in machine learning for wildfire prediction, successful real-world applications remain limited. A fundamental challenge lies in the heavy dependence of machine learning models—particularly in supervised learning—on data quality [31]. While forestry agencies worldwide have meticulously documented historical fire incidents, providing a valuable foundation for data-driven modeling, the uncritical use of such data introduces significant risks. Specifically, there is a pervasive issue of potential data misinterpretation: points where fires historically occurred are typically labeled as high-risk, while those without recorded fires are considered low-risk. However, areas without past fires are not necessarily safe—they may represent under-observed regions or simply not have encountered ignition sources yet. Similarly, some locations near historical fire events might be misclassified as high-risk due to spatial or temporal proximity, even if conditions there are not conducive to fire. Manually verifying each data point is infeasible due to the vast number of observations and high-dimensional feature space. Therefore, this study aim to develop a method that can identify two types of informative instances: non-fire points that may actually be high-risk, and fire-proximate points that might in fact be low-risk. These instances can then be validated by experts and reintroduced into the model, refining its predictive accuracy. To address these issues, this paper proposes an XGBoost-based active learning framework. First, a spatiotemporal risk classification strategy is designed. Then, building on XGBoost an active learning methodology that integrates data-driven modeling with empirical expertise is developed, thereby mitigating prediction risks associated with unreliable labels.
Note that although XGBoost for wildfire risk prediction has been studied by Liao et al. [32], their method primarily centers on enhancing model interpretability through SHAP explanations. Here, we introduce an active learning framework to improve prediction reliability with limited labeled data. Thus, in comparison with [32], the novelty of our study lies in the proposed learning paradigm rather than in the base model architecture. The contributions of this work are as follows:
A spatiotemporal data-based risk classification method is introduced, enabling the autonomous identification of high- and low-risk data from large historical datasets.
An active learning wildfire risk prediction model is designed, combining empirical and data-driven models to prevent overfitting.
A novel architecture based on XGBoost is proposed that effectively avoids catastrophic forgetting, ensuring the model retains learned knowledge as relabeled data is incorporated.
2.1 Basic Derivation of XGBoost
XGBoost (Extreme Gradient Boosting) is an ensemble learning algorithm. In XGBoost, the model makes predictions by gradually optimizing the loss function and learning a weighted sum of multiple decision trees through several iterations. The goal of XGBoost is to fit the loss function using an additive model, gradually reducing bias, thereby obtaining an efficient and accurate prediction model.
Forest fire risk prediction is a classification problem, where the training data typically comes from historical fire-related data for a specific area. The features x represent factors related to fire risk, while the labels indicate the fire risk level (
Cross-entropy loss function is used to evaluate the classification error:
Unlike a typical random forest, the growth of a new decision tree in this model depends on the accuracy of the previously generated trees. Specifically, when generating the t-th tree, the predictions from the previous t−1 trees are already available. Let the predictions from the ensemble of the first t − 1 trees be denoted as
Additionally, a regularization term
Thus, the loss function can be expressed as:
The prediction of the
here,
Using the Taylor expansion, the loss function can be approximated as:
where, for each sample
These parameters depend only on the previously trained model and are constants when training the
For a tree with T leaf nodes, the weight
where
The final prediction for each sample is obtained by summing the contributions from all trees:
For binary classification, the final output is obtained by applying the Sigmoid activation function:
where η is the learning rate, controlling the contribution of each tree.
2.2 A Spatiotemporal Data Partition-Based Autonomous Data Selection Strategy
In the XGBoost loss function, the first and second-order derivatives accurately approximate the local variations of the loss function. The ensemble learning framework enables XGBoost to demonstrate strong generalization performance, while controlling model complexity further reduces the risk of overfitting. However, like methods such as SVM and ANN, XGBoost is a supervised learning algorithm that depends on reliable data. Currently, forestry and grassland departments worldwide primarily focus on acquiring wildfire point data, which does not cover the full spectrum of risk scenarios from high to low. In practice, both high-risk and low-risk data are essential for training data-driven wildfire models (see Fig. 1). To address this, a spatiotemporal sampling-based method is employed to autonomously extract high and low-risk data. On one hand, this method uses the limited fire point data to autonomously identify high and low-risk instances. On the other hand, this spatiotemporal risk classification method cannot fully ensure the validity of the labels. Therefore, a novel learning paradigm based on active learning to is designed further mitigate the reliability issues caused by data quality problems.
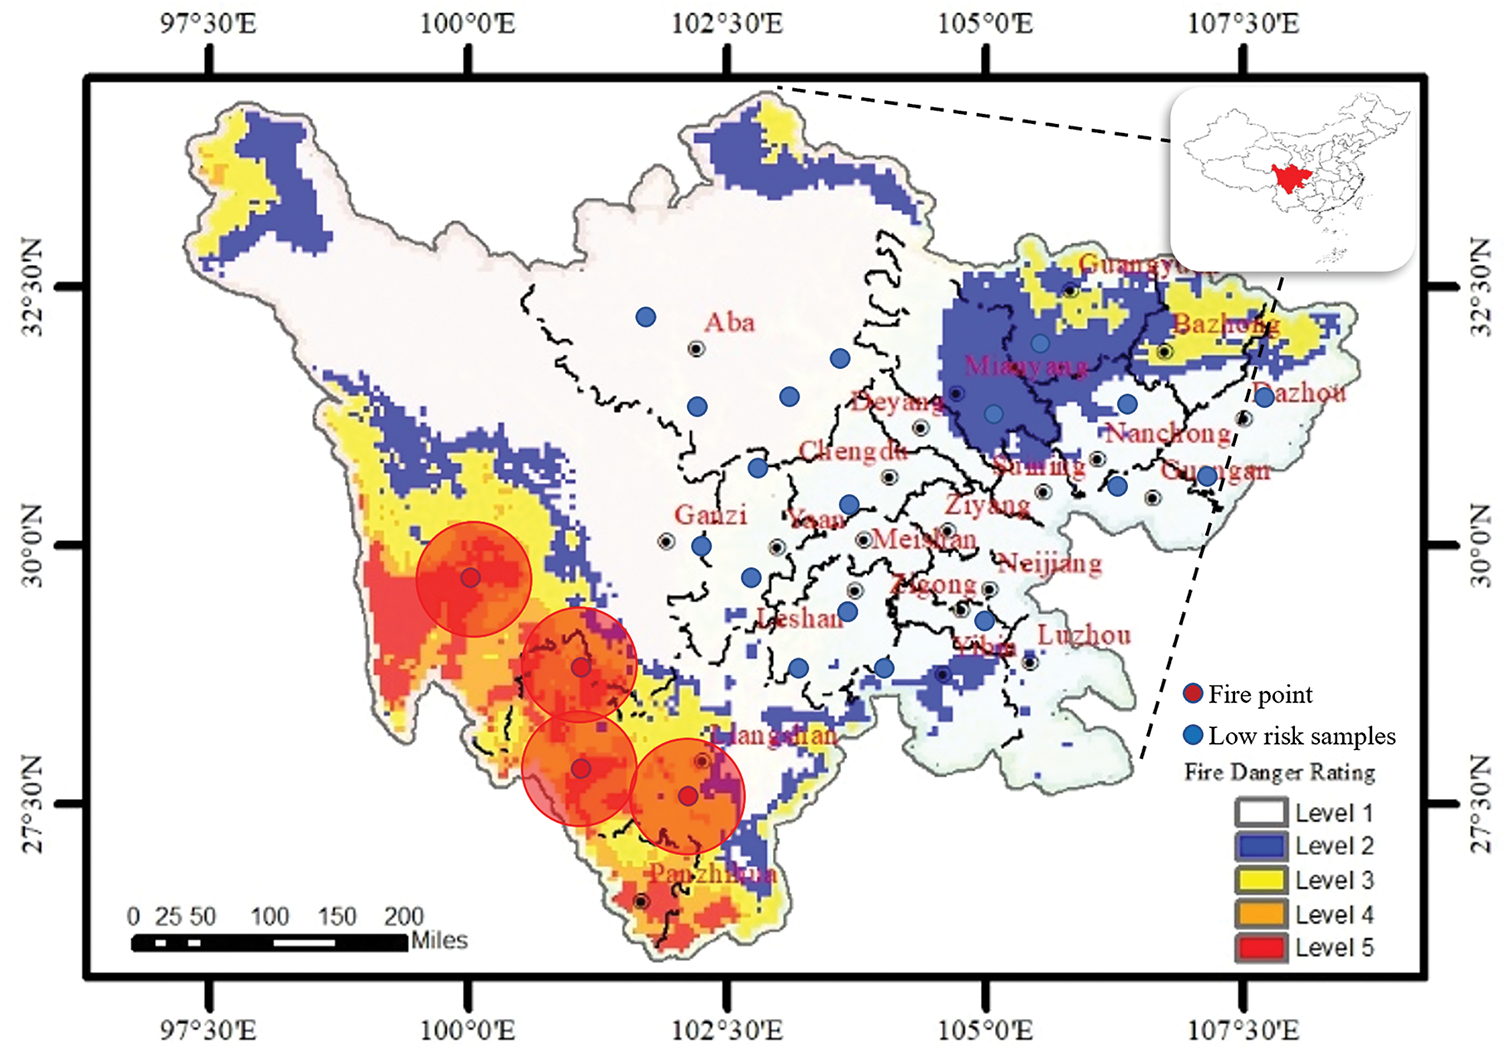
Figure 1: Schematic of spatiotemporal autonomous extraction of high and low-risk data
Fire points
where
Based on the historical wildfire data, ensure that 99% of the wildfire data fall within the 1-sigma range. This means, based on historical data, we will calculate the values of
This involves analyzing the historical fire points and calculating the standard deviations of the distribution. Once the standard deviations
where
Low-risk area is any point outside this high-risk range, where:
The spatiotemporal data sampling method is illustrated in the figure below. Using wildfire data from the Sichuan region as an example, Fig. 2 shows a map of fire points over a specific period, in which the red dots represent recorded wildfire locations. Through division of the spatiotemporal data, the 3-sigma range is determined to help identify high-risk wildfire areas. Sampling is conducted within the high-risk region, and together with the fire point data, this area is treated as high-risk data. Outside the wildfire region, points are randomly sampled as low-risk data. Both high-risk and low-risk data are then used for training the XGBoost model.
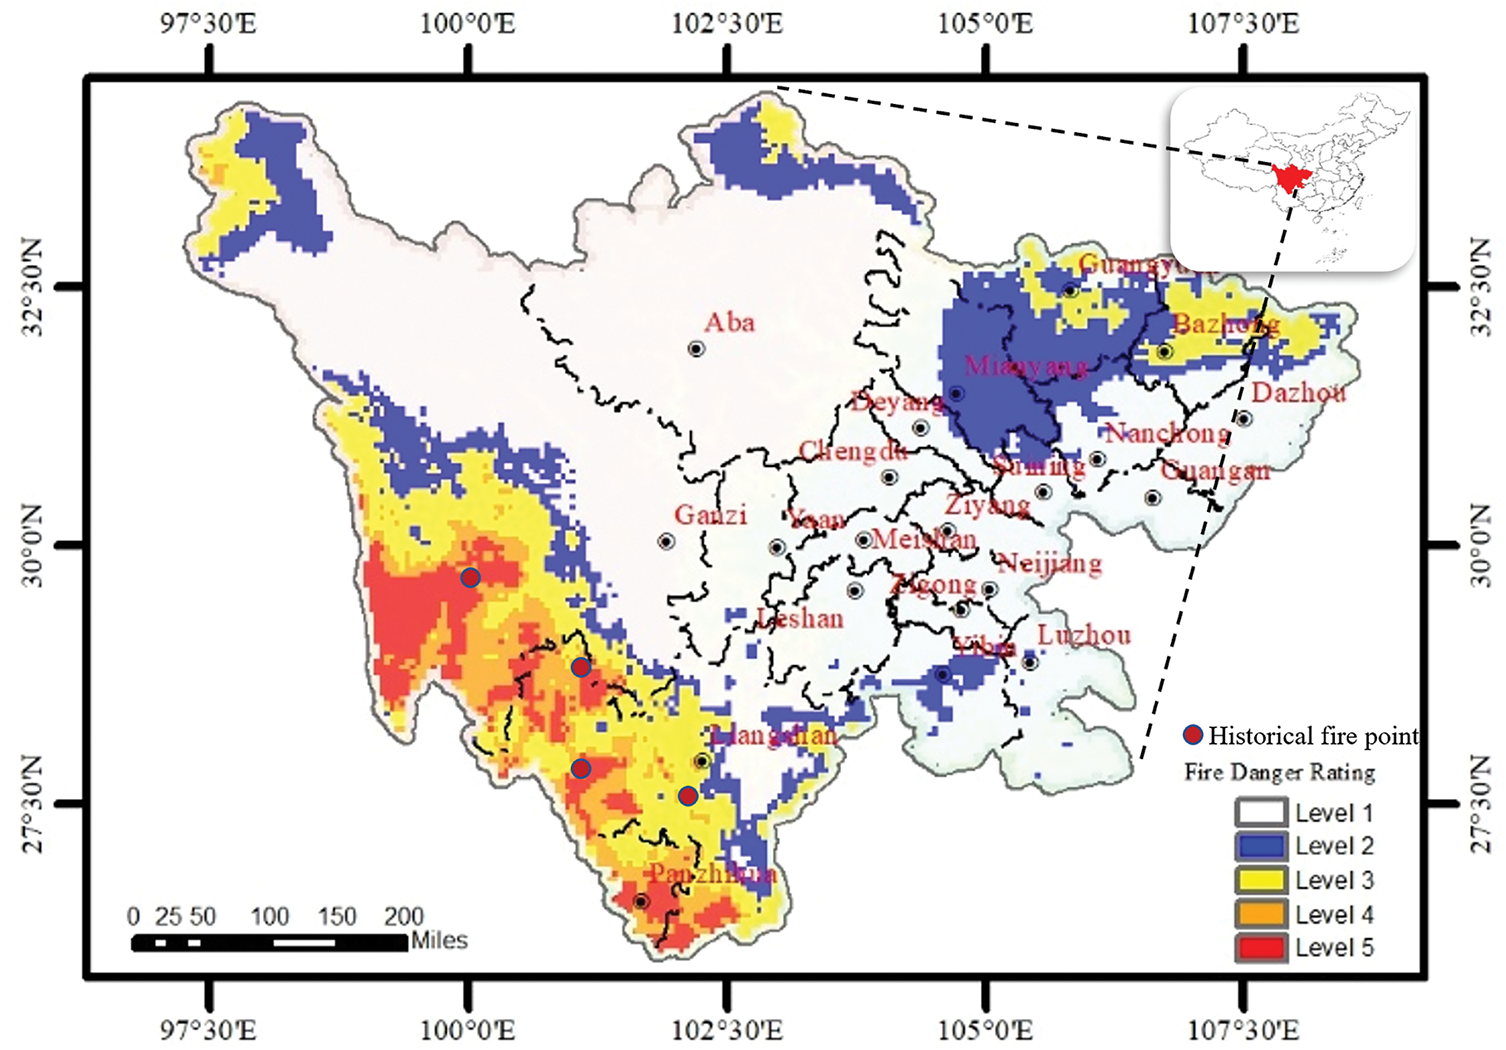
Figure 2: Schematic of historical fire data in sichuan region
2.3 Active Learning for Fire Risk Assessment Using XGBoost
The spatiotemporal data partitioning method proposed in the previous section enables the autonomous selection of high-risk and low-risk data from extensive historical records. In practice, forestry departments and insurance research institutions in various countries follow a similar logic, although traditional approaches have largely relied on experience-based or threshold-driven methods. However, the selection of high-risk data does not necessarily indicate actual high wildfire risk, nor can it be certain that low-risk data represents truly low risk. Despite the application of the 3-sigma principle, the method does not fully guarantee the reliability of the selected data or the accuracy of its labels. Wildfire occurrence is heavily influenced by ignition behavior, and non-fire data often includes numerous high-risk points that did not result in fire solely due to the absence of an ignition source. Conversely, recorded fire points may include locations that are inherently low-risk but ignited due to human intervention.
The selection of high-risk data is heavily dependent on actual wildfire events. Some medium- to low-risk points may be misclassified as high-risk due to human factors that caused a fire. Additionally, some low-risk points may be incorrectly labeled as low-risk simply because no fire occurred nearby within a certain spatiotemporal window, even though these points could be at risk under different conditions. These occasional events introduce uncertainty. For wildfire prediction models, the goal is to predict risk, not to account for these random, chance occurrences. This labeling approach creates discrepancies between the dataset labels and actual risk levels, which ultimately reduces the dataset quality and negatively impacts model training performance. To tackle the challenge of data label unreliable issue in the fire risk model prediction process, an active learning-based approach to fire risk assessment is proposed that leverages XGBoost and incorporates human expertise into the iterative model training process, thus improving the reliability of the dataset and the accuracy of the fire risk prediction model.
Initially, an XGBoost model is trained on dataset
To identify uncertain samples, the prediction error (or confidence index) for each data point is calculated:
If the error
The relabeled uncertain samples form a new dataset,
To avoid catastrophic forgetting when incorporating new data, an incremental training approach is employed. Specifically, a subset of the low-confidence data, along with a subset of non-low-confidence samples, is randomly selected to form an updated training set
This new dataset
where
The active learning approach is illustrated in Fig. 3. Based on climate, geographical, and vegetation data obtained from forestry departments for a specific region, the spatio-temporal data partitioning method proposed in this paper is employed to extract high-risk and low-risk data from vast historical datasets. This serves as the initial coarse filtering of the data labels. The XGBoost algorithm evaluates the data by estimating the probability of high risk and comparing it with actual fire occurrences. The points where the estimated results do not match the labels are then subjected to expert or empirical model judgment. Experts relabel these data points in a second round to prevent unreliable labels caused by automated classification. The newly relabeled data is used to train new decision trees, which are integrated into the XGBoost model. This approach helps avoid catastrophic forgetting of previously learned knowledge while combining expert experience with data-driven models, leveraging the powerful data fusion capabilities of machine learning methods.
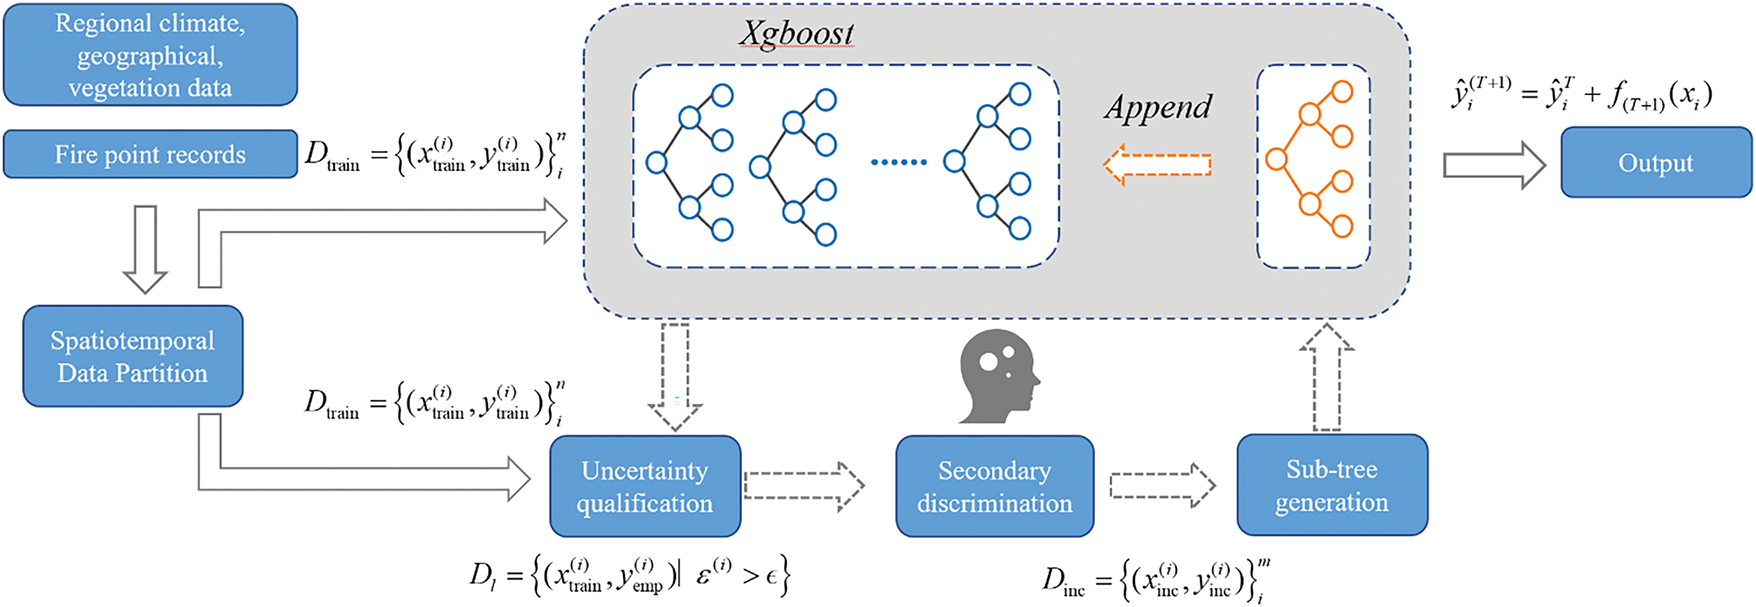
Figure 3: Active learning for fire risk assessment flowchart
This process of identifying uncertain samples, relabeling them using expert knowledge, and incrementally updating the model continues iteratively, leading to a more robust and accurate fire risk prediction over time. By refining the dataset with expert-labeled samples, the model improves its predictive accuracy, especially in scenarios involving uncertain or noisy data. The active learning approach, which integrates statistical machine learning with human expertise, offers several key advantages: it reduces labeling errors by focusing on uncertain samples, enhancing the quality of the training data; it allows for continuous improvement of the model without the risk of catastrophic forgetting, as new data is incorporated incrementally; and it leverages expert knowledge to increase the model’s reliability and accuracy, making it particularly effective in environments where data quality can vary.
The experimental analysis was conducted based on nearly two decades of historical wildfire monitoring records provided by the Sichuan Provincial Forestry Department in China, encompassing more than 8000 fire events. The majority of these fires occurred between February and May, with approximately 98% attributed to anthropogenic ignition. According to the spatial distribution patterns and clustering characteristics of the fire points, the study area was divided into three subregions, see Fig. 4.
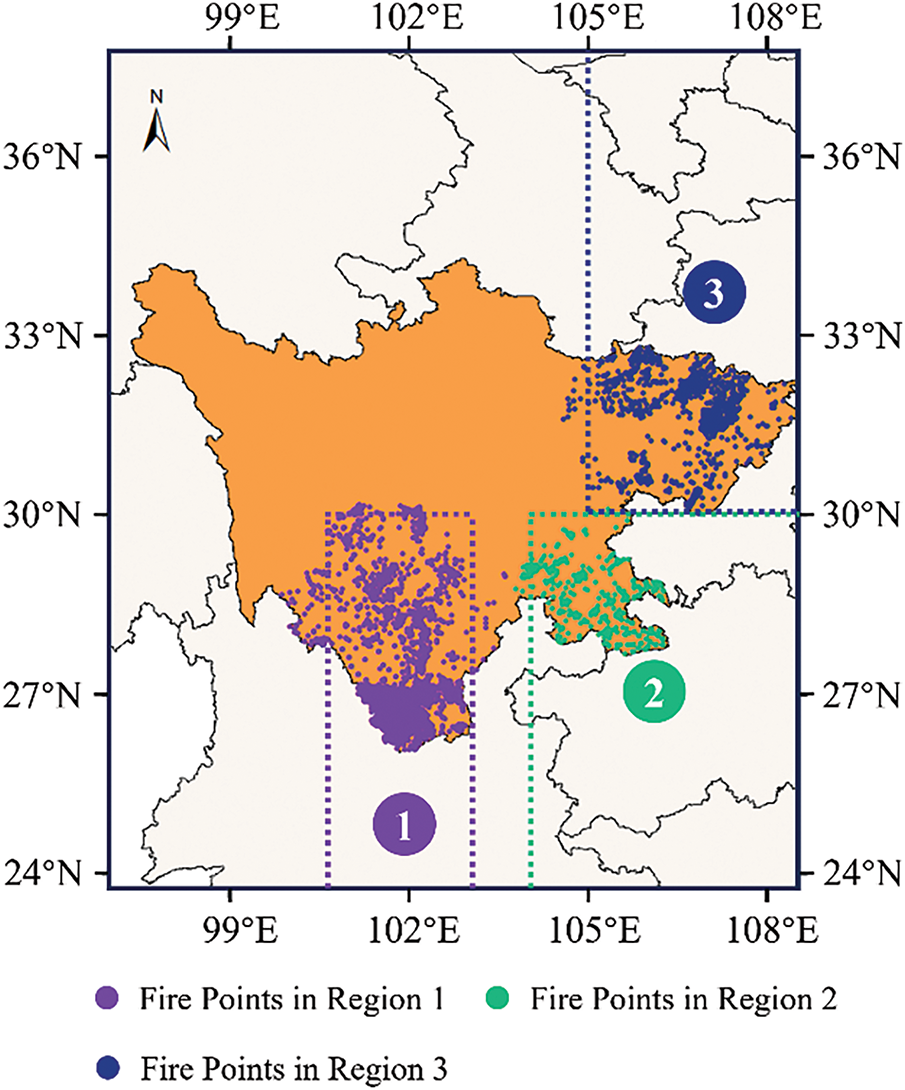
Figure 4: Schematics of research area division
Region 1 covers the area south of 30°N and between 100.7°E and 103°E in Sichuan Province. Located on the eastern margin of the Hengduan Mountains, this region exhibits pronounced vertical climatic differentiation, characterized by the coexistence of dry-hot valleys and cold-humid highlands.
Region 2 encompasses the area east of 104°E and south of 30°N. The dominant landform consists of low mountains and hills, with climatic conditions marked by mild winters, humid summers, and frequent foggy weather.
Region 3 includes the area north of 30°N and east of 105°E, situated in the central-eastern part of the Sichuan Basin. It is characterized by a typical subtropical humid monsoon climate, with hot and rainy summers, mild and dry winters, and frequent temperature inversions and haze events.
In terms of wildfire distribution, Region 1 recorded 5888 historical fire points, Region 2 contained 1137 fire points, and Region 3 accounted for 1266 fire points. These three subregions present significant differences in both climatic and geographical characteristics, thereby providing a diverse experimental setting to evaluate the adaptability of the proposed algorithm under varying environmental conditions.
The fire risk prediction is based on meteorological factors collected by local forestry departments. Eleven meteorological factors, including wind speed, temperature, and solar radiation, were selected as features, as shown in the Table 1. For the aforementioned meteorological factors, based on high-resolution hourly observation records, daily-scale characteristic indicators are calculated through statistical modeling methods. These indicators include but are not limited to daily average values (reflecting the overall level of meteorological elements), standard deviations (characterizing the intra-day fluctuation range), ranges (embodying the extreme value scope), and interquartile ranges (IQR, describing the degree of dispersion in data distribution). The meteorological data is sourced from the ERA5 atmospheric reanalysis dataset, which has a spatial resolution of 0.1°.

Our experiments are designed to comprehensively evaluate the effectiveness of the proposed model, with a particular focus on the validation of the active learning mechanism and the incremental learning strategy. Specifically, the evaluation of the active learning mechanism investigates its contribution to performance improvement, while the assessment of incremental learning focuses on its generalization capability under cross-regional and sample-constrained scenarios.
To better assess the model’s performance, the test set labels are dynamically updated in each iteration according to the evolving model, allowing for continuous tracking of performance improvement over the course of iterative training.
This study employs the GB/T 36743-2018 Forest Fire Danger Weather Rating (FFDR) system as a standardized benchmark to mitigate the subjectivity inherent in human judgment. While expert assessments can be highly effective—often surpassing model-based predictions due to their rich prior knowledge and ability to synthesize multiple factors—they vary significantly among individuals, making consistent cross-comparison challenging. In contrast, the FFDR model offers a unified and objective approach by quantifying fire risk into five distinct levels based on key meteorological variables, including wind speed, temperature, relative humidity, precipitation, snow depth, and drought index. This standardization helps reduce bias and ensures consistent evaluation, even though it may not fully capture the nuanced reasoning of an experienced expert. The FFDR is calculated using a specific model that incorporates several meteorological and environmental variables. The formula for FFDR is:
where, U is the fire risk meteorological index:
The classification performance of various machine learning methods is assessed using five metrics: Accuracy, Precision, Recall and Specificity. Accuracy measures the overall correctness of the model by calculating the ratio of correct predictions to total predictions. Precision focuses on the accuracy of positive predictions, indicating how many of the predicted positive instances are actually positive. Recall measures the model’s ability to correctly identify all positive instances, highlighting its effectiveness in capturing positive cases. Specificity evaluates the model’s ability to correctly identify negative instances, ensuring it avoids false positives. Together, these metrics provide a comprehensive view of a model’s performance, each focusing on different aspects of prediction accuracy. Below are the expressions for the model performance metrics:
In machine learning, TP (True Positives) are the instances correctly predicted as positive, TN (True Negatives) are correctly predicted as negative, FP (False Positives) are incorrectly predicted as positive, and FN (False Negatives) are incorrectly predicted as negative.
3.2 Experiment on the Effectiveness of the Active Learning Mechanism
The effectiveness of the active learning mechanism was evaluated using fire and non-fire data from Region 1. Initially, experiments were conducted using XGBoost without active learning. Prior to iterative training, the model showed accuracies of 76.4% on the training set and 74.9% on the test set. Subsequently, the active learning mechanism was integrated into the XGBoost framework for further validation. A key hyperparameter, denoted as
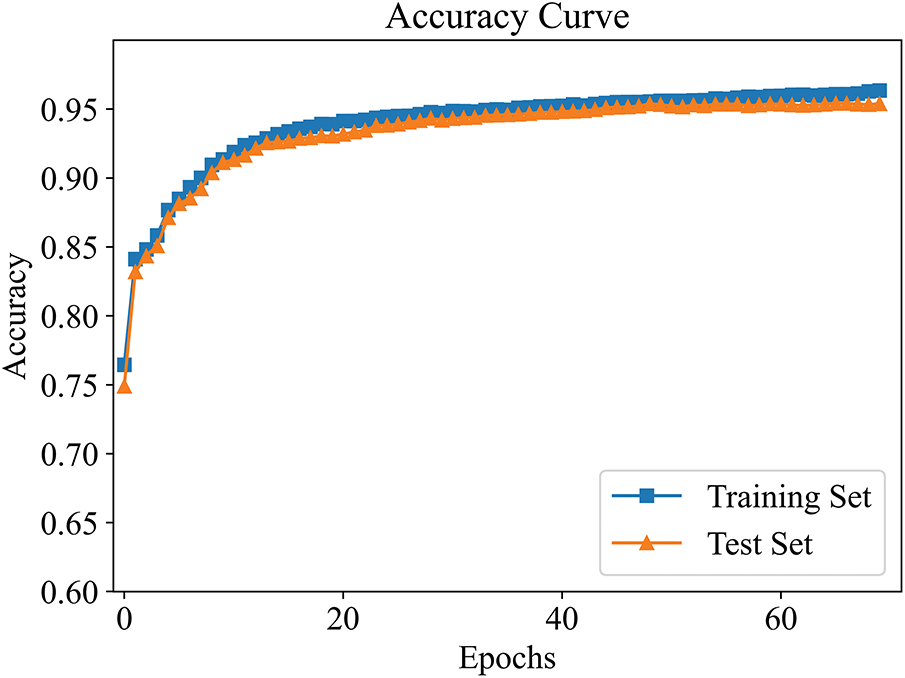
Figure 5: Accuracy improvement curve in active learning (
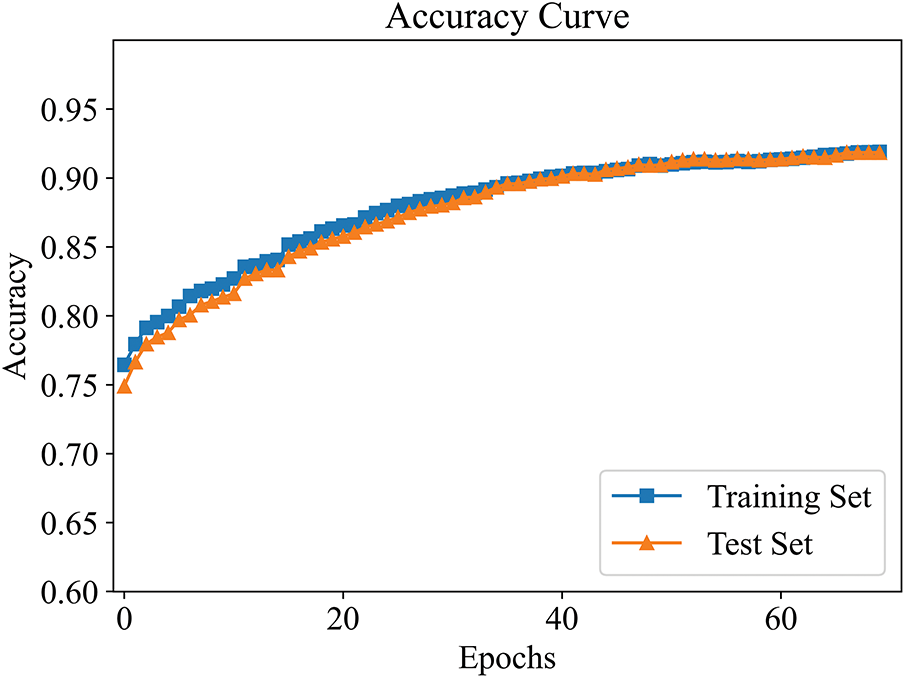
Figure 6: Accuracy improvement curve in active learning (
At both thresholds, the model’s accuracy on the training and test sets consistently increased with each iteration, eventually stabilizing. When
Additionally, it can be observed that although the model’s accuracy improved under both thresholds, the maximum accuracy was higher when
To further illustrate the effectiveness of the active learning mechanism in XGBoost, Fig. 7 visualizes the data before and after iterations using the t-distributed stochastic neighbor embedding (t-SNE) dimensionality reduction method. In Fig. 7a, the data labels obtained via the spatiotemporal capture method are shown. Some high-risk data points are misclassified as low-risk, and some low-risk data points might be incorrectly labeled as high-risk. After the active learning iterations, the model can autonomously identify and filter out low-risk samples within high-risk regions, which are then submitted to experts for verification or discriminated using models like FFDR. The model is then updated, and the samples are reintroduced for training. Fig. 7b,c represents the results of active learning under different thresholds: ε = 0.7 and 0.8, respectively. A higher ε means stricter data selection, resulting in fewer samples participating in the active learning iterations. From the figures, it is evident that more labels are changed in Fig. 7b than in Fig. 7c. This iterative mechanism significantly improves the model’s accuracy.
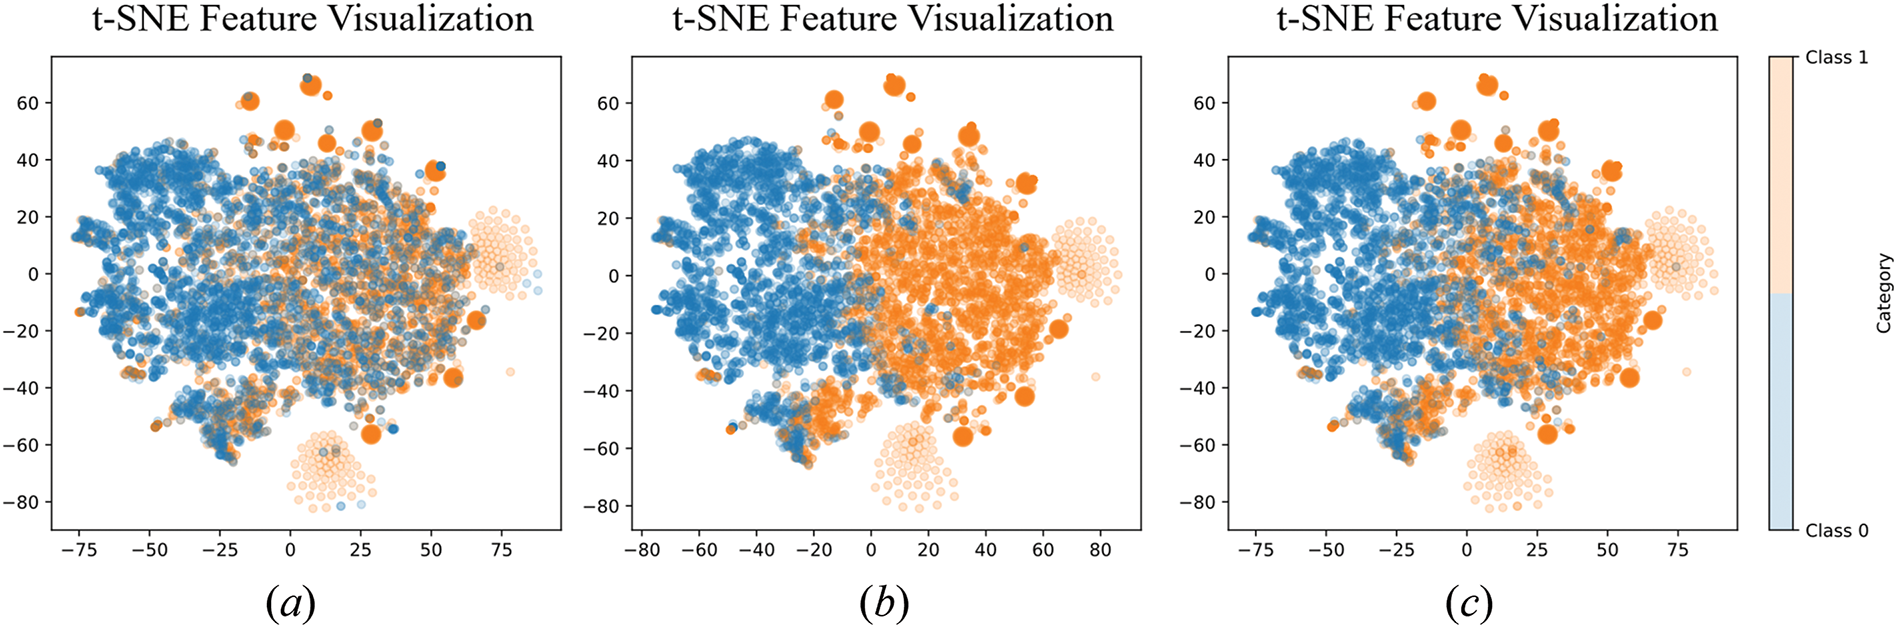
Figure 7: t-SNE feature visualization. (a) Before active learning iterations. (b)
ROC curves for both the classic XGBoost and Active-XGBoost models were plotted, as shown in Figs. 8 and 9. These curves intuitively reflect the discriminative ability of each model under varying classification thresholds: the closer the curve is to the top-left corner, the better the model performance. A significant improvement in model effectiveness was observed after iterative training. The active learning mechanism successfully identified and corrected samples with misleading information, thereby enhancing the model’s ability to predict actual fire risks.
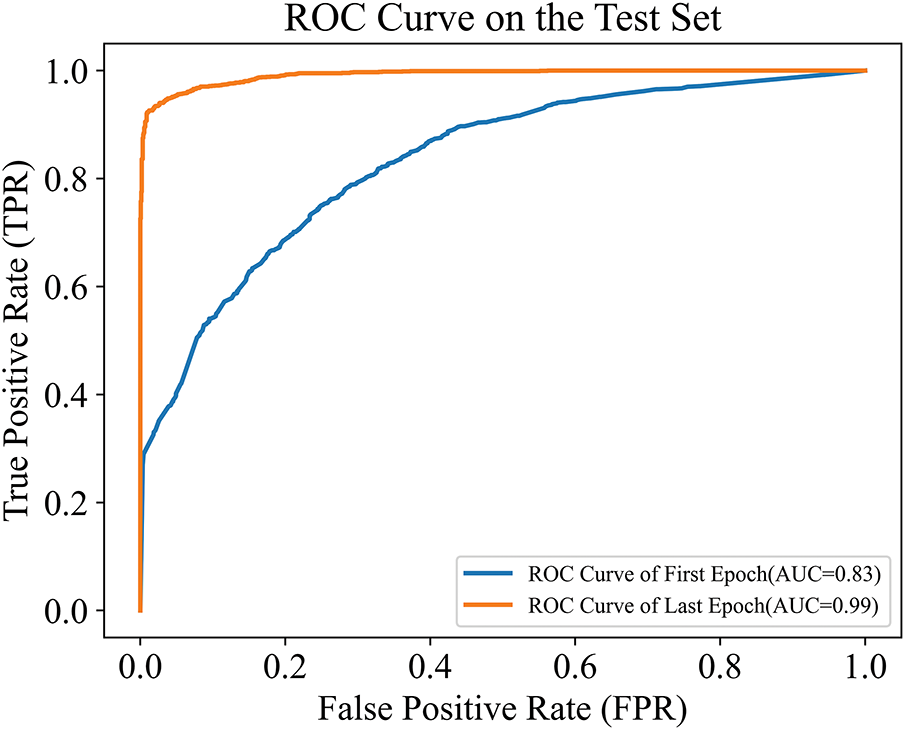
Figure 8: ROC curve on the test set (
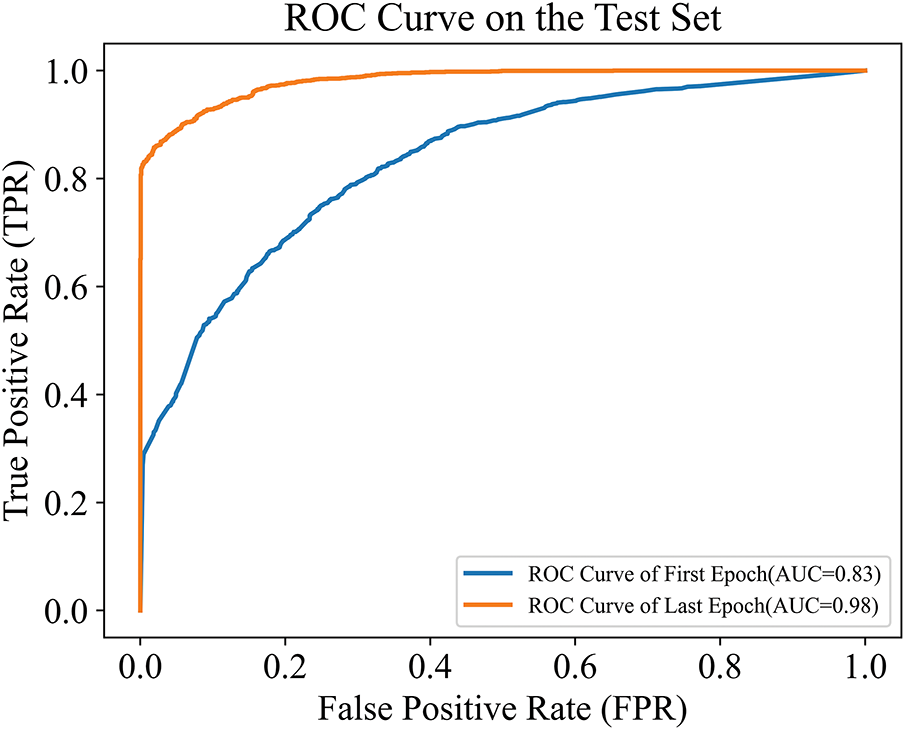
Figure 9: ROC curve on the test set (
To further verify that the active learning model can effectively filter out samples containing misleading information, manual intervention was applied to the labels of selected sample points. The actual fire occurrences of these samples were locally verified by experts, and their labels were manually altered—specifically, known fire samples were relabeled as low-risk. This experiment aimed to evaluate whether the active learning mechanism could correctly identify such mislabeled samples. The final results are presented in Table 2.

As part of the experimental design, the labels of 100 confirmed fire events were artificially altered to low-risk, thereby introducing misleading samples into the dataset. Results showed that, with
In addition to XGBoost, comparisons were made with other machine learning models recognized for their strong generalization performance, including ANN [21], Support Vector Machine (SVM) [28,30], RF [24,25], LR [17,20] and GBDT [30]. These models are widely used in forest fire prediction tasks. The evaluation results are shown in Table 3.

Results show that among the compared algorithms, RF and SVM perform well in terms of accuracy, with 79.6% and 78.3%, respectively. In contrast, Active-XGBoost method achieves an accuracy of 95.4%, demonstrating a significant advantage in overall prediction accuracy. Active-XGBoost model’s recall rate of 97.3% indicates its ability to accurately identify most high-risk samples. For the comparison models, the best-performing model is RF with a recall rate of 79.6%. Furthermore, Active-XGBoost significantly outperforms other compared models in precision Sensitivity, and Specificity.
3.3 Experiment on the Effectiveness of the Incremental Learning Mechanism
Building upon the model pre-trained on Region 1, incremental learning was conducted with samples from Regions 2 and 3. Figs. 10 and 11 show the accuracy improvement curves during the iterative incremental learning process in Region 2 and Region 3, respectively. As observed from the curves, the model accuracy rapidly increases and stabilizes after a few iterations. This confirms that our proposed incremental active learning approach remains effective in cross-regional scenarios and is capable of continuously improving model performance through iterative updates.
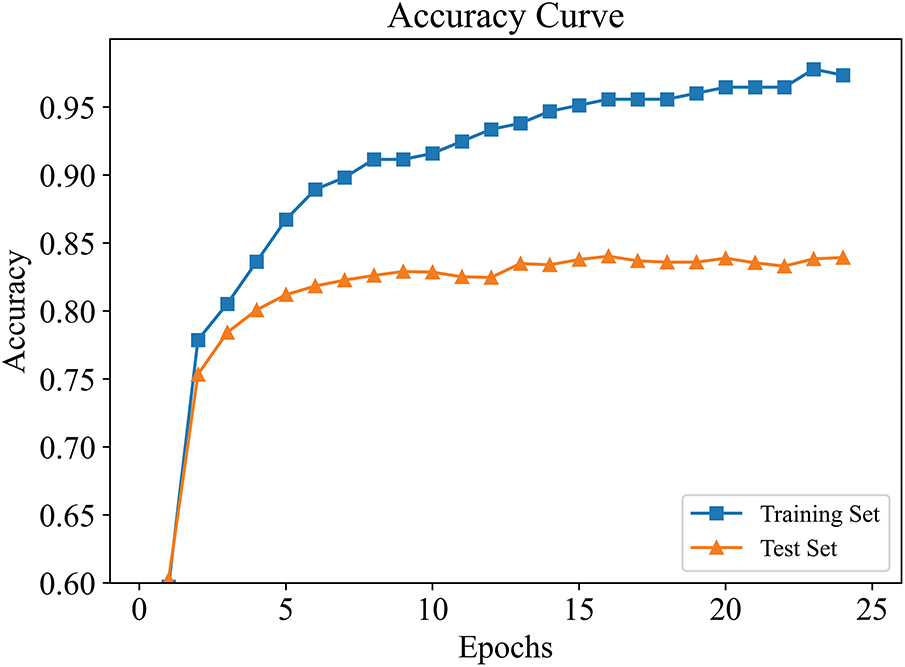
Figure 10: Accuracy improvement curve in Region 2
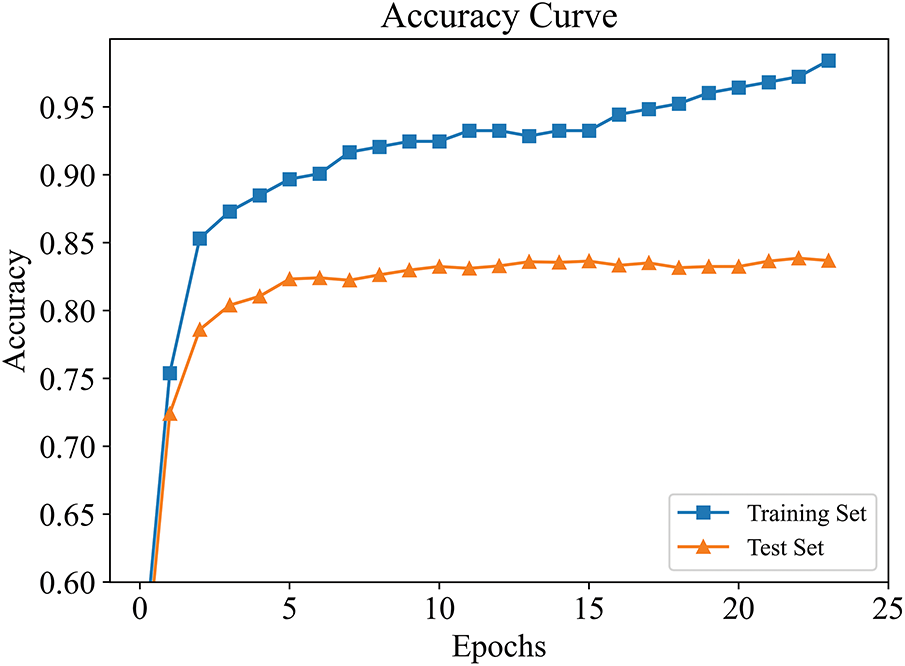
Figure 11: Accuracy improvement curve in Region 3
To further evaluate the effectiveness of the incremental learning approach, the performance of the proposed model with several baseline algorithms under varying training set sizes is compared. In the experiment, the proportion of the training set gradually increased from a minimum of 5% to a maximum of 80%. The performance curves, with the training set proportion on the horizontal axis and test accuracy on the vertical axis, are shown in Figs. 12 and 13, illustrating how each model performs under different levels of training data availability. Fig. 12 demonstrates the Accuracy Comparison in Region 2, while Fig. 13 illustrates the Accuracy Comparison in Region 3.
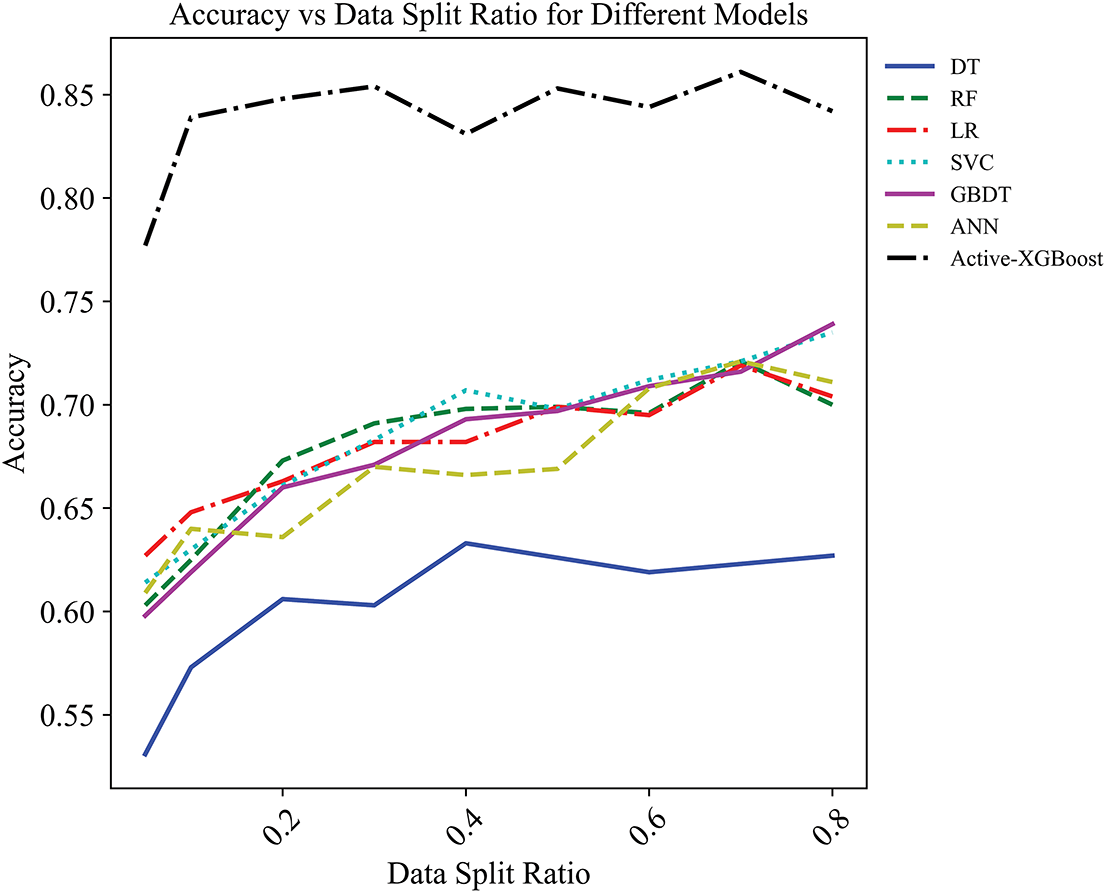
Figure 12: Accuracy comparison under different training set proportions in Region 2
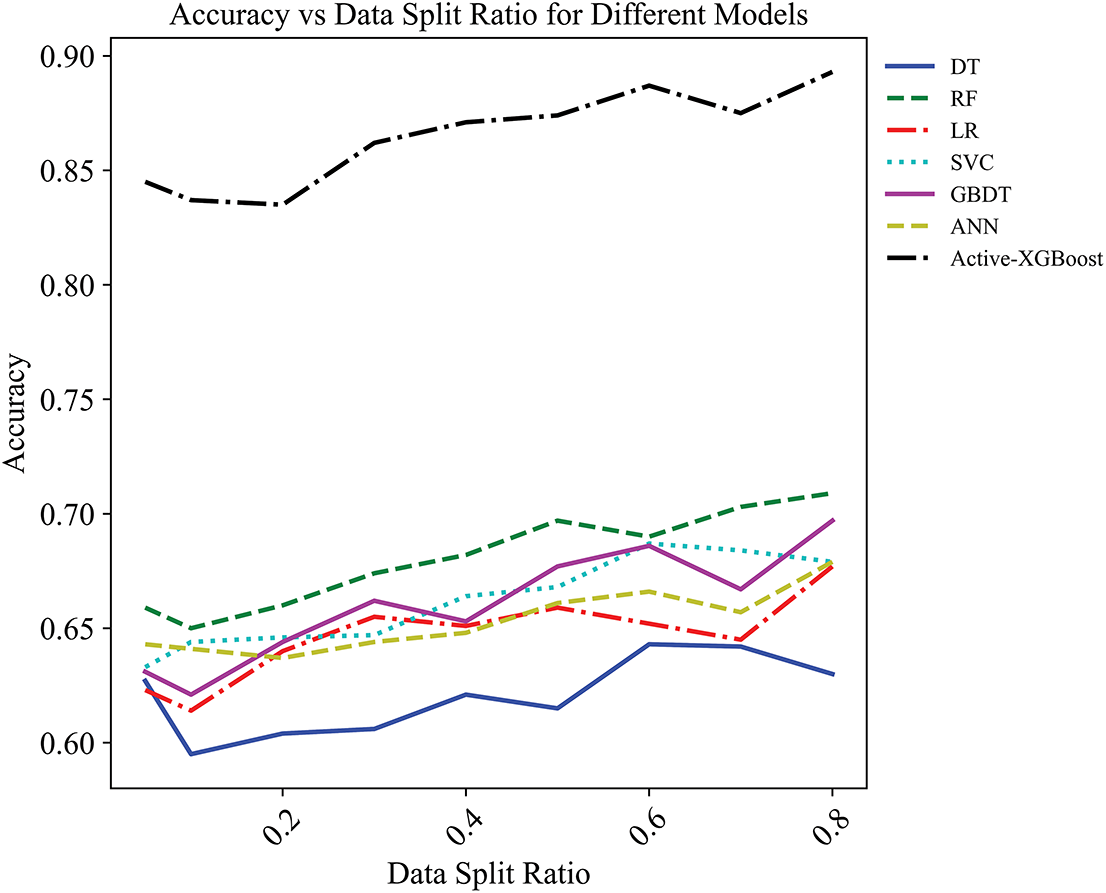
Figure 13: Accuracy comparison under different training set proportions in Region 3
Under training sets with identical sampling ratios, the accuracy of Active-XGBoost consistently outperforms that of the other models. It is worth noting that the Active-XGBoost demonstrates strong performance even with as little as 5% of the total labeled data. This indicates that our method is capable of achieving cross-regional generalization with only a small amount of annotated data. This characteristic holds significant practical value, especially in regions where labeled data are costly or difficult to obtain. By effectively leveraging limited data, the proposed approach substantially reduces the dependence on large-scale labeled datasets and enhances the model’s applicability and scalability across diverse regions.
Forestry departments often prioritize the collection of wildfire data. However, relying solely on this data fails to provide reliable labels that encompass both high and low-risk scenarios for data-driven fire risk prediction models. The unreliability of the data hampers the effectiveness of these models. To address this issue, this paper proposes an autonomous data acquisition method based on spatiotemporal data sampling. This method enables a convenient, intuitive, and highly interpretable way to autonomously categorize fire risk. Furthermore, an active learning strategy based on XGBoost is introduced, which identifies and filters out unreliable samples from the automatically categorized data. These samples are then re-labeled by experts or validated experience-based models. The updated samples are used to generate new sub-trees, which are integrated into XGBoost to enhance the model’s discriminative capabilities.
The experimental design consisted of two components to systematically evaluate the performance advantages of the proposed model and its generalization capability across multiple regions. In the experiments presented in Section 3.2, multiple performance metrics of Active-XGBoost were compared against several baseline models within Region 1. The results demonstrated that the integration of the active learning mechanism substantially improved model performance. Furthermore, the active learning process was visualized, and misleading samples were deliberately introduced to simulate real-world label noise. The outcomes confirmed the effectiveness of the mechanism in identifying and removing erroneous samples, thereby enhancing the robustness of the model. In addition, the functional role of key hyperparameters was revealed through experiments, showing that they can be used to regulate the degree of dependence of Active-XGBoost on prior knowledge, thus achieving a flexible balance between data-driven learning and experiential knowledge.
In Section 3.3, the cross-regional transferability of the model was further examined. Based on the model trained in Region 1, satisfactory classification performance was achieved in Regions 2 and 3 using only a small amount of labeled data. The overall performance was significantly superior to that of traditional models, as evidenced by the comparative results in Figs. 12 and 13. These experiments provide strong evidence of the proposed model’s effective generalization capability under varying regional conditions.
In summary, Active-XGBoost does not rely solely on either data-driven or knowledge-driven modeling; instead, it achieves an organic integration of the two through an active learning mechanism, thereby demonstrating distinctive advantages in improving data quality, enhancing model robustness, and facilitating cross-regional generalization.
It should be mentioned that the proposed method in this paper is evaluated by limited performance factors and criteria, e.g., limited granular environmental variables and explicitly marked semantic information. Hence, more performance factors and criteria could be integrated to further improve the reliability and generalizability of the proposed framework. Additionally, such a method can be generalized to solve the risk prediction problems in a broader scope of application scenarios, e.g., semiconductor manufacturing, wild target detection, and geological disaster monitoring. Accordingly, some future work could be XGBoost-based active learning for defect prediction in semiconductor manufacturing, threat prediction for wild camouflaged targets, and disaster prediction of terrain transformation.
Acknowledgement: Not applicable.
Funding Statement: This work was funded by the Natural Science Foundation of Guangxi Province (Grant AB24010157); Research Project of the Sichuan Forestry and Grassland Bureau (Grants G202206012 and G202206012-2); National Natural Science Foundation of China (Grants 32471878, 62373081, U2330206, U2230206 and 62173068); and Sichuan Science and Technology Program (Grants 2024NSFSC1483, 2024ZYD0156, 2023NSFC1962 and DQ202412).
Author Contributions: Conceptualization, Hang Geng, Hongrong Wang and Hanmin Sheng; Methodology, Hang Geng and Hongrong Wang; Software, Jing Yuan; Validation, Hongrong Wang, Jing Yuan and Wen Zhang; Formal analysis, Hanmin Sheng and Xinjian Li; Investigation, Hang Geng; Resources, Qiuhua Wang; Data curation, Wen Zhang; Writing—original draft preparation, Hongrong Wang; Writing—review and editing, Qiuhua Wang and Xinjian Li; Visualization, Xinjian Li and Hanmin Sheng; Supervision, project administration, Hang Geng. All authors reviewed the results and approved the final version of the manuscript.
Availability of Data and Materials: Due to the nature of this research, participants of this study did not agree for their data to be shared publicly, so supporting data is not available.
Ethics Approval: Not applicable.
Conflicts of Interest: The authors declare no conflicts of interest to report regarding the present study.
References
1. Pang Y, Li Y, Feng Z, Feng Z, Zhao Z, Chen S, et al. Forest fire occurrence prediction in china based on machine learning methods. Remote Sens. 2022;14(21):5546. doi:10.3390/rs14215546. [Google Scholar] [CrossRef]
2. Flannigan MD, Krawchuk MA, De Groot WJ, Wotton BM, Gowman LM. Implications of changing climate for global wildland fire. Int J Wildland Fire. 2009;18(5):483. doi:10.1071/wf08187. [Google Scholar] [CrossRef]
3. Wasserman TN, Mueller SE. Climate influences on future fire severity: a synthesis of climate-fire interactions and impacts on fire regimes, high-severity fire, and forests in the western United States. Fire Ecol. 2023;19(1):43. doi:10.1186/s42408-023-00200-8. [Google Scholar] [CrossRef]
4. Ma W, Feng Z, Cheng Z, Chen S, Wang F. Identifying forest fire driving factors and related impacts in China using random forest algorithm. Forests. 2020;11(5):507. doi:10.3390/f11050507. [Google Scholar] [CrossRef]
5. Clarke H, Nolan RH, De Dios VR, Bradstock R, Griebel A, Khanal S, et al. Forest fire threatens global carbon sinks and population centres under rising atmospheric water demand. Nat Commun. 2022;13(1):7161. doi:10.1038/s41467-022-34966-3. [Google Scholar] [PubMed] [CrossRef]
6. Senande-Rivera M, Insua-Costa D, Miguez-Macho G. Spatial and temporal expansion of global wildland fire activity in response to climate change. Nat Commun. 2022;13(1):1208. doi:10.21203/rs.3.rs-143619/v1. [Google Scholar] [CrossRef]
7. Abatzoglou JT, Kolden CA, Williams AP, Lutz JA, Smith AMS. Climatic influences on interannual variability in regional burn severity across western US forests. Int J Wildland Fire. 2017;26(4):269–75. doi:10.1071/WF16165. [Google Scholar] [CrossRef]
8. GB/T 36743-2018. Forest fire danger weather ratings. Beijing, China: China Standards Press; 2018. [Google Scholar]
9. Williams AAJ, Karoly DJ, Tapper N. The sensitivity of australian fire danger to climate change. Climatic Change. 2001;49:171–91. doi:10.1023/A:1010706116176. [Google Scholar] [CrossRef]
10. Hardy CC, Hardy CE. Fire danger rating in the United States of America: an evolution since 1916. Int J Wildland Fire. 2007;16(2):217. doi:10.1071/wf06076. [Google Scholar] [CrossRef]
11. Wang X, Wotton BM, Cantin AS, Parisien M-A, Anderson K, Moore B, et al. cffdrs: an R package for the Canadian forest fire danger rating system. Ecol Process. 2017;6(1):5. doi:10.1186/s13717-017-0070-z. [Google Scholar] [CrossRef]
12. Abid F. A survey of machine learning algorithms based forest fires prediction and detection systems. Fire Technol. 2021;57(2):559–90. doi:10.1007/s10694-020-01056-z. [Google Scholar] [CrossRef]
13. Lu Y, Li P, Wang P, Li T, Li G. A method of rice yield prediction based on the QRBILSTM-MHSA network and hyperspectral image. Comput Electron Agric. 2025;239:110884. doi:10.1016/j.compag.2025.110884. [Google Scholar] [CrossRef]
14. Coffield SR, Graff CA, Chen Y, Smyth P, Foufoula-Georgiou E, Randerson JT. Machine learning to predict final fire size at the time of ignition. Int J Wildland Fire. 2019;28(11):861–73. doi:10.1071/wf19023. [Google Scholar] [PubMed] [CrossRef]
15. Jain P, Coogan SCP, Subramanian SG, Crowley M, Taylor S, Flannigan MD. A review of machine learning applications in wildfire science and management. Environ Rev. 2020;28(4):478–505. doi:10.1139/er-2020-0019. [Google Scholar] [CrossRef]
16. Lin H, Liu X, Wang X, Liu Y. A fuzzy inference and big data analysis algorithm for the prediction of forest fire based on rechargeable wireless sensor networks. Sustain Comput Inform Syst. 2018;18:101–11. doi:10.1016/j.suscom.2017.05.004. [Google Scholar] [CrossRef]
17. Chang Y, Zhu Z, Bu R, Chen H, Feng Y, Li Y, et al. Predicting fire occurrence patterns with logistic regression in Heilongjiang Province. China Landscape Ecol. 2013;28(10):1989–2004. doi:10.1007/s10980-013-9935-4. [Google Scholar] [CrossRef]
18. Gao B, Shan Y, Liu X, Yin S, Yu B, Cui C, et al. Prediction and driving factors of forest fire occurrence in Jilin Province. China J For Res. 2023;35(1):21. doi:10.1007/s11676-023-01663-w. [Google Scholar] [CrossRef]
19. Tariq A, Shu H, Siddiqui S, Munir I, Sharifi A, Li Q, et al. Spatio-temporal analysis of forest fire events in the Margalla Hills, Islamabad, Pakistan using socio-economic and environmental variable data with machine learning methods. J Forestry Res. 2022;33(1):183–94. doi:10.1007/s11676-021-01354-4. [Google Scholar] [CrossRef]
20. Guo F, Zhang L, Jin S, Tigabu M, Su Z, Wang W. Modeling anthropogenic fire occurrence in the boreal forest of China using logistic regression and random forests. Forests. 2016;7(11):250. doi:10.3390/f7110250. [Google Scholar] [CrossRef]
21. Dimuccio LA, Ferreira R, Cunha L, Campar De Almeida A. Regional forest-fire susceptibility analysis in central Portugal using a probabilistic ratings procedure and artificial neural network weights assignment. Int J Wildland Fire. 2011;20(6):776. doi:10.1071/wf09083. [Google Scholar] [CrossRef]
22. Woolford DG, Martell DL, McFayden CB, Evens J, Stacey A, Wotton BM, et al. The development and implementation of a human-caused wildland fire occurrence prediction system for the province of Ontario, Canada. Canadian J Forest Res. 2021;51(2):303–25. doi:10.1139/cjfr-2020-0313. [Google Scholar] [CrossRef]
23. Phelps N, Woolford DG. Comparing calibrated statistical and machine learning methods for wildland fire occurrence prediction: a case study of human-caused fires in Lac La Biche, Alberta, Canada. Int J Wildland Fire. 2021;30(11):850–70. doi:10.1071/wf20139. [Google Scholar] [CrossRef]
24. Shao Y, Feng Z, Cao M, Wang W, Sun L, Yang X, et al. An ensemble model for forest fire occurrence mapping in China. Forests. 2023;14(4):704. doi:10.3390/f14040704. [Google Scholar] [CrossRef]
25. Singh M, Huang Z. Analysis of forest fire dynamics, distribution and main drivers in the atlantic forest. Sustainability. 2022;14(2):992. doi:10.3390/su14020992. [Google Scholar] [CrossRef]
26. He W, Shirowzhan S, Pettit CJ. GIS and machine learning for analysing influencing factors of bushfires using 40-year spatio-temporal bushfire data. ISPRS Int J Geo-Inf. 2022;11(6):336. doi:10.3390/ijgi11060336. [Google Scholar] [CrossRef]
27. Wu X, Zhang G, Yang Z, Tan S, Yang Y, Pang Z. Machine learning for predicting forest fire occurrence in Changsha: an Innovative investigation into the introduction of a forest fuel factor. Remote Sens. 2023;15(17):4208. doi:10.3390/rs15174208. [Google Scholar] [CrossRef]
28. Gigović L, Pourghasemi HR, Drobnjak S, Bai S. Testing a new ensemble model based on SVM and random forest in forest fire susceptibility assessment and its mapping in Serbia’s Tara National Park. Forests. 2019;10(5):408. doi:10.3390/f10050408. [Google Scholar] [CrossRef]
29. Mohajane M, Costache R, Karimi F, Bao Pham Q, Essahlaoui A, Nguyen H, et al. Application of remote sensing and machine learning algorithms for forest fire mapping in a Mediterranean area. Ecol Indic. 2021;129(1):107869. doi:10.1016/j.ecolind.2021.107869. [Google Scholar] [CrossRef]
30. Tan C, Feng Z. Mapping forest fire risk zones using machine learning algorithms in hunan province. China Sustainability. 2023;15(7):6292. doi:10.3390/su15076292. [Google Scholar] [CrossRef]
31. Wu X, Xiao L, Sun Y, Zhang J, Ma T, He L. A survey of human-in-the-loop for machine learning. Future Generat Comput Syst. 2022;135:364–81. doi:10.1016/j.future.2022.05.014. [Google Scholar] [CrossRef]
32. Liao B, Zhou T, Liu Y, Li M, Zhang T. Tackling the wildfire prediction challenge: an explainable artificial intelligence (XAI) model combining extreme gradient boosting (XGBoost) with SHapley Additive exPlanations (SHAP) for enhanced interpretability and accuracy. Forests. 2025;16(4):689. doi:10.3390/f16040689. [Google Scholar] [CrossRef]
Cite This Article
 Copyright © 2025 The Author(s). Published by Tech Science Press.
This work is licensed under a Creative Commons Attribution 4.0 International License , which permits unrestricted use, distribution, and reproduction in any medium, provided the original work is properly cited.
 Downloads
 Citation Tools