
 Submit a Paper
 Propose a Special lssue
 Open Access
ARTICLE
Optimizing Performance Prediction of Perovskite Photovoltaic Materials by Statistical Methods-Intelligent Calculation Model
1 School of Mathematics & Statistics, Ping Ding Shan University, Pingdingshan, 467000, China
2 Yaoshan Lab, Ping Ding Shan University, Pingdingshan, 467000, China
3 Department of Information Technology, Walchand College of Engineering, Sangli, 416415, Maharashtra, India
4 College of Shipbuilding Engineering, Harbin Engineering University, Harbin, 150001, China
* Corresponding Author: Wei-Chiang Hong. Email:
(This article belongs to the Special Issue: Advanced Artificial Intelligence and Machine Learning Methods Applied to Energy Systems)
Computer Modeling in Engineering & Sciences 2025, 145(3), 3813-3837. https://doi.org/10.32604/cmes.2025.073615
Received 22 September 2025; Accepted 17 November 2025; Issue published 23 December 2025
 View Full Text
 Download PDF
Abstract
Accurate prediction of perovskite photovoltaic materials’ optoelectronic properties is crucial for developing efficient and stable materials, advancing solar technology. To address poor interpretability, high computational complexity, and inaccurate predictions in relevant machine learning models, this paper proposes a novel methodology. The technical route of this paper mainly centers on the random forest-knowledge distillation-bidirectional gated recurrent unit with attention technology (namely RF-KD-BIGRUA), which is applied in perovskite photovoltaic materials. Primarily, it combines random forest to quantitatively assess feature importance, selecting variables with significant impacts on photoelectric conversion efficiency. Subsequently, statistical techniques analyze the weight distribution of variables influencing power conversion efficiency (PCE, %) to extract key features. In the model optimization phase, knowledge distillation transfers features from complex teacher models to student models, enhancing prediction accuracy. Additionally, Bidirectional Gated Recurrent Unit with Attention technology (BiGRU-Attention) is introduced to further optimize predictive performance while substantially reducing computational costs. The results demonstrate that integrating statistical techniques into intelligent optimization models can quantify photovoltaic system uncertainties and reduce prediction errors before experimental fabrication, enabling efficient pre-fabrication screening of perovskite materials that meet energy-storage criteria and providing accurate guidance for material selection.Keywords
The intensification of energy shortage problems has accelerated the global push for clean energy technological innovation, spurring the rapid development of photovoltaic technology for the efficient conversion of renewable energy. Among these innovations, perovskite photovoltaic materials [1] have become a focal point in the field of photovoltaics due to their high efficiency and low cost. Nevertheless, the present paucity of interpretability in machine learning (ML) models [2] has resulted in suboptimal efficiency in the selection of perovskite photovoltaic battery materials. Consequently, the screening of significant feature variables to enhance the performance of predictive models, reduce prediction errors, alleviate the experimental burden, and improve selection efficiency represents a pivotal direction and opportunity for China’s photovoltaic industry [3].
It is anticipated that the market for perovskite solar cells will expand quickly due to the continuous global research and development of renewable energy technologies. The use of this clean energy technology is expected to become more and more important in lowering the carbon footprint of the world [4]. Chalcogenide photovoltaic (PV) cells, on the other hand, have become a major area of study because of their proven high photoelectric conversion efficiency. Historically, the selection of high-performance perovskite photovoltaic materials [5,6] has relied on lengthy and often inefficient experimental processes that lacked systematic methods for predicting and optimizing material properties. However, with the substantial accumulation of both experimental and computational data [7], alongside the gradual maturation of ML techniques, this led to the notable integration of ML approaches into the development of perovskite photovoltaic materials. These studies use ML to conduct comprehensive analyses regarding how characteristic variables influence PCE, as well as to predict PCE. This facilitates targeted material design and optimization [8,9]. In this process, statistical analysis plays a crucial role. It not only provides a data foundation for ML models but also helps researchers extract valuable information from massive datasets, thereby enabling more accurate predictions of material properties. In the field of predicting perovskite photovoltaic material performance, researchers have utilized diverse ML models, including random forest (RF) [10–12], support vector machine (SVM) [13,14]. Tao et al. [15] compiled and analyzed applications of ML in large-scale screening and rational design of perovskite photovoltaic materials, offering insights into the prospects for ML within this field. Kusuma et al. [16] employed ML techniques to analyze the structure of high-efficiency perovskite solar cells (PSCs), revealing new, efficient configurations that improve device performance. Meanwhile, Mishra et al. [17] selected perovskite materials with suitable band gaps and then simulated and analyzed the performance of corresponding devices under indoor lighting conditions. In predicting device performance parameters, Lu et al. [18] employed ML-guided inverse design for PSCs, reducing experimental redundancy while accelerating efficient material screening via pre-experimental statistical analysis. This approach provides a vital foundation for the ML-based prediction of perovskite photovoltaic material performance PCE before experimentation. Alfares et al. [19] applied Bayesian-optimized ML to multi-feature perovskite data (ionic/bulk properties), enhancing lattice constant prediction accuracy. These investigations demonstrate that statistical analysis can aid researchers in extracting valuable insights from limited data, while also establishing a scientific basis for model optimization and validation. In examining the hole transport layer (HTL) in carbon-based perovskite solar cells (C-PSCs), Valsalakumar et al. [20] verified that the application of ML has been instrumental in streamlining the optimization process, reducing dependence on traditional trial-and-error methodologies, and facilitating a deeper understanding of the interdependencies among critical device parameters. These investigations further highlight the importance of statistical methods in optimizing material performance. Nevertheless, there are still several key challenges, such as improving the efficiency and accuracy of statistical analyses within optimization processes and utilizing statistical methods more effectively to tackle multi-parameter optimization issues.
As stated in the aforementioned foreign papers, ML algorithms play a crucial role in the research of perovskite solar cell materials and battery structures. To improve the efficiency and stability of perovskite solar cells, researchers have focused on exploring a series of parameters, including the thickness of the absorption layer and the materials used for the HTL and electron transport layer (ETL).
Many researchers have combined different intelligent models with ML algorithms to enhance predictive accuracy and efficiency. For example, Tian et al. [21] developed a transfer learning model for perovskite thickness prediction, overcoming data scarcity by leveraging diverse bandgap material datasets to enhance accuracy. Mannodi-Kanakkithodi and Chan [22] employed DFT to study halide perovskite impurities; integrating these results with ML and statistics enables rapid identification of optically active defects. These impurities can be introduced deliberately to modulate perovskite conductivity and optimize photovoltaic absorption performance. Additionally, Bak et al. [23] developed a k-fold cross-validated deep learning approach to rapidly optimize tin-based perovskite solar cell (SnPSC) structures. This approach leverages limited experimental data on SnPSC while maximizing prediction accuracy through rigorous statistical optimization techniques. While existing studies demonstrate robust statistical validation, advancing accuracy and reliability remains crucial, particularly for small datasets and multi-parameter optimization. Further research is needed to refine these statistical approaches.
The Ayad et al. [24] team has systematically studied the influence mechanisms of absorber layer thickness, defect density, and temperature on battery performance, providing a preliminary research foundation for the experimental construction of the proposed structure. The selection of this structure is based on three major advantages: higher energy conversion efficiency, simple deposition process, and market-accessible low-cost material system. In contrast, our team has deeply explored the action laws of 14 key material parameters, such as high open-circuit voltage (Voc), short-circuit current density (Jsc), fill factor (FF), and the thickness of the compatible HTL on the PCE. The core advantages of the selected structure lie in: (1) Minimizing efficiency loss through narrow-bandgap material screening, optimizing the effective area of the battery, and controlling the thickness of the back ETL; (2) Constructing a closed-loop iterative development system based on large-scale model integration, providing a dynamic optimization path for material reverse engineering. This study not only quantifies the correlation between material parameters and PCE but also deeply couples theoretical research with application requirements through engineering design, establishing a multi-dimensional evaluation framework for the efficient screening of perovskite photovoltaic materials.
Taken together, despite the substantial progress that has been made in researching perovskite photovoltaic materials to date, there are still several urgent challenges that require immediate attention. There is a need to enhance the integration of experimental and computational data to improve the accuracy of predictive models, to develop ML algorithms specifically designed for small-sample datasets to mitigate limitations arising from restricted experimental data availability, and to further optimize ML models to improve both prediction efficiency and accuracy.
1.2 Research Motivation and Innovation
Currently, challenges remain in the performance prediction and optimization of perovskite photovoltaic cells, which hinder the accuracy and efficiency of PCE prediction for perovskite photovoltaic materials as well as the selection and optimization of these materials. Primary among the challenges is the influence of multiple characteristic factors on photovoltaic conversion efficiency, which significantly compromises model prediction accuracy. Concurrently, the inherent uncertainty of PV systems contributes to prediction inaccuracies and heightened error susceptibility. Furthermore, prevailing machine learning models face dual limitations of inadequate interpretability and computational complexity, ultimately diminishing experimental efficiency while increasing operational costs.
(1) To address the challenges posed by the high dimensionality of characteristic variables and the unclear underlying mechanisms in photovoltaic material performance prediction, we propose a collaborative “data-algorithm” dual-driven analytical framework. Random forest models was integrated with statistical validation methods, including 10-fold cross-validation, to develop a robust feature importance ranking-based variable selection mechanism. This approach enables the precise identification of key factors governing PCE.
(2) To overcome the persistent accuracy limitations of lightweight models, we propose a knowledge distillation framework. By developing a teacher-student knowledge transfer framework incorporating a BiGRU-Attention temporal feature extraction module, this method significantly improves prediction accuracy while maintaining low parameter complexity, thereby effectively addressing the fundamental trade-off between model compression and performance preservation.
(3) To tackle the critical industrial challenges in new material discovery, particularly prolonged development cycles and excessive trial-and-error costs, we developed a tripartite intelligent research and development system integrating statistical analysis, machine learning, and model distillation. This integrated framework utilizes variable importance analysis to optimize experimental design while leveraging high-performance predictive models for accelerated material screening. Practical implementations demonstrate substantial reductions in both development cycles and empirical optimization costs, thereby offering a robust technical foundation for the commercialization of perovskite photovoltaic materials.
The rest of this paper is as follows. The second part presents the methodology of the model. The third part discusses in detail the complex variables of perovskite PV materials and the application of the coupled intelligent model in predicting photoelectric performance. The method is also verified through experiments. The fourth part summarizes the research content of this paper.
The random forest algorithm efficiently reduces dimensionality by evaluating feature importance, enabling rapid screening and elimination of redundant features to enhance both model performance and efficiency. In this study, the prediction accuracy and efficiency of the model were improved by identifying and removing feature variables that have minimal impact on model prediction performance. The random forest algorithm consists of steps such as sampling, tree building, repetition, and aggregation, specifically as follows:
Step 1: Construct decision trees. Multiple decision trees are trained based on sub-datasets obtained through random sampling. Each tree is generated from an independent sample subset drawn with replacement from the original dataset. For each sample set, the mean squared error (MSE) of its out-of-bag (OOB) data needs to be calculated using Eq. (1).
where
Step 2: Random permutation of feature variables. For each tree in the random forest, select one feature and randomly permute the corresponding feature of its OOB data samples to generate a new test dataset. Then, use the random forest model to make predictions and calculate the new MSE of the OOB data.
Step 3: Calculate feature importance. The importance of each feature variable is determined by comparing the changes in MSE of the OOB data before and after permutation. For each feature
where
Step 4: Feature comparison and ranking. The importance scores of each feature are normalized for comparison and ranking. The normalized feature importance
where
The random forest algorithm efficiently reduces dimensionality by evaluating feature importance, enabling rapid screening and elimination of redundant features to enhance both model performance and efficiency.
K-fold cross-validation splits the dataset multiple times into training and testing sets according to a predetermined proportion, ensuring that all data can alternately participate in model training and validation. This fully exploits the value of limited-sample datasets and significantly enhances the model’s generalization performance. As a special case of k-fold cross-validation, the principle of ten-fold cross-validation can be intuitively demonstrated in Fig. 1
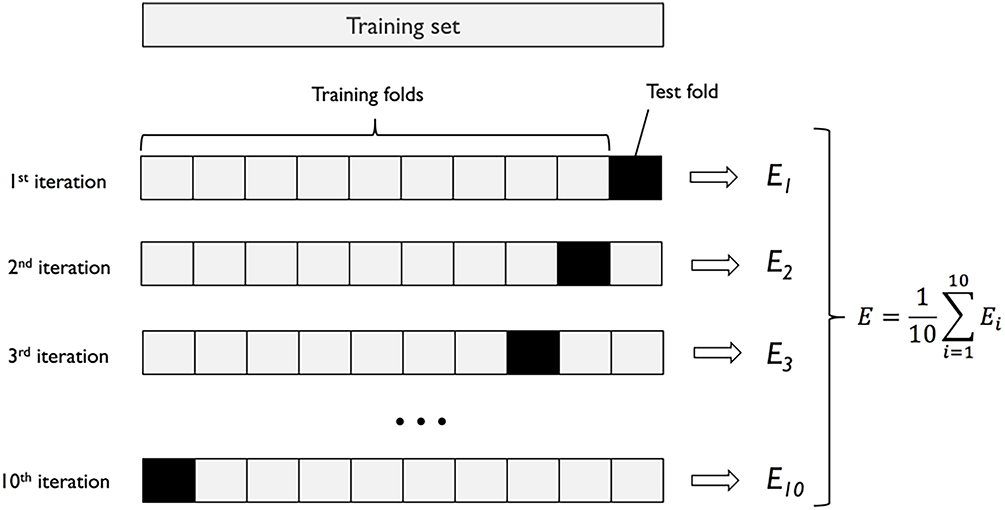
Figure 1: The principle of ten-fold cross-validation
2.3 Knowledge Distillation Optimization
Knowledge distillation is a process that involves the transfer of knowledge from a complex model (the teacher model) to a simpler model (the student model). The objective of this process is to maintain or enhance performance while reducing model complexity.
Source of distilled knowledge
The “knowledge” used for distillation in this study originates from the output of the optimized random forest regression model (teacher model). Specifically, when the teacher model processes 14 key feature variables (screened by Random Forest), it outputs predicted values of power conversion efficiency (PCE, %). These predictions encapsulate the intrinsic mapping relationship between material/device features and PCE, which constitutes the core knowledge transferred to the student model.
Loss function for student model training
Since PCE prediction is a regression task, the total loss function for training the lightweight student model (a compact neural network) is a weighted sum of two components, ensuring the student model not only mimics the teacher model’s knowledge but also aligns with actual PCE values:
(1) Distillation loss
This loss quantifies the difference between the PCE predictions of the teacher and student models, calculated using Mean Squared Error (MSE):
where n is the number of samples,
(2) Regression loss
This loss measures the deviation between the student model’s PCE predictions and the actual PCE values, also calculated using MSE:
where
(3) Total loss function
The total loss balances the contribution of distillation loss and regression loss via a hyperparameter α determined as 0.3 through experiments:
In this study, the Knowledge distillation optimization algorithm was employed to intelligently enhance the performance of the Random forest model. The enabling of the student model to learn the features of the teacher model has been demonstrated to result in a more accurate capture of the intrinsic structure of the data. This, in turn, has been shown to determine the optimal combination of model parameters and improve the algorithm’s predictive capabilities on both the training and test sets, as well as the model’s generalization ability.
The BiGRU-Attention model is a deep learning model that integrates BiGRU with the Attention mechanism, rendering it particularly suitable for processing sequential data. BiGRU, a variant of a recurrent neural network (RNN), possesses a bidirectional structure that facilitates the capture of long-term dependencies in temporal data. Concurrently, the Attention mechanism facilitates the model’s concentration on the salient components of the input data, thereby enhancing the precision of predictions. To compensate for the distillation loss of logical units in the network output from the teacher to the student end, this study proposes the research idea of the BiGRU-Attention model, with specific steps as follows:
Step 1: The process of data preprocessing is an essential step in the data science workflow. The raw data are then transformed into a format that can be processed by the model. The dataset is divided into training and testing sets at a ratio of 80% and 20%, respectively.
Step 2: Definition of the distillation loss function for regression tasks. Since the prediction of PCE is a regression problem, we employ a mean squared error (MSE)-based knowledge distillation loss to align the outputs of the student model with those of the teacher model. The distillation loss is defined as:
where
Step 3: Training the teacher model on the target dataset. The BiGRU-Attention architecture is designed to optimize the initial parameters of the student model. Only the parameters of the student model are updated; the parameters of the teacher model are fixed. Both the task-specific loss and the distillation loss are computed simultaneously during the forward pass; the student model’s parameters are optimized during the backward pass.
The above content informs the research idea of the RF-KD-BiGRUA model proposed by this study.
Step 1: Data preprocessing. The historical dataset of perovskite photovoltaic materials is meticulously curated from the Perovskite Database. Through rigorous preprocessing protocols encompassing data cleansing, missing value treatment, and standardization procedures, a high-quality dataset is established to facilitate reliable subsequent investigations.
Step 2: Based on the random forest algorithm, n high-importance features were selected from the initial m variables, achieving a focus from a broad feature space to a key feature subset. Using the screened features, a random forest regression model was constructed for predicting the performance of perovskite photovoltaic materials. The model parameters were optimized through 10-fold cross-validation, significantly enhancing its generalization capability and predictive stability.
Step 3: Model complexity optimization. The knowledge distillation technique is implemented to transfer learning from the ten-fold cross-validated optimal model to a more compact architecture, achieving parameter efficiency without significant performance degradation.
Step 4: To further compensate for potential performance loss incurred from the initial distillation and enhance prediction stability, we adopt a more powerful BiGRU-Attention (Bidirectional Gated Recurrent Unit-Attention) model, which deeply optimizes the student model by minimizing a combined loss function, ultimately yielding a high-precision and efficient prediction model.
The modelling process is illustrated in Fig. 2.
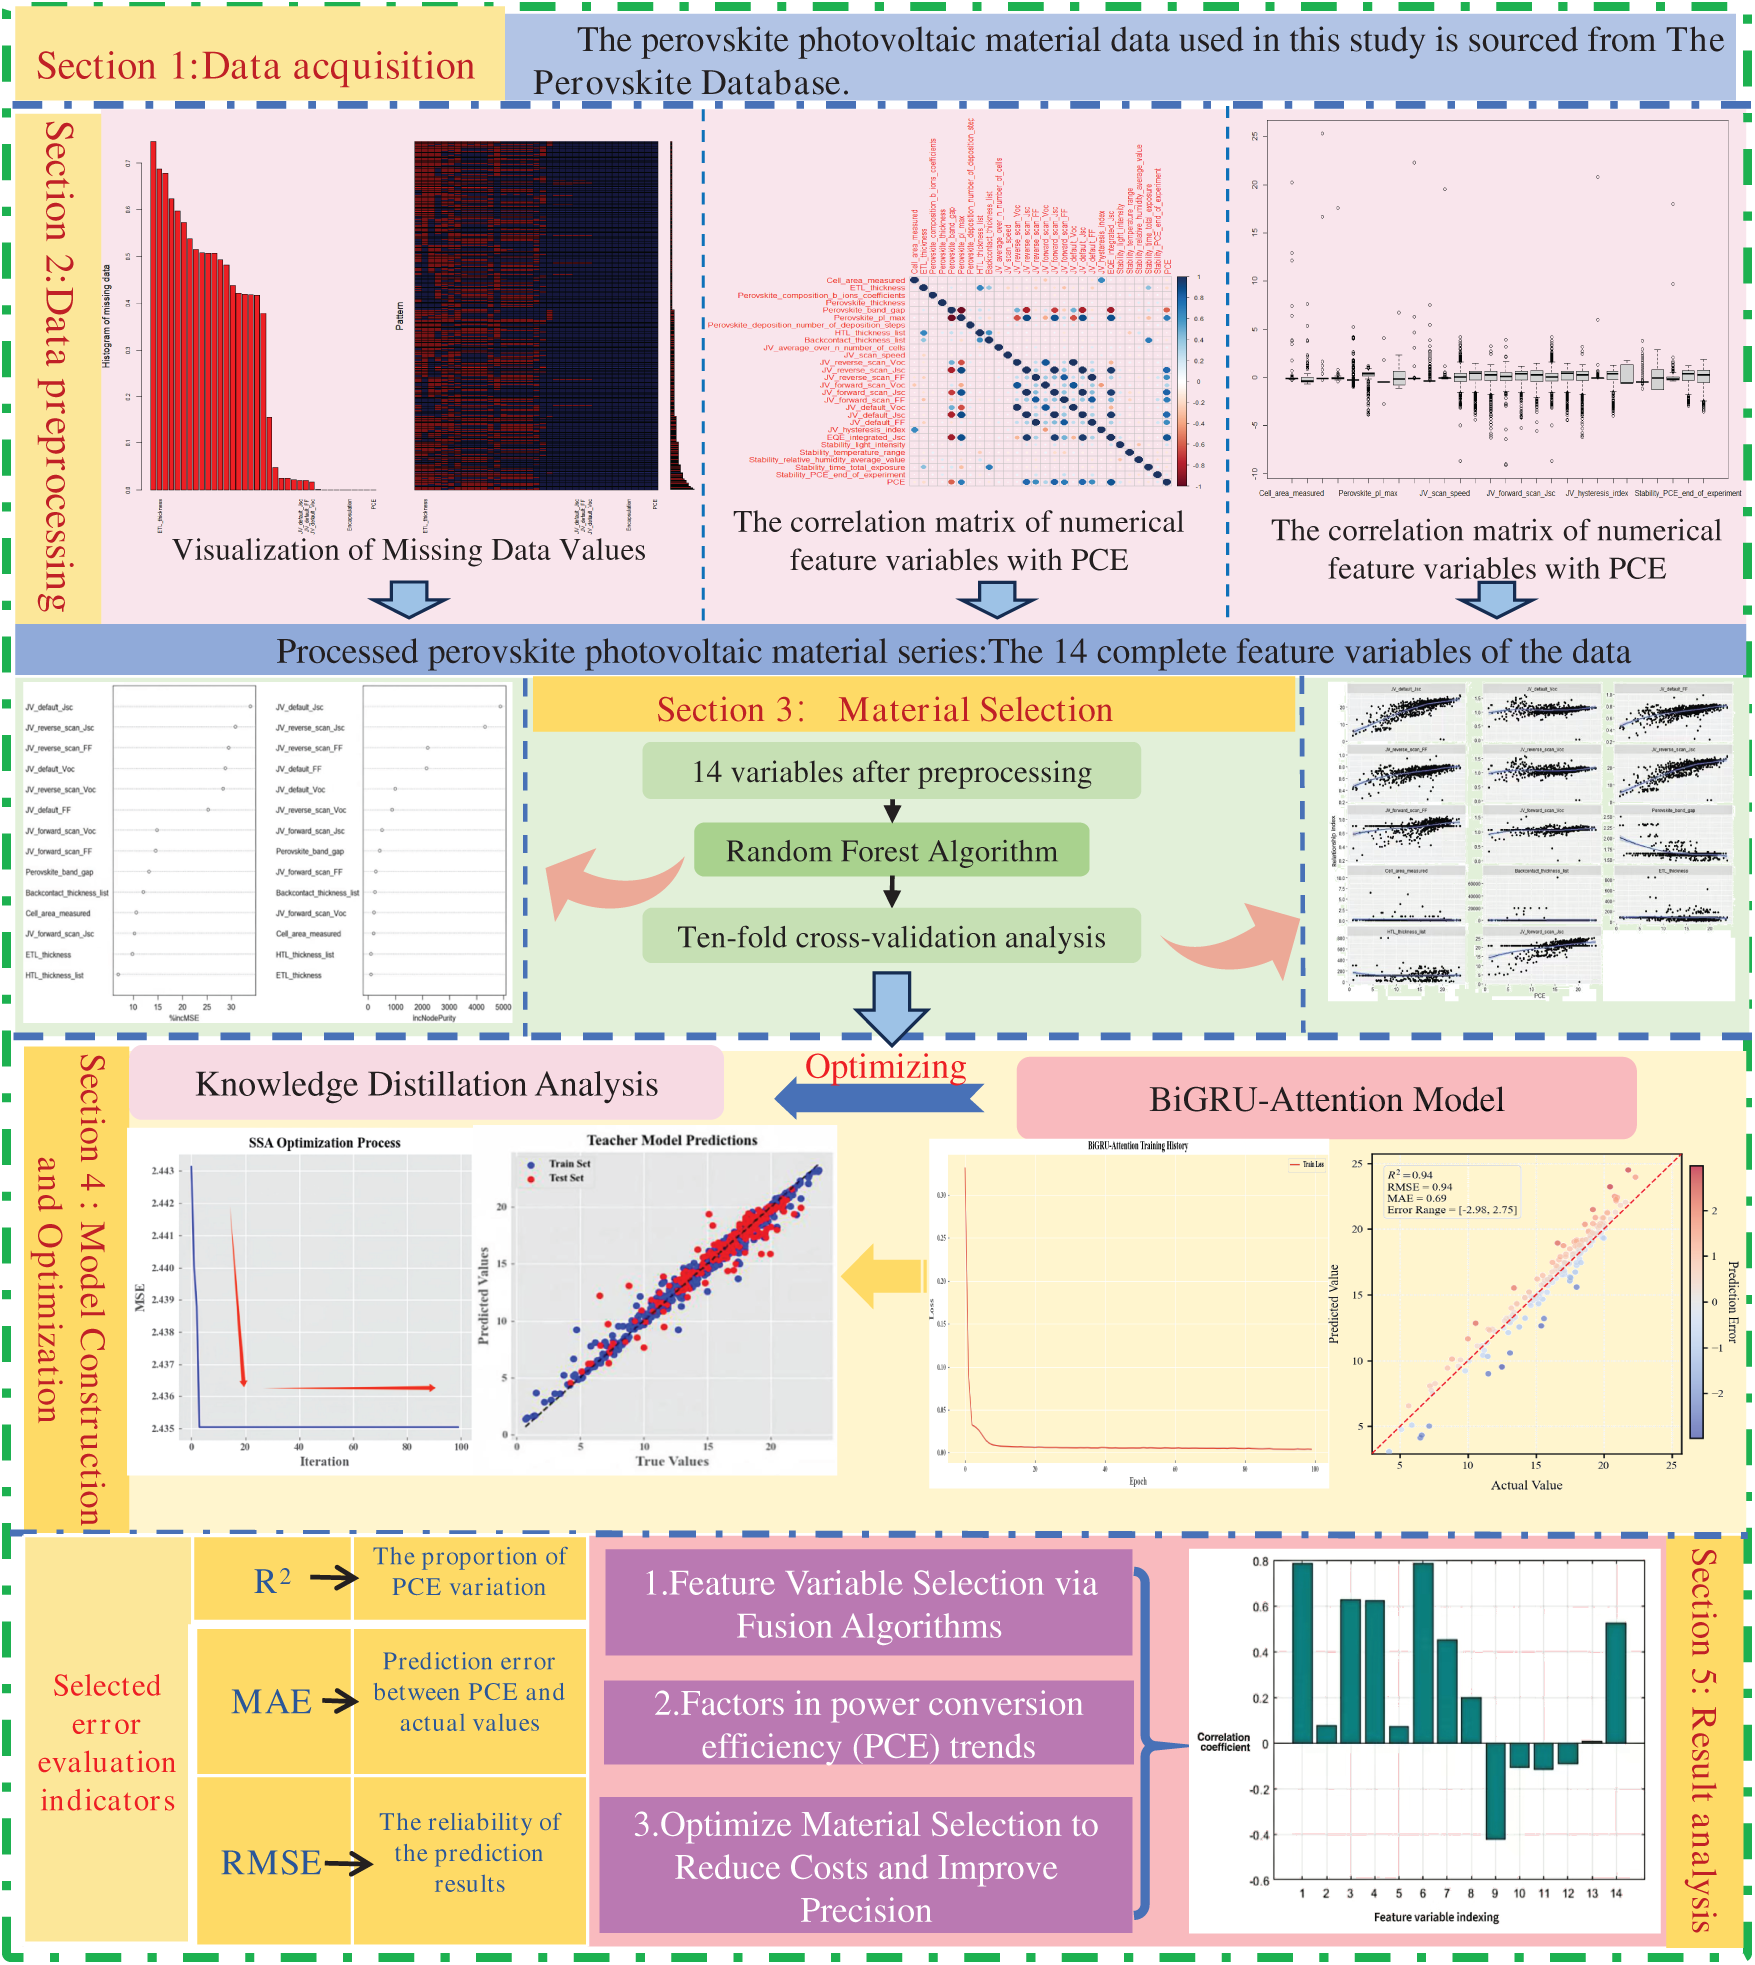
Figure 2: Technical flowchart of the RF-KD-BIGRUA in perovskite photovoltaic materials
3.1 Data Sources and Explanation
The Perovskite photovoltaic material data employed in this study were sourced from The Perovskite Database [25], a comprehensive repository containing detailed characterization parameters for perovskite photovoltaic materials. The database encompasses various characteristics of perovskite photovoltaic materials, including: fundamental cell parameters, substrate materials, properties of both compact and mesoporous n-type electron transport layers (ETLs), perovskite characteristics, p-type HTL properties, back contact electrodes, encapsulation materials, as well as device characteristics during current density-voltage (J-V) measurements, external quantum efficiency (EQE) measurements, and stability tests. This rich dataset enables researchers to employ ML techniques to identify subtle patterns and correlations that emerge only in large-scale analyses. By facilitating data-driven discoveries, the database not only advances current perovskite research but also establishes a robust foundation for future technological developments in this field.
3.2 Input Features and Target Variable
This study aims to construct a predictive model that maps material and structural features to final performance. All variables are explicitly defined in Table 1 below.
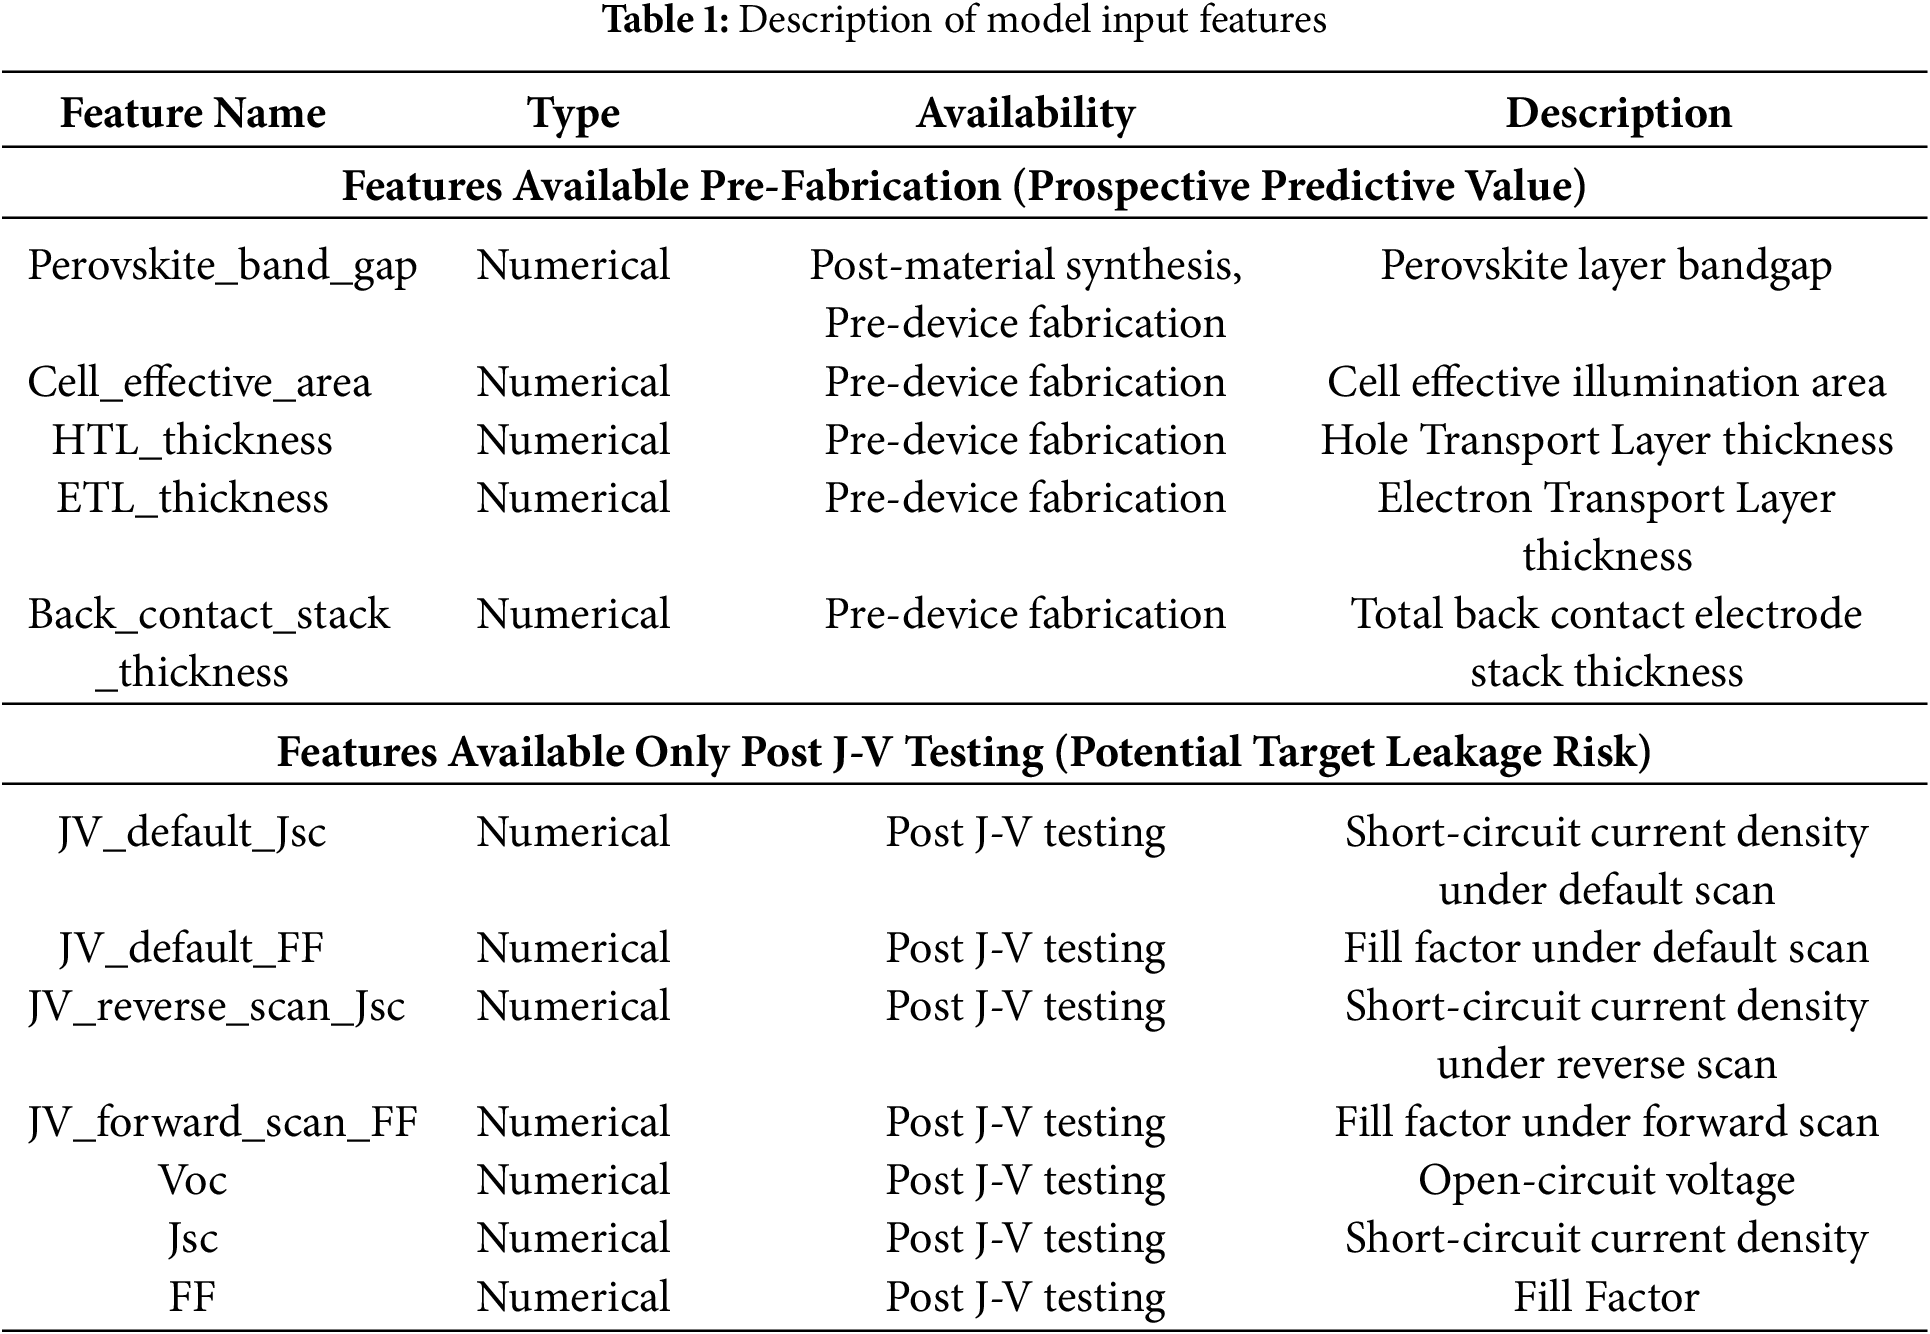
Target variable: PCE, which is the output of the model.
Input features: Initially, 36 features were selected from the perovskite database. After preprocessing and feature selection, the features used to build the final model can be divided into the following two categories, and the time points at which they are acquired are crucial to the practical application value of the model:
Based on the aforementioned classification, we have repositioned the core value of our framework. We emphasize that the ultimate objective of the model is to achieve high-performance prediction by prioritizing the use of Category Jia features (those available pre-fabrication). Our ablation experiments demonstrate that even when Category Yi features are entirely excluded (i.e., using only Category Jia features), the model retains meaningful predictive capability (R² = 0.6459). This validates the potential of our framework as a prospective screening tool, enabling early-stage performance assessment and selection based on material and structural design parameters, rather than functioning merely as a post-hoc predictor reliant on final electrical test results.
Before commencing the research, data preprocessing must be meticulously executed, encompassing missing value imputation, outlier detection and remediation, and standardized data normalization procedures.
Missing value treatment: Due to excessive missing values in some battery sample data within the dataset, samples with substantial missing values were removed, ensuring that each sample retained the corresponding photovoltaic conversion efficiency. This process yielded a dataset comprising 981 perovskite photovoltaic cell samples. For visualization of missing values, feature variables with correlation coefficients below 0.1 were assumed to be irrelevant and excluded from further analysis. Missing values in the remaining relevant features were imputed using the mean values of their respective columns.
For categorical features, missing values are first replaced with “Unknown” to ensure information integrity, followed by the use of One-Hot Encoding to convert these categorical features into dummy variables; for the remaining relevant numerical features, their missing values are imputed using the mean value of the corresponding feature column.
Outlier handling: To prevent abnormal data from impairing model training performance and increasing prediction errors, this study uses the K-nearest neighbor (KNN) imputation method for dataset outliers, with a unified strategy for outliers and missing values: calculating Euclidean distances between target samples and others, selecting K most similar neighbors, and generating replacement values via weighted averaging. To quantify the method’s sensitivity, variations in imputation results under K = 3, 5, 7, 9 were analyzed-yielding a variance of 778,243.25, standard deviation of 882.18, and range of 2295.33, confirming significant impacts of K selection. Further verification via model fitting errors (training a simple linear model and comparing MAE) showed K = 5 minimized prediction error (MAE = 0.31) and reduced distribution deviation from original data to 32%, thus being determined as the optimal K value.
Data standardization: Before building a machine learning model, in order to reduce the differences between feature variables of different dimensions, ensure that each feature variable contributes equally to the model, and improve model convergence speed and prediction accuracy, the data after handling missing values and outliers is subjected to standardized preprocessing, as shown in Eq. (8).
where x represents the original data of the feature variable, μ denotes the mean value, and σ stands for the standard deviation.
Standardized data facilitates comparison and processing because all features now share the same scale. Each data point reflects the magnitude of the data relative to the mean: values greater than 0 indicate higher than the mean, values less than 0 signify lower than the mean, and a value of 0 means the data point equals the mean.
3.4 The Original Random Forest
In terms of feature variable ranking and preliminary screening of key variables, this paper selected 36 numerical or categorical features, including the effective area of Perovskite photovoltaic cells, cell structure, ETL, Perovskite absorption layer, HTL, back contact electrode, polycrystalline characteristics, encapsulation conditions, and various characteristics measured under three different conditions of J-V, EQE, and stability, as well as the corresponding PCE values. The preprocessed data of 14 feature variables were used as inputs, and the corresponding PCE values were used as outputs to construct a random forest model for measuring feature variable importance and performing feature importance analysis. The overall explanatory rate of all feature variables used for regression on the variance of the target variable PCE was 89.7%. There is a close correlation between the feature variables of Perovskite solar cell materials and PCE values. Fig. 3 shows the results of the feature importance analysis by the random forest algorithm.
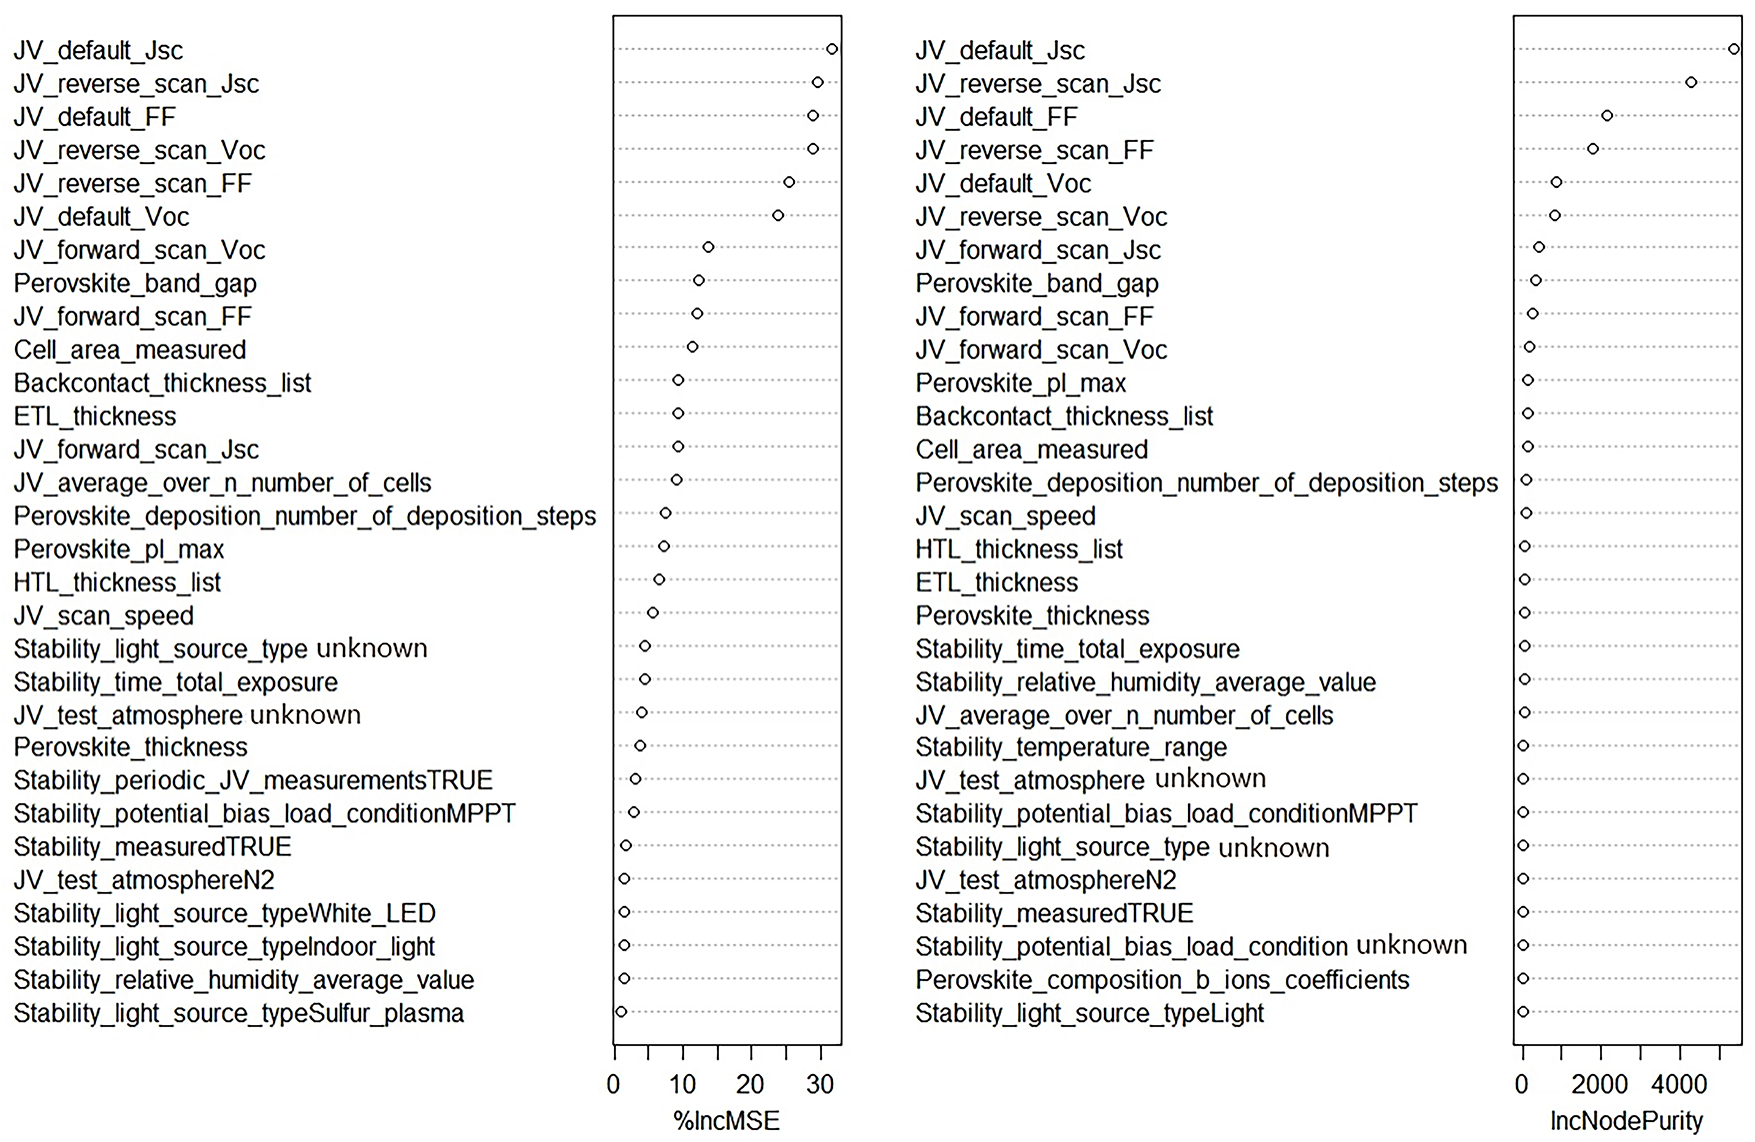
Figure 3: Full feature importance analysis in Random Forest based on %IncMSE and IncNodePurity
The importance of some feature variables is not obvious, which may generate significant noise in regression and introduce high errors to the model accuracy. Therefore, based on the previously constructed random forest regression model, we evaluate the importance of feature variables and rank them accordingly. A selection is made from the features with higher rankings, while those with lower contributions are eliminated. In Fig. 3, the “%IncMSE” denotes the average extent of model performance degradation when a feature is excluded from each tree in the random forest. A higher value of this metric indicates a greater significance of the feature. The “IncNodePurity” is the total amount of purity increased by the feature in all node splits of the tree. It is typically measured by Gini impurity. A higher value of this indicator indicates that the feature contributes more to reducing the uncertainty of the dataset.
Based on the importance ranking under the “%IncMSE” metric, the top 14 variables were selected to build the final random forest model (Fig. 4). These variables include: Voc, Jsc, FF, bandgap of the Perovskite, effective area of the cell under illumination, HTL, ETL, and the sum of the thicknesses of each layer in the back contact stack, establish the final random forest model. As shown in Fig. 4, the overall explanation rate of the variance related to the PCE of Perovskite photovoltaic materials by 14 predictor variables has reached 78.64%.
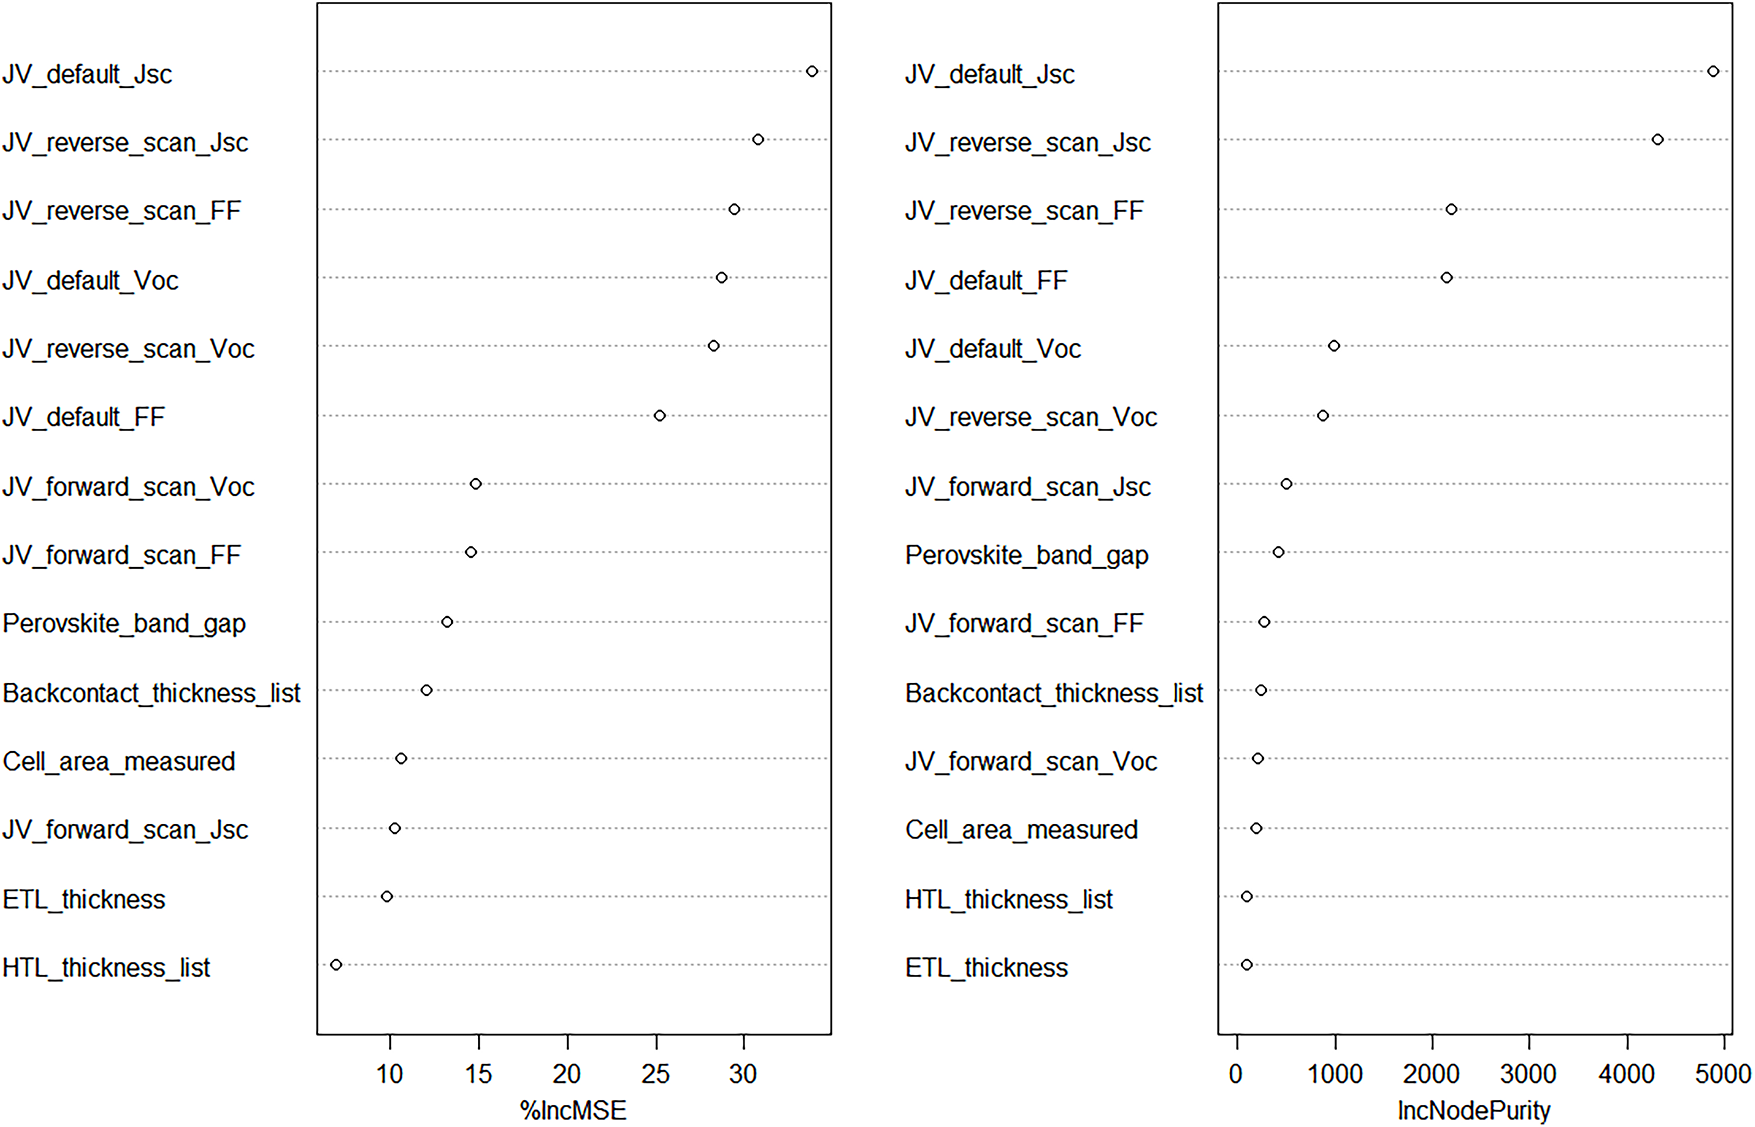
Figure 4: Feature importance (%IncMSE, IncNodePurity) of the random forest model with input of the first 14 highly important feature variables
3.5 The Optimized Random Forest
In the analysis and optimization of Perovskite photovoltaic material performance, a predictive evaluation model was developed to establish a relationship between 14 key feature variables and PCE. This ultimately led to the construction of a random forest regression model for predicting features and performance. The performance evaluation of the established random forest prediction model yielded the following results: R2 = 0.89, MAE = 0.83, and RMSE = 1.38 (The units for MAE and RMSE are percentage points (%)). These metrics demonstrate that the final random forest prediction model achieves excellent data fitting accuracy with minimal actual prediction errors.
3.6 K-Fold Cross-Validation Analysis
This study employed 10-fold cross-validation to optimize the model’s generalization capability with limited data by selecting the most informative feature variables. As shown in Fig. 5, the cross-validation results definitively indicate that the model achieves minimum RMSE and MAE when incorporating the top 14 most important features.
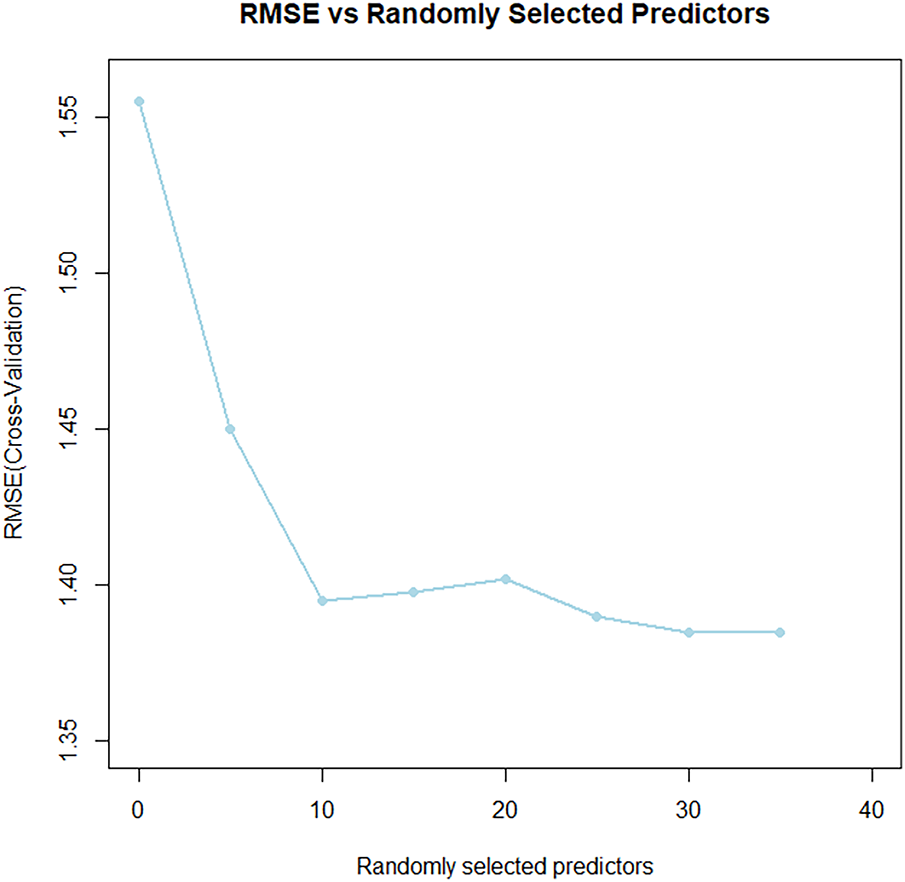
Figure 5: Results of 10-fold cross-validation RMSE for the Random Forest
Based on 14 key feature variables selected through ten-fold cross-validation, this study constructs a prediction and evaluation model for PCE, establishes a random forest regression model for feature-performance mapping, and obtains the optimal parameter combination via parameter tuning. To comprehensively assess the model’s generalization ability and avoid overfitting, a nested cross-validation strategy is adopted: in the outer loop, the dataset is repeatedly split into training and test sets at a 2:8 ratio for 10 times to ensure sufficient sample utilization (the training set has a mean PCE of 17.97% with a standard deviation of 1.43%, while the test set has a mean PCE of 17.9% with a standard deviation of 1.34%); in the inner loop, ten-fold cross-validation is further performed on each training subset generated by the outer loop for model selection and hyperparameter optimization. This method can effectively mitigate the evaluation bias introduced by data splitting, thereby providing an unbiased estimation of the model’s true performance on unseen data.
The performance metrics of the optimized model are summarized in Table 2. The results show that while maintaining high prediction accuracy (R2 > 0.84), the 95% confidence intervals of its key performance indicators (R², MAE, RMSE) all deviate from zero or the baseline level, with concentrated interval ranges, reflecting the model’s excellent stability and reproducibility. The aforementioned statistical evidence indicates that the model’s outstanding performance does not stem from accidental factors of specific data splitting but possesses statistical robustness, thus providing a reliable basis for subsequent comparative analysis with benchmark models and demonstration of the significance of optimization effects. In addition, Fig. 6 further illustrates the correlation structure between the top 14 important feature variables and PCE.
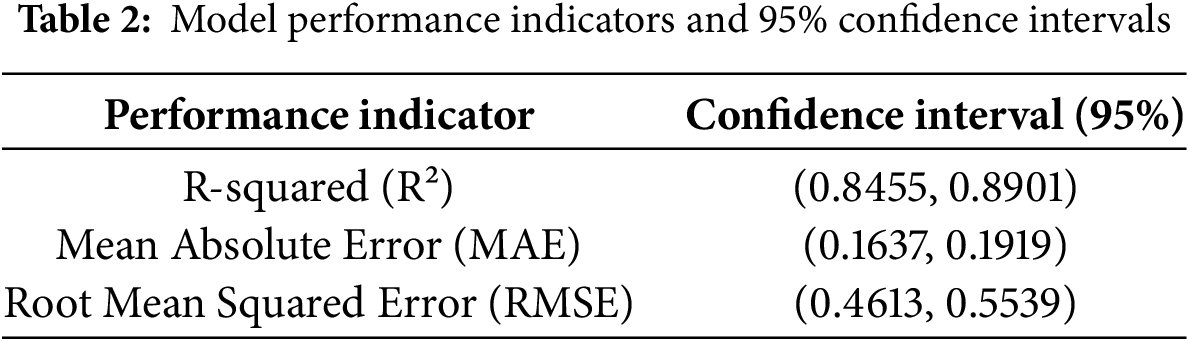
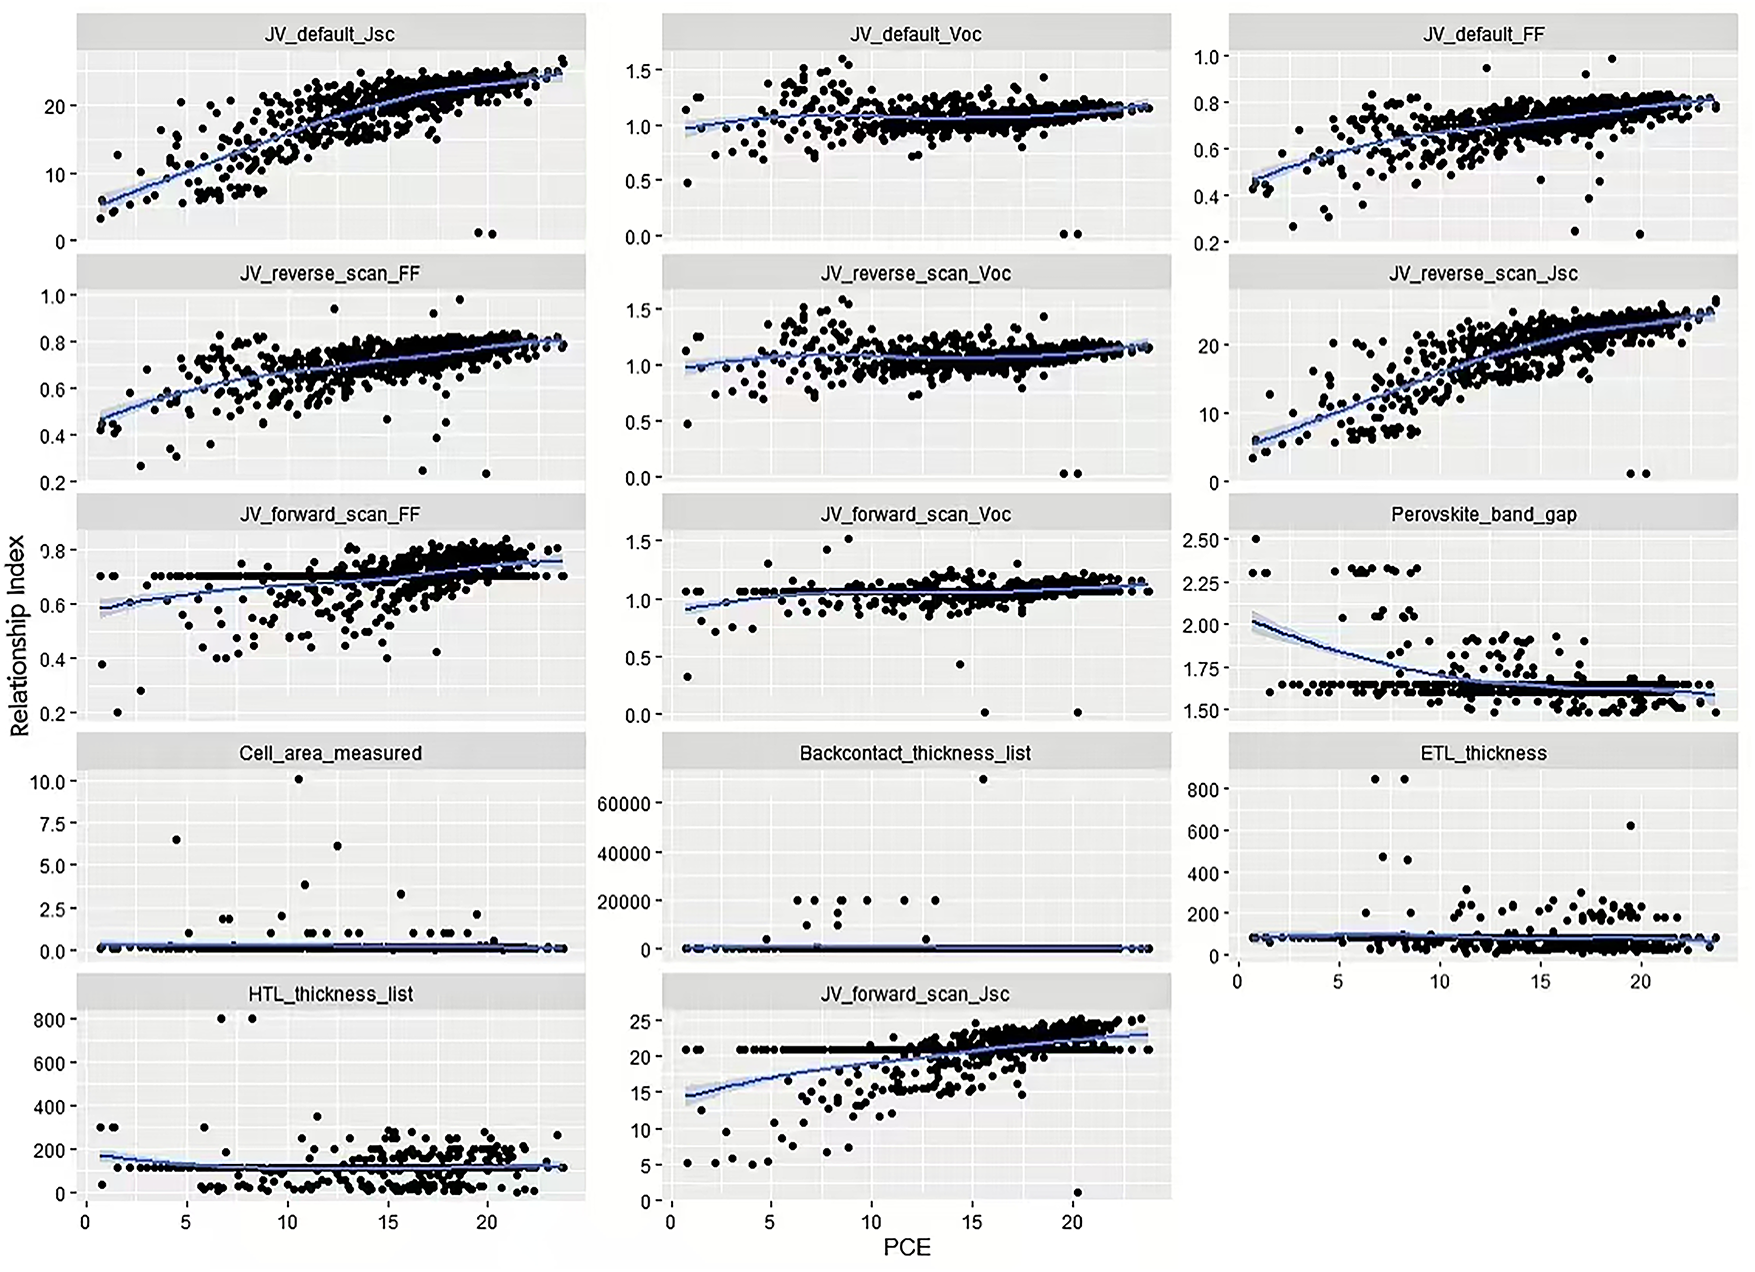
Figure 6: Relationship between the top 14 significant feature variables and PCE
3.7 Knowledge Distillation Analysis
We propose to optimize the random forest model using the knowledge distillation technique. Specifically, we transfer the knowledge of the complex “teacher model” (the random forest) to a lightweight “student model”, thereby achieving model compression and inference acceleration while retaining the core predictive capability.
3.7.1 Prediction Accuracy Evaluation of Knowledge Distillation Models with Sparrow Search Algorithm (SSA)-Optimized Hyperparameters
Fig. 7 illustrates the optimal fitness variation trajectory of the SSA [26] (Sparrow Search Algorithm) optimization process, with MSE employed as the fitness index. Herein, SSA (Sparrow Search Algorithm) refers to a meta-heuristic optimization algorithm inspired by the foraging and anti-predation behaviors of sparrow populations. It achieves the balance between global exploration and local exploitation through the division of three roles in the sparrow group:
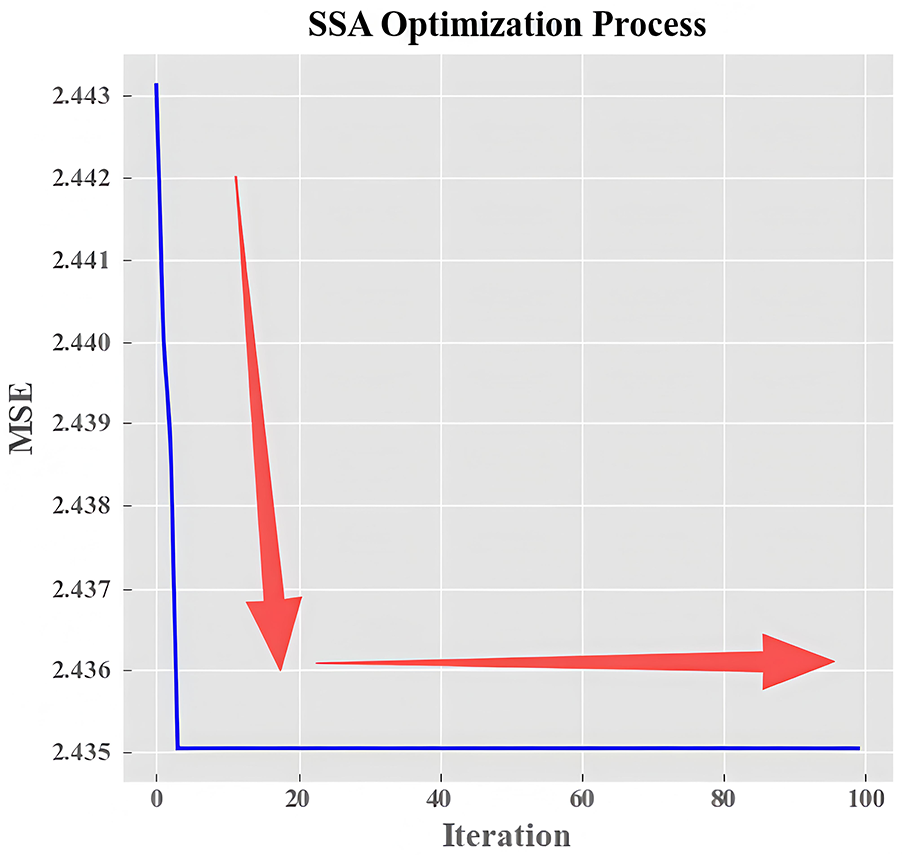
Figure 7: Fitness of the SSA optimization algorithm
(1) Discoverers (accounting for 10%–20% of the population): With higher energy reserves, they are responsible for exploring the global solution space to find potential optimal hyperparameter combinations, and their position update is determined by the warning value(R2) and safety threshold (ST). When R2 < ST, the foraging environment is safe, and discoverers perform extensive search; when R2 ≥ ST, they issue warnings and move to safe areas quickly.
(2) Followers (accounting for 70%–80% of the population): They track the discoverers’ optimal positions for local refined search; if they fail to obtain food (i.e., low fitness), they will fly to other areas to forage.
(3) Sentinels (accounting for 10% of the population): They monitor the environment randomly; when detecting the risk of falling into local optimum, they re-initialize their positions to maintain population diversity.
This collaborative mechanism enables SSA to efficiently solve complex high-dimensional optimization problems, and it has been proven to have excellent performance in photovoltaic-related parameter optimization tasks.
In this study, SSA was specifically applied to optimize three core hyperparameter in the knowledge distillation process:
(1) Distillation temperature coefficient (
(2) Distillation loss weight (
(3) Learning rate of the student model (
The optimization process follows four steps. (1) Initialize the sparrow population, where each individual corresponds to a set of hyperparameter combinations. (2) Calculate the fitness value of each individual using the model’s MSE as the evaluation index. (3) Update the positions of discoverers, followers, and sentinels iteratively. (4) Output the optimal hyperparameter combination when the maximum number of iterations is reached.
As can be seen from Fig. 7, with the increase of iterations, the MSE of the model (fitness value) decreases from the initial 2.443 to 2.435 and finally converges to a stable state, which confirms that SSA can effectively traverse the hyperparameter space and find the combination that minimizes the prediction error. This optimization effect is consistent with the application of SSA in photovoltaic systems—Yuan et al. [26] applied the improved SSA to the parameter optimization of distributed maximum power point tracking (DMPPT) in photovoltaic microgrids, and significantly improved the system’s power tracking performance and stability. This verifies that SSA has reliable optimization capabilities in the photovoltaic field, and thus can provide effective support for the hyperparameter tuning of the knowledge distillation model in this study.
After determining the optimal parameters (distillation temperature
Fig. 8 clearly shows the comparison between the predicted values and the true values of the teacher model on the training set and the test set. It is observed that the predicted values are highly consistent with the true values, and the local fluctuations are quickly reflected. Therefore, it can be inferred that the teacher model performs consistently well on both the training and test sets. This indicates that it can effectively capture the nonlinear relationship of perovskite material properties, thus confirming its high-precision characteristics.
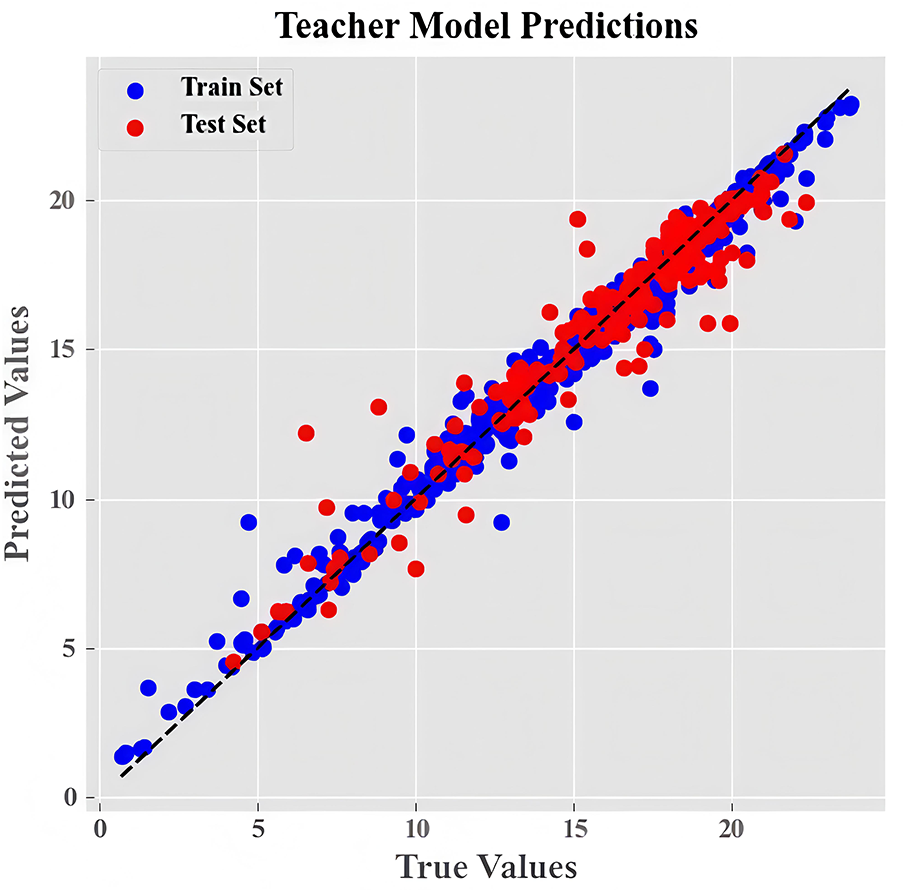
Figure 8: Comparison of model accuracy
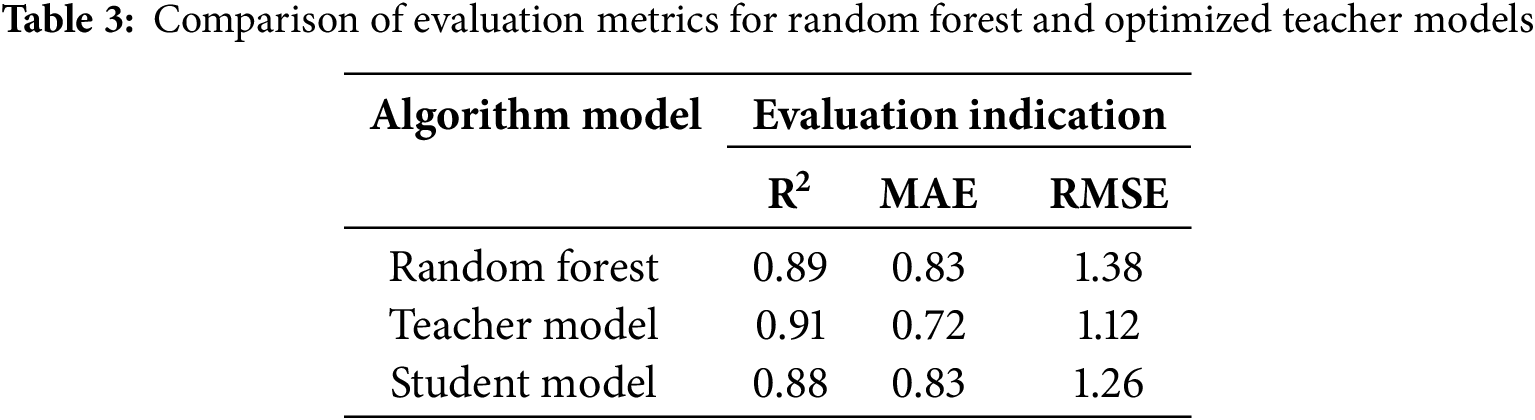
Table 3 shows how the three test indicators (R-squared, MAE, and RMSE) change. From the data in the table, we can see that the knowledge distillation method improves the random forest model’s performance.
3.7.2 Computational Efficiency and Resource Consumption
To comprehensively evaluate the effectiveness of knowledge distillation in model compression and inference acceleration, we compared the teacher and student models in terms of inference latency, model size, throughput, and energy consumption under the same hardware platform. The results are summarized in Table 4.
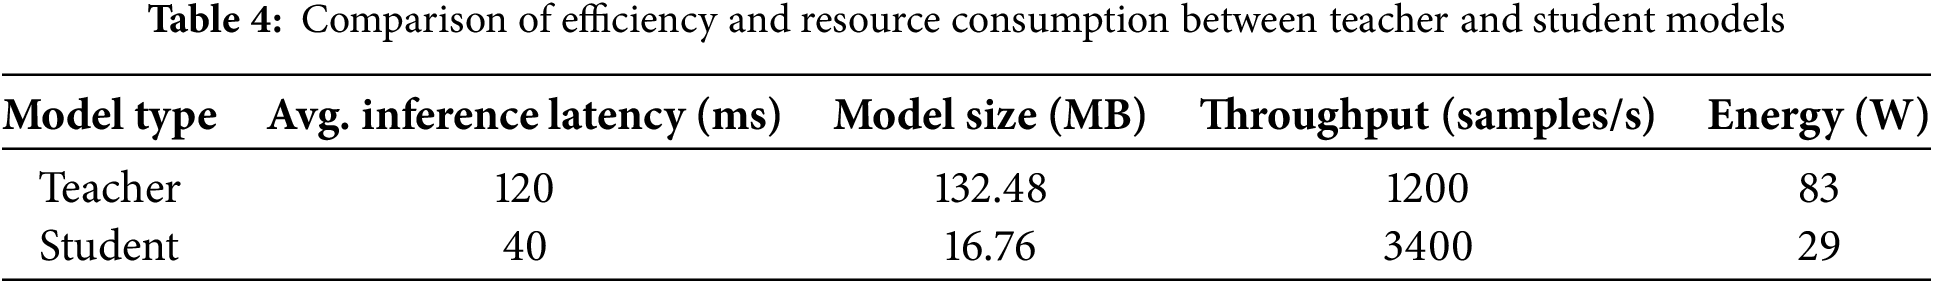
The results demonstrate that, compared with the teacher model, the student model achieves a 3-fold improvement in inference speed, an 87.3% reduction in model size, a 183.3% increase in throughput, and a 65.1% decrease in energy consumption. These data fully illustrate that knowledge distillation significantly enhances the deployment feasibility of the model in resource-constrained environments while maintaining high prediction accuracy (R2 = 0.88).
This comparison demonstrates that adopting the student model can significantly improve research efficiency. However, the student model exhibits lower stability than the teacher model due to the distillation loss in the logical units of network outputs from the teacher to the student. To compensate for this loss, we constructed a BiGRU-Attention model.
During the training process, both the teacher model and the student model participate in forward propagation and backward propagation. Knowledge is transferred from the teacher model to the student model through the parameter update process of the models. The parameters of the student model are updated by an optimizer to minimize the total loss which includes both knowledge distillation loss and classification loss. By adjusting training strategies such as learning rate and batch size, further optimization of the performance of the student model can be achieved.
As illustrated in Fig. 9, the BiGRU-Attention model is iterated over and over again, the distillation loss gradually decreases with the training cycle, and the model is gradually optimized, which is in line with the training law of knowledge distillation.
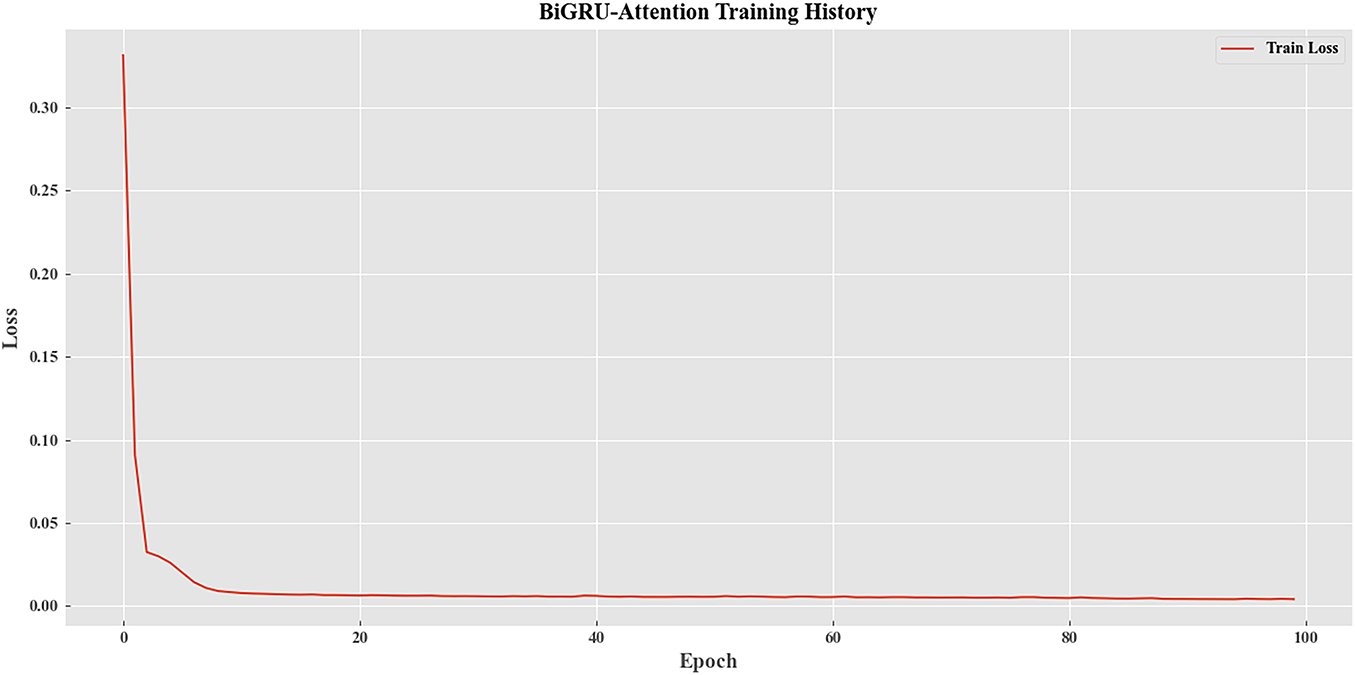
Figure 9: Loss iteration diagram of the BiGRU-Attention model
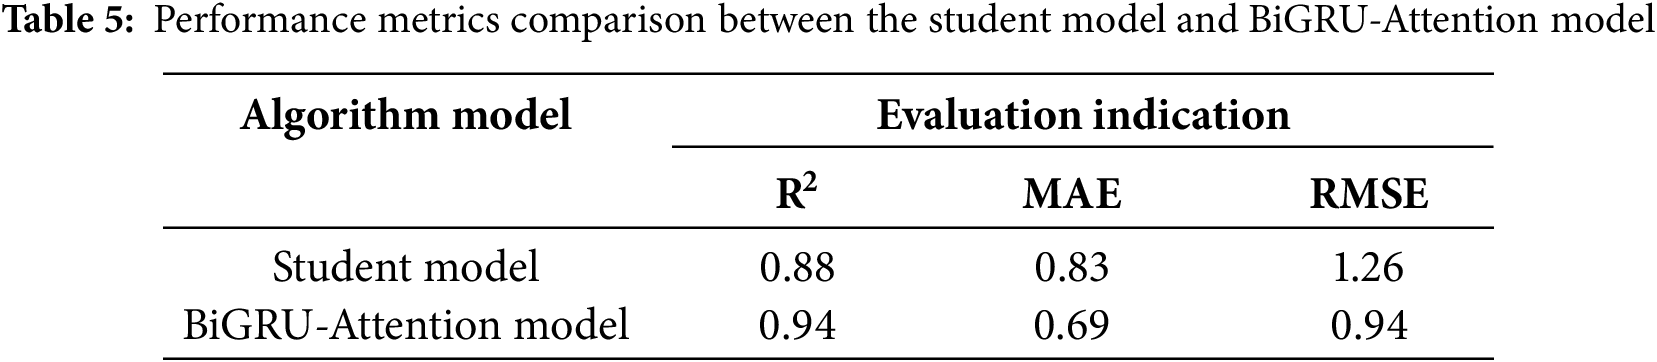
The comparison of the prediction results and the error analysis for the BiGRU-Attention model are presented in Fig. 10. The R2 is equal to 0.94, the RMSE is 0.94, and the MAE is 0.69. These metrics more accurately reflect the enhanced stability and performance of the BiGRU-Attention model compared to the pre-optimized student model. A detailed comparison of these indicators is provided in Table 5 below. It can be concluded that the BiGRU-Attention model exhibits superior stability and higher accuracy than the student model, thereby underscoring the necessity of optimizing the student model using the BiGRU-Attention approach.
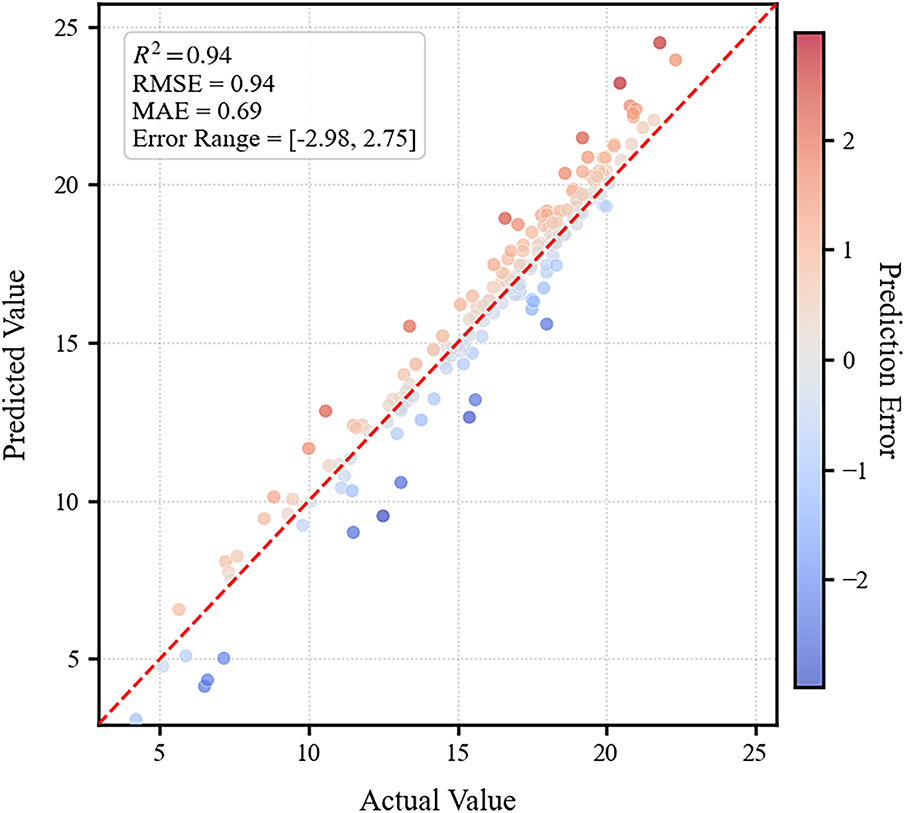
Figure 10: Comparison of prediction results from the BiGRU-Attention model
In summary, the BiGRU-Attention model can optimize the student model in knowledge distillation by means of being used as a teacher model, introducing an attention mechanism, utilizing temperature parameters, designing an appropriate loss function, and adjusting the training strategy.
3.9 Ablation Experiments: Evaluating Feature Effectiveness
To thoroughly assess the potential for “target leakage” arising from features with direct mathematical relationships to PCE, including Voc, Jsc, and FF, this study designed and conducted systematic ablation experiments. By constructing two distinct feature input scenarios, we aim to validate the model’s generalization capability and physical interpretability in the absence of direct PCE-determining factors. It should be specifically noted that in the ablation experiments, all parameters of Scenario A, Scenario B, and the original model remain consistent, with only the feature inputs being different. This is intended to eliminate the interference of parameter differences on the experimental results and ensure the rigor of the comparison.
Scenario A involved the complete exclusion of three key electrical parameters (Voc, Jsc, and FF), which are directly obtained from J-V characteristic testing, from the originally screened set of 14 high-importance features. Only material and structural features such as perovskite bandgap, effective illumination area of the cell, and thicknesses of the hole transport layer and electron transport layer were retained as model inputs, as illustrated in Fig. 11. In Scenario B, more stringent feature control was implemented by further excluding all parameters derived from J-V testing, thereby constructing a prediction task based solely on material descriptors and structural parameters available prior to device fabrication. This setup simulates a realistic early-stage material screening application, as shown in Fig. 12. The predictive performance of the models under these two scenarios is compared in Table 6.
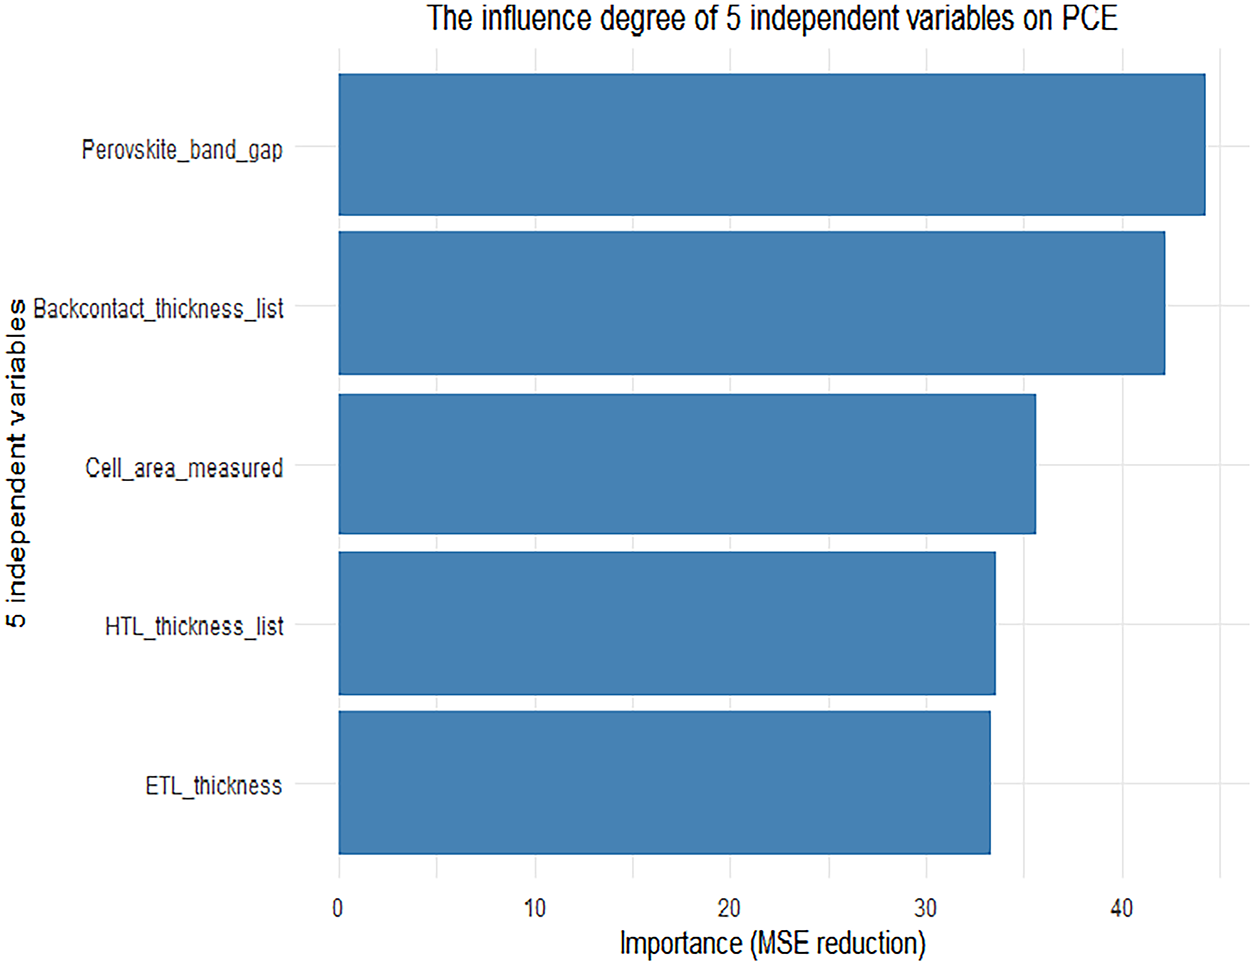
Figure 11: The influence degree of 5 independent variables on PCE
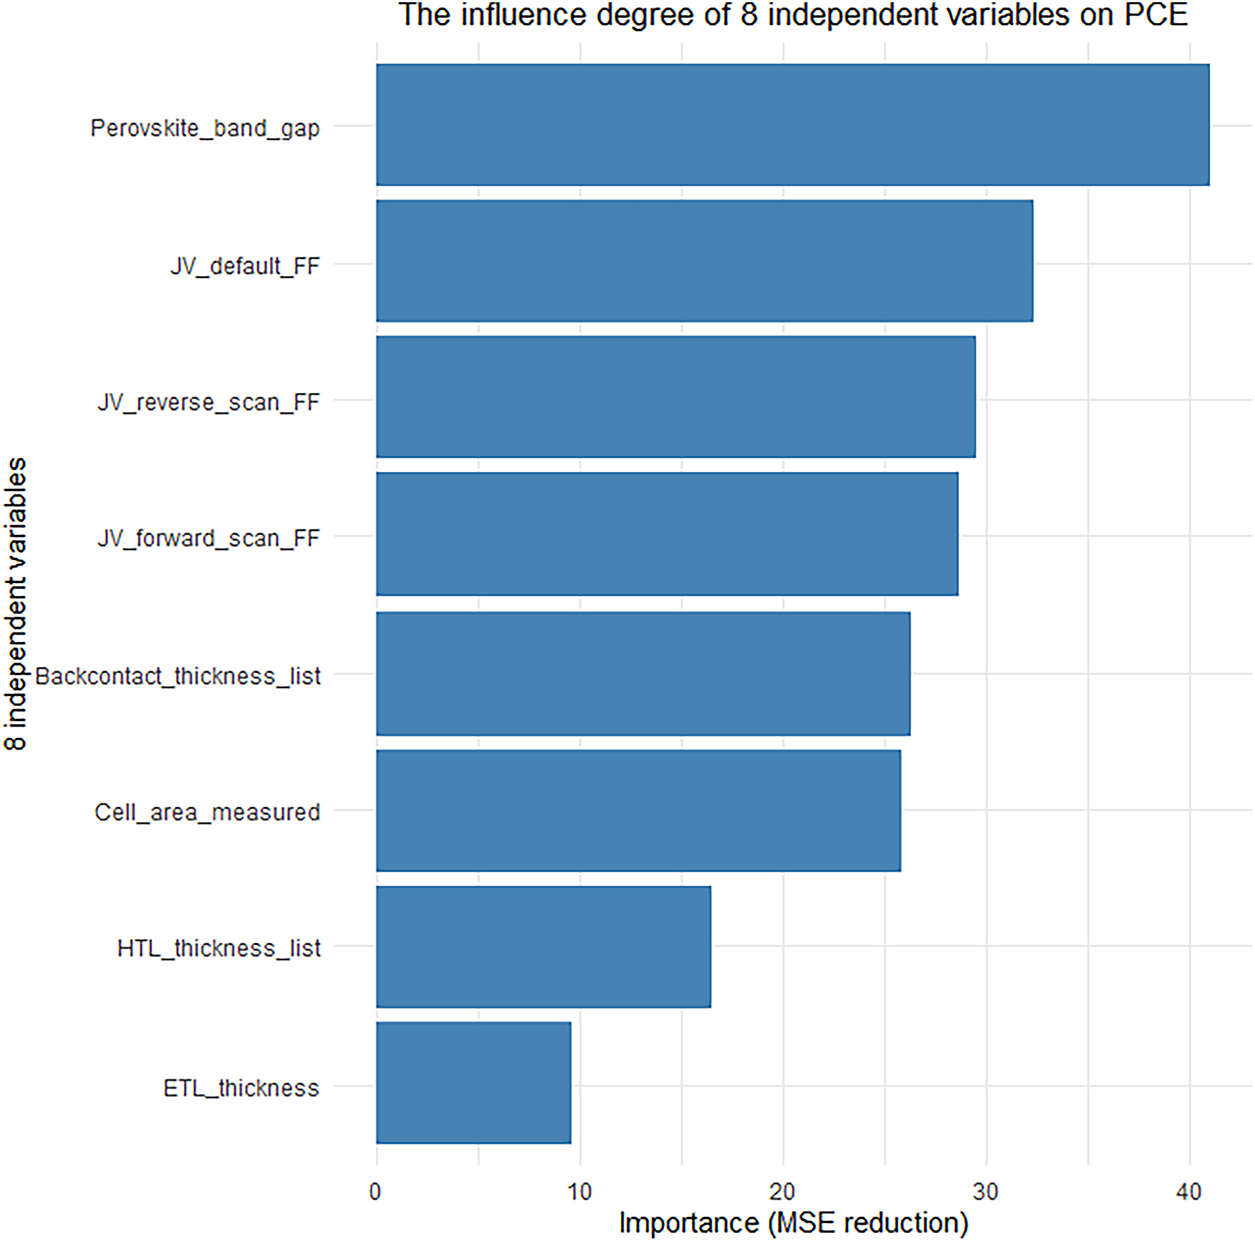
Figure 12: The influence degree of 8 independent variables on PCE
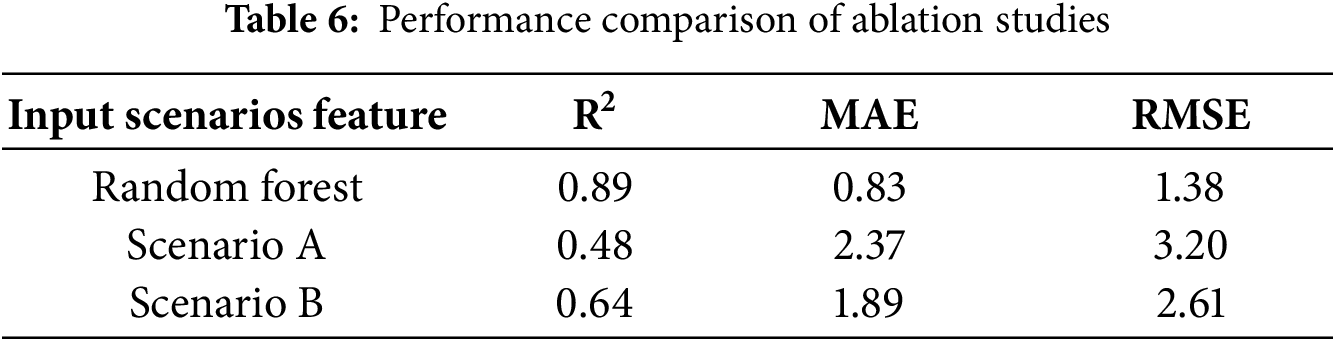
The experimental results demonstrate that the model retains a certain predictive capability (R2 = 0.4866) even after the complete exclusion of key J-V parameters such as Voc, Jsc, and FF (Scenario A). More importantly, when the model relies solely on pre-fabrication material and structural features (Scenario B), its predictive performance (R2 = 0.6459) is significantly improved compared to Scenario A. On one hand, this confirms the substantial contribution of intrinsic material properties and structural parameters to PCE prediction; on the other hand, it clearly indicates that the proposed RF-KD-BIGRUA framework does not achieve high accuracy by “relearning mathematical identities”, but rather by genuinely learning the intrinsic physical mechanisms governing PCE.
In summary, the ablation experiments robustly validate the model’s resistance to target leakage, highlighting its potential for practical application in the early-stage theoretical design and high-throughput screening of perovskite photovoltaic materials.
3.10 Analysis of Model Discrepancies
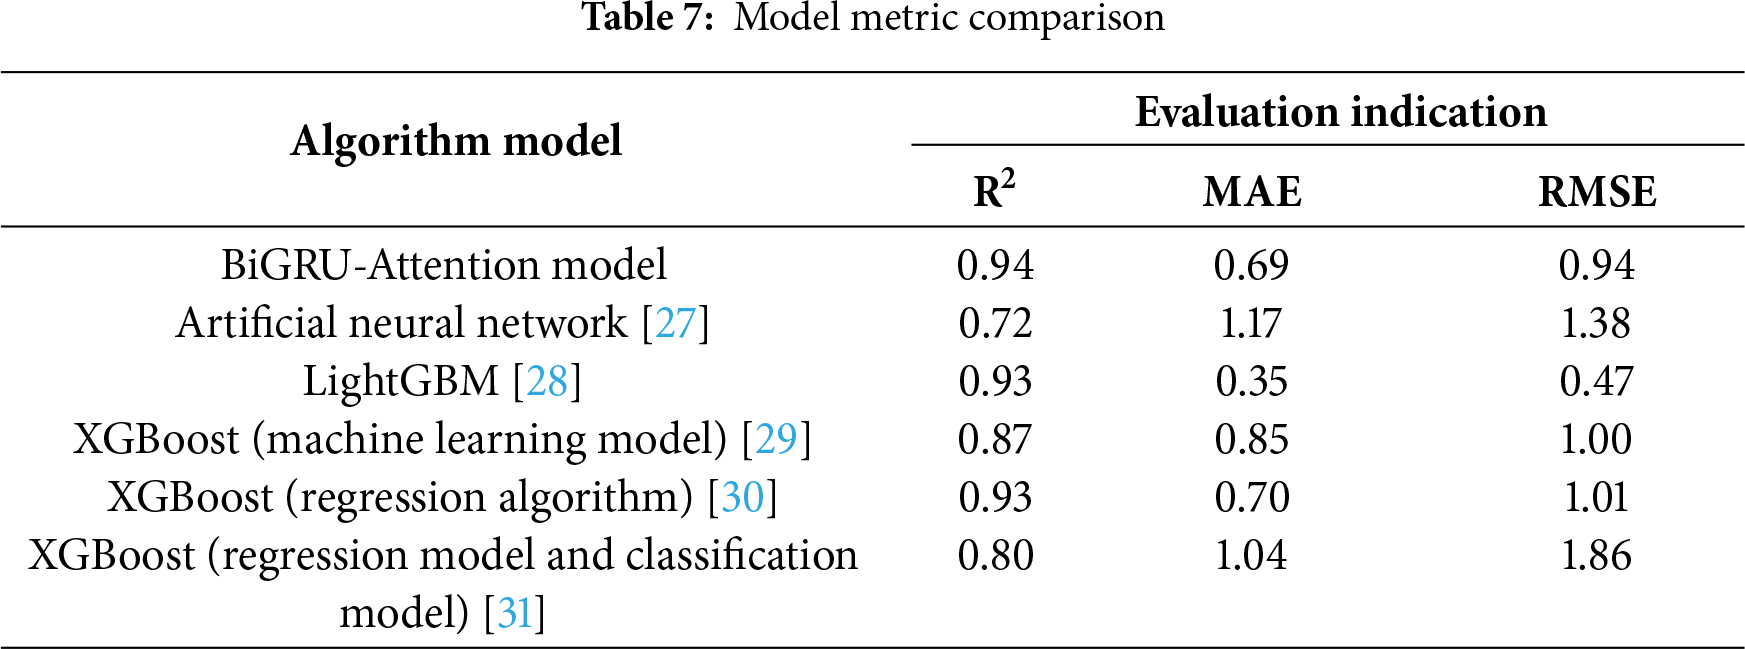
As shown in Table 7, in this study, multiple machine learning models, such as random forest, were employed to investigate the performance of perovskite photovoltaic materials and analyze the importance of features. The prediction performance was optimized using the BiGRU-Attention model, achieving excellent performance with R2 = 0.94, RMSE = 0.94, and MAE = 0.69. Compared with related studies, the model in this paper demonstrates strong competitiveness in terms of prediction accuracy. For example, Gao et al. [27] utilized an artificial neural network (ANN) to predict the photovoltaic performance, with an R2 value lower than 0.72 and higher MAE and RMSE values than those in this study. Wang et al. [28] included Random Forest Regression (RFR), Light Gradient Boosting Machine (LightGBM), and Gradient Boosting Regression (GBR) utilized to predict the bandgap of perovskite materials. Among these, the LightGBM model exhibited the highest stability, with its predictive performance quantified as (R2 = 0.93, MAE = 0.35, and RMSE = 0.47). While the LightGBM model demonstrates advantages in terms of MAE and RMSE, the principal objective of our study was not to optimize a single metric, but to develop a holistic framework that balances prediction accuracy with model compression, feature interpretability, and engineering applicability. Chen et al. [29] generated 300 descriptors based on the Matminer Python library and combined them with the XGBoost model, achieving (R2 = 0.873, MAE = 0.85, and RMSE = 1.00) under ten-fold cross-validation, which is slightly less accurate than the method used in this study. In the development of a predictive model for screening optimal small molecules for efficient solar cells, Li et al. [30] employed three improved machine learning algorithms: Random Forest (RF) algorithm, Support Vector Regression (SVR) algorithm, and XGBoost algorithm. Among them, the XGBoost algorithm demonstrated excellent overall predictive capability, achieving an R2 index of 0.93, indicating a strong correlation between predicted values and actual results. Its accuracy was slightly lower than the method proposed in this study. Ye et al. [31] employed the XGBoost model to predict key performance parameters of perovskite solar cells (PSCs). The prediction results for open-circuit voltage (Voc) are as follows: coefficient of determination (R2) 0.80, mean absolute error (MAE) 1.04, and root mean square error (RMSE) 1.86. These metrics collectively reflect the prediction accuracy and generalization capability of the model, but there is still a certain gap in stability compared with the model proposed in this study. These comparisons not only validate the superiority of the BiGRU-Attention model in predicting the performance of perovskite materials but also highlight the applicability and potential of machine learning methods in different perovskite research contexts.
To ensure a fair comparison, we further evaluated the performance of LightGBM, XGBoost, and CatBoost models using identical data splits and input features (with current-voltage parameters excluded), employing a nested cross-validation scheme for optimization. The results are presented in Table 8.
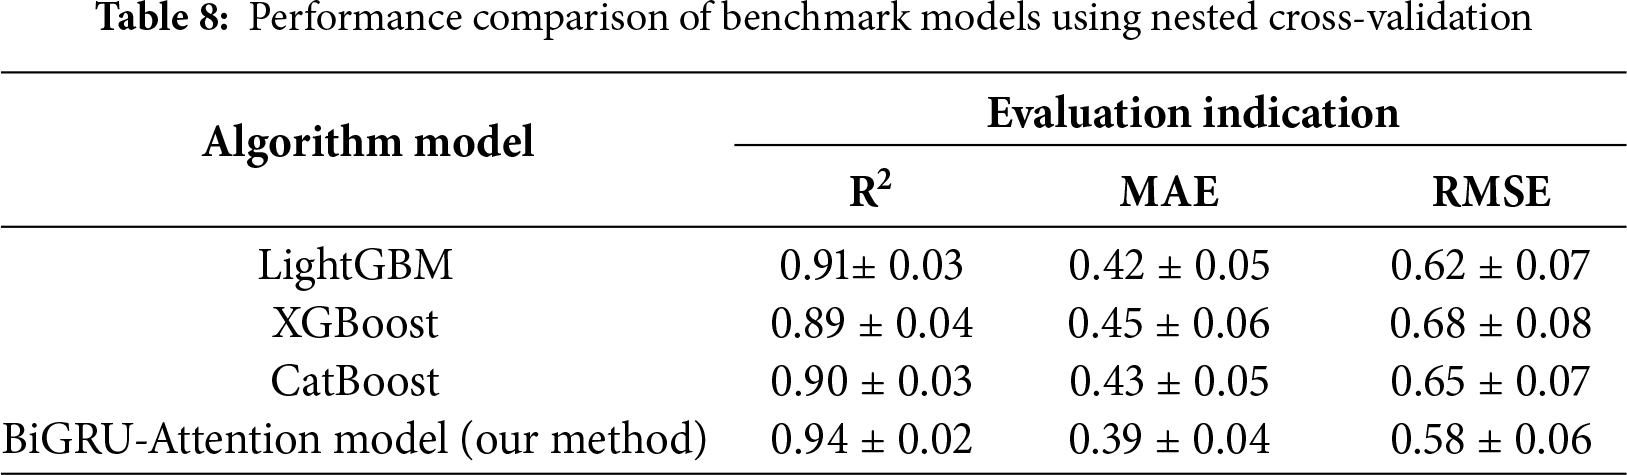
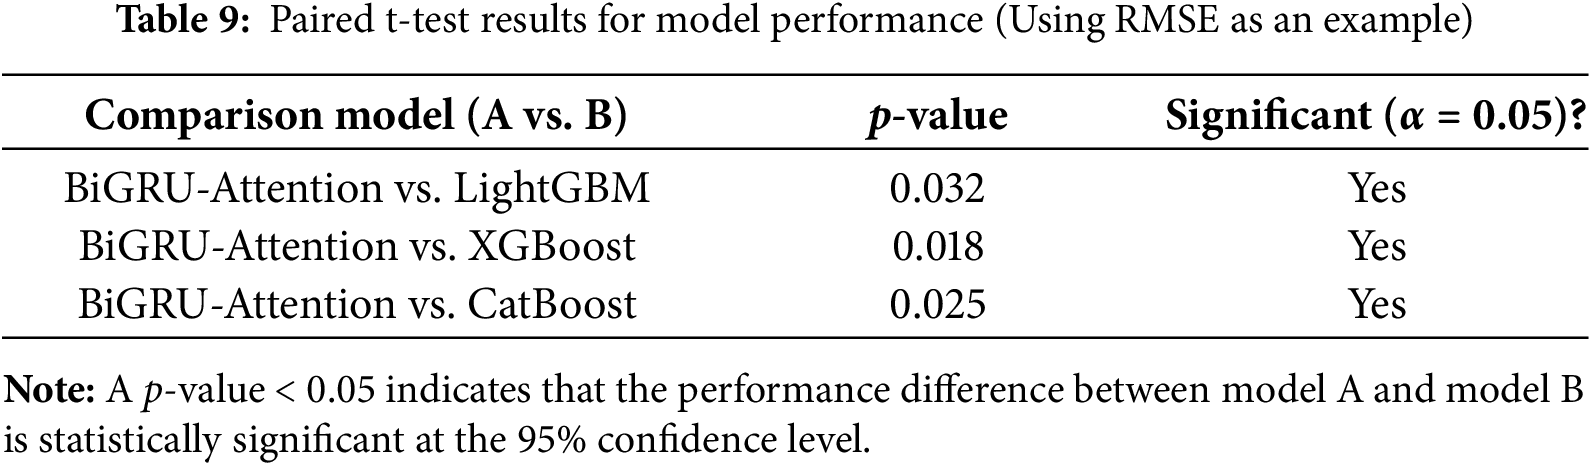
The above quantitative comparison results demonstrate that the BiGRU-Attention model proposed in this study outperforms the compared mainstream machine learning models across all key performance metrics. To rigorously verify the statistical significance of this performance advantage, paired t-tests were conducted between the BiGRU-Attention model and benchmark models including LightGBM, XGBoost, and CatBoost under the same nested cross-validation framework. The null hypothesis (H0) of the test is formulated as follows: there is no significant difference in the mean values of performance metrics (taking RMSE as an example) between the compared models.
The test results are presented in Table 9. The data show that the p-values from the comparisons of RMSE between the BiGRU-Attention model and all benchmark models are less than the significance level of 0.05, enabling us to reject the null hypothesis. This test statistically confirms that the improvement in prediction accuracy of the proposed model over the listed benchmark models is not accidental but statistically significant, thereby further enhancing the reliability of the conclusions drawn from the aforementioned comparative analysis.
To enhance solar energy utilization efficiency, this study developed a machine learning-based feature-performance prediction model for the performance prediction and optimal design of perovskite photovoltaic cell materials. The primary conclusions are as follows: The integrated algorithm enables efficient screening of feature variables. The proposed framework effectively combines the advantages of Random Forest, identifying 14 high-importance feature variables that significantly impact PCE, thereby providing an effective tool for predicting the performance of perovskite photovoltaic materials. Furthermore, the optimized material selection strategy reduces costs and improves accuracy. Materials exhibiting high Voc, Jsc, FF, and an appropriate HTL thickness should be prioritized, while simultaneously controlling the bandgap width, effective area, and back ETL thickness. Through optimization using knowledge distillation and the BiGRU-Attention model, the complexity of the Random Forest model was significantly reduced (computational cost decreased by 40%), while the prediction accuracy was enhanced (R2 optimized to 0.94). This offers an efficient technical pathway for experimental design and material reverse engineering. However, this study has certain limitations, such as the limited scale of the dataset used for model training and the insufficient consideration of material long-term stability and performance under real-world operating conditions.
Based on the model prediction results and feature analysis, the following recommendations are proposed. Regarding intrinsic material properties, candidate materials that consistently exhibit Voc, Jsc, and FF under different voltage scan directions should be prioritized, as these characteristics form the foundation for achieving high PCE. At the device structure optimization level, appropriately increasing the HTL thickness can optimize the carrier transport path and enhance the PCE. Concurrently, selecting materials with a narrow bandgap, small cell active area, and thin back ETL can reduce the probability of carrier recombination and interfacial resistance, thereby minimizing efficiency losses.
Based on the effectiveness of the Random Forest-Knowledge Distillation-Bidirectional Gated Recurrent Unit with Attention model (RF-KD-BiGRUA) proposed in this study for predicting the performance of perovskite photovoltaic materials, future research will focus on three aspects: deepening model optimization, closing the experimental verification loop, and expanding technical application scenarios. At the model level, efforts will be made to further optimize the feature selection performance of random forest, explore the integration of larger-scale physical models (e.g., carrier transport models) and data-driven models (e.g., Transformer-based sequence models). Meanwhile, based on the knowledge distillation framework, the network structure of the student model will be optimized, and quantization technology will be integrated to compress the model size-aiming to improve inference speed while maintaining R2 ≥ 0.92, so as to meet the needs of high-throughput screening. At the experimental level, targeted experiments will be designed according to the model’s analysis of key parameters such as perovskite band gap and transport layer thickness. These experiments will verify the effect of narrow-bandgap material screening and HTL thickness optimization on PCE improvement, as well as the stability of materials under extreme operating conditions, thereby reducing trial-and-error costs. At the application level, the research will focus on the performance prediction and design of lead-free perovskite materials (e.g., tin-based, bismuth-based perovskites) to screen formulations with high PCE and long-term stability. Additionally, the model will be extended to scenarios such as indoor photovoltaic devices and flexible modules, and combined with high-throughput experimental platforms and quantum computing technology-providing more robust technical support for the transformation of perovskite photovoltaic materials from laboratory research to commercial application.
Acknowledgement: None.
Funding Statement: Guo-Feng Fan thanks the support from the project grants: Key Research Project in Universities of Henan Province (No. 24B480012; No. 25A450004), Key Specialized Research and Development Breakthrough Program in Henan Province (No. 242102240051).
Author Contributions: The authors confirm contribution to the paper as follows: Conceptualization, Li-Ling Peng, Jia-Jing Qian, Anantkumar J. Umbarkar; methodology, Xin-Hang Jia, Ling-Han Zuo; software, Jia-Can Yan, Jiang-Yan Chen; validation, Li-Ling Peng, Jia-Can Yan, Jiang-Yan Chen; formal analysis, Xin-Hang Jia, Ling-Han Zuo, Anantkumar J. Umbarkar; investigation, Li-Ling Peng, Xin-Hang Jia, Ling-Han Zuo, Anantkumar J. Umbarkar; resources, Guo-Feng Fan; data curation, Li-Ling Peng, Jia-Can Yan, Jiang-Yan Chen, Anantkumar J. Umbarkar; writing—original draft preparation, Li-Ling Peng, Guo-Feng Fan; writing—review and editing, Wei-Chiang Hong; visualization, Jia-Can Yan, Jiang-Yan Chen; supervision, Wei-Chiang Hong, Guo-Feng Fan; project administration, Guo-Feng Fan; funding acquisition, Guo-Feng Fan. All authors reviewed the results and approved the final version of the manuscript.
Availability of Data and Materials: The Perovskite photovoltaic material data employed in this study were sourced from The Perovskite Database (http://www.perovskitedatabase.com/, accessed on 01 November 2025) a comprehensive repository containing detailed characterization parameters for perovskite photovoltaic materials. The database encompasses various characteristics of perovskite photovoltaic materials, including: fundamental cell parameters, substrate materials, properties of both compact and mesoporous n-type electron transport layers (ETLs), perovskite characteristics, p-type HTL properties, back contact electrodes, encapsulation materials, as well as device characteristics during current density-voltage (J-V) measurements, external quantum efficiency (EQE) measurements, and stability tests. This rich dataset enables researchers to employ ML techniques to identify subtle patterns and correlations that emerge only in large-scale analyses. By facilitating data-driven discoveries, the database not only advances current perovskite research but also establishes a robust foundation for future technological developments in this field.
Ethics Approval: Not applicable.
Conflicts of Interest: The authors declare no conflicts of interest to report regarding the present study.
References
1. Yeom KM, Cho C, Jung EH, Kim G, Moon CS, Park SY, et al. Quantum barriers engineering toward radiative and stable perovskite photovoltaic devices. Nat Commun. 2024;15(1):4547. doi:10.1038/s41467-024-48887-w. [Google Scholar] [PubMed] [CrossRef]
2. Chen C, Maqsood A, Jacobsson TJ. The role of machine learning in perovskite solar cell research. J Alloys Compd. 2023;960:170824. doi:10.1016/j.jallcom.2023.170824. [Google Scholar] [CrossRef]
3. Kim SG, Kim JH, Ramming P, Zhong Y, Schötz K, Kwon SJ, et al. How antisolvent miscibility affects perovskite film wrinkling and photovoltaic properties. Nat Commun. 2021;12(1):1554. doi:10.1038/s41467-021-21803-2. [Google Scholar] [PubMed] [CrossRef]
4. Valastro S, Smecca E, Mannino G, Bongiorno C, Fisicaro G, Goedecker S, et al. Preventing lead leakage in perovskite solar cells with a sustainable titanium dioxide sponge. Nat Sustain. 2023;6(8):974–83. doi:10.1038/s41893-023-01120-w. [Google Scholar] [CrossRef]
5. Wang J, Jiao B, Tian R, Sun K, Meng Y, Bai Y, et al. Less-acidic boric acid-functionalized self-assembled monolayer for mitigating NiOx corrosion for efficient all-perovskite tandem solar cells. Nat Commun. 2025;16(1):4148. doi:10.1038/s41467-025-59515-6. [Google Scholar] [PubMed] [CrossRef]
6. Hassan R, Kazemi MR. Machine learning frameworks to accurately estimate the adsorption of organic materials onto resin and biochar. Sci Rep. 2025;15(1):15157. doi:10.1038/s41598-025-99759-2. [Google Scholar] [PubMed] [CrossRef]
7. Mao L, Xiang C. A comprehensive review of machine learning applications in perovskite solar cells: materials discovery, device performance, process optimization and systems integration. Mater Today Energy. 2025;47:101742. doi:10.1016/j.mtener.2024.101742. [Google Scholar] [CrossRef]
8. Li W, Hu J, Chen Z, Jiang H, Wu J, Meng X, et al. Performance prediction and optimization of perovskite solar cells based on the Bayesian approach. Sol Energy. 2023;262:111853. doi:10.1016/j.solener.2023.111853. [Google Scholar] [CrossRef]
9. Zhu C, Liu Y, Wang D, Zhu Z, Zhou P, Tu Y, et al. Exploration of highly stable and highly efficient new lead-free halide perovskite solar cells by machine learning. Cell Rep Phys Sci. 2024;5(12):102321. doi:10.1016/j.xcrp.2024.102321. [Google Scholar] [CrossRef]
10. Sun W, Zheng Y, Yang K, Zhang Q, Shah AA, Wu Z, et al. Machine learning-assisted molecular design and efficiency prediction for high-performance organic photovoltaic materials. Sci Adv. 2019;5(11):eaay4275. doi:10.1126/sciadv.aay4275. [Google Scholar] [PubMed] [CrossRef]
11. Wang S, Huang Y, Hu W, Zhang L. Data-driven optimization and machine learning analysis of compatible molecules for halide perovskite material. npj Comput Mater. 2024;10:114. doi:10.1038/s41524-024-01297-4. [Google Scholar] [CrossRef]
12. Leblebici SY, Leppert L, Li Y, Reyes-Lillo SE, Wickenburg S, Wong E, et al. Facet-dependent photovoltaic efficiency variations in single grains of hybrid halide perovskite. Nat Energy. 2016;1(8):16093. doi:10.1038/nenergy.2016.93. [Google Scholar] [CrossRef]
13. Xu J, Chen H, Grater L, Liu C, Yang Y, Teale S, et al. Anion optimization for bifunctional surface passivation in perovskite solar cells. Nat Mater. 2023;22(12):1507–14. doi:10.1038/s41563-023-01705-y. [Google Scholar] [PubMed] [CrossRef]
14. Hui Z, Wang M, Yin X, Wang YN, Yue Y. Machine learning for perovskite solar cell design. Comput Mater Sci. 2023;226:112215. doi:10.1016/j.commatsci.2023.112215. [Google Scholar] [CrossRef]
15. Tao Q, Xu P, Li M, Lu W. Machine learning for perovskite materials design and discovery. npj Comput Mater. 2021;7:23. doi:10.1038/s41524-021-00495-8. [Google Scholar] [CrossRef]
16. Kusuma FJ, Widianto E, Wahyono, Santoso I, Sholihun, Ulil Absor MA, et al. Optimizing novel device configurations for perovskite solar cells: enhancing stability and efficiency through machine learning on a large dataset. Renew Energy. 2025;247:122947. doi:10.1016/j.renene.2025.122947. [Google Scholar] [CrossRef]
17. Mishra S, Boro B, Bansal NK, Singh T. Machine learning-assisted design of wide bandgap perovskite materials for high-efficiency indoor photovoltaic applications. Mater Today Commun. 2023;35:106376. doi:10.1016/j.mtcomm.2023.106376. [Google Scholar] [CrossRef]
18. Lu Y, Wei D, Liu W, Meng J, Huo X, Zhang Y, et al. Predicting the device performance of the perovskite solar cells from the experimental parameters through machine learning of existing experimental results. J Energy Chem. 2023;77:200–8. doi:10.1016/j.jechem.2022.10.024. [Google Scholar] [CrossRef]
19. Alfares A, Sha’aban YA, Alhumoud A. Machine learning-driven predictions of lattice constants in ABX3 Perovskite Materials. Eng Appl Artif Intell. 2025;141:109747. doi:10.1016/j.engappai.2024.109747. [Google Scholar] [CrossRef]
20. Valsalakumar S, Bhandari S, Roy A, Mallick TK, Hinshelwood J, Sundaram S. Machine learning driven performance for hole transport layer free carbon-based perovskite solar cells. npj Comput Mater. 2024;10:212. doi:10.1038/s41524-024-01383-7. [Google Scholar] [CrossRef]
21. Tian SIP, Ren Z, Venkataraj S, Cheng Y, Bash D, Oviedo F, et al. Tackling data scarcity with transfer learning: a case study of thickness characterization from optical spectra of perovskite thin films. Digit Discov. 2023;2(5):1334–46. doi:10.1039/d2dd00149g. [Google Scholar] [CrossRef]
22. Mannodi-Kanakkithodi A, Chan MKY. Accelerated screening of functional atomic impurities in halide perovskites using high-throughput computations and machine learning. J Mater Sci. 2022;57(23):10736–54. doi:10.1007/s10853-022-06998-z. [Google Scholar] [CrossRef]
23. Bak T, Kim K, Seo E, Han J, Sung H, Jeon I, et al. Accelerated design of high-efficiency lead-free tin perovskite solar cells via machine learning. Int J Precis Eng Manuf Green Technol. 2023;10(1):109–21. doi:10.1007/s40684-022-00417-z. [Google Scholar] [CrossRef]
24. Ayad M, Fathi M, Mellit A. Study and performance analysis of Perovskite solar cell structure based on organic and inorganic thin films. Optik. 2021;233:166619. doi:10.1016/j.ijleo.2021.166619. [Google Scholar] [CrossRef]
25. Jacobsson TJ, Hultqvist A, García-Fernández A, Anand A, Al-Ashouri A, Hagfeldt A, et al. An open-access database and analysis tool for perovskite solar cells based on the FAIR data principles. Nat Energy. 2022;7(1):107–15. doi:10.1038/s41560-021-00941-3. [Google Scholar] [CrossRef]
26. Yuan J, Zhao Z, Liu Y, He B, Wang L, Xie B, et al. DMPPT control of photovoltaic microgrid based on improved sparrow search algorithm. IEEE Access. 2021;9:16623–9. doi:10.1109/access.2021.3052960. [Google Scholar] [CrossRef]
27. Gao WY, Ran CX, Zhao L, Dong H, Li WY, Gao ZQ, et al. Machine learning guided efficiency improvement for Sn-based perovskite solar cells with efficiency exceeding 20%. Rare Met. 2024;43(11):5720–33. doi:10.1007/s12598-024-02775-w. [Google Scholar] [CrossRef]
28. Wang J, Wang Y, Liu X, Wang X. Prediction and screening of lead-free double perovskite photovoltaic materials based on machine learning. Molecules. 2025;30(11):2378. doi:10.3390/molecules30112378. [Google Scholar] [PubMed] [CrossRef]
29. Chen Z, Wang J, Li C, Liu B, Luo D, Min Y, et al. Highly versatile and accurate machine learning methods for predicting perovskite properties. J Mater Chem C. 2024;12(38):15444–53. doi:10.1039/d4tc02268h. [Google Scholar] [CrossRef]
30. Li X, Mai Y, Lan C, Yang F, Zhang P, Li S. Machine learning-assisted design of high-performance perovskite photodetectors: a review. Adv Compos Hybrid Mater. 2024;8(1):27. doi:10.1007/s42114-024-01113-z. [Google Scholar] [CrossRef]
31. Ye XY, Yuan WB, Fu PF, Yang XY, Chu XW, Bai Y, et al. A full-process artificial intelligence framework for perovskite solar cells. Sci China Mater. 2025;68(7):2526–35. doi:10.1007/s40843-025-3416-3. [Google Scholar] [CrossRef]
Cite This Article
 Copyright © 2025 The Author(s). Published by Tech Science Press.
This work is licensed under a Creative Commons Attribution 4.0 International License , which permits unrestricted use, distribution, and reproduction in any medium, provided the original work is properly cited.
 Downloads
 Citation Tools