
 Submit a Paper
 Propose a Special lssue
 Open Access
ARTICLE

Multimodal Signal Processing of ECG Signals with Time-Frequency Representations for Arrhythmia Classification
1 Research Institute of AI Convergence, Hanyang University ERICA, Ansan, 15588, Republic of Korea
2 Department of Computer Science and Engineering, Hanyang University, Ansan, 15588, Republic of Korea
3 Department of Artificial Intelligence, Hanyang University, Ansan, 15588, Republic of Korea
* Corresponding Author: Kyungtae Kang. Email:
(This article belongs to the Special Issue: Recent Advances in Signal Processing and Computer Vision)
Computer Modeling in Engineering & Sciences 2026, 146(2), 35 https://doi.org/10.32604/cmes.2026.077373
Received 08 December 2025; Accepted 15 January 2026; Issue published 26 February 2026
 View Full Text
 Download PDF
Abstract
Arrhythmias are a frequently occurring phenomenon in clinical practice, but how to accurately distinguish subtle rhythm abnormalities remains an ongoing difficulty faced by the entire research community when conducting ECG-based studies. From a review of existing studies, two main factors appear to contribute to this problem: the uneven distribution of arrhythmia classes and the limited expressiveness of features learned by current models. To overcome these limitations, this study proposes a dual-path multimodal framework, termed DM-EHC (Dual-Path Multimodal ECG Heartbeat Classifier), for ECG-based heartbeat classification. The proposed framework links 1D ECG temporal features with 2D time–frequency features. By setting up the dual paths described above, the model can process more dimensions of feature information. The MIT-BIH arrhythmia database was selected as the baseline dataset for the experiments. Experimental results show that the proposed method outperforms single modalities and performs better for certain specific types of arrhythmias. The model achieved mean precision, recall, and F1 score of 95.14%, 92.26%, and 93.65%, respectively. These results indicate that the framework is robust and has potential value in automated arrhythmia classification.Keywords
Arrhythmia is the most common condition among patients with cardiovascular disease [1,2]. There are many types of arrhythmias, and many of these types are difficult to detect in their early stages. This can lead to delayed diagnosis for patients, or doctors misinterpreting information due to subtle differences in manual reading. This can result in outcomes such as heart failure or sudden death for the patient. Electrocardiogram (ECG) is the most commonly used tool for clinicians to diagnose arrhythmia. Doctors can manually interpret and label the generated ECG signal waveforms, and diagnose diseases based on abnormal changes [3]. This places a high demand on doctors’ clinical experience, enabling them to quickly and accurately detect abnormalities and make diagnoses of patients’ complex conditions. To improve diagnostic efficiency and compensate for errors caused by doctors’ human intervention, it is crucial to develop reliable automated systems that utilize large amounts of ECG data to assist in the diagnosis of arrhythmias.
In recent years, the advancements in deep learning have significantly improved the automatic identification of arrhythmias. It has been found that convolutional neural networks (CNNs) [4] can directly learn complex electrocardiogram features from raw signals. However, most existing approaches rely on a single type of input, which restricts the range of information that can be captured. For example, one-dimensional CNNs mainly focus on temporal variations in the signal and therefore overlook many frequency-related patterns that are important for distinguishing certain arrhythmias, such as atrial rhythm disorders. On the other hand, methods that convert ECG signals into two-dimensional time–frequency representations [5,6] enable the extraction of frequency-domain characteristics, but this transformation often compresses or weakens temporal details. If features from both of these data formats can be obtained simultaneously, it will be more advantageous for classifying arrhythmia categories with small or complex details.
To address the aforementioned issues, this study proposes a multimodal learning framework. This framework can simultaneously process feature information from both the time and frequency domains. These features include the original one-dimensional electrocardiogram signal and the corresponding two-dimensional time-frequency signal generated by continuous wavelet transform (CWT). Compared to existing methods that rely on a single modality, this design enables the model to capture a more comprehensive representation of cardiac activity, thereby improving its ability to characterize subtle and complex arrhythmia patterns. Unlike previous methods that primarily focus on temporal or spectral features, the proposed framework explicitly combines these two domains within a unified learning architecture [7].
To correspond with the proposed multimodal framework, this study separates ECG signals into the time and frequency domains. For the inherently complex ECG signal, this separation better compensates for the omissions in single-modal features. In practice, differences in frequency bands or spectra can help distinguish arrhythmia categories. Time-domain analysis, on the other hand, can determine the characteristic expressions of waveform and periodic variations. Through these complementary forms of data, the original ECG signal can be processed more efficiently. Simultaneously, this type of method indirectly augments the data, offering greater reliability and realism compared to generative data augmentation methods. This design avoids over-reliance on handcrafted features or complex preprocessing procedures, thus maintaining the model’s generality and robustness.
Unlike existing multimodal ECG classification methods, the proposed Dual-Path Multimodal Electrocardiogram Heartbeat Classifier (DM-EHC) emphasizes a lightweight dual-path architecture that balances representational capacity and computational efficiency. Instead of relying on complex fusion strategies or deeply stacked multi-branch networks, DM-EHC adopts a simple yet effective fusion mechanism to integrate complementary features from the time and frequency domains. This design enables efficient feature interaction while maintaining a relatively low computational burden. As a result, the proposed DM-EHC achieves a favorable trade-off between model complexity and classification performance, making it well suited for practical deployment scenarios. Experimental results on the MIT-BIH arrhythmia dataset further demonstrate that DM-EHC consistently outperforms single-modality approaches and achieves competitive performance compared with more complex architectures.
Nowadays, a large amount of medical clinical data is publicly available for research, and it is because of this data that deep learning can be widely applied. In particular, in the areas of medical signals and medical imaging, these data can be used for tasks such as disease detection [8–10]. It is precisely because of the emergence of these auxiliary diagnostic tools that doctors’ work efficiency and diagnostic accuracy have been greatly improved [11–13].
Cardiac arrhythmia classification is a very important part of disease detection. The use of deep learning as an auxiliary diagnostic tool for cardiac arrhythmias has always been an important research direction. This method does not require professionals to provide features for judgment; it can directly extract signal features through neural networks. However, during the research process, it was found that doctors still needed to label a large amount of data, which was very labor-intensive. Furthermore, the infrequent occurrence of certain heart rate types can lead to class imbalances in the datasets, making the identification of these rare arrhythmias extremely difficult. The problems mentioned above are all significant challenges faced in the actual research process.
The MIT-BIH arrhythmia database is the standard database for arrhythmia classification research, and many studies use it as a benchmark. Acharya et al. [14] segmented ECG signals into short ECG segments of 2 and 5 s. The CNN model achieved accuracy of 92.5% and 94.9% under these two input conditions, respectively. This shows that different input windows affect the accuracy of classification. In order to reduce the sensitivity caused by the input window, Ferretti et al. [15] standardized the signal to ensure that each input sample had a consistent length and constructed a more lightweight one-dimensional convolutional neural network, which can more quickly classify arrhythmias from standard ECG records. However, during the analysis of the dataset, it was found that the data classes were highly imbalanced. Ahmed et al. [3] also discovered this problem. In addition to using deep learning models to classify arrhythmias normally, they also added a class weighting strategy during training to improve the sensitivity of a few arrhythmia classes, but the results were not ideal. Hua et al. [16] improved the model’s ability to identify latent features by changing the length of the input samples to three consecutive ECG peaks instead of a single pulse signal. This method improved the model’s ability to learn dependencies between multiple cardiac cycles by broadening the time range of the input samples. In addition to improving accuracy through better preprocessing of input data, another direction is to better express the characteristics of ECG signals. Hassan et al. [17] improved the feature extraction and representation capabilities of ECG signals by changing the model architecture. They combined a one-dimensional convolutional neural network with a Bi-LSTM module to jointly model local waveform characteristics and longer-distance temporal patterns. Although this method improved accuracy, it also brought higher computational overhead.
In addition to improving feature representation by changing the model structure, researchers have also begun to focus on how to further enrich the feature information that the model can utilize. Following this line of thought, recent research has moved beyond simply using one-dimensional raw electrocardiogram signals. Techniques such as time-frequency variations have been employed to transform the raw signals into two-dimensional representations. This allows the model to acquire more detailed features, thereby improving the performance of arrhythmia classification [6,18–20].
Some studies have begun to attempt to transform ECG signals into two-dimensional images for classification. Izci et al. [21] were among the earliest examples. Through simple grayscale transformation, a single heartbeat was converted into a 128 × 128 two-dimensional grayscale image. By leveraging the mature two-dimensional image feature extraction capabilities of two-dimensional convolutional neural networks, the recognition effect was improved, achieving an accuracy of 97.42%. This method has been proven to improve feature representation, and subsequent studies have begun to explore the use of different time-frequency transformation methods to transform two-dimensional images. Huang et al. [22] further attempted to use short-time Fourier transform (STFT) to generate the time-frequency spectrum of ECG signal. Compared to simple grayscale conversion, the spectrum generated by STFT can more clearly show the frequency changes of ECG signal in different time periods, providing richer features for the model. The final classification accuracy reached 99%. However, the study found that the window selection in the STFT method for ECG signal is very sensitive because the electrocardiogram signal has a very high degree of irregularity. To solve this drawback, the method of converting the ECG signal into a time-frequency image using CWT has emerged. Al Rahhal et al. [23] also used the ImageNet pre-training method to verify that higher performance was achieved in detecting VEB and SVEB categories. Mohonta et al. [24] also proposed a similar method. Compared to methods that process raw ECG signal alone, using two-dimensional graphs with time-frequency characteristics as the research object has stronger classification performance in distinguishing complex arrhythmias.
As research into single-mode characteristics continues to deepen, researchers have found that neither directly processing the original signal nor generating time-frequency scalograms using methods such as time-frequency transformation can fully provide all the information in an ECG signal. This has prompted researchers to consider whether multiple feature modalities can be used simultaneously to provide a more comprehensive description of the ECG signal. In this context, multimodal learning [25] has gradually become a new development direction. By combining the original waveform and time-frequency features, the reliability of classification can be further improved.
Ahmad et al. [26] adopted a multimodal strategy and developed a multimodal framework to convert electrocardiogram signals into three different two-dimensional representations—Gramia angle field (GAF), recurrence plot (RP), and Markov transition field (MTF). These representations were then used as three-channel inputs to synthesize a CNN for feature learning. Experiments on the MIT-BIH and PTB databases reported an accuracy of 99.7% for arrhythmia classification and 99.2% for myocardial infarction. This result also demonstrates the significant advantage of multimodal fusion in addressing class imbalance. Meanwhile, another study explored the combination of time and frequency domains. Wang et al. [5] integrated the time-frequency characteristics derived from CWT with RR interval information. Unlike the aforementioned multimodal fusion, they used more refined time-frequency information as an additional supplement. By fusing these complementary modalities through a CNN and a fully connected layer, the performance of arrhythmia classification was improved.
Previous studies have also explored combining handcrafted features with machine learning-based models to enhance the ability to classify arrhythmias. For example, Dhanka and Maini [27] proposed a hybrid framework that integrates optimized feature representations with machine learning classifiers, demonstrating the benefit of combining complementary information. As summarized in Table 1, existing ECG classification methods still exhibit inherent limitations, highlighting the need for more effective feature integration strategies.
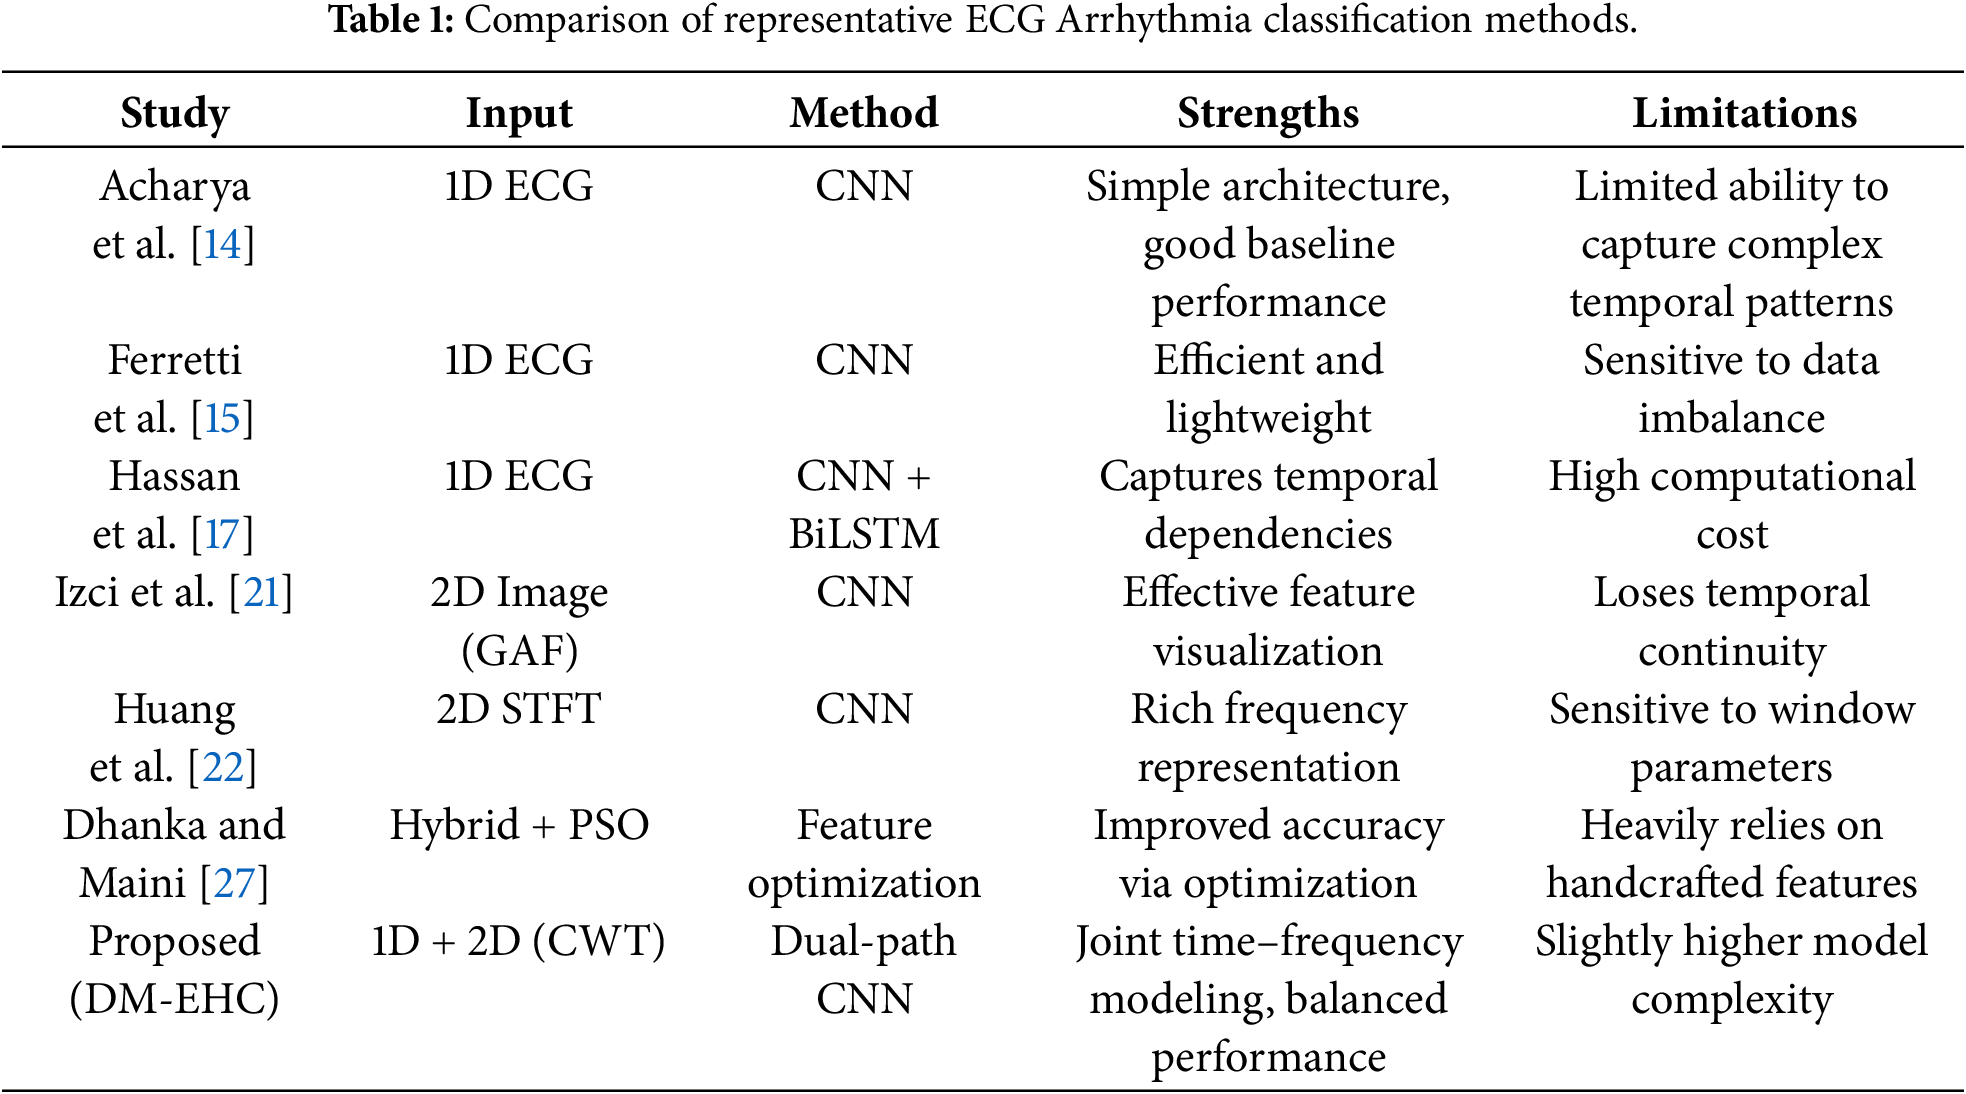
Overall, current approaches span three categories: one-dimensional signal processing, two-dimensional image transformation, and multimodal fusion. While 1D methods efficiently capture temporal patterns, they neglect frequency information; 2D methods provide spectral features but often underutilize sequential context. In contrast, multimodal fusion, by integrating complementary information from the time and frequency domains, shows greater potential in mitigating class imbalance and detecting a minority of arrhythmias.
3.1.1 MIT-BIH Arrhythmia Database
One of the most widely used standard datasets in the field of ECG signal analysis and arrhythmia detection studies is the MIT-BIH Arrhythmia Database [28] (https://www.physionet.org/content/mitdb/1.0.0/).
As one of the first benchmark datasets for arrhythmia, the MIT-BIH dataset is routinely used to evaluate and compare algorithms, ensuring study comparability. This dataset with a range of arrhythmia kinds, moderate data size, and high annotation quality is suited for testing the suggested technique. Recent ECG datasets have increased in scale and diversity, however differing acquisition equipment affect sampling frequencies and signal quality, and some data still have a lot of noise or wrong annotations. Since these factors may impair research stability and comparability, the MIT-BIH dataset is still the best option.
Two specialists in cardiology separately finished the annotation of the MIT-BIH arrhythmia database, and each heartbeat’s type was checked and validated. Researchers can train and assess automatic arrhythmia detection algorithms using the high-quality benchmark dataset these annotations offer. The data is regarded as one of the authoritative datasets in the field of arrhythmia research due to its excellent annotation quality and range of arrhythmia forms. This work uses its high-quality annotations and different arrhythmia types to train and evaluate models for data sample imbalance and multi-class heartbeat classification. This dataset also provides frequent and unusual arrhythmia samples to assist the model execute extensive minority arrhythmia recognition performance testing, boosting classification accuracy and generalization.
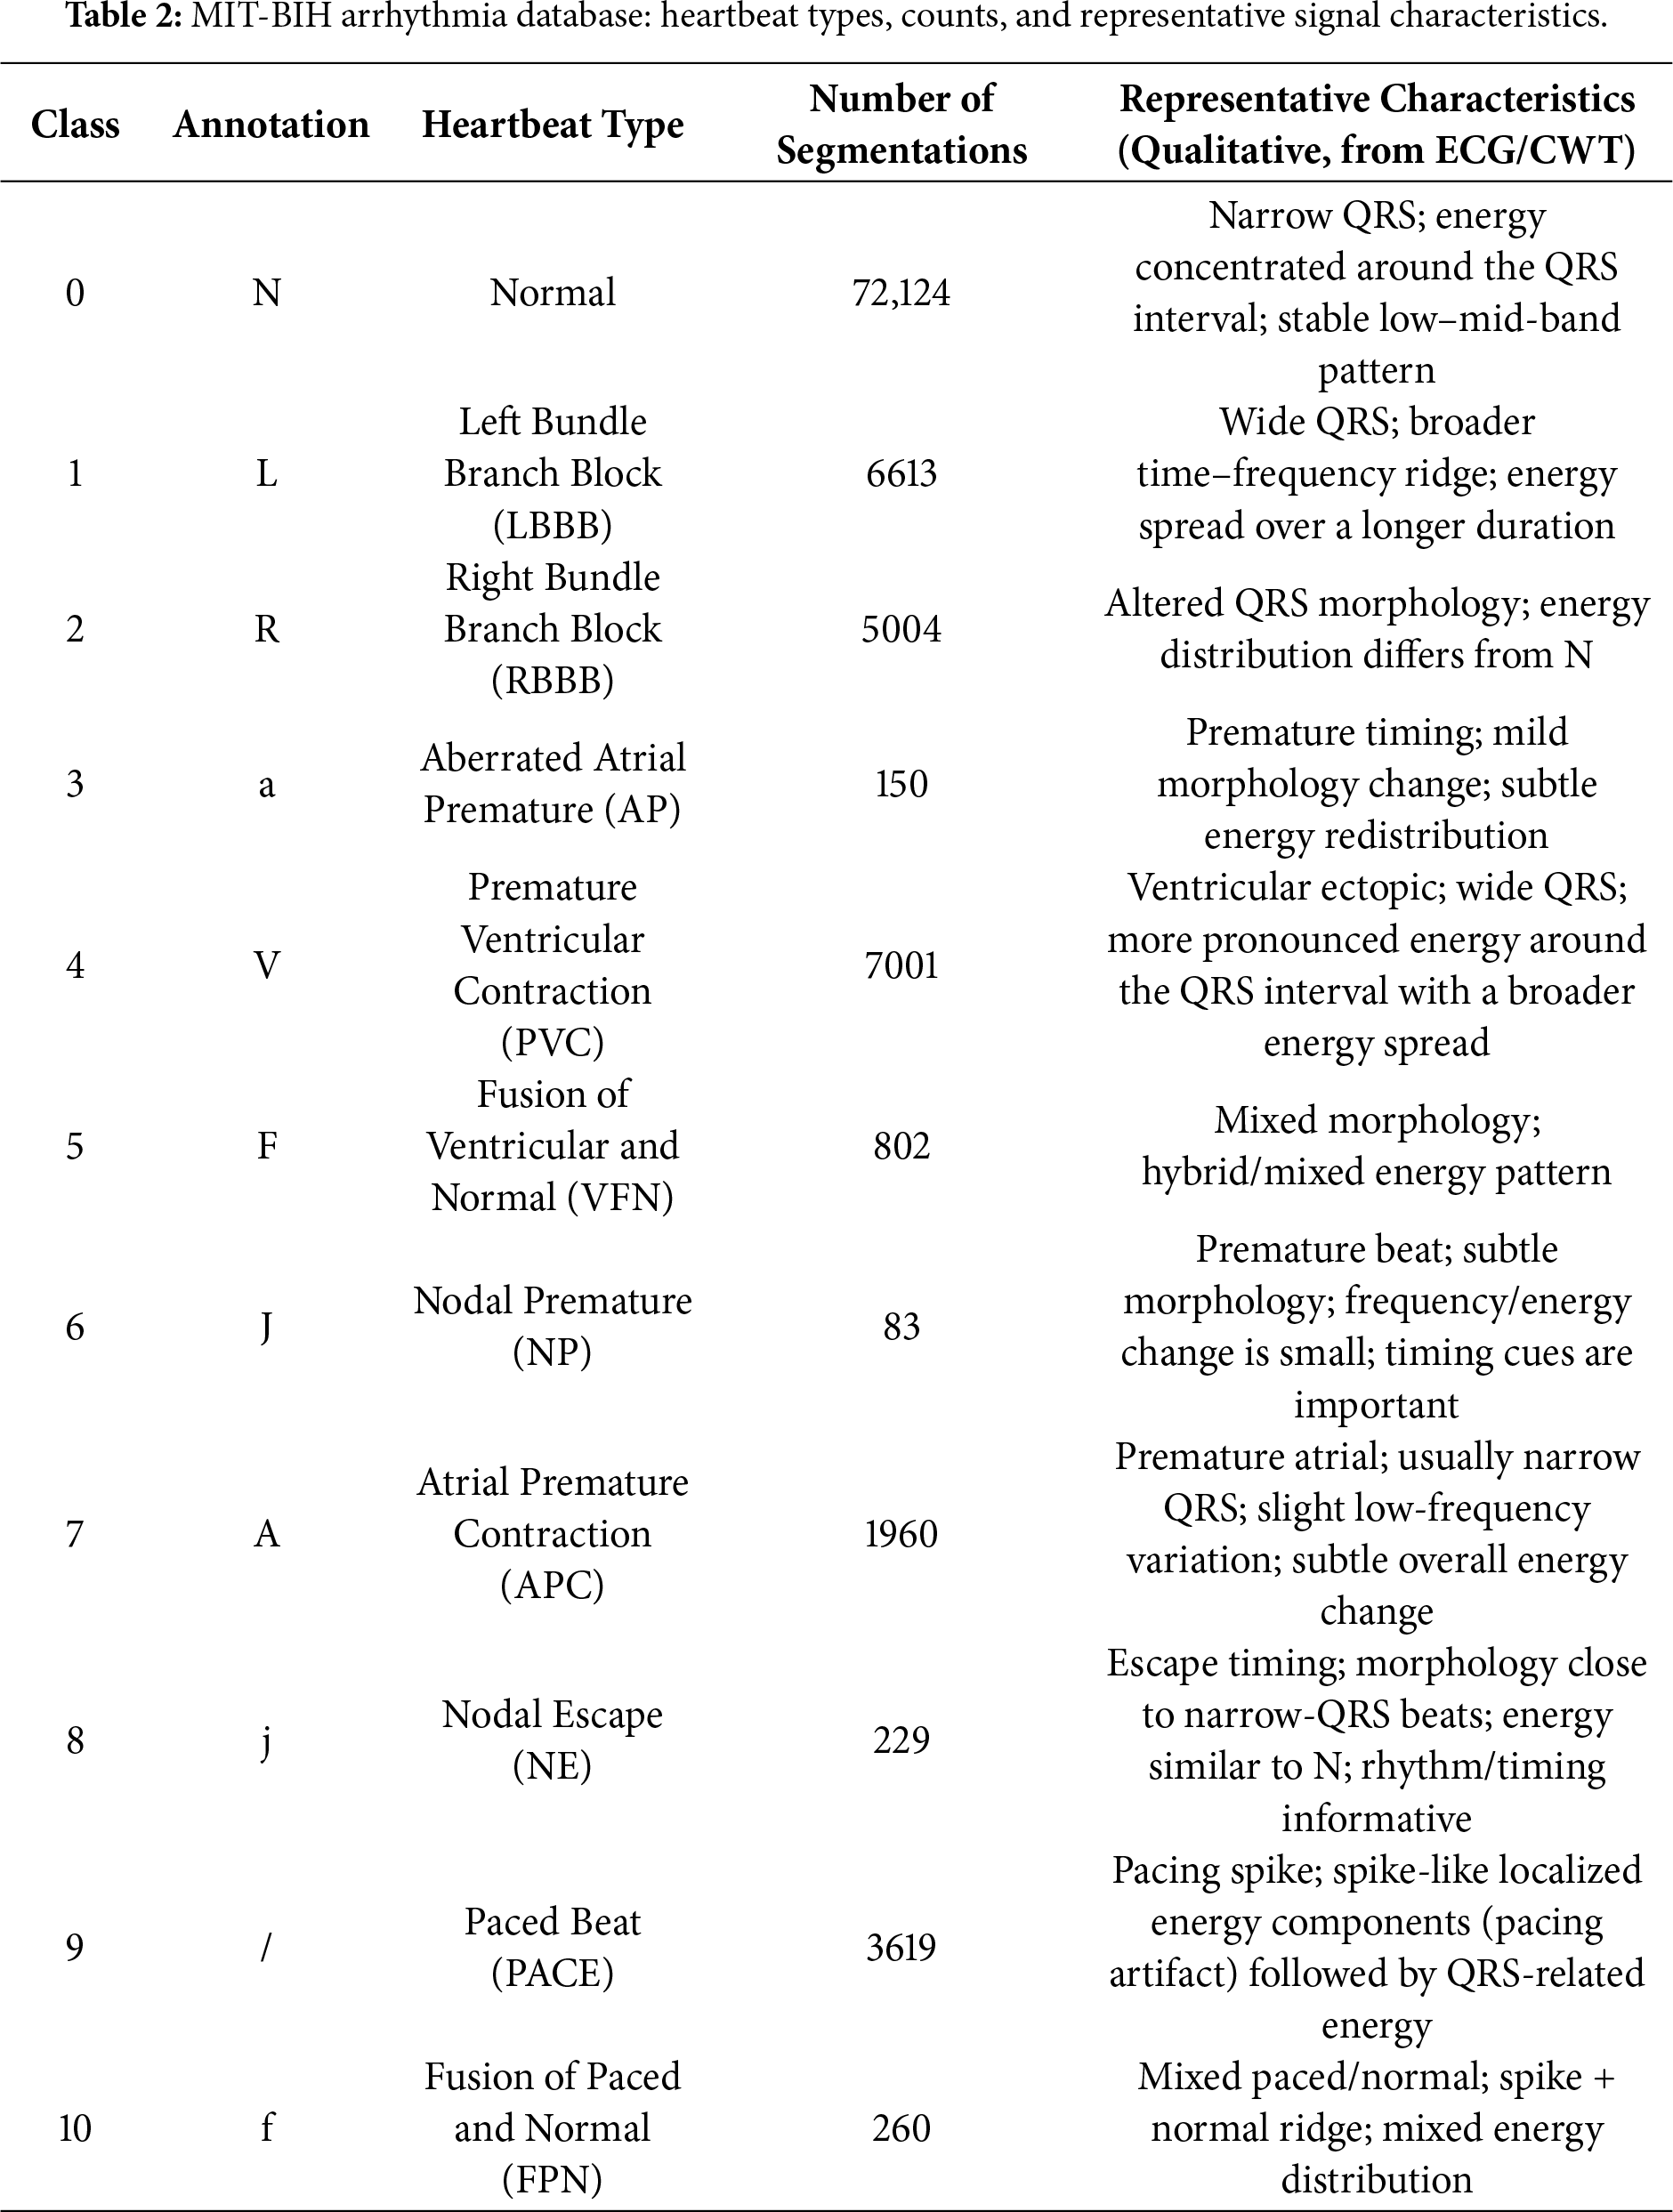
The dataset includes two channels: MLII (Modified Lead II), widely used in ECG research for its clear representation of P waves, QRS complexes (Q wave-R wave-S wave complex), and T waves, and either V1 or V5, chosen based on patient or recording conditions. This study primarily uses channel MLII as the data source. The ECG signals were segmented based on heartbeat annotations and the proposed method, with details of heart type, annotation, quantity and representative characteristics shown in Table 2.
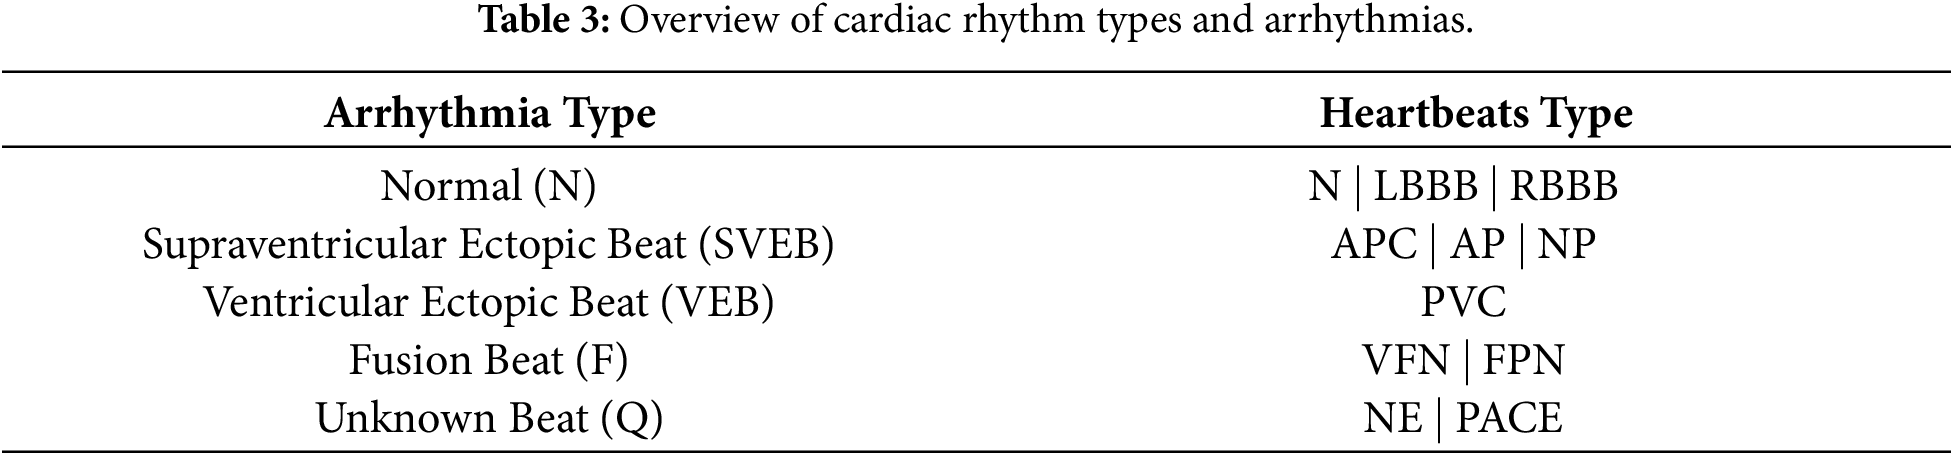
Arrhythmias are often classified into four categories: tachycardia, bradycardia, atrial fibrillation, and premature beats [29]. Nonetheless, the classification will be more comprehensive during the actual diagnostic procedure [30]. More information about the relationship between different heartbeat types and the arrhythmia they are linked to [31], based on the criteria set by the Association for the Advancement of Medical Instrumentation (AAMI), is provided in Table 3.
3.1.2 Preprocessing of ECG Signals
Raw ECG signals collected during long-term monitoring are prone to interference from multiple noise sources, which can substantially hinder downstream signal interpretation if not properly handled [32,33]. In practice, filtering methods are often adopted to attenuate irrelevant frequency components while maintaining the morphological integrity of the underlying waveform. Without such processing, the signal amplitude may fluctuate between –2 and +2 V, and poorly chosen filter parameters may inadvertently distort clinically relevant information. Among the various artifacts, baseline wander is one of the most frequently encountered, typically arising from respiratory movements or subtle shifts in body position and leading to slow drifts or distortions of the isoelectric baseline. Myoelectric interference is another common contaminant, especially in ECG recordings obtained during physical activity, introducing high-frequency perturbations into the waveform. To mitigate these effects, this study applies a fourth-order Butterworth bandpass filter with a passband of 0.5–15 Hz [34], which suppresses low-frequency baseline fluctuations and high-frequency noise while preserving the essential ECG features needed for accurate analysis.
In the preprocessing stage of this study, Z-score normalization was employed to place ECG recordings on a comparable amplitude scale, allowing the model to learn from inputs with differing signal magnitudes. This procedure rescales each sample using the global mean and standard deviation of the signal so that the transformed data has an approximate mean of zero and a standard deviation of one. By doing so, variations arising from subject-specific amplitude differences are substantially reduced. The formulation of the Z-score is presented in Eq. (1).
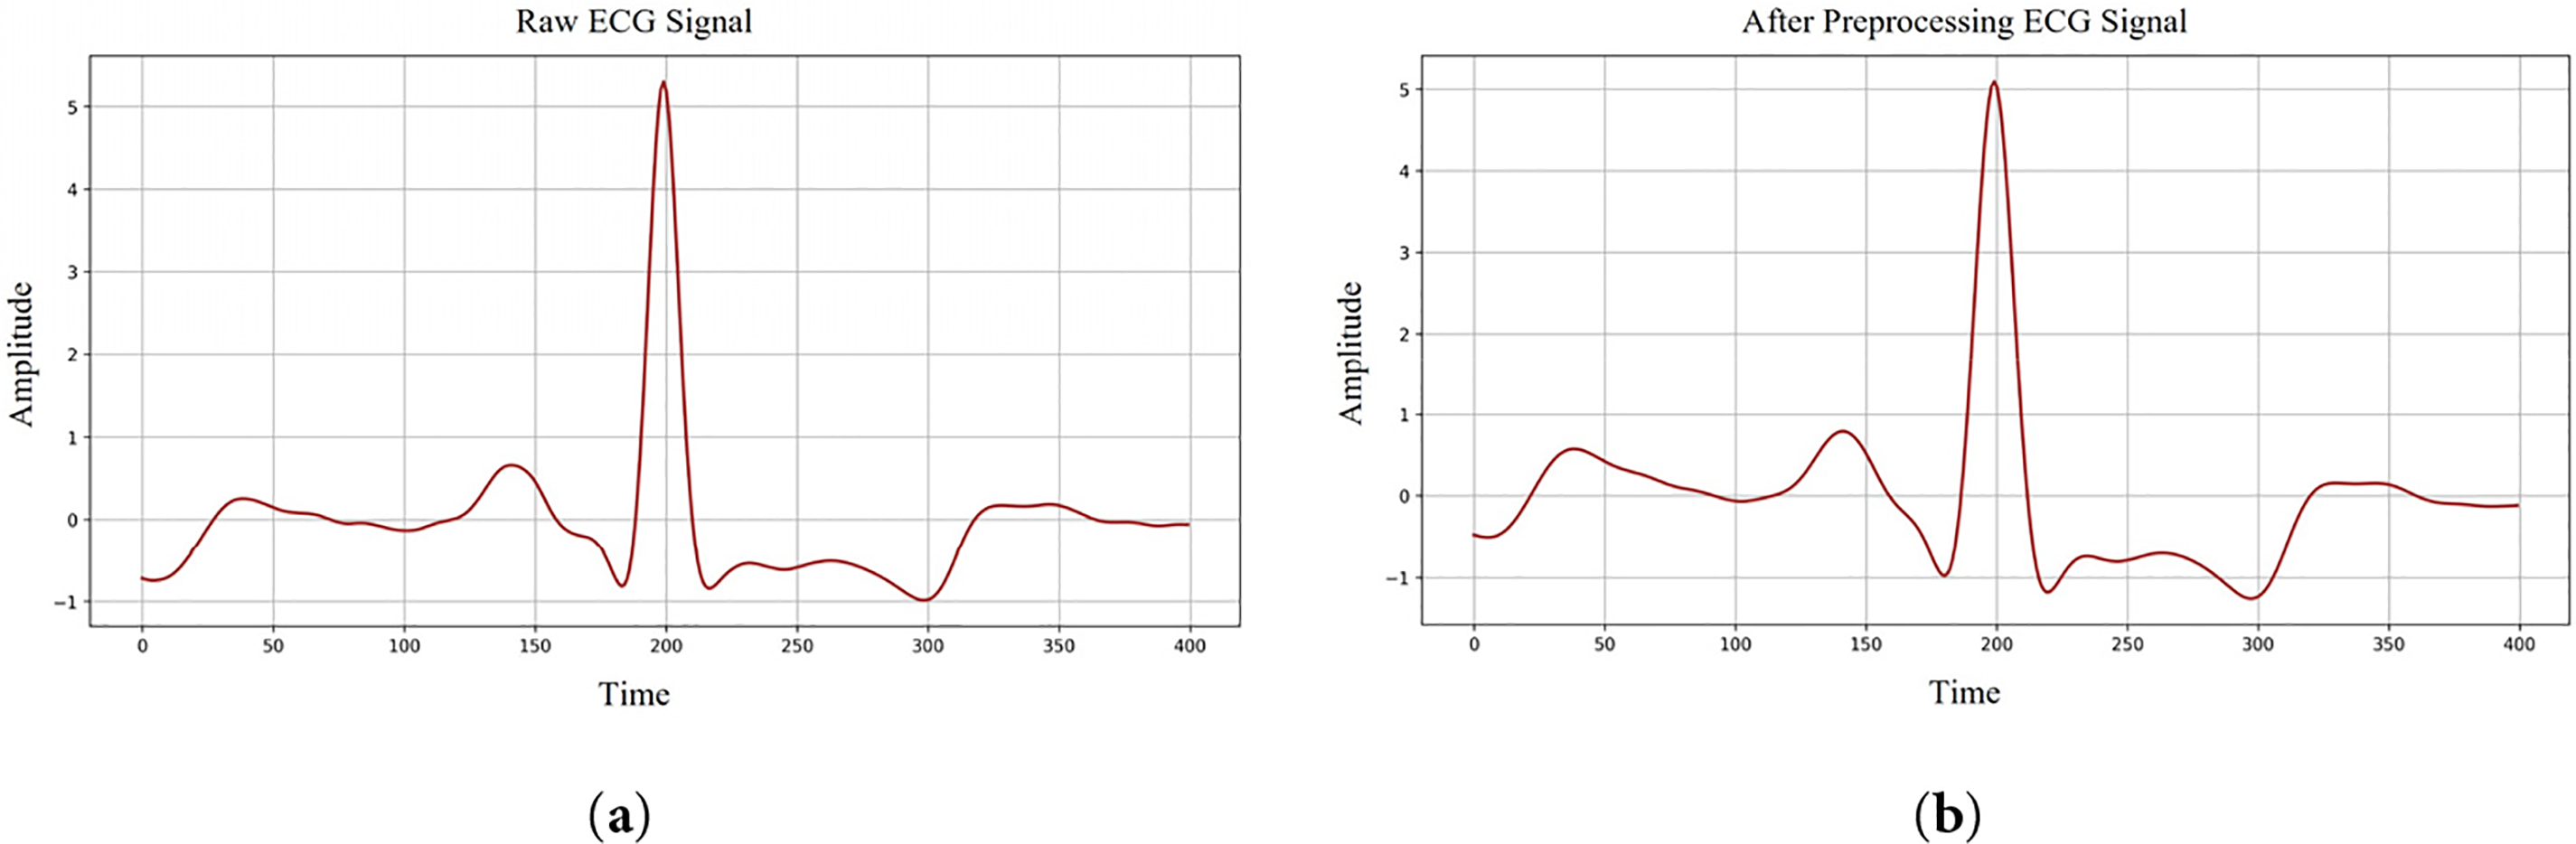
Figure 1: ECG signals denoising process. (a) Raw ECG signal shape; (b) After preprocessing ECG signal shape.
The ECG signal was then segmented to accurately identify individual heartbeat types. The average cardiac cycle lasts approximately 0.6–1.2 s [35]. With a sampling rate of 360 Hz, each cycle corresponds to about 400 data points. In this study, each segment was centered on the QRS complex peak (R point), including 200 points before and 200 points after the peak. This window captures the complete waveform of each heartbeat and provides comprehensive ECG features for classification. The segmentation procedure is illustrated in Fig. 2. By incorporating full-cycle information, this segmentation strategy improves arrhythmia detection accuracy and ensures that the model classifies based on independent heartbeat information.
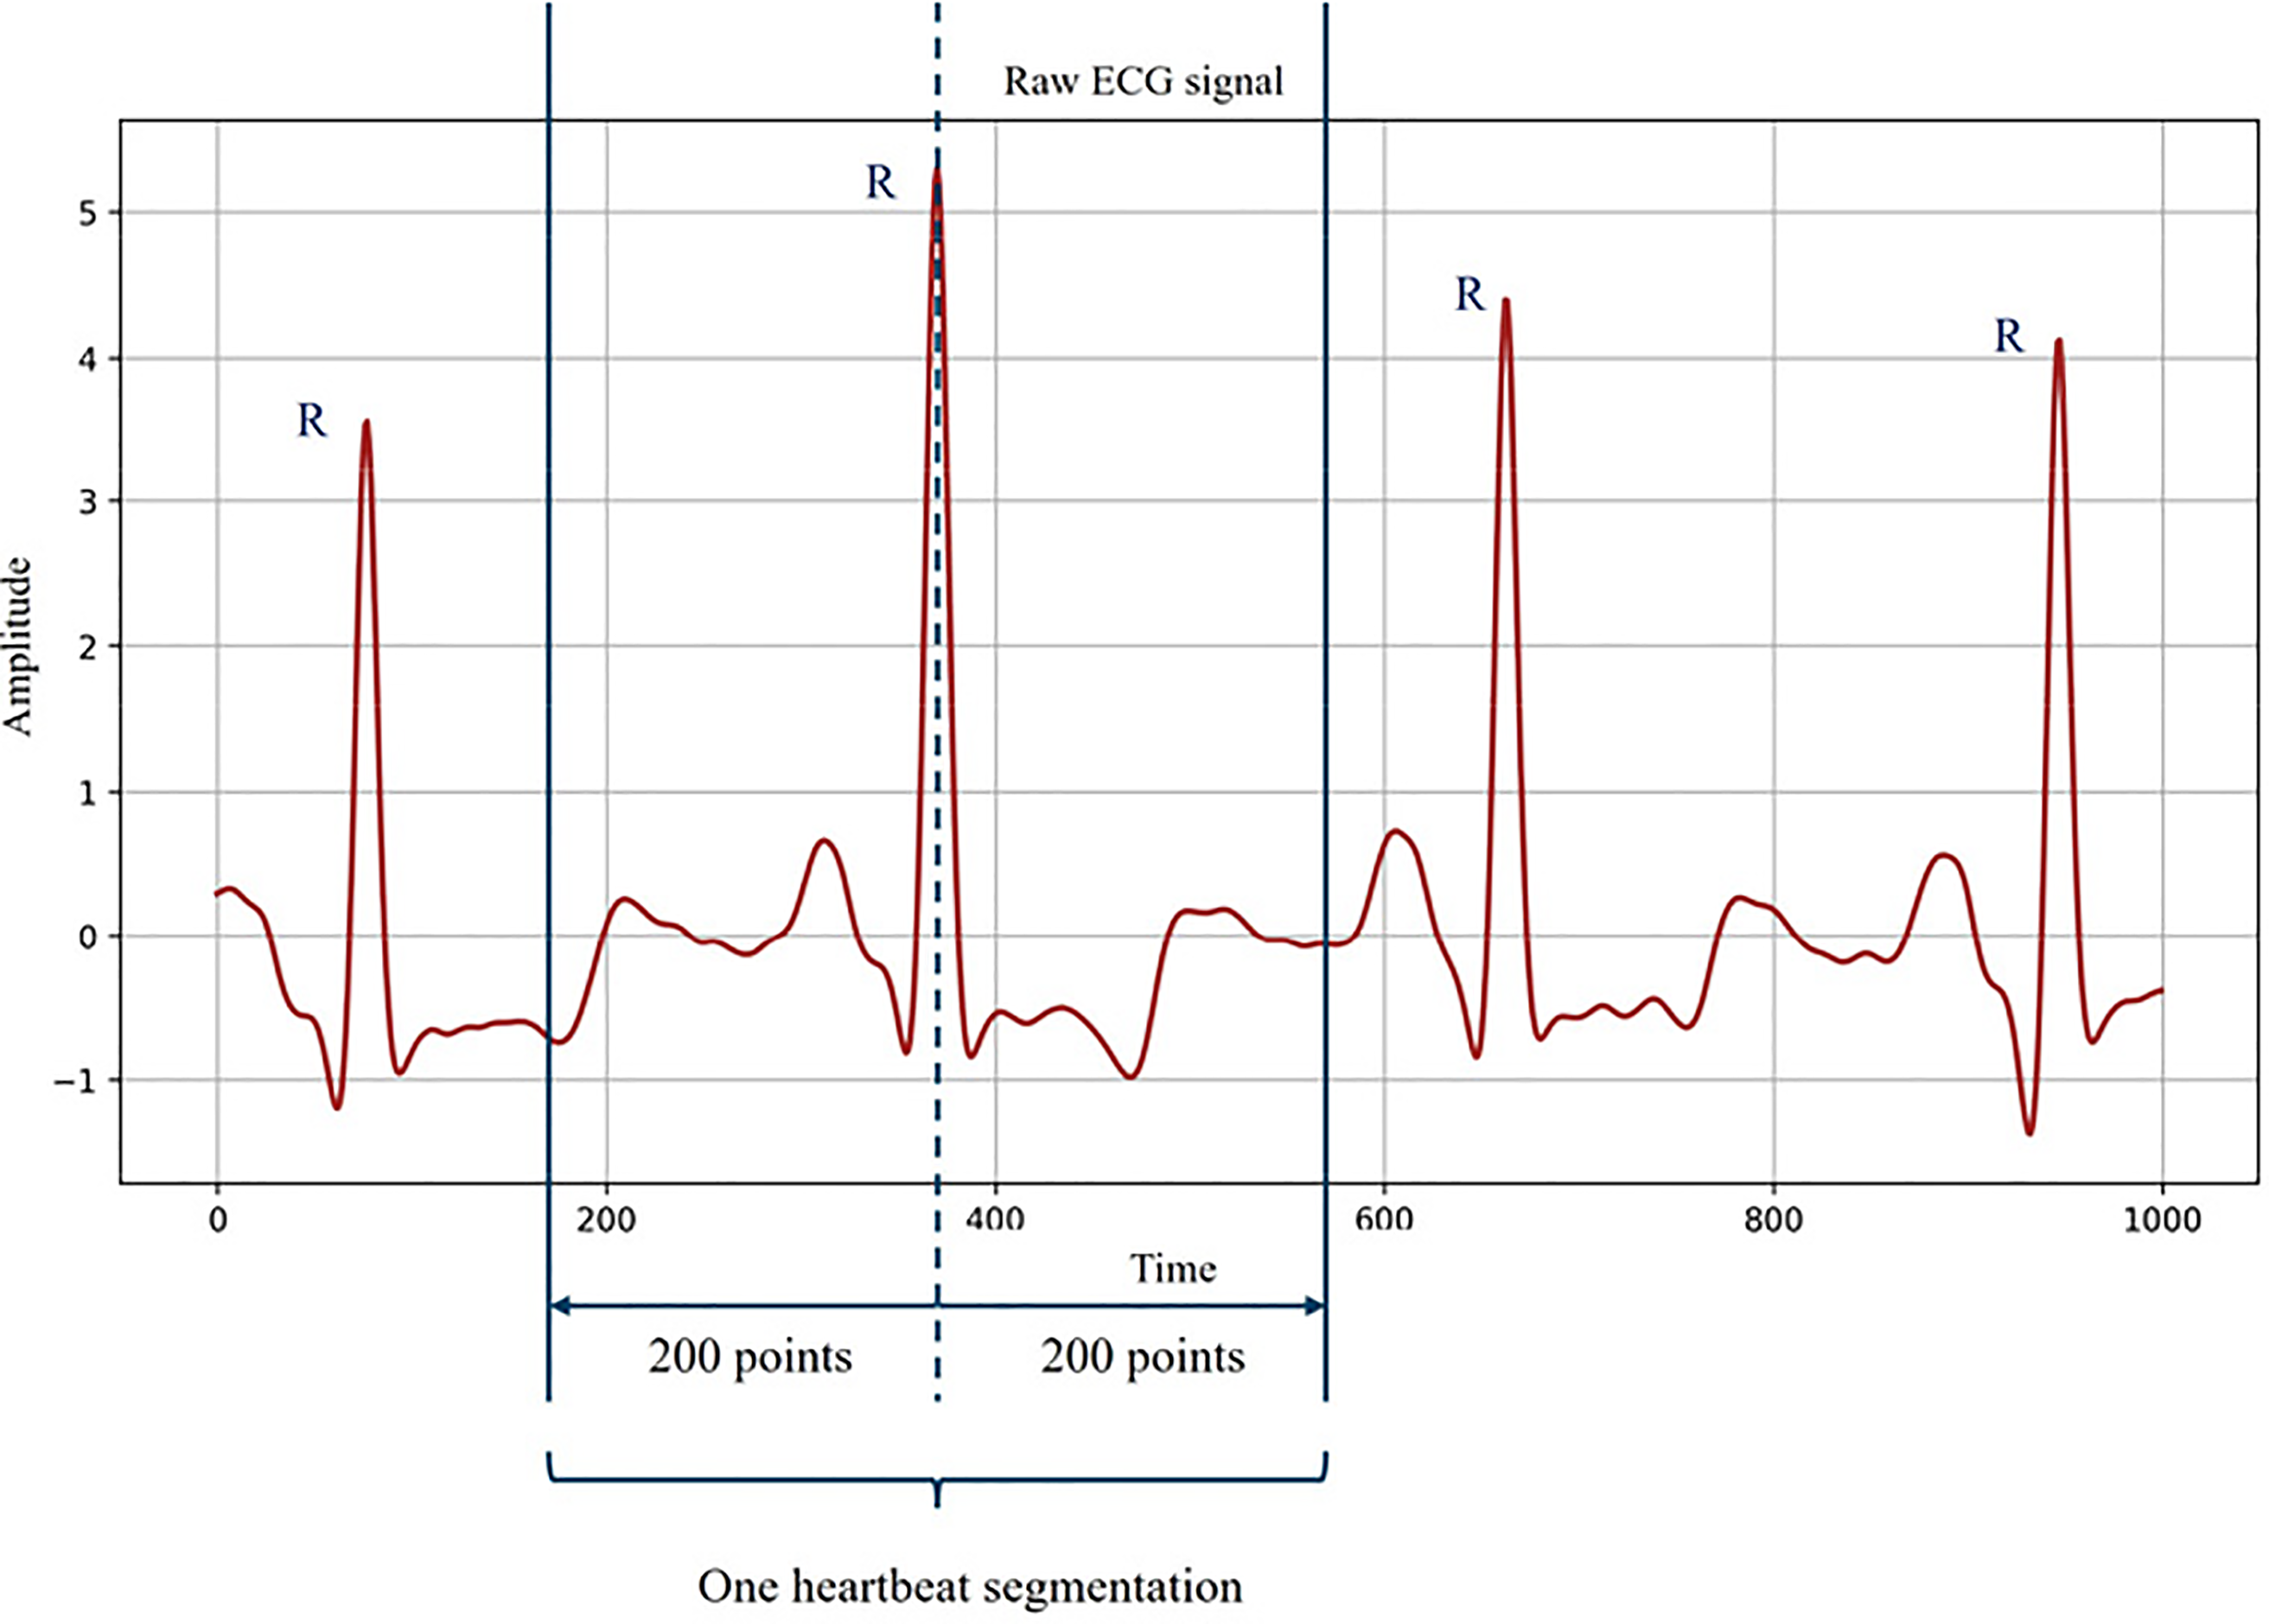
Figure 2: One heartbeat segmentation from ECG signal.
It is important to note that the classification task in this study was based on the heartbeat level rather than the patient level. Although multiple heartbeats may originate from the same subject, significant variability exists within subjects due to physiological fluctuations and noise. Therefore, heartbeat-level classification is a commonly used method in arrhythmia analysis. To avoid information leakage, segmentation and preprocessing steps were performed before model training. This design ensures that the model can learn discriminative morphological patterns from individual heartbeats, rather than memorizing patient-specific characteristics. Similar heartbeat-level assessment strategies have been widely applied in previous ECG classification studies, providing a reasonable and standardized basis for performance comparisons.
3.2 Time–Frequency Representation of ECG Signals via Continuous Wavelet Transform
Arrhythmia classification in ECG signal processing depends on the ability to capture the time-frequency features of the signal. Sometimes the complicated cardiac pathogenic traits cannot be revealed with just one time domain characteristic. Consequently, as a time-frequency analysis method, CWT is extensively applied to transform one-dimensional time series into two-dimensional images [34], so enabling the model to extract characteristics in both time and frequency domains concurrently.
CWT is a time-frequency analysis tool for concurrently extracting the time and frequency features of a signal. CWT is very appropriate for studying non-stationary signals, such as ECG signals [35]. Since it can preserve time information unlike conventional Fourier transform. CWT enables tracking changes in the signal overtime and recording them at several frequencies. Previous studies have shown that in CWT, a family of wavelets capable of representing signals at multiple resolutions can be formed by scaling and translating the mother wavelet. These wavelet families correspond to different frequency bands of the examined signal [36]. The size of the stretching scale corresponds to the low and high frequencies of the signal band, respectively. The translation operation is used to identify the occurrence time of specific frequency components.
The continuous wavelet transform (CWT) is defined in Eq. (2):
where
In continuous wavelet analysis, the mother wavelet needs to be selected strategically based on the characteristics of the research object. In this case study, the ECG waveform consists of multiple characteristic components, among which the P wave, QRS complex, and T wave need to be considered. These three waveforms each occupy different frequency ranges and have their own unique temporal characteristics. Based on these considerations, to fully process the characteristics of the ECG waveform, this study adopted the Morlet wavelet as the standard for ECG signal analysis. The Morlet wavelet has the characteristic of time-frequency positioning balance, which enables it to distinguish between rapidly changing and slowly changing components in a signal [37]. Due to this characteristic, it can highlight the high-frequency QRS complex while retaining information of the low-frequency P wave and T wave during processing.
In this study, the time-frequency representations of all 11 heart rate categories are presented. Fig. 3 shows the graphical representation generated for each category. As can be seen from Fig. 3, in the high-frequency range, the QRS complex forms a concentrated region of strong energy, specifically manifested as a clearly visible spike in the graph. Its temporal location and corresponding high-frequency content are easily identifiable. In contrast, the P wave and T wave changes are smoother and slower. These two waveforms mainly appear in the lower-frequency region with noticeably weaker energy, blue-toned areas in the scalogram.
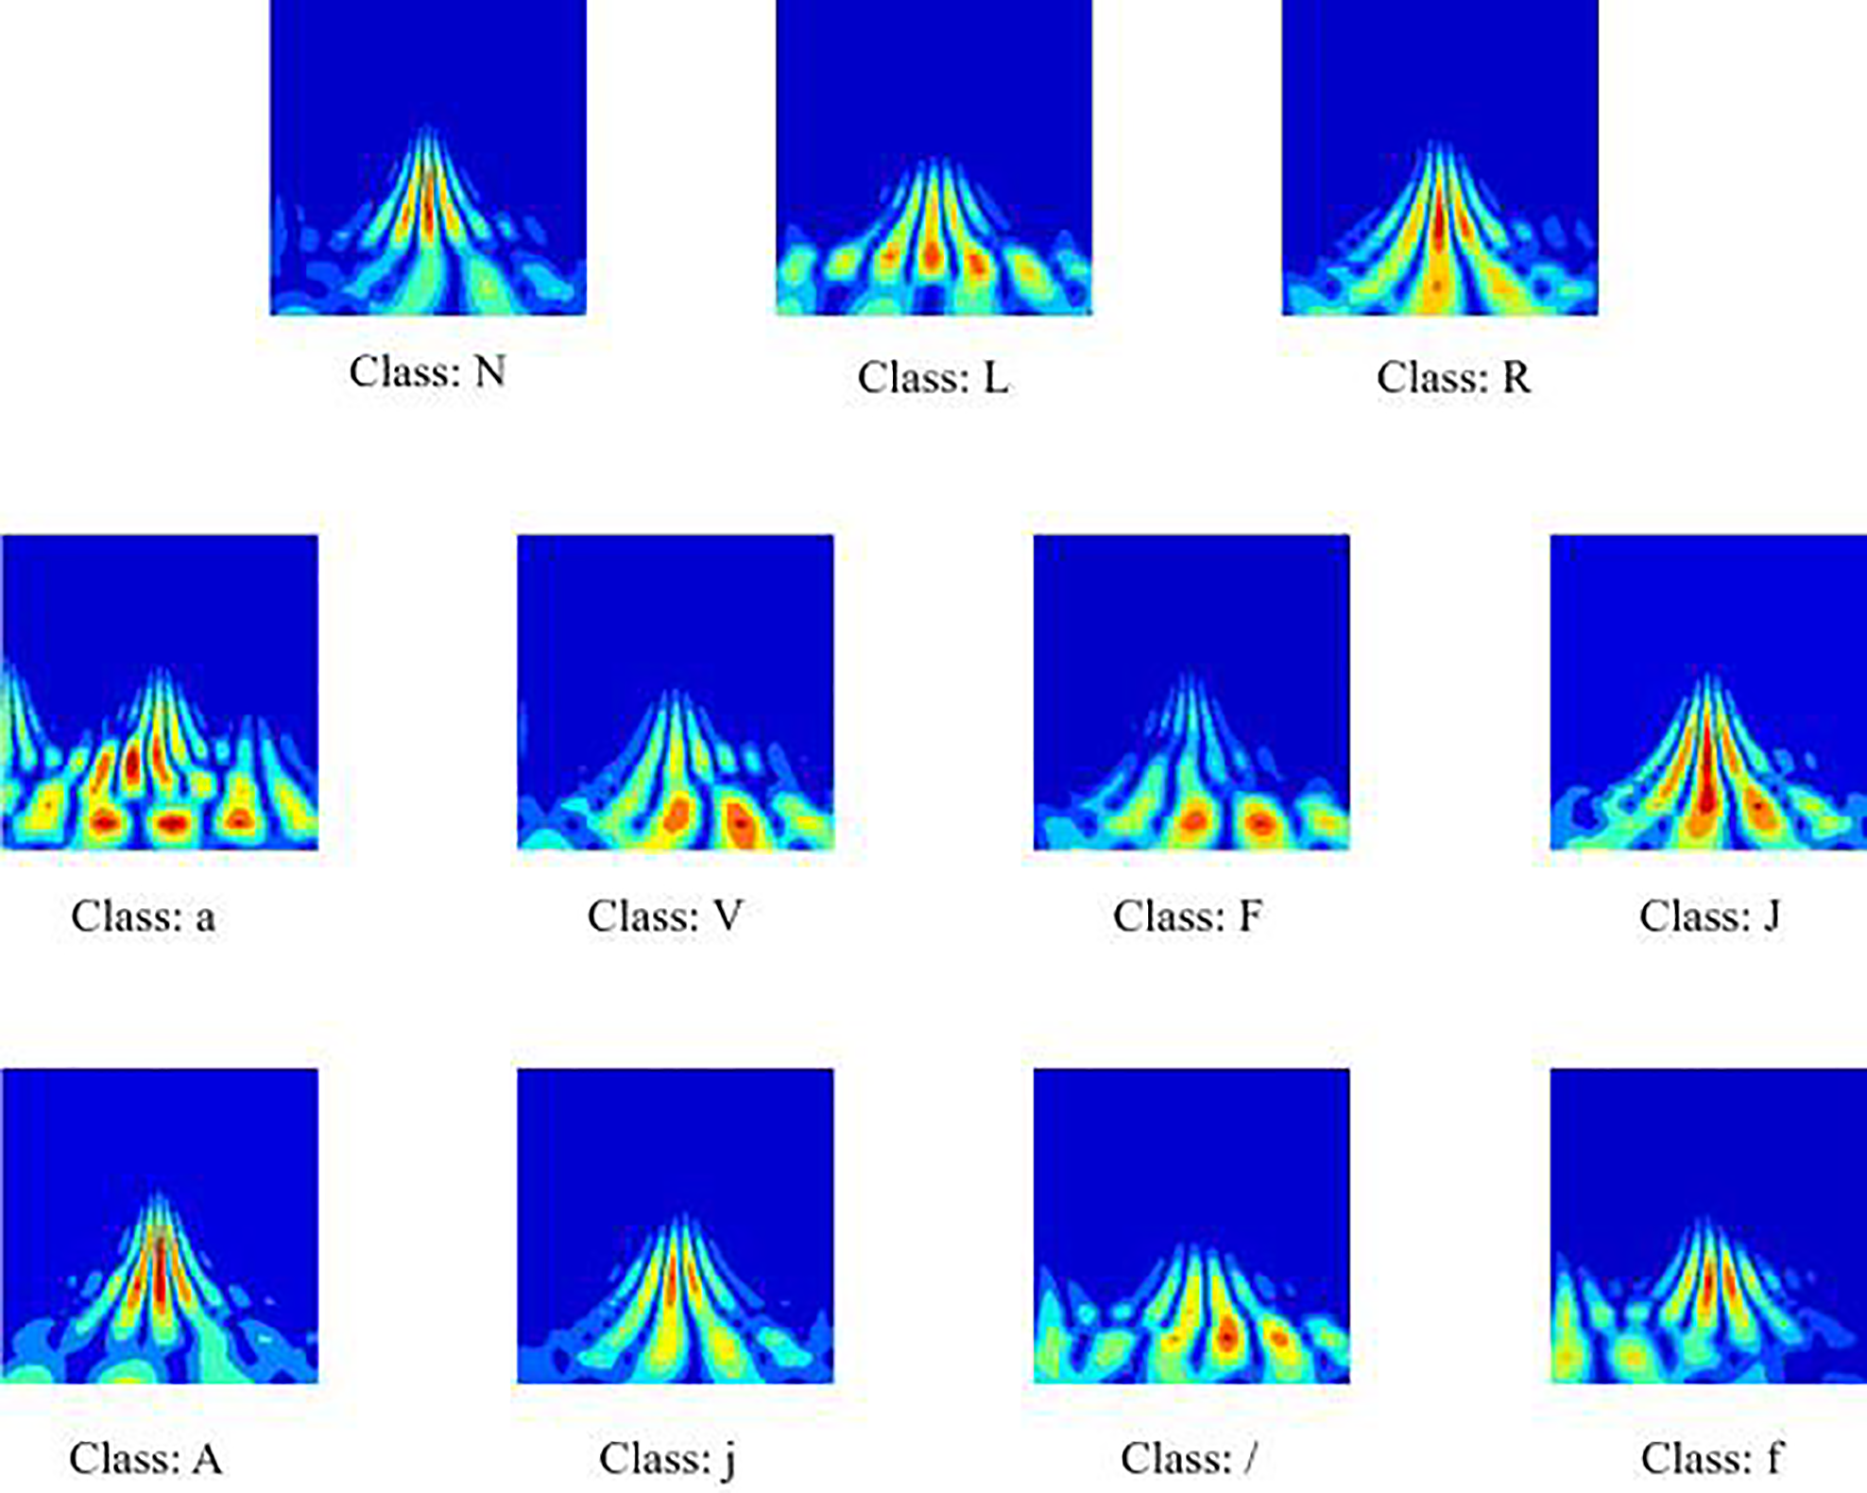
Figure 3: Scalograms for the eleven heartbeat classes. The color scale reflects the local energy distribution, with warmer tones (red/yellow) indicating higher energy and cooler tones (blue) representing lower energy regions.
3.3 Dual-Path Multimodal Framework for Arrhythmia Classification
This section introduces the proposed model framework, which is named DM-EHC (Dual-Path Multimodal ECG Heartbeat Classifier). This model employs dual-path multimodal framework design. The model’s inputs are the original one-dimensional ECG waveform and a two-dimensional time-frequency representation generated by CWT.
Fig. 4 illustrates overall model architecture. After denoising and heartbeat segmentation, the raw ECG signal retains its original time format for each ECG sample while being converted into a two-dimensional scan. The two inputs are then processed in different branches, allowing each branch to extract specific modal features.
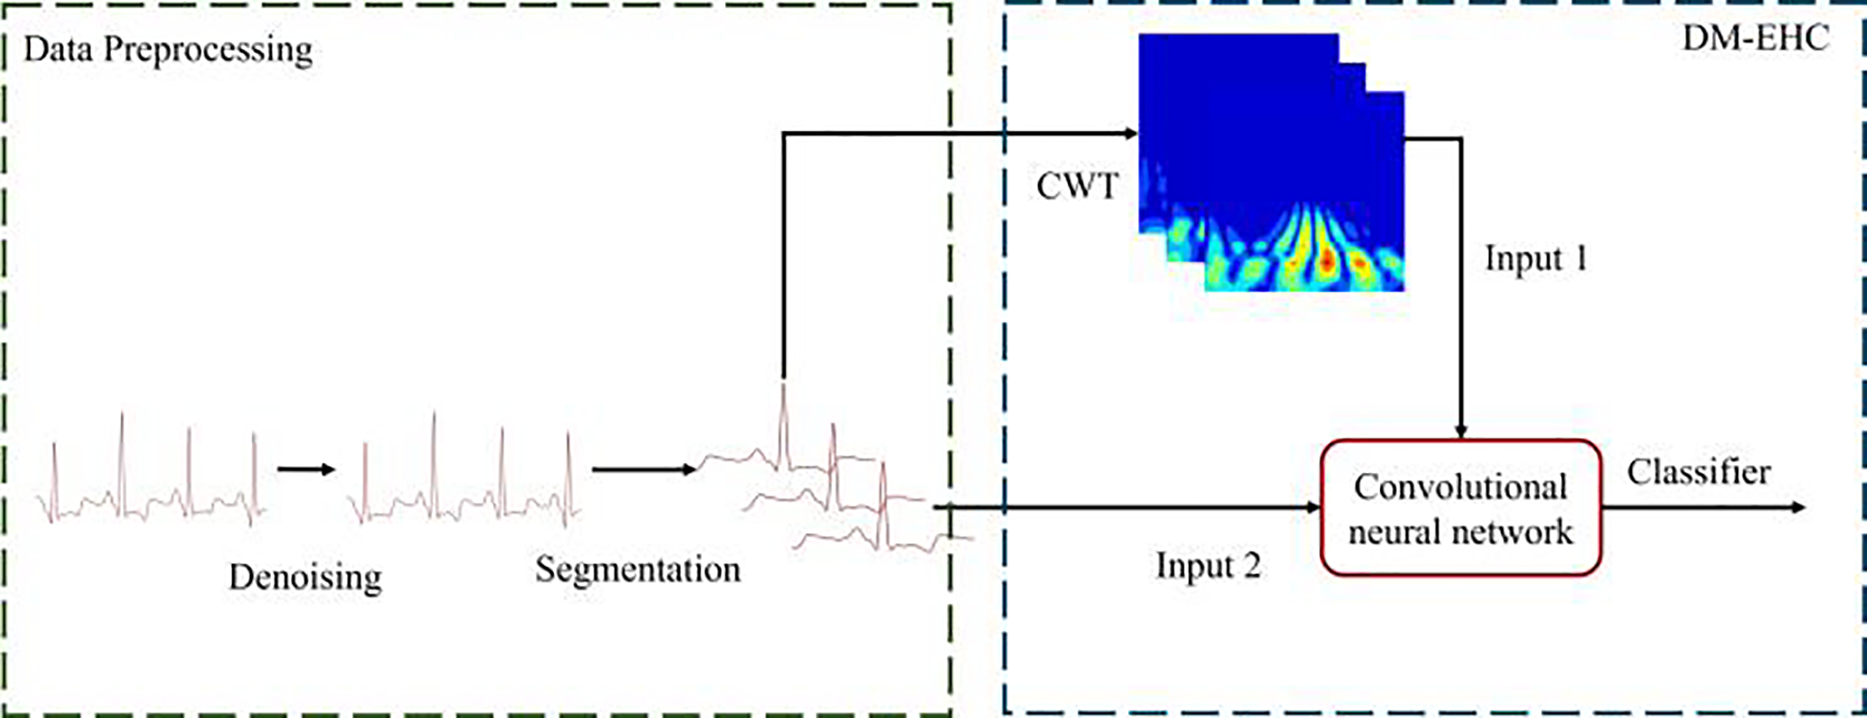
Figure 4: Architecture of a multimodal arrhythmia classification system.
Fig. 5 illustrates the design details of the DM-EHC architecture. This architecture integrates convolutional layers, batch normalization, and ReLU layers into a single intuitive convolutional unit. One path of the model converts the ECG signal into a two-dimensional scalogram using CWT.
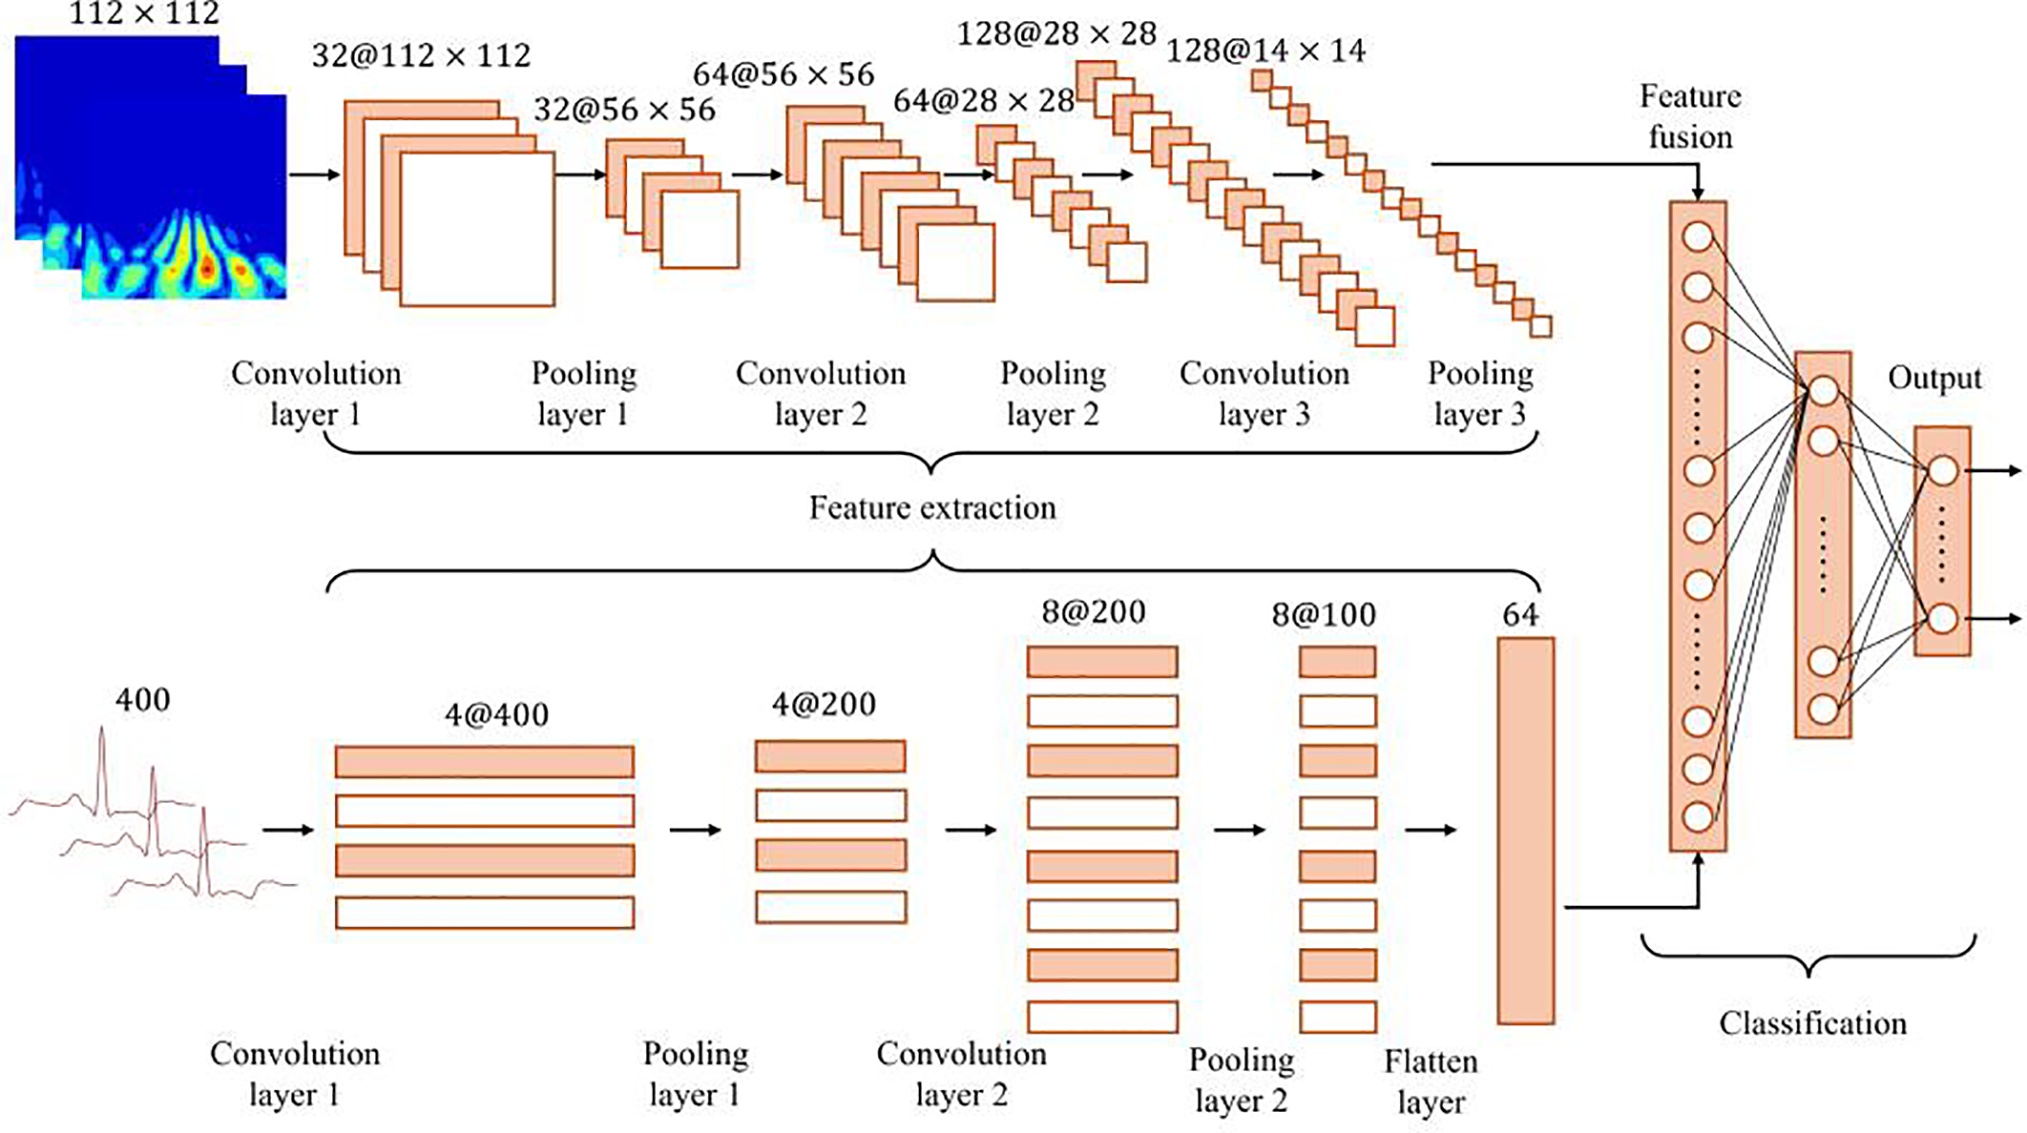
Figure 5: Overview of the DM-EHC architecture.
Thereafter, these images are input into a 2D CNN to extract frequency domain characteristics of the ECG signal. To save computational expense, the scalogram dimensions are adjusted to 112 × 112. A separate pathway takes the original one-dimensional ECG signal post-denoising and inputs it into a 1D CNN as a one-dimensional time series to extract temporal characteristics and cardiac electrical activity data from the ECG. The features obtained from the two distinct channels are integrated in the fusion layer through splicing, amalgamating time domain and frequency domain information to provide a comprehensive feature representation. The integrated features are processed by a fully connected layer to ultimately classify the type of heartbeat. This dual-path architecture integrates time domain and frequency domain information, preserving excellent classification accuracy in the face of obstacles including noise and data shortages, particularly in arrhythmia detection applications.
The primary benefit of this model is its multimodal architecture, which enhances the resilience and accuracy of classification by integrating information from various modalities (1D signal and 2D time-frequency scalogram). Initially, multimodal processing can extract features from various perspectives: the one-dimensional channel effectively captures the temporal characteristics of the ECG signal, whereas the two-dimensional channel captures the frequency characteristics through the time-frequency image produced by CWT. By integrating these two complementing datasets, the model may conduct a more thorough analysis of the intricate patterns in the ECG signal, particularly in the identification of arrhythmias, where the multimodal approach demonstrates a considerable benefit.
Secondly, multimodal architecture performs exceptionally well in the few-sample learning scenario. With fewer training samples, the model can nevertheless retain high classification accuracy by effectively integrating complementary information of several modalities. Multimodal approaches can utilize available data more fully than standard single-modal models, which enhances the model’s capacity for generalization. In medical signal analysis, this aspect is highly crucial, especially when there is a lack of labeled data. The model may greatly increase the impact of arrhythmia classification and improve its capacity to capture intricate pathological aspects by utilizing multimodal fusion.
3.4 Design of the Loss Function
To alleviate the difficulties caused by class imbalance and the difficulty in classifying heartbeat types, this study introduced Focal loss during training [38]. The loss function introduces two core parameters,
Here,
Properly tuning these parameters helps the model improve its recognition of underrepresented heartbeat types while mitigating dominance from majority classes.
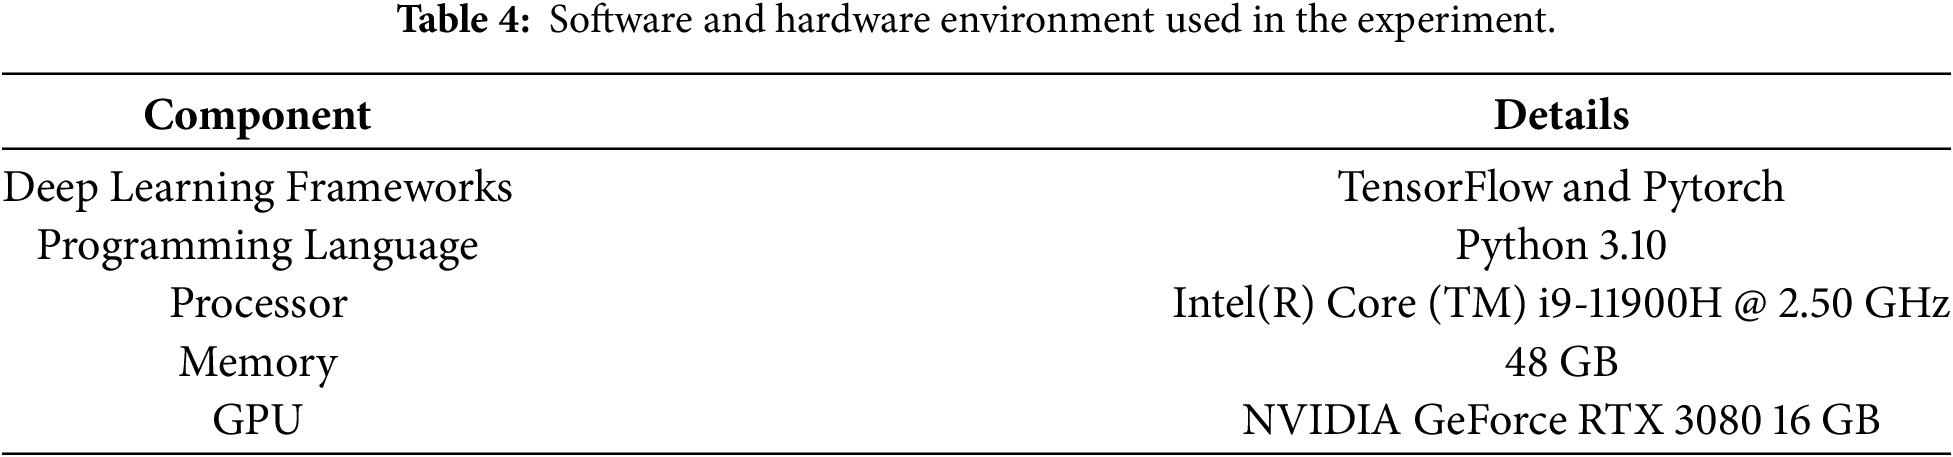
Table 4 shows the computing environment used in this study, including hardware specifications and software versions.
This experiment used the MIT-BIH dataset. During training, the dataset was divided into training, validation, and test sets in a classic 7:2:1 ratio. Table 5 shows the configuration of the model inputs and the hyperparameter settings.
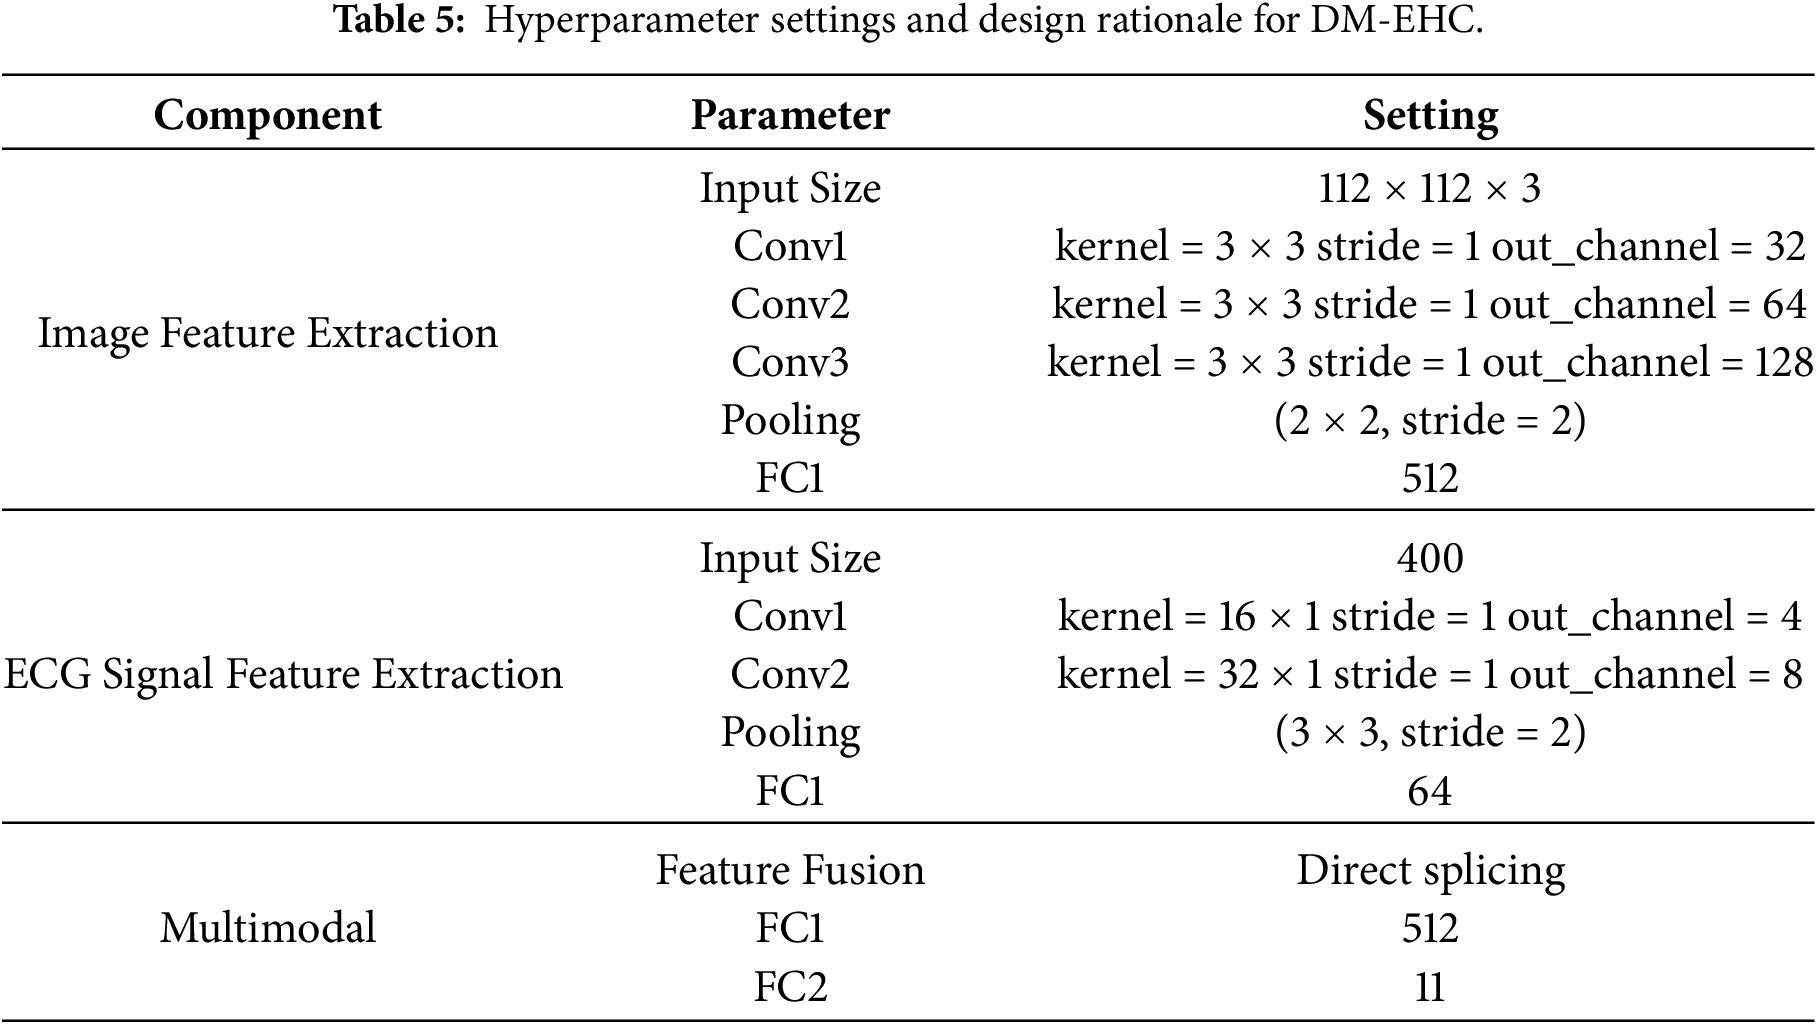
In practice, it was observed that using the original CWT images without resizing significantly increased memory usage during training, while offering little observable gain in classification performance. For this reason, the images were reduced to 112 × 112 during preprocessing frequency patterns while keeping the computation manageable. In the image-processing path, the pooling layers gradually compress the spatial dimensions, but sufficient resolution was retained to avoid losing the distinct structures around the QRS complex and other waveform components. The compressed representations are then projected into a 512-dimensional space through a fully connected layer, which serves as a convenient interface to the ECG branch.
For the one-dimensional ECG path, larger convolution kernels were deliberately used after observing that small kernels tended to miss some of the rhythm-level temporal cues. This design choice prioritizes capturing longer temporal dependencies within a single heartbeat, while maintaining a relatively simple and stable network structure. The extracted features are subsequently mapped to a 64-dimensional vector so that their scale aligns with the image-based features during fusion. A dropout rate of 0.3 was applied, based on preliminary experiments showing that lower dropout had little regularizing effect while higher dropout hindered convergence [39].
When combining the outputs of the two branches, direct feature concatenation was adopted. Concatenation allows the high-level descriptors from the image and ECG sources to retain their distinctiveness, which was found to be particularly helpful when dealing with heterogeneous signal patterns [40]. Another practical reason for adopting this strategy is that it avoids the need to reshape or align the modalities through complex transformations, which kept the computational cost lower and shortened the training cycle. Importantly, this structure makes it easier to interpret the model, as the two feature streams can be visualized separately or jointly to understand their contributions. Although more sophisticated fusion strategies could be explored, the adopted design provides an effective balance between model complexity and representational capability.
Because the dataset contains a substantial imbalance among heartbeat types, focal loss was employed to lessen the dominance of majority classes [41]. In preliminary tests, models trained with standard cross-entropy tended to overfit on normal beats while underperforming on less frequent arrhythmia. Setting the focusing parameter
The effectiveness of the proposed model in arrhythmia classification was assessed using several commonly adopted evaluation measures, including macro precision, macro recall, macro F1-score, overall accuracy, and the area under the ROC curve (AUC) [40]. These metrics together provide a broad view of the model’s classification performance. Simultaneously, to guarantee the model’s resilience, the experiment employs the k-fold cross-validation approach for performance validation.
Macro precision evaluates the classification accuracy across all classes. It computes the accuracy for each class and subsequently derives the average. In contrast to general accuracy, it emphasizes the performance of minority classes. Macro recall measures the average recall across all classes. It primarily assesses the model’s coverage of diverse samples. Macro F1-Score is the harmonic mean of precision and recall, which is used to comprehensively evaluate the classification effect of the model. It is particularly important for cases with imbalanced classes and can balance precision and recall. The Eqs. (4)–(6) are as follows:
Accuracy is the proportion of samples correctly classified by the model to the total number of samples. Although accuracy is a commonly used evaluation indicator, it is easily affected by the majority class samples in the class imbalance problem, so it needs to be used together with other indicators.
AUC measures the overall classification ability of the model and represents the area under the ROC curve. The closer the AUC value is to 1, the better the classification effect of the model. Compared with Accuracy, AUC can better reflect the classification performance of the model under different thresholds, especially for datasets with imbalanced classes.
This experiment uses the k-fold cross-validation method to ensure the model’s robustness. K-fold cross-validation involves partitioning the dataset into k equal segments, with each segment serving as the test set in succession, while the remaining segments are utilized as the training set, iterating this process k times. To reduce the sensitivity of the results to how the data are divided, a 5-fold cross-validation strategy was used. The model was trained and evaluated on five different splits, and the final result was obtained by averaging the performance across all folds, providing a more stable and reliable assessment.
4.4 Model Training and Validation Performance
To evaluate the learning and convergence capabilities of the DM-EHC model during training, this study plotted a comparison of accuracy and loss on the training and validation sets, as shown in Fig. 6. As shown in Fig. 6a, the accuracy comparison curves for the training and validation sets are similar, without significant differences, indicating that the model maintains good generalization ability during training and does not experience obvious overfitting. From the loss comparison curve in Fig. 6b, it can be seen that although the validation loss is slightly higher than the training loss, the difference between the two is small, and their trends are relatively gentle, demonstrating good convergence and stability of the model.
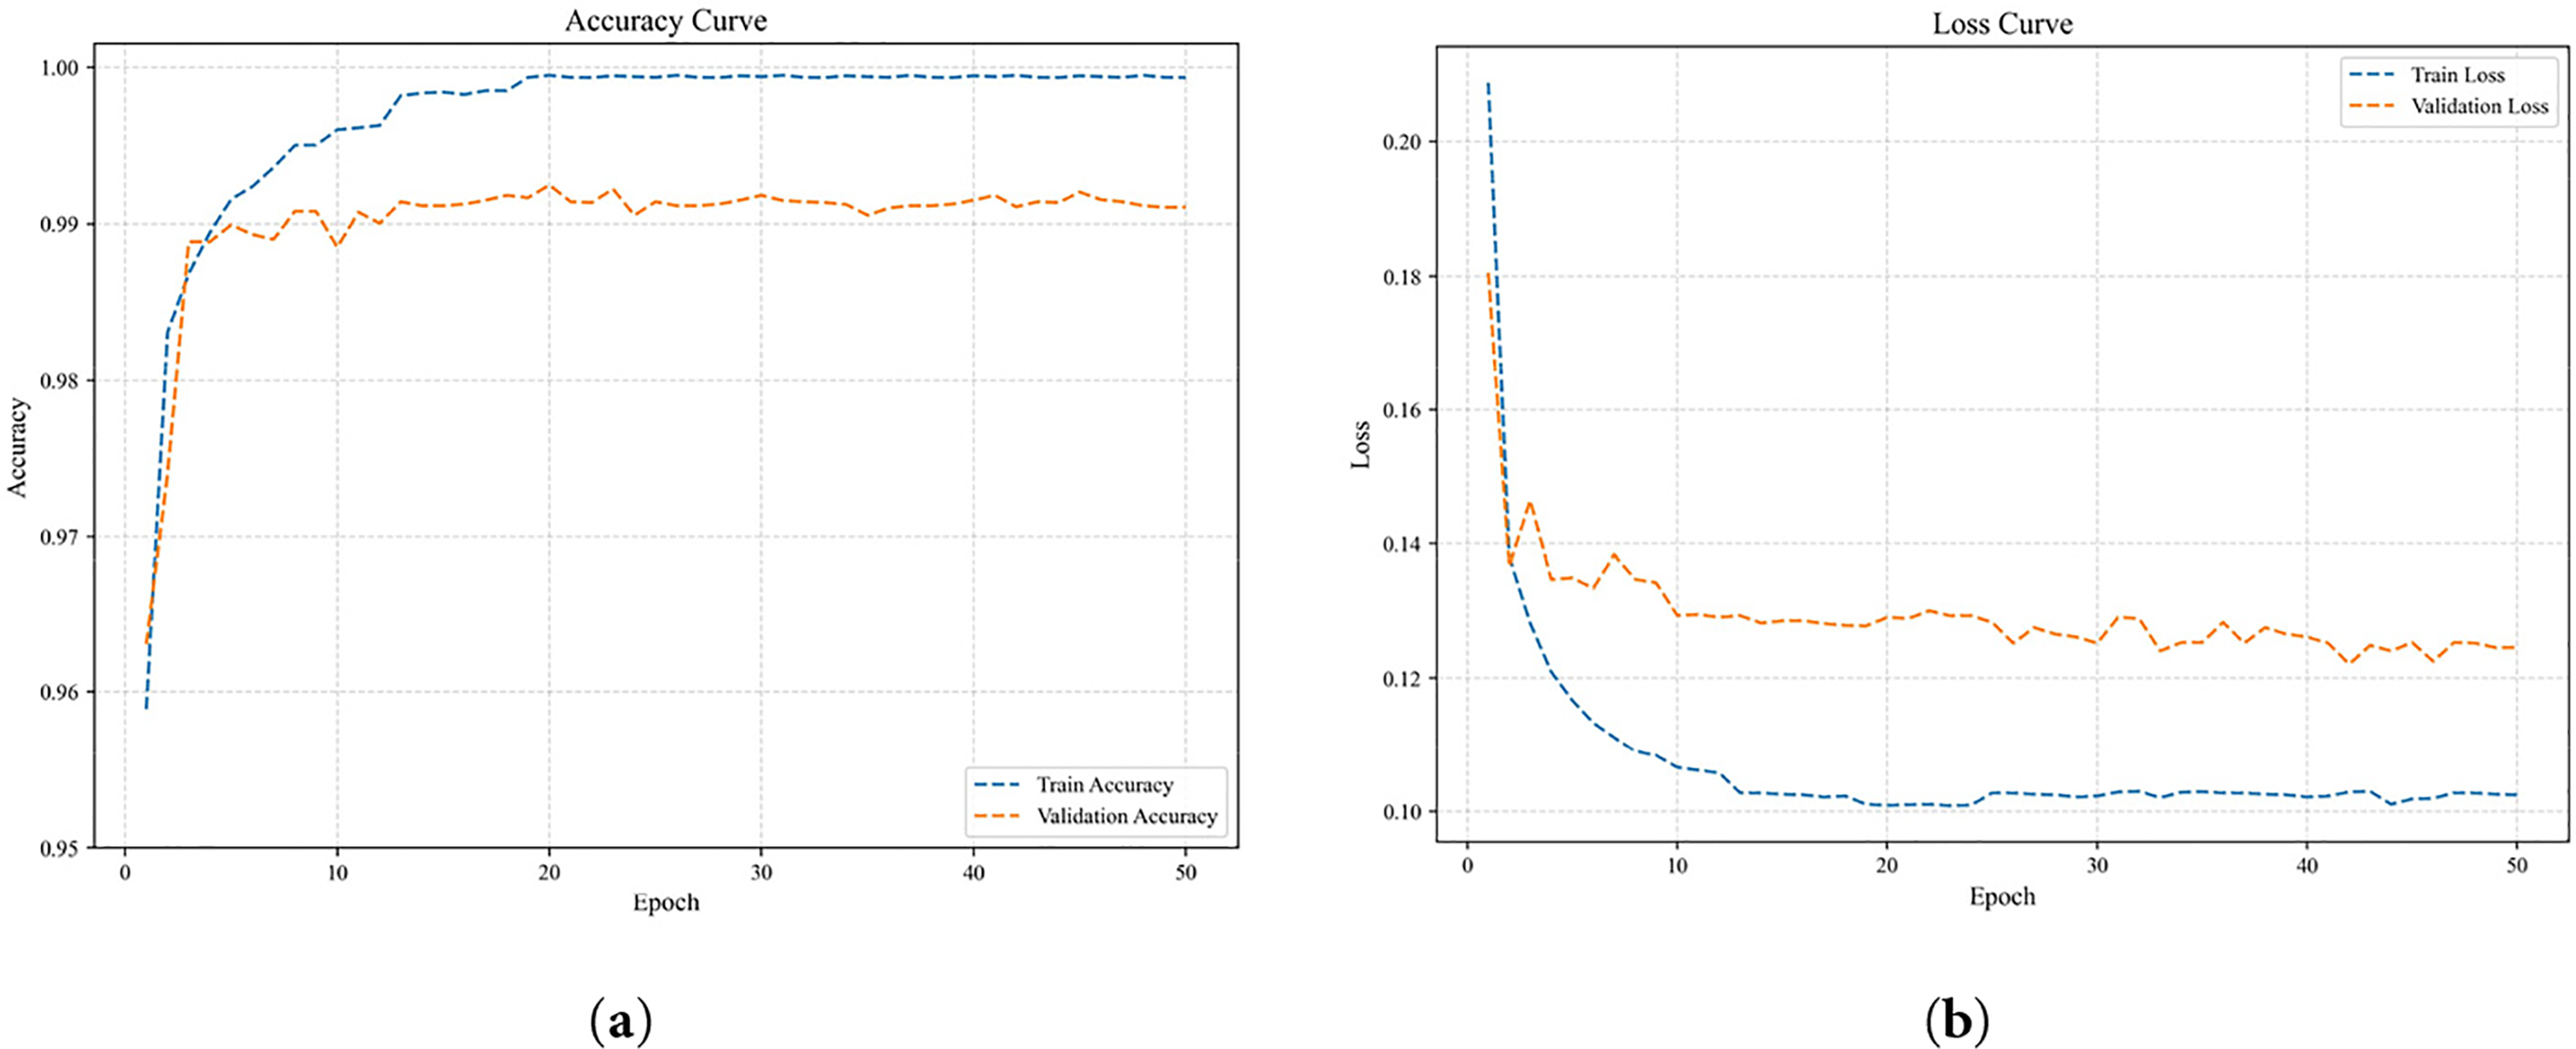
Figure 6: Comparison curves of training performance on the training and validation sets. (a) Accuracy Curve; (b) Loss Curve.
Therefore, the overall trend of the training and validation curves indicates that the DM-EHC model has stable convergence characteristics when learning multimodal features.
4.5 Evaluation of Classification Efficacy across Various Input Techniques and Pre-Trained Models
In this experiment, three different forms of input were examined to understand how each influences the model’s behavior: the raw one-dimensional ECG waveform, the time–frequency images derived from CWT, and a multimodal setting that combines both sources. Each configuration was assessed using confusion matrices, qualitative classification plots, ROC curves, and corresponding AUC values. To place the proposed approach in a broader context, a separate set of experiments was also conducted using a standard 2D CNN pipeline. In doing so, the framework was compared against several widely used pretrained architectures—ResNet18 [43], ResNet50 [44], DenseNet121 [45], and MobileNetV2 [46]. These models were chosen not only because they are well-established feature extractors, but also because their network designs differ considerably in depth, connectivity, and computational load. Testing against such representative architectures provided a practical benchmark and allowed us to more clearly evaluate how much the proposed method contributes beyond what existing pretrained models can offer.
Table 6 summarizes the results of macro precision, recall, F1-score, accuracy, and AUC across different inputs and models. One input, the 1D signal, is utilized. The model exhibits good classification results and makes use of the DM-EHC architecture’s ECG component. The overall AUC is 0.898, the precision is 0.93, the recall is 0.80, and the F1-score is 0.84. This indicates that while the 1D signal can extract useful features, specifically, its accuracy of 99%, it is marginally inadequate in terms of recall, particularly when it comes to the recognition effect of minority classes, which may not be as strong as that of other models. Without pre-training the DM-EHC image component of the model, experiments on CWT-converted images demonstrate that the precision, F1-score, and AUC are 0.92, 0.86, and 0.91, respectively, suggesting that it has superior recall and feature extraction capabilities in comparison to 1D signals. Pre-trained ResNet18 (AUC 0.953) and pre-trained ResNet50 (AUC 0.931) perform noticeably better than the DM-EHC model image component when compared to other pre-trained models. Particularly for minority groups, these deep networks are better at extracting information from scalogram images. Despite having great feature extraction capabilities, DenseNet121 and MobileNetV2’s AUCs of 0.900 and 0.910, respectively, show that they fall short of the ResNet series by a small margin.
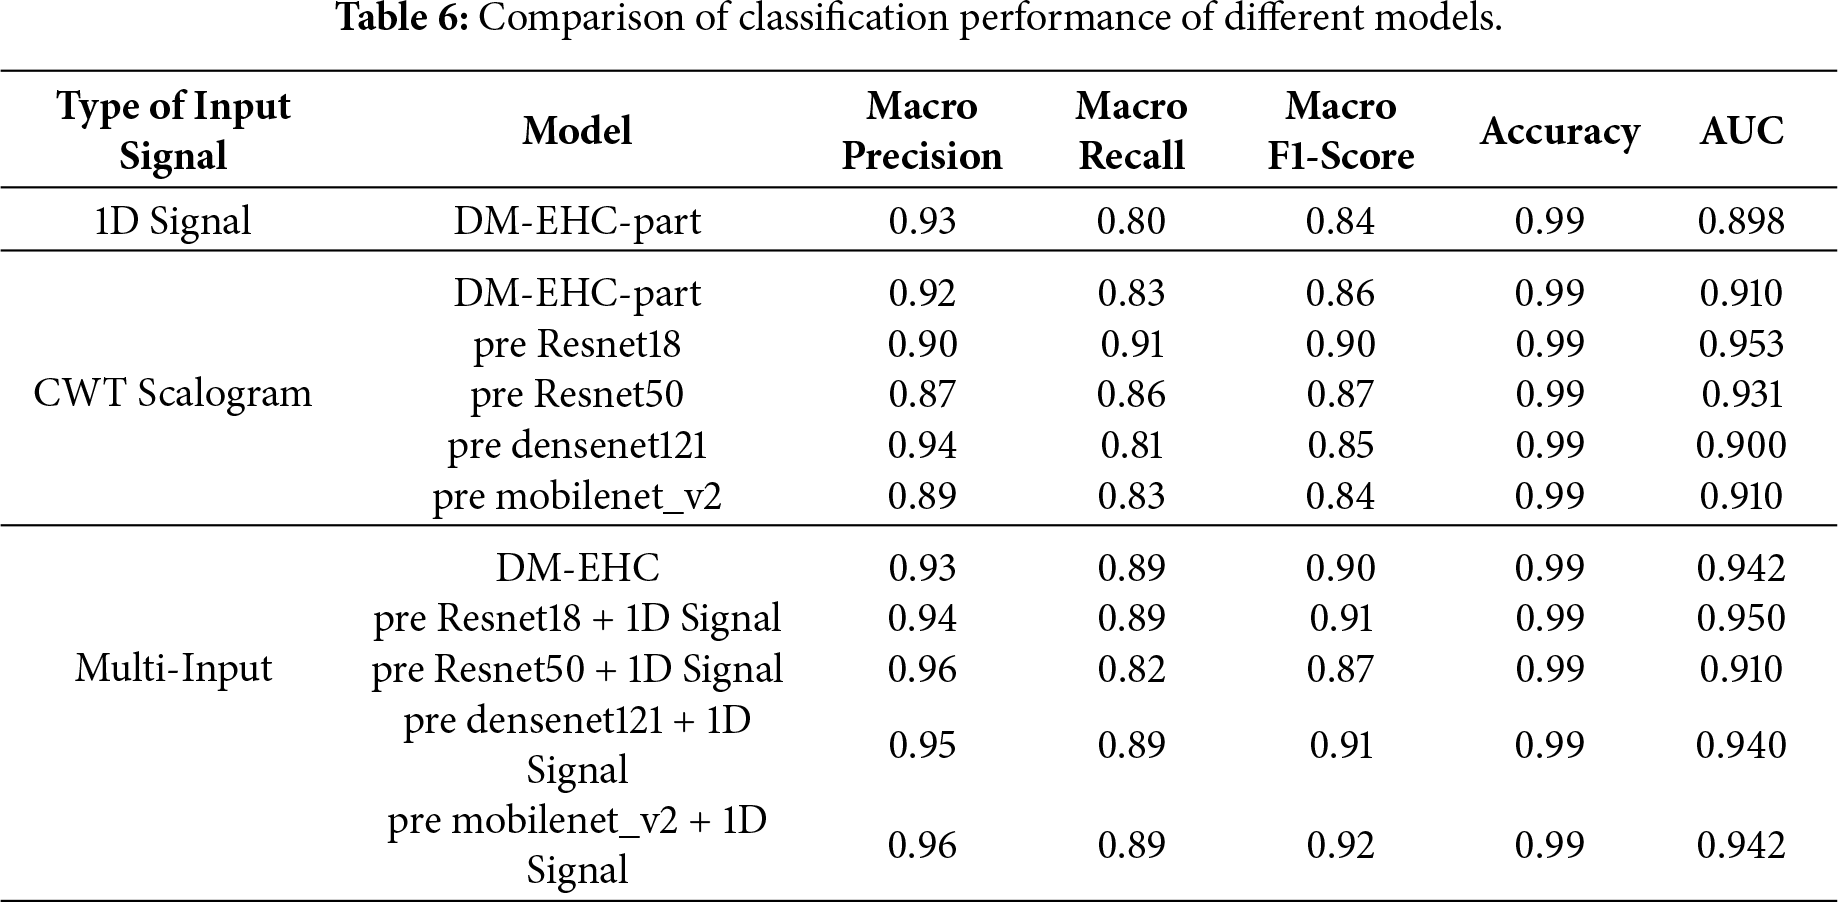
Multimodal input outperforms all other models by combining the benefits of CWT Scalogram and 1D signals. The DM-EHC approach increases Precision to 0.93, Recall to 0.89, F1-score to 0.90, and AUC to 0.942 when multimodal input is used. Multimodal input significantly improves recall rate, F1-score, and
AUC when compared to unimodal 1D signal and CWT converted image. This suggests that combining the features of 1D signal and CWT image can effectively improve the model’s performance, particularly in minority class classification tasks. Multimodal input in conjunction with a pre-trained model considerably improves the model’s identification capacity, as seen by the pre-trained ResNet18 and 1D signal’s AUC of 0.950, the best result. Although somewhat less than ResNet18, the pre-trained ResNet50 + 1D signal’s AUC of 0.910 is still a decent performance. DenseNet121 + 1D signal and MobileNetV2 + 1D signal have respective AUCs of 0.940 and 0.942, demonstrating that the multimodal input approach in conjunction with various pre-trained models can result in notable performance enhancements.
Although the pre-trained ResNet18 achieves a slightly higher AUC, this improvement mainly reflects its strong feature extraction capability on time–frequency representations. In contrast, the proposed multimodal approach emphasizes complementary information from both temporal and spectral domains, providing more balanced performance across classes.
In general, using multiple input sources led to markedly better performance than relying on a single modality. The gains were most evident in recall, F1-score, and AUC, indicating that the multimodal design is especially effective for identifying less represented arrhythmia types. This suggests that combining the characteristics of the two modalities can effectively improve the recognition ability of minority arrhythmia. The DM-EHC method can also accomplish similar results under a simple structure, with lesser model complexity, even if pre-trained deep models (such as ResNet18 and ResNet50) have higher capabilities in feature extraction.
4.6 Impact of Data Imbalance on Classification Performance
The classification performance of DM-EHC across different classes is depicted in the confusion matrix presented in Fig. 7a–c and the AUC score comparison table shown in Table 7.
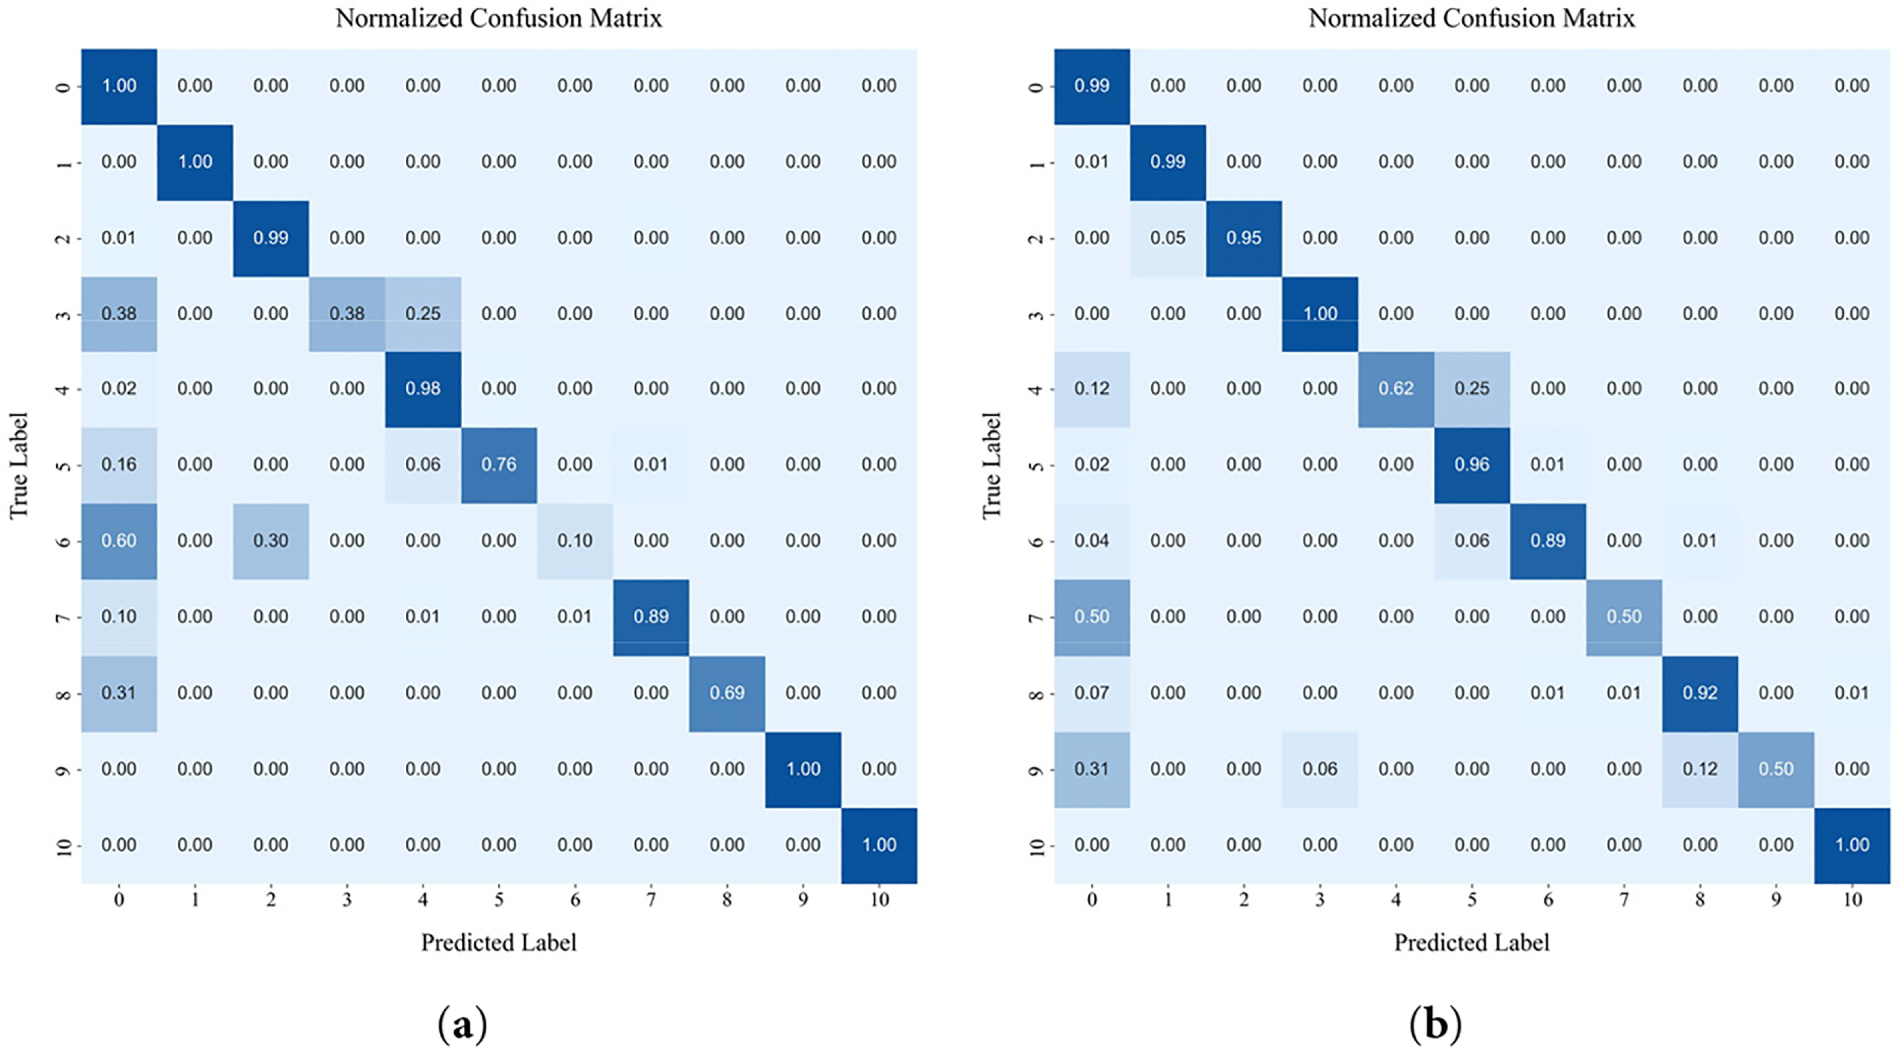
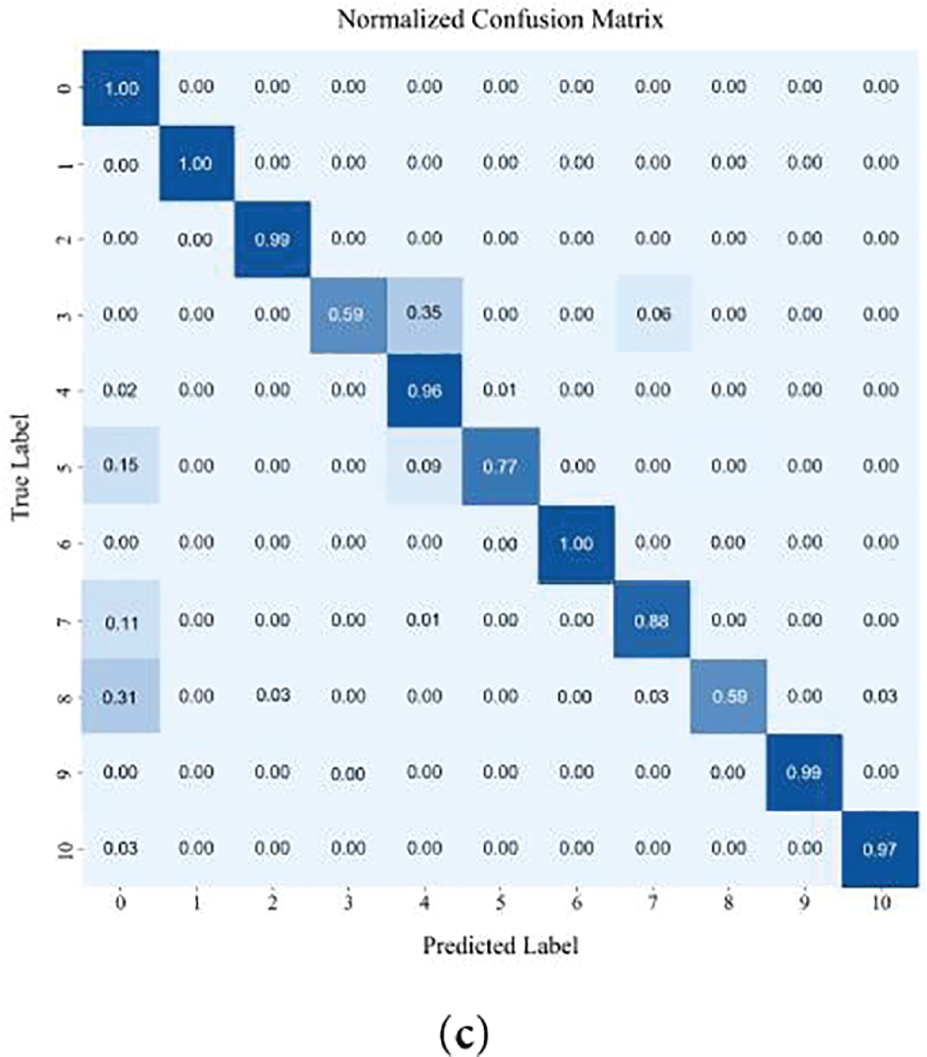
Figure 7: The result of confusion matrix: (a) Confusion matrix of 1D signal as input; (b) Confusion matrix of 2D scalogram as input; (c) Confusion matrix of DM-EHC.
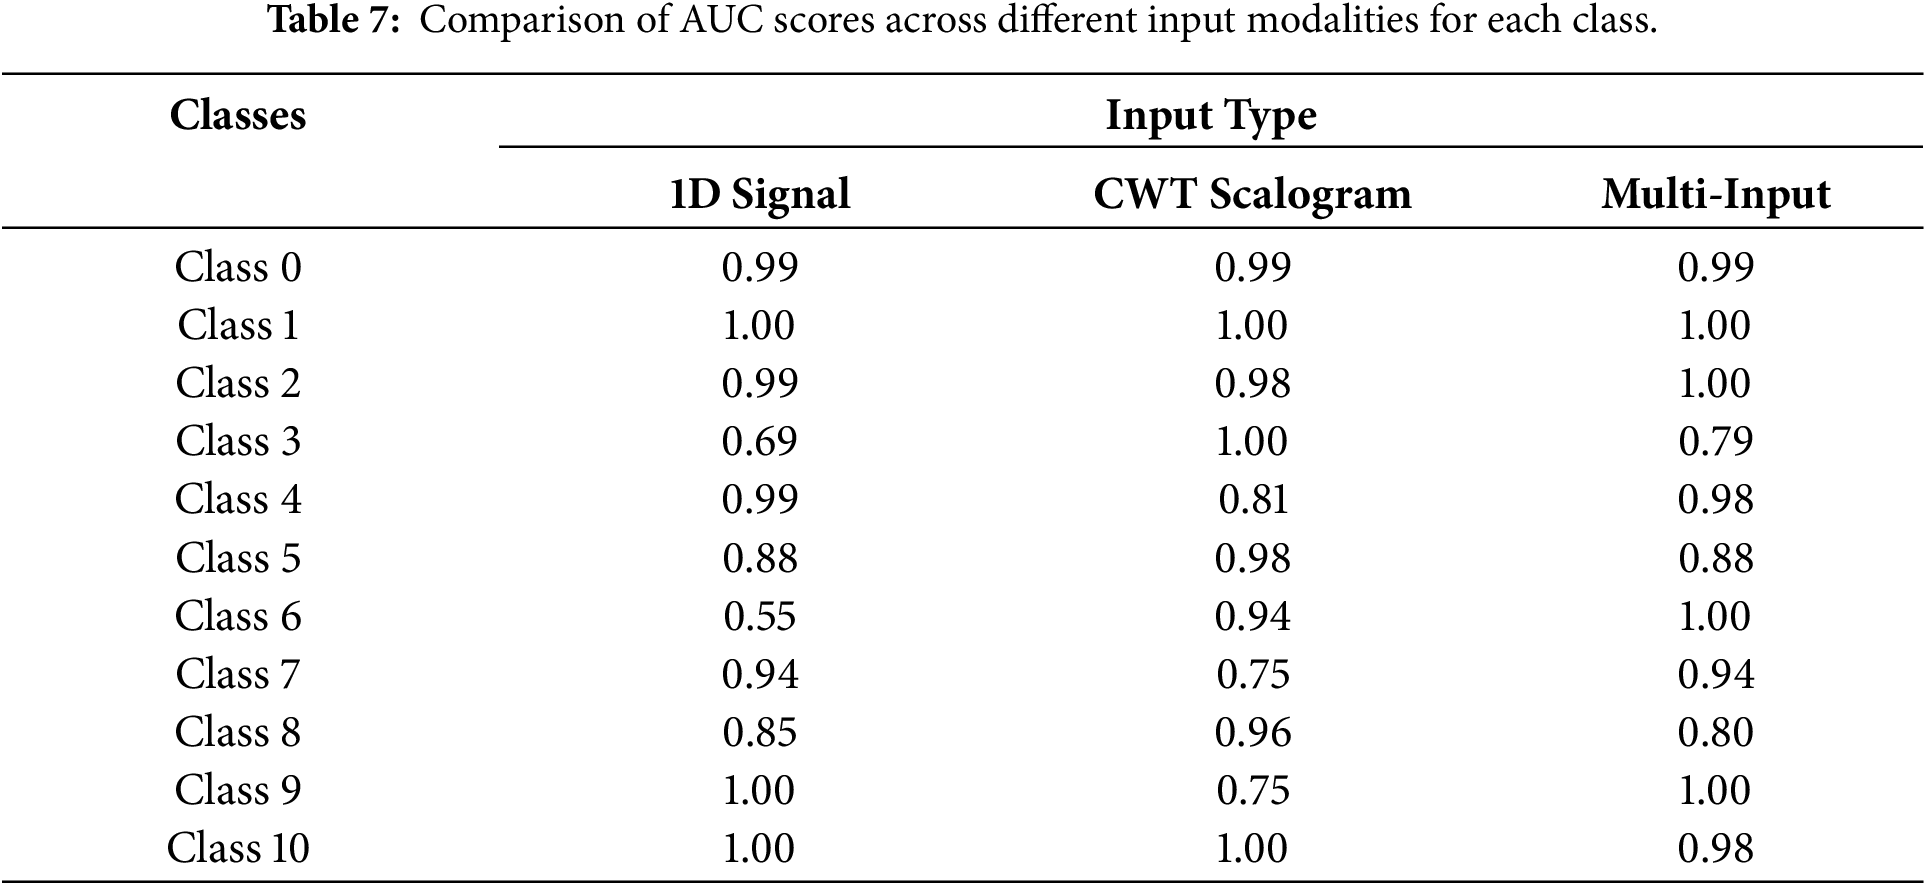
Data imbalance causes single- and multi-modal models to differ in performance, especially for minority classes, where multi-modal models perform better. In contrast, using CWT Scalogram as input improves the model’s performance on minority class samples. The AUC for major classes, such as class 0 and class 1, is 0.99 and 1, respectively, indicating that the model maintains a high classification capability for these classes. On minority class samples, particularly class 3 (AUC = 1) and class 6 (AUC = 0.94), the model performs significantly better than the 1D signal model. However, the AUC for Class 4 and Class 7, which have more data, is lower at 0.81 and 0.75, respectively. This could be attributed to the complexity of their features, which may prevent the CWT model from fully capturing the key characteristics necessary for accurate classification.
In addressing class imbalance, the multimodal approach shows clear advantages, particularly for underrepresented heartbeat types. For majority classes, the AUC values remain close to 1, indicating that combining modalities does not compromise performance on well-represented categories. For minority classes such as Class 3 and Class 6, the AUC scores of 0.79 and 1, respectively, demonstrate that integrating the 1D waveform with its CWT-based representation enables the model to capture a richer set of discriminative cues. By drawing on both temporal patterns and time–frequency characteristics, the multimodal framework provides a more complete description of heartbeat morphology, which in turn leads to improved classification results for classes with limited samples.
Using only 1D signals fails to address data imbalance, showing strong performance on majority classes but poor results for minority classes. The model does better on both main class and minority class samples when CWT scalogram is used as input. It does better on minority class samples than on main class samples, which shows the usefulness of time-frequency domain features. However, there are times when key features are not fully captured. When combining the multi-modal input of 1D signals and CWT scalogram, it works best when there are problems with data imbalance. In particular, it makes it much easier to recognize samples from minority classes. This shows that multi-modal input can better combine features from different modalities, which makes it easier for the model to recognize minority groups. The multi-modal model does a better task of dealing with data imbalance problems, which fully shows its benefits in improving the accuracy of minority class classification and handling data sets that aren’t balanced.
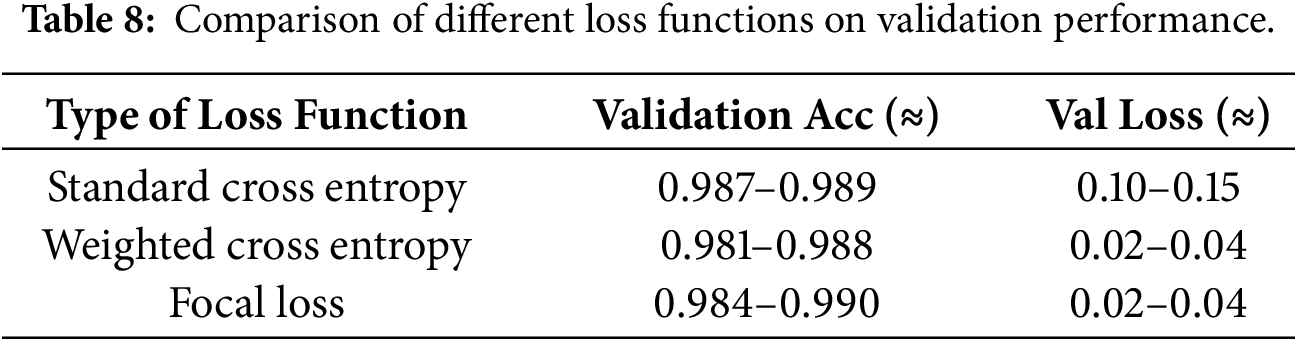
In addition, the effectiveness of the adopted focal loss function further contributes to mitigating data imbalance. Table 8 compares the performance of different loss functions. The standard cross-entropy loss function has a relatively high validation loss, indicating its limited robustness in imbalanced classes. The weighted cross-entropy loss function improves the performance of the minority class, while the focal loss function achieves the best overall balance, ensuring both low validation loss and stable accuracy. These results suggest that the focal loss function is more effective in handling imbalanced ECG classification tasks.
4.7 Model Robustness and Computational Efficiency
5-fold cross validation was adopted to validate the model’s robustness and reliability [47]. Specifically, the dataset was first randomly partitioned into five folds. In each fold, one subset was used as the test set, while the remaining data were further divided into training and validation subsets following an approximate 7:2 ratio for model optimization and early stopping. 5-fold cross validation can successfully lessen the impact of the model on certain training or validation set partitions by training and validating the model on various data partitions. When compared to cross validation with greater folds, 5-fold guarantees evaluation reliability without appreciably increasing computation time and resource usage.
Fig. 8 presents the model’s training and validation performance under 5-fold cross-validation, evaluated by average accuracy, precision, recall, and F1-score. To better account for class imbalance, evaluation focused primarily on precision, recall, and F1-score rather than accuracy alone. Across the five folds, the proposed method achieved an average precision of 0.927 ± 0.021, recall of 0.903 ± 0.033, and F1-score of 0.920 ± 0.025, demonstrating stable and consistent performance. These results indicate that the proposed model maintains reliable classification capability under imbalanced conditions and that the observed performance is not sensitive to data partitioning.
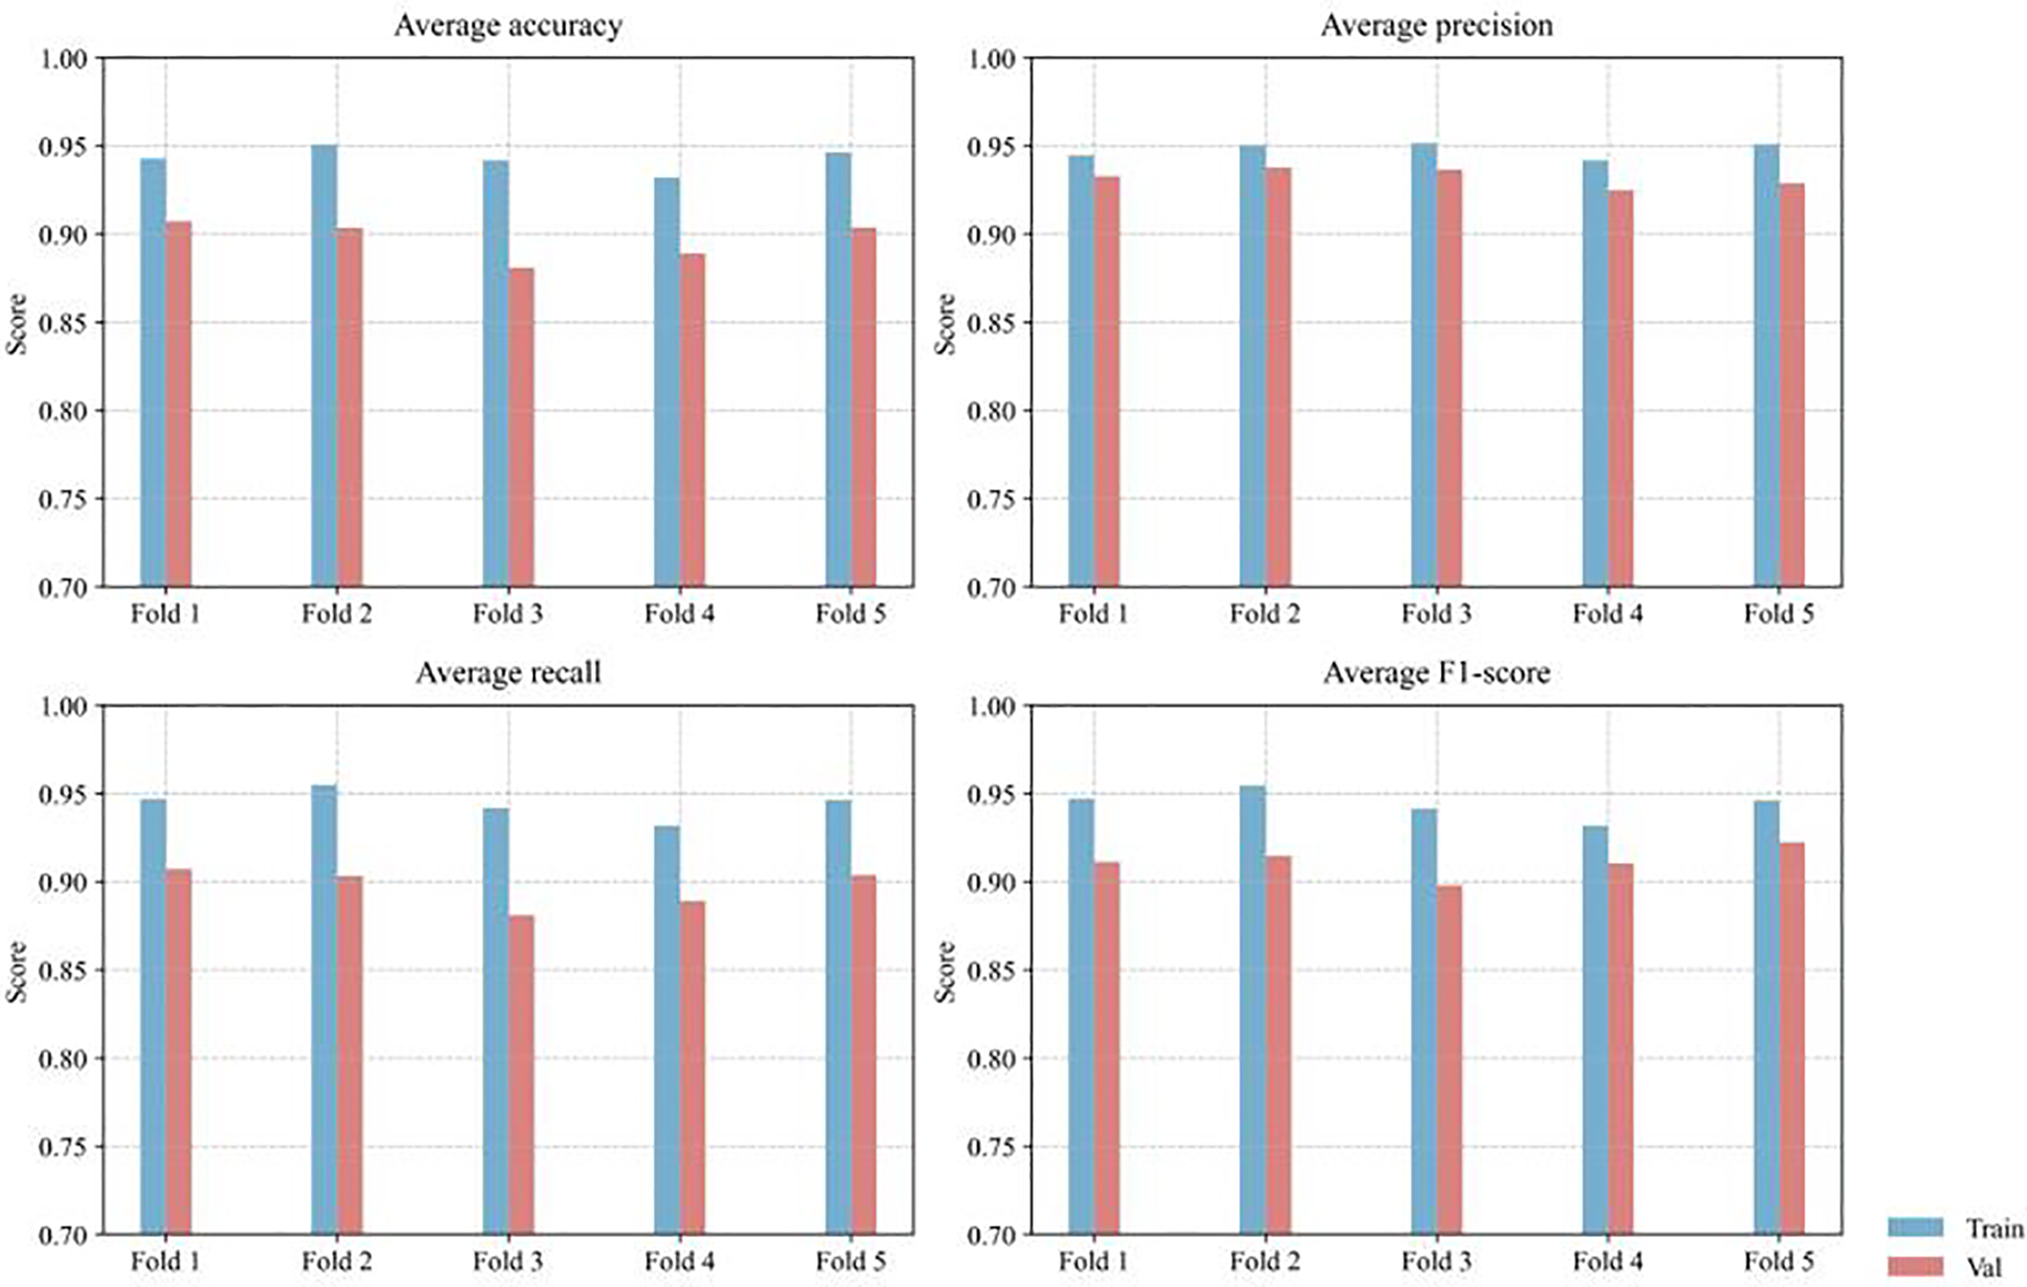
Figure 8: Distribution of classification metrics across training and validation sets using 5-fold cross-validation.
In addition to evaluating robustness through cross-validation, this paper further analyzes the computational efficiency of the proposed model to assess its practical applicability. Table 9 summarizes the computational complexity of the network in terms of parameter count, inference time, and throughput. The proposed DM-EHC model contains 17.42 M parameters, slightly more than ResNet18 (11.73 M). However, despite the larger parameter size, DM-EHC exhibits superior inference efficiency. Specifically, with a batch size of 1, its inference time per sample is 2.95 ms; with a batch size of 32, its inference time per sample is 0.148 ms, both better than ResNet18’s 6.91 and 0.22 ms required under the same conditions.
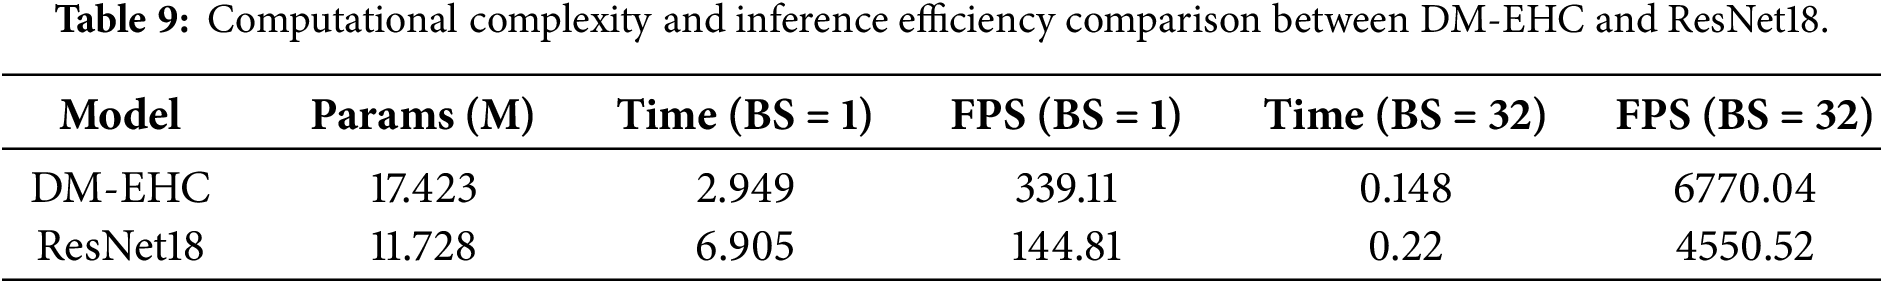
These results demonstrate that the proposed architecture maintains high computational efficiency while incorporating richer feature representations. The improved performance can be attributed to the simplified network design and avoidance of overly deep residual structures, thereby enabling efficient feature extraction while reducing computational overhead. Overall, the proposed DM-EHC model achieves a good balance between model complexity and inference efficiency, making it very suitable for real-time deployment scenarios.
4.8 Qualitative Analysis of Model Predictions
To further investigate the behavior of the proposed model beyond quantitative metrics, a qualitative analysis was conducted to examine representative prediction cases. Fig. 9 illustrates several examples, including correctly classified and misclassified samples, by visualizing the original ECG waveform, the corresponding CWT time–frequency representation, and the predicted class probabilities.
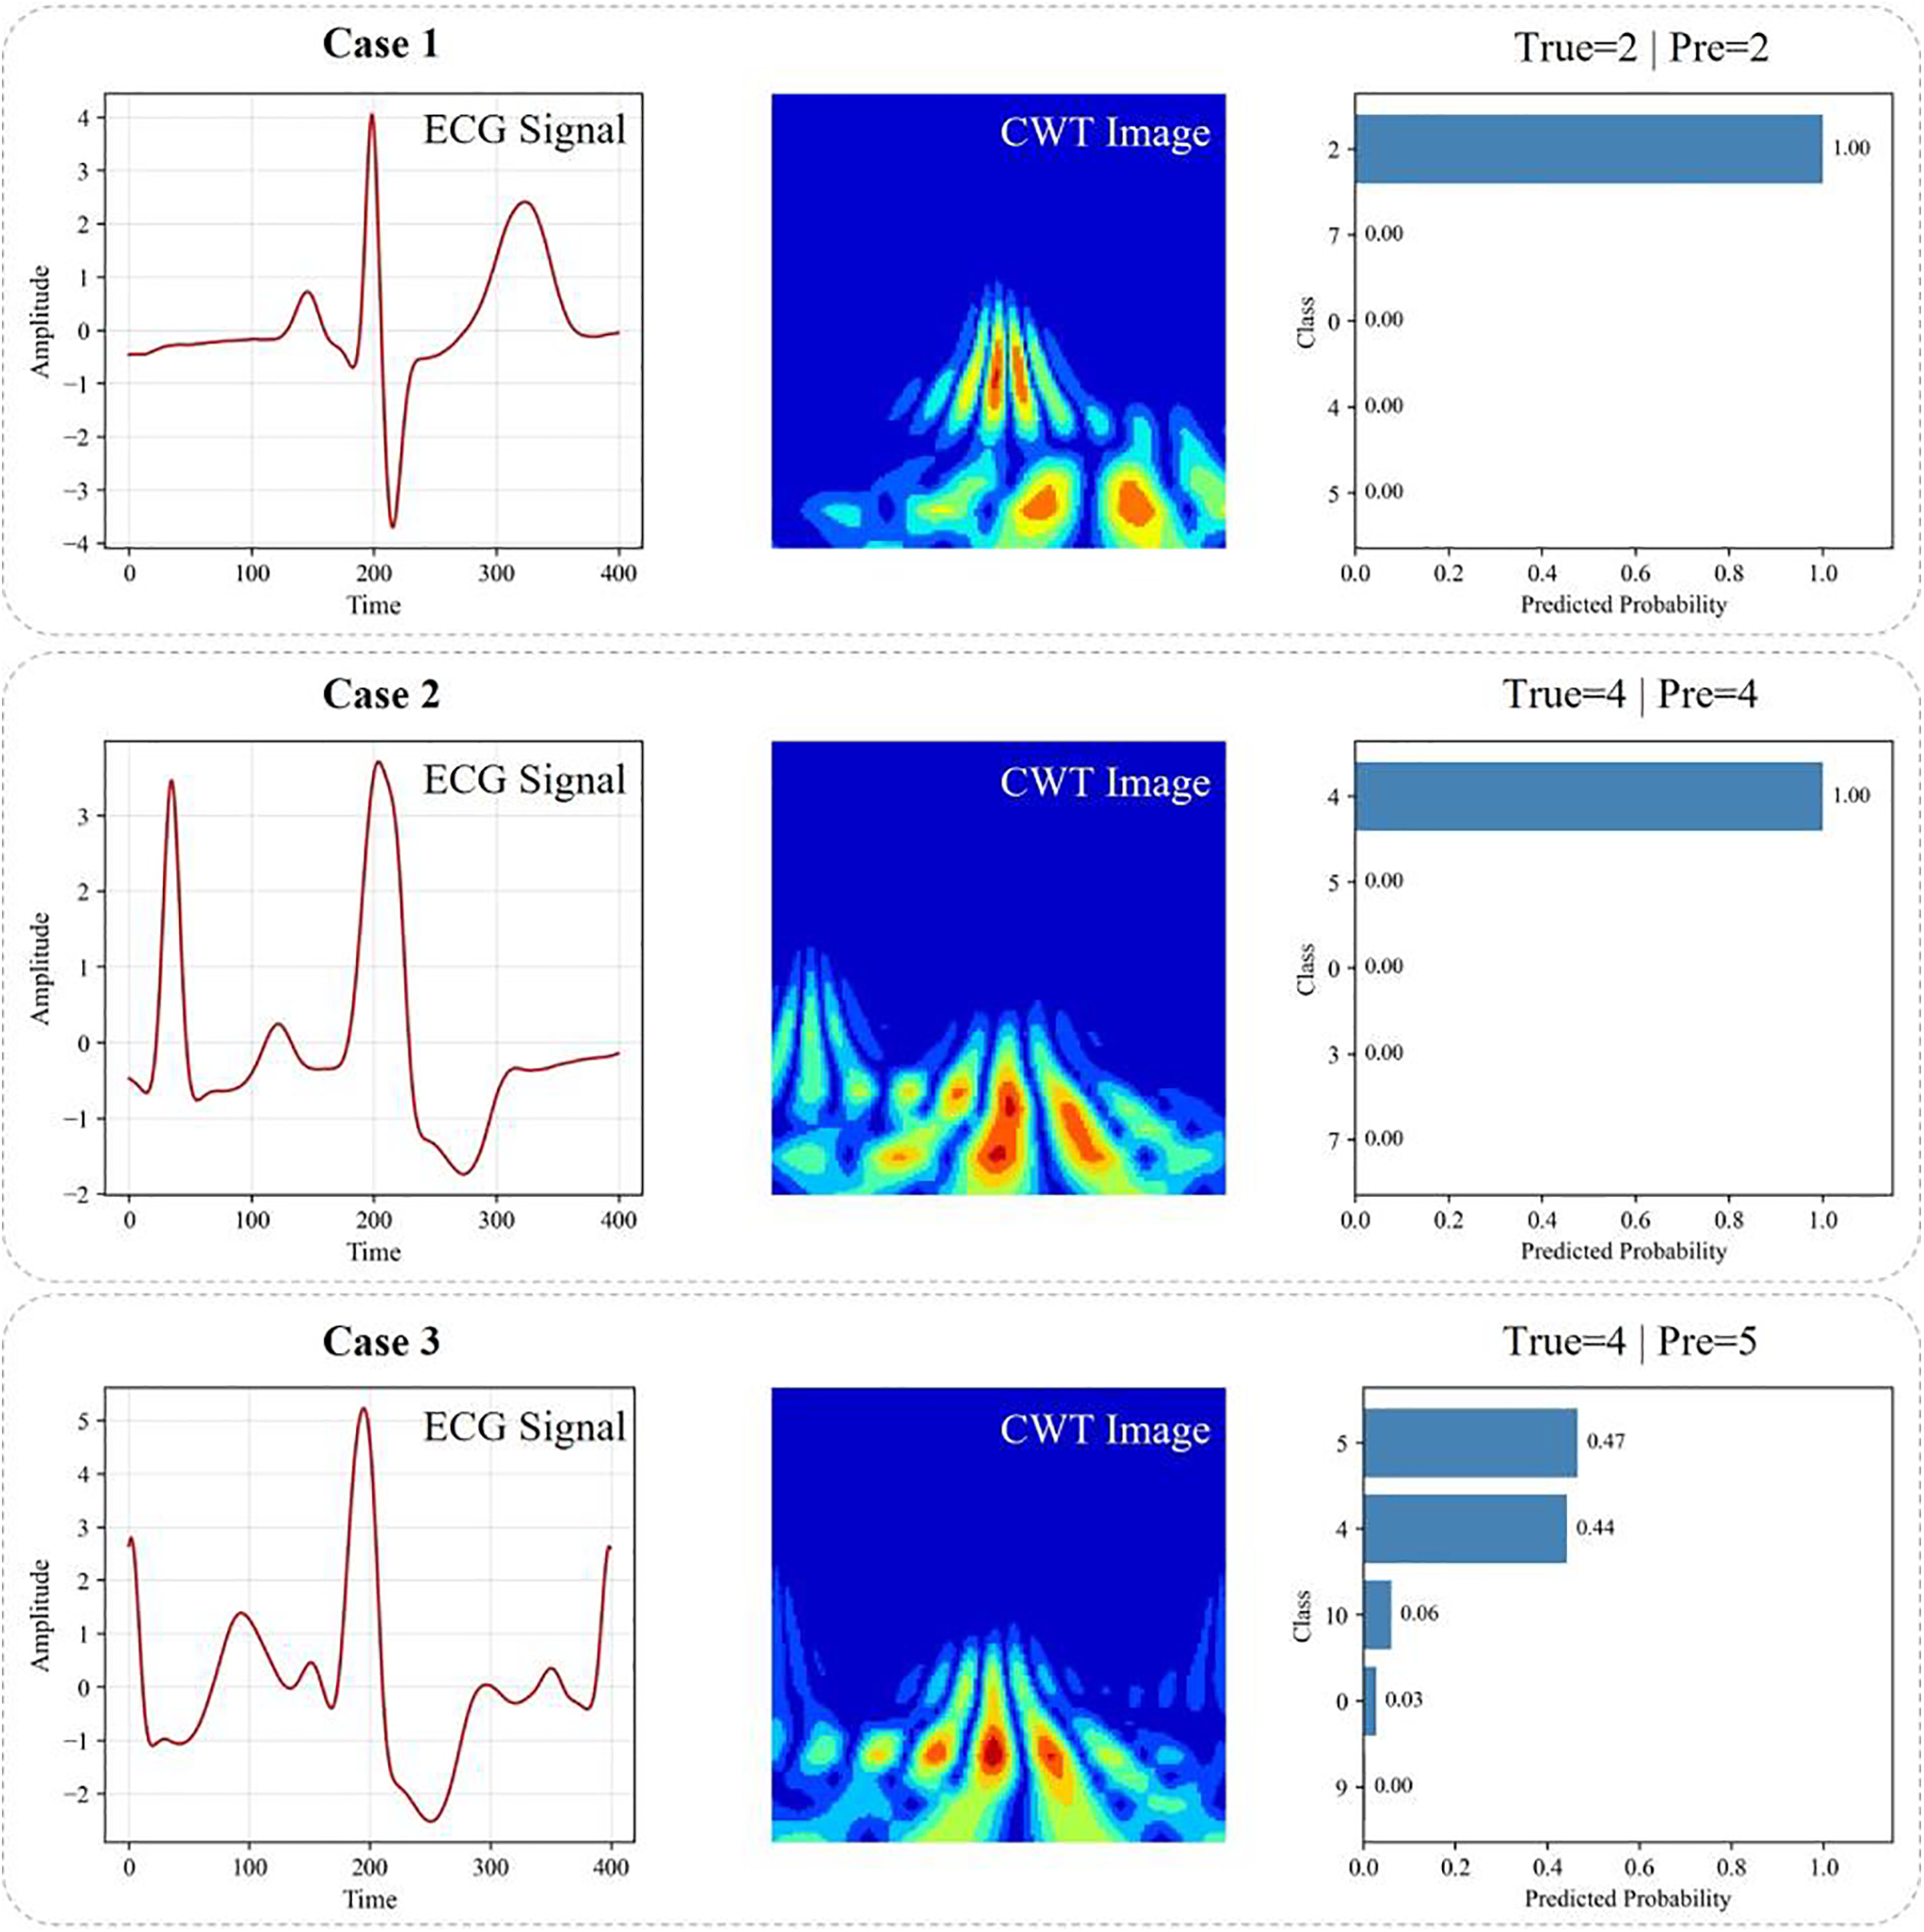
Figure 9: Qualitative visualization of classification results. Cases 1 and 2 are correctly classified examples, while Case 3 illustrates a misclassification caused by ambiguous signal patterns.
For correctly classified cases (Cases 1 and 2), the ECG waveforms exhibit clear morphological characteristics, and the corresponding CWT representations show well-localized and distinguishable energy distributions. These patterns enable the model to extract discriminative features effectively from both the time and frequency domains. As a result, the predicted probability distributions are highly confident, with the correct class receiving dominant probability values close to one. This demonstrates that the proposed dual-path architecture can successfully capture complementary temporal and spectral information when the underlying signal characteristics are sufficiently distinct.
In contrast, Case 3 illustrates a misclassified example. Although the waveform exhibits certain features associated with the ground-truth class, its morphology partially overlaps with other arrhythmia types. This ambiguity is also reflected in the CWT representation, where the energy distribution spans multiple frequency regions with no clearly dominant pattern. Consequently, the predicted probabilities are distributed across multiple classes rather than being concentrated on a single label. This behavior indicates that the model does not produce an overconfident but incorrect decision; instead, it reflects the intrinsic ambiguity of the input signal. Such cases often correspond to borderline or transitional rhythms that are difficult to distinguish even for human experts.
Overall, the qualitative results demonstrate that the proposed DM-EHC framework is capable of capturing meaningful temporal–spectral characteristics and producing reliable predictions in most cases. Misclassifications tend to occur when the underlying ECG patterns exhibit strong inter-class similarity, highlighting the inherent difficulty of the task rather than a deficiency of the model. These observations further support the effectiveness and robustness of the proposed multimodal design in practical arrhythmia classification scenarios.
4.9 Performance in Arrhythmia Classification
These eleven heartbeat patterns can be categorized using the five main AAMI arrhythmia classes (N, SVEB, VEB, F, and Q), and they can be thoroughly compared with the findings of previous studies, as indicated in Table 10. Although the results in Table 10 are based on performance values reported in prior studies that may employ different data partitions and evaluation protocols, they still provide a useful reference for comparing overall trends. All methods were evaluated on the same benchmark dataset, allowing for a reasonable qualitative comparison.
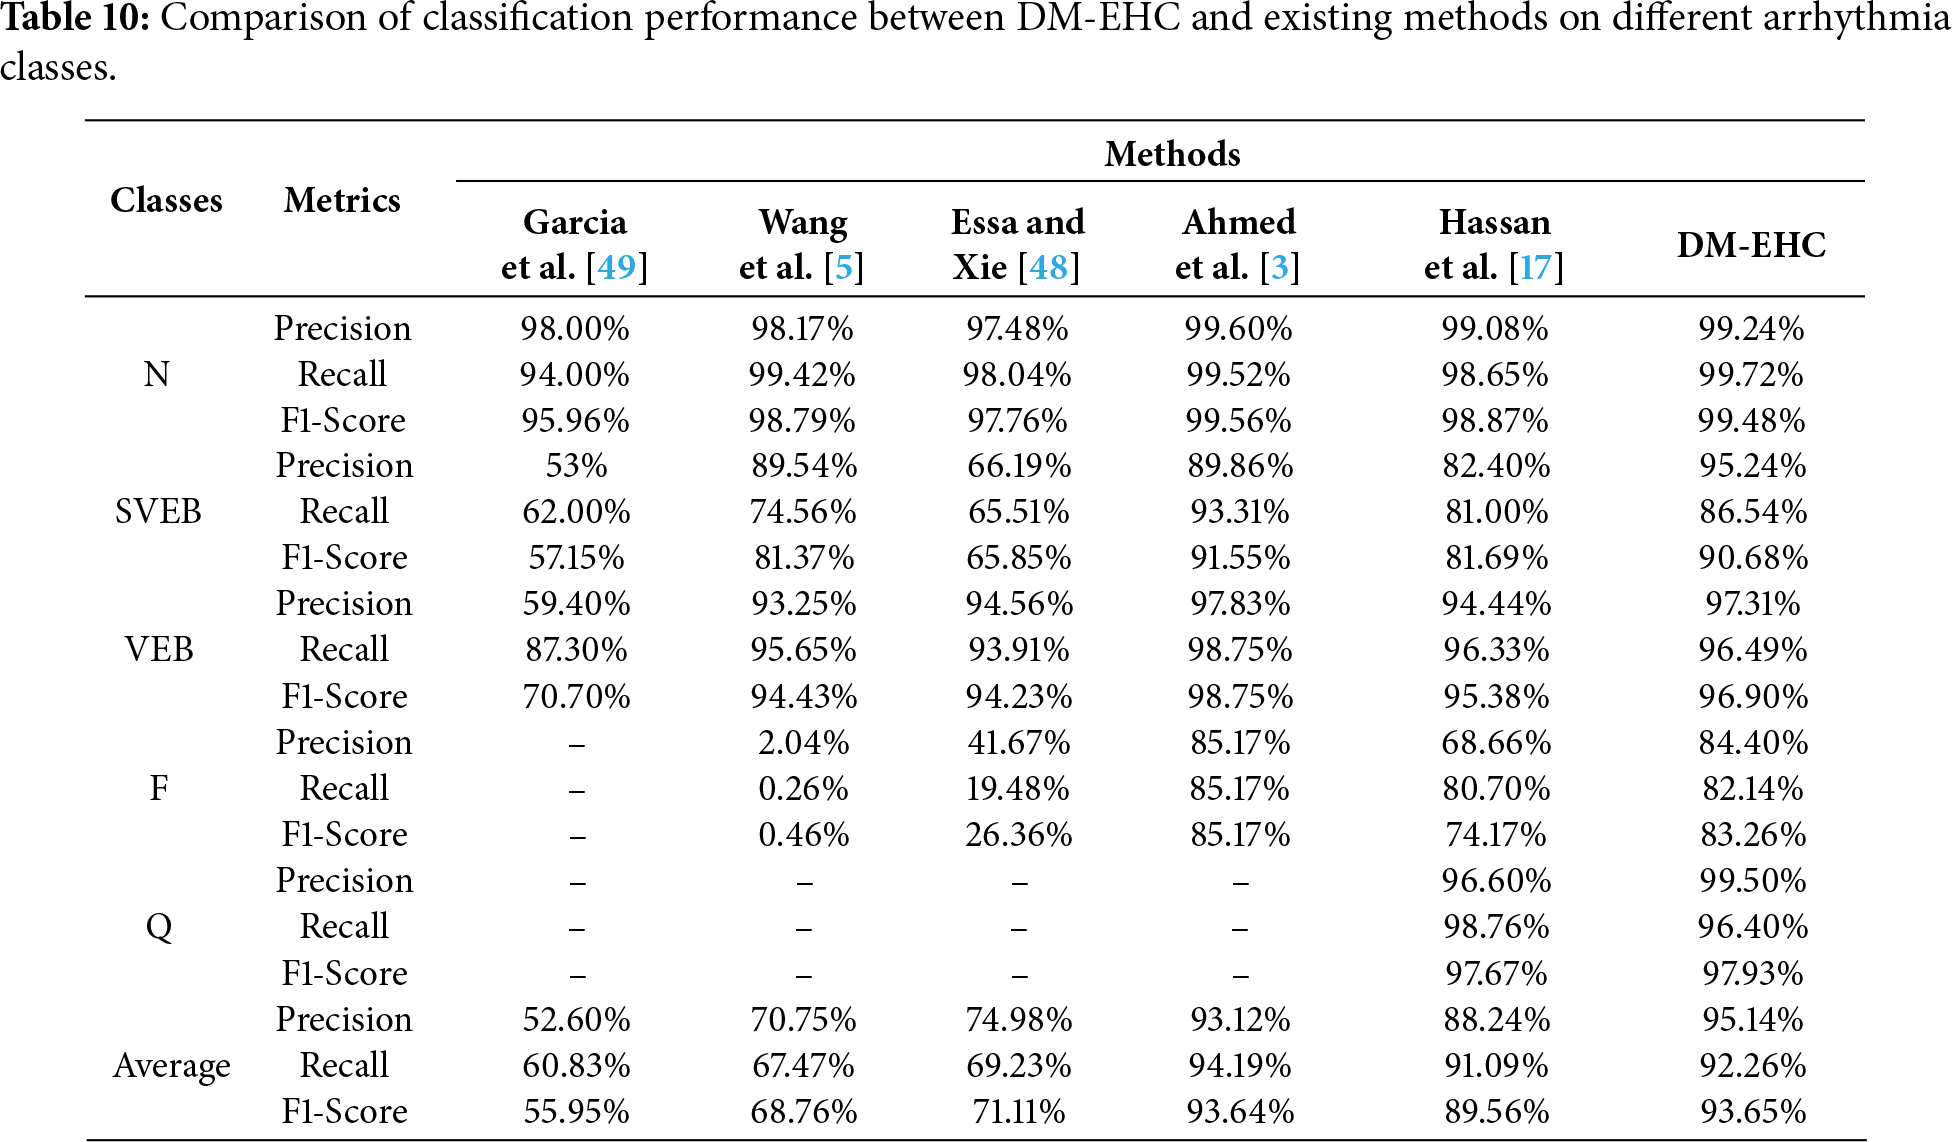
With a precision of 99.24%, a recall of 99.72%, and an F1-Score of 99.48%, the DM-EHC approach outperformed all comparative methods in the classification tasks of different classes, particularly in the N class. The F1-Score was as high as 90.68%, which is satisfactory, and the precision of DM-EHC in the SVEB class reached 95.24%, which was much higher than other methods. With an F1-Score of 96.90% and a precision of 97.31% for the VEB class, DM-EHC can manage this kind of arrhythmia. With an F1-Score of 83.26% and a precision of 84.40% in the F class, DM-EHC outperformed the majority of comparison methods, demonstrating its robustness. Precision is 99.50% and F1-Score is 97.93% in the Q class, which outperforms other approaches. With an average precision of 95.14%, recall of 92.26%, and F1-Score of 93.65%, DM-EHC exceeds Essa and Xie [48], Wang et al. [5], and Garcia et al. [49] methods in every class.
In comparison to the approach put out by Hassan et al. [17], DM-EHC markedly enhances both overall classification efficacy and class classification efficacy. Regarding average measures, DM-EHC’s precision, recall, and F1-Score improved by 6.9%, 1.17%, and 4.09% correspondingly, indicating enhanced classification proficiency. A clear advantage of DM-EHC appears in the less represented categories. For example, in the SVEB and F classes, the model achieves gains of 12.84% in accuracy and 9.09% in F1-score, showing its ability to extract more informative features from rare heartbeat patterns. In addition, for majority classes such as N and VEB, DM-EHC delivers slightly higher performance compared with the model proposed by Hassan et al., suggesting that the method maintains a strong balance between handling common cases and adapting to more complex classification demands.
The comparison with Ahmed et al. [3] shows that DM-EHC achieves better overall performance, particularly in terms of average precision and F1-score, although Ahmed et al. reports slightly higher recall. Across most heartbeat categories, DM-EHC delivers stronger results and is especially effective in identifying class Q, where Ahmed et al.’s model is limited by scarce data. A closer look at individual categories reveals that Ahmed et al. performs well in SVEB and VEB recall, indicating its strength in minimizing missed detections. DM-EHC, on the other hand, maintains more stable precision, suggesting greater reliability in controlling false alarms. These characteristics imply that Ahmed et al.’s approach may be preferable in scenarios where high recall is critical, while DM-EHC offers a more balanced solution, providing higher overall accuracy and stronger robustness.
The findings indicate that DM-EHC provides clear advantages in situations involving imbalanced data and classes that are generally difficult to distinguish. The model delivers strong performance across the evaluated tasks and shows marked improvements for underrepresented categories such as SVEB and Fusion. These gains are largely attributed to the combination of multimodal information and the model’s ability to capture detailed temporal and time–frequency characteristics. In addition, DM-EHC consistently outperforms the alternative methods included in the comparison, particularly in scenarios requiring reliable recognition of complex heartbeat patterns and robustness against skewed class distributions. Overall, the framework demonstrates stable and generalizable behavior, making it well suited for arrhythmia classification tasks with challenging class structures.
The method has advantages over existing research in terms of model structure design and data construction methods. For example, Acharya et al. [14] and Hua et al. [16] only used one-dimensional convolutional networks, which could only extract features of the original ECG signal. Izci et al. [21] and Wang et al. [5] used time-domain transformation methods to extract frequency domain features related to the ECG. Compared with the above studies, the method can extract features in the time domain and frequency domain simultaneously by creating a dual-path structure. In other words, this network can extract features more comprehensively. When facing more complex arrhythmia categories, it can not only focus on waveform changes but also pay attention to spectral differences. This enables the model to learn richer feature representation information.
In addition to the advantages of network model architecture, data construction also has advantages. Previous studies usually use fixed-length windows or standard preprocessed raw signal representations. For example, the studies of Ahmed et al. [3] and Ferretti et al. [15]. However, their research faces the problem of imbalanced datasets, making it difficult to solve this problem. Or like Izci et al. [21] and Wang et al. [5], they learn frequency domain features. Regardless of the above studies, they learn a single feature type. Regardless of the type of research mentioned above, they all involve learning a single feature type. The research involves creating two modalities of data and fusing them for learning. The goal is to learn features simultaneously, allowing them to participate in classification decisions within the same learning framework. It is precisely because of the richer feature learning that the impact of data imbalance is mitigated in a roundabout way. It can correctly diagnose and classify rare and complex types of arrhythmias.
In addition to the architectural advantages discussed above, the design of the input representation and segmentation strategy also plays a critical role in the overall performance of the proposed framework. It is worth noting that the ECG signals in this study were segmented using a fixed-length window centered on the R-wave peak, and preprocessed with a fourth-order Butterworth bandpass filter with a frequency range of 0.5–15 Hz. However, for cases with irregular RR intervals, this fixed window may not fully capture temporal variations, and the upper cutoff frequency may attenuate some high-frequency components associated with specific arrhythmias. Future research could explore adaptive segmentation strategies based on RR intervals or multi-scale time modeling, as well as investigate other or multi-band filtering schemes to better preserve the discriminative features of the signals.
The experimental results also show that, compared with existing methods, DM-EHC achieves higher accuracy, recall and F1 scores in multiple categories. Particularly in a smaller number of classes, such as SVEB, VEB, and F, the results showed significant improvement. This theoretically further validates the ability of the proposed multimodal framework to classify cardiac arrhythmias.
Beyond classification performance, computational efficiency is another important consideration for practical deployment. From a computational perspective, although the proposed multimodal framework introduces additional complexity compared to single-branch models, the overall network structure remains relatively lightweight and computationally feasible. This makes the method suitable for offline analysis and, with appropriate optimization, holds promise for deployment in real-world clinical scenarios. However, further exploration of lightweight architectures or model compression techniques could improve efficiency and facilitate real-time or resource-constrained applications.
While the proposed method performs well overall, a small number of misclassifications still occur, primarily when different types of arrhythmias exhibit highly similar morphological patterns. In particular, even with multimodal features, some heartbeats with subtle waveform changes or transitional features are difficult to distinguish. Limited sample diversity restricts the model’s ability to learn fully discriminative representations. This observation suggests that introducing richer temporal context or more adaptive feature learning strategies might further enhance the model’s robustness in complex situations.
The proposed framework was evaluated on the MIT-BIH arrhythmia database, a widely used benchmark database in ECG research; however, we acknowledge that the current experiments were conducted on a single dataset. To mitigate potential subject-dependent bias, the proposed method employs a heartbeat-based classification strategy, treating each heartbeat as an independent sample rather than relying on patient-level patterns. This design helps reduce overfitting to individual subjects and allows the model to focus on the morphological features of ECG waveforms. Furthermore, the proposed multimodal representation method integrates time-domain and time-frequency information, aiming to capture intrinsic cardiac features that are less sensitive to inter-patient differences. While cross-dataset validation can more rigorously assess generalization ability, this evaluation is limited by differences in annotation protocols and signal acquisition conditions across different ECG databases. Future work will extend the proposed framework to more public datasets and explore domain-adaptive strategies to further validate its generalization performance in different clinical scenarios.
Despite the good performance of the proposed method, some limitations remain. First, the effectiveness of multimodal learning inherently depends on high-quality and well-labeled datasets. Compared to unimodal methods, multimodal models require richer and more diverse data sources; however, the collection of large-scale, high-quality multimodal ECG datasets is limited by privacy concerns and data acquisition costs. Future work will focus on constructing or utilizing datasets more suited to multimodal approaches to further enhance the robustness and generalization ability of the proposed framework.
Second, although the current multimodal architecture achieves a good balance between performance and computational efficiency, the increased complexity introduced by multi-branch feature extraction inevitably leads to higher computational demands. Future research will explore lighter network designs and efficient fusion strategies to reduce computational overhead while maintaining discriminative power, thus facilitating deployment in resource-constrained or real-time clinical environments.
Furthermore, while the proposed multimodal framework exhibits strong performance, further efforts are needed to improve its interpretability and clinical transparency. Future work could introduce visualization techniques such as Gradient Weighted Class Activation Mapping (Grad-CAM) to highlight discriminative regions that contribute to the model’s predictions. By visualizing the attention regions in time-domain ECG signals and time-frequency representations, clinicians can better understand the model’s decision-making process and verify whether the learned features have physiological significance. This interpretable analysis will improve the reliability and clinical acceptance of multimodal ECG classification systems.
This study addresses several challenges in arrhythmia classification, such as the uneven distribution of arrhythmia classes and the limited representation of single-modal input features. By introducing a multimodal strategy, the above problems are solved while improving the reliability and accuracy of the automated diagnostic system.
To this end, the DM-EHC framework was developed as a deep learning model that integrates information from both the raw 1D ECG waveform and its corresponding time–frequency representation. Combining these complementary sources of information enables the system to better identify underrepresented heartbeat types and supports clinicians in detecting high-risk arrhythmias with greater confidence. In doing so, the approach addresses major weaknesses of traditional single-modality methods and offers more dependable diagnostic assistance for rare or morphologically complex arrhythmias.
Future research will focus on lightweight network architectures to reduce dependence on large-scale annotated datasets and improve deployment feasibility in real-world settings. In addition, generative data augmentation strategies will be explored to expand minority-class samples, thereby improving model adaptability and stability. With continued optimization of multimodal feature fusion and network design, ECG-based intelligent diagnostic systems are expected to play an increasingly important role in clinical decision support and preventive cardiology.
Acknowledgement: None.
Funding Statement: This work was partly supported by the Innovative Human Resource Development for Local Intellectualization program through the Institute of Information & Communications Technology Planning & Evaluation (IITP) grant funded by the Korea government (MSIT) (No. IITP-2026-2020-0-01741), and by the research fund of Hanyang University (HY-2025-1110).
Author Contributions: The authors confirm contribution to the paper as follows: conceptualization, Yu Zhou; methodology, Yu Zhou and Jiawei Tian; software, Yu Zhou and Jiawei Tian; formal analysis, Yu Zhou and Jiawei Tian; data curation, Yu Zhou; writing—original draft, Yu Zhou; writing—editing, Jiawei Tian; writing—review, Kyungtae Kang; supervision, Kyungtae Kang; funding acquisition, Kyungtae Kang. All authors reviewed and approved the final version of the manuscript.
Availability of Data and Materials: The data that support the findings of this study are openly available in the MIT-BIH Arrhythmia Database at https://www.physionet.org/content/mitdb/1.0.0/.
Ethics Approval: This study did not involve any human participants, animals, or sensitive personal data. Therefore, ethics approval was not required in accordance with institutional and national guidelines. All experimental procedures were conducted in compliance with standard laboratory protocols and safety regulations.
Conflicts of Interest: The authors declare no conflicts of interest.
References
1. Roth GA, Mensah GA, Fuster V. The global burden of cardiovascular diseases and risks: a compass for global action. J Am Coll Cardiol. 2020;76(25):2980–1. doi:10.1016/j.jacc.2020.11.021. [Google Scholar] [PubMed] [CrossRef]
2. Gaidai O, Cao Y, Loginov S. Global cardiovascular diseases death rate prediction. Curr Probl Cardiol. 2023;48(5):101622. doi:10.1016/j.cpcardiol.2023.101622. [Google Scholar] [PubMed] [CrossRef]
3. Ahmed AA, Ali W, Abdullah TAA, Malebary SJ. Classifying cardiac arrhythmia from ECG signal using 1D CNN deep learning model. Mathematics. 2023;11(3):562. doi:10.3390/math11030562. [Google Scholar] [CrossRef]
4. Xiao Q, Lee K, Mokhtar SA, Ismail I, bin Md Pauzi AL, Zhang Q, et al. Deep learning-based ECG arrhythmia classification: a systematic review. Appl Sci. 2023;13(8):4964. doi:10.3390/app13084964. [Google Scholar] [CrossRef]
5. Wang T, Lu C, Sun Y, Yang M, Liu C, Ou C. Automatic ECG classification using continuous wavelet transform and convolutional neural network. Entropy. 2021;23(1):119. doi:10.3390/e23010119. [Google Scholar] [PubMed] [CrossRef]
6. Ullah A, Rehman Sur, Tu S, Mehmood RM, Fawad, Ehatisham-ul-haq M. A hybrid deep CNN model for abnormal arrhythmia detection based on cardiac ECG signal. Sensors. 2021;21(3):951. doi:10.3390/s21030951. [Google Scholar] [PubMed] [CrossRef]
7. Katal N, Gupta S, Verma P, Sharma B. Deep-learning-based arrhythmia detection using ECG signals: a comparative study and performance evaluation. Diagnostics. 2023;13(24):3605. doi:10.3390/diagnostics13243605. [Google Scholar] [PubMed] [CrossRef]
8. Johnson AEW, Bulgarelli L, Shen L, Gayles A, Shammout A, Horng S, et al. MIMIC-IV, a freely accessible electronic health record dataset. Sci Data. 2023;10(1):1. doi:10.1038/s41597-023-01945-2. [Google Scholar] [PubMed] [CrossRef]
9. Ouyang D, He B, Ghorbani A, Yuan N, Ebinger J, Langlotz CP, et al. Video-based AI for beat-to-beat assessment of cardiac function. Nature. 2020;580(7802):252–6. doi:10.1038/s41586-020-2145-8. [Google Scholar] [PubMed] [CrossRef]
10. Shorten C, Khoshgoftaar TM, Furht B. Text data augmentation for deep learning. J Big Data. 2021;8(1):101. doi:10.1186/s40537-021-00492-0. [Google Scholar] [PubMed] [CrossRef]
11. Liu X, Gao K, Liu B, Pan C, Liang K, Yan L, et al. Advances in deep learning-based medical image analysis. Health Data Sci. 2021;2021:8786793. doi:10.34133/2021/8786793. [Google Scholar] [PubMed] [CrossRef]
12. Gupta D, Kose U, Khanna A, Balas VE. Deep learning for medical applications with unique data. Cambridge, MA, USA: Academic Press; 2022. [Google Scholar]
13. Khalifa M, Albadawy M. AI in diagnostic imaging: revolutionising accuracy and efficiency. Comput Meth Programs Biomed Update. 2024;5:100146. doi:10.1016/j.cmpbup.2024.100146. [Google Scholar] [CrossRef]
14. Acharya UR, Fujita H, Lih OS, Hagiwara Y, Tan JH, Adam M. Automated detection of arrhythmias using different intervals of tachycardia ECG segments with convolutional neural network. Inf Sci. 2017;405(1):81–90. doi:10.1016/j.ins.2017.04.012. [Google Scholar] [CrossRef]
15. Ferretti J, Randazzo V, Cirrincione G, Pasero E. 1-D convolutional neural network for ECG arrhythmia classification. In: Progresses in artificial intelligence and neural systems. Singapore: Springer; 2020. p. 269–79. doi:10.1007/978-981-15-5093-5_25. [Google Scholar] [CrossRef]
16. Hua X, Han J, Zhao C, Tang H, He Z, Chen Q, et al. A novel method for ECG signal classification via one-dimensional convolutional neural network. Multimed Syst. 2022;28(4):1387–99. doi:10.1007/s00530-020-00713-1. [Google Scholar] [CrossRef]
17. Hassan SU, Mohd Zahid MS, Abdullah TA, Husain K. Classification of cardiac arrhythmia using a convolutional neural network and bi-directional long short-term memory. Digit Health. 2022;8:1–13. doi:10.1177/20552076221102766. [Google Scholar] [PubMed] [CrossRef]
18. Madan P, Singh V, Singh DP, Diwakar M, Pant B, Kishor A. A hybrid deep learning approach for ECG-based arrhythmia classification. Bioengineering. 2022;9(4):152. doi:10.3390/bioengineering9040152. [Google Scholar] [PubMed] [CrossRef]
19. Tihak A, Smajlovic L, Boskovic D, editors. Classification of atrial fibrillation ECG signals using 2D CNN. In: Mediterranean Conference on Medical and Biological Engineering and Computing; 2023 Sep 14–16; Sarajevo, Bosnia and Herzegovina. Cham, Switzerland: Springer; 2023. doi:10.1007/978-3-031-49062-0_7. [Google Scholar] [CrossRef]
20. Jamil S, Rahman M. A novel deep-learning-based framework for the classification of cardiac arrhythmia. J Imaging. 2022;8(3):70. doi:10.3390/jimaging8030070. [Google Scholar] [PubMed] [CrossRef]
21. Izci E, Ozdemir MA, Degirmenci M, Akan A, editors. Cardiac arrhythmia detection from 2D ECG images by using deep learning technique. In: Proceedings of the 2019 Medical Technologies Congress (TIPTEKNO); 2019 Oct 3–5; Izmir, Turkey. doi:10.1109/tiptekno.2019.8895011. [Google Scholar] [CrossRef]
22. Huang J, Chen B, Yao B, He W. ECG arrhythmia classification using STFT-based spectrogram and convolutional neural network. IEEE Access. 2019;7:92871–80. doi:10.1109/access.2019.2928017. [Google Scholar] [CrossRef]
23. Al Rahhal MM, Bazi Y, Al Zuair M, Othman E, BenJdira B. Convolutional neural networks for electrocardiogram classification. J Med Biol Eng. 2018;38(6):1014–25. doi:10.1007/s40846-018-0389-7. [Google Scholar] [CrossRef]
24. Mohonta SC, Motin MA, Kumar DK. Electrocardiogram based arrhythmia classification using wavelet transform with deep learning model. Sens Bio Sens Res. 2022;37:100502. doi:10.1016/j.sbsr.2022.100502. [Google Scholar] [CrossRef]
25. Yan K, Li T, Marques JAL, Gao J, Fong SJ. A review on multimodal machine learning in medical diagnostics. Math Biosci Eng. 2023;20(5):8708–26. doi:10.3934/mbe.2023382. [Google Scholar] [PubMed] [CrossRef]
26. Ahmad Z, Tabassum A, Guan L, Khan NM. ECG heartbeat classification using multimodal fusion. IEEE Access. 2021;9:100615–26. doi:10.1109/access.2021.3097614. [Google Scholar] [CrossRef]
27. Dhanka S, Maini S. A hybrid machine learning approach using particle swarm optimization for cardiac arrhythmia classification. Int J Cardiol. 2025;432:133266. doi:10.1016/j.ijcard.2025.133266. [Google Scholar] [PubMed] [CrossRef]
28. Moody GB, Mark RG. The impact of the MIT-BIH arrhythmia database. IEEE Eng Med Biol Mag. 2001;20(3):45–50. doi:10.1109/51.932724. [Google Scholar] [PubMed] [CrossRef]
29. Wu M, Lu Y, Yang W, Wong SY. A study on arrhythmia via ECG signal classification using the convolutional neural network. Front Comput Neurosci. 2021;14:564015. doi:10.3389/fncom.2020.564015. [Google Scholar] [PubMed] [CrossRef]
30. Ansari Y, Mourad O, Qaraqe K, Serpedin E. Deep learning for ECG Arrhythmia detection and classification: an overview of progress for period 2017–2023. Front Physiol. 2023;14:1246746. doi:10.3389/fphys.2023.1246746. [Google Scholar] [PubMed] [CrossRef]
31. Mondéjar-Guerra V, Novo J, Rouco J, Penedo MG, Ortega M. Heartbeat classification fusing temporal and morphological information of ECGs via ensemble of classifiers. Biomed Signal Process Control. 2019;47:41–8. doi:10.1016/j.bspc.2018.08.007. [Google Scholar] [CrossRef]
32. Malghan PG, Hota MK. A review on ECG filtering techniques for rhythm analysis. Res Biomed Eng. 2020;36(2):171–86. doi:10.1007/s42600-020-00057-9. [Google Scholar] [CrossRef]
33. Zhou Y, He Y, Kang K, editors. OSA-CCNN: obstructive sleep apnea detection based on a composite deep convolution neural network model using single-lead ECG signal. In: Proceedings of the 2022 IEEE International Conference on Bioinformatics and Biomedicine (BIBM); 2022 Dec 6–8; Las Vegas, NV, USA. doi:10.1109/bibm55620.2022.9995675. [Google Scholar] [CrossRef]
34. Zhou Y, Kang K. Multi-feature automatic extraction for detecting obstructive sleep apnea based on single-lead electrocardiography signals. Sensors. 2024;24(4):1159. doi:10.3390/s24041159. [Google Scholar] [PubMed] [CrossRef]
35. Xie L, Li Z, Zhou Y, He Y, Zhu J. Computational diagnostic techniques for electrocardiogram signal analysis. Sensors. 2020;20(21):6318. doi:10.3390/s20216318. [Google Scholar] [PubMed] [CrossRef]
36. Wu Z, Lan T, Yang C, Nie Z. A novel method to detect multiple arrhythmias based on time-frequency analysis and convolutional neural networks. IEEE Access. 2019;7:170820–30. doi:10.1109/access.2019.2956050. [Google Scholar] [CrossRef]
37. Chen S, Wang H, Zhang H, Peng C, Li Y, Wang B. A novel method of swin transformer with time-frequency characteristics for ECG-based arrhythmia detection. Front Cardiovasc Med. 2024;11:1401143. doi:10.3389/fcvm.2024.1401143. [Google Scholar] [PubMed] [CrossRef]
38. Liu W, Chen L, Chen Y, editors. Age classification using convolutional neural networks with the multi-class focal loss. In: IOP Conference Series: Materials Science and Engineering. Bristol, UK: IOP Publishing; 2018. doi:10.1088/1757-899x/428/1/012043. [Google Scholar] [CrossRef]
39. Garbin C, Zhu X, Marques O. Dropout vs. batch normalization: an empirical study of their impact to deep learning. Multimed Tools Appl. 2020;79(19):12777–815. doi:10.1007/s11042-019-08453-9. [Google Scholar] [CrossRef]
40. Ramachandram D, Taylor GW. Deep multimodal learning: a survey on recent advances and trends. IEEE Signal Process Mag. 2017;34(6):96–108. doi:10.1109/msp.2017.2738401. [Google Scholar] [CrossRef]
41. Romdhane TF, Alhichri H, Ouni R, Atri M. Electrocardiogram heartbeat classification based on a deep convolutional neural network and focal loss. Comput Biol Med. 2020;123:103866. doi:10.1016/j.compbiomed.2020.103866. [Google Scholar] [PubMed] [CrossRef]
42. Barakat A, Bianchi P. Convergence and dynamical behavior of the ADAM algorithm for nonconvex stochastic optimization. SIAM J Optim. 2021;31(1):244–74. doi:10.1137/19m1263443. [Google Scholar] [CrossRef]
43. Ayyachamy S, Alex V, Khened M, Krishnamurthi G, editors. Medical image retrieval using Resnet-18. In: Proceedings of the Medical Imaging 2019: Imaging Informatics for Healthcare, Research, and Applications; 2019 Feb 17–18; San Diego, CA, USA. [Google Scholar]
44. Koonce B. ResNet 50—convolutional neural networks with swift for tensorflow: image recognition and dataset categorization. Berlin/Heidelberg, Germany: Springer; 2021. p. 63–72. doi:10.1007/978-1-4842-6168-2. [Google Scholar] [CrossRef]
45. Chhabra M, Kumar R. A smart healthcare system based on classifier DenseNet 121 model to detect multiple diseases. In: Mobile Radio Communications and 5G Networks: Proceedings of Second MRCN 2021. Singapore: Springer Nature; 2022. p. 297–312. doi:10.1007/978-981-16-7018-3_23. [Google Scholar] [CrossRef]
46. Dong K, Zhou C, Ruan Y, Li Y, editors. MobileNetV2 model for image classification. In: Proceedings of the 2020 2nd International Conference on Information Technology and Computer Application (ITCA); 2020 Dec 18–20; Guangzhou, China. doi:10.1109/itca52113.2020.00106. [Google Scholar] [CrossRef]
47. Nti IK, Nyarko-Boateng O, Aning J. Performance of machine learning algorithms with different K values in K-fold CrossValidation. Int J Inf Technol Comput Sci. 2021;13(6):61–71. doi:10.5815/ijitcs.2021.06.05. [Google Scholar] [CrossRef]
48. Essa E, Xie X. An ensemble of deep learning-based multi-model for ECG heartbeats arrhythmia classification. IEEE Access. 2021;9:103452–64. doi:10.1109/access.2021.3098986. [Google Scholar] [CrossRef]
49. Garcia G, Moreira G, Menotti D, Luz E. Inter-patient ECG heartbeat classification with temporal VCG optimized by PSO. Sci Rep. 2017;7(1):10543. doi:10.1038/s41598-017-09837-3. [Google Scholar] [PubMed] [CrossRef]
Cite This Article
 Copyright © 2026 The Author(s). Published by Tech Science Press.
This work is licensed under a Creative Commons Attribution 4.0 International License , which permits unrestricted use, distribution, and reproduction in any medium, provided the original work is properly cited.
 Downloads
 Citation Tools