
 Submit a Paper
 Propose a Special lssue
 Open Access
ARTICLE

A Deep Learning Approach for Three-Dimensional Thyroid Nodule Detection from Ultrasound Images
1 Department of Computer Science, Faculty of Computer Science and Information Technology, Universiti Putra Malaysia, Selangor, 43400, Malaysia
2 College of Science, University of Kerbala, Karbala, 56001, Iraq
3 Department of Radiology, Faculty of Medicine and Health Sciences, Universiti Putra Malaysia, Selangor, 43400, Malaysia
4 Department of Computer Science, University of Münster, Münster, 48149, Germany
* Corresponding Author: Razali Yaakob. Email:
(This article belongs to the Special Issue: Artificial Intelligence Models in Healthcare: Challenges, Methods, and Applications)
Computer Modeling in Engineering & Sciences 2026, 146(3), 36 https://doi.org/10.32604/cmes.2025.074109
Received 02 October 2025; Accepted 17 December 2025; Issue published 30 March 2026
 View Full Text
 Download PDF
Abstract
Currently, thyroid diseases are prevalent worldwide; therefore, it is necessary to develop techniques that help doctors improve their diagnostic skills for such diseases. In previous studies, 2-dimensional convolutional neural network (2D CNN) techniques were employed to classify thyroid nodules as benign and malignant without detecting the presence of thyroid nodules in the obtained ultrasound images. To address this issue, we propose a 3-dimensional convolutional neural network (3D CNN) for thyroid nodule detection. The proposed CNN exploits the 3D information and spatial features contained in ultrasound images and generates distinctive features during its training using multiple samples, even for small nodules. In contrast, a 2D CNN only depends on spatial features. In this study, we used two datasets of 2210 ultrasound images obtained from the Sultan Abdul Aziz Shah Hospital in Malaysia, and a public open dataset, Digital Database Thyroid Image (DDTI). We created folders containing three images each, processed the images and extracted volumetric features suitable for the 3-dimensional convolutional neural network (3D CNN). The proposed model was assessed using four metrics: accuracy, recall, precision and F1 score. The results showed that the accuracy of the model in predicting the presence of thyroid nodules in ultrasound images was 96%. In conclusion, this study could help radiologists in hospitals and medical centres in classifying ultrasound images and detecting thyroid nodules.Keywords
In computational biology, patient data collection is essential for disease prediction. This can be achieved by selecting features from multiple datasets that are easily distinguishable in healthy individuals. In contrast, selecting the wrong features could lead to the unnecessary treatment of healthy individuals [1]. In recent years, various computational methods have been applied to medical images for the prediction and solution of complex problems. For example, such methods have been used in the detection and diagnosis of thyroid nodules that grow abnormally in the thyroid gland. These nodules affect the normal function of the thyroid gland in the secretion of essential hormones. This, in turn, affects the protein synthesis and metabolism rates [2,3]. The number of thyroid nodule diagnoses and the number of patients with thyroid nodule cancer, especially among women under 30 years old, have increased in recent years [4]. For this reason, the accurate and efficient detection of suspicious thyroid nodules, which relies on radiologists’ experience and skills, is highly important [5]. The detection of thyroid nodules is often performed using various methods such as computed tomography, magnetic resonance imaging, and ultrasound imaging. Among these methods, ultrasound imaging is the most commonly used because it is safe and affordable [5]. Coinciding with the development of artificial intelligence (AI) technology, computer-assisted diagnostic systems have been increasingly used in the medical field [6]. However, in medical imaging, a major issue associated with these technologies is the similarities among different image categories and the differences in images of the same category [7]. For example, as shown in Fig. 1, these images may contain thyroid nodules, lymph nodes, the left thyroid lobe, or the thyroid gland. This is particularly noticeable in ultrasonography, which mainly relies on the doctor’s experience in interpreting these images and diagnosing thyroid diseases [8].
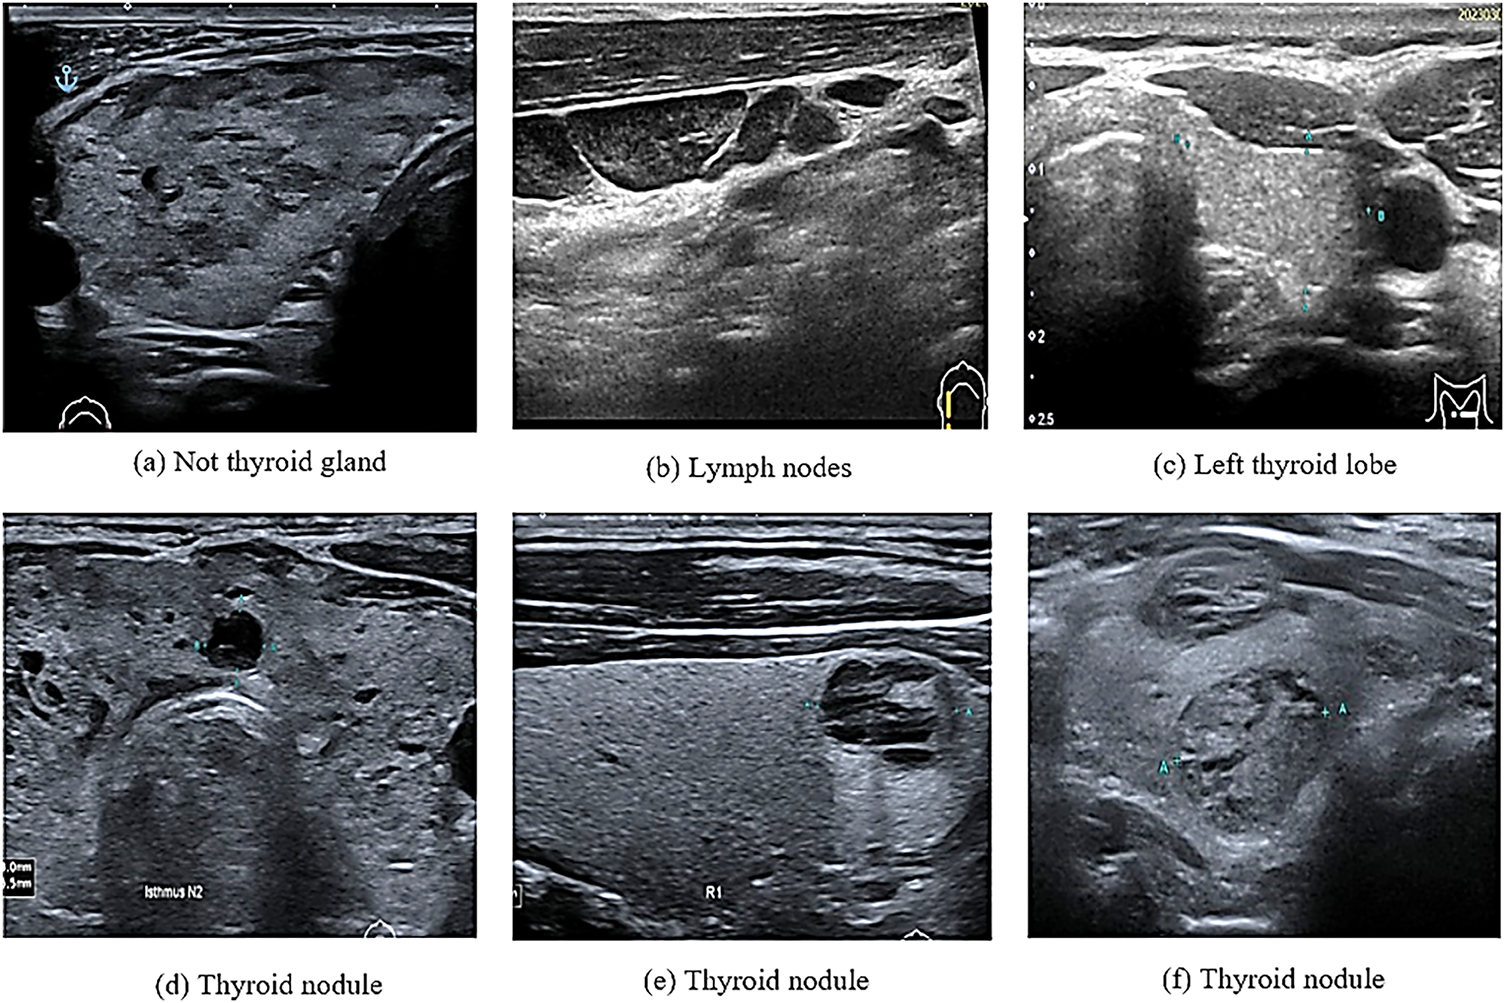
Figure 1: Ultrasound thyroid images (a–c) images without thyroid nodules (d–f) images with thyroid nodules
The low resolution of ultrasound images is associated with shadowing and speckle noise, leading to difficulties in distinguishing different tissues. The results of the low resolution are frequent misdiagnoses and missed diagnoses. Additionally, because of the small and irregular size of nodules in many cases, a considerable amount of time is required to ensure an accurate diagnosis [9]. Thus, developing automated and accurate methods for computer-aided ultrasound examination is highly important [10].
This study introduces a 3D CNN model for detecting thyroid nodules on ultrasound, even the smallest ones. The ability of the 3D CNN to extract volumetric features helps doctors rely on AI to detect and diagnose cancers.
The basic outline of this paper is as follows: Section 2 reviews previous studies on deep learning techniques for thyroid nodules. Section 3 details the methodology, including the data collection, data preprocessing, and the structure of the 3D CNN model. Section 4 presents the experimental results, providing a comparative analysis of our model’s performance against other models and of radiologists’ agreement with the model’s results. Finally, Section 6 concludes the paper by summarizing the experiments, the results, and the future work.
Machine learning techniques (especially deep learning (DL) techniques) have been rapidly developed in recent years for the prediction, classification and identification of patterns in medical images [11,12]. In particular, convolutional neural networks (CNNs) have been widely used in segmentation, classification and disease prediction [13]. Based on their dimensionality, CNNs are classified into 1D, 2D and 3D CNNs [14]. In particular, 2D CNNs can extract spatial features, while 3D CNNs can extract multi-view features using 3D images or stacking multiple ultrasound images, which can be considered as 3D slices [15]. In ultrasound imaging, DL techniques are used to detect thyroid nodules [16], extract features from images and then classify the detected thyroid nodules into benign or malignant [5,17] or into multiple classes according to the type of thyroid cancer [18,19]. DL techniques based on the methods shown in Table 1 have been extensively used for detecting thyroid nodules.
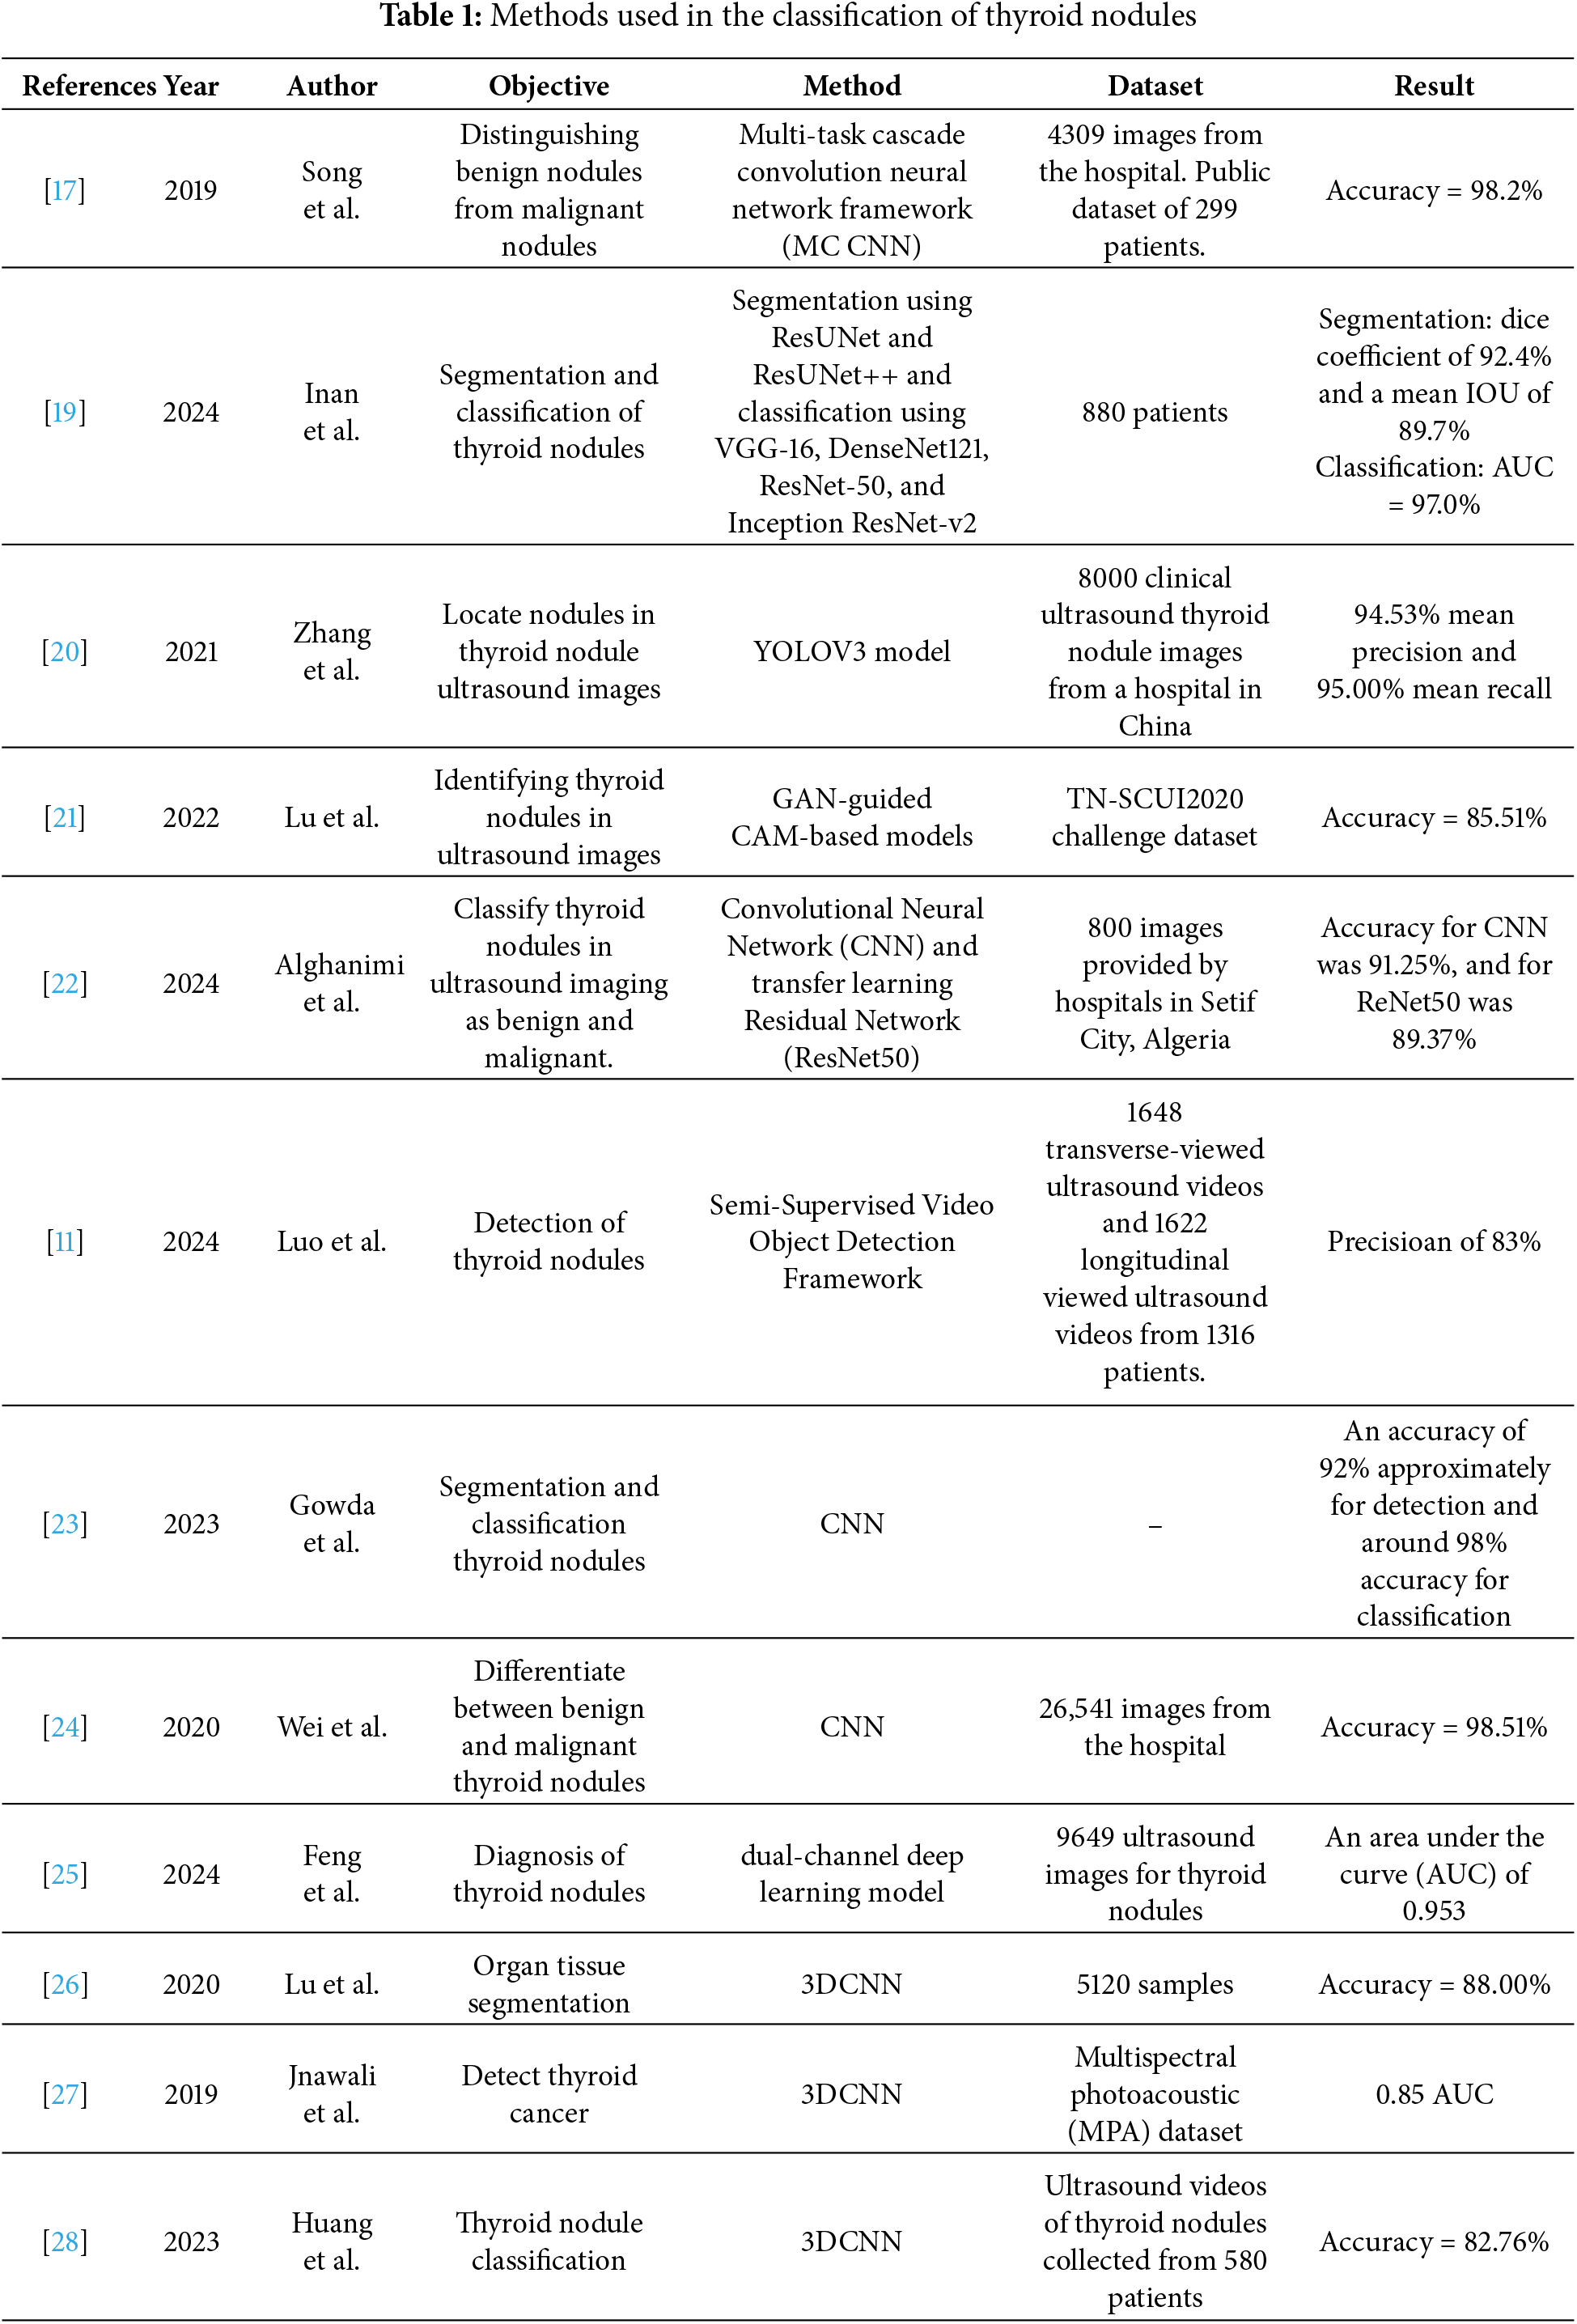
Table 1 shows that some previously reported DL methods for detecting thyroid nodules have faced some challenges. A YOLOV3 model in [20] failed to detect irregularly shaped nodules because it identified the background of ultrasound images as a nodule. In [21], a generative adversarial network (GAN)-guided class activation mapping (CAM) mechanism model was used to detect thyroid nodules. Nevertheless, the model could only detect large nodules and not small nodules based on a zoom technique. A semi-supervised video object detection framework was used to detect thyroid nodules from ultrasound videos [11]. However, the similarity between thyroid nodules and thyroid vessels degraded the performance of the detection framework [11]. Feng et al. have applied a dual-channel DL model to ultrasound images already containing thyroid nodules. The model was applied to two static images, leading to a loss of information related to some nodules; consequently, patients underwent surgery or biopsy [25]. A 3D CNN was used in a previous study for the segmentation, classification, and detection of thyroid nodules [26]. In [27], a 3D CNN model was used to detect thyroid tissues from multispectral photoacoustic images. However, it was trained using thyroid nodules and tested on prostate images [27].
The aforementioned background indicates that in previous studies, the thyroid (i.e., a normal thyroid lobe) could not be detected in ultrasound images. Because of this, using an appropriate model to detect the thyroid in ultrasound images can facilitate the work of medical specialists. Additionally, DL models and model training using images of thyroid nodules can facilitate the classification of nodules as benign or malignant. The objective of this study is to develop a 3D CNN model based on previous studies [26–28] to improve the classification of ultrasound images and the detection of thyroid nodules. The proposed 3D CNN model is used to classify the thyroid nodules contained in ultrasound images into two classes: thyroid nodules and normal thyroid lobes. Unlike the models used in previous studies, this model uses three images for the same nodule at each time point to extract all features from the images. Additionally, the proposed 3D CNN model is suitable for detecting small nodules that were not detected in previous studies, making it a pre-emptive diagnostic tool. Examining the presence of thyroid nodules, thyroid lobes, or normal tissues contained in ultrasound images is crucial for eliminating unwanted images before model training to classify a thyroid nodule as benign or malignant. The results of this step are used as input for the segmentation or classification model. This step is important because it reduces the errors during model training and increases the accuracy of image segmentation.
In this section, we describe the data collection, the pre-processing of ultrasound images, and the structure of the proposed 3D CNN model, which is used for image classification.
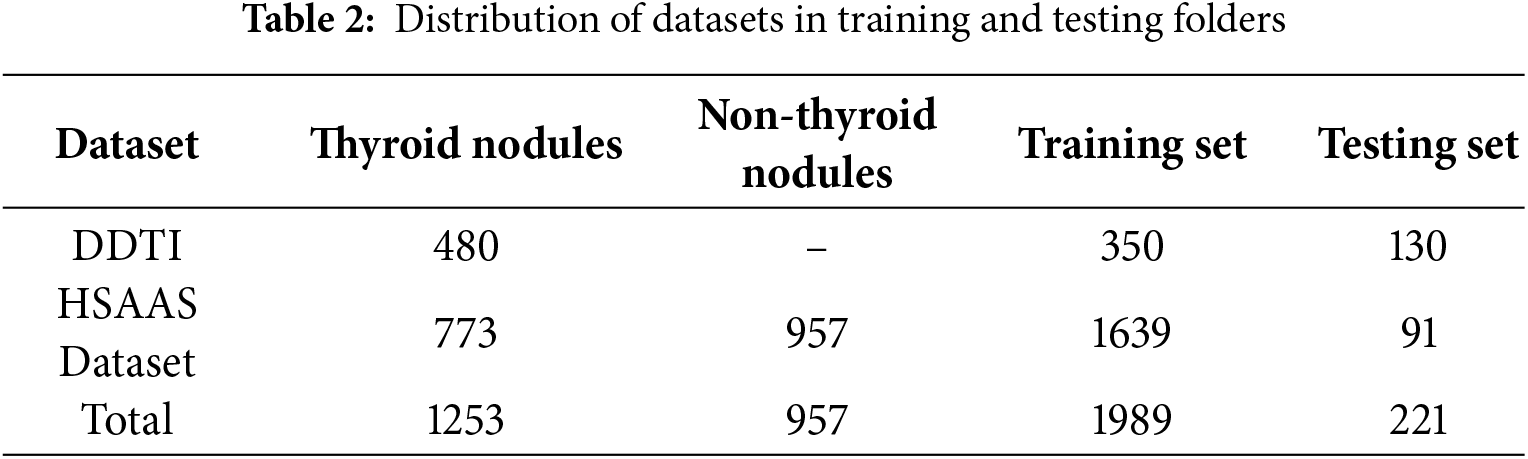
In this study, we used two datasets, which are (i) containing 1730 ultrasound images obtained from the Sultan Abdul Aziz Shah Hospital (HSAAS) in Malaysia, and (ii) a public open dataset (Digital Database Thyroid Image)1 containing 480 ultrasound images [29]. Among the ultrasound images (with and without thyroid nodules) obtained from the hospital, those with the nodules contained information regarding nodule shape, size and density, which is used to train models that meet the demands of practical clinical applications in hospitals. The ultrasound imaging equipment used in the hospital was Canon Aplio i800, which uses a linear probe (i18LX5) with a set of standard thyroid scanning protocols. The collection of thyroid cancer patient ultrasound images was approved by the Ethical Committee of the Hospital Sultan Abdul Aziz Shah and the Ethics Committee for Research Involving Human Subjects in Universiti Putra Malaysia (UPM.TNCPI.800-2/1/7).
Furthermore, the aforementioned 1730 images were collected from 1730 patients, of which 957 images contained normal thyroid lobes, and 773 images contained thyroid nodules. Only one image was obtained for each patient to avoid overlapping between the training and testing processes. Table 2 illustrates the distribution of thyroid and non-thyroid ultrasound images in the training and testing image datasets.
The 2D CNN is a traditional network comprising convolutional and pooling layers. The network is connected with the local region around the 2D input images [28]. The network’s sparse connection enables it to represent its inputs hierarchically. The hierarchy of the 3D CNN is an extension of that of the 2D CNN. However, the 3D CNN utilises the z cubes of the images to extract spatial and volumetric features instead of the 2D slice images [26] as shown in Fig. 2.
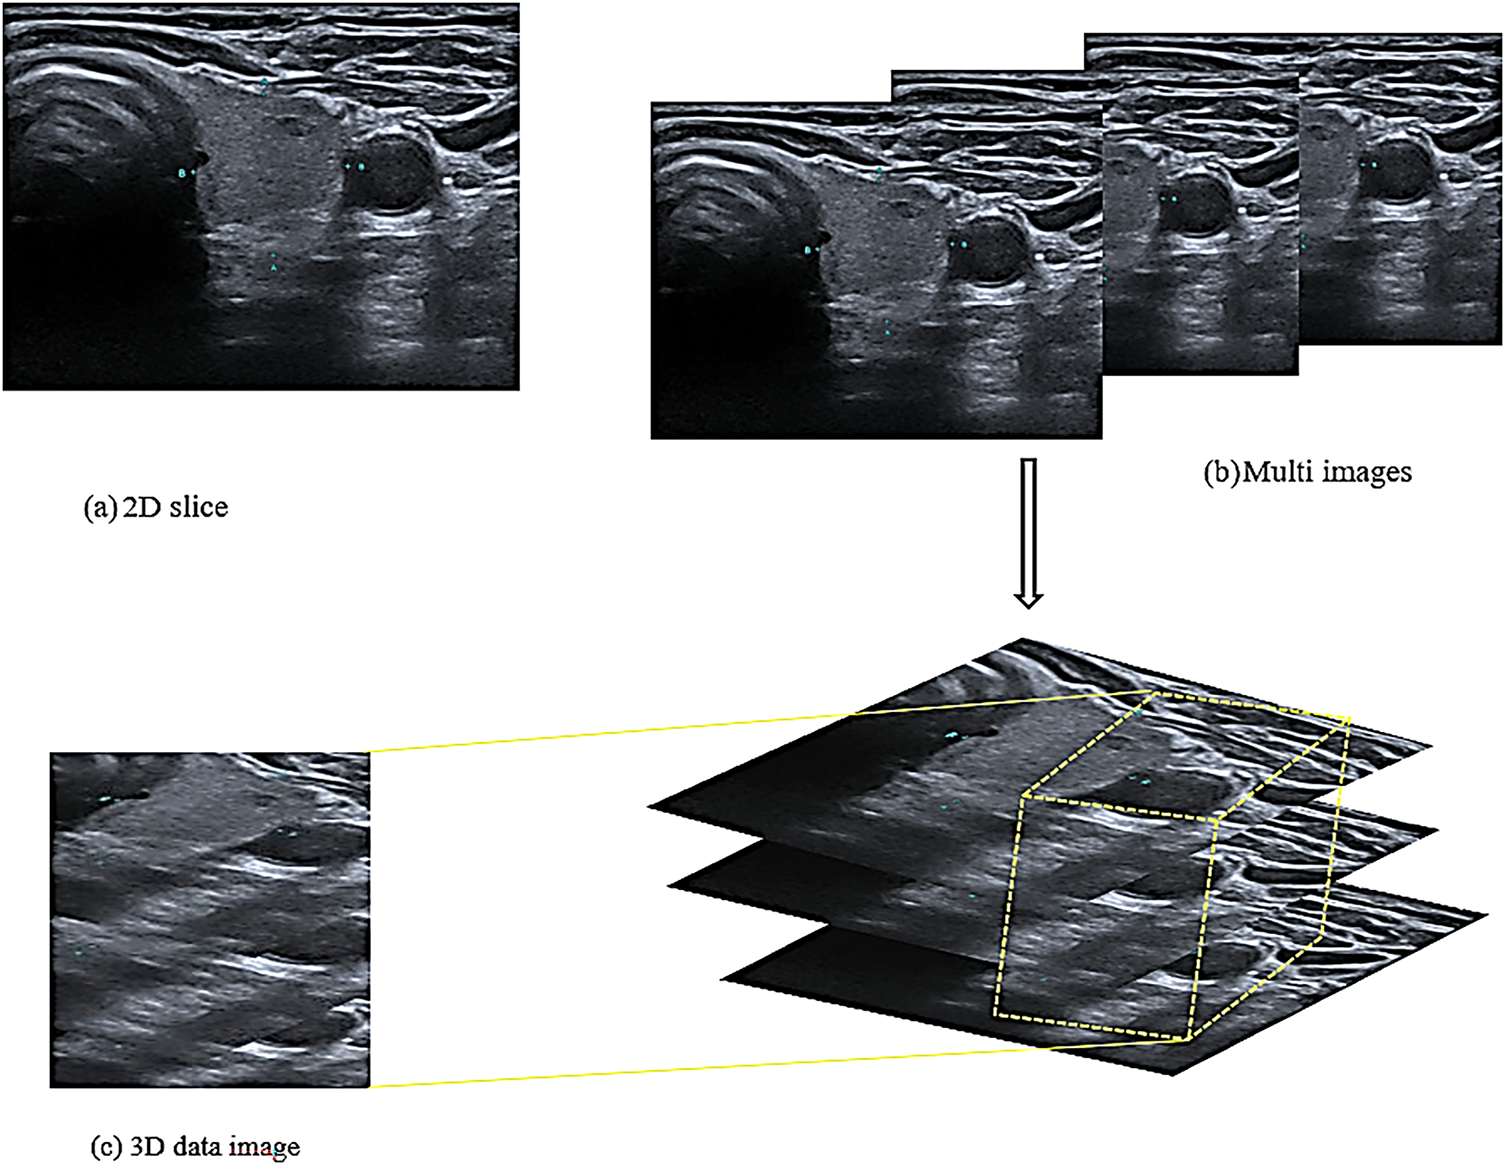
Figure 2: Structure of the input images
Fig. 2a shows a 2D slice that was used in the 2D CNN model for extracting the spatial features utilised in previous studies. Unlike this model, the proposed model required 3D images to extract volumetric features. Consequently, the image dataset was divided into a group of folders, each folder contained three successive images of the same patient and the exact location of the thyroid in the same direction of the image, as shown in Fig. 2b. These three images of the same nodule and location are used to extract volumetric features as a three-dimensional image. The i18LX5 probe, along with a set of standard thyroid scanning protocols, was used to scan the thyroid gland along the axial and longitudinal axes. Fig. 2b shows that the three images were treated as one 3D image and that the model extracted the spatial and volumetric features from the images based on a method reported in a previous study [30]. Accordingly, the features extracted from the images are cubes with height, width, and depth; the depth refers to the number of slices in the same folder, as shown in Fig. 2c.
After inserting the three images as a single input, pre-processing is performed to improve the performance of the training model, as shown in Fig. 3. In this study, we applied various pre-processing techniques to ensure the quality and suitability of the dataset for model training and improve the performance of the model in detecting thyroid nodules. The following processes were applied to all images in the training and testing folders to ensure that they have the same size and pixel intensity.
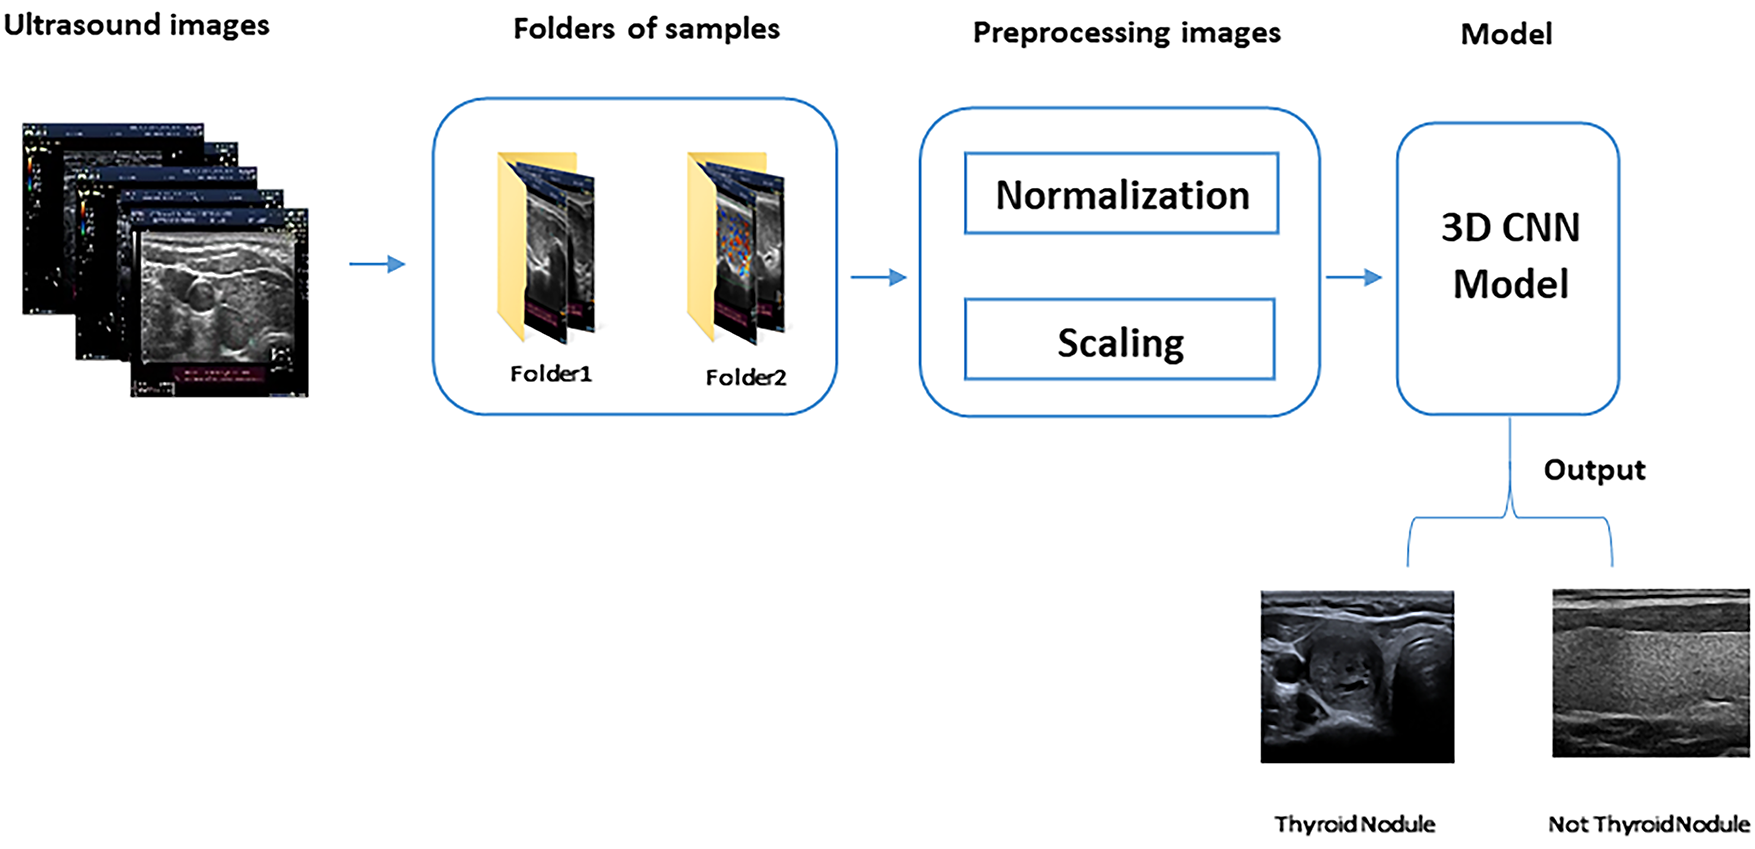
Figure 3: 3D CNN model steps
• Image Normalisation, which is sometimes referred to as contrast stretching, is the process of changing the range (normally between 0 and 1) of the pixel intensity values. The purpose of normalisation or standardisation is to ensure that a whole set of values has a particular property, hence making the image range familiar or normal to the human senses [31]. The normalisation of the pixel intensity values is performed across all channels by dividing all pixel values by the most significant pixel value (i.e., 255), regardless of the actual range of pixel values that are present in the image.
• Image Resizing, which is also referred to as scaling, is an important operation in image processing that is used to magnify or reduce an image when changing the resolution [30]. Many algorithms have been used for image resizing. In this study, a bi-cubic interpolation algorithm based on the sixteen nearest neighbours of a pixel was used to reduce the image size to 64 × 64. Compared with other algorithms, this algorithm preserves finer details of an image than other algorithms [32].
Fig. 3 shows the division of the ultrasound images into folders of samples (each containing three images). After this division, pre-processing is performed to prepare the images for the 3D CNN model, which detects thyroid nodules from the images.
3.3 3D Convolutional Neural Network (3D CNN) Model
In this study, we propose the 3D CNN model shown in Fig. 4 for detecting thyroid nodules in ultrasound images. The figure illustrates the development and assessment of this model for classifying thyroid ultrasound images. In this stage, the model’s input comprises 3D ultrasound images; subsequently, the model is refined to produce a “Fine-Tuned 3D CNN” designed to enhance classification accuracy. During the testing stage, a labelled test set of thyroid images is used to assess the model’s performance by employing a weight matrix that encodes the learned features critical for accurate classification. This framework exemplifies the application of machine learning techniques in medical imaging for achieving precise nodule detection.
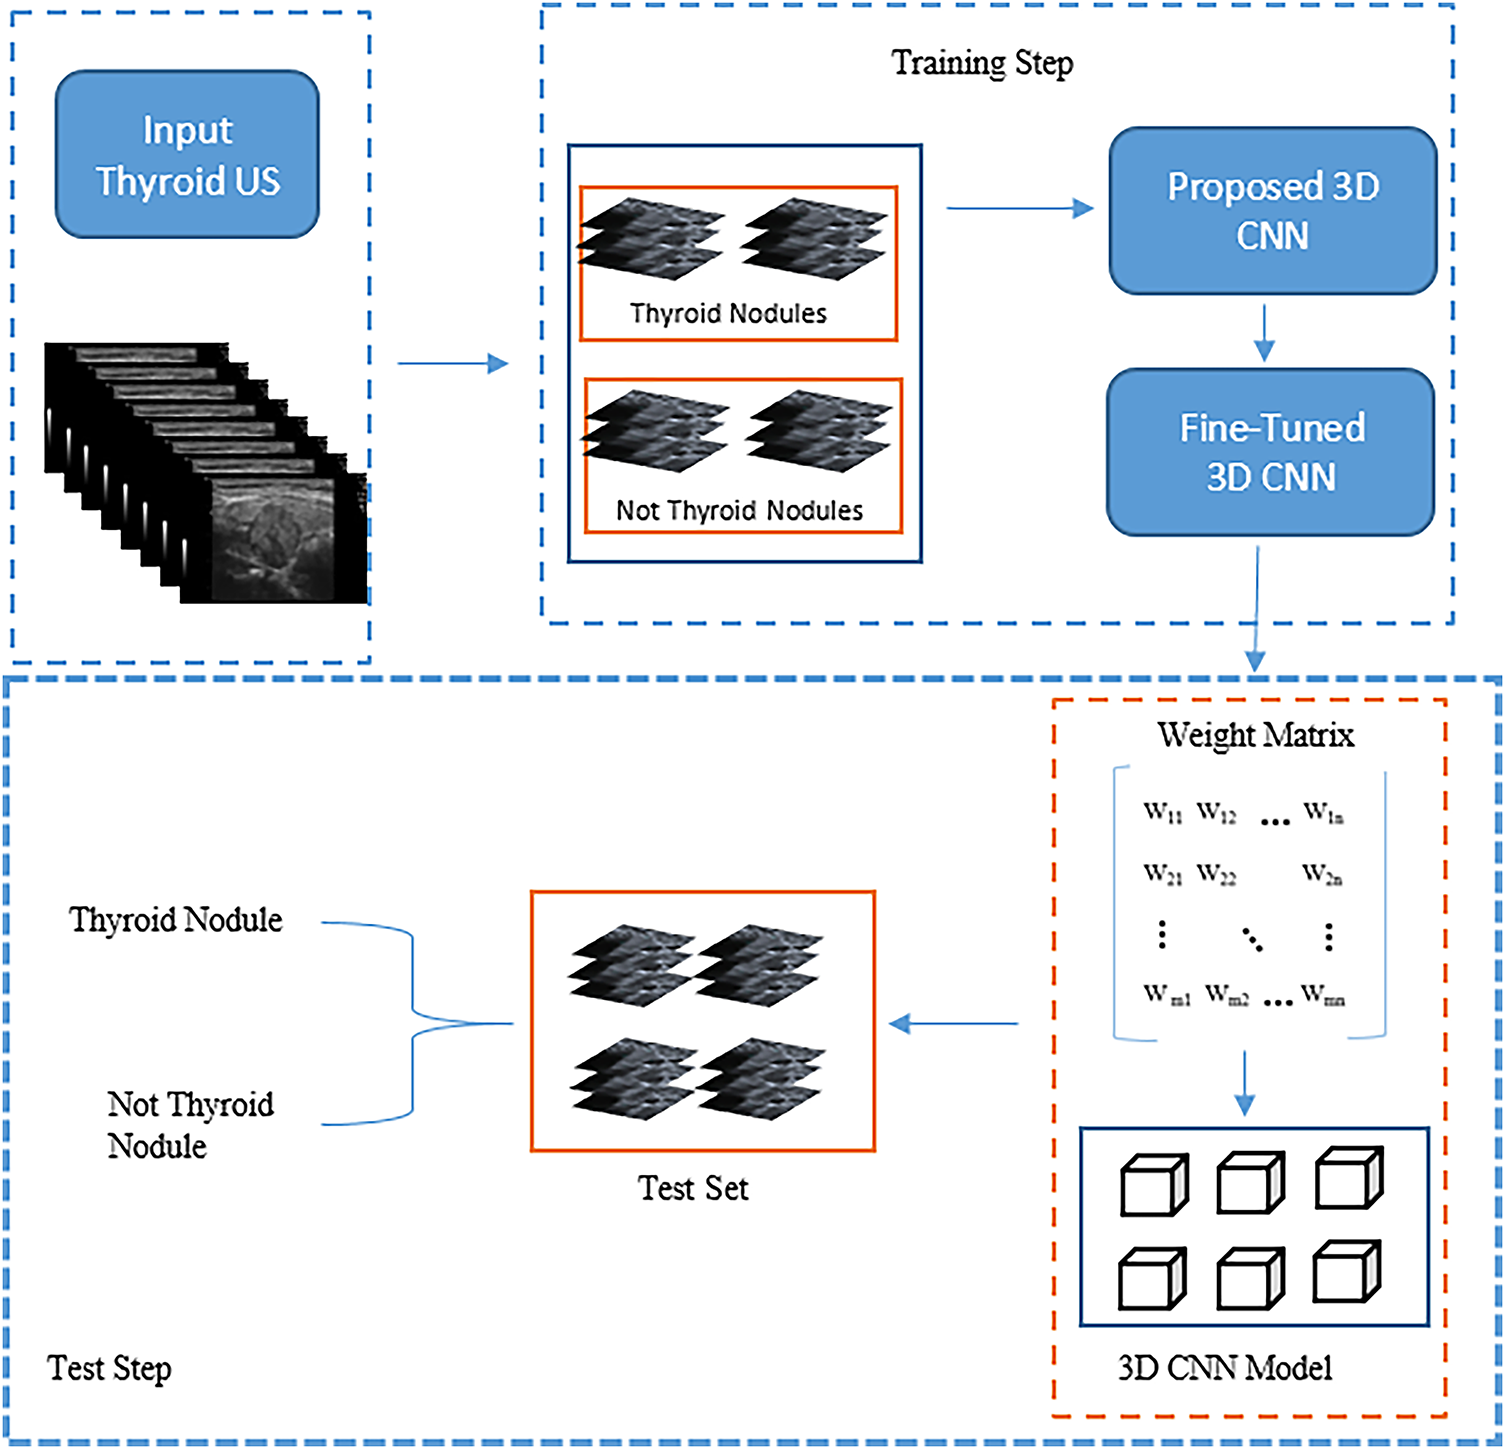
Figure 4: The main structure of the proposed model
Fig. 4 shows that the proposed model’s structure comprises 3D blocks that train on 3D images and save the weights to be used during the testing stage. Based on Fig. 5, the structure comprises 3D convolutional layers with 14 blocks, including seven 3D max-pooling blocks, two batch normalisation layers, and four fully connected (dense) layers.
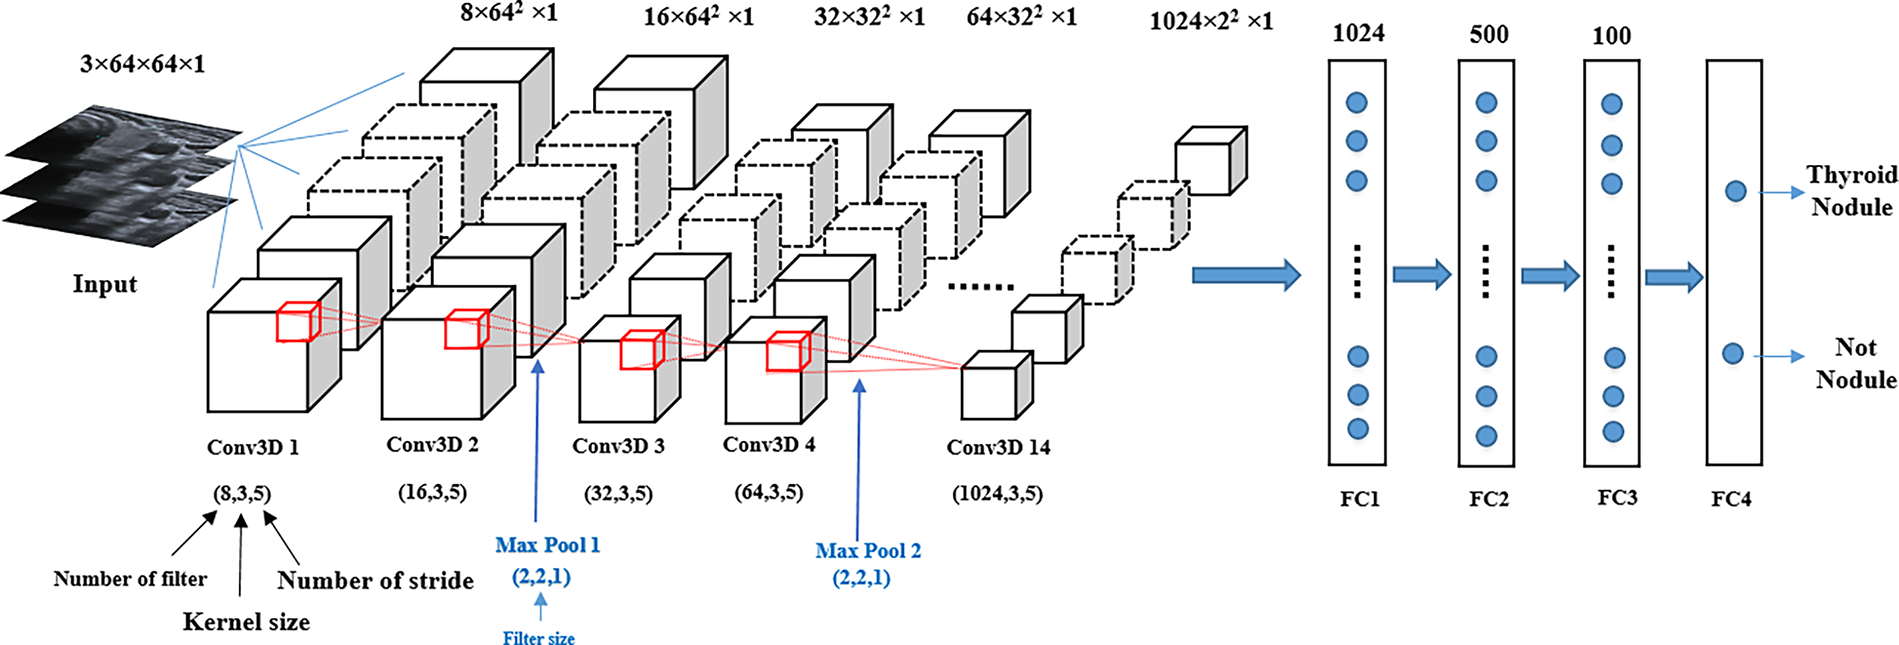
Figure 5: Structure of the proposed 3D CNN model
The image size inserted into the input layer is 3 × 64 × 64 × 1, where the 3D convolutional layers accept four data dimensions (channel, width, height and depth), with the depth referring to the number of input slices. The layers extract features from the input data by multiplying them with an 8-kernel filter of size 3 × 3 × 3, and this process is repeated for the other layers using different filter sizes. Each pair of adjacent 3D convolutional layers is followed by 3D max-pooling layers. These layers are used to reduce the depth dimension of the 3D feature map to extract only the most significant feature value. The parameters that affect the 3D convolutional layers of the model are filter size, kernel size and stride, and the max-pooling parameter is only affected by the filter size. To improve model performance, the dropout 0.2 layer was applied after the 3D max-pooling layers. Additionally, to reduce the gradient vanishing problem of the network that leads to effective back-propagation, the rectified linear unit (ReLu) was used in each convolution layer and the fully connected layers. During the back-propagation process, the Adam optimiser was employed to update the model parameters [28]. Four fully connected layers, starting with 1024 nodes were added to the model structure. In the last layer, the sigmoid function was used for the binary detection of thyroid nodules.
Each model type required suitable hardware and software to be implemented. In this section, we discuss the experimental setup, the evaluation metrics used and the results obtained using the proposed model.
In thyroid nodule detection, the size of the images inserted into the 3D CNN model was 64 × 64 × 3 because of the computer GPU memory limitation. The following two DL packages were used to implement the model: TensorFlow [33] and Keras [34]. In addition, the Adam optimiser function with a learning rate of 0.0001 was used. The proposed model was trained by performing iterations using 150 epochs with a batch size of 16. The learning rate was varied every ten epochs according to Eq. (1). The proposed 3D CNN model was implemented in Python (version 3.10) on a Windows 10 operating system using a hardware system equipped with an NVIDIA GeForce RTX3050 GPU.
The performance of the proposed 3D CNN model was evaluated using four main metrics: accuracy (Acc.), specificity (Spec.), precision (Prec.) and dice coefficient (F1 score). Most of these metrics were calculated using a confusion matrix, which involves four fundamental components [20,35]: the true positive (TP) rate, the true negative (TN) rate, the false positive (FP) rate and the false negative (FN) rate, as described in Eqs. (2)–(5), respectively.
where β = 1.
Fig. 6 shows some of the selected ultrasound images that were classified using the proposed model. All ultrasound images were classified correctly regarding the presence of thyroid nodules in them. Images containing either a lobe or part of the lymph were classified as non-thyroid.
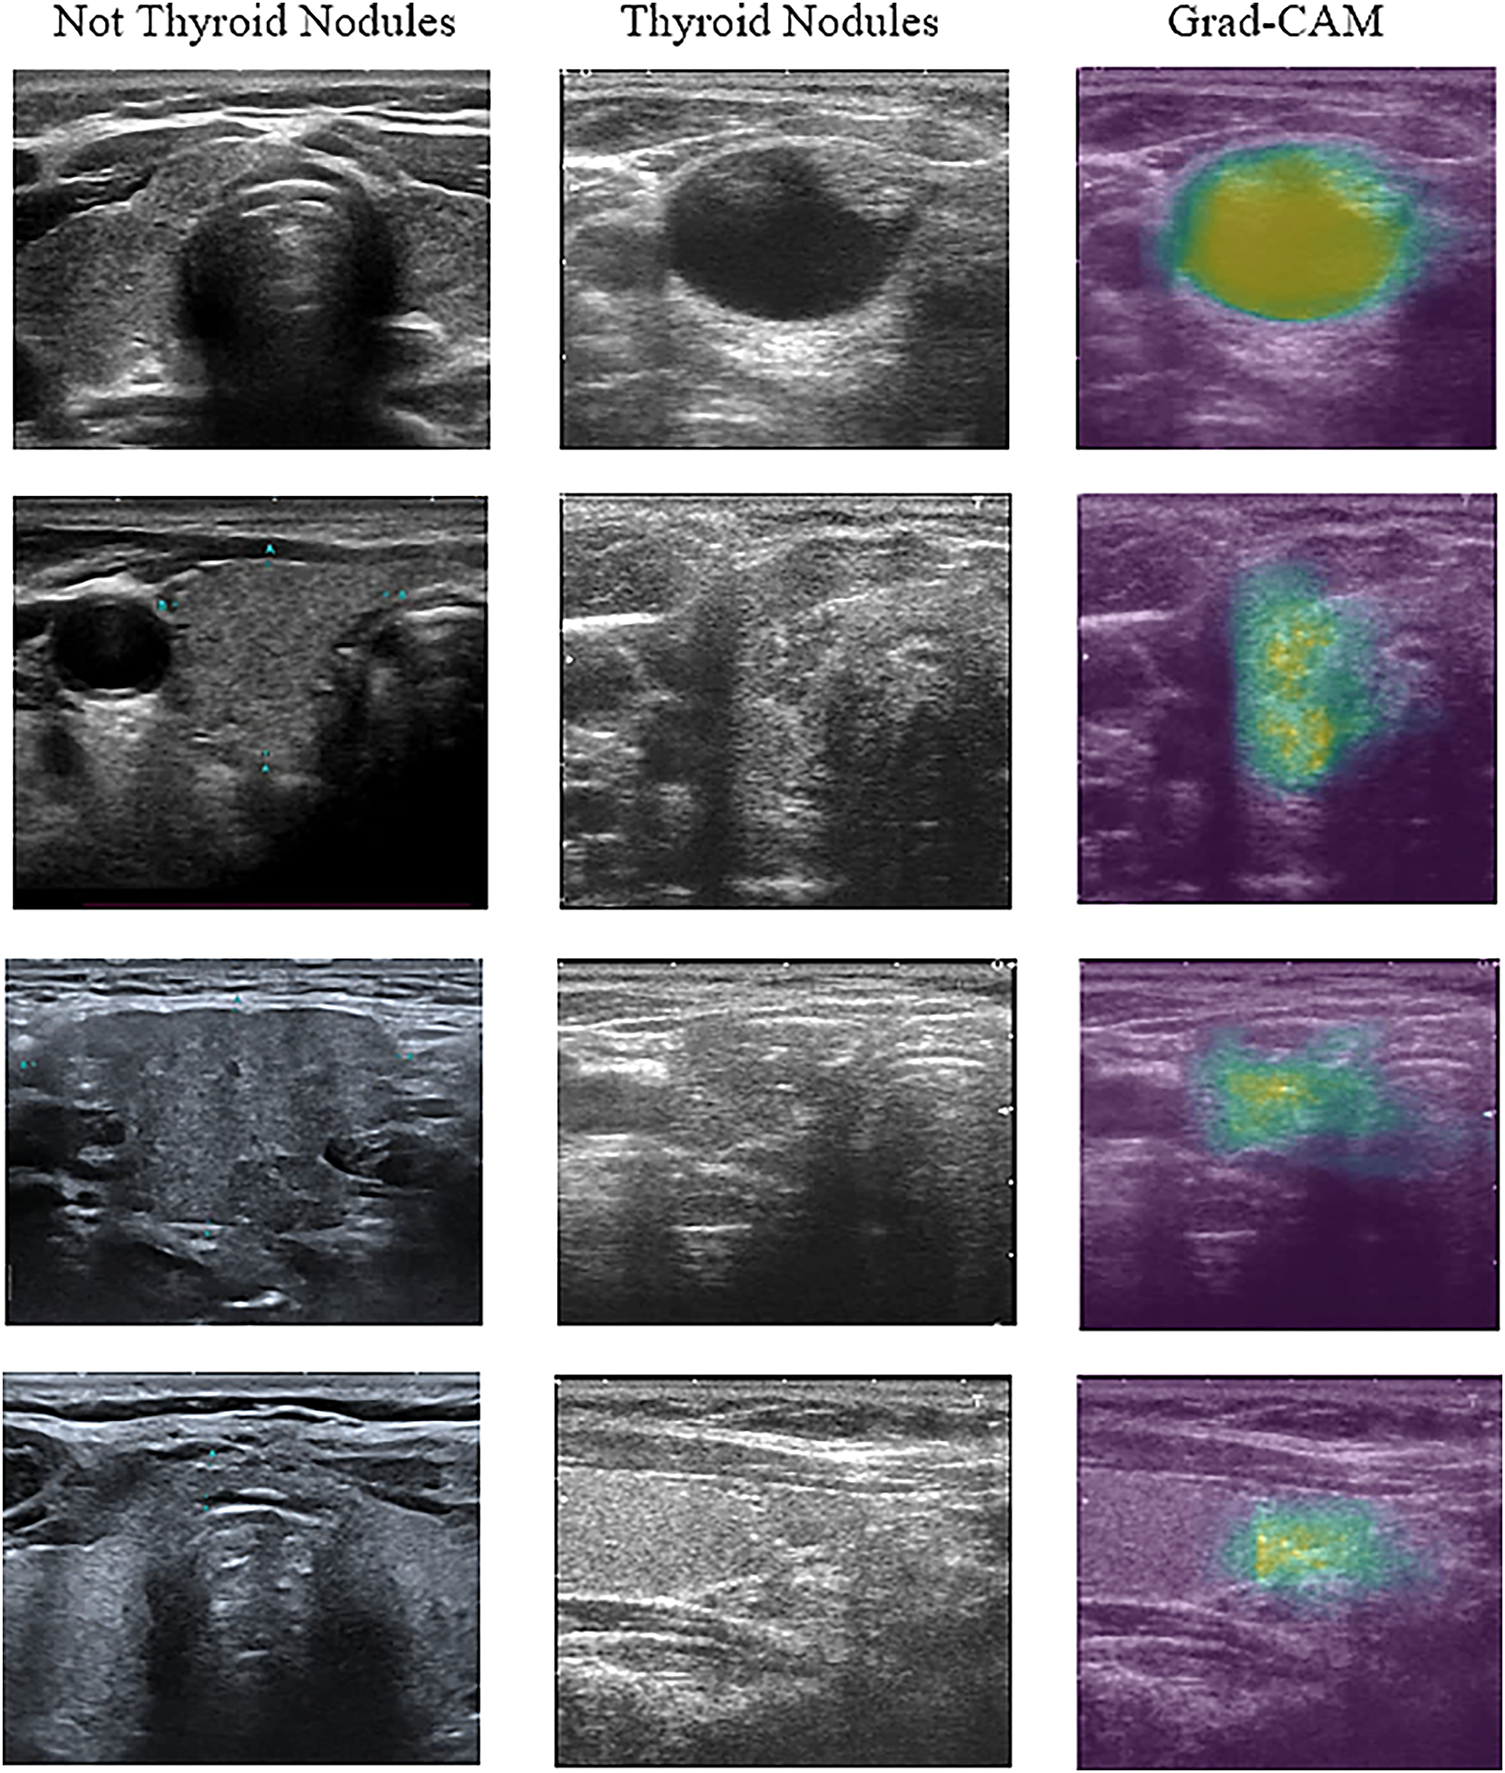
Figure 6: Example of ultrasound image classification result
As shown in Fig. 6, the images were visualised after being processed by the model. The first column in the figure represents the images that the proposed model predicted without thyroid nodules. The second column shows the image with thyroid nodules, and the third column shows the 3D CNN model that localised thyroid nodules and distinguished the nodular regions using the gradient-weighted CAM (Grad-CAM) technique. This technique offers critical interpretability by highlighting the specific anatomical areas that most significantly influenced the detection decision.
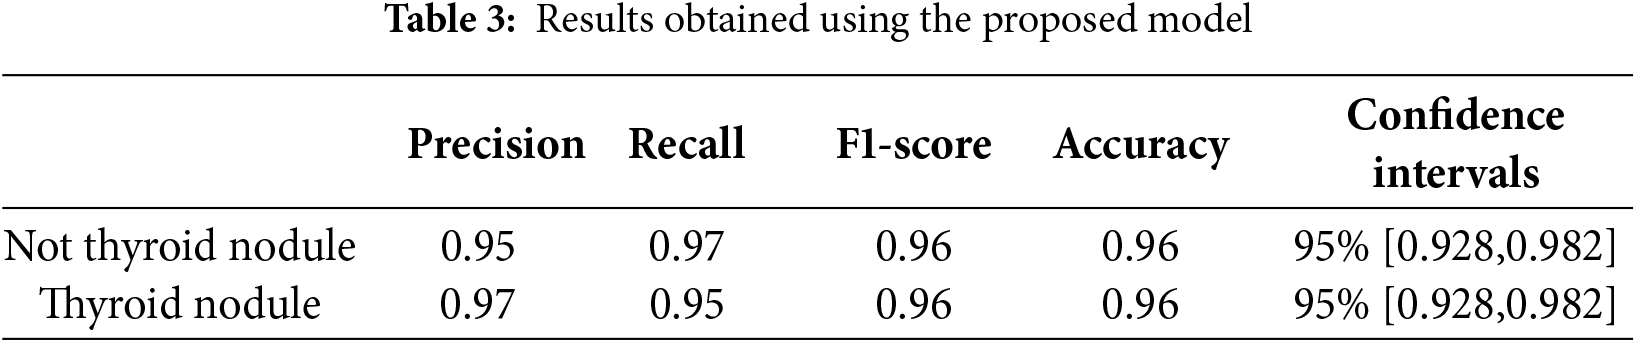
Table 3 shows that the proposed 3D CNN model achieves 97% and 95% precision scores for both classes of images (thyroid and non-thyroid, respectively). These results indicate that the model accurately identifies TP cases. In addition, the calculated values of the recall (proportion of the TP observations to the total actual positive observations) for the non-thyroid and thyroid classes were 97% and 95%, respectively. The F1-score values for the non-thyroid and thyroid classes were 96% and 96%, respectively. The F1-score measures the balance between precision and recall.
These evaluation metrics depend on the four fundamental components TP, TN, FP and FN used in the confusion matrix, as shown in Fig. 7.
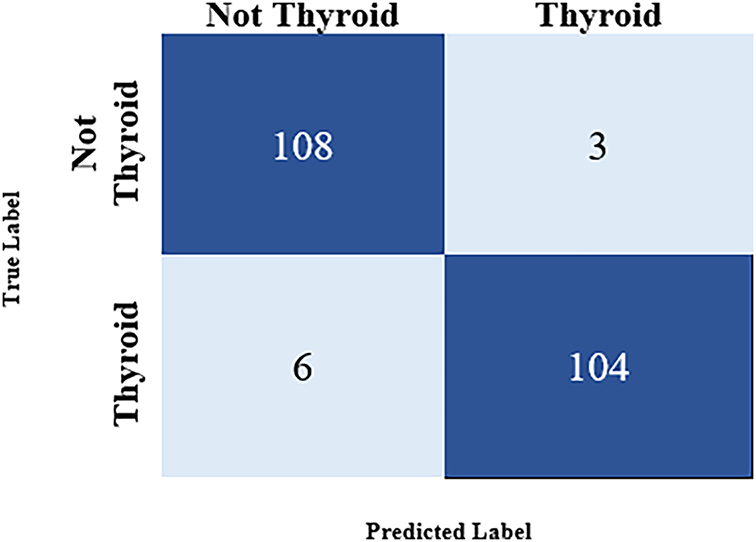
Figure 7: Confusion matrix for the result
A confidence interval measures the uncertainty associated with the model’s performance. A 95% confidence interval implies that the interval calculated from the test data indicates the actual parameter value. The resulting value is the exact value of the estimated accuracy, referred to as the real accuracy (which is between 92% and 98%) [36]. The 95% confidence interval [0.928, 0.982] indicates that if the same experiment were repeated multiple times with different random samples from the population, 95% of the calculated intervals would contain the true accuracy of the model. The evaluation metrics were calculated according to the information contained in the confusion matrix (Fig. 7).
The confusion matrix in Fig. 7 shows that the model was tested using 346 images to predict the images containing a thyroid nodule. A summary is given below:
• TP: 104 (predicted as a thyroid nodule and was correctly identified as a thyroid nodule)
• TN: 108 (predicted as a non-thyroid nodule and was correctly identified as a non-thyroid nodule)
• FP: 3 (predicted as a thyroid nodule but was not identified as a thyroid nodule)
• FN: 6 (predicted as a non-thyroid nodule but was identified as a thyroid nodule)
The result of using AI demonstrated 93% diagnostic accuracy on the test set. Both radiologists showed improved diagnostic performance when utilizing AI assistance. Radiologist 1 has been enhanced from 89% to 93%, as shown in Table 4, while Radiologist 2 has improved from 85% to 93%. Notably, the AI system transformed inter-observer agreement from slight disagreement (κ = −0.10) to perfect consensus (κ = 1.00), effectively eliminating diagnostic variability between readers. The κ symbolizes Cohen’s Kappa statistic, which measures agreement between the two raters.
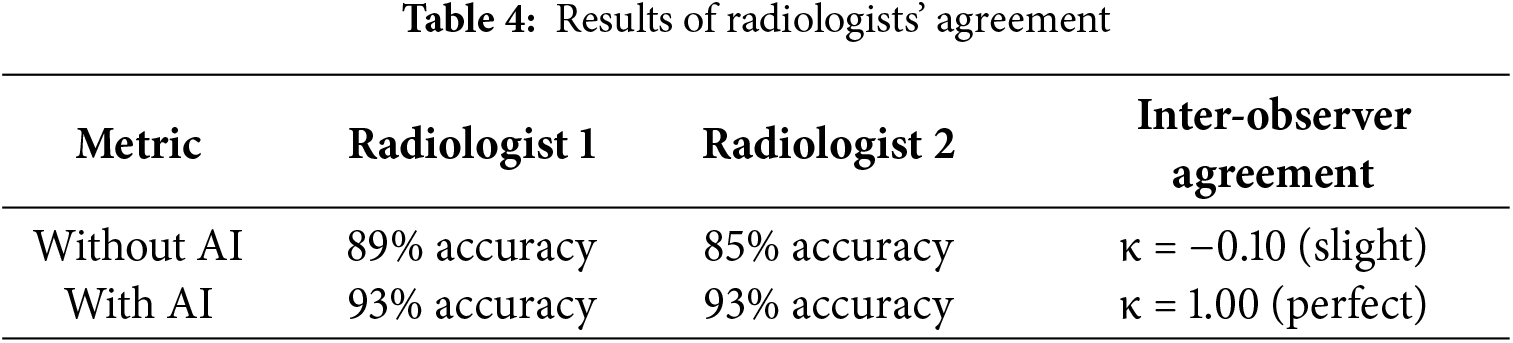
By using the proposed model, the disagreements between radiologists were completely resolved through AI integration. This result not only augments individual diagnostic capabilities but also serves as a powerful standardization tool in clinical practice.
4.3.1 Comparison with State-of-the-Art Methods
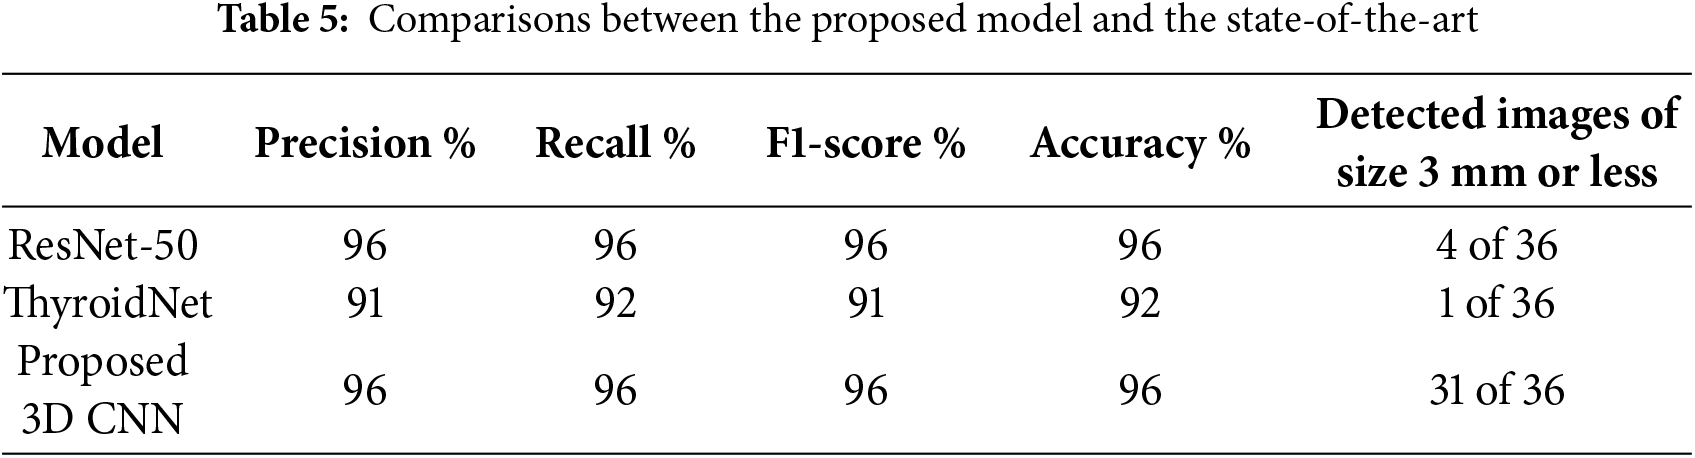
To assess the proposed model, two state-of-the-art models, ResNet-50 [28] and ThyroidNet [31], were used. The two models were re-implemented using the same datasets as those used for the proposed model. The first model was the pre-trained ResNet-50, which had been trained on large datasets and used to predict the results on the test data. The ThyroidNet model was trained on the same training folder images as the other two models, and the test folder was used to predict the nodules. The data in Table 5 shows that while ResNet-50 is effective, achieving an accuracy of 96%, it exhibited poor performance when detecting small nodules. This limitation is attributable to the training was based on ultrasound images with poor contrast between lesions and the background, resulting in weak signals for feature extraction. Similarly, ThyroidNet achieved an accuracy of 92%, but its performance declined when attempting to detect small nodules or dealing with low contrast conditions.
The McNemar’s test was performed to compare the proposed model with the state-of-the-art models. The test revealed a statistically significant difference in classification performance between the 3D CNN and ResNet-50 models (χ2 = 11.25, p = 0.0008). Analysis of 221 test cases demonstrated that the proposed model correctly classified 18 instances that had been misclassified by ResNet-50, as shown in Fig. 8. Additionally, the McNemar’s test comparison of the 3D CNN with the ThyroidNet model showed significant differences between the performances of the models (χ2 = 89.60, p = 0.001). This is strong evidence demonstrating the statistical superiority of the 3D CNN model.
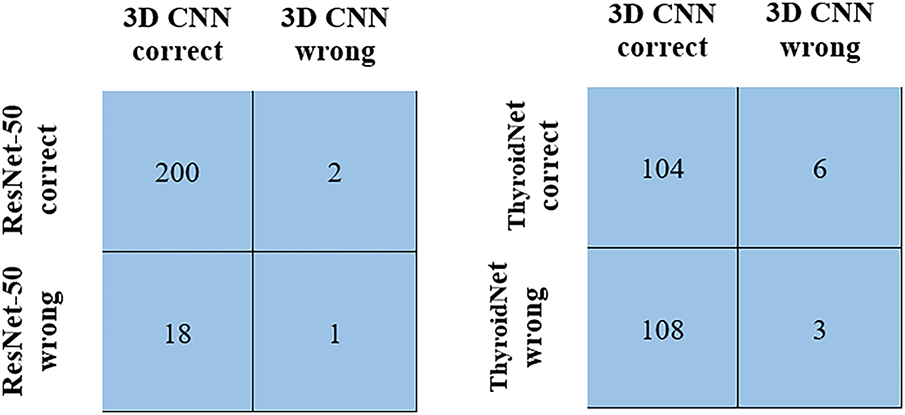
Figure 8: McNemar’s test comparison
The accuracy metric measures the accuracy of the training and validation data. The training data accuracy measures the ability of the model to make predictions based on the training data. An increased accuracy value indicates that the model has learned to extract features from the training samples, and its data classification performance has been improved. Furthermore, the validation data accuracy measures the ability of the model to predict hidden or new samples. An increased accuracy value indicates that the model extracts elementary patterns, which can be effectively applied to other samples without model overfitting. In the proposed 3D CNN model, both accuracy metrics increase simultaneously with epochs, reaching 96%, as shown in Fig. 9. The 10-fold cross-validation method was employed. The process was repeated 10 times to ensure that all data were represented in the training set. Table 6 lists the accuracy obtained in the 10-fold cross-validation.
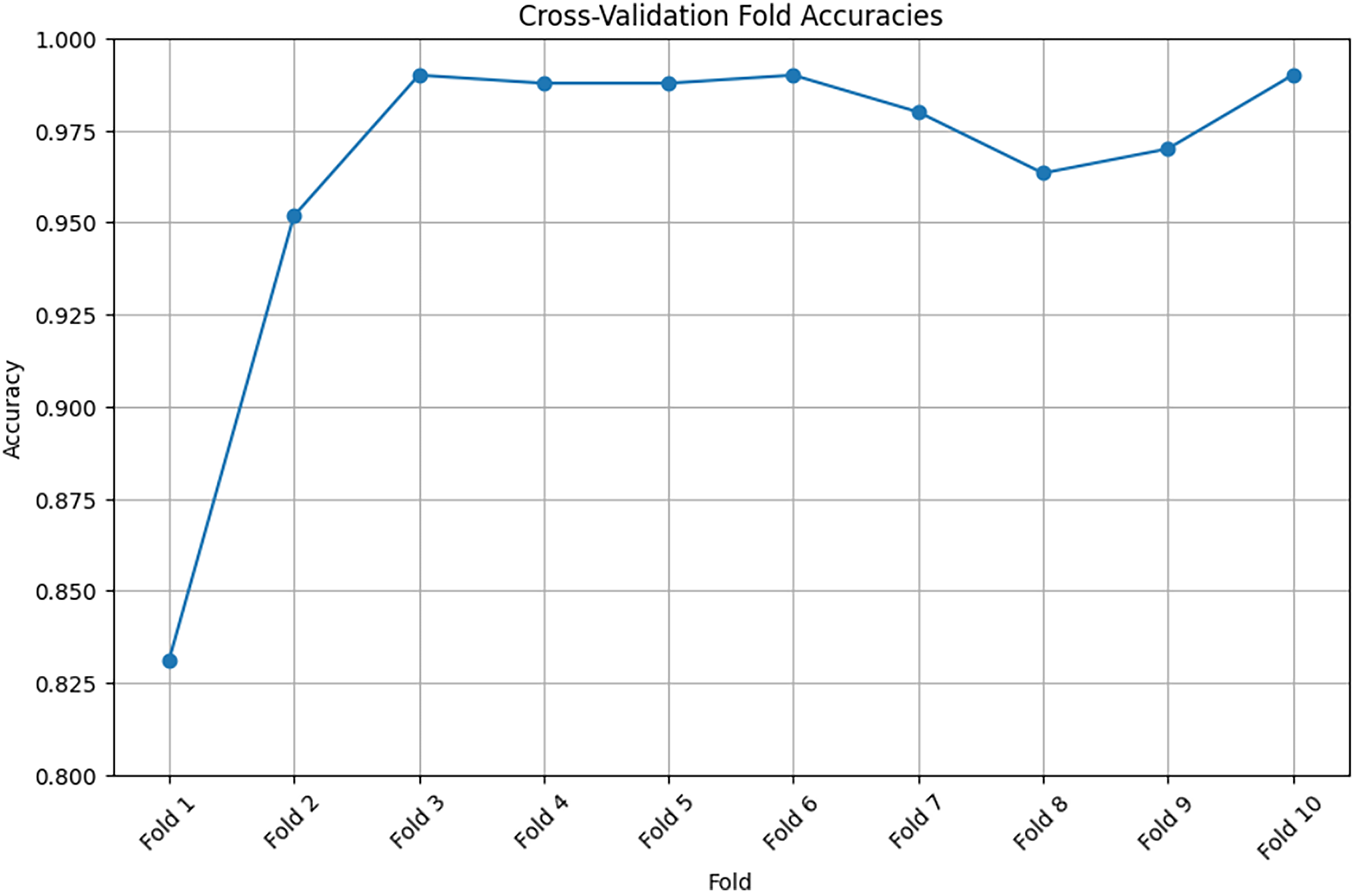
Figure 9: Training accuracy using cross-validation method
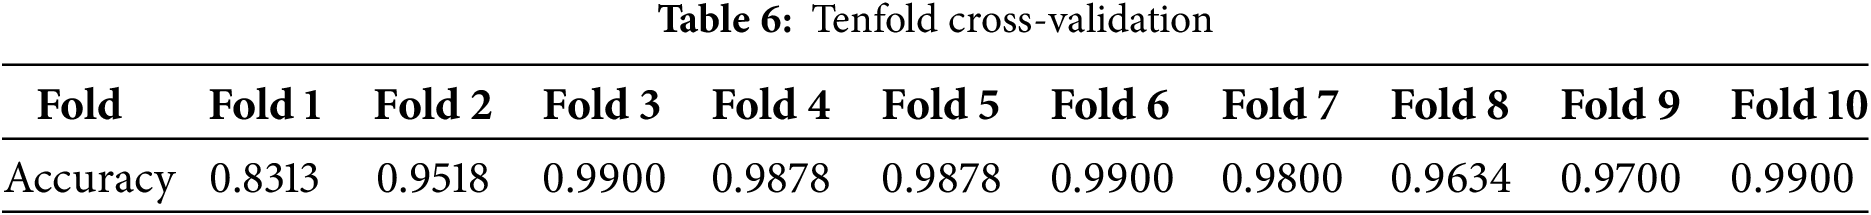
Fig. 9 shows that the curve rises gradually and consistently, indicating the extent of model learning and the ability of the model to extract images from images.
Fig. 10 shows that after applying the receiver operating characteristic (ROC) curves and the area under the ROC curve (AUC) to the 3D CNN model, its performance is improved, and the obtained AUC is 0.95.
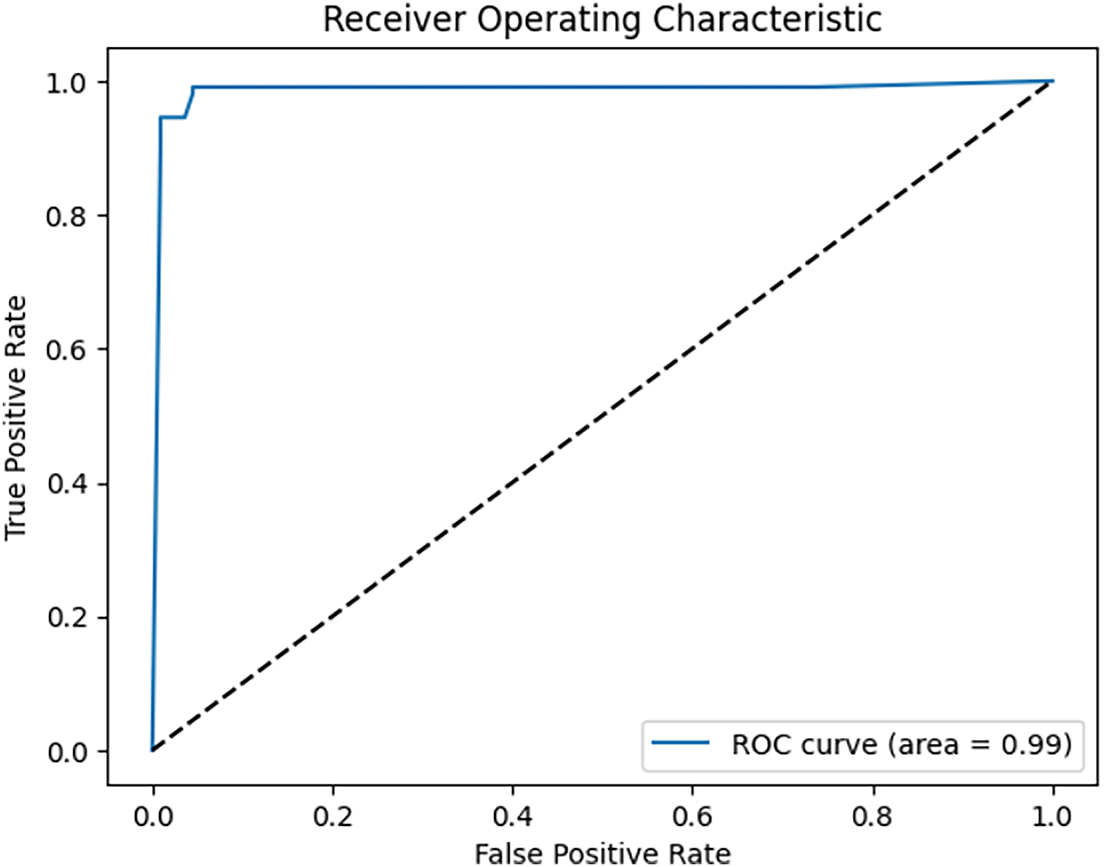
Figure 10: ROC curves of the proposed 3D CNN model
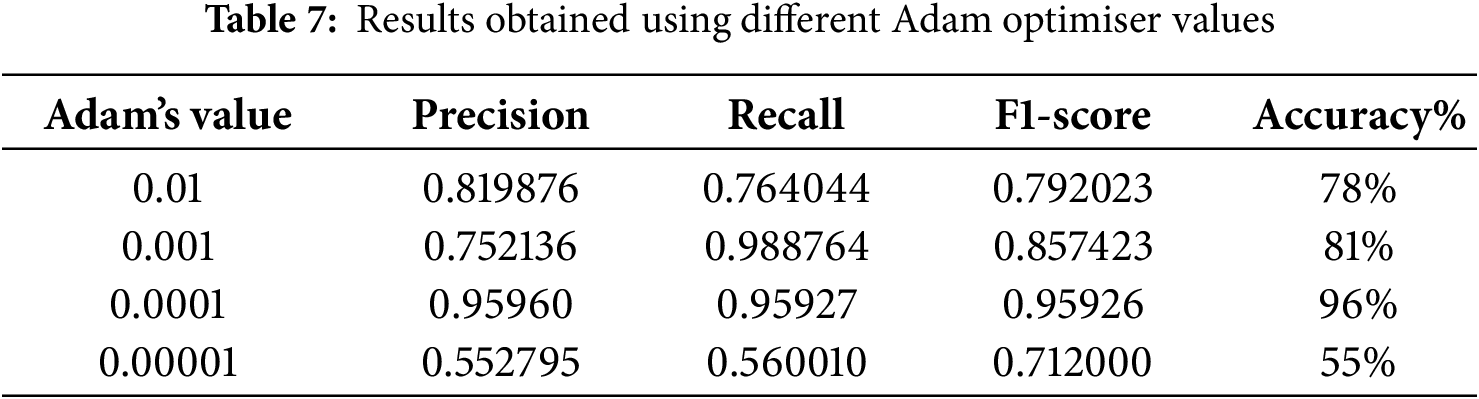
In our study, we tested several Adam optimizer values to obtain the optimal value, as shown in Table 7. The optimal value for achieving 96% accuracy is 0.0001.
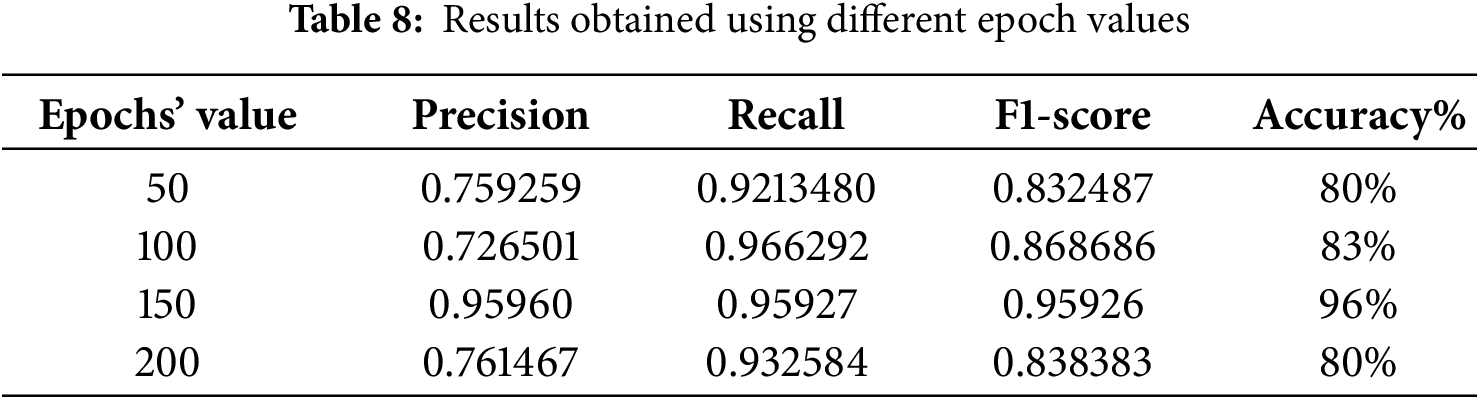
Another factor that affects model performance is epoch (iteration). Table 8 shows the number of epochs in the 50–200 range. Evidently, the best accuracy was obtained when the model was trained using 150 epochs.
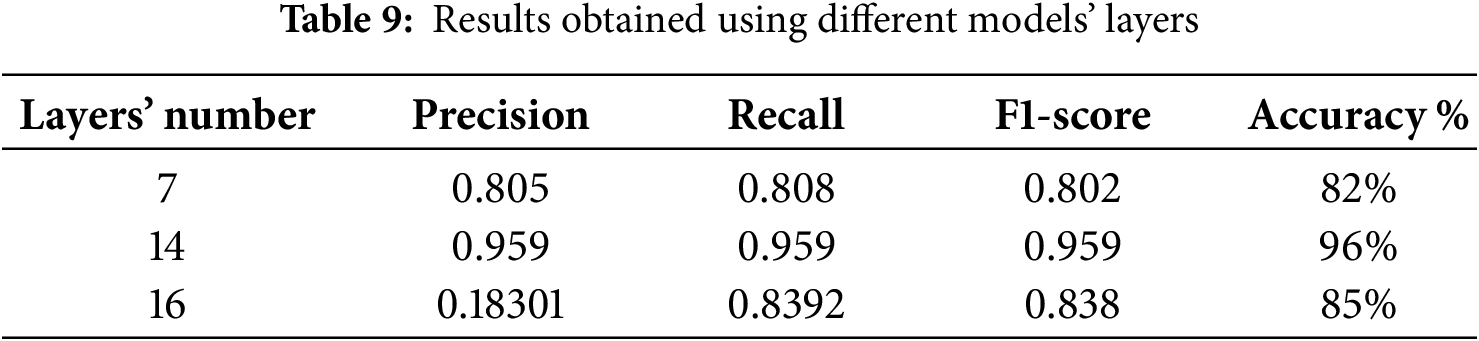
Furthermore, the other model parameters, such as the number of layers, filter size and dropout rate, affected model performance. For example, the accuracy was approximately 82% for seven layers, and it reached 85% when the number of layers increased to 16, as shown in Table 9. The other parameters also affected the performance, and optimal values were chosen during training to achieve a reasonable level of accuracy. The results obtained using the proposed model can be used by doctors to quickly identify thyroid nodules from ultrasound images with a low error rate. This is essential in constructing any type of model for the detection of thyroid cancer because ultrasound images usually contain nodules, normal tissues or lymph nodes. Accordingly, classification is essential to exclude images that do not contain nodules because their presence affects the training results of the model.
5 Comparison between 2D and 3D CNNs
Fig. 11 shows a comparison between the 2D and 3D CNNs used to detect thyroid nodules of different sizes (large and small). As shown in image (a), the 2D CNN model on side (A) detected thyroid nodules with a size of 4 mm from ultrasound images.
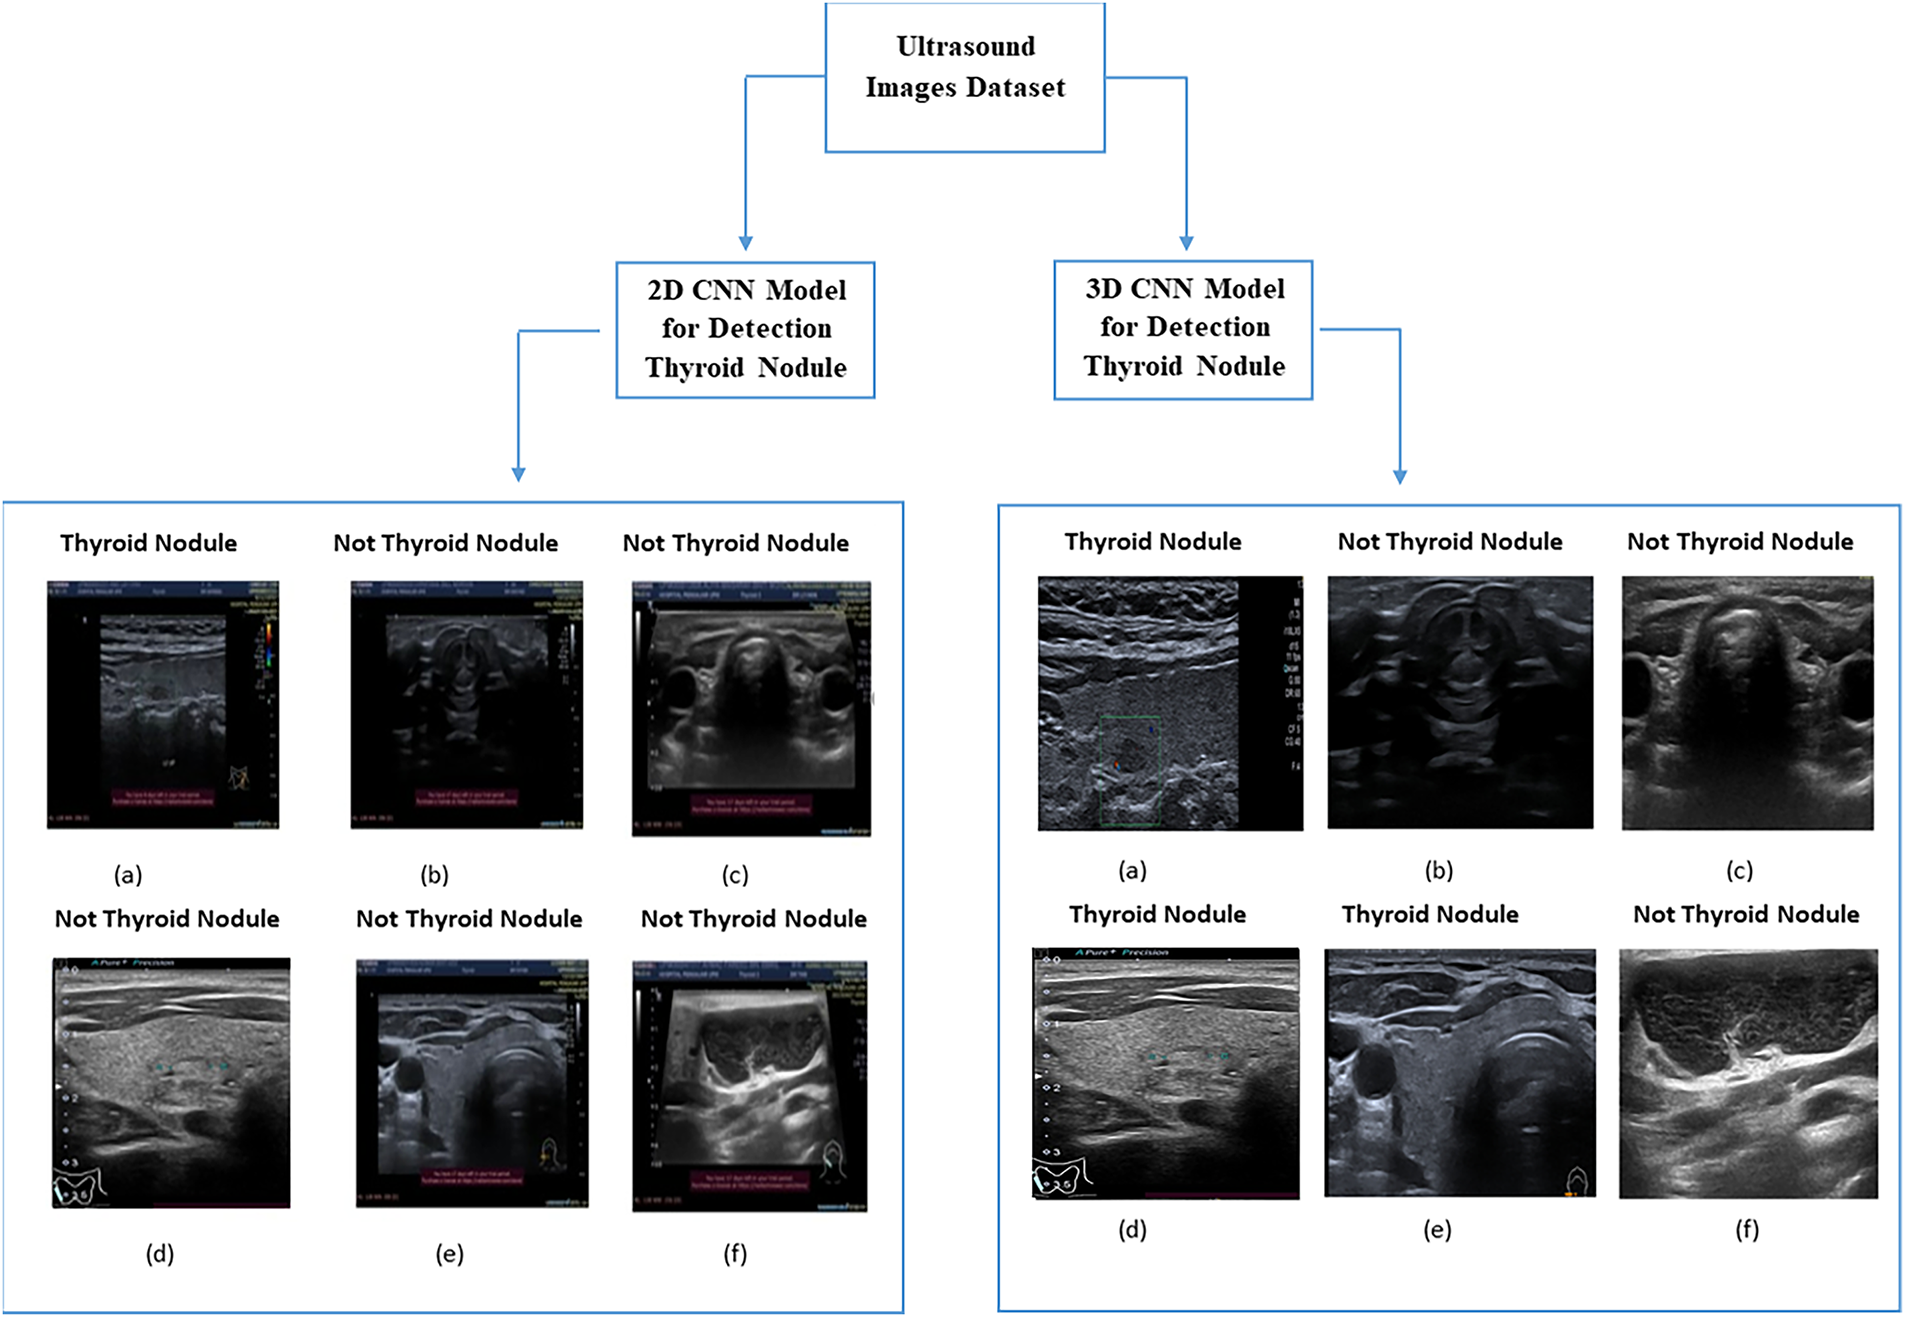
Figure 11: Comparison between 2D CNN and 3D CNN
In contrast, images (d) and (e) show that the 2D CNN model could not accurately detect thyroid nodules with sizes of 1 and 3 mm (images (d) and (e), respectively). However, the 2D CNN model correctly identified images not containing thyroid nodules, reaching an accuracy of 92%. In general, the images detected using the 2D CNN model contained large thyroid nodules. In contrast, the 3D CNN model detected all images containing various sizes of thyroid nodules because of its ability to extract volumetric features and representative features from ultrasound images. Therefore, the 3D CNN model can detect small nodules more accurately than the 2D CNN model. This is consistent with the medical imaging results and the detection accuracy of pathological tissues reported in [37].
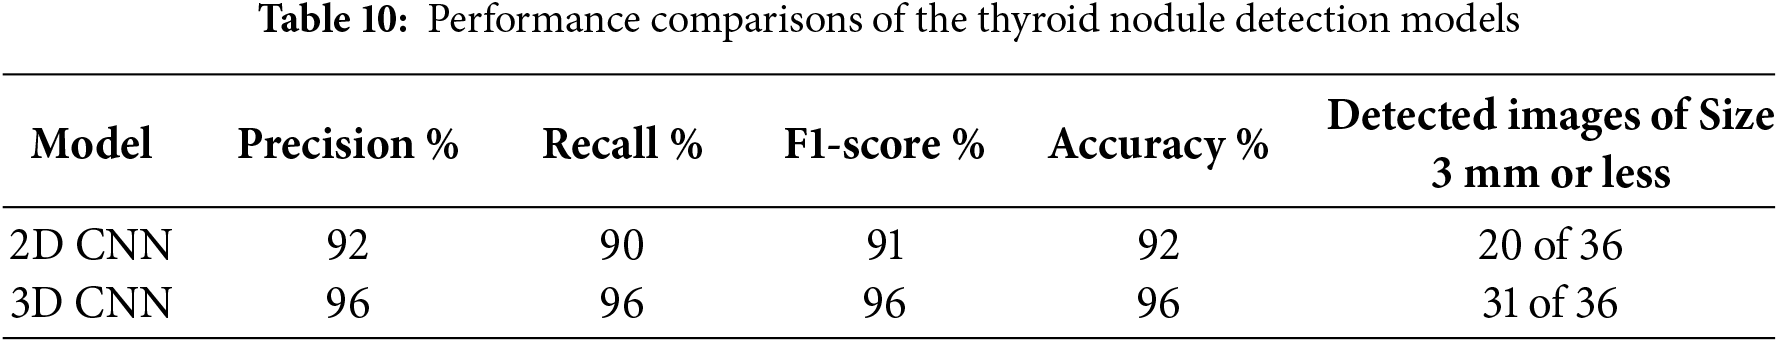
Table 10 shows a comparison between the two models regarding their nodule detection performance. The metrics used in the comparison include precision, recall, F1 score and accuracy. The 2D CNN model achieved remarkable results, particularly in terms of accuracy, but could not detect small nodules [35]. The proposed 3D CNN model detected all nodule sizes because of its ability to extract high-level nodule features [26]. In the dataset used for comparing the two models, 36 images contained thyroid nodules with a size of ≤3 mm. The 2D CNN model successfully detected 20 of these images, where the nodule size was 3 mm; it could not detect nodules with a size of ≤2. In contrast, as shown in Table 10, the 3D CNN successfully detected 31 images containing small nodules, indicating its efficiency in extracting all features. Furthermore, the proposed 3D CNN model was tested using clinical ultrasound images obtained from SAASH in Malaysia by an experienced radiologist with more than 10 years of experience.
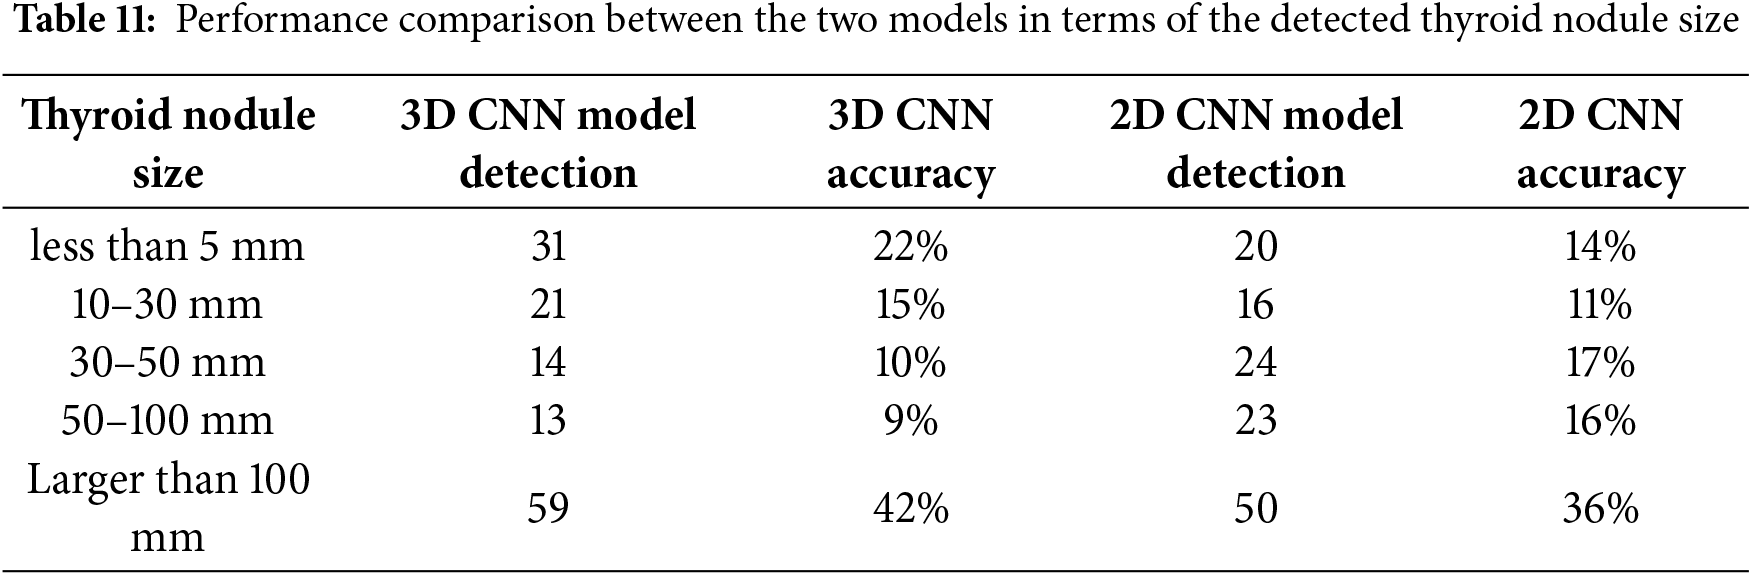
The sizes of the thyroid nodules in the image dataset varied, leading to differences in the detection performance of the two models. Table 11 shows that the 3D CNN model accurately detected small nodules. It accurately identified 31 images containing nodules with a size of <5 mm and 21 images containing nodules of size between 10 and 30 mm out of 138 images. In contrast, the 2D CNN model accurately detected nodules with a size of >30 mm.
The proposed model performed well because it efficiently leveraged a 3D CNN architecture for extracting volumetric features. The training step of the model was efficient because of its high number of layers. In addition, the dataset on which the model was trained comprised images with and without thyroid nodules, enabling the model to recognise the tissue most effectively. In contrast, the other models used a dataset containing only thyroid nodules, leading to bias during training [37].
In this study, we developed a 3D CNN model to detect thyroid nodules from ultrasound images. The model successfully detected the nodules and classified the ultrasound images into two classes: images containing thyroid nodules and images containing normal tissues. As medical data accumulate, 3D CNNs are emerging as a promising approach for various types of medical detections because they effectively represent complex features and extract detailed spatial information of targets by employing a data-driven methodology. Inputting multiple images as one image considerably facilitates the extraction of image volumetric features in addition to spatial features, thus improving the ability of the model to learn and detect nodules, including small volumes, compared with regular models. The proposed model has some limitations.
One of the limitations in this study is that the images that were used for training the model were taken from one hospital and from one device, which may bias the results. In the future, we will try to collect data from other hospitals to compare the robustness of the proposed method. Even the 3D CNN gave better results to detect small-sized nodules, but the 3D CNN has a drawback, as it requires higher computational resources, such as memory and storage capacity. Nevertheless, the proposed model achieves good performance in terms of accuracy (96%), recall (0.96%), precision (0.96%) and F1 score (0.96%).
In conclusion, the 3D CNN had achieved better performance compared to 2D CNN. Based on the discussion with the radiologist in HSAAS, the approach can help the hospital demonstrate its potential as a powerful clinical tool for detecting nodules and determining their malignant potential.
Acknowledgement: We are thankful to the Ministry of Higher Education, Malaysia, for supporting this work. We would also like to thank the radiologist Dr Fuaza Izzati Bosro from HSAAS for validating the images.
Funding Statement: This work was supported by the Ministry of Higher Education under the Fundamentals Research Grant Scheme (FRGS/1/2024/ICT02/UPM/02/5).
Author Contributions: Huda F. AL-Shahad: data collection, methodology and drafted the article; Razali Yaakob, Nurfadhlina Mohd Sharef and Hazlina Hamdan: supervising and draft checking; Hasyma Abu Hassan: supervising and validation; Xiaoyi Jiang: writing—review and editing. All authors reviewed the results and approved the final version of the manuscript.
Availability of Data and Materials: The ultrasound images obtained from Sultan Abdul Aziz Shah Hospital, Malaysia, are not publicly available due to ethical and privacy restrictions. In addition, this study also used a publicly available open dataset, the Digital Database Thyroid Image (DDTI), which can be accessed at: https://www.kaggle.com/datasets/dasmehdixtr/ddti-thyroid-ultrasound-images.
Ethics Approval: The collection of thyroid cancer patient ultrasound images was approved by the Ethical Committee of the Hospital Sultan Abdul Aziz Shah and the Ethics Committee for Research Involving Human Subjects in Universiti Putra Malaysia (UPM.TNCPI.800-2/1/7).
Conflicts of Interest: The authors declare no conflicts of interest to report regarding the present study.
1(2025) https://www.kaggle.com/datasets/dasmehdixtr/ddti-thyroid-ultrasound-images.
References
1. Mohan E, Saravanan P, Natarajan B, Kumer SVA, Sambasivam G, Kanna GP, et al. Thyroid detection and classification using DNN based on hybrid meta-heuristic and LSTM technique. IEEE Access. 2023;11:68127–38. doi:10.1109/ACCESS.2023.3289511. [Google Scholar] [CrossRef]
2. Ud Din I, Almogren A, Guizani M, Zuair M. A Decade of internet of things: analysis in the light of healthcare applications. IEEE Access. 2019;7:89967–79. doi:10.1109/ACCESS.2019.2927082. [Google Scholar] [CrossRef]
3. Seyhan AA, Carini C. Are innovation and new technologies in precision medicine paving a new era in patients centric care? J Transl Med. 2019;17(1):114. doi:10.1186/s12967-019-1864-9. [Google Scholar] [PubMed] [CrossRef]
4. Sung H, Ferlay J, Siegel RL, Laversanne M, Soerjomataram I, Jemal A, et al. Global cancer statistics 2020: GLOBOCAN estimates of incidence and mortality worldwide for 36 cancers in 185 countries. CA Cancer J Clin. 2021;71(3):209–49. Available from: https://acsjournals.onlinelibrary.wiley.com/doi/10.3322/caac.21660. [Google Scholar] [PubMed]
5. Yao J, Wang Y, Lei Z, Wang K, Feng N, Dong F, et al. Multimodal GPT model for assisting thyroid nodule diagnosis and management. npj Digit Med. 2025;8(1):245. doi:10.1038/s41746-025-01652-9. [Google Scholar] [PubMed] [CrossRef]
6. Grani G, Sponziello M, Filetti S, Durante C. Thyroid nodules: diagnosis and management. Nat Rev Endocrinol. 2024;20(12):715–28. doi:10.1038/s41574-024-01025-4. [Google Scholar] [PubMed] [CrossRef]
7. Kaviani S, Han KJ, Sohn I. Adversarial attacks and defenses on AI in medical imaging informatics: a survey. Expert Syst Appl. 2022;198(1):116815. doi:10.1016/j.eswa.2022.116815. [Google Scholar] [CrossRef]
8. Zhang J, Xie Y, Wu Q, Xia Y. Medical image classification using synergic deep learning. Med Image Anal. 2019;54:10–9. doi:10.1016/j.media.2019.02.010. [Google Scholar] [PubMed] [CrossRef]
9. Peng S, Liu Y, Lv W, Liu L, Zhou Q, Yang H, et al. Deep learning-based artificial intelligence model to assist thyroid nodule diagnosis and management: a multicentre diagnostic study. Lancet Digit Health. 2021;3(4):e250–9. doi:10.1016/S2589-7500(21)00041-8. [Google Scholar] [PubMed] [CrossRef]
10. Liu R, Zhou S, Guo Y, Wang Y, Chang C. Nodule localization in thyroid ultrasound images with a joint-training convolutional neural network. J Digit Imaging. 2020;33(5):1266–79. doi:10.1007/s10278-020-00366-6. [Google Scholar] [PubMed] [CrossRef]
11. Luo X, Li Z, Xu C, Zhang B, Zhang L, Zhu J, et al. Semi-supervised thyroid nodule detection in ultrasound videos. IEEE Trans Med Imaging. 2024;43(5):1792–803. doi:10.1109/TMI.2023.3348949. [Google Scholar] [PubMed] [CrossRef]
12. Lee G, Fujita H. Deep learning in medical image analysis. Vol. 1213. Cham, Switzerland: Springer International Publishing; 2020. 181 p. [Google Scholar]
13. Umirzakova S, Shakhnoza M, Sevara M, Whangbo TK. Deep learning for multiple sclerosis lesion classification and stratification using MRI. Comput Biol Med. 2025;192(2):110078. doi:10.1016/j.compbiomed.2025.110078. [Google Scholar] [PubMed] [CrossRef]
14. Nugroho HA, Zulfanahri, Frannita EL, Ardiyanto I, Choridah L. Computer aided diagnosis for thyroid cancer system based on internal and external characteristics. J King Saud Univ Comput Inf Sci. 2021;33(3):329–39. doi:10.1016/j.jksuci.2019.01.007. [Google Scholar] [CrossRef]
15. Cihan M, Ceylan M, Soylu H, Konak M. Fast evaluation of unhealthy and healthy neonates using hyperspectral features on 700-850 nm wavelengths, ROI extraction, and 3D-CNN. IRBM. 2022;43(5):362–71. doi:10.1016/j.irbm.2021.06.009. [Google Scholar] [CrossRef]
16. Hai J, Qiao K, Chen J, Liang N, Zhang L, Yan B. Multi-view features integrated 2D\\3D Net for glomerulopathy histologic types classification using ultrasound images. Comput Methods Programs Biomed. 2021;212(3):106439. doi:10.1016/j.cmpb.2021.106439. [Google Scholar] [PubMed] [CrossRef]
17. Song W, Li S, Liu J, Qin H, Zhang B, Zhang S, et al. Multitask cascade convolution neural networks for automatic thyroid nodule detection and recognition. IEEE J Biomed Heal Inform. 2019;23(3):1215–24. [Google Scholar] [PubMed]
18. Ko SY, Lee JH, Yoon JH, Na H, Hong E, Han K, et al. Deep convolutional neural network for the diagnosis of thyroid nodules on ultrasound. Head Neck. 2019;41(4):885–91. [Google Scholar] [PubMed]
19. Inan NG, Kocadağlı O, Yıldırım D, Meşe İ, Kovan Ö. Multi-class classification of thyroid nodules from automatic segmented ultrasound images: hybrid ResNet based UNet convolutional neural network approach. Comput Methods Programs Biomed. 2024;243:107921. doi:10.1016/j.cmpb.2023.107921. [Google Scholar] [PubMed] [CrossRef]
20. Zhang L, Zhuang Y, Hua Z, Han L, Li C, Chen K, et al. Automated location of thyroid nodules in ultrasound images with improved YOLOV3 network. J Xray Sci Technol. 2021;29(1):75–90. doi:10.3233/XST-200775. [Google Scholar] [PubMed] [CrossRef]
21. Lu J, Ouyang X, Shen X, Liu T, Cui Z, Wang Q, et al. GAN-guided deformable attention network for identifying thyroid nodules in ultrasound images. IEEE J Biomed Heal Inform. 2022;26(4):1582–90. doi:10.1109/JBHI.2022.3153559. [Google Scholar] [PubMed] [CrossRef]
22. Alghanimi GB, Aljobouri HK, Al-shimmari KA. CNN and ResNet50 model design for improved ultrasound thyroid nodules detection. In: Proceedings of the 2024 ASU International Conference in Emerging Technologies for Sustainability and Intelligent Systems (ICETSIS); 2024 Jan 28–29; Manama, Bahrain. p. 1000–4. doi:10.1109/icetsis61505.2024.10459588. [Google Scholar] [CrossRef]
23. Gowda S, Thrishul D, Sheth VB, Vishwas R, Gargi N, Hemavathi P. Thyroid nodule detection and classification using deep learning. In: Proceedings of the 2023 International Conference on Computational Intelligence for Information, Security and Communication Applications (CIISCA); 2023 Jun 22–23; Bengaluru, India. p. 200–5. doi:10.1109/ciisca59740.2023.00047. [Google Scholar] [CrossRef]
24. Wei X, Gao M, Yu R, Liu Z, Gu Q, Liu X, et al. Ensemble deep learning model for multicenter classification of thyroid nodules on ultrasound images. Med Sci Monit. 2020;26:e926096. doi:10.12659/MSM.926096. [Google Scholar] [PubMed] [CrossRef]
25. Feng N, Zhao S, Wang K, Chen P, Wang Y, Gao Y, et al. Deep learning model for diagnosis of thyroid nodules with size less than 1 cm: a multicenter, retrospective study. Eur J Radiol Open. 2024;13(10387):100609. doi:10.1016/j.ejro.2024.100609. [Google Scholar] [PubMed] [CrossRef]
26. Lu H, Wang H, Zhang Q, Yoon SW, Won D. A 3D convolutional neural network for volumetric image semantic segmentation. Procedia Manuf. 2019;39:422–8. doi:10.1016/j.promfg.2020.01.386. [Google Scholar] [CrossRef]
27. Jnawali K, Chinni B, Dogra V, Sinha S, Rao N. Deep 3D convolutional neural network for automatic cancer tissue detection using multispectral photoacoustic imaging. In: Ruiter NV, Byram BC, editors. Medical imaging 2019: ultrasonic imaging and tomography. Washington, DC, USA: SPIE; 2019. 51 p. [Google Scholar]
28. Huang J, Chen T, Jiang W, Zhang H, Wang R. Thyroid nodule classification in ultrasound videos by combining 3D CNN and video transformer. In: Proceedings of the 2023 IEEE International Conference on Systems, Man, and Cybernetics (SMC); 2023 Oct 01–04; Honolulu, Oahu, HI, USA. p. 5273–8. [Google Scholar]
29. Zhang H, Liu Q, Han X, Niu L, Sun W. TN5000: an ultrasound image dataset for thyroid nodule detection and classification. Sci Data. 2025;12(1):1437. doi:10.1038/s41597-025-05757-4. [Google Scholar] [PubMed] [CrossRef]
30. Hirzi NM, Ma’sum MA, Pratama M, Jatmiko W. Large-scale 3D point cloud semantic segmentation with 3D U-Net ASPP sparse CNN. In: Proceedings of the 2022 7th International Workshop on Big Data and Information Security (IWBIS); 2022 Oct 1–3; Depok, Indonesia. p. 59–64. doi:10.1109/iwbis56557.2022.9924988. [Google Scholar] [CrossRef]
31. Chen L, Chen H, Pan Z, Xu S, Lai G, Chen S, et al. ThyroidNet: a deep learning network for localization and classification of thyroid nodules. Comput Model Eng Sci. 2023;139(1):361–82. doi:10.32604/cmes.2023.031229. [Google Scholar] [PubMed] [CrossRef]
32. Abdullah D, Fajriana F, Maryana M, Rosnita L, Utama Siahaan AP, Rahim R, et al. Application of interpolation image by using bi-cubic algorithm. J Phys Conf Ser. 2018;1114:012066. doi:10.1088/1742-6596/1114/1/012066. [Google Scholar] [CrossRef]
33. Abadi M, Barham P, Chen J, Chen Z, Davis A, Dean J, et al. TensorFlow: a system for large-scale machine learning. In: Proceedings of the 12th USENIX Symposium on Operating Systems Design and Implementation; 2016 Nov 2–4; Savannah, GA, USA. p. 265–83. [Google Scholar]
34. Astrophysics Source Code Library. Keras: The Python Deep Learning library—NASA/ADS [Internet]. [cited 2025 Dec 1]. Available from: https://ui.adsabs.harvard.edu/abs/2018ascl.soft06022C/abstract. [Google Scholar]
35. Gong L, Jiang S, Yang Z, Zhang G, Wang L. Automated pulmonary nodule detection in CT images using 3D deep squeeze-and-excitation networks. Int J Comput Assist Radiol Surg. 2019;14(11):1969–79. doi:10.1007/s11548-019-01979-1. [Google Scholar] [PubMed] [CrossRef]
36. Ben Arie A, Gorfine M. Confidence intervals and simultaneous confidence bands based on deep learning. arXiv:2406.14009. 2024. [Google Scholar]
37. Tiwari S, Jain G, Shetty DK, Sudhi M, Balakrishnan JM, Bhatta SR. A comprehensive review on the application of 3D convolutional neural networks in medical imaging. Eng Proc. 2023;59(1):3. doi:10.3390/engproc2023059003. [Google Scholar] [CrossRef]
Cite This Article
 Copyright © 2026 The Author(s). Published by Tech Science Press.
This work is licensed under a Creative Commons Attribution 4.0 International License , which permits unrestricted use, distribution, and reproduction in any medium, provided the original work is properly cited.
 Downloads
 Citation Tools