
 Submit a Paper
 Propose a Special lssue
 Open Access
ARTICLE

Multi-Leakage Detection Using Graph Attention Networks and Restoration Prioritization in Water Distribution Systems
Department of Civil and Infrastructure Engineering, Gyeongsang National University, Jinju, Republic of Korea
* Corresponding Author: Young Hwan Choi. Email:
(This article belongs to the Special Issue: Explainable AI, Digital Twin, and Hybrid Deep Learning Approaches for Urban–Regional Hydrology, Water Quality, and Risk Modeling under Uncertainty)
Computer Modeling in Engineering & Sciences 2026, 146(3), 28 https://doi.org/10.32604/cmes.2026.077480
Received 10 December 2025; Accepted 13 February 2026; Issue published 30 March 2026
 View Full Text
 Download PDF
Abstract
Leakage events occurring at multiple locations simultaneously generate overlapping and topology-dependent pressure signatures, making reliable detection and subsequent restoration planning a persistent challenge in water distribution systems (WDSs). While recent data-driven techniques have improved the ability to identify anomalous hydraulic behavior, most approaches remain limited to the detection stage and offer little guidance on how utilities should prioritize repairs once multiple failures are identified. To bridge this gap, this study proposes an integrated framework that links topology-aware leakage detection with quantitative restoration prioritization. First, a multi-task learning framework based on Graph Attention Networks (GAT) is employed to jointly detect both the location and magnitude of multiple leakages by explicitly incorporating hydraulic responses and network topology into the learning process. The model’s detection robustness is evaluated across networks with contrasting looped, branched, and hybrid topologies to examine how structural characteristics influence detection accuracy under multi-event conditions. Second, the study develops a restoration-planning module that constructs a two-objective decision space combining restoration cost and segment vulnerability, where the latter accounts for disruption potential arising from hydraulic importance and local service connectivity. Non-dominated sorting is used to derive Pareto-optimal restoration sequences, enabling explicit quantification of the trade-offs between operational cost and service disruption. This provides decision-makers with a ranked set of restoration orders that reflect both hydraulic impact and functional risk, rather than relying on heuristics or cost-only criteria. Notably, the proposed framework separates offline training from online inference, requiring only a single forward pass for real-time decision-making without the need for iterative hydraulic simulations. Results demonstrate that topology strongly governs both detection performance and the structure of optimal repair sequences, underscoring the importance of integrating network-aware learning with multi-criteria restoration evaluation.Keywords
In modern society, water distribution systems (WDSs) are crucial for reliable water supplies. Their performance and reliability directly affect local communities and daily life. Recently, the stability of these networks has drawn considerable attention due to various abnormal conditions (e.g., leakage, pipe breakage, fire-water usage, and earthquakes). Among these, leakage is especially problematic because it is often difficult to detect immediately, leading to delayed responses and potential secondary damage. To enhance WDS maintenance and restoration, many utilities segment their networks and collect pressure and flow data from each segment. This approach helps detect abnormal hydraulic conditions, such as surges in demand or unusual flow patterns. Various methodologies have been proposed for detecting abnormal conditions, including analyzing changes in measurement data [1] and applying machine learning to pressure and flow datasets. However, simple data-driven detection can be unreliable if performed during peak demand or when measurement errors occur, making it more difficult to identify small-scale or gradual leakage.
Recent studies have sought to address these challenges by applying modeling-based or hybrid (data and model-based) approaches [2]. For example, Daniel et al. [3] employed a model-based method using linear regression on the L-Town network (BattLeDIM 2020) to identify the location and severity of leakage. Marvin et al. [4] utilized a Historical Gradient Boosting (HGB) algorithm to locate network leakage and proposed a machine learning (ML) framework that examines correlations between leakage onset time and leakage area, demonstrating higher performance than Random Forest (RF). Tyagi et al. [5] applied multinomial logistic regression with sensor flow-pressure relationships to detect leakage in noisy data environments. Zanfei et al. [6] used graph convolution networks (GCNs) for anomaly classification in pressure and flow datasets. Additionally, other approaches, such as 2D CNN [7] and MIMO-ANN [8], have shown promise in improving leakage detection accuracy and recognition time.
Despite these advances, most existing studies focus predominantly on detection performance, with relatively few extending their scope to the utilization of leakage detection results for efficient restoration. Failure to integrate restoration strategies that consider hydraulic, social, and economic factors can undermine the system’s resilience if leakages are simply repaired in the order they are discovered. In severe cases, multiple leakages can drastically reduce system pressure and inflict secondary damage on critical facilities [9]. Consequently, prioritizing repairs based on the scale and location of a leakage is essential for mitigating broader impacts [10]. Some studies have explored optimal restoration scenarios or decision-support tools. For instance, Choi et al. [11] employed simulation and optimization techniques to locate multiple leakages following earthquakes, proposing efficient restoration solutions. Yoo et al. [12] calculated the hydraulic importance of network segments to determine restoration priorities, providing a more realistic decision-making framework than simplistic aging-based approaches. Sophocleous and Nikoloudi [13] leveraged a multi-objective optimization method to identify optimal post-earthquake restoration strategies for B-City’s network, minimizing restoration time while maximizing effectiveness.
However, integrating both leakage detection and restoration plan into a single framework remains underexplored. Therefore, this study performs leakage detection using hydraulic analysis modeling and an artificial intelligence model to determine the location and scale of leakage. Furthermore, a framework was developed to establish restoration priorities based on the scale and location of detected leakages. The performance of leakage detection was analyzed for different networks, considering their topological characteristics. The proposed approach is designed to detect both single and multiple leakages, construct diverse leakage scenarios, and set restoration priorities based on detection results. By combining accurate detection with a systematic restoration strategy, this framework demonstrates its potential to significantly reduce response times and losses, ultimately enhancing the resilience of WDSs.
Leakage detection within water distribution networks has been performed in various manners using network data. However, leakage detection using measurement data, such as a pressure sensor, can be challenging to distinguish from water usage patterns if not conducted at night. Moreover, to select leakage restoration priorities, it is necessary to determine the presence of a leakage and quantitatively identify its size. Therefore, in this study, leakage detection was conducted using a deep learning-based model capable of detecting the location and size of leakage. For data-driven leakage detection, a hydraulic analysis program utilizing pressure data was employed. The pressure data were obtained using a single step during the night for each scenario. Scenarios simulating leakage were created and trained in a deep learning-based model to detect location and scale. Here, a scenario refers to both normal state data without leakage and abnormal state scenarios with simulated leakage events. The detected leakage locations and sizes are used as factors in deciding restoration priorities. To utilize these factors, an analysis of the targeted network was conducted by calculating the amount of water outage damage, average node degree (
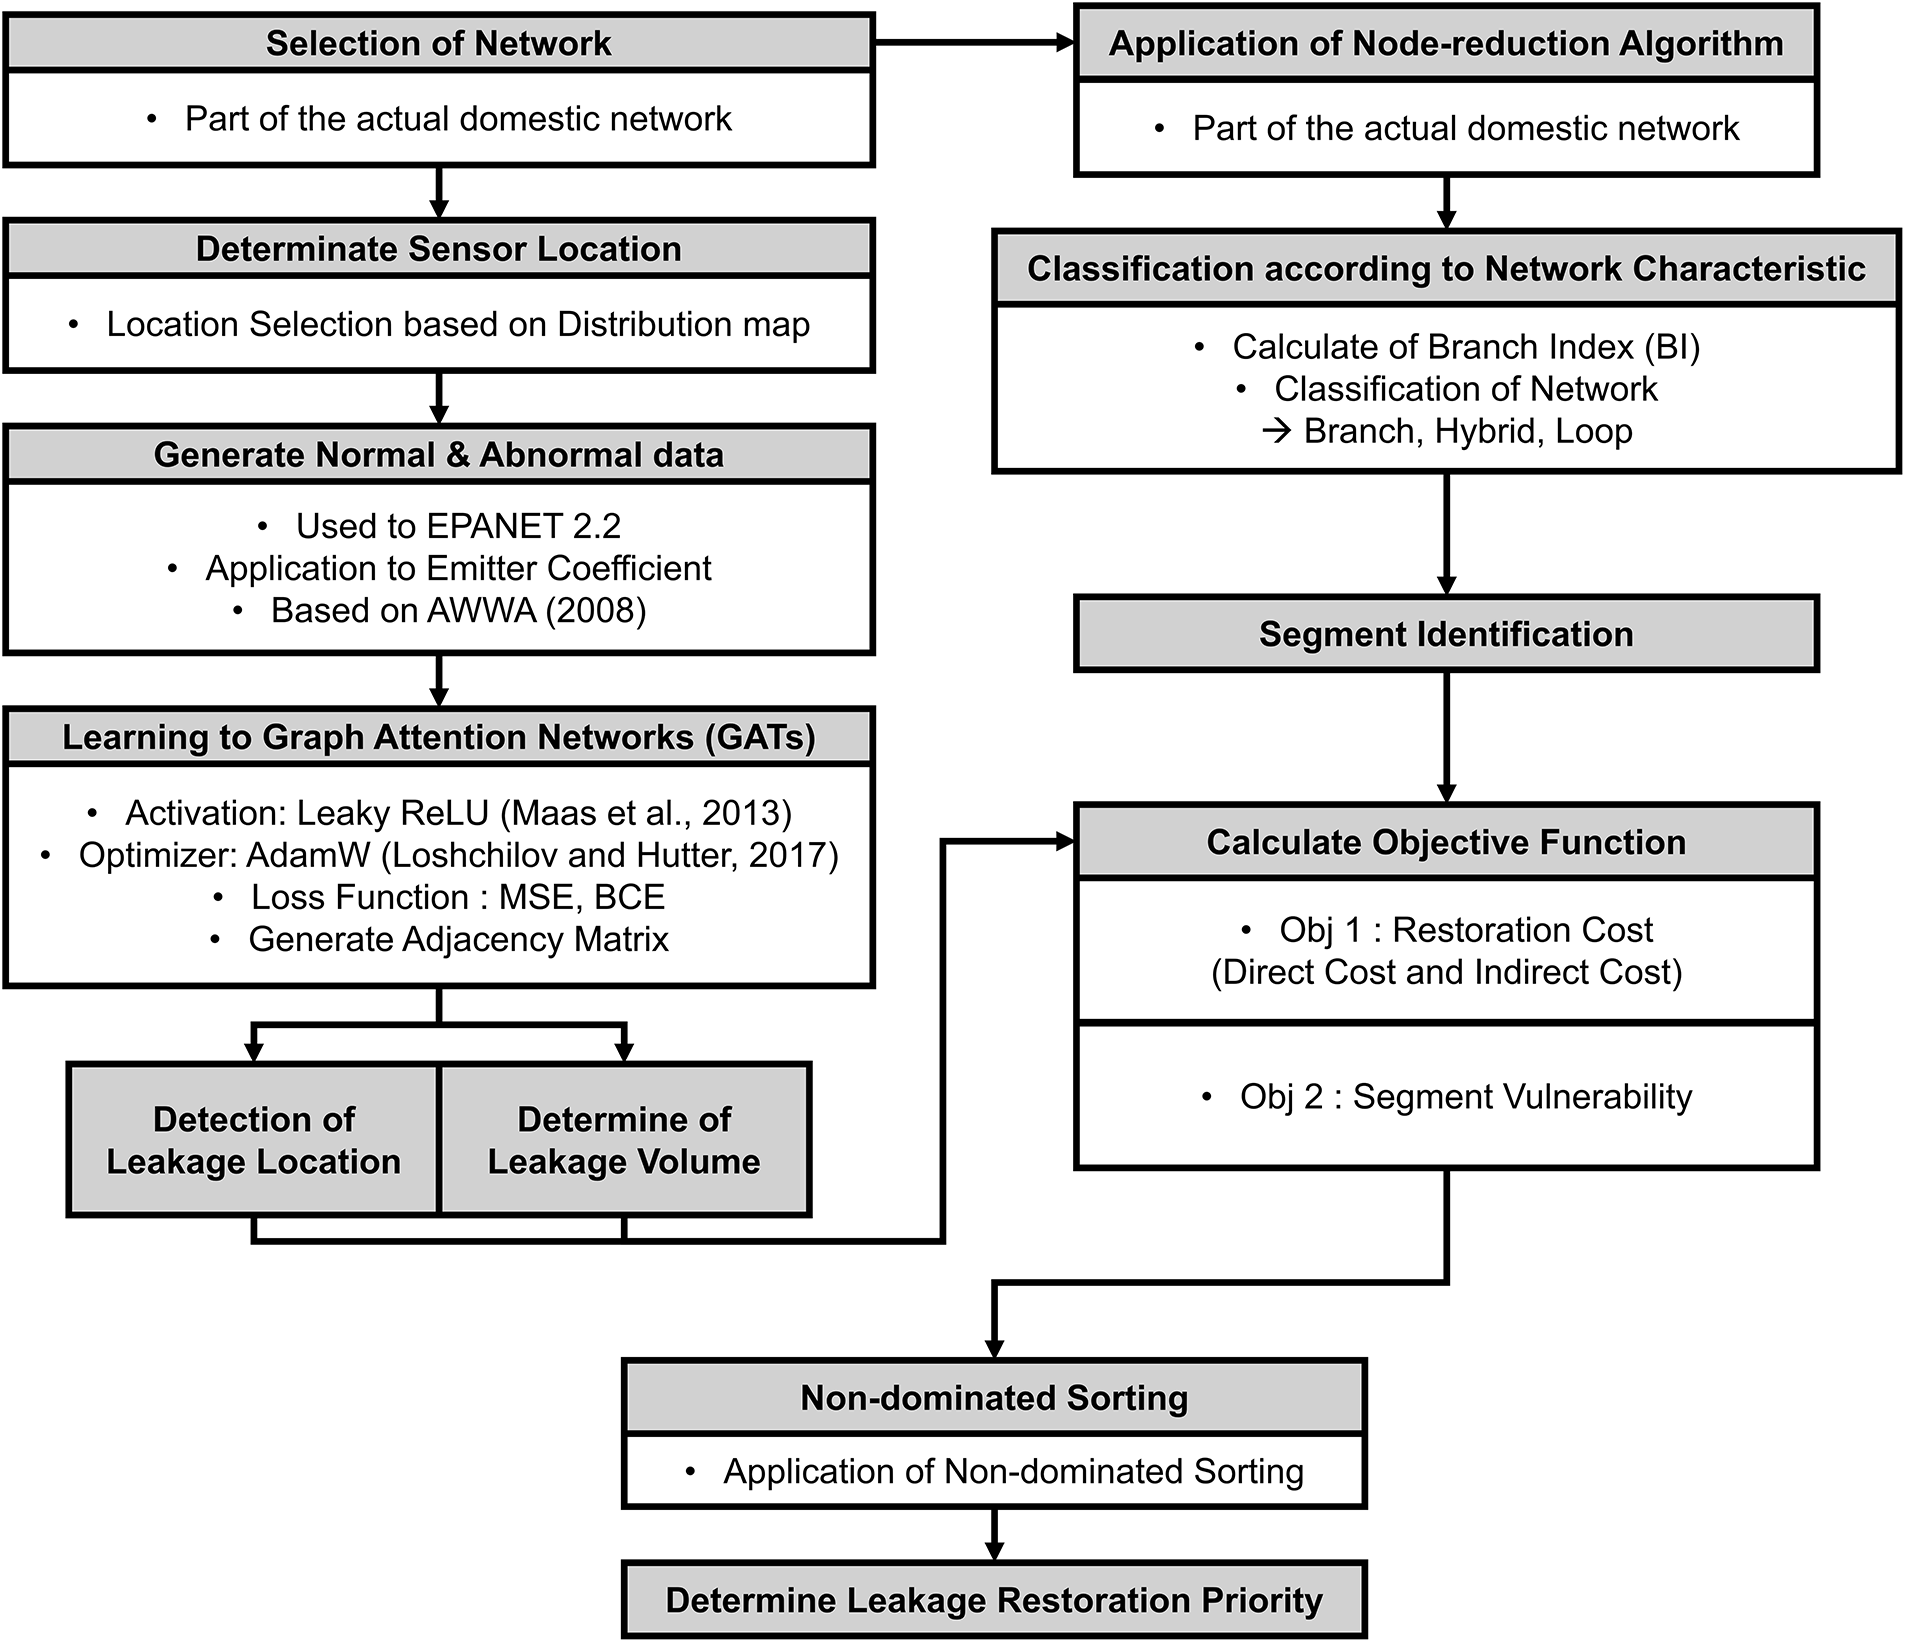
Figure 1: Flowchart of leakage detection and leakage restoration methodology.
2.1 Leakage Detection; Graph Attention Networks
The methodology for leakage detection and restoration comprises two main phases. The first phase is leakage detection, which involves determining both the location and the scale of leakage. Leakage location detection identifies the segment in which a leakage event has occurred, thereby defining the target area for subsequent restoration actions. In this study, leakage detection was performed using GATs [14]. GATs learn network structural information through graph connectivity and model interactions among nodes via attention mechanisms, making them well-suited for capturing spatially correlated pressure-response patterns in WDSs. Because GATs jointly exploit network topology and nodal attributes, they have demonstrated robust predictive performance even in large-scale and complex WDSs. Structural information was incorporated into the model through an adjacency matrix representing network connectivity. Fig. 2 illustrates the overall architecture of the adopted GAT model.
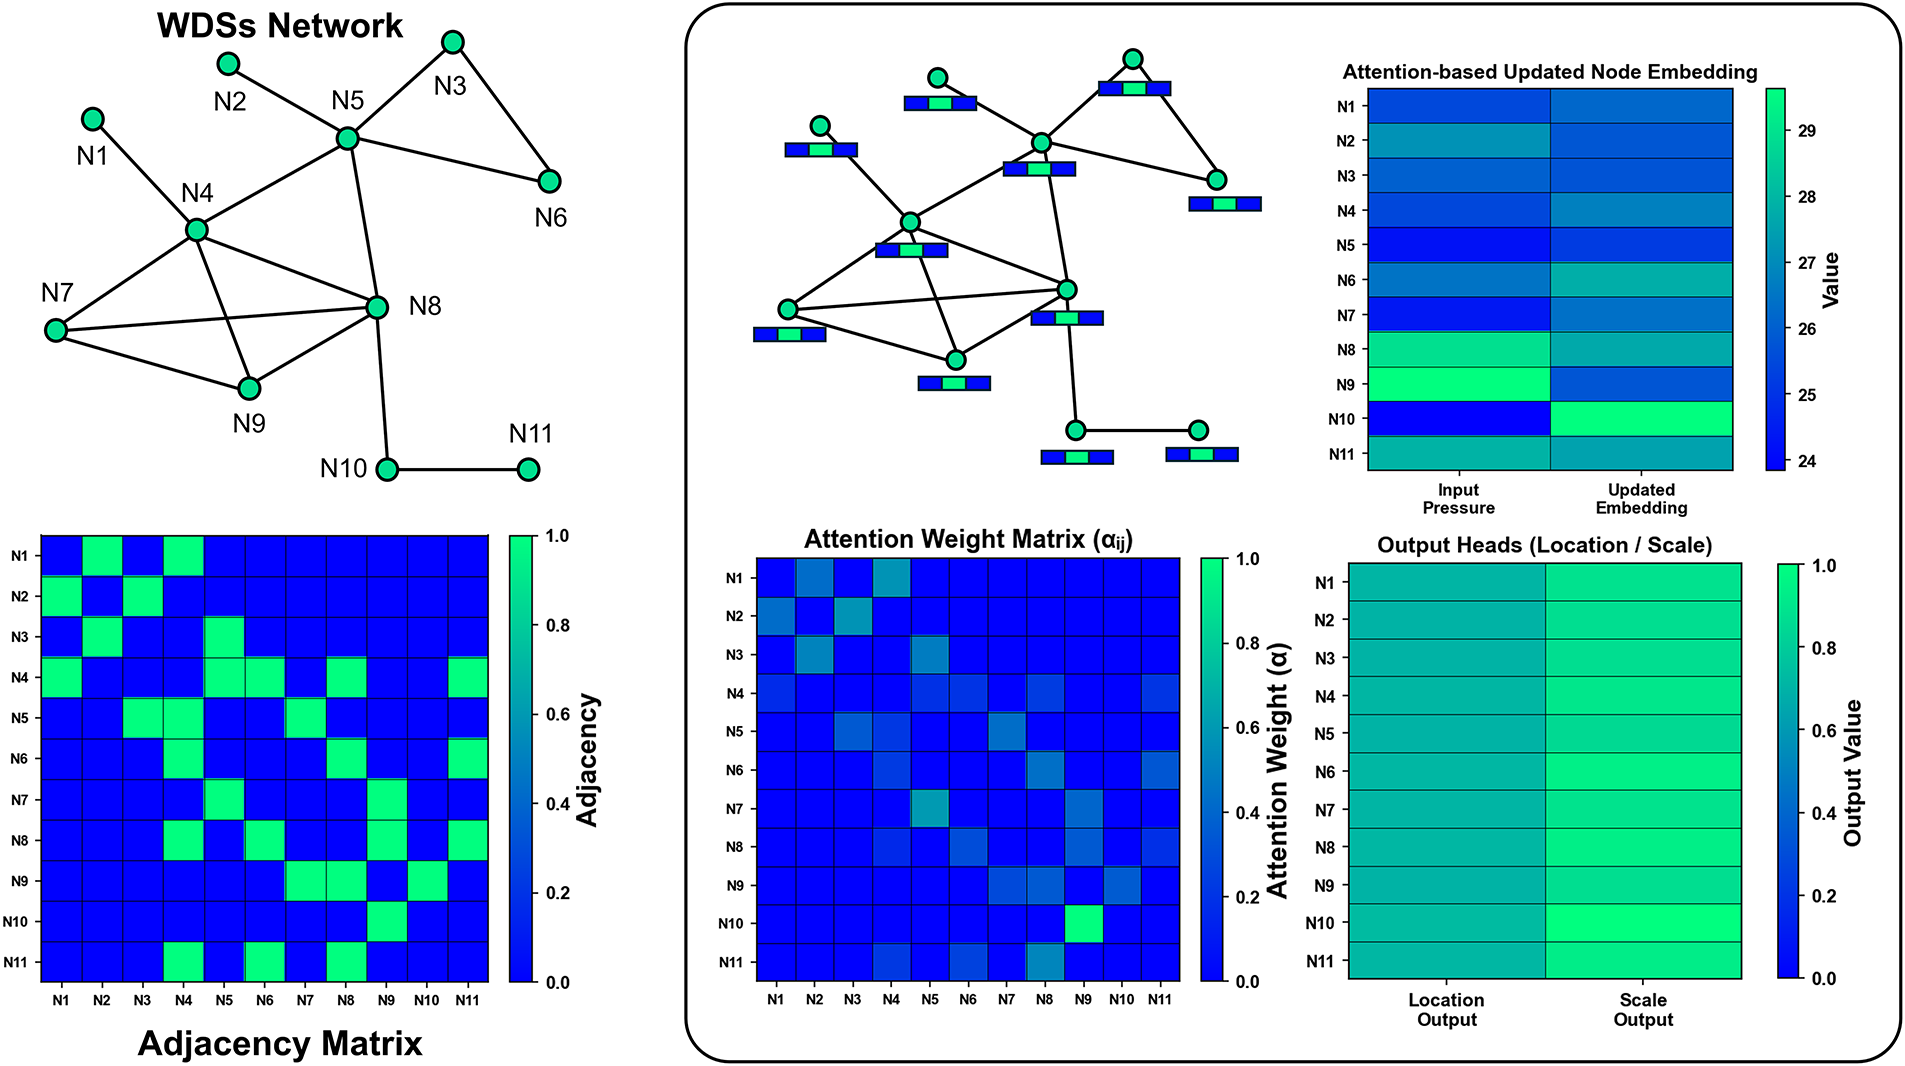
Figure 2: Architecture of GAT model.
To jointly estimate leakage location and leakage scale, a multi-task learning framework was employed. Specifically, the model employs a hard parameter-sharing architecture. The first two GAT layers serve as a shared encoder to extract latent hydraulic features common to both tasks. Subsequently, the network branches into two independent task-specific layers: one for leakage localization (classification) and another for leakage scale estimation (regression). Recent research verified that applying a multi-task learning framework to jointly estimate leak location and severity is effective in capturing complex hydraulic features [15]. Leakage scale was treated as a continuous regression target, whereas leakage location was formulated as a binary classification problem. Accordingly, Mean squared error (MSE) and Binary cross entropy (BCE) were used as the respective loss functions. The MSE loss is defined as:
where
where
2.1.1 GAT Architecture and Input-Output Representation
The input features consisted of pressure-based hydraulic characteristics collected at each node, along with local structural indicators derived from network connectivity. These features include nodal pressure values and graph descriptors reflecting local topological relationships. All input variables were normalized to the range [0, 1] to enhance training stability and prevent scale imbalance across features. The output labels were defined as a multi-dimensional vector for each segment, consisting of a binary indicator for leakage occurrence and a continuous value representing leakage scale. The leakage scale labels were also normalized to the range [0, 1] to stabilize multi-task learning and to ensure balanced optimization between classification and regression objectives. The GAT architecture comprised three graph attention layers. The first and second layers employed GAT convolutional layers with two attention heads each and a hidden dimension of 128. Following each GAT layer, a Leaky ReLU [16] activation function was applied. Batch normalization and dropout with a rate of 0.2 were incorporated to improve training stability and mitigate overfitting. The final output stage consisted of two independent GAT layers, separately dedicated to leakage location classification and leakage scale regression. This design allows the model to share intermediate representations while accounting for the distinct objectives and loss characteristics of the two tasks. The adopted architecture was selected based on preliminary experiments that balanced representational capacity, training stability, and computational efficiency. Fig. 3 summarizes the overall model structure, shared graph attention layers for feature extraction and the task-specific output branches designed to separately address leakage location classification and leakage scale regression.
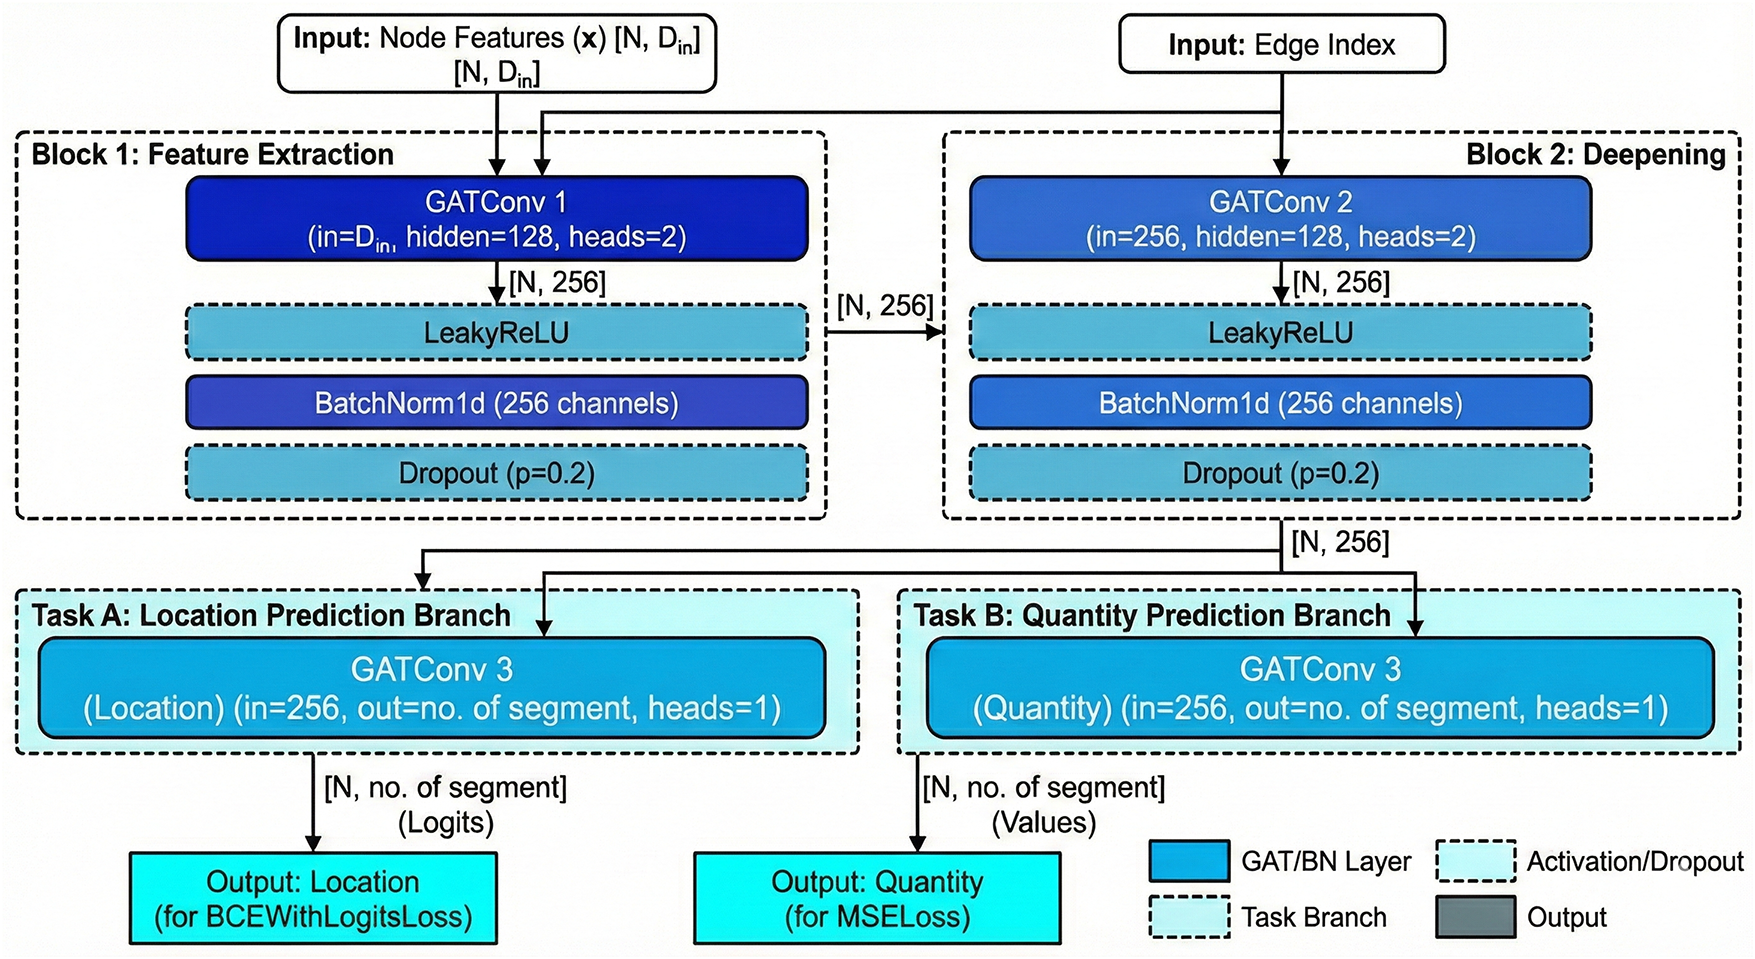
Figure 3: GAT architecture for leakage detection.
The total loss function was formulated as a weighted sum of the BCE and MSE losses. Given the operational importance of accurate leakage localization, a higher weight of 0.6 was assigned to the location prediction loss, while a weight of 0.4 was applied to the leakage scale loss. Model training was conducted using the AdamW optimizer [17] with an initial learning rate of 0.001 and a weight decay coefficient of 1 × 10⁻⁵. To mitigate validation-loss stagnation, a learning rate scheduler was employed, reducing the learning rate by a factor of 0.1 when no improvement was observed over a predefined number of epochs. The maximum number of training epochs was set to 50,000 to allow sufficient convergence under adaptive learning rate scheduling. Early stopping was applied when validation loss failed to improve for 1000 consecutive epochs, thereby preventing overfitting.
2.1.2 Leakage Scenario Generation and Data Construction
Training the GAT model requires both normal operating conditions and abnormal scenarios with leakage events. Because leakage and pipe ruptures primarily manifest as pressure anomalies, pressure data were used as the primary input for leakage detection [18]. Pressure snapshots at a single nighttime step (24:00) corresponding to minimum demand conditions were extracted for all scenarios. Leakage scenarios were generated using the Water Network Tool for Resilience (WNTR) [19]. Leakage was simulated by applying emitter coefficients at selected nodes, with leakage outflow expressed as:
where
The American Water Works Association (AWWA) [20] has provided data on unreported leakage scale by pressure. Accordingly, to simulate an unreported leakage within the network, emitter coefficients were determined considering the average pressure within the network, and the corresponding leakage scale were applied. However, it is unrealistic to obtain pressure data at every node in the network compared to actual WDSs. Therefore, to acquire pressure data within the network, it was assumed that pressure meters were installed at twice the number of segments into which the network is divided. Several assumptions are included in the data and simulation-based leakage detection methodology of this study [21].
1. The method seeks to find leakage that occurs after the model has been calibrated.
2. Leakages within the network do not occur in different locations at the same time.
3. The scale of the leakage does not expand or contract due to pressure and remains constant.
4. There is no measurement error in the observed pressure.
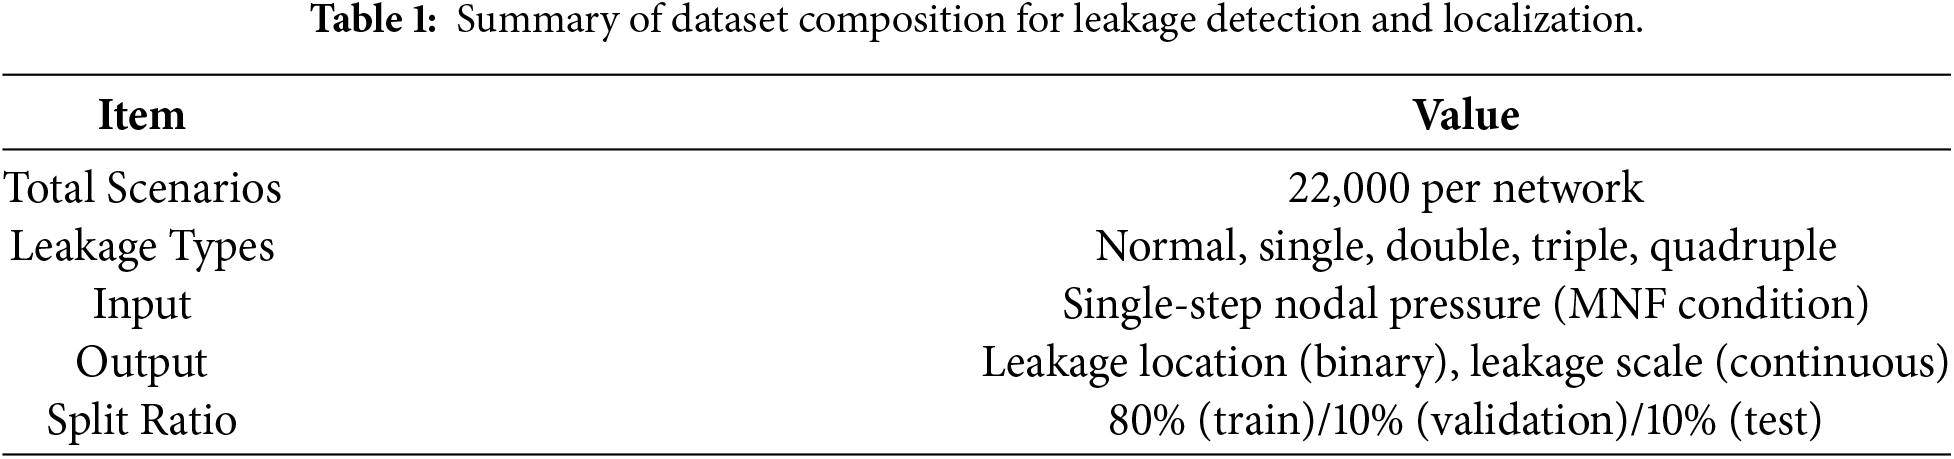
To obtain pressure data, a pressure-driven analysis (PDA) was conducted using EPANET 2.2 [22] and WNTR. Demand-driven analysis (DDA) is typically used, but it can yield unrealistic hydraulic results in abnormal situations [23]. Hence, a PDA was performed. In this study, the leakage simulations include both single and multiple leakage, simulating leakage occurring simultaneously at up to four locations, including one specific point. However, generating scenarios for all possible cases of single, double, triple, and quadruple leakage in each network and training on all the data would be inefficient. Therefore, a subset of scenarios for each type of leakage was sampled and used as training data. For each network, 22,000 simulated scenarios were constructed by sampling pressure data after simulation of leakage of varying sizes and locations. Out of 22,000 training data, 5000 data were randomly sampled for each of the single, double, triple and quadruple leakages, and 2000 normal condition scenarios were included in the training data to minimize false alarms. The obtained simulated scenario data were divided into learning, validation, and test databases at a ratio of 8:1:1 for model training. A concise summary of the dataset composition, including the number of scenarios, leakage types, input structure, and data split, is provided in Table 1.
The determination of restoration priorities plays a critical role in enhancing the overall stability and safety of water distribution systems by accounting for the relative importance of affected network components [12]. Leakage events can immediately compromise system performance, posing risks to both water quality and supply continuity. Moreover, leakage requires continuous monitoring and suppression, necessitating restoration strategies that consider not only leak management but also associated facility and operational impacts [24]. During restoration, the isolation of a segment may unintentionally disconnect other parts of the network from the reservoir, resulting in unintended service outages [25]. Therefore, restoration impacts, including unintended isolation, were considered when establishing restoration priorities. Fig. 4 illustrates an example of unintended isolation caused by segment separation.
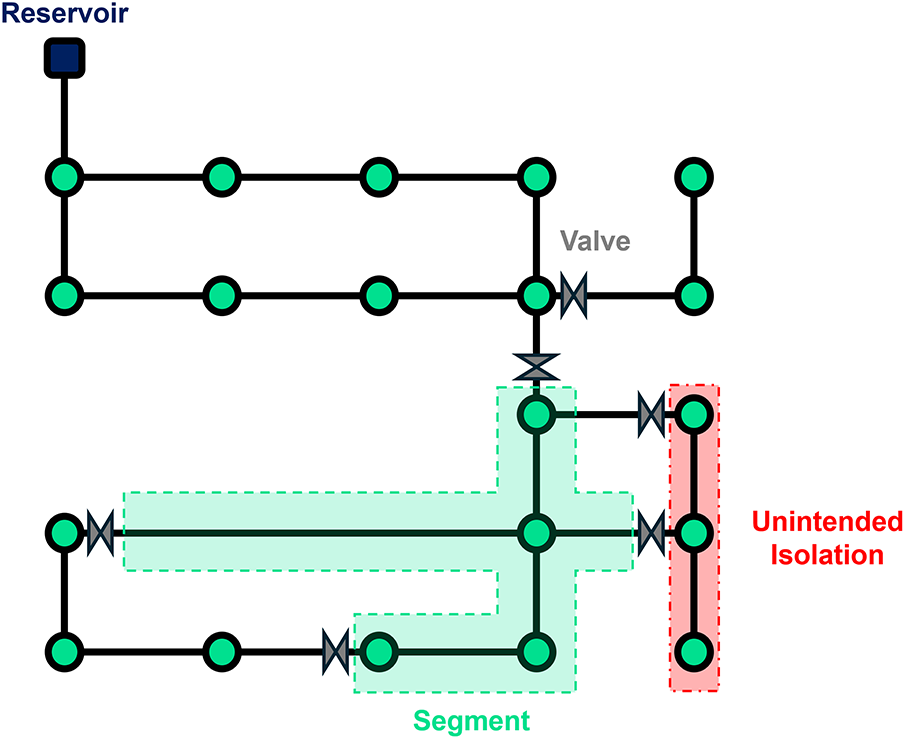
Figure 4: Example of WDSs segment and unintended isolation.
The determination of leakage restoration priority involves a multi-criteria decision-making process in which multiple, often conflicting, factors must be considered. Indicators such as total demand and the number of
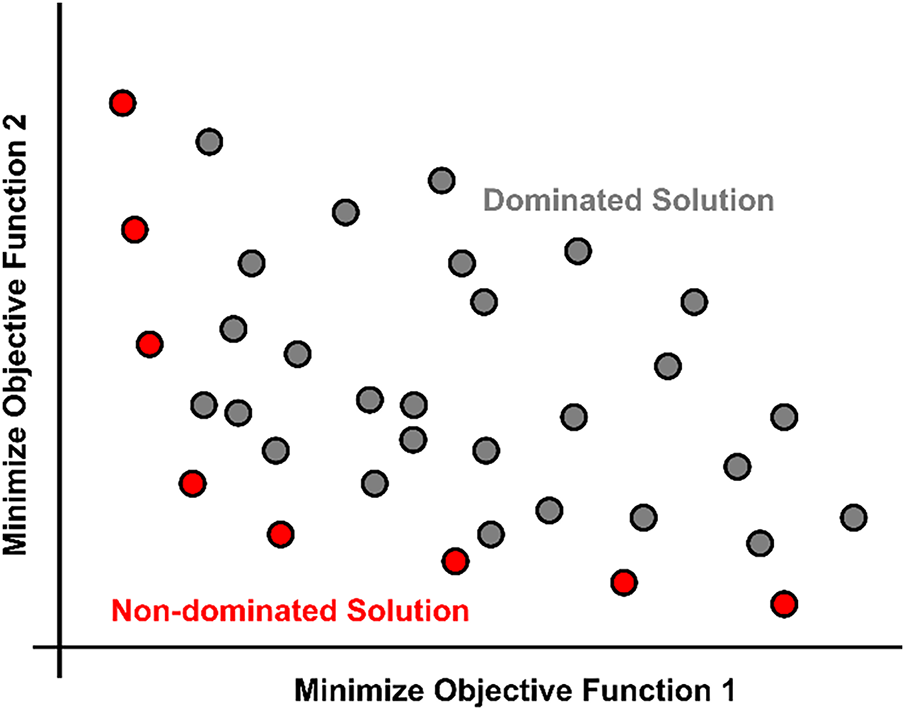
Figure 5: Methodology of the non-dominated sorting.
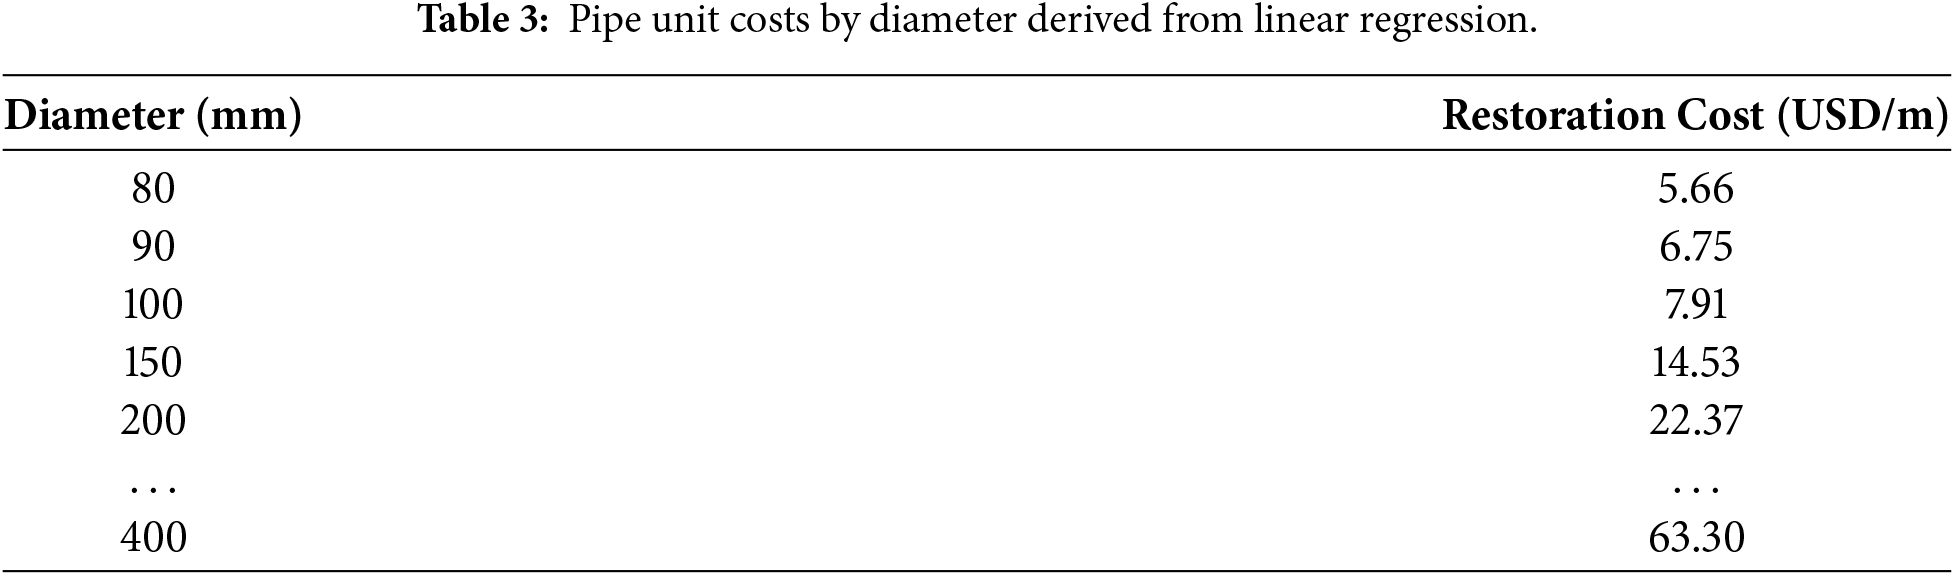
To evaluate dominance relationships among restoration scenarios, two performance indicators were defined: a leakage restoration cost indicator and a segment vulnerability indicator. The restoration cost indicator accounts for both direct and indirect costs. Direct costs were estimated based on the average pipe diameter within each segment, as larger diameters generally incur higher construction and repair expenses. Indirect costs represent additional impacts such as personnel deployment and restoration duration and were assumed to scale proportionally with leakage magnitude and direct costs. Furthermore, a delay weight was incorporated to reflect increased outage damage and leakage impacts when restoration of a segment is postponed relative to others. The restoration cost indicator is expressed as:
The segment vulnerability indicator represents the potential service impact caused by leakage and restoration activities. It incorporates undelivered demand (
where
where
3 Benchmark Network and Classification
For the application of the methodology, a portion of a domestic administrative WDS was used. Three different networks were selected as target networks, and each was classified using the branch index (BI) and node-reduction algorithm proposed by Hwang and Lansey [27] to differentiate the detection performance based on network topology characteristics. A node reduction algorithm has the advantage of being able to quantitatively evaluate the topology of networks with different shapes because it utilizes node degree (ND) for network simplification. A node reduction algorithm first calculates the number of pipe connections of each node, i.e., ND, and determines nodes with ND of 1 as non-essential nodes and deletes them. In this process, the pipes connected to the corresponding nodes are removed, and this process is repeated until there are no nodes with ND of 1 in the network. After that, the ND of each node in the remaining network is calculated again and stored as New ND, and nodes with New ND of 2 are found and additionally deleted. At this time, a new pipe is formed that directly connects the two adjacent nodes of the deleted node, and the ND of the adjacent nodes after the connection is recalculated and stored as After ND. If the New ND before deletion and the After ND after deletion are the same, it is determined that the deletion of the corresponding node does not affect the basic structure of the network, and the removal process is performed. After applying the algorithm, quantification of BI becomes possible. Fig. 6 visualizes this process.
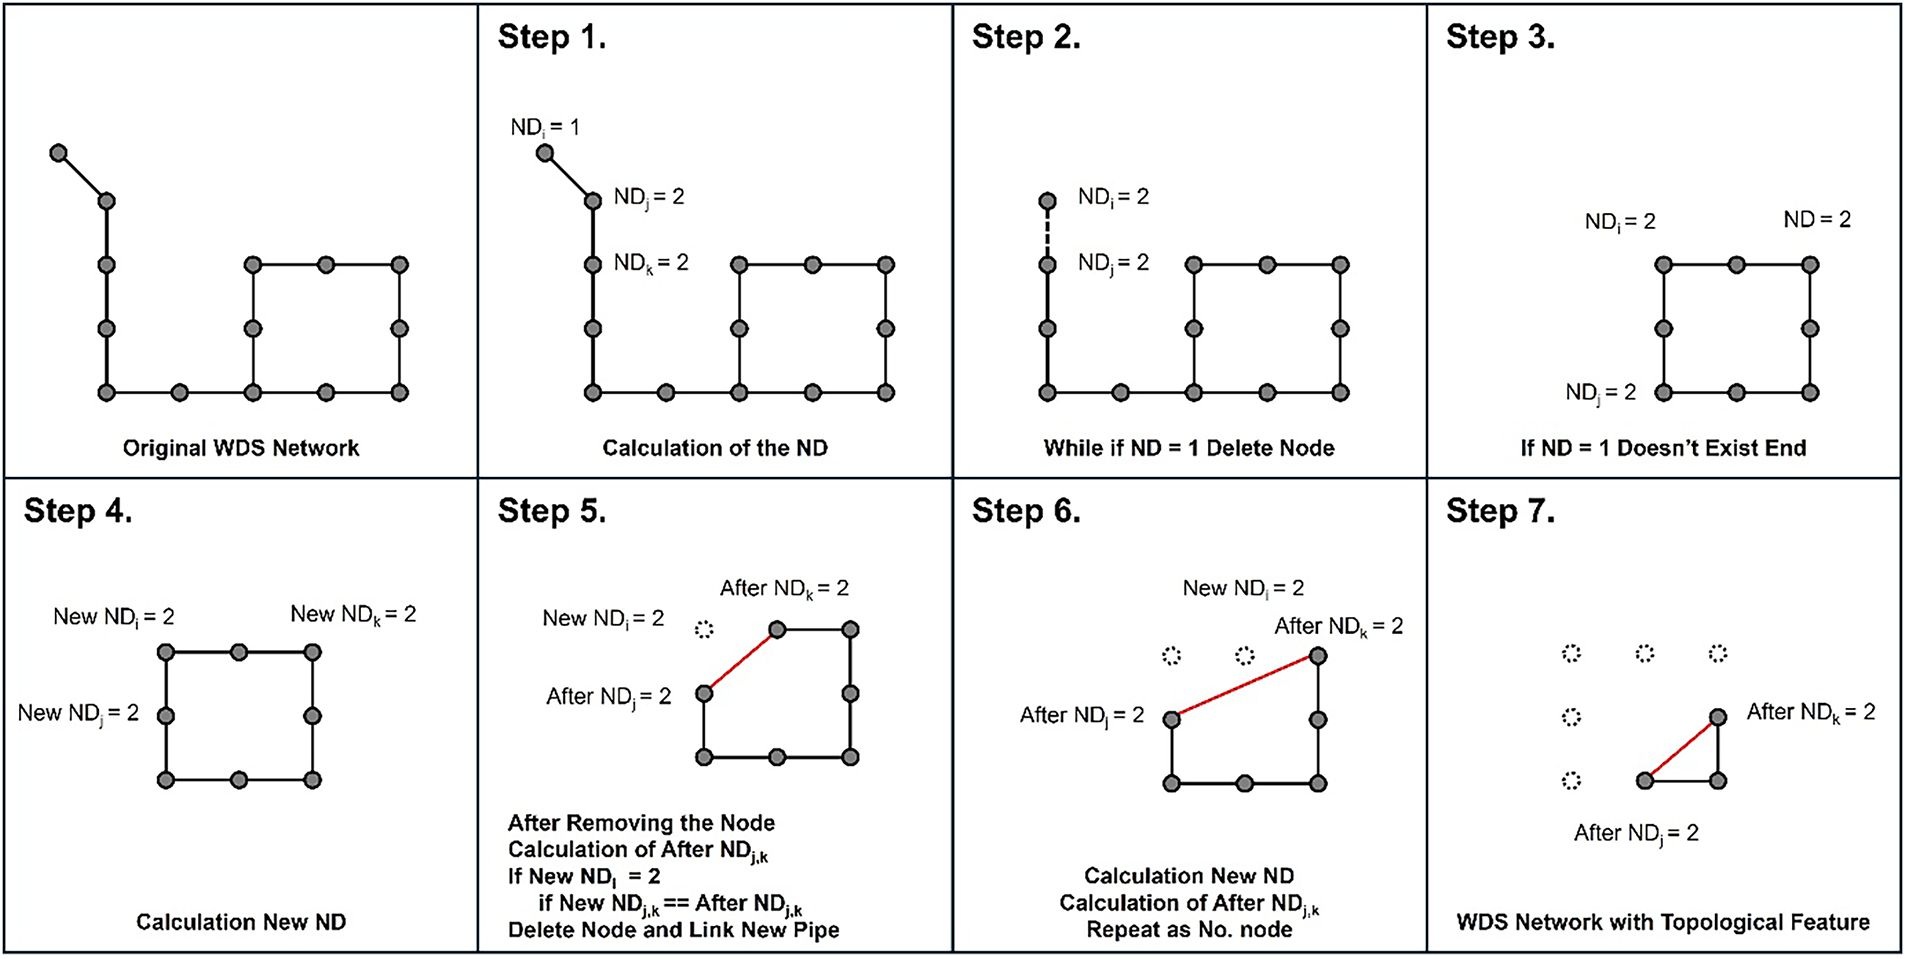
Figure 6: Flow of node-reduction algorithm [28].
Based on the BI, each network was categorized as Branch, Hybrid, or Loop, and the leak detection performance was assessed according to each network type. Each network was simplified using the node-reduction algorithm to identify nonessential nodes, and nonessential nodes and pipes were removed after grading all nodes in the overall network. BI is expressed as Eq. (7):
where
The networks targeted for validation of the methodology of this study are a part of a domestic administrative water supply network. Net 1 consists of 287 nodes and 328 pipes. After the application of the node-reduction algorithm, it was found to be a Loop network with a BI of approximately 0.1. Net 2 consists of 206 nodes and 221 pipes. After the application of the node-reduction algorithm, it was found to be a Hybrid network with a BI of approximately 0.4. Net 3 consists of 323 nodes and 328 pipes. After the application of the node-reduction algorithm, it was found to be a Branch network with a BI of approximately 0.7. Table 2 shows the classification results of each network based on their BI. In this study, valve locations were arbitrarily assumed to divide the segments. Net 1 assumed 42 valves, and Net 1 was divided into 9 segments based on the assumed valve positions. Net 2 assumed 15 valves and was divided into 11 segments. Net 3 assumed 9 valves and was divided into 10 segments. This segment division is an assumption to simplify the configuration and secure analysis convenience for the review of the methodology proposed in this study and may be somewhat different from the actual operating situation. The quality of sensor placement in WDSs has a considerable impact on leakage detection efficiency [29]. In particular, for data-driven leakage detection using deep learning models, the installation of at least two sensors with minimal correlation and sufficient spatial separation has been shown to enhance detection performance [30]. In this context, the optimal meter placement (OMP) problem in WDSs aims to secure sufficient sensing coverage so that pressure variations caused by leakage can be clearly distinguished using a limited number of sensors. To this end, various approaches based on pressure sensitivity matrices or multi-objective optimization techniques have been proposed [31–34]. While these methods can improve leakage detection performance with a minimal number of sensors, they typically require repeated hydraulic simulations and combinatorial searches, resulting in a substantial increase in computational burden as the network size grows. Moreover, because the resulting sensor configurations are often highly network-specific, their applicability may be limited in data-driven deep learning frameworks that require the repeated generation of large-scale leakage scenarios for model training. Therefore, sensor locations were determined by uniformly distributing a fixed number of sensors across the water distribution network, assuming at least two sensors per segment, to ensure consistent spatial coverage and reliable pressure observation across all segments. Figs. 7 and 8 illustrate the targeted networks along with their geometries and the locations of the pressure meters for each network divided into segments.
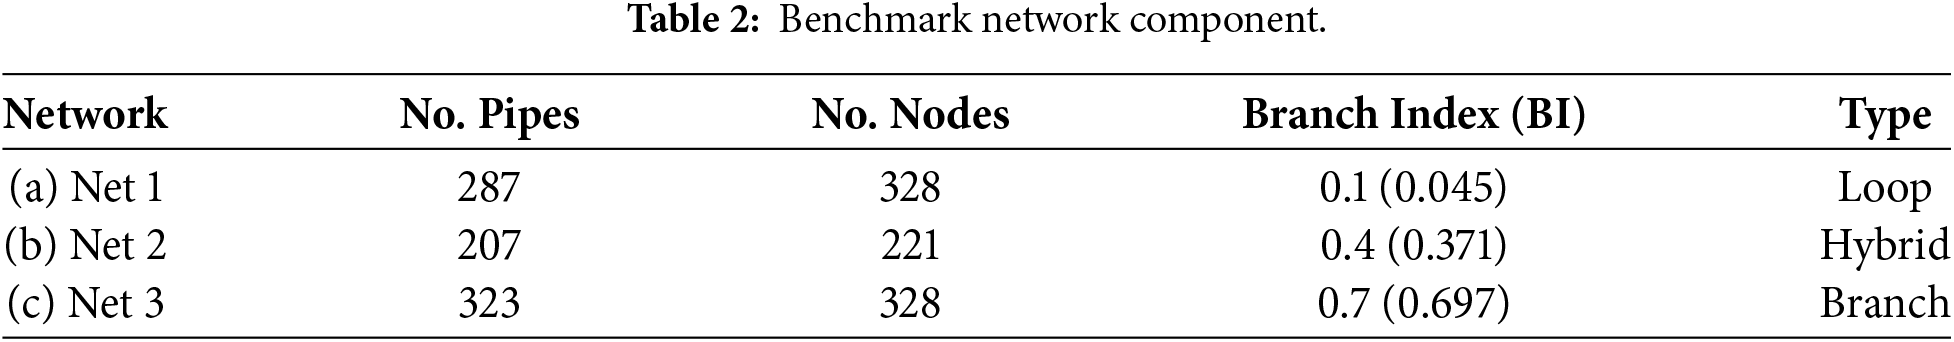
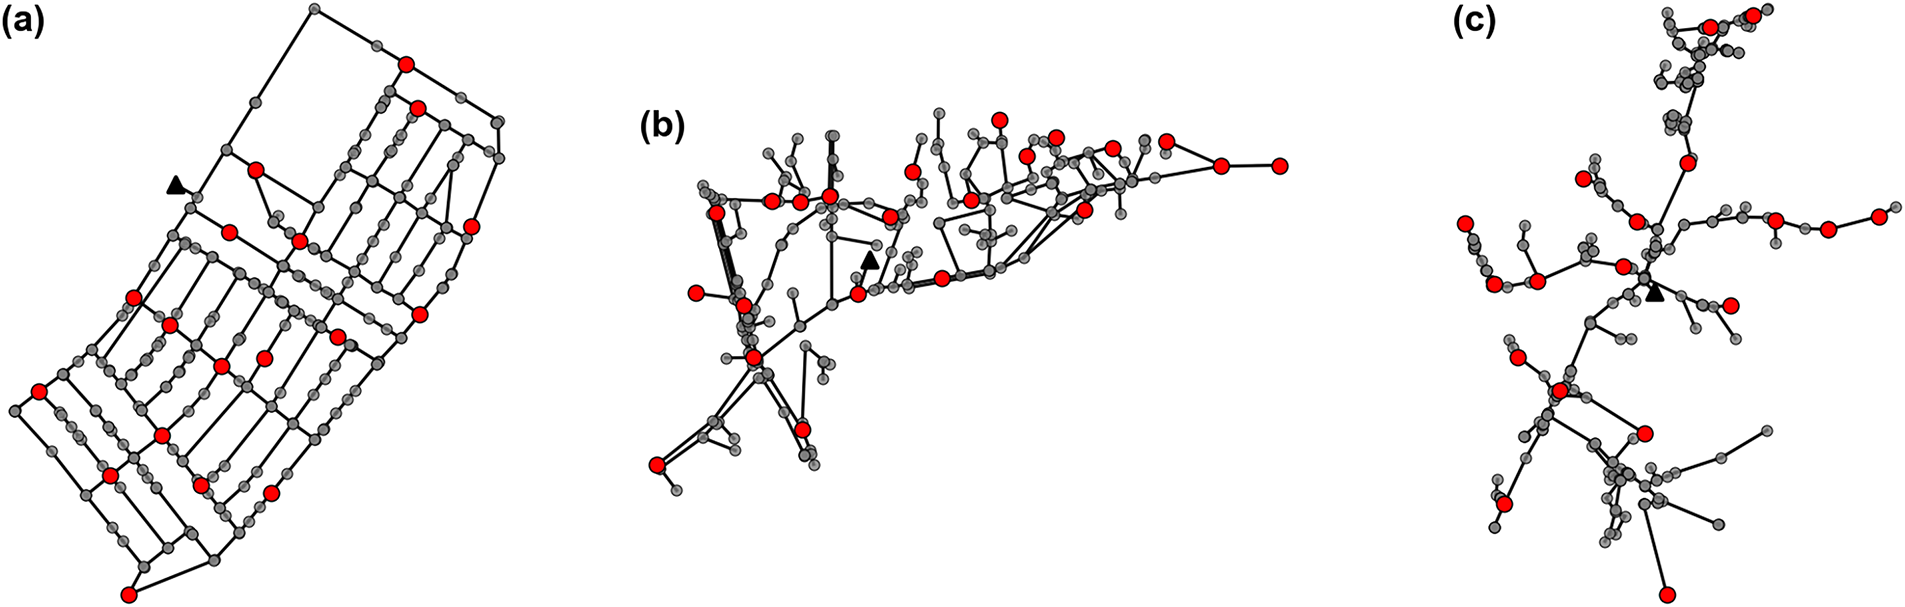
Figure 7: (a) Net 1: loop characteristic benchmark network; (b) Net 2: hybrid characteristic benchmark network; (c) Net 3: branch characteristic benchmark network; Red point: sensor location.
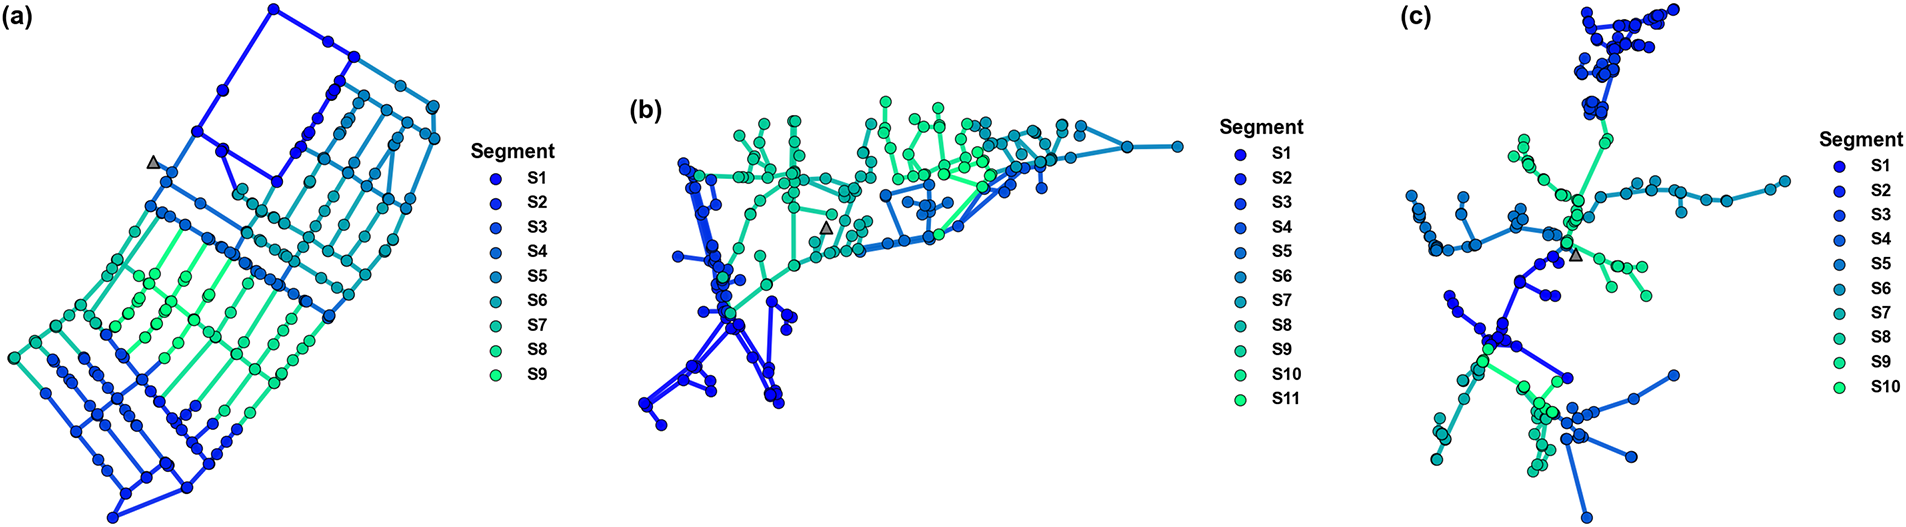
Figure 8: Benchmark network segment division shape.
The networks categorized by BI are evaluated using several indices to assess the leakage detection performance according to their type. As the leakage scale is continuous data, it is assessed using regression indices, while the leakage location detection, being discrete data, is assessed using classification indices. In this study, mean average percent error (MAPE) was used for the quantitative evaluation of leakage scale detection, while accuracy, F1 score, and precision were used for evaluation of leakage location. The MAPE, accuracy, F1 score, and precision are expressed in Eqs. (8)–(12).
Each of the three target networks was trained using GAT models under single and multiple leakage scenarios to evaluate prediction performance. In parallel, internal structural characteristics of the segmented networks and the
5.1 Leakage Detection Performance Results
The prediction performance was evaluated by training the GAT model on single and multiple leakage scenarios obtained for each network. Table 4 and Fig. 9 present the leakage detection performance for each network type.
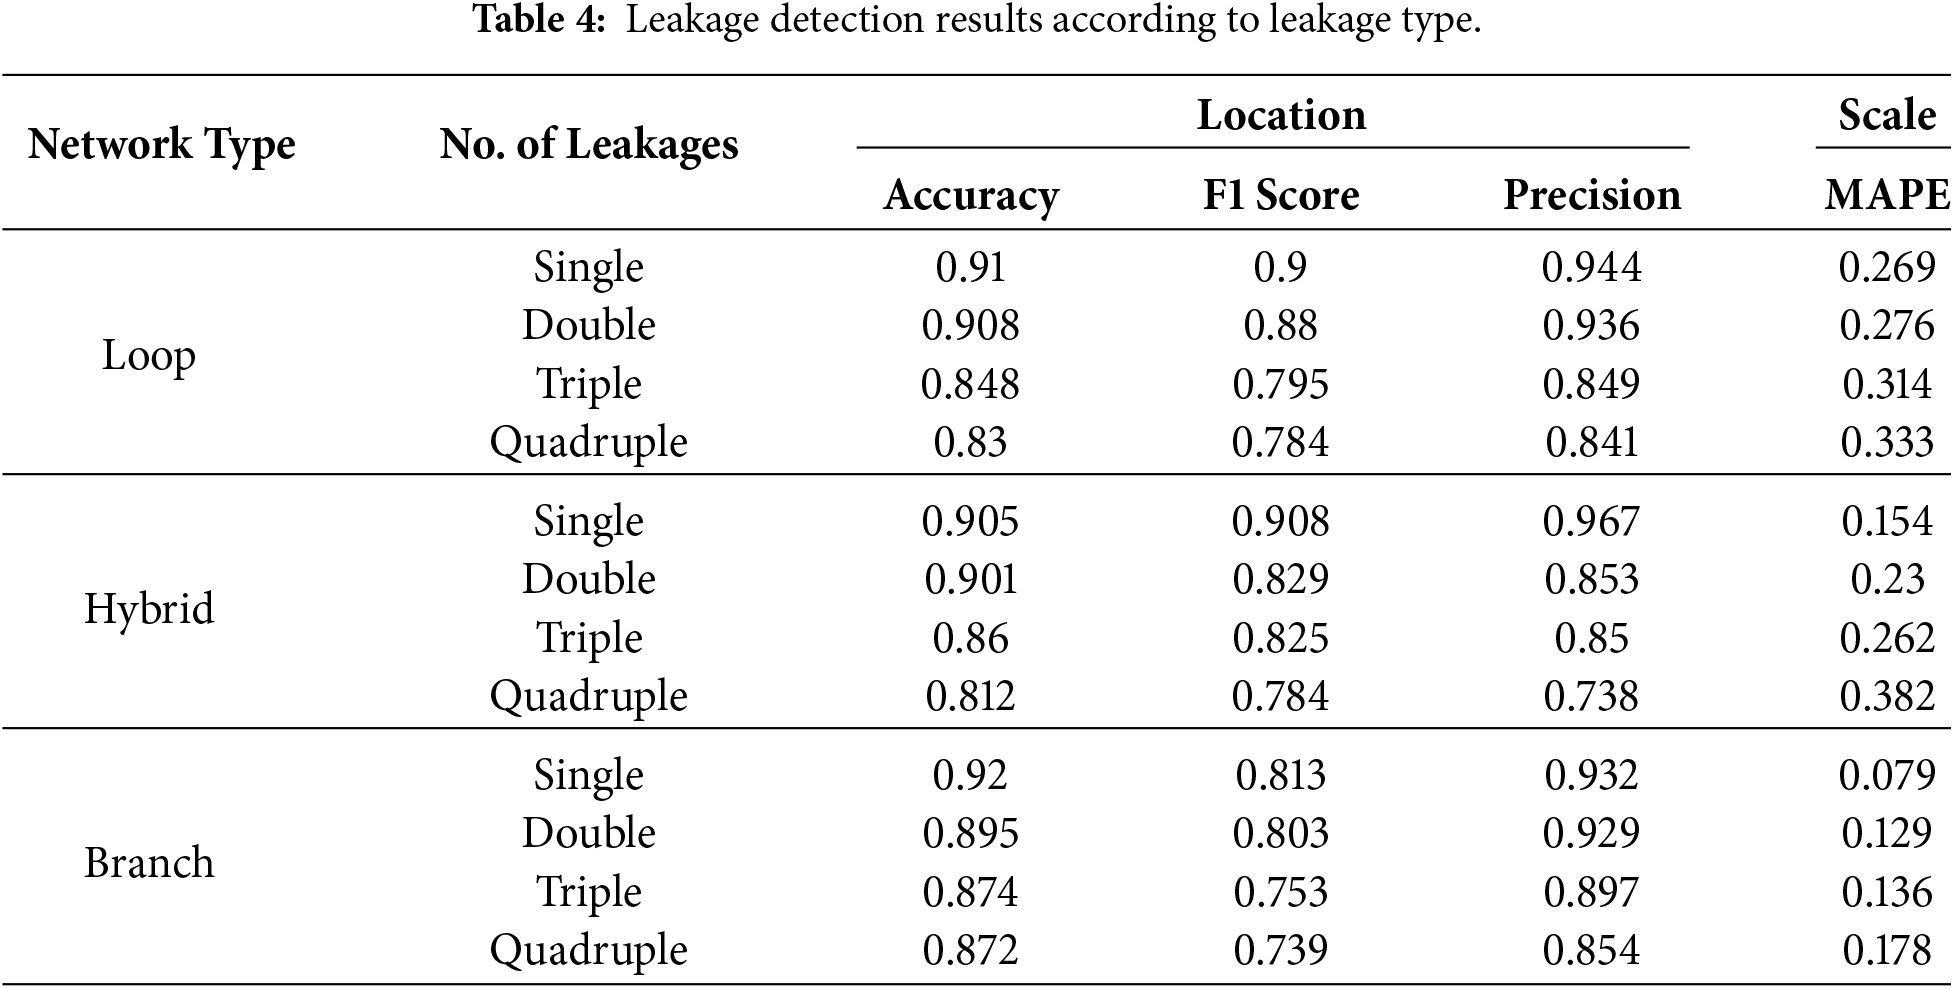
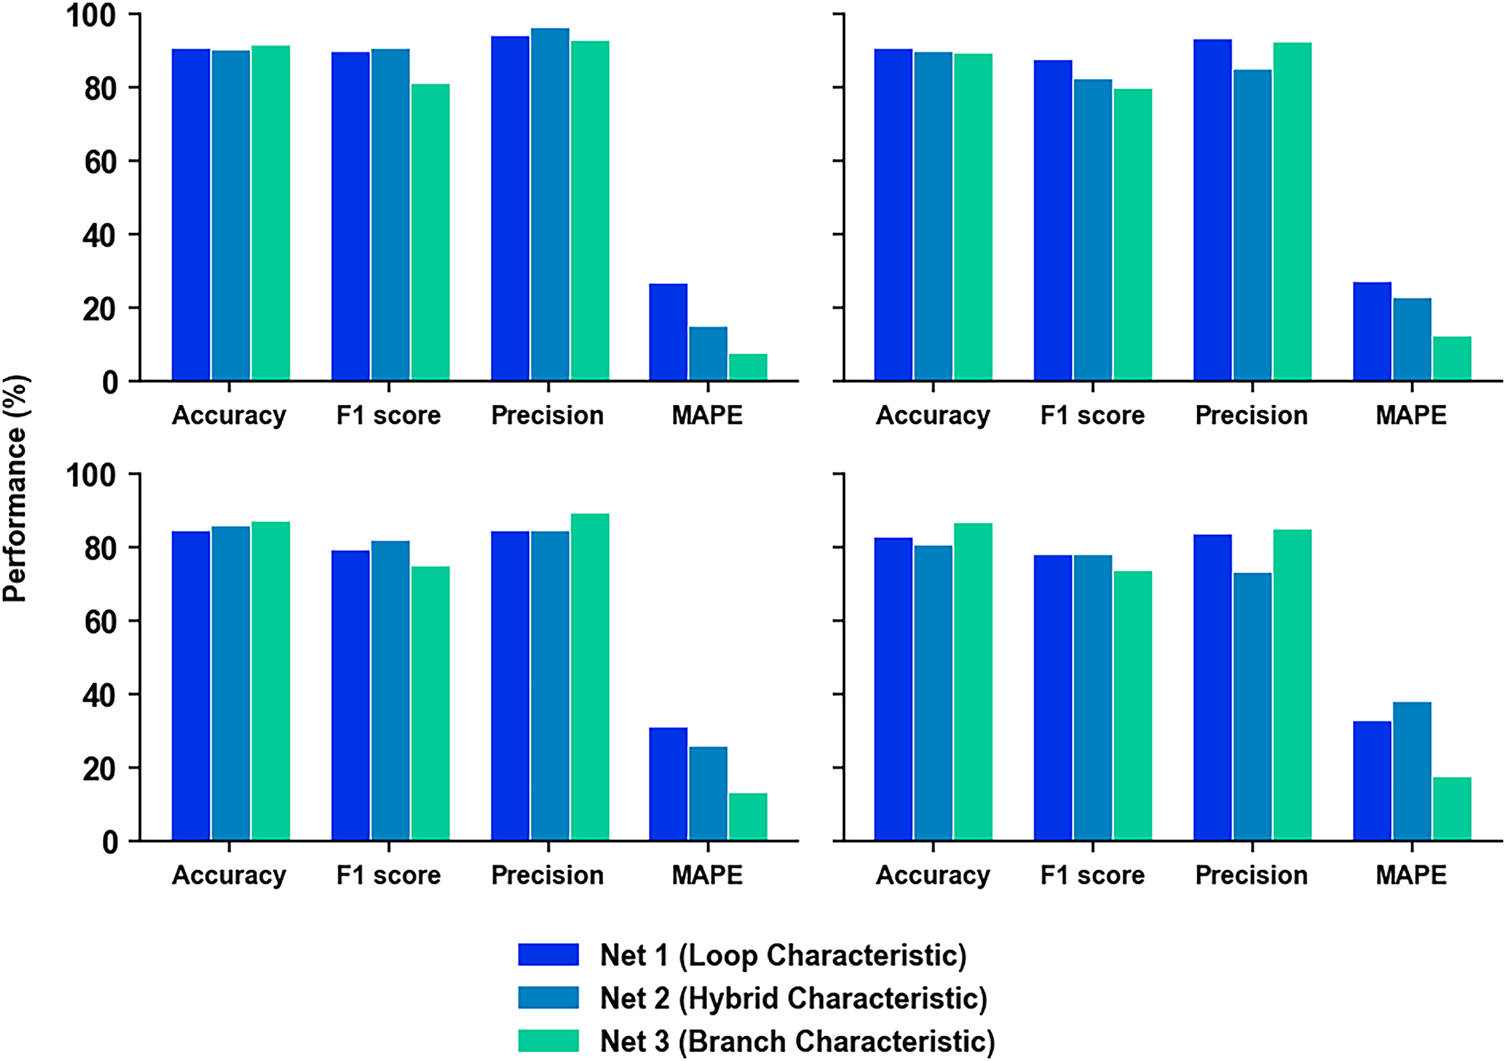
Figure 9: Comparison of leakage detection performance across network topology types.
In Net 1 (Loop characteristics), the accuracy for single leakage detection was 0.910, F1 score 0.900, precision 0.944, and MAPE 0.269. This is because the pressure drop occurs at a limited point when a single leakage occurs, so the model can learn relatively clear features, which results in high accuracy and F1 score. However, when multiple leakages occur, the pressure drop within the network is more complex than that of a single leak, and their influences interfere with each other, making it difficult for the model to specifically identify the leakage location. Accordingly, the accuracy of the multiple-leakage detection results in Net 1 decreased to 0.83, F1 score to 0.784, and precision to 0.841, and MAPE increased to 0.333. These results mean that estimating the leakage location and scale becomes more difficult in a multiple-leakage situation compared to a single leakage. In the case of Net 2 (Hybrid characteristics), the accuracy was 0.905, F1 score was 0.908, precision was 0.967, and MAPE was 0.154 in the case of a single leakage, which were low compared to Net 1. However, in the case of a multiple leakage scenario, the accuracy was 0.812, F1 score was 0.784, and precision was 0.738, clearly showing a decrease in performance due to increased complexity, similar to the Loop characteristic. Also, as MAPE increased to 0.382, it could be confirmed that the difficulty of estimating the leakage scale increased compared to a single leakage. This can be interpreted as because although the Hybrid characteristic includes some sections with Branch characteristics, it still has Loop characteristics, so when leakage occurs simultaneously at multiple points, the transition path of the pressure drop is not fixed to one branch but is distributed into multiple branches, making it difficult for the model to identify the exact location. For Net 3 (Branch Characteristics), single leakage detection resulted in an accuracy of 0.92, an F1 score of 0.713, and a precision of 0.832. These metrics indicate superior accuracy in location identification compared to Loop or Hybrid networks, although the F1 score and precision results were mixed. Despite this, the MAPE was notably low at 0.079, indicating relatively accurate leakage scale estimation. This can be attributed to the structural characteristics of the Branch network, where clear terminal nodes lead to localized and pronounced head losses when leakage occurs. Such localized hydraulic responses reduce ambiguity in the pressure-leakage relationship, enabling the model to more reliably infer leakage magnitude even when location-related classification metrics show mixed performance. This characteristic can also be advantageous for estimating the leakage scale [36]. In multiple leakage scenarios, the accuracy was 0.872, with an F1 score of 0.739 and a precision of 0.854, similar to other network characteristics. However, a performance decrease was observed compared to single leakage scenarios. Despite this decrease, the MAPE remained relatively stable, ranging from 0.129 to 0.178. This suggests that because Branch networks have a simpler pressure flow path than Loop networks, the GAT model, which applies the Attention mechanism, can effectively learn to estimate the actual leakage scale.
Across all network types (Loop, Hybrid, and Branch characteristics), a consistent pattern emerged: accuracy, F1 score, precision, and MAPE showed degraded performance in multiple-leakage scenarios compared to single-leakage scenarios. This deterioration occurs because simultaneous leakages at multiple points cause overlapping pressure drop sections, where leakage points mutually interact. These interactions create complex pressure patterns that challenge the model’s ability to accurately identify leakage locations and magnitudes. Furthermore, while increasing the number of detailed network clusters may improve area-specific leakage diagnosis granularity, it also raises the number of potential leakage candidates. This expanded candidate pool could result in higher rates of false positive or false negatives [37]. The GAT-based model performed in this study may have an advantage over other models in terms of robustness to network topology change. AM (Attention Mechanism)-LSTM model which applies attention mechanism, may have an advantage in learning continuous pressure changes using time-series data, and has shown high AUC in leakage detection [38]. However, in this study, it demonstrated that a time series model similar to LSTM is not essential because leakage can be detected with only single-step pressure data. In addition, GAT has an advantage in that it learns the structural shape of a network consisting of nodes and links, making it advantageous for application in actual large-scale networks. And performed leakage detection using the GCN-LSTM model, which combines the GCN model and the LSTM model, it was possible to evaluate the status of a robust network even when the sensor density is low or there is data loss because spatial characteristics and time series changes were learned together [39]. However, since GAT uses an attention mechanism, it is more effective in capturing local abnormal signs such as leakage. When a specific node plays a more important role in the interaction between sensors, GAT can highlight that information to identify the leakage point more clearly. As a result, in real networks, the distribution of sensors may not be uniform, but GAT has the advantage of effectively detecting abnormal events such as leaks even in situations where the sensor density is low or unbalanced by giving more weight to sensor nodes located in important areas.
In conclusion, Loop networks (Net 1) and Hybrid networks (Net 2) exhibit significantly increased difficulty in detecting leakage or estimating leakage scale under multiple leakage occur scenarios. This challenge arises from pressure redistribution through interconnected pathways, which complicates the isolation of individual leakage effects. In contrast, Branch networks (Net 3) demonstrate relative accuracy in estimating leakage scale due to their ability to capture terminal leakage characteristics, where pressure loss patterns are more distinct. However, Branch networks are not universally advantageous. While they perform better in simpler scenarios, their accuracy in locating leakage and estimating magnitudes diminishes as leakage complexity increases, mirroring performance degradation observed in Loop and Hybrid networks. This limitation underscores the need for adaptive detection frameworks that account for network topology and leakage interaction dynamics. These results indicate that both in practice and research, a comprehensive approach should be developed to address various scenarios, including multiple leakages, by simultaneously considering network characteristics and model limitations. Furthermore, it is anticipated that future improvements in network operation will be effectively achieved through the utilization of machine learning and physics-based fusion models specialized for multiple leakage detection, as well as real-time pressure monitoring systems.
5.2 Application of Leakage Restoration Priority Method Results
In WDSs, multiple leakage can lead to immediate losses upon occurrence. To minimize this, an optimal restoration scenario must be selected. Leakage in arbitrary locations were simulated for up to quadruple leakage. To illustrate the specific application of the restoration priority selection methodology, it was applied to quadruple leakage scenarios in each network. Moreover, the location of
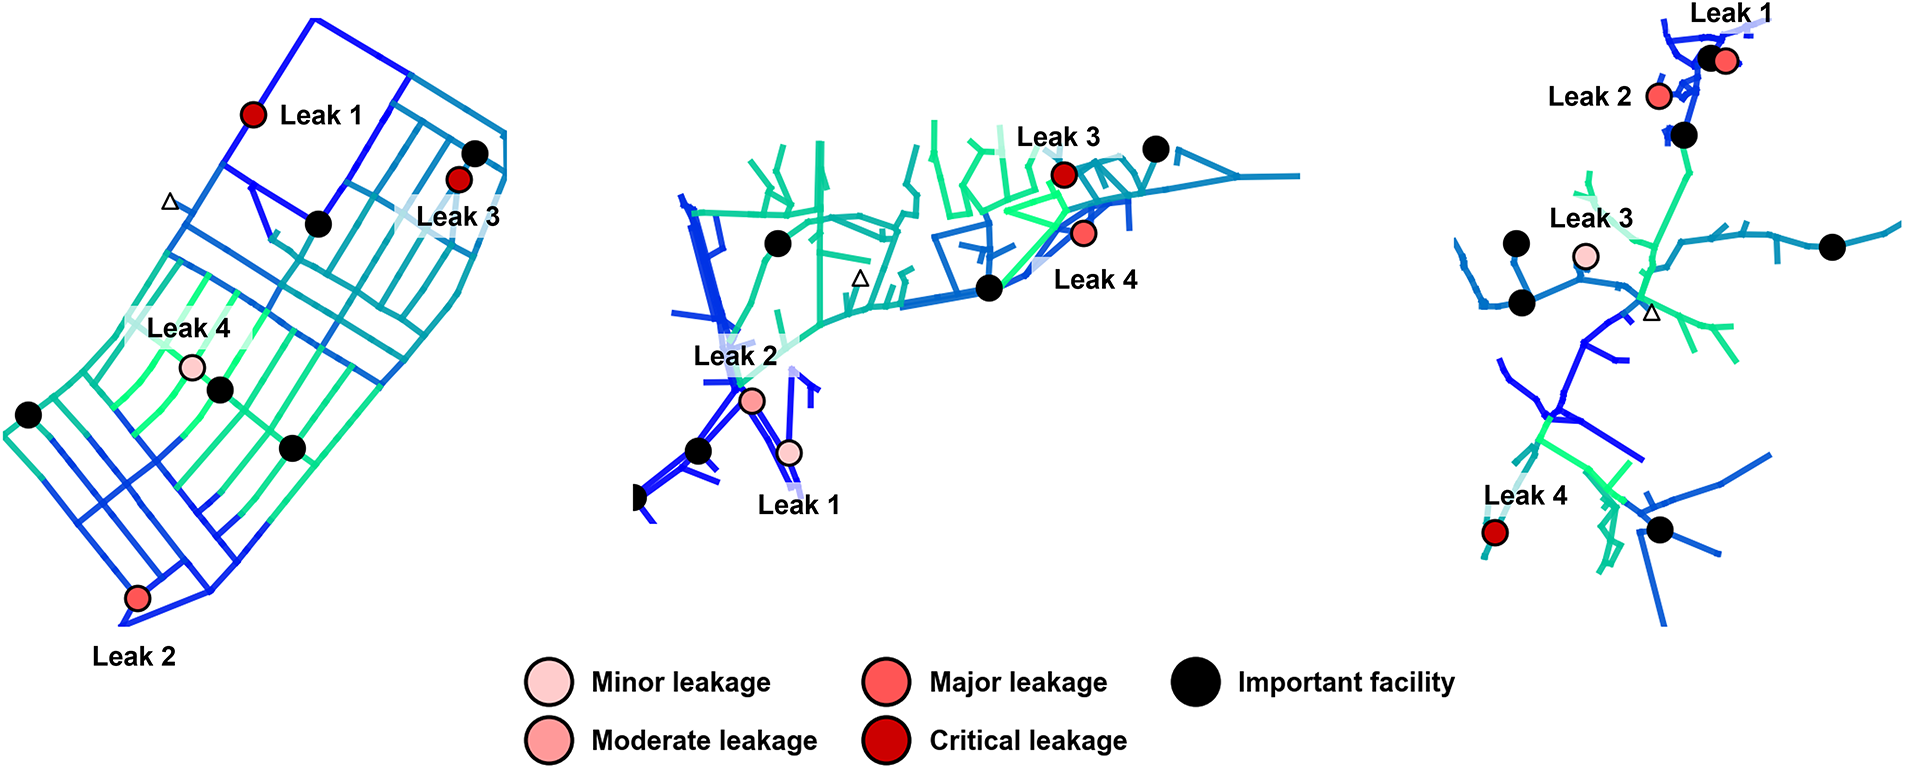
Figure 10: Spatial distribution of
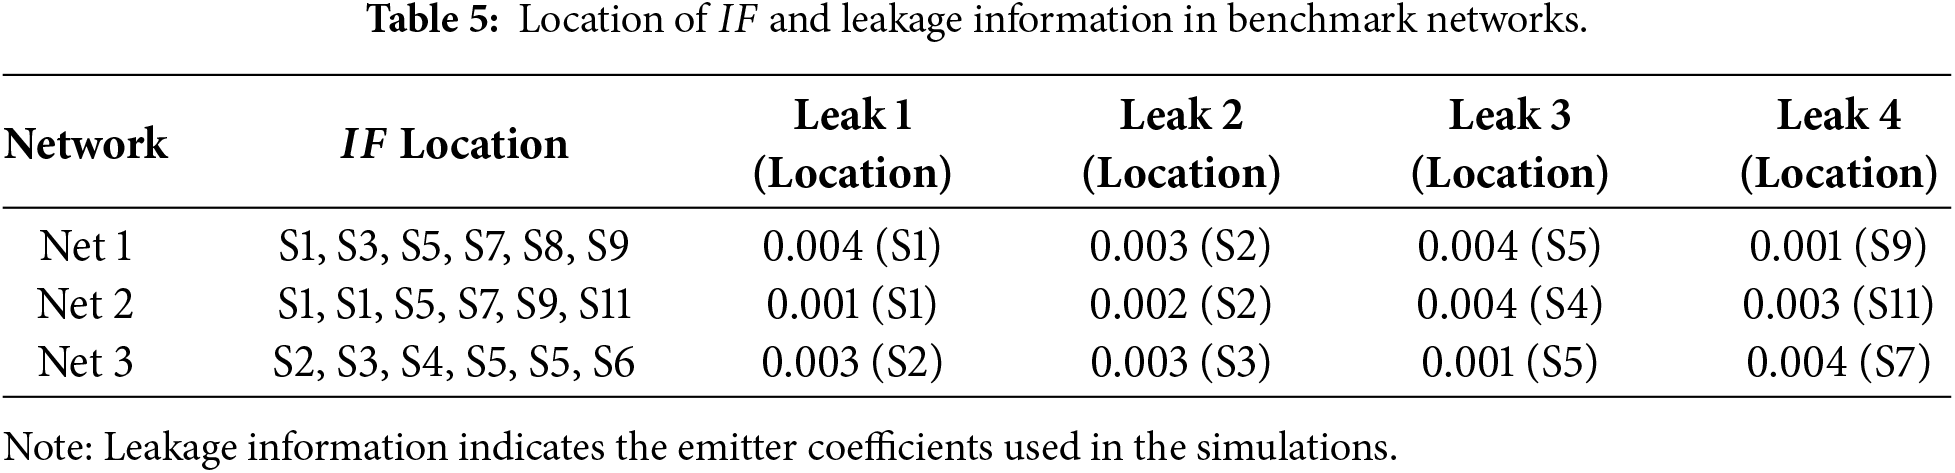
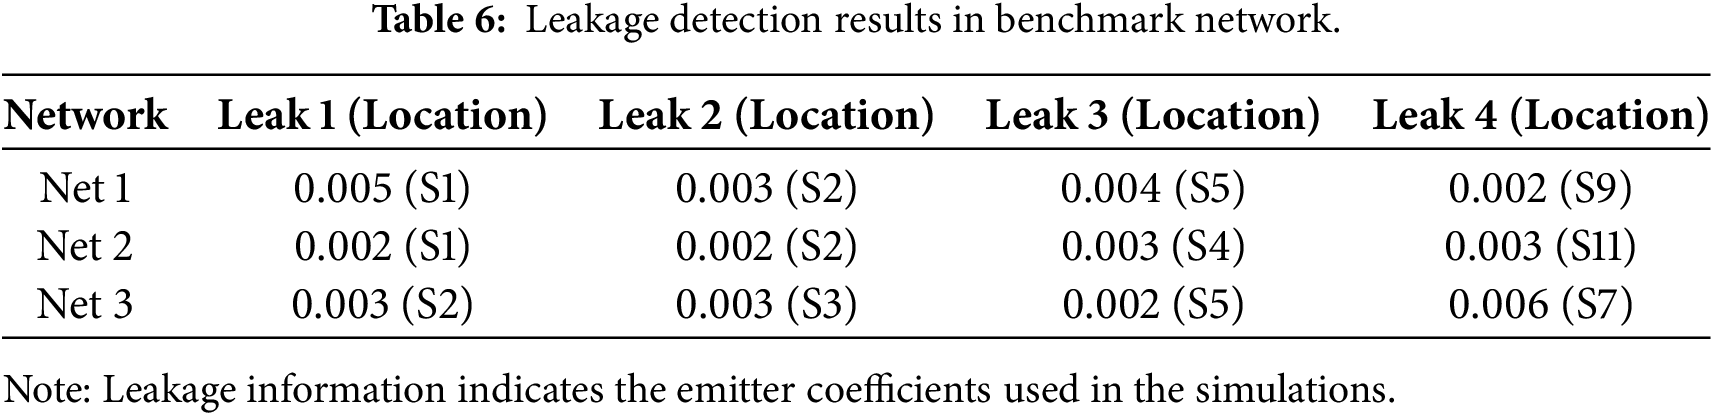
5.2.1 Scenario-Based Leakage Detection Results
To implement the restoration priority selection methodology, a scenario for each network was created and applied. In Net 1,
5.2.2 Results of Scenario-Based Determination of Leakage Restoration
Using the leakage detection results obtained in Section 5.2.1, each objective function was calculated, and non-dominated sorting was performed. The results are shown in Fig. 11. The restoration priorities that can be determined from the obtained Pareto front are presented in Table 7.
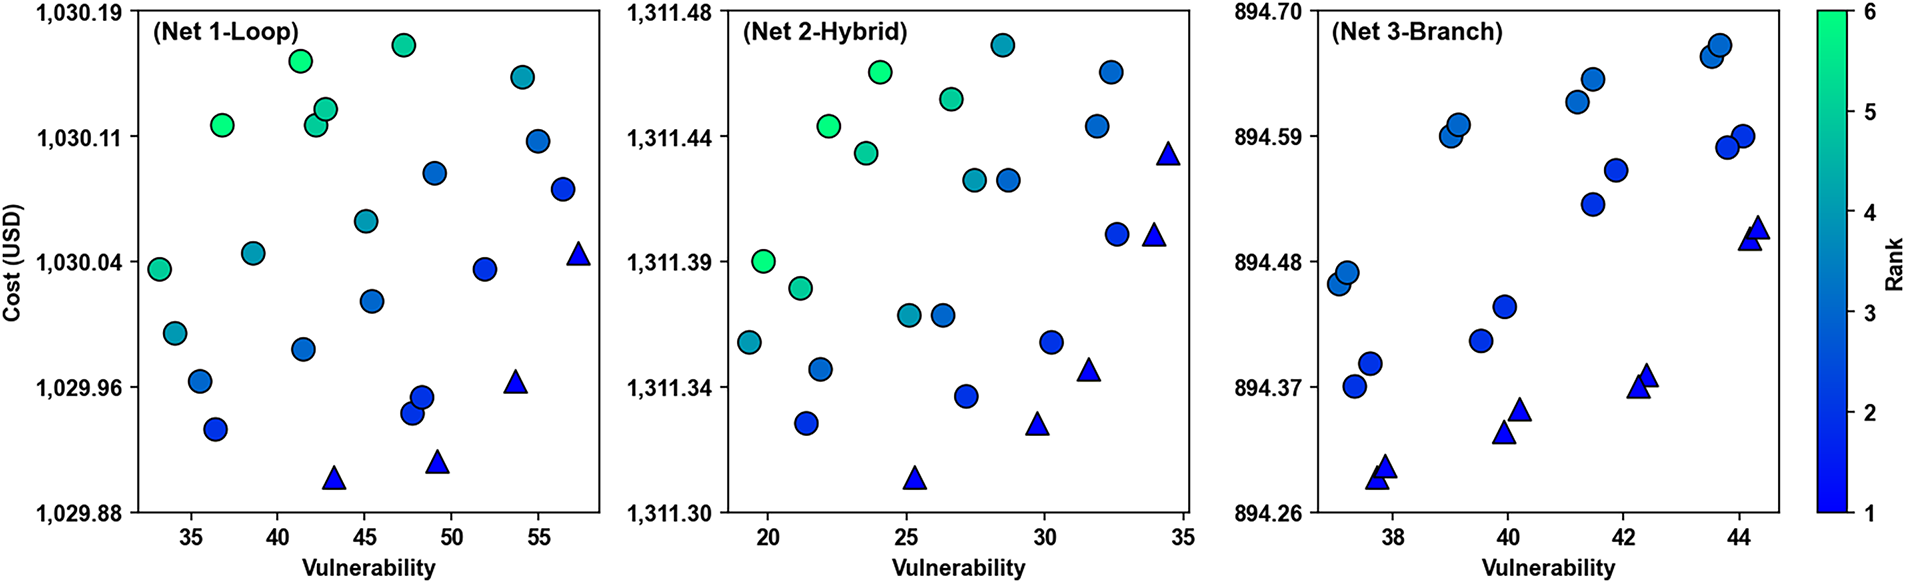
Figure 11: Comparison of pareto ranked leakage restoration solution in cost-vulnerability; triangle symbol: rank 1 solutions.
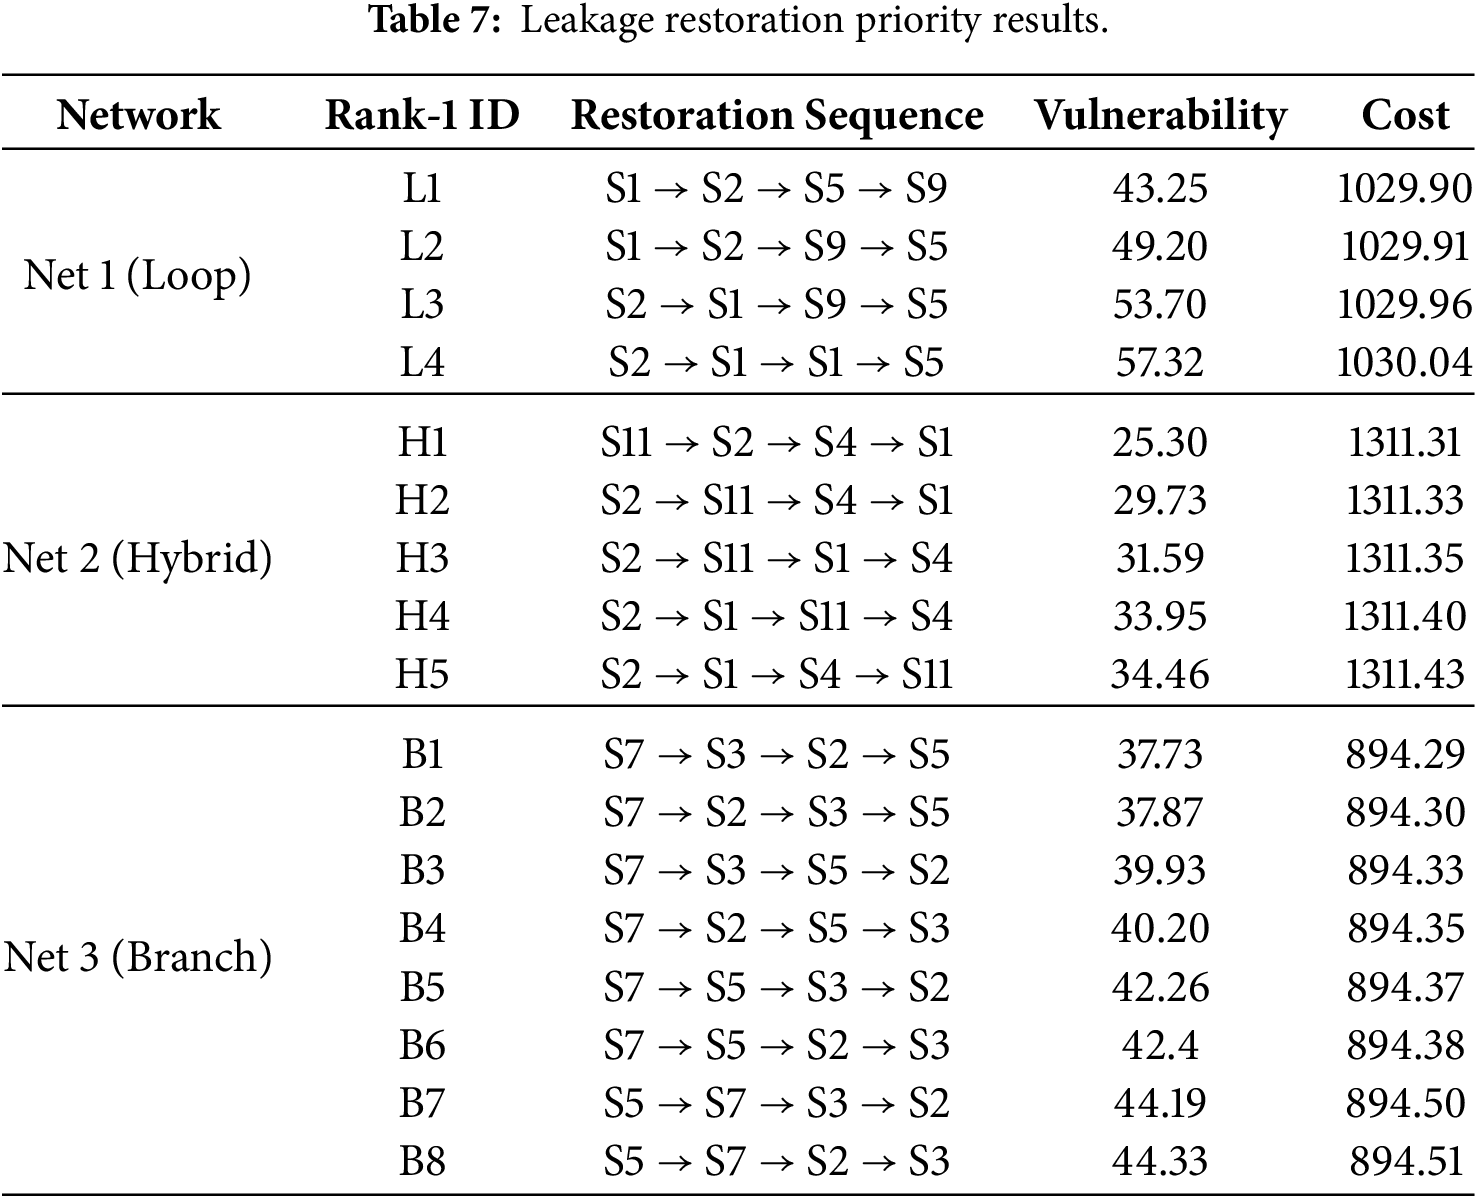
For Net 1, the total restoration cost ranges from a minimum of 1029.90 to a maximum of 1030.04, while the corresponding vulnerability values are distributed between 43.25 and 57.32. A total of four top-priority restoration alternatives are identified for Net 1. Although the vulnerability varies significantly depending on the repair sequence, the total restoration cost exhibits only limited variation within a narrow range. This cost distribution characteristic originates from the structural definition of the cost metric adopted in this study. The cost metric consists of a direct cost component based on the physical properties of the segments and an indirect cost component that increases in proportion to leakage magnitude and repair delay. Under the same leakage scenario, the set of segments to be restored remains identical; therefore, the direct cost component does not vary with the repair sequence. In contrast, the vulnerability metric is directly influenced by leakage magnitude. Vulnerability is defined to collectively reflect unmet demand due to service interruption, the number of critical facilities affected, and structural indicators related to network connectivity. When unintended isolation areas are formed, larger leakage magnitudes lead to a more rapid accumulation of service impacts within the affected areas. Consequently, even at similar cost levels, variations in the restoration timing of segments associated with larger leakage magnitudes result in discernible differences in vulnerability values. Owing to these characteristics, multiple repair sequences with comparable costs but different vulnerability levels emerge in Net 1 as equally valid restoration priority alternatives.
For Net 2, the total restoration cost ranges from 1311.31 to 1311.43, while vulnerability values are distributed between 25.30 and 34.46. In this case, a total of five top-priority restoration alternatives are identified. The narrow range of the cost distribution, similar to that observed for Net 1, results from the same cost function structure. By contrast, the vulnerability range is generally lower and exhibits a more limited spread than that of Net 1. This pattern can be interpreted as a consequence of the network structural characteristics considered in this scenario, together with the presence of alternative flow paths in certain sections, which leads to a relatively moderate expansion of unintended isolation areas. As a result, the amplification effect of leakage magnitude on vulnerability is more gradual than in Net 1, and the number of restoration priority alternatives is formed at an intermediate level.
For Net 3, the total restoration cost ranges from 894.29 to 894.51, while vulnerability values are distributed between 37.73 and 44.33. In this case, a total of eight top-priority restoration alternatives are identified, representing the largest number of restoration priority options among the three networks. In branch network structures, the isolation of a specific segment is more likely to directly lead to terminal disconnections, resulting in the formation of unintended isolation areas with a large spatial extent. Under such conditions, delays in restoring segments associated with larger leakage magnitudes cause a rapid accumulation of service impacts. Consequently, the dispersion of vulnerability values with respect to repair sequence is substantially increased, and multiple restoration priority alternatives simultaneously emerge despite only marginal differences in total restoration cost.
Overall, the restoration priorities derived in this study can be understood as the combined outcome of network structural characteristics and the distribution of leakage magnitudes. Network structure determines the formation mechanisms and spatial extent of unintended isolation areas, while leakage magnitude regulates the rate at which service impacts accumulate within these isolated areas. Through the interaction of these two factors, network-specific differences arise in the sensitivity of restoration outcomes to repair sequence and in the number of restoration priority alternatives. These findings indicate that both network structure and leakage magnitude should be jointly considered when formulating leakage restoration strategies.
Compared to studies that employ deep learning and reinforcement learning for optimal restoration sequencing [40,41], this approach leverages non-dominated sorting as a lightweight yet effective tool to evaluate the trade-off between restoration cost and segment vulnerability. This not only ensures computational efficiency and easier interpretability but also enhances the practical applicability for real-time decision-making in the field. In summary, this study demonstrates its strength in providing a quantifiable, fast, and resilience-centric framework for leakage restoration prioritization, addressing the limitations inherent in existing qualitative methods and more computationally intensive deep learning approaches.
This study developed a model capable of identifying the presence and scale of leakage in WDSs based on a hydraulic analysis model. The model quantitatively determines leakage scale and facilitates effective restoration actions when leakage occurs. In the detection of leakage location for restoration priority selection, the model exhibited an accuracy ranging from a maximum of 0.92 to a minimum of 0.905 and an F1 score ranging from 0.908 to 0.713 for single leakage scenarios. For multiple leakage location detection, the model achieved accuracies ranging from 0.908 to 0.812 and F1 scores ranging from 0.829 to 0.639. In determining the leakage scale, detection performance ranged from 0.382 to 0.079 for both single and multiple leakages. Additionally, the results of the restoration priority decisions provide users with quantitative information for decision-making by accurately determining the locations and leakage scale across multiple scenarios.
From an implementation and computational perspective, the proposed framework is designed to be practically feasible by separating offline model training from online decision-making. The GAT-based model is trained offline using simulated leakage scenarios, whereas the operational stage requires only a single forward inference using measured pressure data, followed by straightforward calculations for cost and vulnerability assessment and simple ranking to determine restoration priorities. Importantly, no additional hydraulic simulations or iterative optimization procedures are required during deployment. This modular structure significantly reduces computational overhead at the operational stage, enabling efficient application even for large-scale networks and multi-leakage scenarios, and supports its use as a practical decision-support tool for leakage restoration planning. As a result, the operational stage involves only lightweight matrix operations and ranking procedures, requiring minimal computational resources and enabling near real-time decision support.
It should be noted that the methodology used in this study involves uncertainties inherent in simulation-based data, which can affect the model’s accuracy when applied to empirical data. An important task for future research is to reduce these uncertainties. Given that the deep learning model provides predictions based on data, it is crucial to use ample and diverse training datasets. To enhance the accuracy of leakage detection, the model should be trained with a wider variety of data and scenarios, and its performance in detecting actual leakage situations should be continuously evaluated and refined. In particular, the introduction of dynamic learning methods that reflect real-time leakage situations in the field is expected to further improve model accuracy. Furthermore, future application of other algorithms, such as optimizing pressure meter locations for improved leakage detection could yield even higher performance.
The pressure data used in the current study were generated under simulated leakage scenarios, without accounting for pressure variations due to changes in nodal demand or measurement errors. Incorporating uncertainties such as measurement errors or demand fluctuations would allow the model to more closely mimic actual leakage conditions, thereby enhancing its practical applicability. Moreover, the current restoration cost functions are formulated based on design costs, with indirect costs approximated as 10% of the direct costs. Future work will aim to develop more robust cost functions by quantitatively evaluating factors such as the cost of labor, restoration routes, and the availability of other assets. Additionally, while the proposed framework currently applies equal weighting across various factors, adjusting these weights based on their relative importance, especially in scenarios where vulnerability must be translated into monetary value, could lead to a more efficient and realistic selection of restoration priorities. Furthermore, the integration of other artificial intelligence algorithms with the current GAT model or the use of ensemble learning methods may further enhance performance and provide more reliable results for restoration prioritization. Overall, these improvements will help ensure that the framework not only accurately detects leakages but also delivers robust and economically meaningful restoration decisions in real-world water distribution systems.
Additionally, this study considers a scenario where quadruple leakage occurs. With an increase in the number of simultaneous failures, the complexity of network interactions escalates nonlinearly. This not only poses challenges to leakage detection accuracy but also significantly impacts the restoration prioritization process. In such cases, the direct repair costs and indirect costs, along with the vulnerability metrics, may interact in complex ways, necessitating a recalibration of the objective functions (cost and vulnerability) to ensure that both are accurately converted into a common monetary unit. Future work will address these challenges by extending the simulations to scenarios with more than four simultaneous failures and by recalibrating the cost and vulnerability functions accordingly. Also, this study assumed that two sensors are evenly distributed per segment, but in future studies, examine sensor placement optimization strategies that reflect network characteristics and data quality to further improve the leakage detection performance and the effectiveness of the proposed framework.
In summary, this study demonstrates a quantifiable, fast, and resilience-centric framework for leakage detection and restoration prioritization in WDSs. Although the proposed methodology shows promising results under the tested conditions, further research is needed to address the challenges associated with more complex failure scenarios, to refine the cost and vulnerability metrics, and to optimize sensor placement for enhanced model performance and real-time decision-making.
Acknowledgement: This research was supported by the Korea Environmental Industry & Technology Institute (KEITI) through Water Management Program for Drought, funded by Korea Ministry of Environment (MOE) (RS-2023-00231944) and This work was supported by the research grant of the Gyeongsang National University in 2023.
Funding Statement: This research was supported by the Korea Environmental Industry & Technology Institute (KEITI) through Water Management Program for Drought, funded by Korea Ministry of Environment (MOE) (RS-2023-00231944) and This work was supported by the research grant of the Gyeongsang National University in 2023.
Author Contributions: Writing—original draft, Ryul Kim; Validation, Ryul Kim; Data curation, Ryul Kim; Conceptualization, Ryul Kim; Methodology, Ryul Kim and Young Hwan Choi; Visualization, Ryul Kim; Writing—review & editing, Young Hwan Choi; Supervision, Young Hwan Choi. All authors reviewed and approved the final version of the manuscript.
Availability of Data and Materials: The data that support the findings of this study are available from the Corresponding Author, Young Hwan Choi, upon reasonable request.
Ethics Approval: Not applicable.
Conflicts of Interest: The authors declare no conflicts of interest.
References
1. Basnet L, Brill D, Ranjithan R, Mahinthakumar K. Supervised machine learning approaches for leak localization in water distribution systems: impact of complexities of leak characteristics. J Water Resour Plan Manag. 2023;149(8):04023032. doi:10.1061/jwrmd5.wreng-6047. [Google Scholar] [CrossRef]
2. Romero-Ben L, Alves D, Blesa J, Cembrano G, Puig V, Duviella E. Leak detection and localization in water distribution networks: review and perspective. Annu Rev Control. 2023;55(4):392–419. doi:10.1016/j.arcontrol.2023.03.012. [Google Scholar] [CrossRef]
3. Daniel I, Pesantez J, Letzgus S, Ali Khaksar Fasaee M, Alghamdi F, Berglund E, et al. A sequential pressure-based algorithm for data-driven leakage identification and model-based localization in water distribution networks. J Water Resour Plan Manag. 2022;148(6):04022025. doi:10.1061/(asce)wr.1943-5452.0001535. [Google Scholar] [CrossRef]
4. Marvin G, Grbčić L, Družeta S, Kranjčević L. Water distribution network leak localization with histogram-based gradient boosting. J Hydroinf. 2023;25(3):663–84. doi:10.2166/hydro.2023.102. [Google Scholar] [CrossRef]
5. Tyagi V, Pandey P, Jain S, Ramachandran P. A two-stage model for data-driven leakage detection and localization in water distribution networks. Water. 2023;15(15):2710. doi:10.3390/w15152710. [Google Scholar] [CrossRef]
6. Zanfei A, Menapace A, Brentan BM, Righetti M, Herrera M. Novel approach for burst detection in water distribution systems based on graph neural networks. Sustain Cities Soc. 2022;86:104090. doi:10.1016/j.scs.2022.104090. [Google Scholar] [CrossRef]
7. Jun S, Lansey KE. Convolutional neural network for burst detection in smart water distribution systems. Water Resour Manag. 2023;37(9):3729–43. doi:10.1007/s11269-023-03524-x. [Google Scholar] [CrossRef]
8. Wan X, Farmani R, Keedwell E. Real-time gradual leakage detection system for water distribution networks based on MIMO-ANN. In: Proceedings of the he 25th EGU General Assembly; 2023 Apr 23–28; Vienna, Austria. [Google Scholar]
9. Choi YH, Jung D, Jun H, Kim JH. Improving water distribution systems robustness through optimal valve installation. Water. 2018;10(9):1223. doi:10.3390/w10091223. [Google Scholar] [CrossRef]
10. Tornyeviadzi HM, Seidu R. Leakage detection in water distribution networks via 1D CNN deep autoencoder for multivariate SCADA data. Eng Appl Artif Intell. 2023;122:106062. doi:10.1016/j.engappai.2023.106062. [Google Scholar] [CrossRef]
11. Choi J, Jeong G, Kang D. Multiple leak detection in water distribution networks following seismic damage. Sustainability. 2021;13(15):8306. doi:10.3390/su13158306. [Google Scholar] [CrossRef]
12. Yoo D, Kang D, Jun H, Kim J. Rehabilitation priority determination of water pipes based on hydraulic importance. Water. 2014;6(12):3864–87. doi:10.3390/w6123864. [Google Scholar] [CrossRef]
13. Sophocleous S, Nikoloudi E. Simulation-based framework for the restoration of earthquake-damaged water distribution networks using a genetic algorithm. In: Proceedings of the WDSA/CCWI Joint Conference; 2018 Jul 23–25; Kingston, ON, Canada. [Google Scholar]
14. Veličković P, Cucurull G, Casanova A, Romero A, Liò P, Bengio Y. Graph attention networks. arXiv:1710.10903. 2017. [Google Scholar]
15. Zhang R, Fares A, Tijani IA, Zayed T, Jin Z, Yussif AM. Acoustic based leak location detection for water supply pipelines in urban areas via multi-task deep learning. Eng Appl Artif Intell. 2026;163:112718. doi:10.1016/j.engappai.2025.112718. [Google Scholar] [CrossRef]
16. Maas AL, Hannun AY, Ng AY. Rectifier nonlinearities improve neural network acoustic models. In: Proceedings of the 30th International Conference on Machine Learning; 2013 Jun 16–21; Atlanta, GA, USA. p. 3. [Google Scholar]
17. Loshchilov I, Hutter F. Decoupled weight decay regularization. arXiv:1711.05101. 2017. [Google Scholar]
18. Kim R, Kwon HG, Choi YH. Determination of a priority for leakage restoration considering the scale of damage in for water distribution systems. J Korea Water Resour Assoc. 2023;56(10):679–90. (In Korean). [Google Scholar]
19. Klise K, Murray R, Haxton T. An overview of the water network tool for resilience (WNTR). In: Proceedings of the 1st International WDSA/CCWI Joint Conference; 2018 Jul 23–25; Kingston, ON, Canada. [Google Scholar]
20. AWWA (American Water Works Association). Water audits and loss control programs. Washington, DC, USA: AWWA; 2008 [cited 2026 Feb 22]. Available from: https://www.awwa.org/. [Google Scholar]
21. Berglund A, Areti VS, Brill D, Mahinthakumar GK. Successive linear approximation methods for leak detection in water distribution systems. J Water Resour Plan Manag. 2017;143(8):04017042. doi:10.1061/(asce)wr.1943-5452.0000784. [Google Scholar] [CrossRef]
22. Rossman L, Woo H, Tryby M, Shang F, Janke R, Haxton T. EPANET 2.2 user manual. Cincinnati, OH, USA: U.S. Environmental Protection Agency; 2020. [Google Scholar]
23. Gupta R, Bhave PR. Comparison of methods for predicting deficient-network performance. J Water Resour Plan Manag. 1996;122(3):214–7. doi:10.1061/(asce)0733-9496(1996)122:3(124). [Google Scholar] [CrossRef]
24. K-water. Water facilities construction cost estimation report. Seoul, Republic of Korea: Korea Water Resources Associatio; 2009. [Google Scholar]
25. Jun H, Loganathan GV. Valve-controlled segments in water distribution systems. J Water Resour Plan Manag. 2007;133(2):145–55. doi:10.1061/(asce)0733-9496(2007)133:2(145). [Google Scholar] [CrossRef]
26. Choi YH, Kim JH. Topological and mechanical redundancy-based optimal design of water distribution systems in many-objective optimization. Eng Optim. 2020;52(11):1974–91. doi:10.1080/0305215X.2019.1688798. [Google Scholar] [CrossRef]
27. Hwang H, Lansey K. Water distribution system classification using system characteristics and graph-theory metrics. J Water Resour Plan Manag. 2017;143(12):04017071. doi:10.1061/(asce)wr.1943-5452.0000850. [Google Scholar] [CrossRef]
28. Ko MJ, Choi YH. Optimal design of water distribution systems considering topological characteristics and residual chlorine concentration. Mathematics. 2022;10(24):4721. doi:10.3390/math10244721. [Google Scholar] [CrossRef]
29. Hu Z, Chen W, Chen B, Tan D, Zhang Y, Shen D. Robust hierarchical sensor optimization placement method for leak detection in water distribution system. Water Resour Manag. 2021;35(12):3995–4008. doi:10.1007/s11269-021-02922-3. [Google Scholar] [CrossRef]
30. Kim R, Choi YH. The development of a data-based leakage pinpoint detection technique for water distribution systems. Mathematics. 2023;11(9):2136. doi:10.3390/math11092136. [Google Scholar] [CrossRef]
31. Oh J, Jun S, Jung D. Minimization of leak detection overlaps using sensitivity matrix-based optimal meter placement in water distribution networks. J Water Resour Plan Manag. 2025;151(12):04025066. doi:10.1061/jwrmd5.wreng-7067. [Google Scholar] [CrossRef]
32. Parajuli U, Magar BA, Ghimire AB, Shin S. Sensor placement for the classification of multiple failure types in urban water distribution networks. Urban Sci. 2025;9(10):413. doi:10.3390/urbansci9100413. [Google Scholar] [CrossRef]
33. Wu Z, Li Z, Li Y, Yan H, Tao T, Xin K. Multi-objective optimization of pressure sensor placement for leakage location and network calibration. J Hydroinf. 2025;27(10):1579–99. doi:10.2166/hydro.2025.067. [Google Scholar] [CrossRef]
34. Rodriguez L, Fernandez C, Pantano N, Scaglia G, Keesman KJ. Optimizing sensor placement for enhanced observability in water distribution networks. J Hydroinf. 2025;27(6):946–59. doi:10.2166/hydro.2025.279. [Google Scholar] [CrossRef]
35. Fujiwara O, Khang DB. A two-phase decomposition method for optimal design of looped water distribution networks. Water Resour Res. 1990;26(4):539–49. doi:10.1029/WR026i004p00539. [Google Scholar] [CrossRef]
36. Jun S, Choi YH. Data generation approaches to detect abnormal conditions in water distribution systems. J Korean Soc Hazard Mitig. 2022;22(2):69–79. (In Korean). doi:10.9798/kosham.2022.22.2.69. [Google Scholar] [CrossRef]
37. Chan TK, Chin CS, Zhong X. Review of current technologies and proposed intelligent methodologies for water distributed network leakage detection. IEEE Access. 2018;6:78846–67. doi:10.1109/ACCESS.2018.2885444. [Google Scholar] [CrossRef]
38. Zhang X, Shi J, Yang M, Huang X, Usmani AS, Chen G, et al. Real-time pipeline leak detection and localization using an attention-based LSTM approach. Process Saf Environ Prot. 2023;174:460–72. doi:10.1016/j.psep.2023.04.020. [Google Scholar] [CrossRef]
39. Bonilla CA, Brentan B, Montalvo I, Ayala-Cabrera D, Izquierdo J. Assessing the impacts of failures on monitoring systems in real-time data-driven state estimation models using GCN-LSTM for water distribution networks. Water. 2025;17(1):46. doi:10.3390/w17010046. [Google Scholar] [CrossRef]
40. Assad A, Bouferguene A. Resilience assessment of water distribution networks-bibliometric analysis and systematic review. J Hydrol. 2022;607:127522. doi:10.1016/j.jhydrol.2022.127522. [Google Scholar] [CrossRef]
41. Fan X, Zhang X, Yu X. A graph convolution network-deep reinforcement learning model for resilient water distribution network repair decisions. Comput Aided Civ Infrastruct Eng. 2022;37(12):1547–65. doi:10.1111/mice.12813. [Google Scholar] [CrossRef]
Cite This Article
 Copyright © 2026 The Author(s). Published by Tech Science Press.
This work is licensed under a Creative Commons Attribution 4.0 International License , which permits unrestricted use, distribution, and reproduction in any medium, provided the original work is properly cited.
 Downloads
 Citation Tools