
 Submit a Paper
 Propose a Special lssue
 Open Access
ARTICLE

Numerical Study of Burden Effects on Rock Breakage in Single-Hole Bench Blasting
Oulu Mining School, University of Oulu, Oulu, Finland
* Corresponding Author: Kai Rong. Email:
Computer Modeling in Engineering & Sciences 2026, 146(3), 15 https://doi.org/10.32604/cmes.2026.078415
Received 30 December 2025; Accepted 04 February 2026; Issue published 30 March 2026
 View Full Text
 Download PDF
Abstract
Burden is one of the main parameters in blast design. However, field tests, either single- or multi-hole blasts, used to determine an appropriate burden, are difficult to capture crack propagation, evolution of breakage angle, and the mechanism governing these processes in the rock. In this study, a single-hole bench blasting model is developed using LS-DYNA software to comprehensively investigate the relationship between burden and rock breakage. The simulation results show that the breakage angle decreases with the increase in burden, and the blasted volume reaches a peak value with a burden of 4 m. Meanwhile, backbreak distance increases with increasing burden. The optimum burden in this simulation is found to be 4.0 m, as the ratio of burden to blasthole diameter is equal to 20.62 and the ratio of burden to bench height is 0.44, based on a comprehensive analysis of the blasted volume, average damage, and total damage. Under the optimum burden condition, tensile stress wave regions are simultaneously generated at the free surfaces of both the bench top and bench slope, allowing more effective utilization of the two free surfaces and resulting in a more uniform damage distribution within the burden region.Keywords
Drilling and blasting are the primary methods for hard rock excavation in rock and mining engineering. Results of rock blasting are usually influenced by many factors, such as burden, spacing, stemming, delay time, powder factor, and so on. Among them, burden, defined as the distance between a blasthole and the nearest free face approximately parallel to the blasthole, is one of the main parameters in blast design.
As a key parameter in rock blasting, burden significantly influences blast consequence, such as rock fragmentation [1–3], excavation volume [4], vibration [5,6], flyrock [7], etc. Bilgin [8] conducted a full-scale single-hole blast test in a magnetite mine. Good fragmentation and acceptable toe conditions were achieved when the burden was 4.3 m, corresponding to 22 times the blasthole diameter and 0.47 times the bench height. A single-hole blast test was conducted at the Storugns limestone quarry on Gotland by Rustan and Nie [9] to investigate the rock breakage properties. Both the breakage angle and mean fragment size have good correlation with burden, which is direct evidence that burden has a significant impact on production efficiency. Bhandari [10] conducted laboratory-scale blast tests using a single-hole charge with a blasthole diameter of 6.4 mm in cement-mortar and granite blocks. The test results show that the total mass of broken material at very small burdens is only about 40% of that under an optimum burden. Peng et al. [11] used an electric initiation system combined with a high-speed camera to carry out model tests, which show that the short axis, perimeter, and volume of the crater-shaped fractured zone tend to first increase, then decrease with the increase of burden. In addition, breakage angle was reported to be between 90°–160° with the change in burden [12–14]. When the burden increased from 6 to 43 mm, the breakage angle decreased from 150° to 125° [15]. If the breakage angle was 120°, the best ratio of spacing to burden was two, concerning rock fragmentation in blasting, according to the stress wave analysis [16]. In brief, burden and breakage angle directly influence blast results such as rock fragmentation and excavation.
Moreover, under different burdens, the maximum distances of flyrocks may be different. The relationship between burden and flyrocks was investigated by using dimensional analysis based on 150 blast events [7]. The result showed that the burden is one of the key factors in flyrock prediction models. A model based on the Gurney formula is used to calculate the flyrock range, which is proposed by Roth [17]. The model indicates that the minimum burden is one of the important factors to define the maximum flyrock range for a given explosive shot in a given rock. Compared with the consensus regarding how burden affects fragmentation, breakage angle, and flyrock distance, its effect on vibration remains contentious. Konya and Walter [4] proposed that excessive burden caused over confinement to the blasthole, which would result in a high level of ground vibrations. Murmu et al. [5] shared the same view after incorporating burden into peak particle velocity (PPV) prediction formulas to analyze 637 groups of blast vibration data from ten project sites. However, Blair and Armstrong [6] and Brent et al. [18], based on previous work and field test results, found no convincing evidence that burden influences blast vibration. According to the above studies, understanding how the burden affects blasting outcomes is crucial for improving overall productivity, optimizing rock fragmentation, and ensuring operational safety in mining operations.
Since the 1950s, many empirical formulas for burden design have been developed [19–23]. For example, Anderson [19] proposed an empirical equation for burden calculation in 1952 by considering blasthole diameter and bench height. Subsequently, additional parameters such as explosive and rock properties were considered in burden design. Konya [24] combined charge diameter with the specific gravities of explosive and rock in burden design. Praillet [25] considered the velocity of detonation (VOD) and the compressive strength of rock as key factors in burden design. In addition, based on stress wave propagation principles, a burden design method was proposed by Berta [26] in 1985, considering key factors such as explosive coupling, impedances of both rock and explosive, and rock breakage. Although some of the parameters were still determined empirically, the method provides a theoretical framework that accounts for the most important parameters in burden calculation. Then, Kou and Rustan [21] introduced a concept related to energy, including the energy required for forming two main cracks that define the breakage angle, as well as the energy consumed during rock fragmentation and movement. Based on this concept, some empirical formulas for burden calculation were proposed. This approach possesses a stronger theoretical foundation than other earlier burden calculation methods. After then, Zhang [16] introduced theoretical methods to determine the burden in surface control and the burden in mining production blasting by means of stress wave theory, and he found that the theoretical method yielded results consistent with the blast results from small-scale blasts by Bergmann et al. [27] and full-scale blasts by Olsson et al. [28], showing that smaller burden gave rise to better or finer fragmentation.
There is an optimum burden, which results in a larger excavation volume and/or better fragmentation. The propagation of the compressive wave generated by blasting and the tensile wave reflected from the free surface is the main reason for rock breakage and fragmentation formation [16,29]. The high amplitude of the compressive wave near the blasthole causes tangential tensile stress, leading to radial cracks [30,31]. After the compressive wave arrives at the free surface, it is reflected into the tensile wave. It is this tensile wave that causes spalling near the free surface due to the low tensile strength of rock [12,32]. The change in burden determines the amplitude attenuation and wavelength variation of the stress wave, thereby affecting the excavation volume and fragmentation of the blasting operation [33]. Unlike field or laboratory tests, numerical simulation methods can capture the propagation of stress waves and the development of cracks within the rock mass, providing a powerful tool for studying the formation of breakage angle and rock damage under different burdens. Saadatmand Hashemi and Katsabanis [34] determined the optimum burden based on the numerical simulation, which showed that the damage distribution of 80- and 100-mm burdens was more favorable, since the tensile cracks, formed after the wave reflection, were distributed well across the influence zone. Tao et al. [35] found that with the increase in burden, the energy density decreased, the cascade crack branching associated with damage was inhibited, increasing the potential for the formation of large fragments.
Several constitutive models have been used for rock blasting simulation, such as the Holmquist-Johnson-Cook model (HJC) [36–40], the Continuous Surface Cap Model (CSCM) [35], the Riedel-Hiermaier-Thoma model (RHT) [41–45], and the Taylor-Chen-Kuszmaul (TCK) [46]. For example, Liu et al. [39] proposed a modified HJC model to simulate rock blasting. The results show that the tensile crack can be simulated appropriately. Wang et al. [36] simulated cyclic rock blasting by using HJC and RHT models, showing that the RHT model can reveal the actual response of rock under cyclic blasting. Compared with the HJC, CSCM, and TCK model, the RHT model can better simulate strain effect, plastic hardening, and damage softening behaviour of rock under blast loading [43,44,47].
In summary, burden is one of the key parameters in rock blasting and has been widely studied. However, its influence on rock breakage remains unclear, mainly due to limitations of experimental techniques that make it difficult to capture the complete process from explosive detonation to rock breakage with different burdens. Therefore, this study employs numerical simulation to investigate the effect of burden on rock breakage and to track the evolution of stress and damage within the rock mass, thereby providing a basis for rational burden determination. Considering the complexity of multi-hole blasting, numerical simulation of a single-hole blasting was employed in this study to better understand the underlying mechanism of rock breakage under different burdens. The simulation was performed using LS-DYNA to investigate the relationship between burden and rock breakage. The simulation model was established and validated according to the single-hole field blasts conducted at a large open pit iron mine [8]. The crack morphology, crack propagation process, and the relationships between burden and breakage angle, blasted volume, and backbreak were examined. The propagation process of stress waves under different burdens was analyzed. In addition, the optimum burden was determined, and the time relationship between stress wave and damage initiation was discussed.
2 Numerical Model and Calibration
A single-hole bench blasting model was established according to the full-scale field test [8], as shown in Fig. 1. Dimensions of the model were selected in accordance with the real bench blast design. The bench height (H) is 9 m, and the subdrilling depth is 1.5 m. The blasthole diameter (d) is 194 mm. In a 10.5 m length of blasthole, the stemming length is 4.5 m, and the charge length is 6.0 m. The explosive is initiated at the bottom of the blasthole. At the toe position of the bench, a 4.5 m depth and 2 m long rock mass is considered to simulate the bottom constraint in the field test. Assuming a breakage angle of 120° [16] for a burden of 5.5 m, the theoretical model width can be calculated as 19 m. Therefore, the width of the model is 19.2 m and the blasthole is drilled at the middle in the width dimension. The six burdens (B), ranging from 3.0 to 5.5 m in 0.5 m increments, are used in the single-hole bench blasting simulation. To make the boundary conditions of the simulation model close to those in the field test, the free surface is set on three planes, i.e., the surface of the bench top, the bench slope, and a horizontal surface at the toe position. Except for these three planes, a non-reflecting boundary is applied to the remaining surfaces. The total computation time is 15 ms in this study, which is enough for the damage formation and propagation. After which, the damage in the model remains essentially unchanged.
Figure 1: Numerical simulation model.
The fluid-solid interaction method is used in the model establishment. The rock mass and stemming are established by the Lagrangian algorithm, while the air and explosive are established by the Arbitrary-Euler (ALE) algorithm. The two types of materials are coupled with the keyword *CONSTRAINED_LAGRANGE_IN_SOLID. Considering the computational efficiency of the model, the rock mass is meshed with a size of 8 cm × 8 cm × 15 cm, with a total of 3.5 million fluid and solid elements. To investigate the dynamic behavior of rock under blasting load, the RHT model [47] that can capture strain effect, plastic hardening, and damage softening is selected. The material is in the elastic stage before its pressure reaches the yield surface, and the plastic strain will accumulate continuously. The normalized effective plastic strain is used to calculate the damage (D) in the RHT model. D ranges from 0 to 1, where D = 0 represents an undamaged material, and D = 1 indicates a fully damaged state, characterized macroscopically by fragmentation or complete disintegration. The cumulative plastic strains initially result in hardening of the material strength reaching the failure surface, followed by damage-softening with a gradual decrease to the residual surface, as shown in Fig. 2. These three strength surfaces characterize rock failure, governing its progression from elasticity through yielding to complete damage. σ* is the normalized strength, and P* is the normalized pressure, which can be obtained by the triaxial compressive test. The mechanical properties of rock are listed in Table 1 according to [8].
Figure 2: Strength surface of RHT.
In the field, due to the heterogeneity and geological structures within the rock mass, the actual compressive strength of the rock mass is much lower than that of intact rock. However, the field tests [8] do not provide any information on joint distribution; therefore, there is no basis for incorporating joints into a numerical simulation model. To account for this degradation effect on rock mass quality, a reduction in compressive strength of rock is adopted. The compressive strength of rock mass can be estimated by Eq. (1) [48]:
where σcj is the actual compressive strength of rock mass in MPa, γ is the density of the rock in g/cm3, Q is the quality index of rock, and σci is the compressive strength of intact rock in MPa. Based on the in-situ rock conditions, the value of Q is set to 1 in this study, indicating poor-quality rock according to the rock mass classification system [49]. Therefore, the compressive strength of rock in the numerical model is set as 17.3 MPa. In addition, the stemming is modeled by the keyword *MAT_SOIL_AND_FOAM in LS-DYNA. The density, Young’s modulus, and Poisson’s ratio of the stemming material are 1800 kg/m3, 172 MPa, and 0.25, respectively [50].
The detonation of an explosive is a rapid chemical reaction process. After detonation is initiated, the detonation wave begins to propagate from the initiation point to the unreacted explosive, producing high-energy products, which lead to high pressure and temperature in the blasthole [16]. This high-energy product acts on the blasthole and becomes the source of stress waves propagating in the rock mass. Specifically, after the detonation front, the chemical reaction zone is followed. The highest-pressure value occurs at the front of the reaction zone, which is called the von Neumann spike. The Champman-Jouguet (CJ) pressure appears at the end of the reaction zone [51]. Normally, the von Neumann spike is ignored due to its narrow width and rapid attenuation [16,52]. Based on the one-dimensional detonation theory, CJ pressure is one of the most important parameters for explosive detonation in a blasthole [16]. The Jones-Wilkins-Lee (JWL) equation of state (EoS) is used to calculate the CJ pressure in LS-DYNA, as shown in Eq. (2).
where P is pressure, A, B, R1, R2, and ω are material constants. E0 is the detonation energy per unit volume, while V is the relative volume. The type of explosive used in this study is ANFO, one of the most commonly used explosives in production blasting. The density of the charge explosive is 1000 kg/m3 according to the charging weight and volume in the field test [8]. The detonation velocity of the explosive and CJ pressure are 4740 m/s and 6.14 GPa, respectively [53]. In this study, the material constants of ANFO are as follows [54]: A is 145 GPa, B is 1.99 GPa, R1 is 5.01, R2 is 1.03, and ω is 0.33. The E0 is 4.27 kJ/cm3.
The keyword *MAT_NULL and the EoS of linear polynomial are adopted to represent the state of the air. The pressure of air can be calculated by Eq. (3) [55]:
where Ea is the initial internal energy per unit volume. C0–C6 are the polynomial equation coefficients, where C4 = C5 = γ − 1, and the remaining coefficient is zero. γ is the ratio of specific heats. μ is the compression of air, which calculated by μ = ρac/ρ0 − 1, ρac is the current density of air, ρ0 is the reference density. The parameter values of air is followed: ρ0 is 1.29 kg/m3, Ea is 2.50 × 10⁵ J/m3, and γ is 1.40.
2.2 Validation of Numerical Simulation Models
In numerical simulation, the actual blasthole pressure will be influenced by element size [41]. The JWL EoS is used to model the pressure of detonation products in LS-DYNA. Although the blasthole pressure can theoretically reach the CJ pressure, achieving this requires sufficiently fine mesh, which substantially increases the computational cost of the model. In previous studies on field-scale bench blasting simulation, the blasthole pressure is often between 2 and 3 GPa with an appropriate computational scale [34,56,57]. In this study, the size of the ALE element is set to 2.5 cm × 2.5 cm × 15 cm, with the dimension of 15 cm in the bench height direction. After the detonation is completed, the pressure–time histories of different elements along the blasthole wall in the vertical direction were extracted, and the peak pressures of these elements were averaged. Fig. 3 shows the pressure–time histories of elements located at the bottom, middle, and top of the blasthole wall, respectively. The average blasthole pressure at these three positions is 2.63 GPa, which is acceptable for field-scale rock blasting simulation.
Figure 3: Pressure–time histories of elements along the blasthole wall.
All the simulation models have the same dimensions and differ only in the burden value. After the simulation was completed, a horizontal cross section is taken at the mid-height of the charge column, measured above the bench floor for simulation results measurement. The breakage angle, blasted volume, and backbreak are measured based on equivalent relationships between damage and macroscopic cracks. According to the discussion in Appendix A and the empirical value presented by Yi et al. [58], a macroscopic crack is assumed to form when the damage of an element reaches 0.6. The simulation results are given in Table 2.
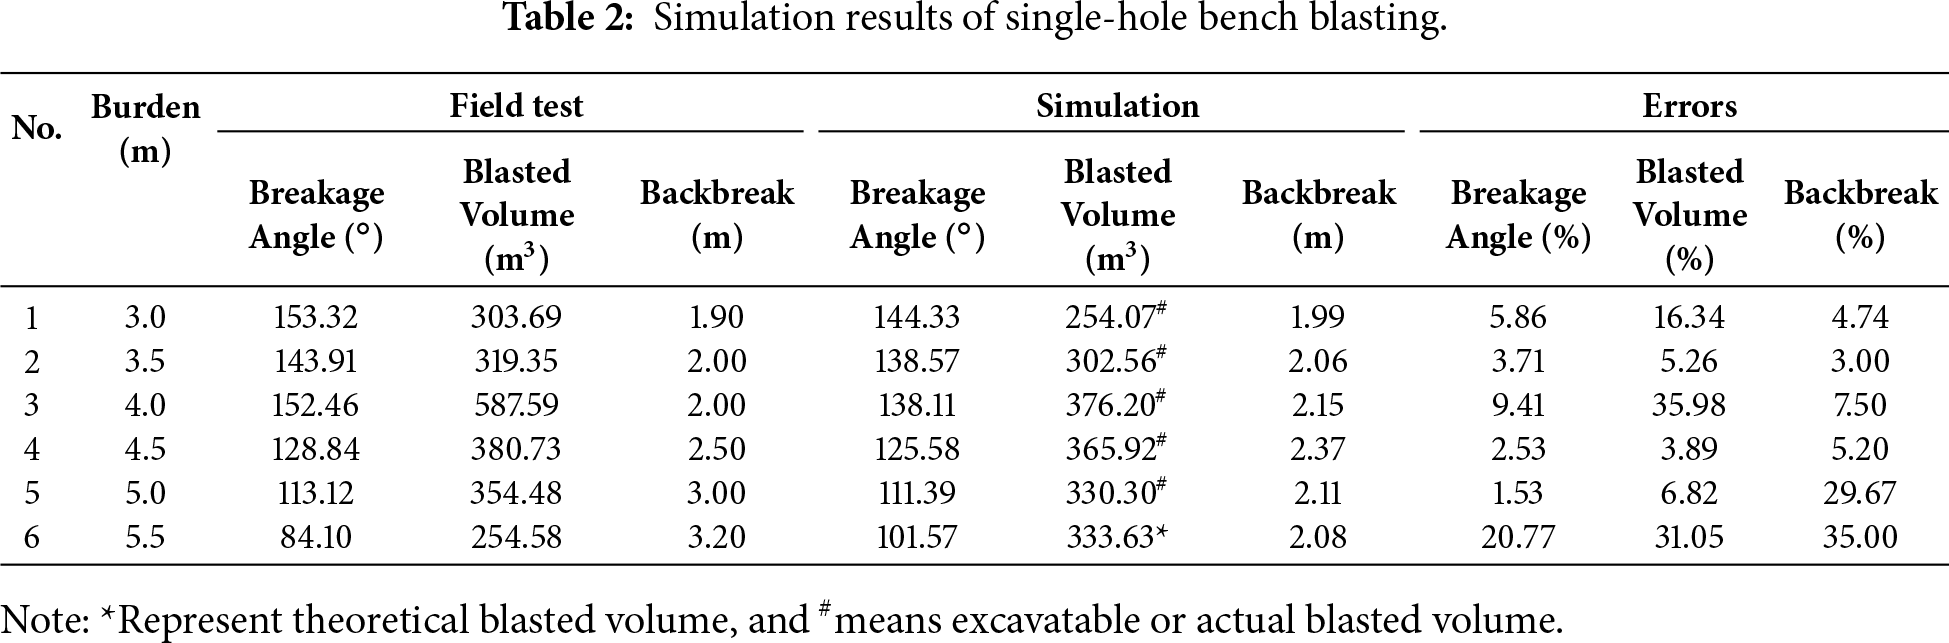
In the field test [8], when the burden was 4.0 m, the blast was conducted in very weak and intensely altered hematite, so the blast results were abnormal, especially in terms of breakage angle and blasted volume. The average relative error between simulation results and the field test results is 12.68%, showing acceptable consistency. Specifically, the average relative errors of the breakage angle, blasted volume, and backbreak are 7.30%, 16.56%, and 14.18%, respectively, as shown in Fig. 4. Since the model is sufficiently large parallel to the free surface, the breakage angle is simulated accurately. It should be noted that simulation results with relative errors exceeding 20% are due to the settings of the numerical simulation or variations in the rock mass quality during the field tests. For burdens greater than 5.0 m, the simulation showed a significant decrease in backbreak, which leads to relative errors of more than 29%. This is because, to improve computational efficiency, models with different burdens are established with identical dimensions along the burden direction (i.e., the x-direction in Fig. 1). When the burden is large, the dimension behind the blasthole becomes relatively small. Non-reflecting boundary conditions are applied at the model boundaries to reduce stress wave reflections and simulate the semi-infinite rock mass of the field tests. However, non-reflecting boundaries, which assume linear material behavior [55], cannot compensate for the limited dimension behind the blasthole, because crack formation is inherently a plastic process. In other words, the limited model dimensions and the use of non-reflecting boundaries cannot fully replicate the boundary conditions of a semi-infinite rock mass, especially when crack propagation is involved, resulting in relatively large errors.
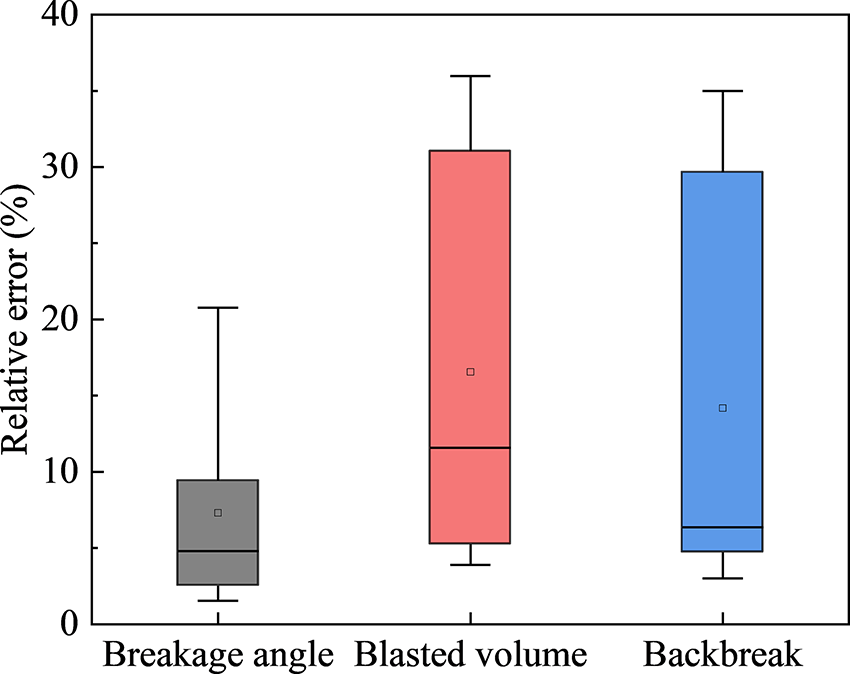
Figure 4: Relative error of simulation results.
Besides, the relative error of breakage angle in the simulation for a burden of 5.5 m is also higher than 20%, which is caused by different measurement methods for breakage angle. In the field test, the breakage angle is measured from the free surface to the blasthole after rock excavation, i.e., if the burden is too large to allow the bench to be separated successfully, the breakage angle is 0° regardless of the angle between two main cracks near the blasthole. In contrast, in the numerical simulation, the breakage angle is measured according to the angle formed by two main damage bands near the blasthole, as shown in Fig. 5. Elements with a damage level above 0.6 mean the formation of macro cracks [58]. Accordingly, since the blasted volume largely depends on the breakage angle, the relative error of the blasted volume also reached 31.05% when the burden is 5.5 m. In addition, the absence of joints in the numerical simulation model is another reason for large discrepancies with field tests.
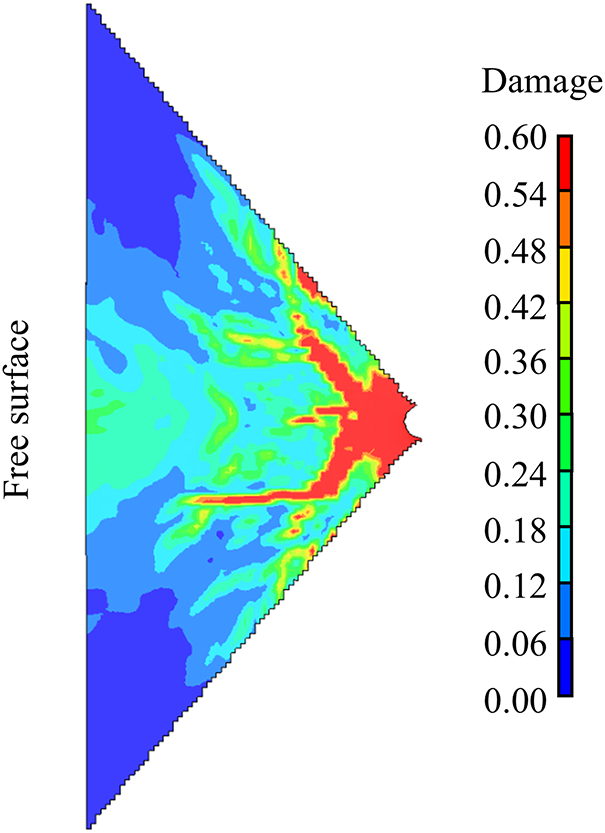
Figure 5: Damage of the 5.5 m burden model at a height of 7 m.
Since the 5.5 m burden in the simulation is relatively large, the crack tip (tip of red damage band) remains far from the free surface, as shown in Fig. 5. At this burden, the crack tip is located 1.78 m away from the free surface. This means that under this simulation condition, the target portion of the burden is not successfully separated from the rock mass. The blasted volume shown in Table 2 is only the theoretical upper limit of blasted volume, not the actual rock mass excavation volume. In summary, based on the good agreement in rock breakage angle, blasted volume, and backbreak between field tests and numerical simulations, it can be concluded that the numerical model, element size, simulation settings, and values of material parameters in this study are suitable and acceptable for revealing the breakage process of rock in single-hole bench blasting.
In this section, the damage distribution with various burdens is compared and discussed. Then, the relationship between burden, breakage angle, blasted volume, and backbreak is presented.
The horizontal cross-section at a height of 7 m in the model is intercepted for damage analysis. The damage distribution at the end of the computation time for six different burdens is shown in Fig. 6. The boundary at left side of the blasthole corresponds to the free surface. The elements in red are considered equivalent to represent the formation of macro cracks [58].
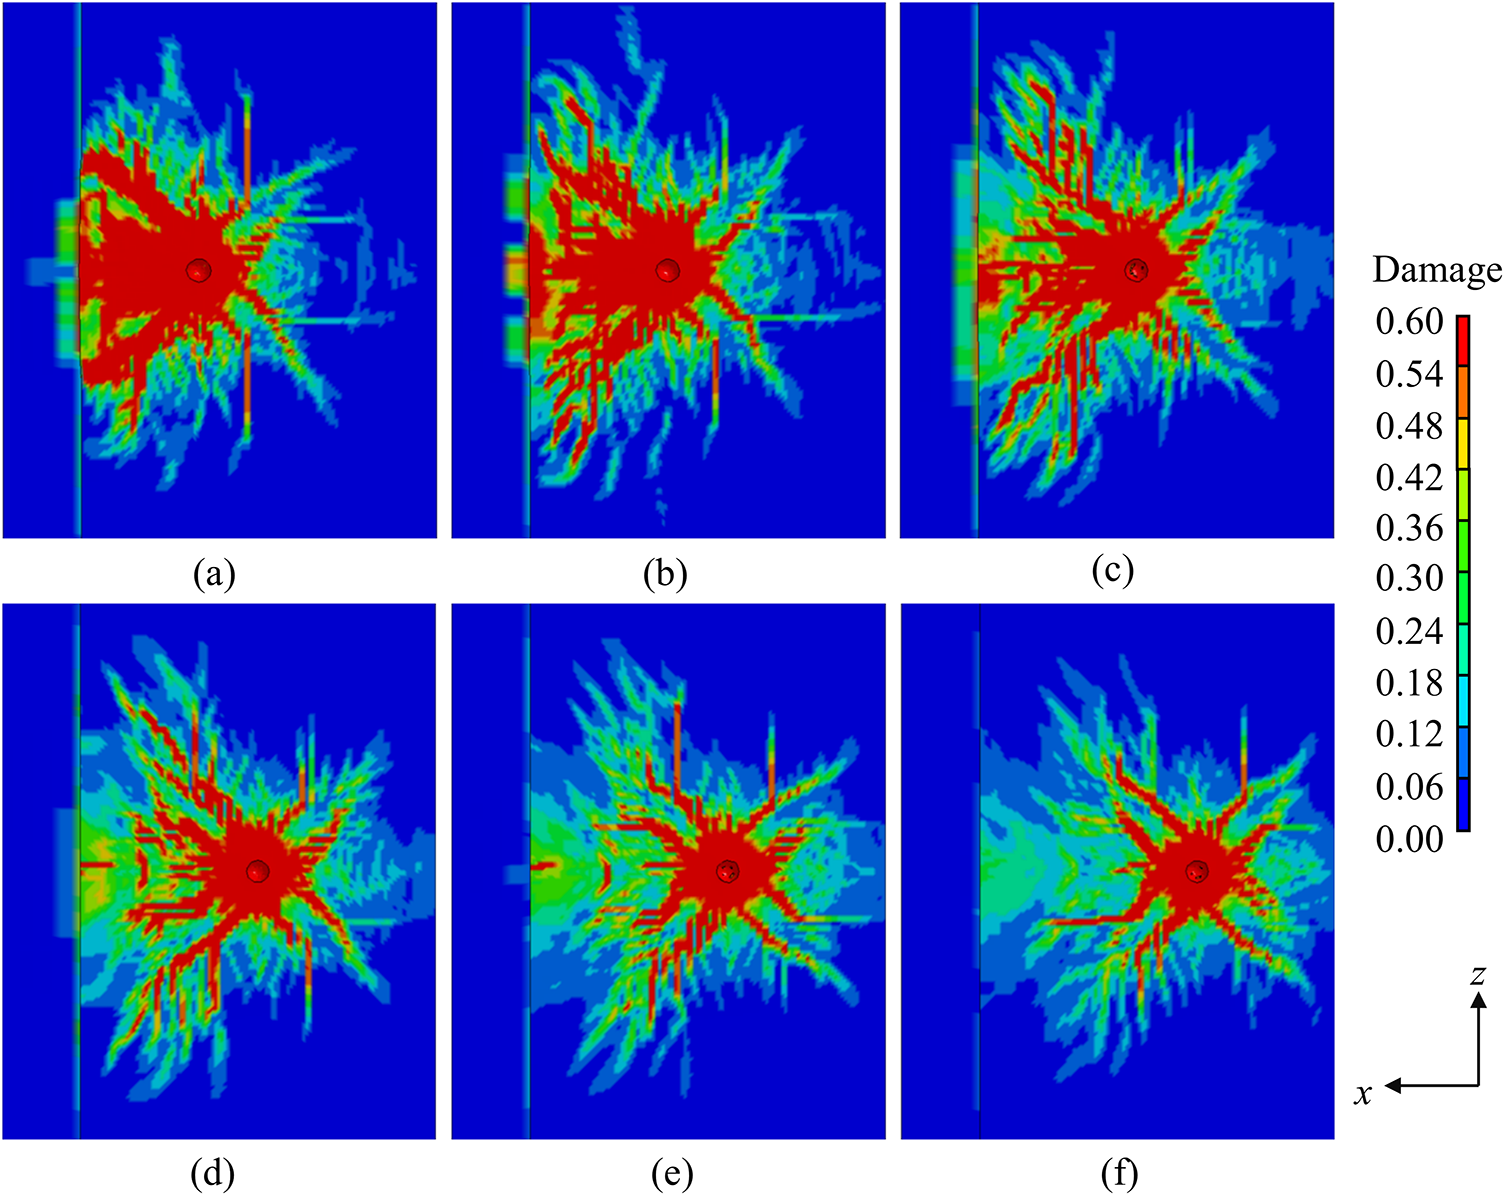
Figure 6: The damage distribution of models. (a) 3.0 m burden; (b) 3.5 m burden; (c) 4.0 m burden; (d) 4.5 m burden; (e) 5.0 m burden; (f) 5.5 m burden.
In Fig. 6, similar damage patterns can be observed with different burden values. A ring-shaped dense damage area is formed near the blasthole for all six models, referred to as the crushed zone. Two main pronounced damage bands propagating from the blasthole to the free surface, which are used to define the breakage angle, are observed. Most of the damage appeared within the area enclosed by the breakage angle and the free surface. In addition, four short, pronounced damage bands are also observed behind the blasthole, i.e., on the right side of the blasthole in Fig. 6, and the length of these lines determines the backbreak distance. However, the specific damage patterns vary with changes in the burden. At a burden of 3 m, as shown in Fig. 6a, the widths of the two pronounced damage bands are noticeably larger than those of other burdens. When the burden exceeds 4 m, as shown in Fig. 6c–f, the width of the pronounced damage band remains essentially unchanged, and branch damage bands appear along the main damage lines. As the burden increases, the number of branch damage bands decreases. In addition, when the burden is less than 5 m, as shown in Fig. 6a–e, radial damage bands extending from the free surface toward the blasthole are observed. This is due to the tensile wave generated by the reflection of the outward compressive wave at the free surface, which initiates numerous small damage bands in the rock mass near the free surface, and the subsequent S-wave causes some of them to expand significantly [31]. When the burden is 3 m, these radial damage bands are densely distributed and almost overlap. In contrast, for burdens of 4.5 and 5 m, only a single, relatively short damage band is observed near the free surface. Meanwhile, tangential damage bands are also observed between the outward-propagating radial damage bands from the blasthole and the inward-propagating ones from the free surface. When the burden is less than 4 m, the tangential damage bands are connected with the radial damage bands. As the burden increases to 4.5 and 5 m, the connection between them disappears, and when the burden is 5.5 m, no distinct tangential damage bands can be observed. These tangential damage bands are very important for the occurrence of spalling [32,59–61], which is beneficial for rock breakage and fragmentation. Moreover, the length of the damage bands behind the blasthole varies with the burden. As the burden increases, this damage band length first increases and then decreases. When the burden exceeds 5 m, the limited model dimension behind the blasthole and partial reflection of stress waves at the model boundary lead to a decrease in damage band length, as mentioned in Section 2.2. Theoretically, as the burden increases, the damage bands around the blasthole should become more symmetric because the influence of the free surface on rock breakage gradually diminishes [16,22,62].
In addition, changes in the burden affect the blasted volume, which is defined as the product of the area enclosed by the breakage angle and the free surface and the bench height. As shown in Fig. 6a, when the burden is 3 m, the two primary damage bands fully extend to the free surface, but the area they enclose is relatively small. When the burden is 4.0 m, the damage distribution is more uniform, and the blasted volume is larger than that of a 3 m burden. When the burden is 5.5 m, only a little oblique damage band is formed under tangential tension stress, and the most developed damage band has its tip located 1.78 m from the free surface. Although the rock mass near the free surface also suffers certain damage, the extent has not reached the level of forming macrocracks. The rock mass may not be separated successfully at this burden value.
In summary, the burden value has a significant influence on damage distribution, resulting in different rock excavation volumes. When the burden is too small, the damage distribution is relatively concentrated. When the burden is relatively large, fewer damage bands are formed, and the rock mass may not be excavated successfully. Appropriate burden will make the damage evenly distributed and effectively utilize the explosive energy for rock breakage, which can significantly enhance excavation efficiency.
3.2 Damage Propagation Process
Rock fracture is a complex process initiated by the energy released from explosives, which ultimately affects the fragmentation formation. Fig. 7 shows an example of the damage propagation process when the burden is 4.0 m. The explosive initiates at the bottom of the blasthole at 0 ms. The detonation wave propagates to a height of 7 m in the bench blasting model at 0.81 ms, as shown in Fig. 7a. Accordingly, the detonation velocity is calculated to be 4938 m/s, which is close to the 4740 m/s set in the explosive material parameters. The resulting discrepancy between the two values is due to slightly larger output intervals and element sizes. Then, the stress wave propagates outward from the blasthole at the 7 m-high horizontal section, resulting in a crushed zone surrounding the blasthole. When the computation time reaches 4 ms, rock breakage in this ring-shaped dense damage zone is almost complete. Due to the high level of tangential tensile stress [30], oriented perpendicular to the direction of stress wave propagation, four pronounced radial damage bands form and begin to propagate outwards. Among them, two damage bands that propagate to the free surface will contribute to the rock breakage, while the other two damage bands induce backbreak. When the outward-propagating compressive wave reaches the free surface, it reflects as a tensile wave propagating back to the blasthole. At the toe position of the bench model, a radial damage band forms on the free surface and propagates towards the blasthole. This damage band is initiated by the tensile stress state and starts to propagate under the shear stress [31]. Besides, the vertical angle of the model at the toe position causes stress concentration, which explains why the damage band occurs at this position. If the amplitude of the tensile wave propagating from the free surface toward the blasthole exceeds the tensile strength of rock, spalling may occur. At 7.4 ms, the damage bands continue to extend. The radial damage bands on the free surface occur at a height of 7 m, as shown in Fig. 7c. A tangential damage band (or called spalling crack) appears between the blasthole and free surface, and the radial damage bands extending from the blasthole and free surface are arrested, verifying the hypothesis from the study of Chi et al. [41]. Finally, at 15 ms, the rock in the ring-shaped dense damage zone is fully damaged, and all damage bands outside it are fully extended. The oblique radial damage band from the blasthole arrives at the free surface and forms the breakage angle. Three tangential damage bands are generated and cause rock spalling. Radial damage bands from the blasthole are arrested by the tangential damage band. Similarly, damage bands propagating from the free surface toward the blasthole are also stopped by the tangential damage band, which greatly facilitates rock breakage.
Figure 7: Damage propagation process with a burden of 4.0 m. (a) 0.81 ms; (b) 4.0 ms; (c) 7.4 ms; (d) 15 ms.
3.3 Burden vs. Blasting Results
Simulation results, including breakage angle, blasted volume, and backbreak distance, can be measured. The breakage angle is a critical parameter in blast design, influencing the blasted volume, actual specific charge, and the determination of spacing. The breakage angle for various burdens is shown in Fig. 8. With the increase in burden, the breakage angle is reduced linearly due to the increasing constraint on the explosive. In most cases, the breakage angle measured from field tests and numerical simulations is in good agreement. It should be noted that when the burden is 5.5 m, the breakage angle in the field test decreases rapidly, to only 84.10°. This illustrates that the burden is relatively large and close to the threshold beyond which excavation may no longer be feasible. This observation is corroborated by the fact that, in the numerical simulation, the most fully developed crack occurs at a distance of 1.78 m from the free surface when the burden is 5.5 m.
Figure 8: Breakage angle vs. burden.
The blasted volume is an important indicator of rock excavation efficiency and is highly significant for blast design. The relationship between blasted volume and burden is shown in Fig. 9. In the range of 3.0 to 5.5 m burden, the blasted volume increases as the burden increases up to 4.0 m, beyond which the blasted volume decreases with further increases in burden. The blasted volume for a 5.5 m burden in numerical simulation is only considered as a theoretical upper limit, as mentioned above. In addition, the large error between the field test and numerical simulation with a burden of 4.0 m is due to the significantly altered geological conditions in the field test, as claimed by Bilgin [8]. Thus, there is an appropriate burden value for high blasting volume, while a burden that is too small or too large will reduce the rock excavation efficiency.
Figure 9: Blasted volume vs. burden.
The backbreak is one of the negative effects in bench blasting that needs to be controlled, which may reduce slope stability behind the blasted area. The backbreak distance increases with burden due to the more uniform confinement around the blasthole, and crack propagation generally occurs symmetrically on both sides. Fig. 10 shows that the backbreak distance varies with the change of burden. With the increase in burden, the backbreak distance increases. When the burden exceeds 4.5 m, the backbreak distance in the numerical simulation decreases due to the limited model dimension as mentioned in Section 2.2. Accordingly, in blast design, the burden should not be too large, which could cause excessive backbreak.
Figure 10: Backbreak vs. burden.
By analyzing the propagation of stress waves in models with different burdens, the mechanisms underlying the formation of various damage distributions under blasting can be revealed. Fig. 11 shows the propagation process of radial stress with a burden of 3 m. The blue regions represent compressive stress waves, while the red regions indicate tensile stress waves. It should be noted that the tensile wave region formed in the subdrilling area is caused by the sudden change in the horizontal element size of the blasthole wall and the adjacent rock material. In the analysis, the stress state in this region is neglected, and only the stress variations above the bench bottom are considered. As shown in Fig. 11a, at 2 ms, the front of the compressive wave reaches the free surface of the bench slope, and a reflected tensile wave area is generated at the toe position. At 2.46 ms, a horizontal tensile stress wave develops in the stemming section, caused by the reflection of compressive wave at the interface between stemming material and explosive, as shown in Fig. 11b. At 2.81 ms, the compressive wave arrive the bench top and the reflected tensile wave area is generated near the bench top. At 3 ms, as the tensile stress wave continues to propagate, the two tensile wave regions near the bench slope and the bench top converge.
Figure 11: Propagation process of radial stress of 3 m burden model at (a) 2.00 ms, (b) 2.46 ms, (c) 2.81 ms, (d) 3.00 ms.
Fig. 12 shows the propagation process of radial stress with a burden of 4 m. As shown in Fig. 12a,b, the formation times of the tensile wave region in the stemming section and that at the toe position are almost identical, being 2.42 and 2.58 ms, respectively. At 2.90 ms, as shown in Fig. 12c, the compressive stress wave reaches the bench top, generating a reflected tensile wave region. By 3.08 ms, the tensile regions near the bench slope and the bench top nearly merge.
Figure 12: Propagation process of radial stress of 4 m burden model at (a) 2.42 ms, (b) 2.58 ms, (c) 2.90 ms, (d) 3.08 ms.
Fig. 13 shows the propagation process of radial stress with a burden of 5.5 m. As shown in Fig. 13b, at 2.81 ms, the compressive stress wave reaches the bench top, and the tensile wave regions generated by its reflection have already formed. At 3.16 ms, as shown in Fig. 13c, a tensile wave region with a relatively high amplitude begins to form, exhibiting a banded distribution. As illustrated in Fig. 13d, at 3.33 ms, the tensile wave regions near the bench slope and the bench top are still separated by a considerable distance, remaining as two distinct regions.
Figure 13: Propagation process of radial stress of 5.5 m burden model at (a) 2.39 ms, (b) 2.81 ms, (c) 3.16 ms, (d) 3.33 ms.
As shown in Figs. 11–13, two main tensile wave regions, namely, the one in the stemming section and the one near the bench slope, are formed. The tensile stress region in the stemming section is formed due to the combined effects of detonation wave and friction with blasthole wall, inducing outward expansion of stemming material along the blasthole diameter direction and generating tensile stress in the surrounding rock. The tensile stress region near the bench slope is formed due to the reflection of the stress wave at the free surface. When the burden is changed, these two main tensile wave regions are formed at different times. When the burden is 3 m, the tensile wave region near the bench slope forms first. When the burden is 4 m, the two tensile wave regions form almost simultaneously. However, when the burden is 5.5 m, the formation of the tensile wave region in the stemming section occurs significantly earlier than that of the region near the bench slope. When the burden is either 3 or 5.5 m, there is a significant difference in the formation times of the two tensile wave regions. In contrast, when the burden is 4 m, the two tensile stress wave regions form almost simultaneously. In this case, rock fracturing may occur almost simultaneously from the blasthole toward the two free surfaces, thereby favoring rock fragmentation [16].
In addition, to validate that the relatively low blasthole pressure (2.63 GPa) adopted in this study does not significantly affect the synchronization of two tensile stress regions, a numerical simulation is conducted using a higher-performance explosive [43] with a burden of 4 m. The times at which two tensile stress regions developed were identified, as shown in Fig. 14.
Figure 14: Tensile stress region (a) in the stemming section at 2.15 ms, (b) near the bench slope at 2.34 ms.
The peak pressure of elements located at the bottom, middle, and top of the blasthole wall is obtained, respectively, and the average blasthole pressure is 8.13 GPa, much closer to the actual blasthole pressure. As shown in Fig. 14, the formation of two tensile stress regions occurs almost simultaneously. With increasing blasthole pressure, the formation of both regions occurs earlier; however, the time interval between their formations remains small and can still be regarded as approximately simultaneous. Therefore, relatively low blasthole pressure does not have a significant effect on the synchronization of formation times of two tensile stress regions.
5.1 Determination of Optimum Burden
From the discussion of the above simulation results, it can be concluded that there is an optimum burden that results in good blast performance. In hard rock mining, excavation efficiency and rock fragmentation are two primary factors for evaluating blast results [16]. Accordingly, breakage angle, blasted volume, and damage distribution are selected to characterize excavation efficiency and rock fragmentation, respectively. A suitable breakage angle, the large excavation volume, and a high level of damage distribution indicate good blast results. When the burden is 4.0 and 4.5 m, the blasted volume in the numerical simulation is higher than that in other conditions, as shown in Fig. 9. Additionally, in the model with different burdens, a single layer of elements containing damage information within the breakage angle range, similar to Fig. 5, is output. The damage value contained in the elements is used to calculate the average damage and total damage within the range of breakage angle, as shown in Fig. 15. The total damage represents the cumulative damage caused by the energy used for rock excavation. The average damage value reflects the mean damage level of the excavated rock elements. Higher total and average damage values indicate better rock damage in the burden area. As the burden increases, the total damage tends to increase initially and then decrease once the burden exceeds 3.5 m burden. In addition, the maximum value of average damage occurs when the burden is 3.0 m. With the increase in the burden, the average damage is reduced linearly.
Figure 15: Average and total damage of the model.
The blast results, including blasted volume, average, and total damage within the breakage angle range, are normalized to discuss their contribution to determine the optimum burden. Fig. 16 shows the total score of models with different burden values, based on the above indices. When the burden is 4.0 m, the model has the highest total score, based on three indices. Under this burden value, the blasted volume is the highest, and the total damage is only slightly lower than that of the model with a burden of 3.5 m. Meanwhile, the total score of the model with a burden of 5.5 m is the lowest. The average damage and total damage are both lowest with this burden value. In addition, as analyzed in Section 2.2, the limited model dimension in the direction perpendicular to the free surface affects only the accuracy of the simulated backbreak distance for cases with burdens of 5 and 5.5 m. Since the evaluation of the optimum burden does not involve backbreak distance, the effect of model dimension on the determination of the optimum burden in this numerical study can be ignored. In summary, according to the comprehensive comparison of six models, the optimum burden in this study is 4.0 m, corresponding to a burden-to-blasthole diameter ratio (B/d) of 20.62 and a burden-to-bench height ratio (B/H) of 0.44.
Figure 16: Total score of models with various burdens.
To evaluate the applicability of the optimum burden obtained in this study for actual production blasting, 14 groups of burden design values from various types of mines and rock types were collected, as listed in Table 3. Under these burden values, the blasts reported in the literature generally achieved the best fragmentation and were therefore considered to represent optimum burden. The relationships between these burden values, bench height, and blasthole diameter are summarized in Table 3. The B/H ratios corresponding to the optimum burdens reported in the literature range from 0.33 to 0.48, with an average of 0.41. The B/d ratios range from 17.58 to 28.09, with an average of 23.10. The average B/H and B/d values calculated from these literature design data are both close to the ratios obtained in this study, with deviations of 6.82% and 12.03%, respectively. These relatively small deviations indicate that the optimum burden obtained in this study has good applicability and can be effectively implemented in production blasting.
According to the optimum burden (Bopt) determined in this study and used in production blasting listed in Table 3, an empirical formula for determining optimum burden based on bench height and blasthole diameter is shown in Eq. (4). For the final burden values used in different mines, the recommended range in Eq. (4) should be adjusted according to site-specific geological conditions to determine the optimum burden.
5.2 Time Relationship between Stress Wave and Damage Initiation
The interaction between stress waves and damage bands generated by blasting is one of the key factors influencing rock fracture and fragmentation formation [16,29]. Delayed detonation is more effective than simultaneous initiation in multi-hole blasting [16], yet the optimum delay time remains uncertain. Studying the time interval between stress wave arrival and rock fracture initiation provides a basis for its determination. The model with a burden of 4 m is taken as an example to investigate the relationship between the occurrence time of stress states that cause rock fracture and the initiation time of damage bands. By reviewing the damage propagation process, the initiation points of three types of damage bands can be identified: the radial damage band initiated near the blasthole, the damage band initiated near the free surface, and the damage band formed between the former two regions and oriented parallel to the free surface. Stress and damage information is extracted from three measuring points located at typical positions within the region between the blasthole and the free surface, as shown in Fig. 17. The region records the processes of stress wave propagation and damage evolution. Point 1 is located outside the ring-shaped crushed zone, which is the starting point of the radial damage band. Point 2 is near the free surface, which is the position where damage bands are caused by reflected tensile stress. Point 3 is located at the location where the tangential damage band starts.
Figure 17: Measurement points for stress and damage information extraction.
In the fracturing zone, the high level of radial compressive stress wave induces tangential tensile stress, leading to the formation of a radial damage band [30,31,75]. The radial compressive wave reaches point 1 at 1.25 ms, after which the horizontal tangential stress becomes tensile at 2.36 ms with an amplitude of 3.25 MPa, leading to the initiation of a damage band at this point. The pronounced damage, i.e., when the damage is greater than 0.6, is formed at 3.31 ms. Near the free surface, the small flaw is activated by three-dimensional tensile stress, and the following shear stress drives damage growth [31]. The radial compressive wave arrives at point 2 at 2.14 ms, followed by the reflected tensile wave at 2.77 ms. After 2.77 ms, point 2 is under a three-dimensional tensile stress state. Subsequently, the shear stress reaches its amplitude of 3.18 MPa. At 5.70 ms, the pronounced damage begins to form at this point. In addition, the radial compressive wave reaches point 3 at 2.02 ms, after which the reflected tensile wave arrives at 2.84 ms. Following the arrival of the tensile wave, point 3 is under a three-dimensional tensile stress state. Afterward, damage initiation occurs at this point at 6.81 ms. For the three pronounced damage formation mechanisms represented by the three typical points, the time interval from the occurrence of the stress state that causes rock fracture to pronounced damage formation varies. Fig. 18 shows the variation of the time interval for pronounced damage formation with the wave propagation distance. The time interval for the radial damage band caused by tangential tensile stress outside the crushed zone is the shortest, with a value of 0.95 ms. With the increase in wave propagation distance, the time interval increases gradually. The time interval is 3.97 ms when the spalling occurs. Fig. 18 illustrates that damage formation at a given location consistently occurs after the occurrence of the stress state that induces it, and the time delay becomes larger as the distance from the blasthole increases.
Figure 18: Time interval of crack formation.
(1) When the burden is 5 m and 5.5 m, the model dimension in the direction perpendicular to the free surface (i.e., x-direction in Fig. 1) is relatively limited. Since the primary objective of this study is to investigate the effect of burden on rock breakage, the study focuses on rock damage between the blasthole and the free surface. To achieve this objective, a sufficiently large model dimension of 19.2 m is adopted in direction parallel to free surface (i.e., the z-direction in Fig. 1). Therefore, for cases with burden of 5 and 5.5 m, slightly limited model dimension in direction perpendicular to free surface represents a reasonable compromise made under computational scale constraints, ensuring that the primary research objectives could be effectively addressed.
(2) Since joint conditions in field tests [8] are not provided, joints are not considered in the numerical model. However, in order to account for the strength degradation of rock mass induced by joints, intact rock strength is converted using a rock mass quality index, thereby approximating the actual compressive strength of in-situ rock mass. This approximation may result in some discrepancies between numerical simulation results and actual field-observed failure behavior. Nevertheless, a comparison of the statistical data presented in Table 2 indicates that these discrepancies are within an acceptable range.
(3) Numerical models are developed based on the specific rock condition and blast designs, and an optimum burden value is proposed accordingly. This recommended value shows good agreement with the burden values adopted in production blasting, as listed in Table 3. However, in engineering applications, this value should be regarded only as a reference for burden selection, and final determination of burden should consider factors such as rock strength, structural characteristics and blast design parameters of a specific mine.
In this study, the influence of burden on rock breakage behavior based on the numerical simulation of single-hole bench blasting has been demonstrated. Specifically, the following conclusions are obtained:
(1) When the burden is too small, the damage distribution is relatively concentrated, and the excavation volume is low; when the burden value is large, the rock mass may not be separated successfully.
(2) With increasing burden, the breakage angle decreases, and the blasted volume reaches its peak value at a burden of 4 m. Meanwhile, backbreak increases with increasing burden due to the weakening of the free-surface effect.
(3) Considering both excavation volume and rock damage, the optimum burden is found to be 4 m, corresponding to 20.62 times the blasthole diameter and 0.44 times the bench height. This burden value is consistent with the optimum burden values used in mining production blasting.
(4) Based on the stress wave and damage distribution analysis, it is found that under the optimum burden, stress waves are almost simultaneously reflected from the free surfaces of the bench top and bench slope, forming tensile wave regions that lead to a wider and more uniform damage distribution.
Acknowledgement: Not applicable.
Funding Statement: This work was supported by the European Union in the frame of Horizon Europe AVANTIS project, Grant Agreement No. 101137552.
Author Contributions: The authors confirm contribution to the paper as follows: Conceptualization, Kai Rong; methodology, Kai Rong; software, Kai Rong and Li-Yuan Chi; validation, Kai Rong; formal analysis, Kai Rong and Zong-Xian Zhang; investigation, Kai Rong; resources, Zong-Xian Zhang; data curation, Kai Rong; writing—original draft preparation, Kai Rong; writing—review and editing, Zong-Xian Zhang and Li-Yuan Chi; visualization, Kai Rong; supervision, Zong-Xian Zhang and Li-Yuan Chi; project administration, Zong-Xian Zhang; funding acquisition, Zong-Xian Zhang. All authors reviewed and approved the final version of the manuscript.
Availability of Data and Materials: The authors confirm that the data supporting the findings of this study are available within the article.
Ethics Approval: Not applicable.
Conflicts of Interest: The authors declare no conflicts of interest.
To conduct a sensitivity analysis of the empirical relationship between damage and the occurrence of macroscopic cracks, rock damage distributions corresponding to damage thresholds of 0.4, 0.6, and 0.8 are extracted for analysis, as shown in Fig. A1, Fig. 6, and Fig. A2, respectively. Fig. A1 shows a damage distribution similar to that in Fig. 6, with the differences lying in degree of rock damage and backbreak distance. When damage threshold is 0.4, backbreak distances show large errors compared with the data measured in field tests, as listed in Table A1. The relative errors are between 6.00% and 45.50%, with an average error of 27.69%. In addition, as shown in Fig. A2d, the two damage bands responsible for forming breakage angle become discontinuous, which may lead to failure of rock excavation. Furthermore, as shown in Fig. A2e, the damage band propagating outward from blasthole is relatively far from the free surface, and the damage band parallel to free surface is weak, which may lead to failure of rock separation and contradicts the successful excavation observed in the field tests. Therefore, a damage of 0.6 is adopted in this study as threshold value equivalent to formation of macroscopic cracks. Under this condition, both excavation pattern and backbreak distance are in good agreement with the field test results.
Figure A1: The damage distribution of models with D = 0.4 as threshold. (a) 3.0 m burden; (b) 3.5 m burden; (c) 4.0 m burden; (d) 4.5 m burden; (e) 5.0 m burden; (f) 5.5 m burden.
Figure A2: The damage distribution of models with D = 0.8 as threshold. (a) 3.0 m burden; (b) 3.5 m burden; (c) 4.0 m burden; (d) 4.5 m burden; (e) 5.0 m burden; (f) 5.5 m burden.
References
1. Choudhary BS, Arora RK. Influence of front row burden on fragmentation, muckpile shape, excavator cycle time, and back break in surface limestone mines. Iran J Earth Sci. 2018;10:1–10. [Google Scholar]
2. Prasad S, Choudhary BS, Mishra AK. Effect of stemming to burden ratio and powder factor on blast induced rock fragmentation—A case study. IOP Conf Ser Mater Sci Eng. 2017;225:012191. doi:10.1088/1757-899x/225/1/012191. [Google Scholar] [CrossRef]
3. Zhang Z, Qiu X, Shi X, Luo Z, Chen H, Zong C. Burden effects on rock fragmentation and damage, and stress wave attenuation in cut blasting of large-diameter long-hole stopes. Rock Mech Rock Eng. 2023;56(12):8657–75. doi:10.1007/s00603-023-03512-y. [Google Scholar] [CrossRef]
4. Konya CJ, Walter EJ. Surface blast design. Hoboken, NJ, USA: Prentice Hall; 1990. [Google Scholar]
5. Murmu S, Maheshwari P, Verma HK. Empirical and probabilistic analysis of blast-induced ground vibrations. Int J Rock Mech Min Sci. 2018;103(2):267–74. doi:10.1016/j.ijrmms.2018.01.038. [Google Scholar] [CrossRef]
6. Blair DP, Armstrong LW. The influence of burden on blast vibration. Fragblast. 2001;5(1–2):108–29. doi:10.1076/frag.5.1.108.3315. [Google Scholar] [CrossRef]
7. Ghasemi E, Sari M, Ataei M. Development of an empirical model for predicting the effects of controllable blasting parameters on flyrock distance in surface mines. Int J Rock Mech Min Sci. 2012;52(6):163–70. doi:10.1016/j.ijrmms.2012.03.011. [Google Scholar] [CrossRef]
8. Bilgin HA. Single hole test blasting at an open pit mine in full scale: a case study. Int J Surf Min Reclam Environ. 1991;5(4):191–4. doi:10.1080/09208119108944307. [Google Scholar] [CrossRef]
9. Rustan A, Nie SL. New method to test the rock breaking properties of explosives in full scale. Int J Surf Min Reclam Environ. 1992;6(4):191–200. doi:10.1080/09208119208944336. [Google Scholar] [CrossRef]
10. Bhandari S. Studies in rock fragmentation in blasting [dissertation]. Sydney, NSW, Australia: The University of New South Wales; 1975. doi:10.26190/unsworks/5350. [Google Scholar] [CrossRef]
11. Peng J, Wang X, Zhang F, Yang X, Gao J. Influences of the burden on the fracture behaviour of rocks by using electric explosion of wires. Theor Appl Fract Mech. 2022;118(4):103270. doi:10.1016/j.tafmec.2022.103270. [Google Scholar] [CrossRef]
12. Ouchterlony F, Moser P. Lessons from single-hole blasting in mortar, concrete and rocks. In: Rock fragmentation by blasting. Boca Raton, FL, USA: CRC Press; 2013. p. 3–14. [Google Scholar]
13. Zhang ZX, Chi LY, Yi C. An empirical approach for predicting burden velocities in rock blasting. J Rock Mech Geotech Eng. 2021;13(4):767–73. doi:10.1016/j.jrmge.2021.04.004. [Google Scholar] [CrossRef]
14. Noren CH. Blasting experiments in granite rock. In: The 1st U.S. Symposium on Rock Mechanics (USRMS); 1956 Apr 23–25; Golden, Colorado. [Google Scholar]
15. Nie S. New hard rock fragmentation formulas based on model and full-scale tests [dissertation]. Luleå, Sweden: Luleå tekniska universitet; 1988. [Google Scholar]
16. Zhang ZX. Rock fracture and blasting: theory and applications. Oxford, UK: Butterworth-Heinemann/Elsevier; 2016. [Google Scholar]
17. Roth J. A model for the determination of flyrock range as a function of shot conditions. Washington, DC, USA: US Department of the Interior Bureau of Mines; 1979. [Google Scholar]
18. Brent GF, Smith GE, Lye GN. Studies on the effect of burden on blast damage and the implementation of new blasting practices to improve productivity at KCGMs Fimiston mine. Fragblast. 2002;6(2):189–206. doi:10.1076/frag.6.2.189.8665. [Google Scholar] [CrossRef]
19. Anderson O. Blast hole burden design-introducing a new formula. Aust Inst Min Metall. 1952;166:115–30. [Google Scholar]
20. Fraenkel KH. Manual on rock blasting. Stockholm & Sandviken, Sweden: Aktiebolaget Atlas Diesel; 1957. [Google Scholar]
21. Kou SQ, Rustan A. Burden related to blasthole diameter in rock blasting. Int J Rock Mech Min Sci Geomech Abstr. 1992;29(6):543–53. doi:10.1016/0148-9062(92)91612-9. [Google Scholar] [CrossRef]
22. Langefors U, Kihlstroem B. The modern technique of rock blasting. Stockholm, Sweden: Almqvist & Wiksell; 1978. [Google Scholar]
23. Pearse GE. Rock blasting—some aspects on the theory and practice. Mine Quarry Eng. 1955;21:25–30. [Google Scholar]
24. Konya CJ. The use of shaped explosive charges to investigate permeability, penetration, and fracture formation in coal, dolomite and Plexiglas [dissertation]. Rolla, MO, USA: University of Missouri-Rolla; 1972 [cited 2025 Jan 1]. Available from: https://scholarsmine.mst.edu/doctoral_dissertations/2083. [Google Scholar]
25. Praillet R. A new approach to drilling and blasting. Alachua, FL, USA: Technical Publications, Drilltech Inc.; 1980. [Google Scholar]
26. Berta G. L’esplosivo strumento di lavoro. Milan, Italy: Italesplosivi; 1985. [Google Scholar]
27. Bergmann OR, Riggle JW, Wu FC. Model rock blasting—effect of explosives properties and other variables on blasting results. Int J Rock Mech Min Sci Geomech Abstr. 1973;10(6):585–612. doi:10.1016/0148-9062(73)90007-7. [Google Scholar] [CrossRef]
28. Olsson M, Nyberg U, Fjelborg S. Controlled fragmentation in sublevel caving—First tests. Swebrec Rep. 2009;2:27–37. [Google Scholar]
29. Kutter HK, Fairhurst C. On the fracture process in blasting. Int J Rock Mech Min Sci Geomech Abstr. 1971;8(3):181–202. doi:10.1016/0148-9062(71)90018-0. [Google Scholar] [CrossRef]
30. Chi LY, Zhang ZX, Aalberg A, Yang J, Li CC. Fracture processes in granite blocks under blast loading. Rock Mech Rock Eng. 2019;52(3):853–68. doi:10.1007/s00603-018-1620-0. [Google Scholar] [CrossRef]
31. Fourney WL. The role of stress waves and fracture mechanics in fragmentation. Blasting Fragm. 2015;9:83–106. [Google Scholar]
32. Zhang ZX, Liu Z, Chi LY, Xu X, Zhou S. Spalling-caused rock microfracture and energy partitioning. Eng Fract Mech. 2025;330(7):111692. doi:10.1016/j.engfracmech.2025.111692. [Google Scholar] [CrossRef]
33. Sellers E, Furtney JK. What broke the burden? Improving our understanding of burden breakout. In: Proceedings 39th Annual Conference on Explosives and Blasting Technique, ISEE; 2013 Feb 10–13; Fort Worth, TX, USA. p. 10–3. [Google Scholar]
34. Saadatmand Hashemi A, Katsabanis P. The effect of stress wave interaction and delay timing on blast-induced rock damage and fragmentation. Rock Mech Rock Eng. 2020;53(5):2327–46. doi:10.1007/s00603-019-02043-9. [Google Scholar] [CrossRef]
35. Tao J, Yang XG, Li HT, Zhou JW, Qi SC, Lu GD. Numerical investigation of blast-induced rock fragmentation. Comput Geotech. 2020;128(93):103846. doi:10.1016/j.compgeo.2020.103846. [Google Scholar] [CrossRef]
36. Wang Z, Wang H, Wang J, Tian N. Finite element analyses of constitutive models performance in the simulation of blast-induced rock cracks. Comput Geotech. 2021;135(10):104172. doi:10.1016/j.compgeo.2021.104172. [Google Scholar] [CrossRef]
37. Zhang J, Chen Z, Shao K. Numerical investigation on optimal blasting parameters of tunnel face in granite rock. Simul Model Pract Theory. 2024;130(1):102854. doi:10.1016/j.simpat.2023.102854. [Google Scholar] [CrossRef]
38. Fan H, Wang C, Liu H, Xiong W, Tian Z. Evaluation of deflagration fracturing effect based on the HJC constitutive model. Sci Rep. 2026;16(1):656. doi:10.1038/s41598-025-29636-5. [Google Scholar] [PubMed] [CrossRef]
39. Liu J, Zhang J. A modified HJC model for geological materials subjected to blasting loadings. Structures. 2023;58:105483. doi:10.1016/j.istruc.2023.105483. [Google Scholar] [CrossRef]
40. Wang Z, Ni Y, Wang J, Li S. Improvement and performance analysis of constitutive model for rock blasting damage simulation. Simul Model Pract Theory. 2025;138(12):103043. doi:10.1016/j.simpat.2024.103043. [Google Scholar] [CrossRef]
41. Chi LY, Ylitalo RM, Zhang ZX, Bergström P, Haugen S, Mäki R, et al. A case study of fragmentation improvement by primer placement in kevitsa mine. Min Metall Explor. 2024;41(3):1265–78. doi:10.1007/s42461-024-00998-0. [Google Scholar] [CrossRef]
42. Li J, Li X, Peng J, Wu X, Sun Y, Zhou F. Experimental and numerical investigations of single-hole blast-induced cracks in concrete based on a calibrated RHT model. Struct Concr. 2025;11(5):suco.70048. doi:10.1002/suco.70048. [Google Scholar] [CrossRef]
43. Wang H, Wang Z, Wang J, Wang S, Wang H, Yin Y, et al. Effect of confining pressure on damage accumulation of rock under repeated blast loading. Int J Impact Eng. 2021;156(3):103961. doi:10.1016/j.ijimpeng.2021.103961. [Google Scholar] [CrossRef]
44. Ma S, Liu K, Yang J. Investigation of blast-induced rock fragmentation and fracture characteristics with different decoupled charge structures. Int J Impact Eng. 2024;185(2):104855. doi:10.1016/j.ijimpeng.2023.104855. [Google Scholar] [CrossRef]
45. Li X, Liu K, Qiu T, Sha Y, Yang J, Song R. Numerical study on fracture control blasting using air-water coupling. Geomech Geophys Geo Energy Geo Resour. 2023;9(1):29. doi:10.1007/s40948-023-00546-y. [Google Scholar] [CrossRef]
46. Sanchidrián JA, Pesquero JM, Garbayo E. Damage in rock under explosive loading: implementation in DYNA2D of a TCK model. Int J Surf Min Reclam Environ. 1992;6(3):109–14. doi:10.1080/09208119208944324. [Google Scholar] [CrossRef]
47. Borrvall T, Riedel W. The RHT concrete model in LS-DYNA. In: 8th European LS-DYNA Users Conference; 2011 May 23–24; Strasbourg, France. [Google Scholar]
48. Singh M, Seshagiri Rao K. Empirical methods to estimate the strength of jointed rock masses. Eng Geol. 2005;77(1–2):127–37. doi:10.1016/j.enggeo.2004.09.001. [Google Scholar] [CrossRef]
49. Singh B, Goel RK. Engineering rock mass classification. Oxford, UK: Butterworth-Heinemann; 2012. [Google Scholar]
50. Wu W, Thomson R. A study of the interaction between a guardrail post and soil during quasi-static and dynamic loading. Int J Impact Eng. 2007;34(5):883–98. doi:10.1016/j.ijimpeng.2006.04.004. [Google Scholar] [CrossRef]
51. Meyers MA. Dynamic behavior of materials. New York, NY, USA: John Wiley & Sons, Inc.; 1994. [Google Scholar]
52. Duff RE, Houston E. Measurement of the chapman-jouguet pressure and reaction zone length in a detonating high explosive. J Chem Phys. 1955;23(7):1268–73. doi:10.1063/1.1742255. [Google Scholar] [CrossRef]
53. Cooper PW. Explosives engineering. New York, NY, USA: John Wiley & Sons; 1996. [Google Scholar]
54. Kinoshita N, Kubota S, Saburi T, Ogata Y, Miyake A. Influence of charge diameter on detonation velocity and reaction zone of ANFO explosive contained in a steel tube. Sci Technol Energ Mater. 2011;72:21–5. [Google Scholar]
55. Hallquist J. LS-DYNA keyword User’s manual. Livermore, CA, USA: Livermore Software Technology Corporation (LSTC); 2007. [Google Scholar]
56. Jang H, Handel D, Ko Y, Yang HS, Miedecke J. Effects of water deck on rock blasting performance. Int J Rock Mech Min Sci. 2018;112(3):77–83. doi:10.1016/j.ijrmms.2018.09.006. [Google Scholar] [CrossRef]
57. Chi LY, Zhang ZX, Ylitalo RM, Bergström P, Haugen S. Effects of subdrilling on broken zone beneath bench floor at kevitsa open pit mine: a case study. Rock Mech Rock Eng. 2025;58(11):12029–47. doi:10.1007/s00603-025-04683-6. [Google Scholar] [CrossRef]
58. Yi C, Sjöberg J, Johansson D, Petropoulos N. A numerical study of the impact of short delays on rock fragmentation. Int J Rock Mech Min Sci. 2017;100(1):250–4. doi:10.1016/j.ijrmms.2017.10.026. [Google Scholar] [CrossRef]
59. Niu L, Zhu W, Li S, Liu X. Spalling of a one-dimensional viscoelastic bar induced by stress wave propagation. Int J Rock Mech Min Sci. 2020;131(5):104317. doi:10.1016/j.ijrmms.2020.104317. [Google Scholar] [CrossRef]
60. Gálvez Díaz-Rubio F, Rodríguez Pérez J, Sánchez Gálvez V. The spalling of long bars as a reliable method of measuring the dynamic tensile strength of ceramics. Int J Impact Eng. 2002;27(2):161–77. doi:10.1016/S0734-743X(01)00039-2. [Google Scholar] [CrossRef]
61. Xu T, Li J, Wang M. Influence of incident angle on spalling damage of underground tunnels subjected to explosion waves. Tunn Undergr Space Technol. 2024;147:105746. doi:10.1016/j.tust.2024.105746. [Google Scholar] [CrossRef]
62. Jimeno EL, Jimino CL, Carcedo A. Drilling and blasting of rocks. Rotterdam, The Netherlands: Taylor & Francis; 1995. [Google Scholar]
63. Nielsen K. Optimisation of open pit bench blasting. In: 1st International Symposium on Rock Fragmentation by Blasting; 1983 Aug 23–26; Lulea, Sweden. p. 653–64. [Google Scholar]
64. Armstrong LW. The quality of stemming in assessing blasting efficiency [master’s thesis]. Sydney, NSW, Australia: The University of New South Wales; 1994. doi:10.26190/unsworks/5349. [Google Scholar] [CrossRef]
65. Paley N, Kojovic T. Adjusting blasting to increase SAG mill throughput at the Red Dog mine. In: Proceedings of the Annual Conference on Explosives and Blasting Technique, ISEE; 1999 Feb 7–10; Nashville, TN, USA. p. 65–82. [Google Scholar]
66. Latham JP, Lu P. Development of an assessment system for the blastability of rock masses. Int J Rock Mech Min Sci. 1999;36(1):41–55. doi:10.1016/S0148-9062(98)00175-2. [Google Scholar] [CrossRef]
67. Moser P, Olsson M, Ouchterlony F, Grasedieck A. Comparison of the blast fragmentation from lab-scale and full-scale tests at Bårarp. In: EFEE 2nd World Conference on Explosives and Blasting Technology; 2003 Sep 10–12; Prague, Czech Republic. p. 449–58. doi:10.1201/9781439833476.ch55. [Google Scholar] [CrossRef]
68. Chakraborty AK, Raina AK, Ramulu M, Choudhury PB, Haldar A, Sahu P, et al. Parametric study to develop guidelines for blast fragmentation improvement in jointed and massive formations. Eng Geol. 2004;73(1–2):105–16. doi:10.1016/j.enggeo.2003.12.003. [Google Scholar] [CrossRef]
69. Engin IC. A practical method of bench blasting design for desired fragmentation based on digital image processing technique and Kuz-Ram model. In: 9th International Symposium on Rock Fragmentation by Blasting; 2009 Sep 13–17; Granada, Spain. p. 257–63. [Google Scholar]
70. Hudaverdi T, Kulatilake PHSW, Kuzu C. Prediction of blast fragmentation using multivariate analysis procedures. Int J Numer Anal Methods Geomech. 2011;35(12):1318–33. doi:10.1002/nag.957. [Google Scholar] [CrossRef]
71. Sazid M. Investigating the role of effective stemming in engineering blasting operations for open-pit mines [dissertation]. Mumbai, India: Indian Institute of Technology Bombay; 2014. doi:10.13140/RG.2.2.12811.87846/1. [Google Scholar] [CrossRef]
72. Sharma SK, Rai P. Investigation of crushed aggregate as stemming material in bench blasting: a case study. Geotech Geol Eng. 2015;33(6):1449–63. doi:10.1007/s10706-015-9911-7. [Google Scholar] [CrossRef]
73. Wilkinson D, Rigby G, Norgard J, Thomson S. Higher energy bulk explosives-matching products to rock types using an energy map concept. In: 11th International Symposium on Rock Fragmentation by Blasting, Australasian Institute of Mining and Metallurgy; 2015 Aug 24–26; Sydney, Australia. p. 579–83. [Google Scholar]
74. Moomivand H, Vandyousefi H. Development of a new empirical fragmentation model using rock mass properties, blasthole parameters, and powder factor. Arab J Geosci. 2020;13(22):1173. doi:10.1007/s12517-020-06110-2. [Google Scholar] [CrossRef]
75. Fourney WL, Dick RD, Simha KRY. Model study of crater blasting. Rock Mech Rock Eng. 1988;21(3):183–205. doi:10.1007/BF01032579. [Google Scholar] [CrossRef]
Cite This Article
 Copyright © 2026 The Author(s). Published by Tech Science Press.
This work is licensed under a Creative Commons Attribution 4.0 International License , which permits unrestricted use, distribution, and reproduction in any medium, provided the original work is properly cited.
 Downloads
 Citation Tools