
 Submit a Paper
 Propose a Special lssue
 Open Access
ARTICLE

Development of a Mathematical Control-Oriented Model for Floating Offshore Wind Turbines
1 Dept. Computer Architecture and Automatic Control, Faculty of Physics, Universidad Complutense de Madrid, Madrid, Spain
2 Institute of Knowledge Technology, Computer Sciences Faculty, Universidad Complutense de Madrid, Madrid, Spain
* Corresponding Author: Segundo Esteban. Email:
Computer Modeling in Engineering & Sciences 2026, 147(1), 20 https://doi.org/10.32604/cmes.2026.077663
Received 15 December 2025; Accepted 02 March 2026; Issue published 27 April 2026
 View Full Text
 Download PDF
Abstract
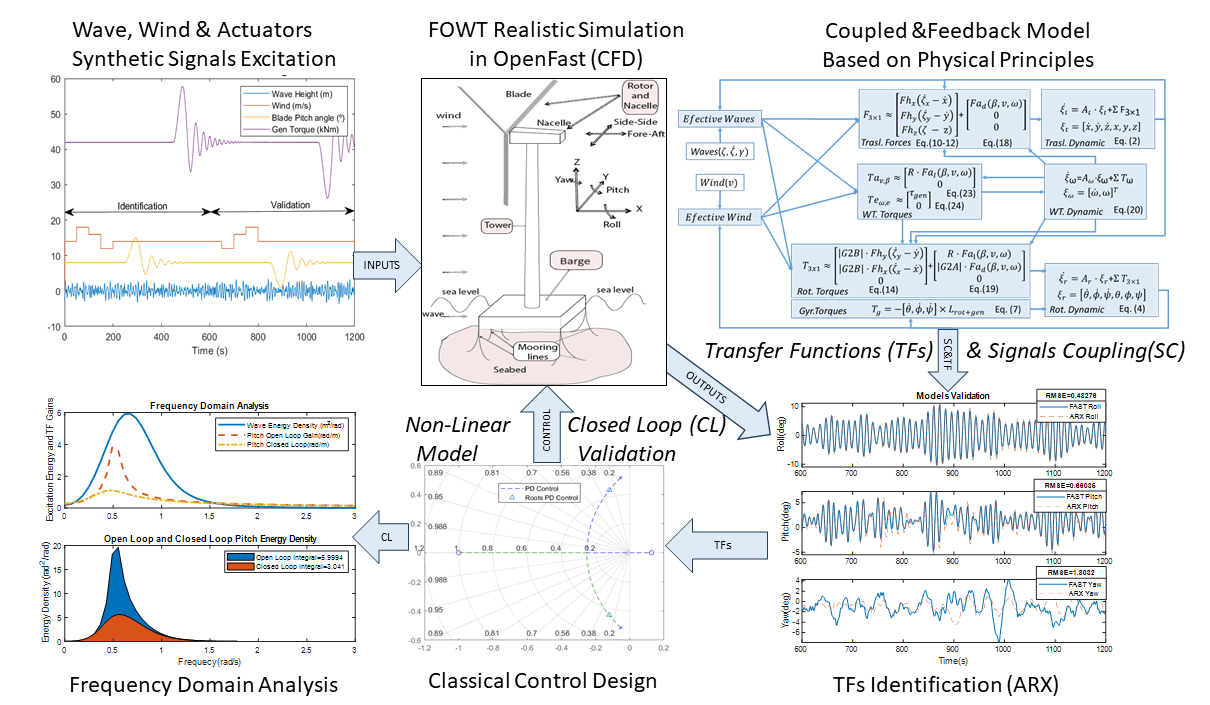
Wind turbines are highly efficient energy converters that exploit locally available renewable resources across many regions. In modern floating offshore wind turbines (FOWTs), strong aerodynamic and hydrodynamic loads give rise to nonlinear and tightly coupled dynamics, which typically require dedicated—and computationally demanding—simulation tools for analysis and control design. This work introduces a simplified, control-oriented mathematical model of a FOWT, derived directly from fundamental force and torque balances and explicitly incorporating the gyroscopic effect, which is often neglected in onshore wind turbines due to its comparatively lower significance. Model parameters are identified for the NREL 5-MW reference turbine using autoregressive models with exogenous input (ARX) techniques. The proposed model is validated against the standard NREL OpenFAST simulation framework. Its utility is further demonstrated by designing a classical control system based on the simplified model and applying it to a high-fidelity nonlinear FOWT simulation, yielding satisfactory performance. The main advantages of the model are: (a) its compact parameter set enables computationally efficient simulations; (b) its feedback structure is based on relative forces, making it applicable under a broader range of disturbances than conventional input–output models; (c) its simplicity facilitates the identification of fundamental behaviors and rapid assessment of dynamic couplings; and (d) its structure is easily modifiable, allowing redesign of components or targeted alteration of the system dynamics through control actions. Overall, the model remains fully explainable, preserving a clear link to the underlying physical principles.Graphic Abstract
Keywords
The accelerating global response to climate change has intensified the transition toward renewable energy systems. Following the 2023 United Nations Climate Change Conference (COP28) [1], which for the first time formally endorsed a global shift away from fossil fuels by 2050, the demand for clean, reliable, and scalable energy technologies has grown substantially. Among renewable sources, wind energy stands out for its technological maturity and high conversion efficiency, leading to rapid deployment in many countries [2].
As onshore wind installations expand, constraints related to land availability, noise emissions, and visual impact have increasingly motivated the relocation of wind farms to offshore environments. Offshore wind turbines may be bottom-fixed, installed in shallow waters, or floating offshore wind turbines (FOWTs). The latter extend deployment to deep-water regions, enabling access to stronger and more consistent wind resources while reducing the ecological and visual footprint [3]. These advantages have spurred interest in large-scale FOWT systems, but their operation introduces significant engineering challenges. Strong and variable environmental loads—wind, waves, currents, and ice—interact with the turbine and floating platform, giving rise to highly nonlinear and coupled dynamics that complicate analysis, control, and structural design [4].
Computational simulation tools are essential for understanding and optimizing FOWT behavior [5]. However, high-fidelity offshore simulation platforms often require extensive computational resources, rely on heterogeneous libraries and lack standardization, which makes them difficult to integrate into iterative design workflows [6]. The scarcity of real operational data further hampers validation and reduces the availability of simple yet accurate analytical models [7]. For many engineering tasks—such as early-stage design, controller synthesis, rapid prototyping, and co-design—there is a strong need for mathematical models that balance physical fidelity with computational simplicity.
Motivated by these limitations, this study aims to develop a fundamental, control-oriented mathematical model of a floating offshore wind turbine that remains computationally efficient while capturing the key coupled dynamics. The model is derived from first-principles force and torque balances and incorporates translational, rotational, and gyroscopic effects—the latter typically excluded in onshore turbine models due to their lower significance. To enhance validity, the model employs relative wave elevation as the excitation variable, which improves linearization accuracy compared with classical RAO-based approaches [8]. With this approach, the modeling methodology and force analysis framework can be applied to a wide range of floating wind devices.
A specific turbine type, the offshore 5 MW NREL ITI-barge, was then selected to identify the parameters of the general model in order to validate it. Model parameters are identified using autoregressive models with exogenous inputs (ARX) based on data from the NREL 5-MW barge-type FOWT. The resulting simplified model is then validated against the high-fidelity OpenFAST simulator [9], including the design and implementation of a conventional control strategy derived from the simplified dynamics and tested on the nonlinear system.
The contributions of this work are as follows:
• A general first-principles FOWT model that remains physically interpretable while being tailored to a representative 5-MW reference turbine.
• Low computational cost, enabled by a compact parameter set suitable for rapid simulation and prototyping.
• Extended validity range, achieved through excitation via relative wave elevation.
• A simple and explainable structure that facilitates identification of fundamental behaviors and dynamic couplings.
• Ease of modification, enabling component redesign and controller integration.
• Practical applicability, supporting both real-turbine deployment and small-scale experimental testing, and offering a flexible platform for evaluating new configurations such as vertical-axis rotors or irregular wave conditions.
The remainder of this paper is organized as follows. Section 2 reviews related work on floating offshore wind turbine modelling and control. Section 3 presents the dynamic mathematical model of the FOWT, with detailed formulations for translational motion (Section 3.1) and rotational motion (Section 3.2). Section 4 describes the external forces and torques acting on the system, including hydrodynamic forces (Section 4.1), aerodynamic forces (Section 4.2), wind turbine rotor dynamics (Section 4.3), and the overall model integration and coupling strategy (Section 4.4). Section 5 focuses on the identification of the NREL 5-MW FOWT model, covering the turbine description (Section 5.1), the excitation–response framework (Section 5.2), and the identification procedure (Section 5.3). Section 6 provides the analysis and control design, including frequency-domain characterization (Section 6.1) and the development and validation of the proposed control approach (Section 6.2). Finally, Section 7 summarizes the main conclusions and outlines directions for future research.
Floating offshore wind turbines (FOWTs) present complex modeling challenges due to the coupled interactions between aerodynamic, hydrodynamic, and mooring forces, combined with rotor and platform dynamics. Accurate, computationally efficient models are essential for both design and control. Lauria et al. [7] review analytical, experimental, and numerical approaches, highlighting the importance of capturing these coupled dynamics. Despite this wealth of research, many models focus on specific turbine types or operational conditions, leaving a gap for general, low-order, physically interpretable formulations suitable for barge-type FOWTs under realistic sea states.
State-space models have been widely employed to describe FOWT dynamics in a control-oriented manner. Homer and Nagamune [10] develop a physics-based model for a semisubmersible platform, capturing nonlinear interactions across six platform and two drivetrain degrees of freedom (DOFs). Basbas et al. [11] review nonlinear control-oriented FOWT models, comparing architectures and performance but without providing a generalizable framework. Other works, such as Tang et al. [12], Cho et al. [13], and Barcena and Etxebarria [14], focus on linearized or system-identified models for pitch control or structural loads, often limited to onshore or fixed-bottom turbines. While state-space formulations offer a structured approach for control design, many fail to capture full rotor-platform coupling, gyroscopic effects, or generalized wave excitation, limiting their applicability for barge-type floating platforms.
Reduced order and simplified models address computational efficiency while retaining essential dynamic behavior. Lerch et al. [15] present a simplified spar-type FOWT model using Morison equation hydrodynamics and nonlinear aerodynamics for time-domain analysis. Karimirad and Moan [16] propose a rigid-body simplification validated against SIMO–Riflex simulations. López-Queija et al. [17] develop a two-dimensional reduced model representing the FOWT as two bodies connected by a flexible beam, validated against OpenFAST, and later extend this to a Python-based framework [18] for rapid controller implementation. Villoslada et al. [19] present a barge-type reduced-order model linearized around small pitch angles, emphasizing iterative identification and validation. These studies demonstrate that reduced-order models can achieve reasonable fidelity, but are often restricted to limited load cases or small-angle approximations, and may omit gyroscopic and multi-DOF interactions critical for control-oriented applications.
Control-oriented modeling has received increasing attention as the demand for real-time, physically interpretable FOWT models grows. Pan et al. [20] propose a low-order multi-body model for floating wind farms with shared moorings, emphasizing early-stage design rather than direct control applications. López-Queija et al. [17] present a four-DOF reduced linear model relying on precomputed aerodynamic and hydrodynamic loads, suitable for preliminary design and control studies, but limited by dependency on lookup tables. Amouzadrad et al. [21] highlight hydroelastic effects and gap resonance in floating structures, often neglected in simplified models, while de N Santos et al. [22] apply physics-informed neural networks for fatigue estimation in monopile turbines, emphasizing long-term load prediction rather than dynamic control. Li et al. [23] develop a Lagrangian low-order model for bottom-fixed turbines with four DOFs under thruster-based station-keeping, showing minimal gyroscopic influence under normal wind but significant effects under extreme turbulent conditions. Ahmad et al. [24] combine floating turbines with oscillating water columns using machine-learning-based estimators for pitch dynamics, prioritizing predictive control over physical transparency. Muro et al. [25] and Pegalajar-Jurado and Lio [26] present reduced-order linearized models with integrated controllers, focusing on stability and closed-loop performance, yet often omitting explicit force- and torque-based representations and gyroscopic dynamics. Álvarez and Santos [27] developed a control-oriented simulation model to analyze interactions between wind turbine controller actions and floating-platform stability in doubly-fed induction generator (DFIG) floating offshore turbines.
Gyroscopic effects play a critical role in floating turbine dynamics. Chen et al. [28] derive an analytical expression for the gyroscopic moment of a spar-type FOWT and verify it with FAST simulations, showing linear dependence on rotor inertia, rotor speed, and platform motion. Høeg and Zhang [29] extend this with a 17-DOF Euler–Lagrange model and state-space formulation, demonstrating that spar-type FOWTs are highly sensitive to gyroscopic couplings, and neglecting these effects can lead to significant overestimation of tower torsion. Fenu et al. [30] model a 5-MW FOWT equipped with a gyroscopic stabilizer, showing substantial damping of platform motion and additional power generation in harsh weather. Soleymani and Norouzi [31] design a hybrid passive/active gyro device for the NREL 5-MW turbine, effectively reducing tower base overturning moments. Wang et al. [32,33] propose control-oriented frameworks for floating platforms integrating gyroscopic coupling with LQG and fuzzy controllers, while Wang et al. [34] study semi-submersible turbines both experimentally and numerically, demonstrating passive gyro stabilizers reduce pitch motion and tower-top displacement. Li et al. [35] further show that for bottom-fixed turbines, gyroscopic effects are minor under normal conditions but become significant under extreme winds with yaw misalignment, illustrating the importance of including these effects in control-oriented models.
Limitations of existing simulation tools are also evident. Medium-fidelity codes such as OpenFAST, HAWC2, SIMPACK, SIMA, and OrcaFlex are widely used for validation and controller development [6,36,37], but rely on simplifying assumptions, which can reduce accuracy relative to high-fidelity CFD simulations. Otter et al. [6] classify modeling approaches across fidelity levels, emphasizing the trade-off between computational cost and precision. High-fidelity CFD solvers (OpenFOAM, ANSYS) provide greater accuracy but at high computational cost and require careful validation. Gyroscopic effects, rotor-platform couplings, and finite platform motions are frequently omitted, leading to non-negligible errors in tower torsion and global platform dynamics [23,29,34,38]. This highlights the ongoing need for efficient, physics-based, control-oriented models that retain key dynamics without excessive computational expense.
Vertical-axis wind turbines (VAWTs), while less common offshore, pose similar modeling challenges [39]. High-fidelity CFD models capture dynamic stall, blade–wake interaction, and 3D flow phenomena [40,41] but at high computational cost. Reduced-order aerodynamic models such as streamtube-based SM and DMST [42] offer physical transparency and computational efficiency, and coupling with data-driven methods [43] improves predictive capability. For floating VAWTs, fully coupled CFD–FEA aero-hydro-elastic models [44] can accurately capture loads and structural responses, but complexity reinforces the need for simplified, control-oriented models.
Collectively, the literature demonstrates substantial advances in modeling FOWTs, from state-space formulations to reduced-order and control-oriented approaches, as well as in the consideration of gyroscopic effects. However, most studies focus on spar-type or semi-submersible platforms, specific operational scenarios, or limited DOFs, and few provide force- and torque-based, physically interpretable frameworks suitable for barge-type FOWTs. In contrast, the present work develops a first-principles, low-order, force- and torque-based model for barge-type FOWTs, explicitly incorporating translational, rotational, and gyroscopic dynamics, and using relative wave elevation as excitation. This formulation is computationally efficient, physically transparent, and directly applicable to controller design, bridging the gap between high-fidelity simulations and existing engineering models while enabling a unified framework for both dynamic analysis and control synthesis.
3 Dynamic Mathematical Model of the FOWT
This section presents the mathematical formulation of the proposed floating offshore wind turbine (FOWT) model. The objective is to derive a control-oriented, physically interpretable representation of the platform dynamics based on force and torque balances.
The equations of motion of a floating offshore wind turbine (FOWT) include numerous nonlinear contributions arising from aerodynamics, hydrodynamics, catenary forces, viscous and aerodynamic damping, and large displacements. The dynamics of the turbine are governed by interactions among its various components, including the blades, rotor, generator, tower, mooring lines, and floating platform. Fig. 1 illustrates the primary elements of a barge-type FOWT along with the main environmental disturbances: wind and waves.

Figure 1: Main components of a barge-type FOWT and reference axes: three controllable-pitch blades, a nacelle with gearbox and generator, the tower, and mooring lines connecting the barge to the seabed. The x-axis is aligned with the wind direction, the z-axis is vertical, and the y-axis is orthogonal to x and z.
The FOWT is modeled as a rigid body with six DoF describing its motion and orientation, plus one additional DoF for the rotor speed. The translational degrees of freedom correspond to surge, sway, and heave, while the rotational degrees correspond to pitch, roll, and yaw (Fig. 1). The x-axis is aligned with the wind direction, toward which the nacelle is oriented; the z-axis is vertical with respect to the sea surface, and the y-axis is orthogonal to both x and z axes. Rotations about these axes—roll, pitch, and yaw—represent the angular motion relative to the inertial reference frame. Pitch and roll in particular can induce large oscillations of the nacelle in fore-aft and lateral directions, potentially causing structural damage. In the model, the wind is assumed to act along the x-axis, whereas wave forces may originate from arbitrary directions. Hydrodynamic forces due to currents are considered negligible for control purposes, as they primarily produce translational displacement without generating aggressive nacelle oscillations. Table 1 summarizes some of the main variables and parameters of the mathematical model.

The dynamic mathematical model presented in this Section 3 is organized into two Sections 3.1 and 3.2, that introduce a linear state-space formulation that describes the translational and rotational dynamics separately for clarity, with couplings incorporated subsequently.
Indeed, the inherently coupling of these models (Sections 3.1 and 3.2) is implemented in Section 4.4. Specifically, it considers the coupling of translational degrees to rotational degrees, which is more relevant than the reverse. This coupling is explicitly incorporated into the model through the torque terms, which depend on translational velocities and accelerations. The influence of rotational motion on translational dynamics is comparatively smaller and is therefore neglected to preserve model simplicity.
Besides, in the following development the wind turbine is considered a rigid body because platform movements are more significant than those due to the tower flexibility, something that does not occur in offshore bottom-fixed or onshore turbines. However, the elasticity of the mooring lines is included by restoring coefficients.
At the equilibrium point of this system, it is possible to express the dynamic model of the three degrees of translation as a state-space dynamic equation written as
where
• The variables
• The variables
The term M is the total mass of the system, which includes the added mass. The equation can be normalized by dividing by M.
The matrix
where:
•
•
•
The summation
Similarly to the translational motion, the dynamic model of the rotational degrees at the equilibrium point can be expressed as,
where
• The variables
• The variables
• The vector
• The summation
The term I is the inertia tensor of the system. The equation can be normalized by multiplying by the inverse of this matrix. The matrix
where:
•
•
•
In Eq. (4), the gyroscopic effect introduces feedback in the system. The gyroscopic torque vector
where:
•
•
where
Therefore, the model of the FOWT dynamics is represented by two linear vector equations, Eqs. (1) and (4), which represent respectively the translational and rotational motions of the wind turbine. The inputs to these equations are the hydrodynamic (Section 4.1) and aerodynamic (Section 4.2) forces and torques, generated by the external disturbances (waves and wind), to which the control action will then be added.
In the model, the system inputs consist of forces and torques induced by external perturbations—namely waves (Section 4.1) and wind (Section 4.2)—as well as control actuators, which are detailed later. A simplified wind turbine model is presented in Section 4.3, which contributes gyroscopic torque and aerodynamic forces to the platform dynamics. Finally, Section 4.4 integrates all modules into a coupled model that captures the primary feedback and interactions, providing the foundation for system identification and control design.
To study and illustrate the hydrodynamic forces and torques generated by waves, the motion of a semi-submerged object is analyzed (Fig. 2). Due to the internal motion of the water particles, a drag force is produced at the bottom of the wave that attracts the object laterally. The object is pushed upwards but is then dragged laterally and finally is carried towards the bottom of the wave. The rectangle in Fig. 2 represents the FOWT barge, where the Center of Gravity (CoG) must be below the Center of Buoyancy (CoB) for the platform to be stable. In contrast, the Center of Aerodynamics (CoA) can be above both, near the nacelle.

Figure 2: Horizontal and vertical hydrodynamic forces of FOWT platform are functions of the relative wave.
For waves of significant height, i.e., large waves relative to the size of the platform, these forces will be perceived as out of phase with respect to the time at which the wave crest reaches the CoG of the barge. This lag can be modeled as a combination of the wave elongation and its derivative, which is advanced ¼ cycle, as expressed in (9).
where
If the wavelength is very large compared to the dimensions of the barge, the signals can be assumed to be in phase with the waves or their derivative.
• A drag force proportional to the relative velocity of the water with respect to the floating object appears in the horizontal plane. This force is ¼ cycle ahead of the vertical force. It can therefore be modeled as a linear function of the derivative of the wave which introduces that lag.
where
• An elastic force is exerted on the vertical axis. This force can be expressed as a function of the elevation of the wave with respect to the object floating, i.e., the relative distance between the height of the wave and the height of the object.
where
The hydrodynamic external torque,
For small platform angles, the vector
In addition to the hydrodynamic disturbances caused by waves, the aerodynamic effects generated by wind must be considered. The two components of the aerodynamic forces acting on the wind turbine blades can be expressed in terms of the wind speed (
• The blades lift force (
• The blades drag force
where,
The values of the local lift and drag coefficients, as well as other parameters, may vary depending on the design and specific operational conditions of the wind turbine. For a control-oriented model, a rotor averaged performance of lift and drag forces around the nominal conditions is more appropriate. The tip speed ration is function of
where
For wind aligned with the nacelle, lateral and vertical aerodynamic forces can be neglected, resulting in the vector of aerodynamic forces shown in Eq. (18).
• The aerodynamic forces acting on the wind turbine generate the following torque components:
• The torque on the x-axis is the torque of rotor, i.e.,
• The torque on the y-axis is the pitching torque, i.e.,
• The torque on the z-axis can be neglected if the nacelle is oriented to the wind, as it is usually the case.
For small pitch angles, under nominal conditions the external torque vector may be approximated by Eq. (19).
The lateral forces that would appear if there were a yaw alignment error have not been considered, since it is assumed that the nacelle is aligned with the wind by the wind turbine’s yaw control, although in any case these effects will be lower than the considered drag force (Eq. (18)).
4.3 Wind Turbine Rotor Dynamics
In a wind turbine, it is common to control the rotor speed through two signals: the electromagnetic torque,
The rotor and generator are connected by a gearbox with a ratio of N, and therefore their angular velocities are proportional. Thus, the dynamics of the entire system can be modeled as a function of the rotor’s angular velocity, including the equivalent inertia of the generator. For this purpose, the effective inertia of the system is defined as
Although the system behaves as a first-order system with respect to the rotor’s angular velocity, the electrical component of the generator is subject to inductive effects. These effects introduce extra inertia into the generator current; therefore, it is necessary to add another order to the model by introducing the derivative of the angular velocity in the system state. The wind turbine’s behavior is represented in Eq. (20).
where:
• The wind turbine state vector is given by,
• The variables
• The term
The matrix
where:
•
•
The dynamics of the wind turbine are perturbed by a sum of different torques acting on the rotor:
•
•
At nominal conditions the wind torque input may be approximated by Eq. (23), where
The electromagnetic torque input may be approximated by Eq. (24), where
This mathematical development captures the main forces and moments acting on the FOWT.
4.4 Model Integration and Coupling
Once the different forces and moments experienced by a wind turbine have been obtained, this section performs an integration of the different components of the dynamic model to analyze the coupling between the DoFs. Fig. 3 shows a block diagram that considers the main couplings between translational, rotational, and wind-turbine DoFs in response to external disturbances. The system is composed of linear blocks with feedback, which facilitates its identification through classical techniques.

Figure 3: Integration of external forces and torques in the FOWT model. The external inputs are waves and wind (blocks with a white background). Based on the calculation of effective waves and wind, the two upper blocks represent the translational dynamics of the FOWT, the middle ones the dynamics of the wind turbine, and the lower ones the rotational dynamics of the FOWT including gyroscopic torque.
The inputs to the model are wind speed and wave elongation. For cross-swells, the effective waves that excite the degrees of freedom (x, y, θ, ϕ) can be modeled as a function of the wave direction, γ, as described in Eq. (25).
Furthermore, the surge and sway motions affect the effective wave through the feedback from Eq. (2). Regarding the effective wind speed captured by the wind turbine, it is disturbed by the fore–aft motion of the nacelle, due mainly to the rotational motion of the FOWT, and is therefore represented by feedback from Eq. (4).
The force module, represented by Eqs. (10)–(12) and (18), works with the relative wave elongation,
The wind turbine model, Eq. (20), is excited by the aerodynamic and generator torques, Eqs. (23) and (24), which are functions of the effective wind and the control signals. In addition, the wave disturbance affects these torques as a simplified way to represent the effect of nacelle motion.
It is important to point out that the translational model shown in Eq. (2) influences the rotational model presented in Eq. (4) through feedback in the torque module, but not the other way around. Because they are independent, the translational model can be identified in advance. This significantly reduces the number of parameters to be estimated at each stage of identification. The relative signals used in the model can be measured in an experimental setting for identification purposes.
In a model as this, with so numerous feedback loops, achieving convergence is challenging. Therefore, less significant components were excluded when describing the forces. In addition, the model was further simplified by retaining only the dominant effects. As shown later, these components can be identified separately, leading to a stable model.
5 Identification of the NREL 5 MW FOWT Model
The parameters of the general model presented in the previous section are identified for a specific turbine. Synthetic data for all degrees of freedom (DoFs) considered in the simplified model were generated using the high-fidelity simulation software OpenFAST. These data were subsequently used to identify the parameters of the proposed linear model via the MATLAB System Identification Toolbox.
This work employs the National Renewable Energy Laboratory (NREL) 5 MW floating offshore wind turbine [46], specifically mounted on the ITI Energy barge platform [47]. The main characteristics of this FOWT are summarized in Table 2. The turbine features an 8-line mooring system (two lines at each barge corner) and is a variable-speed, collective pitch-controlled machine.

Model identification requires exciting the system around its nominal operating point. To this end, the FOWT was subjected to realistic input signals. To ensure sufficient excitation of the relevant dynamics, the OpenFAST simulations are performed under combined wind and wave loading conditions. The wind field is generated using a turbulent wind model, while wave excitation corresponds to a predefined sea state. Fig. 4 shows the excitation signals over two intervals: 0–600 s (used for model identification) and 600–1200 s (used for validation). The inputs comprise wind, wave, and actuator control signals, as shown in Fig. 4.

Figure 4: Excitation signals for system identification. Time series of irregular wave elevation (blue), wind speed (orange), collective blade-pitch angle (yellow), and generator torque (purple) over the identification and validation periods.
The FOWT was excited with high-irregular waves corresponding to Sea State Number (SSN) 6 on the Douglas Sea Scale, generated using a JONSWAP spectrum [48] to induce significant barge motion. Waves were introduced at a
Wind speed, generated around 14 m/s, incorporates small step changes (Fig. 4, orange line) to perturb the system’s gain and dynamics.
Actuator signals—collective blade-pitch angle and generator torque—were designed as chirp signals comprising segments of varying frequency and amplitude (Fig. 4, yellow and purple lines). This design excites the system over a broad frequency range to facilitate comprehensive dynamic identification.
The OpenFAST response of the 5 MW FOWT to these excitations is shown in Fig. 5 (top) depicts the rotor speed (rpm, blue line) and generator output power (MW, orange line). External disturbances from wind and waves significantly affect both variables. Step-like changes in wind speed produce corresponding transient responses. Furthermore, nacelle motion modulates the effective wind speed, inducing oscillations in rotor speed and power, primarily driven by wave-induced rotational dynamics. These simulations were performed without feedback control; consequently, increased wind speed leads to uncontrolled rotor acceleration and higher power generation.

Figure 5: Open fast response of the 5 MW barge FOWT to excitation signals. Top, rotor speed (blue) and generated power (orange). Middle, translational degrees of freedom, heave (black), sway (orange) and scaled-down surge (blue). Bottom, rotational degrees of freedom, roll (blue), pitch (orange) and yaw (black).
Wave excitation perturbs all DoFs (Fig. 5, middle and bottom). As anticipated, wind primarily affects surge (Fig. 5, middle, blue line) and induces a mean offset in pitch (Fig. 5, bottom, orange line). Even more, as shown in Fig. 5 (the middle one), the surge can cause the FWOT structure to shift approximately 20 m. This occurs when the wind begins to push and the turbine moves backward, because the mooring lines allow this drift. Therefore, to identify the model, it will be necessary to use the wave displaced to the FOWT position, which will be handled by the effective wave block in Fig. 3.
Rotor speed variations must be included in the model due to their influence on the gyroscopic effect’s angular momentum and the blades’ aerodynamic coefficients. For translational DoFs: surge exhibits a strong, wind-dependent response; sway shows a transient followed by an oscillatory, wave-dominated response; and heave correlates directly with wave elevation. For rotational DoFs: roll and pitch are highly correlated with waves, while yaw responds at distinctly different frequencies. Additional coupling effects between DoFs, though not visually apparent, will be captured via mathematical identification.
Control actuators are incorporated as model inputs. For the 5 MW barge-type turbine, as for most wind turbines, two control signals are available: generator electromagnetic torque (
While rotor speed (
where coefficients are normalized by the wind turbine effective inertia
The translational DoF equations are:
where coefficients are normalized by the FOWT mass and added mass,
As a result, added mass effects are implicitly included in the normalized model coefficients, even though they are not modeled explicitly as separate terms.
The rotational DoF equations are:
where coefficients are normalized by the FOWT inertia
The parameters for the selected FOWT were estimated using OpenFAST simulation data and the MATLAB System Identification Toolbox. Discrete transfer functions for the seven Eqs. (26)–(32) were identified using ARX (Autoregressive with Exogenous Input) models [49]. This choice is motivated by the need for a computationally efficient and transparent identification framework that is consistent with the control-oriented nature of the proposed model. Both wind and wave excitations are considered, depending on the degree of freedom being identified. The ARX structure employed two poles to capture the common second-order dynamics and a zero for inputs with derivative influence.
Fig. 6 validates the identified model (orange dashed line) against the OpenFAST nonlinear simulation (blue line). The root mean square error (RMSE) between the signals quantifies the model accuracy.

Figure 6: Model validation for rotor speed (top) and generated electrical power (bottom). OpenFAST high-fidelity simulation (blue) vs. identified linear model (dashed orange).
The identified model replicates the OpenFAST response effectively, capturing the correct frequencies and amplitudes for both rotor speed and power. Output power is proportional to rotor speed and generator torque; the identified proportionality constant encapsulates the gearbox ratio and generator efficiency.
Fig. 7 shows the validation for the translational DoFs, with fit quality assessed via the RMSE. The identified model accurately captures surge behavior despite its distinct frequency response. Sway is well-represented at low frequencies, though some high-frequency components are less precise. Heave is modeled with high fidelity. Cumulative errors for surge and sway are minimized.

Figure 7: Model validation for translational DoFs: surge (top), sway (middle) and heave (bottom). OpenFAST simulation (blue) vs. identified ARX model (orange dashed).
Similarly, Fig. 8 presents the validation for rotational DoFs. Roll and pitch, which exhibit predominantly linear behavior, are identified accurately. Yaw dynamics are more nonlinear, resulting in a less precise match; the model captures the frequency but slightly underestimates the amplitude, suggesting a potential need for a more complex nonlinear model for this DoF.

Figure 8: Model validation for rotational DoFs: roll (top), pitch (middle) and yaw (bottom). OpenFAST simulation (blue) vs. identified ARX model (orange dashed).
The fitted discrete models were converted to continuous state-space to extract the parameters in Eqs. (26)–(32). For the rotational DoFs (Eqs. (30)–(32)), the resulting identified transfer functions yield the following continuous representations (coefficients rounded for brevity):
For pitch and roll, the identification achieved optimal results considering only disturbances (waves, wind) and relevant control signals (blade-pitch and, for roll, generator torque). Other inputs provided negligible improvement. Yaw dynamics are distinct, being directly perturbed only by waves. While control signals have no direct effect, gyroscopic coupling with pitch and rotor speed are significant perturbations.
As a summary, it is possible to conclude that
• Roll and pitch are linear and well-identified.
• Surge and heave capture hydrodynamic and aerodynamic influences accurately.
• Yaw requires consideration of nonlinear effects for higher fidelity.
• Couplings between DoFs are effectively represented by torque and gyroscopic interactions.
This section analyzes the system response to wave perturbations in the frequency domain [50]. The primary objective is to identify which degrees of freedom (DoFs) most critically affect energy production and which pose the greatest risk to structural stability and safety. Ensuring structural integrity and preventing emergency shutdowns is paramount, with particular concern for the pitch and roll DoFs. Oscillations in these modes induce fore-aft and side-to-side nacelle movements, leading to accelerated fatigue and potential structural damage.
Waves represent the dominant external disturbance, especially under aggressive sea states common in many offshore locations. The analysis focuses on the frequency response of the rotational DoFs (roll, pitch, yaw) to wave excitation characterized by a JONSWAP spectrum for Sea State Number 6 (SSN6), which provides significant energy to excite these modes.
Fig. 9 compares the power spectral density (PSD) of SSN6 waves with the magnitude (gain) of the transfer functions from wave excitation to the rotational DoFs, as derived from the identified models (Eqs. (33)–(35)).

Figure 9: Wave disturbance and rotational DoF frequency response. Wave power spectral density (blue solid line) and magnitude of the transfer functions for Wave-to-Roll (red dashed), Wave-to-Pitch (yellow dash-dot), Wave-to-Yaw (purple dotted), and the gyroscopic Pitch-to-Yaw coupling (green dotted).
The resonance frequencies for roll (red) and pitch (yellow) align closely with the peak of the wave energy spectrum. In contrast, the yaw mode (purple) resonates at a significantly lower frequency. This confirms that roll and pitch are more susceptible to direct wave excitation, as observed in the time-domain simulations. Furthermore, when waves approach at an oblique heading angle, the effective wavelength increases (and the effective frequency decreases), potentially shifting the spectral peak closer to the pitch and roll natural frequencies and thereby amplifying oscillations.
The gyroscopic coupling from pitch to yaw (green), calculated by applying the pitch gain to the identified pitch-to-yaw transfer function, exhibits two minor peaks at the natural frequencies of yaw and pitch. Its magnitude decays rapidly across most of the wave frequency range, indicating a secondary influence compared to direct wave excitation. This coupling between yaw and pitch through the gyroscopic effect means that if we reduce the pitch oscillation, we will also automatically reduce the yaw oscillations. Nevertheless, in light of the results, as explained in the roll control problem, the gyroscopic moments of the rotor and the generator could have cancelled each other out by design. To give greater weight to the gyroscopic effect, it would be necessary to redesign the gearbox to avoid a change in the direction of rotation.
Altering the resonant frequencies of critical DoFs would require structural redesign—a core aspect of control co-design that relies on a deep understanding of the system dynamics. The presented frequency-domain analysis provides a tool for iteratively evaluating new designs and formulating mathematical criteria for performance optimization.
An alternative solution is to implement active control loops that modify the dynamic response of the resonant DoFs, attenuating peak gains and reducing damaging oscillations. To demonstrate this approach, a simple control loop is designed using the identified linear model and subsequently validated on the high-fidelity nonlinear simulation.
6.2 Control Design and Validation
A control strategy is proposed to modify the turbine’s dynamic response by feeding back rotational states to the available actuators. The design is based on the identified transfer functions relating the control signals (collective blade-pitch angle,
Initial analysis considers proportional (P) feedback. The root locus for roll control (Fig. 10) indicates that, in principle, stable closed-loop poles can be achieved using either the blade-pitch or generator torque actuator.

Figure 10: Root locus for roll DoF control. System poles (x’s and squares for open and closed loop) and zeros (circles) with proportional feedback via (left) blade-pitch angle and (right) generator torque. Open and closed loop poles are overlapped.
However, the FOWT presents a strongly under-actuated control problem: the authority of the actuators is severely limited relative to the disturbance forces acting on the platform. Realistic maximum feedback gains must be estimated based on actuator saturation limits and expected oscillation amplitudes. Assuming actuation margins of ±8° for blade-pitch and ±15 kNm for generator torque, and desired control ranges of ±10° for roll and ±5° for pitch, the maximum feasible gains are calculated (Table 3).

Applying these maximum gains to the roll loop results in closed-loop poles (blue squares in Fig. 10) virtually overlapping the open-loop poles, indicating negligible performance improvement. The blade-pitch effect on roll is inherently weak. The similarly weak effect of generator torque was unexpected and is likely due to the gearbox configuration. Typically, the generator rotor turns opposite to the blades to mitigate gyroscopic effects, causing the generator’s electromagnetic torque to be compensated by the aerodynamic torque on the blades, nullifying its net effect on the roll moment. This insight highlights how such analysis can inform co-design, suggesting that a gearbox redesign could enhance this control pathway.
In contrast, proportional control for the pitch DoF shows greater promise. The root locus (Fig. 11, left) allows for meaningful pole relocation. The achievable closed-loop poles (blue squares), constrained by the maximum gain from Table 3, provide a damping ratio of approximately 0.4.

Figure 11: Root locus for pitch DoF control. With proportional (P) control (left). With Proportional-Derivative (PD) control (right). Open-loop poles (circles), closed-loop poles with P regulator (squares), and with PD controller (triangles).
Performance is improved by adding a derivative (D) term to provide phase lead, increasing the damping ratio. The resulting PD controller places the closed-loop poles closer to the real axis (blue triangles, Fig. 11, right). With the actuator saturation constraint, the achievable closed-loop system has a damping ratio of 0.27 and a natural frequency of 0.45 rad/s, moving it farther from the peak wave excitation frequency. The designed PD controller is:
The effectiveness of the PD controller is first evaluated in the frequency domain (Fig. 12). The closed-loop transfer function (yellow, top) shows a significant reduction and shift of the resonance peak compared to the open-loop system (orange). The bottom graph plots the product of the wave PSD and the pitch gain, representing the propagated energy density. The reduction in the area under this curve (the integral) provides a direct index for control tuning or co-design optimization.

Figure 12: Frequency-domain analysis of pitch control. Top: Magnitude of the open-loop (orange) and PD closed-loop (yellow) transfer functions gain from waves to pitch vs. wave energy density (blue). Bottom: Propagated wave energy density spectrum for the open-loop (blue) and closed-loop (orange) cases and integral values.
Time-domain verification using the linear model (Fig. 13) confirms the controller’s performance. Under combined wind and irregular wave disturbances, the PD controller (black line, top) reduces the pitch oscillation amplitude from approximately 6° to 3°, compared to the uncontrolled response (blue line). The phase shift observed in both responses is induced by the wind disturbance. To discount this shift, the standard deviation is used as a performance index, yielding a reduction factor of 0.43 with PD control. The corresponding control signal (bottom) remains within the specified ±8° limit, saturating only rarely.

Figure 13: Linear model time-domain verification of pitch PD control. Top: Pitch angle for the uncontrolled (blue) and PD-controlled (black) linear model. Bottom: Applied blade-pitch control signal.
Finally, the controller is validated on the high-fidelity OpenFAST nonlinear model (Fig. 14). The PD control law (Eq. (36), with

Figure 14: Nonlinear model (OpenFAST) validation of pitch control. Top: Pitch angle for the uncontrolled (blue) and PD-controlled (black) nonlinear model simulation. Bottom: Applied blade-pitch control signal.
The results closely match the linear model verification. The PD controller reduces pitch oscillations from ~6° to ~3°, with brief intervals near 4° due to strong wind events that induce a mean pitch offset—an effect the controller cannot fully reject due to performance limitations. Consequently, the reduction in the standard deviation index is slightly less pronounced than in the linear case. The control signal operates within its bounds, oscillating around the nominal value and only deviating significantly to counteract sustained wind-induced moments. This confirms the appropriateness of the gain limitation and demonstrates the successful translation of the linear design to the complex nonlinear system.
Wind energy is fundamental to the global transition towards sustainable power. The expansion into offshore environments, particularly with floating wind turbines (FOWTs), introduces significant engineering and control challenges related to dynamic stability and load mitigation in harsh marine conditions. To enhance the efficiency and structural integrity of these systems, there is a pressing need for simulation models that facilitate both the redesign of components and the synthesis of advanced control strategies.
This work addresses this need by developing and validating a simplified, interpretable linear model of a FOWT, derived from first principles. The model successfully encapsulates the essential dynamics, including aerodynamic, hydrodynamic, inertial, and gyroscopic couplings between the platform’s six degrees of freedom, the rotor, and the primary actuators. Its key advantage lies in its utility as a rapid and transparent tool for parametric studies, control design, and preliminary co-design analysis, bridging the gap between complex high-fidelity simulation and conceptual engineering.
Although the modelling methodology based on the analysis of the forces can be applied to any floating device, the model’s fidelity was rigorously demonstrated through identification from and validation against the industry-standard OpenFAST high-fidelity software for the NREL 5 MW barge-type reference turbine. This software is accepted as a standard in the literature given the lack of real data on wave activity relative to the turbine.
Crucially, a pitch control strategy designed solely using this simplified model was successfully implemented on the full nonlinear OpenFAST simulation. In general terms, it has been shown that the energy density for the entire frequency range is reduced by about 50% in the closed-loop against the open-loop for at SSN 6. When tested for these extreme conditions, the platform pitch amplitude was kept below 10°, validating the model’s approximation for these conditions and proving its practical value for control-co-design workflows. In fact, it is assumed that floating wind turbines must cease production for structural safety reasons if platform oscillations exceed 10 degrees, as blade movement contributes to this instability. Therefore, the article identifies the model for a sea state that generates oscillations around this magnitude. For lower sea states, the wind turbine can operate normally, and control would not be necessary. For higher sea states, this model would still be valid since it captures larger rotations very well (Fig. 8), but the actuators would likely not provide sufficient actuation capacity to control the system, as this is a significantly under-actuated control problem.
The subsequent analysis yielded several critical insights. The frequency-domain study quantitatively confirmed that pitch and roll are the modes most susceptible to wave-induced resonance, directly linking external excitation to structural fatigue. Furthermore, the control analysis revealed a fundamental limitation: the severe under-actuation of the platform stabilization problem. Specifically, the achievable control authority for roll mitigation is constrained by existing mechanical design choices, such as gearbox configurations that cancel actuator effects. This finding strongly advocates for an integrated control-structure co-design philosophy from the earliest development stages. Conversely, the gyroscopic coupling, often viewed as a disturbance, was characterized and could potentially be harnessed in future designs for passive or semi-active vibration mitigation.
In summary, this research provides a validated methodological framework that connects system identification, dynamic analysis, and constrained control design for FOWTs. The implications extend the tools available for engineers to expand the operational envelope and longevity of floating wind turbines, contributing to the advancement of more reliable and cost-effective marine renewable energy technologies.
Looking ahead, this foundation opens several productive avenues for future work. The logical next step is to leverage the identified model within advanced, multi-variable control architectures, such as Model Predictive Control (MPC) or robust
Acknowledgement: Authors would like to acknowledge the initial work done by Msc. student I. Galeote.
Funding Statement: This research has been partially supported by the Spanish Ministry of Science and Innovation under the MCI/AEI/FEDER project number PID2021-123543OBC21 and PID2024-155653OB-C21.
Author Contributions: The authors confirm contribution to the paper as follows: conceptualization, Segundo Esteban and Matilde Santos; methodology, Segundo Esteban; software, Segundo Esteban; validation, Segundo Esteban; formal analysis, Matilde Santos; investigation, Segundo Esteban and Matilde Santos; resources, Matilde Santos; writing—original draft preparation, Segundo Esteban; writing—review and editing, Matilde Santos; visualization, Segundo Esteban; supervision, Matilde Santos; project administration, Matilde Santos; funding acquisition, Matilde Santos. All authors reviewed and approved the final version of the manuscript.
Availability of Data and Materials: The authors confirm that the data supporting the findings of this study are available within the article.
Ethics Approval: Not applicable.
Conflicts of Interest: The authors declare no conflicts of interest.
References
1. COP28. United Nations climate change conference. 2023 [Cited 2025 Jan 1]. Available from: https://www.cop28.com/en/. [Google Scholar]
2. Tiismus H, Maask V, Astapov V, Korõtko T, Rosin A. State-of-the-art review of emerging trends in renewable energy generation technologies. IEEE Access. 2025;13(1):10820–43. doi:10.1109/ACCESS.2025.3528640. [Google Scholar] [CrossRef]
3. Kusuma YF, Fuadi AP, Al Hakim B, Sasmito C, Nugroho ACPT, Khoirudin MH, et al. Navigating challenges on the path to net zero emissions: a comprehensive review of wind turbine technology for implementation in Indonesia. Results Eng. 2024;22(1):102008. doi:10.1016/j.rineng.2024.102008. [Google Scholar] [CrossRef]
4. Grasu G, Liu P. Risk assessment of floating offshore wind turbine. Energy Rep. 2023;9:1–18. doi:10.1016/j.egyr.2022.11.147. [Google Scholar] [CrossRef]
5. Yang HS, Alkhabbaz A, Lee YH. Toward reliable FOWT modeling: a new calibration approach for extreme environmental loads. Energies. 2025;18(20):5545. doi:10.3390/en18205545. [Google Scholar] [CrossRef]
6. Otter A, Murphy J, Pakrashi V, Robertson A, Desmond C. A review of modelling techniques for floating offshore wind turbines. Wind Energy. 2022;25(5):831–57. doi:10.1002/we.2701. [Google Scholar] [CrossRef]
7. Lauria A, Loprieno P, Francone A, Leone E, Tomasicchio GR. Recent advances in understanding the dynamic characterization of floating offshore wind turbines. Ocean Eng. 2024;307(10):118189. doi:10.1016/j.oceaneng.2024.118189. [Google Scholar] [CrossRef]
8. Fossen TI. Guidance and control of ocean vehicles. Chichester, UK: Wiley; 1994. [Google Scholar]
9. NREL. OpenFAST documentation. Golden, CO, USA: National Renewable Energy Laboratory; 2025 [cited 2025 Jan 1]. Available from: https://openfast.readthedocs.io/en/main/. [Google Scholar]
10. Homer JR, Nagamune R. Physics-based 3-D control-oriented modeling of floating wind turbines. IEEE Trans Control Syst Technol. 2018;26(1):14–26. doi:10.1109/TCST.2017.2654420. [Google Scholar] [CrossRef]
11. Basbas H, Liu YC, Laghrouche S, Hilairet M, Plestan F. Review on floating offshore wind turbine models for nonlinear control design. Energies. 2022;15(15):5477. doi:10.3390/en15155477. [Google Scholar] [CrossRef]
12. Tang S, Tian D, Huang M, Li B, Tao L. Load control optimization method for offshore wind turbine based on LTR. Energy Rep. 2021;7(12):4288–97. doi:10.1016/j.egyr.2021.07.009. [Google Scholar] [CrossRef]
13. Cho S, Gao Z, Moan T. Model-based fault detection of blade pitch system in floating wind turbines. J Phys Conf Ser. 2016;753(9):092012. doi:10.1088/1742-6596/753/9/092012. [Google Scholar] [CrossRef]
14. Barcena R, Etxebarria A. Active structural load mitigation in wind turbines using linear unique model predictive control. IEEE Trans Sustain Energy. 2025:1–13. doi:10.1109/tste.2025.3641374. [Google Scholar] [CrossRef]
15. Lerch M, De-Prada-Gil M, Molins C. A simplified model for the dynamic analysis and power generation of a floating offshore wind turbine. E3S Web Conf. 2018;61:00001. doi:10.1051/e3sconf/20186100001. [Google Scholar] [CrossRef]
16. Karimirad M, Moan T. A simplified method for coupled analysis of floating offshore wind turbines. Mar Struct. 2012;27(1):45–63. doi:10.1016/j.marstruc.2012.03.003. [Google Scholar] [CrossRef]
17. López-Queija J, Robles E, Llorente JI, Touzon I, López-Mendia J. A simplified modeling approach of floating offshore wind turbines for dynamic simulations. Energies. 2022;15(6):2228. doi:10.3390/en15062228. [Google Scholar] [CrossRef]
18. López-Queija J, Sotomayor E, Jugo J, Aristondo A, Robles E. A novel Python-based floating offshore wind turbine simulation framework. Renew Energy. 2024;222:119973. doi:10.1016/j.renene.2024.119973. [Google Scholar] [CrossRef]
19. Villoslada D, Santos M, Tomás-Rodríguez M. General methodology for the identification of reduced dynamic models of barge-type floating wind turbines. Energies. 2021;14(13):3902. doi:10.3390/en14133902. [Google Scholar] [CrossRef]
20. Pan Q, Yu W, Cheng PW. Simplified modeling of floating offshore wind farms with shared mooring line configurations. Ocean Eng. 2025;327(01):121018. doi:10.1016/j.oceaneng.2025.121018. [Google Scholar] [CrossRef]
21. Amouzadrad P, Mohapatra SC, Soares CG. Review of recent developments on the hydroelastic response and gap resonance of multi-body floating structures. Ocean Eng. 2024;313(2):119398. doi:10.1016/j.oceaneng.2024.119398. [Google Scholar] [CrossRef]
22. de N Santos F, D’Antuono P, Robbelein K, Noppe N, Weijtjens W, Devriendt C. Long-term fatigue estimation on offshore wind turbines interface loads through loss function physics-guided learning of neural networks. Renew Energy. 2023;205(1):461–74. doi:10.1016/j.renene.2023.01.093. [Google Scholar] [CrossRef]
23. Li S, Hong KS, Li A, Huang G, Li X. Control-oriented modeling of floating offshore wind turbines. IFAC-PapersOnLine. 2025;59(17):155–60. doi:10.1016/j.ifacol.2025.10.156. [Google Scholar] [CrossRef]
24. Ahmad I, M’Zoughi F, Aboutalebi P, Garrido I, Garrido AJ. Hybrid offshore wind turbines: control-oriented modeling approaches. In: Innovations in renewable energies offshore. Boca Raton, FL, USA: CRC Press; 2024. p. 511–7. [Google Scholar]
25. Muro JL, Condomines JP, Bilgen O, Burlion L. Control-oriented modeling of a floating offshore wind turbine. In: Proceedings of the 2023 IEEE Conference on Control Technology and Applications (CCTA); 2023 Aug 16–18; Bridgetown, Barbados. p. 208–13. [Google Scholar]
26. Pegalajar-Jurado A, Lio AW. A control-oriented model for floating wind turbine stability and performance analysis. J Phys Conf Ser. 2023;2626(1):012068. doi:10.1088/1742-6596/2626/1/012068. [Google Scholar] [CrossRef]
27. Álvarez AFO, Santos M. Mechanical stability analysis of a DFIG floating offshore wind turbine using an oriented-control model. IEEE Lat Am Trans. 2023;21(1):91–7. doi:10.1109/TLA.2023.10015130. [Google Scholar] [CrossRef]
28. Chen JH, Pei AG, Chen P, Hu ZQ. Study on gyroscopic effect of floating offshore wind turbines. China Ocean Eng. 2021;35(2):201–14. doi:10.1007/s13344-021-0018-z. [Google Scholar] [CrossRef]
29. Høeg CE, Zhang Z. The influence of gyroscopic effects on dynamic responses of floating offshore wind turbines in idling and operational conditions. Ocean Eng. 2021;227(8):108712. doi:10.1016/j.oceaneng.2021.108712. [Google Scholar] [CrossRef]
30. Fenu B, Attanasio V, Casalone P, Novo R, Cervelli G, Bonfanti M, et al. Analysis of a gyroscopic-stabilized floating offshore hybrid wind-wave platform. J Mar Sci Eng. 2020;8(6):439. doi:10.3390/jmse8060439. [Google Scholar] [CrossRef]
31. Soleymani M, Norouzi M. Active gyroscopic stabilizer to mitigate vibration in a multimegawatt wind turbine. Wind Energy. 2021;24(7):720–36. doi:10.1002/we.2599. [Google Scholar] [CrossRef]
32. Wang H, Zhou JW, Zhai E, Yang JH, Tang H, Li QS, et al. Gyroscopic effect-driven dynamics and incremental LQG tracking control for floating offshore wind turbines. Ocean Eng. 2025;342(1):123075. doi:10.1016/j.oceaneng.2025.123075. [Google Scholar] [CrossRef]
33. Wang J, Li H, Zhang J, Guan D, Lin X, Chen H. Experimental investigations in the effect of passive gyro stabilizers on the pitch motion of a semi-submersible floating wind turbine. Ocean Eng. 2025;321(10):120403. doi:10.1016/j.oceaneng.2025.120403. [Google Scholar] [CrossRef]
34. Wang W, Li H, Yang Y, Sheng K, Chen L. Stability analysis of semi-submersible floating wind turbines based on gyro-turbine coupled dynamics model. Front Mar Sci. 2025;12:1597408. doi:10.3389/fmars.2025.1597408. [Google Scholar] [CrossRef]
35. Li X, Xu Z, Basu B, Alujevic N, Habib G, Zhang Z. Dynamic modeling and analysis of gyroscopic effects in bottom-fixed wind turbines under normal and extreme wind conditions. Renew Energy. 2026;256(1):124678. doi:10.1016/j.renene.2025.124678. [Google Scholar] [CrossRef]
36. Tran TT, Ross H, Wiley W, Wang L, Sirnivas S. High- and mid-fidelity modeling comparison for a floating marine turbine system. In: Proceedings of the ASME 2024 43rd International Conference on Ocean, Offshore and Arctic Engineering; 2024 Jun 9–14; Singapore. [Google Scholar]
37. Fadaei S, Afagh FF, Langlois RG. A survey of numerical simulation tools for offshore wind turbine systems. Wind. 2024;4(1):1–24. doi:10.3390/wind4010001. [Google Scholar] [CrossRef]
38. Gong Y, Yang Q, Geng H, Meng W, Wang L. Dynamic modeling and control for an offshore semisubmersible floating wind turbine. IEEE Trans Automat Sci Eng. 2025;22(11):12371–82. doi:10.1109/tase.2025.3541730. [Google Scholar] [CrossRef]
39. Salvador-Gutierrez B, Sanchez-Cortez L, Hinojosa-Manrique M, Lozada-Pedraza A, Ninaquispe-Soto M, Montaño-Pisfil J, et al. Vertical-axis wind turbines in emerging energy applications (1979–2025global trends and technological gaps revealed by a bibliometric analysis and review. Energies. 2025;18(14):3810. doi:10.3390/en18143810. [Google Scholar] [CrossRef]
40. Didane DH, Behery MR, Al-Ghriybah M, Manshoor B. Recent progress in design and performance analysis of vertical-axis wind turbines—a comprehensive review. Processes. 2024;12(6):1094. doi:10.3390/pr12061094. [Google Scholar] [CrossRef]
41. Fazlizan A, Muzammil WK, Al-Khawlani NA. A review of computational fluid dynamics techniques and methodologies in vertical axis wind turbine development. Comput Model Eng Sci. 2025;144(2):1371–437. doi:10.32604/cmes.2025.067854. [Google Scholar] [CrossRef]
42. Gitifar S, Zahedi R, Ziaie S, Mirzaei AM, Forootan MM. Review of different vertical axis wind turbine modeling methods. Future Energy. 2024;3(1):23–33. doi:10.55670/fpll.fuen.3.1.4. [Google Scholar] [CrossRef]
43. Sanchez-Rivera LM, Díaz-Salgado J, Huerta-Chávez OM, García-Barrera J. Experimental and dynamic modeling of a variable-pitch VAWT using a neural network and the DMST model. Appl Sci. 2025;15(20):10989. doi:10.3390/app152010989. [Google Scholar] [CrossRef]
44. Luo W, Liu W, Chen S, Zou Q, Song X. Development and application of an FSI model for floating VAWT by coupling CFD and FEA. J Mar Sci Eng. 2024;12(4):683. doi:10.3390/jmse12040683. [Google Scholar] [CrossRef]
45. Muñoz-Palomeque E, Sierra-García JE, Santos M. Intelligent control techniques for maximum power point tracking in wind turbines. Rev Iberoam De Automática E Informática Ind. 2024;21(3):193–204. [Google Scholar]
46. Jonkman JM. Dynamics of offshore floating wind turbines—model development and verification. Wind Energy. 2009;12(5):459–92. doi:10.1002/we.347. [Google Scholar] [CrossRef]
47. Jonkman JM, Matha D. Dynamics of offshore floating wind turbines—analysis of three concepts. Wind Energy. 2011;14(4):557–69. doi:10.1002/we.442. [Google Scholar] [CrossRef]
48. Hasselmann DE, Dunckel M, Ewing JA. Directional wave spectra observed during JONSWAP 1973. J Phys Oceanogr. 1980;10(8):1264–80. doi:10.1175/1520-0485(1980)010. [Google Scholar] [CrossRef]
49. Kon J, Yamashita Y, Tanaka T, Tashiro A, Daiguji M. Practical application of model identification based on ARX models with transfer functions. Control Eng Pract. 2013;21(2):195–203. doi:10.1016/j.conengprac.2012.09.021. [Google Scholar] [CrossRef]
50. Serrano-Antoñanazas M, Sierra-Garcia JE, Santos M, Tomas-Rodríguez M. Identification of vibration modes in floating offshore wind turbines. J Mar Sci Eng. 2023;11(10):1893. doi:10.3390/jmse11101893. [Google Scholar] [CrossRef]
Cite This Article
 Copyright © 2026 The Author(s). Published by Tech Science Press.
This work is licensed under a Creative Commons Attribution 4.0 International License , which permits unrestricted use, distribution, and reproduction in any medium, provided the original work is properly cited.
 Downloads
 Citation Tools