
 Login
Login Register
 Submit a Paper
 Propose a Special lssue
 Open Access
ARTICLE
Short-Term Photovoltaic Power Prediction Based on IWOA-TCN-BiGRU-MATT
1 China Electric Power Research Institute Co., Ltd., Beijing, China
2 School of Electrical and Automation, Wuhan University, Wuhan, China
* Corresponding Author: Hengrui Ma. Email:
(This article belongs to the Special Issue: Intelligent Control and Machine Learning for Renewable Energy Systems and Industries)
Computer Modeling in Engineering & Sciences 2026, 148(3), 24 https://doi.org/10.32604/cmes.2026.081823
Received 09 March 2026; Accepted 27 May 2026; Issue published 28 September 2026
 View Full Text
 Download PDF
Abstract
To address the challenges of significant nonlinearity, intricate temporal interdependencies, and the tendency to get stuck in local optima during parameter tuning in short-term photovoltaic (photovoltaic, PV) power forecasting, this paper puts forward a hybrid model called IWOA-TCN-BiGRU-MATT. This model fuses the IWOA (Improved Whale Optimization Algorithm, IWOA) with the TCN (Temporal Convolutional Network, TCN), BiGRU (Bidirectional Gated Recurrent Unit, BiGRU), and MATT. By leveraging IWOA to boost parameter optimization efficiency and integrating TCN’s ability to extract multi-scale features, BiGRU’s bidirectional temporal modeling, and MATT’s emphasis on key features, the model aims to realize high-precision PV power prediction. Based on measured data from a PV power station in Central China, experimental findings show that the proposed model surpasses competing methods under various meteorological scenarios, demonstrating improved prediction accuracy under different weather conditions.Keywords
The global energy structure is accelerating its transition to low-carbon development. As a crucial component of clean and renewable energy, PV generation capacity continues to expand globally and plays a pivotal role in realizing carbon-neutrality objectives. Yet its intrinsic variability makes short-horizon forecasting indispensable for grid scheduling and safe system operation for maintaining grid load balance, improving photovoltaic consumption rates, and reducing curtailment rates. The accuracy of such predictions directly impacts the reliability of power system dispatching and operational safety [1,2].
Current research on short-term photovoltaic power prediction mainly faces two core challenges. First, the comprehensiveness and accuracy of feature extraction are insufficient. Existing single prediction models (e.g., ELM, GRU), LSTM (Long Short-Term Memory Network, LSTM) can fit the nonlinear and temporal features of photovoltaic power to a certain extent but fail to simultaneously capture nonlinear relationships, temporal dependencies, and multi-source meteorological interactions [3–5]. Although some hybrid models (e.g., VMD-KELM [6], TCN-BiLSTM) have achieved improvements, they still have obvious shortcomings: EMD is prone to mode mixing; traditional VMD requires manual setting of the number of decompositions; models without attention mechanisms struggle to focus on key temporal features under complex weather conditions; and single GRU models ignore bidirectional temporal dependence, failing to fully utilize the correlation between historical and future data [7–11]. These deficiencies are particularly prominent in complex scenarios such as cloudy or rainy weather, giving rise to a marked increase in prediction deviations. However, these models still lack a unified framework that simultaneously addresses feature extraction, temporal dependency modeling, and global parameter optimization.
Second, the generalization capability achieved through model parameter optimization and multi-dimensional features is inadequate. Traditional intelligent optimization algorithms (e.g., WOA (Whale Optimization Algorithm, WOA), DBO (Dance Behavior Optimization, DBO) [12,13], AHA (Adaptive Hopping Algorithm, AHA)) often suffer from limited global search capabilities, making them prone to local optima. This hinders their ability to efficiently optimize key parameters in hybrid models (e.g., TCN’s convolution kernels and dilation coefficients, BiGRU ’s hidden unit number, ELM’s kernel parameters and regularization coefficients). Additionally, some studies fail to fully integrate multi-dimensional meteorological features (e.g., key meteorological parameters such as solar radiant energy, surrounding temperature, air moisture, and wind speed magnitude) with power station operation data (e.g., component status, energy consumption level), or adopt imprecise feature selection methods (e.g., MIC (Maximal Information Coefficient, MIC), Spearman Correlation Coefficient [14–16]). This results in poor generalization of prediction models, which are difficult to adapt to the needs of different seasons and power stations.
In summary, current short-term PV power prediction faces three core challenges: strong nonlinearity of PV power, complex temporal dependencies, and susceptibility to local optima in model parameter optimization. Existing approaches comprise both standalone models (e.g., ELM, GRU) and partially integrated hybrid architectures (e.g., VMD-KELM (Variational Mode Decomposition-Kernel Extreme Learning Machine, VMD-KELM), TCN-BiLSTM)—have obvious limitations: insufficient comprehensiveness and accuracy in feature extraction, as well as weak adaptability in model parameter optimization and multi-dimensional feature fusion. To address these issues, a composite forecasting framework termed IWOA–TCN–BiGRU–MATT is designed, where an enhanced whale-inspired optimizer is combined with temporal convolution, bidirectional recurrent modeling, and multi-head attention modules. Its key contributions are as follows:
1. An improved whale optimization algorithm is proposed by integrating Logistic chaotic mapping, Lévy flight and Golden Sine strategies. These modifications respectively enhance the initial population diversity, global exploration capability and local exploitation performance of the standard WOA. Taking validation-set RMSE as the fitness function, IWOA is adopted to optimize key model parameters, such as TCN convolution kernels, BiGRU hidden units and MATT attention heads.
2. Multi-Module Feature Capture: The temporal convolution layers capture localized sequential structures through dilated causal filters and residual pathways. Parallel BiGRU branches extract forward–backward temporal cues, while the attention module adaptively highlights pivotal intervals such as high-irradiance hours.
3. Optimized Data Handling: DBSCAN removes outliers, cubic spline interpolation (irradiance-power correlation) fills missing values, and wavelet thresholding reduces noise; Spearman analysis selects 5 highly relevant features to cut redundancy and enhance data quality.
The structure of this paper is arranged in the following sequence: Section 2 elaborates on the research methodologies, Section 3 conducts analyses of case studies, Section 4 performs analysis and discussion, and Section 5 summarizes the entire research.
2.1 Temporal Convolutional Network (TCN)
TCN is a variant of CNNs (Convolutional Neural Networks, CNNs) specifically designed for time-series data. It overcomes the limitations of traditional CNNs—such as their inability to capture long-range dependencies in time-series tasks—and the drawbacks of Recurrent Neural Networks (RNNs/LSTMs/GRUs), such as weak parallel computing capabilities and low training efficiency [17,18]. TCN has shown excellent performance in time-series forecasting tasks. For PV power forecasting, its dilated convolution can effectively capture the multi-scale fluctuation features of PV power caused by irradiance changes and cloud cover, while the residual connection can alleviate the gradient vanishing problem in deep network training, which is more suitable for extracting local temporal features of 15-min short-term PV sequences.
Causal Convolution: Ensures that the output at the current time step only depends on the current and previous inputs, avoiding the leakage of future information. Meanwhile, a 1D fully convolutional network is used to maintain consistent input and output lengths. Let the input time series be
where: K denotes the length of the convolution kernel, ensuring that
Dilated Convolution: introduces spacing between convolution kernels, allowing the network to capture long-range dependencies, which is particularly useful for modeling rapid fluctuations in photovoltaic power caused by sudden irradiance changes without increasing computational complexity Its mathematical expression is:
Residual Connection: By introducing residual connections, TCN can better train deep networks. Each residual block in this structure contains two convolutional layers with dilation factors, which adopt causal convolution and ReLU activation function, respectively. After each convolution, weight normalization and Dropout regularization are applied to improve the stability of network training, prevent overfitting, and alleviate the gradient vanishing problem. Fig. 1 displays the residual module.
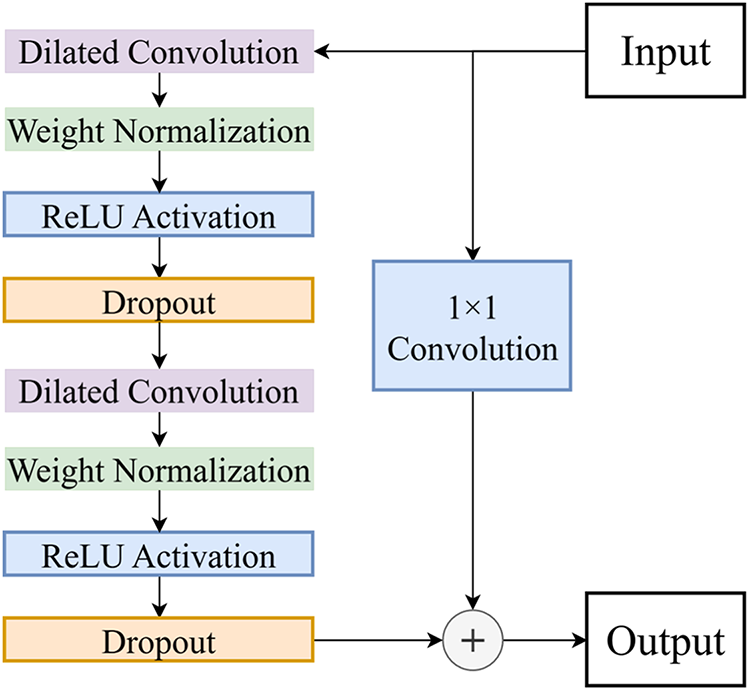
Figure 1: Residual module.
2.1.1 Bidirectional Gated Recurrent Unit (BiGRU)
The BiGRU block essentially integrates a “bidirectional recurrent architecture” with a “gated recurrent unit”. Its overall workflow consists of three core steps: the module includes two parallel branches (forward GRU unit and backward GRU unit) that process time-series data from different directions. Each time step in the figure (e.g., the middle column corresponding to
In this context,
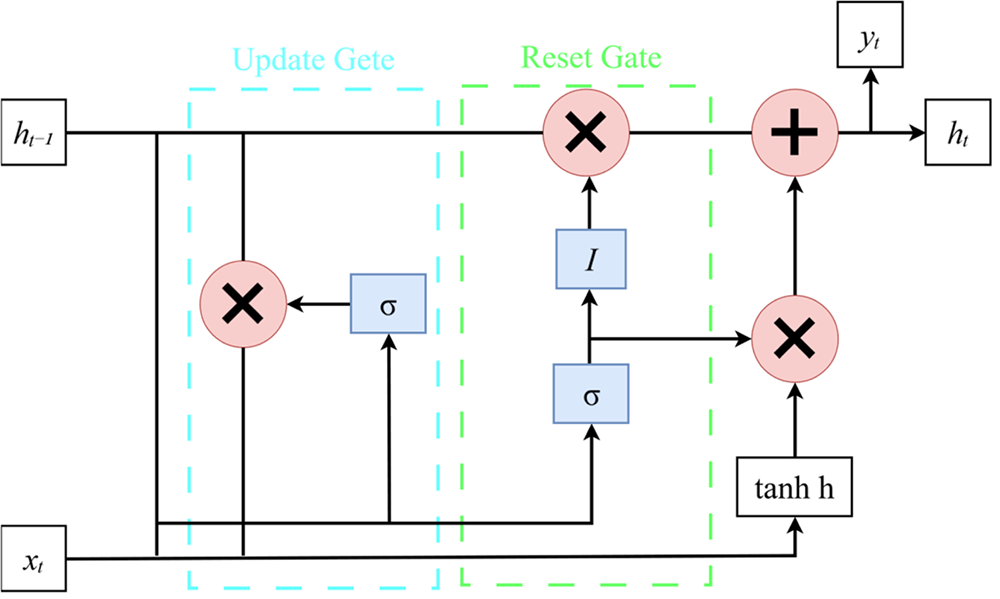
Figure 2: GRU network structure.
Within the given equations: GRU (⋅) signifies the computational procedure of the GRU. Specifically,
At each time step t, the forward and backward GRU units produce their own respective hidden states, which are denoted as
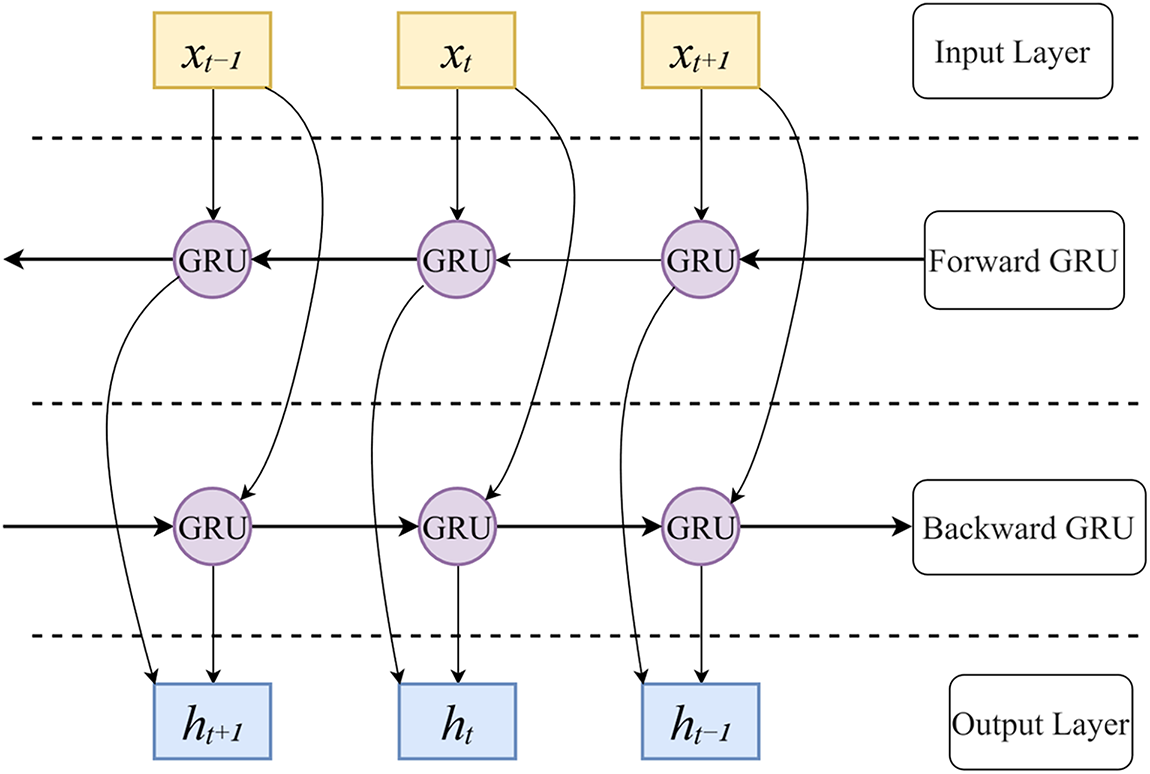
Figure 3: BiGRU architecture.
2.1.2 Multi-Head Attention (MATT)
As an extension of the standard attention mechanism, the multi-head attention mechanism splits the model’s dimension into several heads, where all heads compute attention concurrently yet yield distinct representations; the results are then concatenated. This design allows the model to learn different attention patterns in various representation subspaces, thereby capturing more comprehensive information. For instance, some heads may focus on short-term local correlations in the data, while others excel at mining long-term global dependencies—enabling the model to capture richer and more diverse information [21–24].
Within multi-head attention, three vectors are involved: the query vector Q, key vector K, and value vector V, all derived from the input vector It at time t. Based on these three vectors, computation via the scaled dot-product attention function yields the output below:
Unlike the Luong attention mechanism, when the dimension
In the multi-head mechanism, Q, K, and V are linearly projected h times, resulting in:
here,
All single-head attention results are first concatenated, then projected through the learnable weight
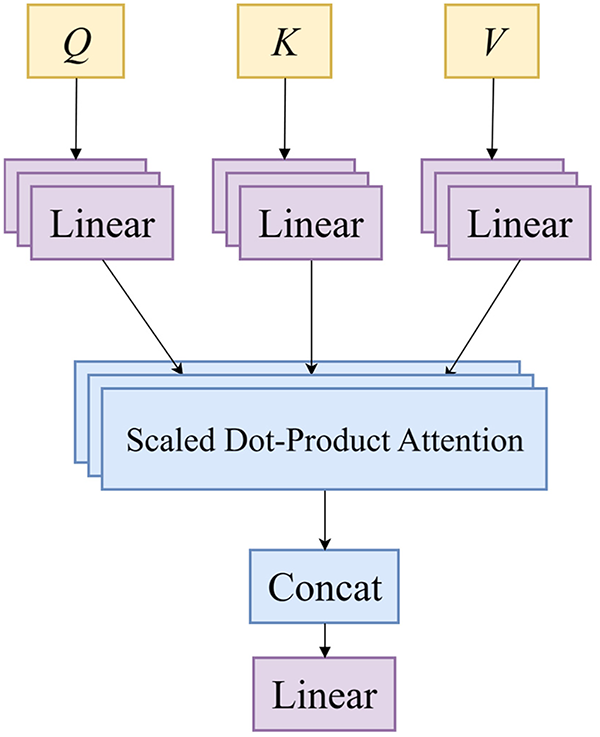
Figure 4: Architecture of the multi-head attention unit.
Photovoltaic power generation data is inherently complex, driven by numerous interacting factors and marked by strong temporal characteristics. The incorporation of multi-head attention allows the model to discern intricate dependencies across different time horizons. When combined with TCN and BiGRU, the architecture orchestrates a cohesive framework: TCN provides robust local feature extraction, BiGRU facilitates bidirectional temporal understanding, and multi-head attention dynamically weights the most influential time steps. This proves especially valuable during critical phenomena such as weather shifts or variations in solar exposure, enabling the model to prioritize these pivotal moments, which significantly enhances forecasting accuracy and produces results that closely reflect actual power dynamics.
2.2 Improved Whale Optimization Algorithm
2.2.1 Whale Optimization Algorithm (WOA)
The WOA is a metaheuristic algorithm inspired by the foraging behavior of humpback whales, particularly their unique “bubble-net” hunting technique and social interactions. It addresses complex optimization problems by mathematically modeling three key behaviors: encircling prey, executing spiral bubble-net movements, and randomly searching for prey. The algorithm is characterized by its simple structure, minimal parameter requirements, and strong convergence performance.
First, population initialization is performed: n search individuals (whales) are randomly generated, and the position of each individual is a dim-dimensional vector (aligning with the solution of the optimization task). The position must satisfy the maximum and minimum bounds of the variables [
where
The algorithm sets the position of the current best individual as the “prey” position, while other individuals move closer to it. The position update formula is as follows:
here,
here, a is a convergence factor that decreases linearly from 2 to 0 throughout the iterations, governing the search process. Meanwhile,
Bubble-Net Attack Stage: Whales approach prey in a spiral path. The update formula is:
where D′ denotes the Euclidean distance between the current candidate solution X(t) and the current best solution
In the prey searching stage, the algorithm shifts its strategy. Instead of following the current best solution, it randomly chooses another individual to guide the search, helping to broaden the search and avoid local optima. The update formula is:
where
2.2.2 Improved Whale Optimization Algorithm (IWOA)
Notwithstanding its capabilities in global exploration and local exploitation, the WOA has certain deficiencies, including a tendency to get trapped in local optima and an ineffective balance between exploitation and exploration. The following strategies are introduced at different phases of the algorithm to ameliorate its convergence accuracy and stability.
1. Logistic Chaotic Mapping
To counteract the limited diversity in the initial population and the tendency for local optima entrapment in the standard WOA, the initialization stage is refined by integrating Logistic chaotic mapping, defined by the following equation:
The control parameter
2. Levy Flight Strategy
Aiming at the weak directionality and low efficiency of random search in the global exploration stage of the standard WOA, to augment the search process, the algorithm employs the Lévy flight strategy. Levy flight is a random walk pattern with a heavy-tailed distribution, and its step size follows the Levy distribution [26]. It can generate a movement trajectory combining short-distance local searches with occasional long-distance jumps—a characteristic that highly matches the behavior of whales searching for prey in the vast ocean. The position update formula is:
here:
3. Golden Sine Strategy
To enhance the local exploitation efficiency and convergence precision of the WOA, the Golden-SA—a hybrid metaheuristic integrating sinusoidal operations with the golden section coefficient—is incorporated to refine the algorithm’s position updating rules. The strategy is mathematically grounded in the cyclic traversal characteristics of the sine function over the unit circle, together with the golden ratio’s efficient space-partitioning ability [27]. During the local exploitation phase of the WOA, the conventional prey encircling mechanism is improved as described below:
In the equation:
To further evaluate the effectiveness of each improvement strategy in the proposed IWOA, an ablation study is conducted, as shown in Table 1. Specifically, the Logistic chaotic mapping, Lévy flight, and Golden Sine strategies are removed individually to assess their contributions.
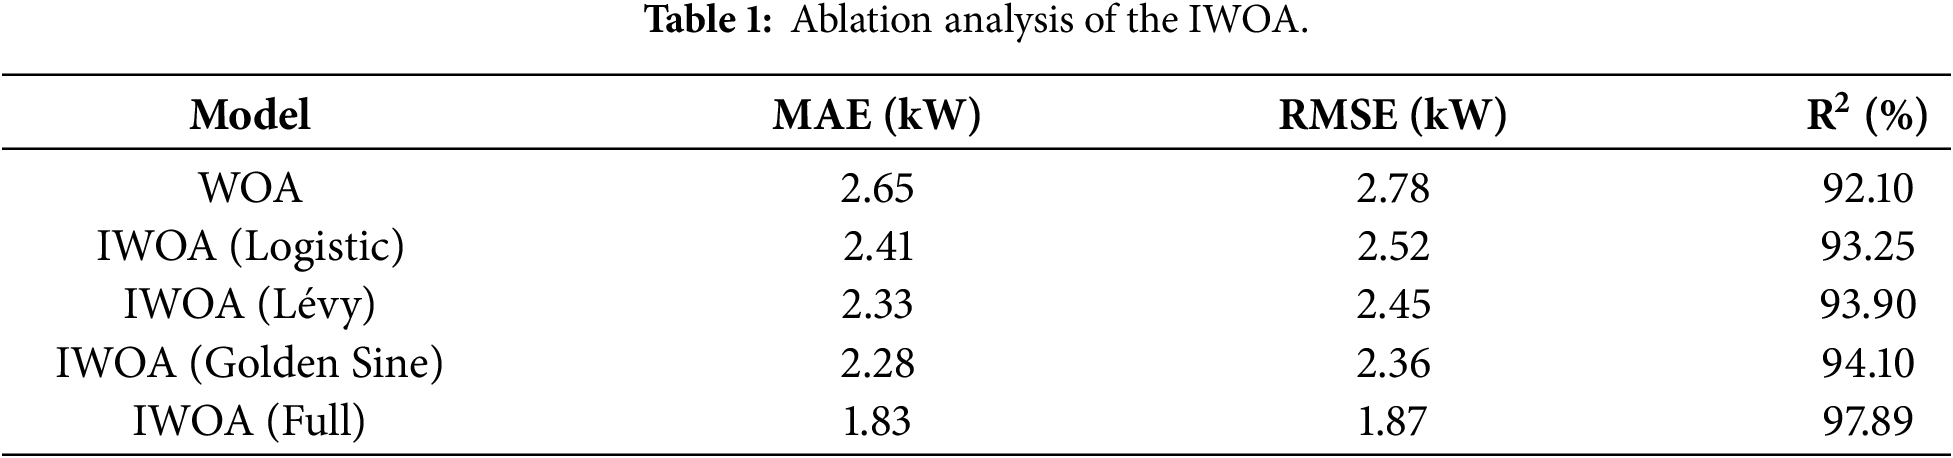
As observed, each component contributes to performance improvement to varying degrees. Compared with the original WOA, all improved variants achieve lower MAE and RMSE, indicating enhanced optimization capability. Among them, removing the Lévy flight or Golden Sine strategy leads to a more noticeable performance degradation, suggesting that these components play a critical role in balancing global exploration and local exploitation.
The full IWOA model achieves the best performance, demonstrating that the integration of all three strategies effectively enhances the optimization process.
The Golden Sine strategy orchestrates an intelligent search within promising regions via the golden section coefficient and harmonizes exploration and exploitation using the sine function’s periodicity. This enhancement allows the algorithm to leverage historical information more effectively during local refinement, leading to a more directed and purposeful search. Consequently, it significantly accelerates convergence and improves solution accuracy. The workflow of the IWOA is depicted in Fig. 5.
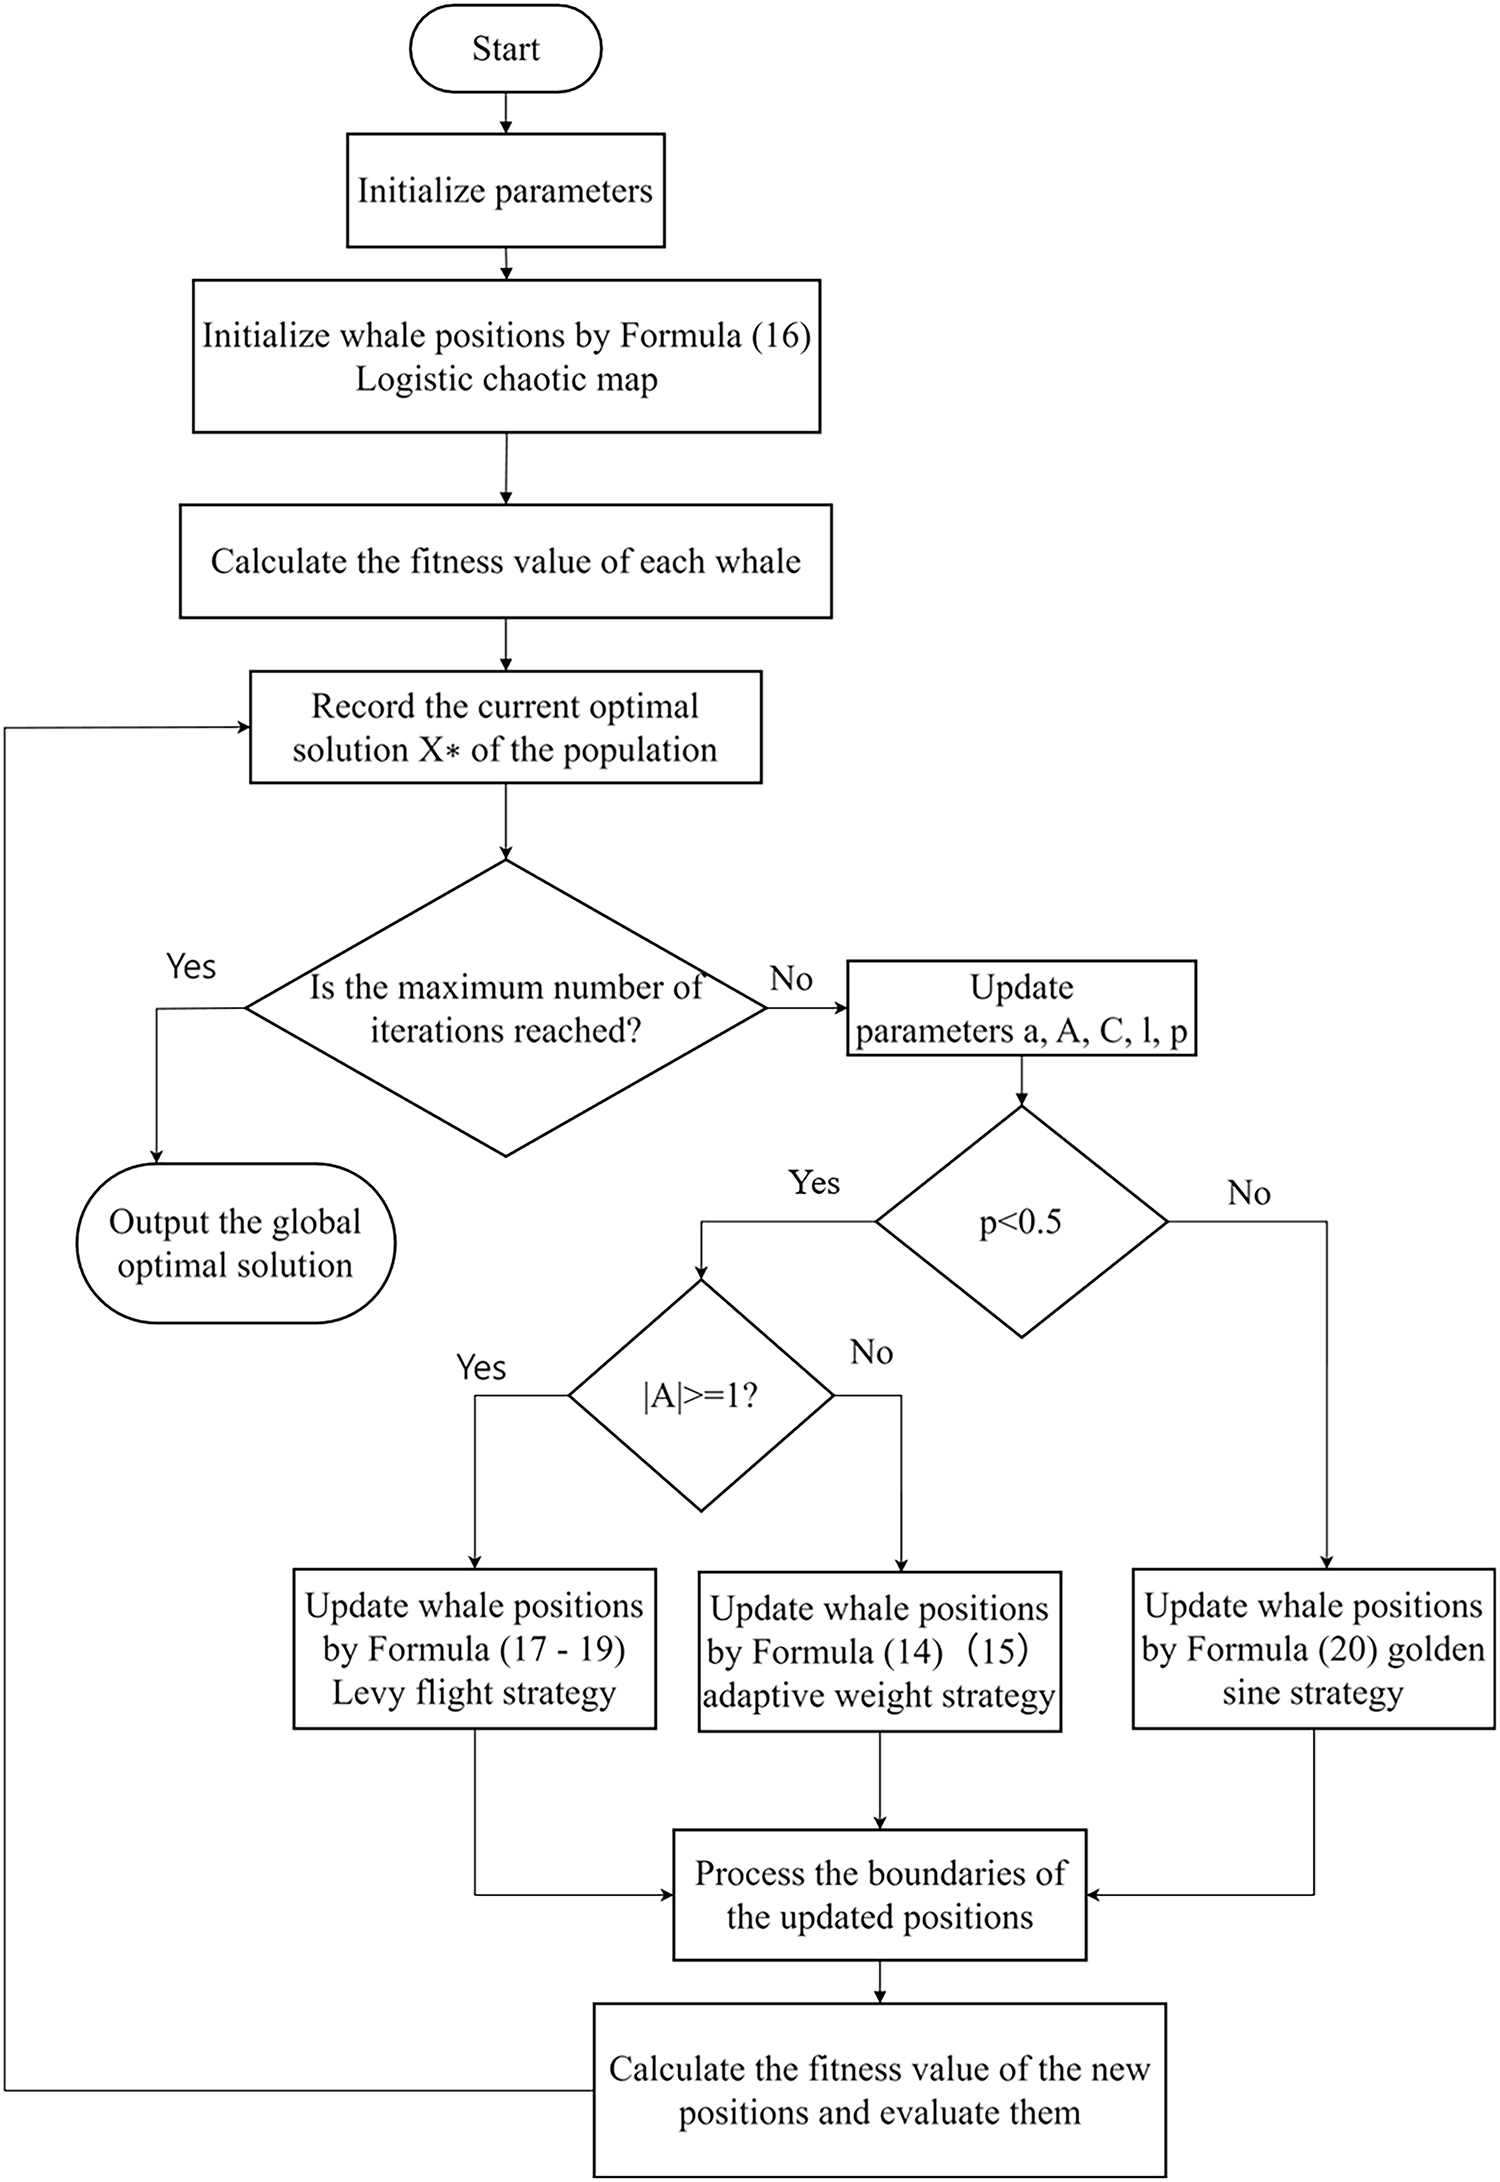
Figure 5: IWOA algorithm flowchart.
2.2.3 Algorithm Performance Testing
The efficacy of the Improved Whale Optimization Algorithm (IWOA) was evaluated using four CEC2022 benchmark functions (F2, F4, F7, F9) in comparative tests with the original WOA, Beluga Whale Optimization (BWO), and Coyote Optimization Algorithm (COA). The CEC2022 benchmark, introduced by the IEEE Congress on Evolutionary Computation, encompasses 12 standard functions that serve as fundamental metrics for evolutionary algorithm performance. The chosen functions encapsulate representative optimization scenarios—high-dimensional multi-modal, shifted rotated multi-modal, constrained multi-modal, and hybrid multi-modal—thereby constituting an authoritative standard for evaluation.
The simulation environment utilized a Windows 11 system powered by an Intel Core i5 CPU and 16 GB RAM, with all computations performed in MATLAB 2024a. All algorithms were uniformly configured with a population size of 30 and were run for 1000 iterations. The convergence characteristics of each algorithm are depicted in Fig. 6.
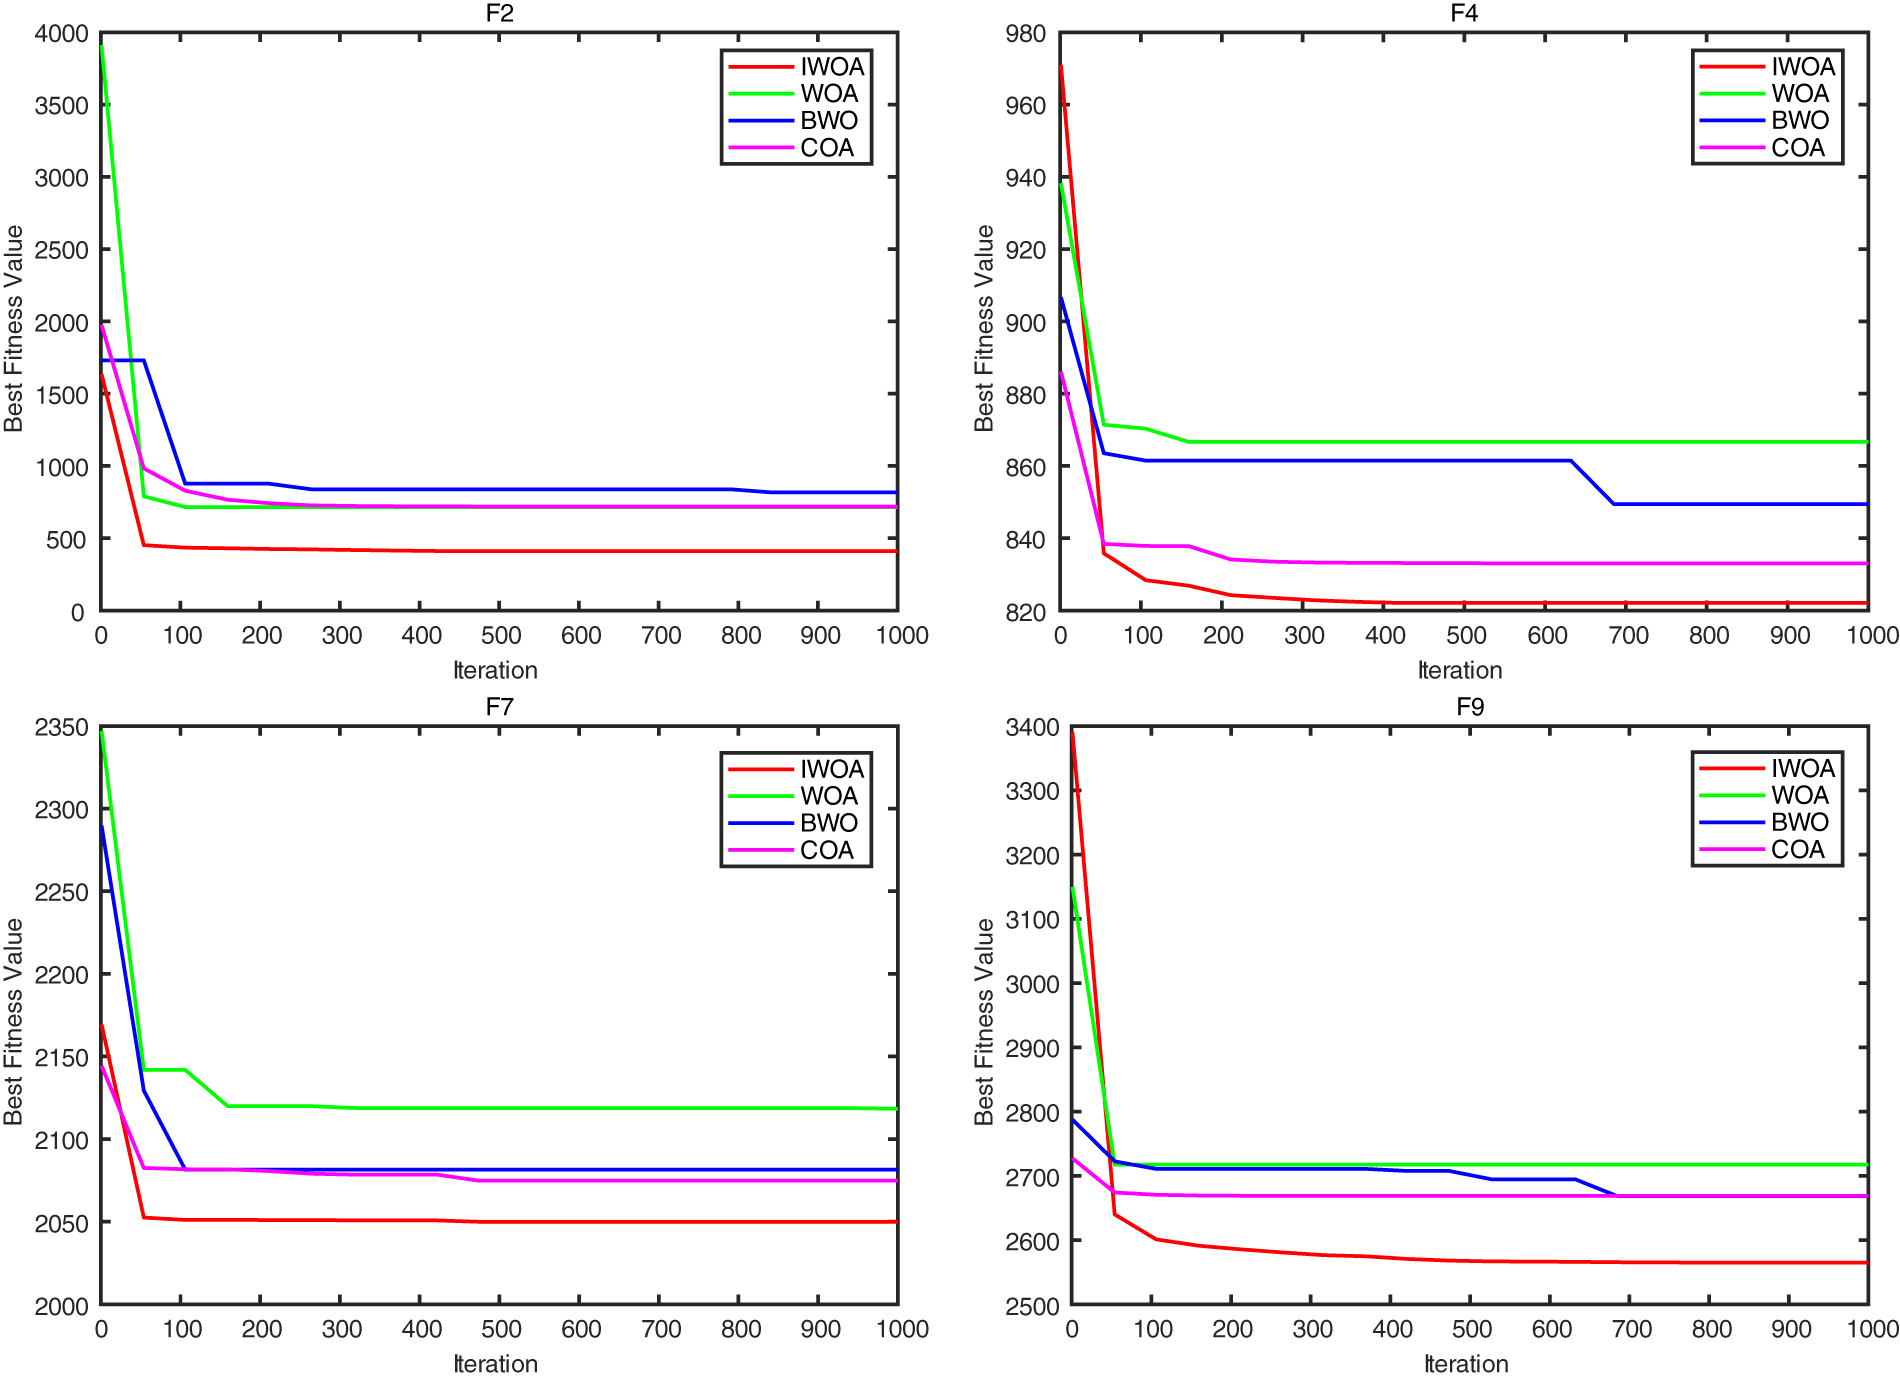
Figure 6: Convergence curves of IWOA, WOA, BWO, and COA under different test functions.
As shown in the top-left and top-right figures, compared with BWO (which is more prone to local optima), IWOA exhibits better convergence accuracy and stability. The bottom-left figure reveals that the improved Whale Optimization Algorithm achieves better optimization speed and convergence accuracy. The bottom-right figure indicates that IWOA and WOA have almost the same convergence speed, but IWOA outperforms WOA in convergence accuracy.
3 Prediction Process of the IWOA-TCN-BiGRU Model
In response to the pronounced nonlinearity, temporal volatility, and reliance on key features in photovoltaic power generation—affected by solar irradiance, temperature, and humidity—a hybrid model (IWOA-TCN-BiGRU-MATT) is proposed. This model enhances the TCN-BiGRU-MATT framework by optimizing it with the IWOA. The detailed prediction procedure is outlined below:
Raw photovoltaic power generation data contains systematic errors (caused by sensor drift), mutation noise (induced by cloudy weather), and missing values (resulting from data transmission interruptions); thus, preprocessing is necessary. The DBSCAN clustering algorithm is used to identify and eliminate outliers (abnormal values) to avoid interference of extreme values on model learning; Missing data is filled using the cubic spline interpolation method based on the correlation between solar irradiance and power, preserving temporal continuity; Wavelet threshold denoising is applied to decompose and filter out high-frequency noise components, enhancing data stationarity. Following preprocessing, the data is allocated in a 7:2:1 ratio to training, validation, and test sets. The training set is employed for model fitting, the validation set for performance monitoring during optimization, and the test set exclusively for verifying the model’s generalization capability and final predictive accuracy.
To enhance model performance, the IWOA is applied to fine-tune the core parameters of the TCN-BiGRU-MATT network. This study employs the IWOA to holistically optimize the key hyperparameters of the model. The search space encompasses: for the TCN layer, the number of convolution kernels [16, 128], dilation coefficient [1, 16], and number of residual blocks [1, 6]; for the BiGRU layer, the number of hidden units [32, 256] and dropout rate [0.1, 0.5]; and for the MATT layer, the number of attention heads [2, 16], L2 regularization parameter [1e−5, 1e−2], and learning rate [1e−5, 1e−3]. The Root Mean Square Error (RMSE) on the validation set is designated as the fitness function for the IWOA, with the population size and maximum number of iterations set to 100 and 100, respectively. The RMSE on the validation set serves as the fitness function for the IWOA. By integrating Logistic chaotic initialization to enhance population diversity, combining the Levy flight strategy to strengthen global exploration capability, and introducing adaptive weight adjustment to improve local exploitation accuracy, the optimal parameter combination is finally obtained to construct the prediction model.
The preprocessed training set data is input into the TCN-BiGRU-MATT model optimized by IWOA: The TCN layer captures multi-scale local temporal features (e.g., power fluctuation patterns in different time periods) through dilated convolution; The BiGRU layer explores bidirectional long-term temporal dependencies (e.g., diurnal cycles, weather change trends); The MATT layer learns attention weights in different subspaces in parallel, focusing on key feature moments (e.g., high-irradiance periods at noon, sudden cloud cover points);Finally, the fully connected layer outputs the prediction results. The Adam W optimizer is applied for training, while an early stopping criterion is incorporated to prevent overfitting. Training ceases after the validation error fails to decrease for 20 successive epochs, a patience interval set to prevent premature termination. In the final evaluation phase, the test set is processed by the trained model to produce the definitive short-term photovoltaic power prediction values.
We employ three distinct metrics to evaluate model performance: MAE, R2, and RMSE. These metrics gauge the average prediction error, provide a scale-independent accuracy percentage, and reflect the model’s goodness of fit, respectively. Their formulas are presented below:
where:
The experimental data was sourced from the historical generation data of a photovoltaic power station located in Central China, with a sampling resolution of 15 min. The complete dataset was partitioned into a 70% training set, a 15% validation set, and a 15% test set. In the configuration of the IWOA, the population size was maintained at 100 individuals per iteration, tasked with calibrating critical hyperparameters within the TCN-BiGRU-MATT architecture. These encompass the count of convolution kernels, the size of hidden layers, the dropout ratio, the number of attention heads, the regularization parameter, and the learning rate.
First, Spearman correlation analysis is performed on the feature factors, and a heatmap is plotted (see Fig. 7). A heatmap is a visualization tool that uses colors to intuitively display the distribution and correlation of values in a data matrix—similar to a “data map”: dark (or warm) colors represent large values/strong correlations, while light (or cool) colors represent small values/weak correlations, allowing for quick identification of data patterns. The 5 features with the strongest correlation with power generation are selected to reduce unnecessary computational load and improve prediction speed.
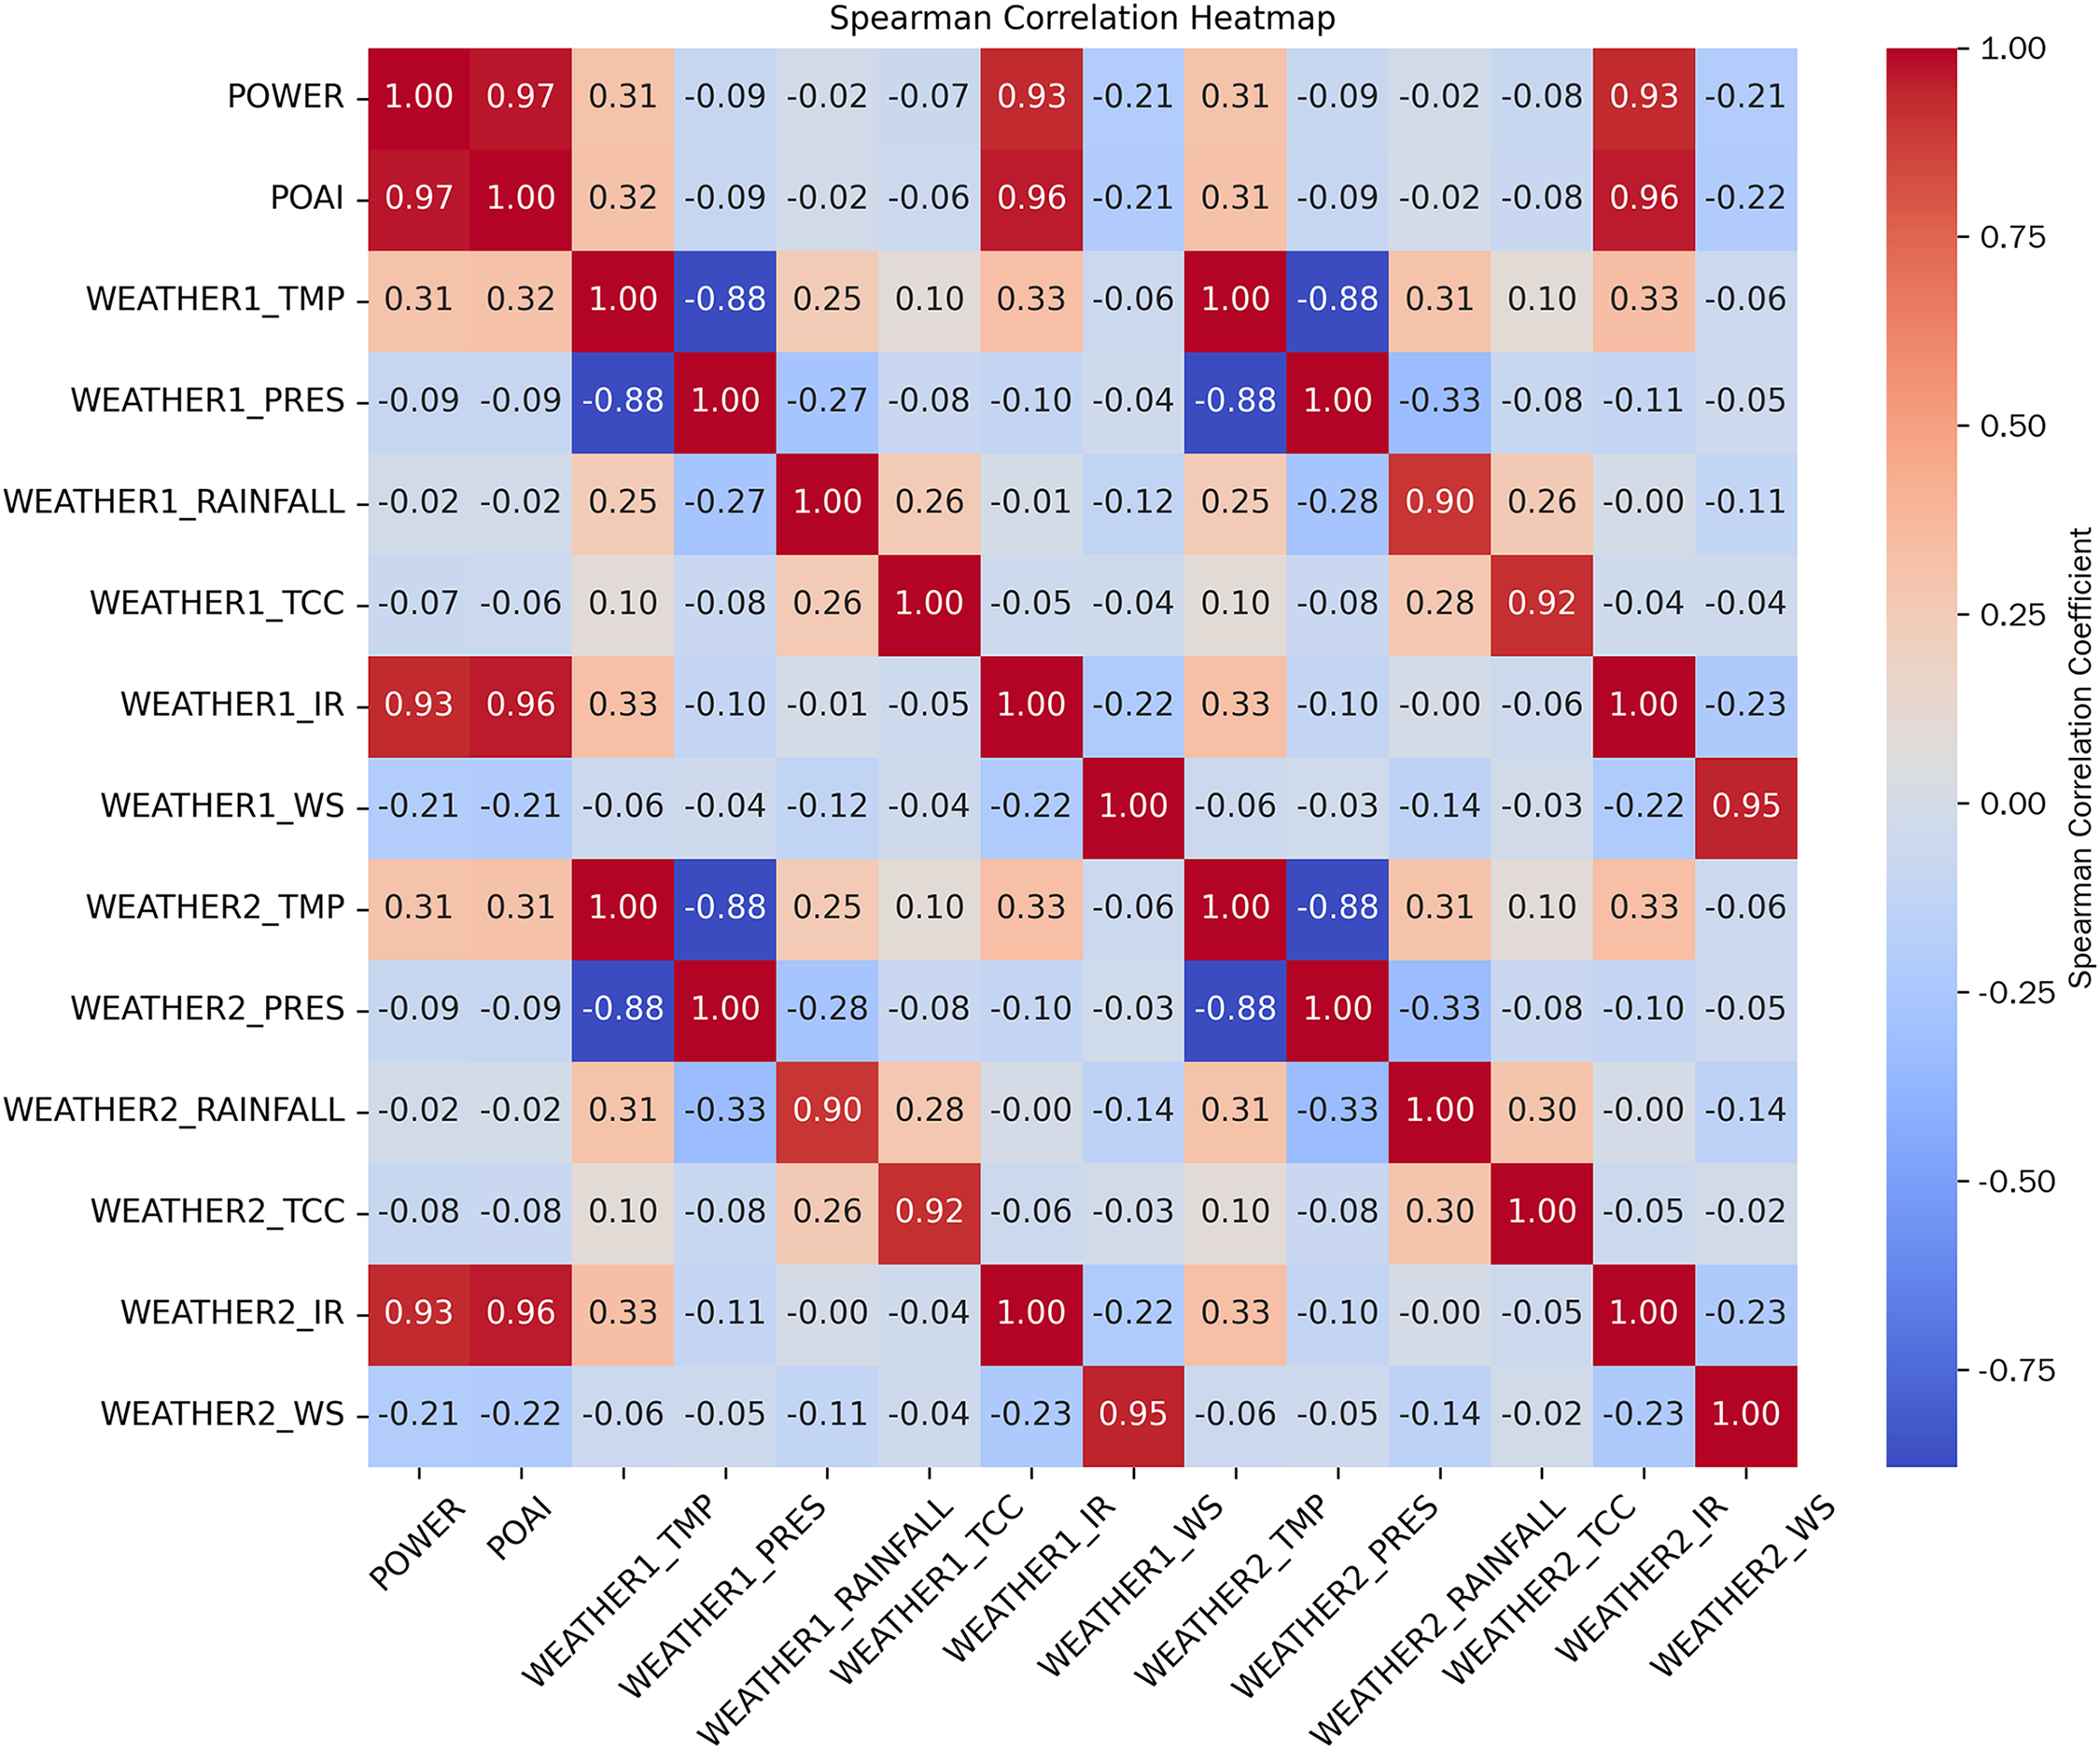
Figure 7: Spearman correlation coefficient heatmap.
The formula defines ρ as the Spearman correlation coefficient, a statistic for evaluating monotonic correlation. The variable n is the total sample count.
Given the prolonged statistical intervals and extensive datasets, occurrences of missing values or invalid power recordings (zero/negative) are probable. These deficiencies necessitate preprocessing procedures to safeguard the reliability of downstream computations and evaluation criteria. Our protocol prioritizes linear interpolation for trend-consistent gap filling, supplementing with forward and backward filling techniques where applicable, to achieve optimal data completeness.
This section systematically evaluates the forecasting performance of the proposed IWOA-TCN-BiGRU-MATT model from three dimensions: module effectiveness verification, generalization & robustness validation, and statistical significance test, to fully prove the reliability and engineering application value of the model.
4.2.1 Ablation Experiment and Module Effectiveness Verification
The IWOA-TCN-BiGRU-MATT model realizes the modeling of target tasks (e.g., photovoltaic power prediction, time-series signal classification) through a multi-level architecture of “data preprocessing-feature extraction-temporal modeling-key information enhancement.” To verify the practical role of each module in improving model accuracy and stability, systematic removal or replacement of core model components is conducted, and performance differences between different simplified versions and the original model are compared—providing empirical support for the rationality of the model structure. The prediction curves of each model are shown in Fig. 8.
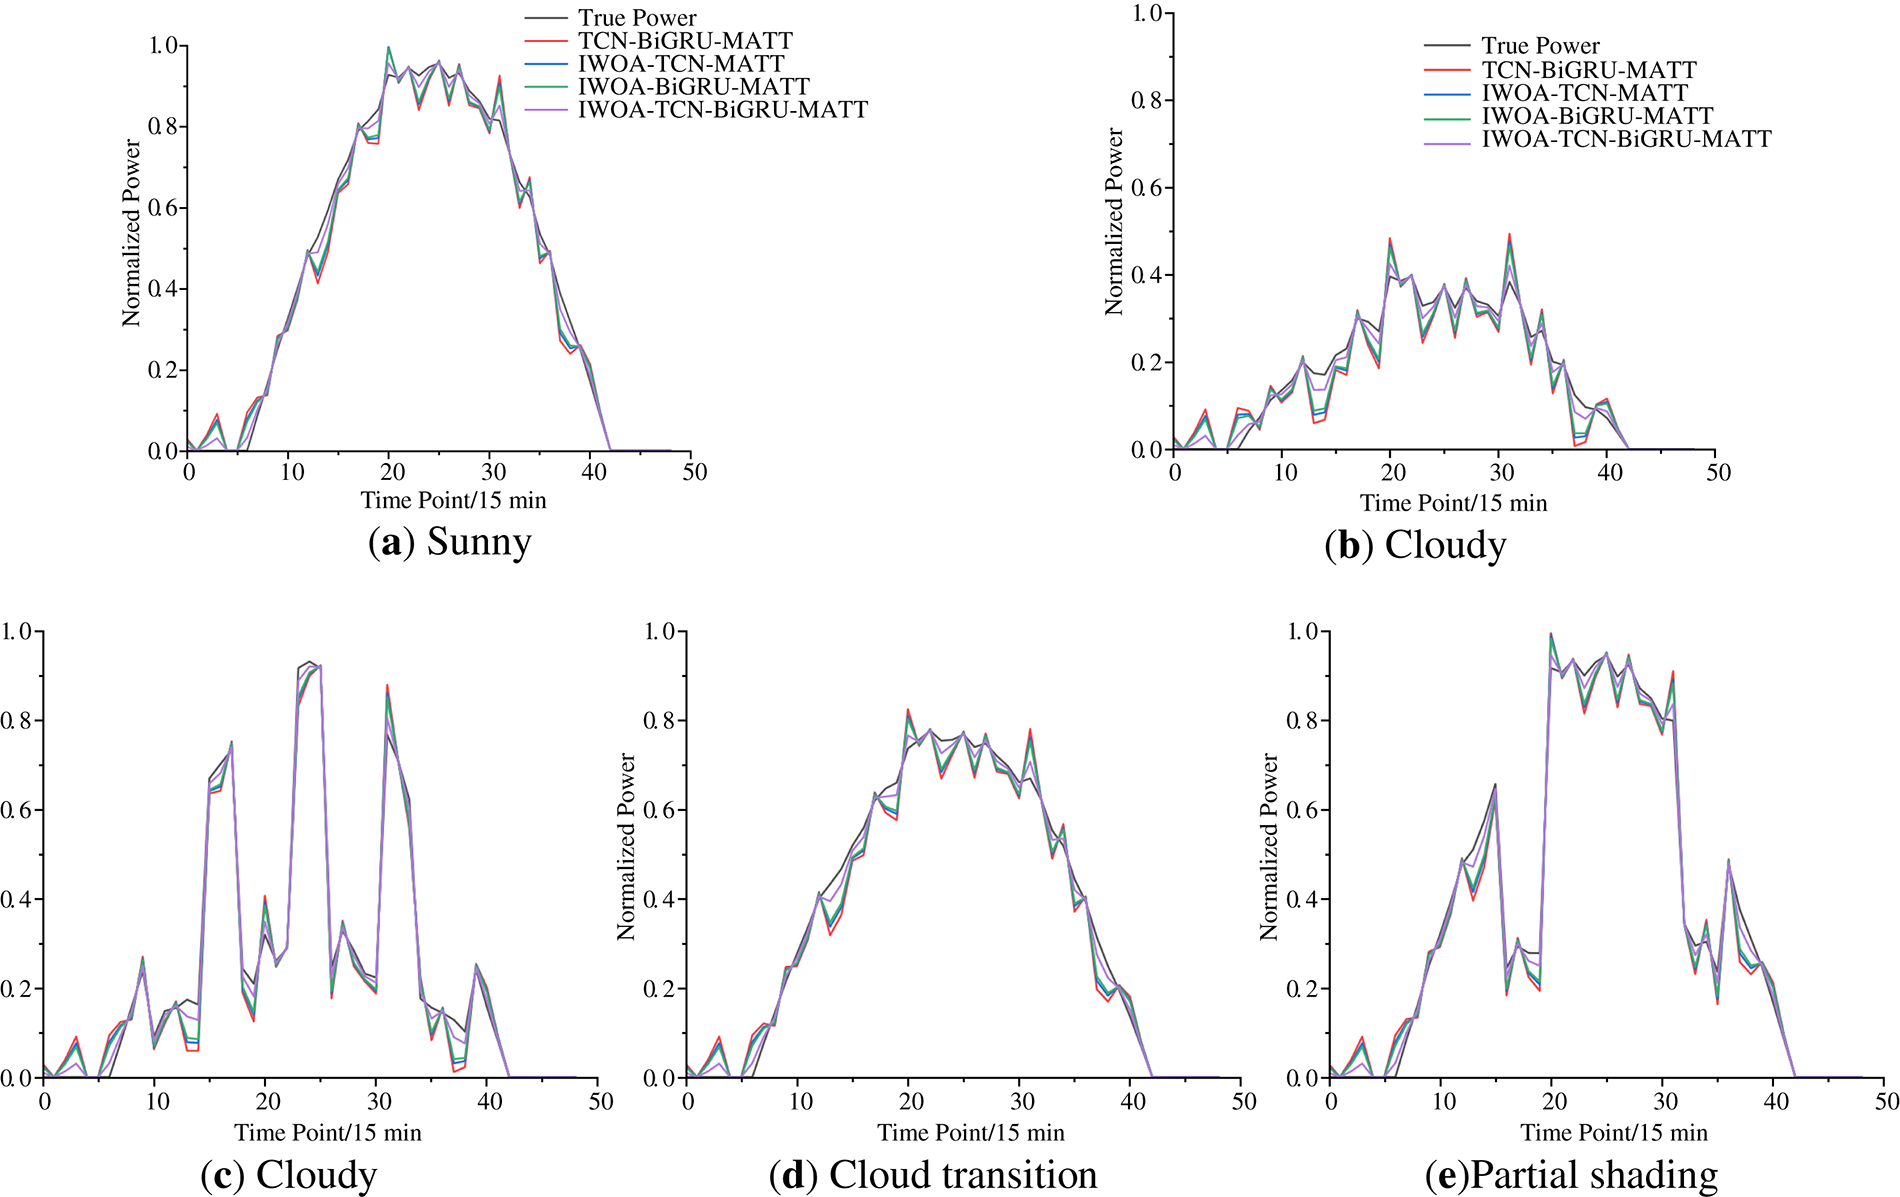
Figure 8: Prediction results of each model.
This paper proposes an IWOA-TCN-BiGRU-MATT hybrid architecture for short-term photovoltaic power prediction, which integrates TCN for local feature extraction, BiGRU for bidirectional temporal dependency modeling, and MATT for key information enhancement, with IWOA for global hyperparameter optimization. To verify the independent contribution of each core module, we design three ablation variant models for controlled comparison: TCN-BiGRU-MATT, IWOA-TCN-MATT, and IWOA-BiGRU-MATT. We systematically test the forecasting performance of all models under five typical operating scenarios (sunny, cloudy, rainy, cloud transition, partial shading), with quantitative evaluation conducted via MAE, RMSE and R2 metrics.
As shown in Table 2, the TCN-BiGRU-MATT model achieves R2, MAE, and RMSE of 91.43%, 2.83, and 4.95, respectively. After introducing IWOA-based hyperparameter optimization, the R2 of the IWOA-TCN-MATT model increases to 93.14%, while MAE and RMSE decrease to 2.59 and 2.49—indicating that the non-stationary feature decomposition of the original photovoltaic power sequence by IWOA effectively improves prediction accuracy. The IWOA-BiGRU-MATT model further applies BiGRU to modal sequences, with R2 increasing to 93.81% and MAE/RMSE of 2.44 and 2.48, respectively—demonstrating the advantage of BiGRU in capturing temporal features.
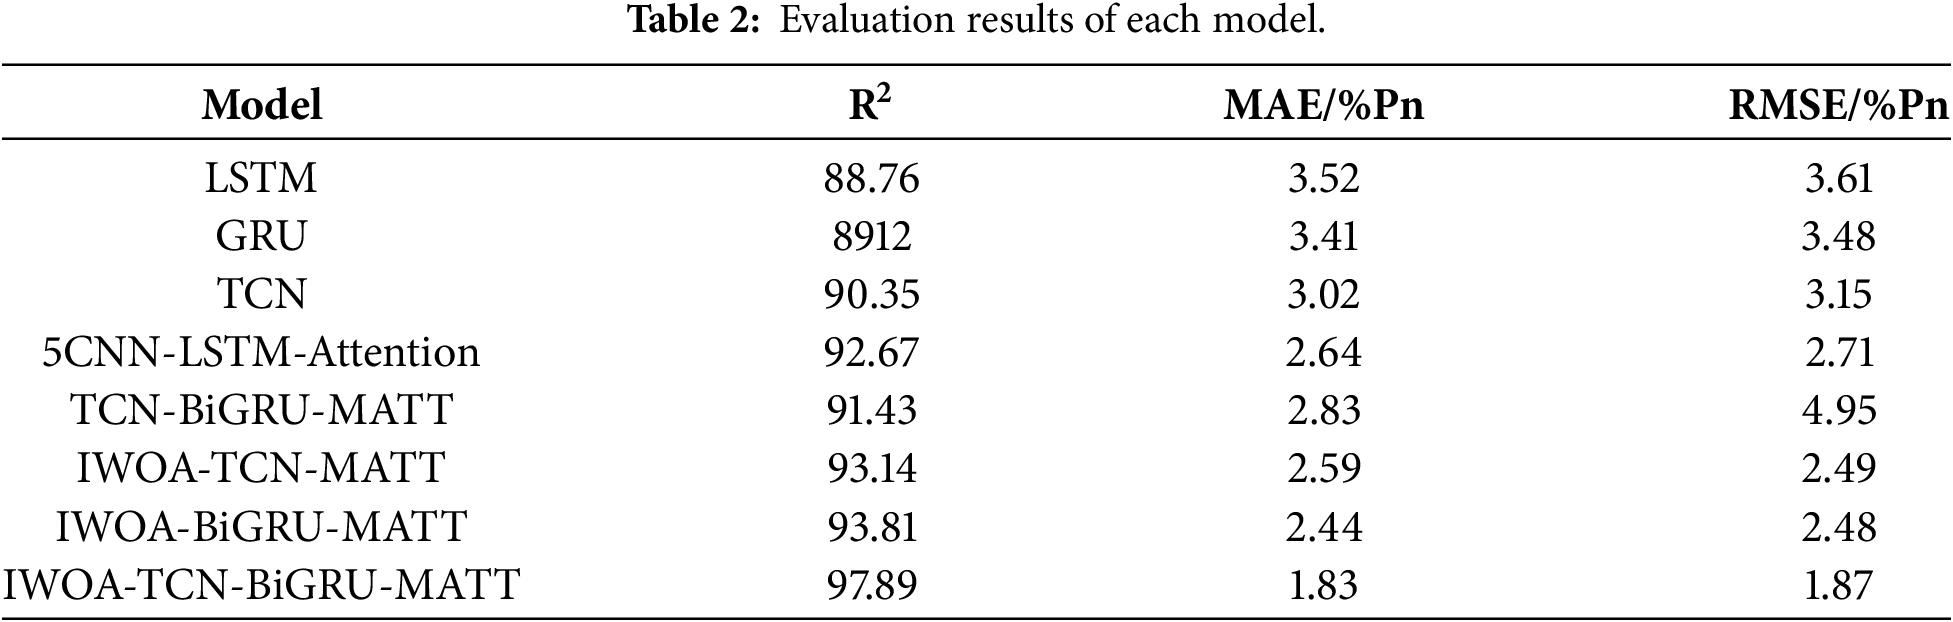
Most notably, the IWOA-TCN-BiGRU-MATT model integrates IWOA, TCN, BiGRU, and the multi-head attention mechanism, exhibiting stronger capabilities in capturing local patterns, long-term dependencies, and complex nonlinear relationships in photovoltaic power sequences. Its R2 reaches 97.89%, with MAE and RMSE reduced to 1.83 and 1.87, respectively—making the prediction results more consistent with actual power values. Compared with the IWOA-TCN-MATT and IWOA-BiGRU-MATT models, the IWOA-TCN-BiGRU-MATT model reduces MAE by 29.35% and 24.59%, respectively, decreases RMSE by 24.90% and 24.60%, respectively, and achieves a significant increase in R2.
4.2.2 Generalization and Robustness Verification
To further evaluate the generalization capability of the proposed model, an additional experiment is conducted using data from a different geographical region. Due to data availability constraints, a subset of weather conditions sunny and cloudy is selected. As shown in Table 3, the proposed model maintains relatively stable prediction performance across different sites and weather conditions. Although prediction errors slightly increase under more complex conditions (e.g., coastal cloudy scenarios), the model still achieves competitive performance, demonstrating its robustness.

To further verify the robustness and generalization ability of the proposed model, we conduct stress tests under extreme edge weather scenarios, including partial shading and rapid cloud cover, which bring high-frequency and large-amplitude fluctuations to PV power. The test results show that the RMSE of the proposed model only increases by 9.7% under these edge cases compared with sunny weather, which is far lower than the 30%+ RMSE increase of the benchmark models. These results indicate that the IWOA-TCN-BiGRU-MATT model exhibits optimal performance in short-term PV power prediction. It not only accurately reflects changes in PV power under conventional sunny, cloudy and rainy weather, but also maintains high accuracy under extreme edge scenarios, providing a reliable reference for PV power dispatching and grid operation.
4.2.3 Statistical Significance Verification
To further verify the robustness and generalization ability of the proposed model, we conduct stress tests under extreme edge weather scenarios, including partial shading and rapid cloud cover, which bring high-frequency and large-amplitude fluctuations to PV power. The test results show that the RMSE of the proposed model only increases by 9.7% under these edge cases compared with sunny weather, which is far lower than the 30% + RMSE increase of the benchmark models. These results indicate that the IWOA-TCN-BiGRU-MATT model exhibits optimal performance in short-term PV power prediction. It not only accurately reflects changes in PV power under conventional sunny, cloudy and rainy weather, but also maintains high accuracy under extreme edge scenarios, providing a reliable reference for PV power dispatching and grid operation.
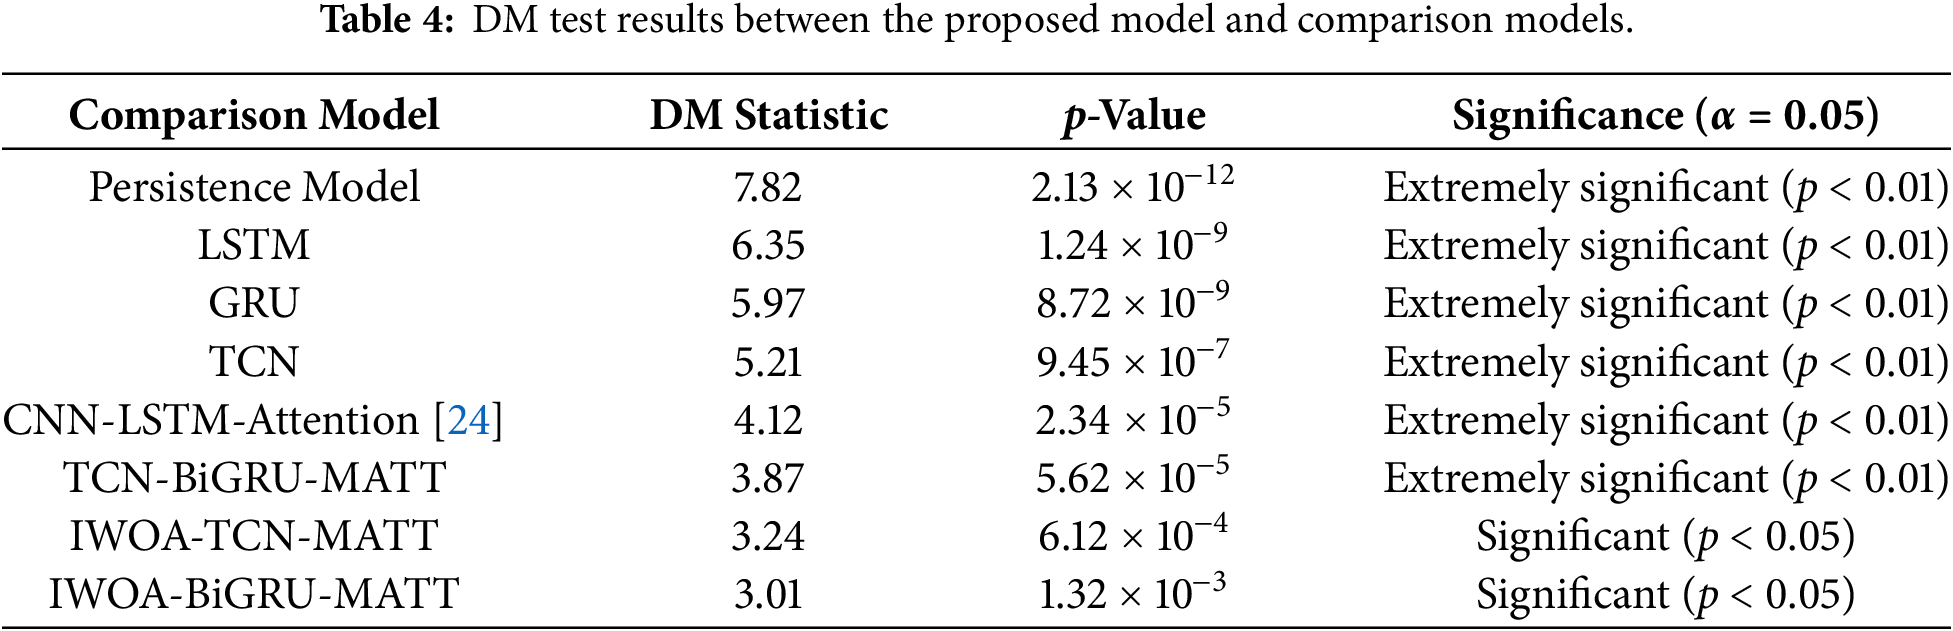
As shown in Table 4, all p-values of the DM test are below the preset significance level of 0.05. Specifically, the p-values between the proposed model and traditional benchmark models, as well as the unoptimized TCN-BiGRU-MATT model, are all less than 0.01, meaning the performance improvement is extremely significant; even compared with the ablation variants with partial core modules, the p-values are still less than 0.05, showing a statistically significant accuracy advantage. These results reject the null hypothesis, and fully prove that the forecasting performance improvement of the proposed model is statistically reliable, which provides a solid statistical basis for the rationality and effectiveness of the hybrid architecture design.
The above experimental results comprehensively show that the proposed IWOA-TCN-BiGRU-MATT model exhibits optimal performance in short-term PV power prediction. It not only accurately reflects the changes in PV power under conventional sunny, cloudy and rainy weather, but also maintains high accuracy and strong robustness under cross-regional scenarios and extreme edge conditions, which can provide a reliable reference for PV power dispatching and grid operation.
To boost the predictive precision and model robustness for PV plant power generation, this paper compares and analyzes four prediction models (TCN-BiGRU-MATT, IWOA-TCN-MATT, IWOA-BiGRU-MATT, IWOA-TCN-BiGRU-MATT). Combined with the results of simulation examples, the following conclusions are drawn:
1. The proposed IWOA, which integrates Logistic chaotic mapping, Lévy flight and Golden Sine strategies, can effectively optimize the key hyperparameters of the hybrid model, avoid the model falling into local optima during training, and thus improve the forecasting accuracy of PV power. Compared with the TCN-BiGRU-MATT model without IWOA-based hyperparameter optimization, the MAE and RMSE of IWOA-TCN-MATT and IWOA-BiGRU-MATT models are significantly reduced.
2. The combination of model structures enhances performance. The IWOA-TCN-BiGRU-MATT model, constructed by combining TCN and BiGRU on the basis of IWOA-based hyperparameter optimization, can simultaneously capture local features and long-short-term dependencies of the sequence. Its R2 reaches 97.89%, with MAE and RMSE reduced to 1.83 and 1.87, respectively—exhibiting significantly higher prediction accuracy than other single models or partial hybrid models.
3. The model exhibits excellent prediction performance and generalization capability. Across sunny, cloudy, rainy and extreme edge weather scenarios, the integrated model consistently surpasses all benchmark models in all evaluated metrics. Cross-regional validation on a PV dataset from Northwest China further proves that the model maintains high forecasting accuracy under different climatic and geographical conditions, underscoring its robustness and adaptability for practical engineering deployment.
Nevertheless, this study still has some limitations. First, the experimental validation is mainly based on measured data from a limited number of PV stations, and further verification using larger multi-region and multi-season datasets is required. Second, the proposed model focuses on short-term PV power forecasting with a 15-min sampling interval; its applicability to longer forecasting horizons and other sampling resolutions needs further investigation. Third, although IWOA improves the hyperparameter optimization performance, it also increases the computational cost compared with simpler benchmark models. Future work will focus on expanding the dataset, improving model lightweighting, and enhancing the real-time deployment capability of the proposed method.
Overall Conclusion: The IWOA-TCN-BiGRU-MATT model, which integrates IWOA-based hyperparameter optimization and the TCN-BiGRU structure, achieves the best performance in photovoltaic power prediction and can significantly improve prediction accuracy and generalization capability.
Acknowledgement: Thanks for the support from the “Research and Development Project of China Electric Power Research Institute Co., Ltd. (Special Project of Applied Research)”.
Funding Statement: This work is supported by National Natural Science Foundation of China (Grant No. U23B6007, Fundamental Theory and Methods for Form Evolutionand High Efficient Safe Operation of New Power Distribution Systems).
Author Contributions: Conceptualization, Guanglin Sha, Xinwei Cong, Yunzhao Wu, Dinghong Chen, Bo Wang and Hengrui Ma; methodology, Guanglin Sha, Xinwei Cong, Yunzhao Wu, Dinghong Chen, Bo Wang and Hengrui Ma; software, Guanglin Sha, Xinwei Cong, Yunzhao Wu, Dinghong Chen, Bo Wang and Hengrui Ma; validation, Guanglin Sha, Xinwei Cong, Yunzhao Wu, Dinghong Chen, Bo Wang and Hengrui Ma; formal analysis, Guanglin Sha, Xinwei Cong, Yunzhao Wu, Dinghong Chen, Bo Wang and Hengrui Ma; investigation, Guanglin Sha, Xinwei Cong, Yunzhao Wu, Dinghong Chen, Bo Wang and Hengrui Ma; writing—original draft preparation, Guanglin Sha, Xinwei Cong, Yunzhao Wu, Dinghong Chen, Bo Wang and Hengrui Ma. All authors reviewed and approved the final version of the manuscript.
Availability of Data and Materials: The authors confirm that the data supporting the findings of this study are available within the article.
Ethics Approval: This study did not involve human participants, animal subjects, or any clinical data. Therefore, ethical review and approval were not required for this research.
Conflicts of Interest: The authors declare no conflicts of interest.
Abbreviations
The following abbreviations are used in this manuscript:
| ELM | Extreme learning machine |
| GRU | Gated recurrent unit |
| LSTM | Long short-term memory |
| EMD | EmpIrical mode decomposition |
| VMD | Variational mode decomposition |
| WOA | Whale optimization algorithm |
| DBO | Dance behavior optimization |
| AHA | Adaptive hopping algorithm |
| MIC | Maximal information coefficient |
| CNN | Convolutional Neural networks |
| TCN | Temporal-Convolutional-Network |
| BiGRU | Bidirectional Gated Recurrent Unit |
| MATT | Multi-Head Attention Mechanism |
References
1. Asghar R, Fulginei FR, Quercio M, Mahrouch A. Artificial neural networks for photovoltaic power forecasting: a review of five promising models. IEEE Access. 2024;12(2):90461–85. doi:10.1109/ACCESS.2024.3420693. [Google Scholar] [CrossRef]
2. Su Z, Gu S, Wang J, Lund PD. Improving ultra-short-term photovoltaic power forecasting using advanced deep-learning approach. Measurement. 2025;239(1):115405. doi:10.1016/j.measurement.2024.115405. [Google Scholar] [CrossRef]
3. Ge J, Cai G, Yang M, Jiang L, Hong H, Zhao J. Short-term prediction of PV output based on weather classification and SSA-ELM. Front Energy Res. 2023;11:1145448. doi:10.3389/fenrg.2023.1145448. [Google Scholar] [CrossRef]
4. Jiang X, Gou Y, Jiang M, Luo L, Zhou Q. Photovoltaic power forecasting with weather conditioned attention mechanism. Big Data Min Anal. 2025;8(2):326–45. doi:10.26599/BDMA.2024.9020066. [Google Scholar] [CrossRef]
5. Elmousaid R, Drioui N, Elgouri R, Agueny H, Adnani Y. Ultra-short-term global horizontal irradiance forecasting based on a novel and hybrid GRU-TCN model. Results Eng. 2024;23(11):102817. doi:10.1016/j.rineng.2024.102817. [Google Scholar] [CrossRef]
6. Zhou N, Shang B, Xu M, Peng L, Feng G. Enhancing photovoltaic power prediction using a CNN-LSTM-attention hybrid model with Bayesian hyperparameter optimization. Glob Energy Interconnect. 2024;7(5):667–81. doi:10.1016/j.gloei.2024.10.005. [Google Scholar] [CrossRef]
7. Zhao Y, Wang B, Wang S, Xu W, Ma G. Photovoltaic power generation power prediction under major extreme weather based on VMD-KELM. Energy Eng. 2024;121(12):3711–33. doi:10.32604/ee.2024.054032. [Google Scholar] [CrossRef]
8. Zhu H, Wang Y, Wu J, Zhang X. A regional distributed photovoltaic power generation forecasting method based on grid division and TCN-Bilstm. Renew Energy. 2026;256(2):123935. doi:10.1016/j.renene.2025.123935. [Google Scholar] [CrossRef]
9. Cao R, Tian H, Li D, Feng M, Fan H. Short-term photovoltaic power generation prediction model based on improved data decomposition and time convolution network. Energies. 2023;17(1):33. doi:10.3390/en17010033. [Google Scholar] [CrossRef]
10. Cai C, Zhang L, Zhou J, Zhou L. Sky images based photovoltaic power forecasting: a novel approach with optimized VMD and Vision Mamba. Results Eng. 2024;24(3):103022. doi:10.1016/j.rineng.2024.103022. [Google Scholar] [CrossRef]
11. Dai Y, Yu W, Leng M. A hybrid ensemble optimized BiGRU method for short-term photovoltaic generation forecasting. Energy. 2024;299(7):131458. doi:10.1016/j.energy.2024.131458. [Google Scholar] [CrossRef]
12. Du W, Peng ST, Wu PS, Tseng ML. High-accuracy photovoltaic power prediction under varying meteorological conditions: enhanced and improved beluga whale optimization extreme learning machine. Energies. 2024;17(10):2309. doi:10.3390/en17102309. [Google Scholar] [CrossRef]
13. El-kenawy EM, Ali Alhussan A, Mattar EA, Radwan M. Feature selection and hyperparameter tuning in transformer-based deep learning models for photovoltaic power forecasting using the Swordfish Movement Optimization Algorithm (SMOA). Int J Electr Power Energy Syst. 2026;174:111509. doi:10.1016/j.ijepes.2025.111509. [Google Scholar] [CrossRef]
14. Guo W, Xu L, Wang T, Zhao D, Tang X. Photovoltaic power prediction based on hybrid deep learning networks and meteorological data. Sensors. 2024;24(5):1593. doi:10.3390/s24051593. [Google Scholar] [CrossRef]
15. Lin X, Niu Y, Yan Z, Zou L, Tang P, Song J. Hybrid photovoltaic output forecasting model with temporal convolutional network using maximal information coefficient and white shark optimizer. Sustainability. 2024;16(14):6102. doi:10.3390/su16146102. [Google Scholar] [CrossRef]
16. Zhou X, Zhang X, Dai J, Zhang T. Photovoltaic power prediction technology based on multi-source feature fusion. Symmetry. 2025;17(3):414. doi:10.3390/sym17030414. [Google Scholar] [CrossRef]
17. Rao Z, Yang Z, Yang X, Li J, Meng W, Wei Z. TCN-GRU based on attention mechanism for solar irradiance prediction. Energies. 2024;17(22):5767. doi:10.3390/en17225767. [Google Scholar] [CrossRef]
18. Zhou D, Liu Y, Wang X, Wang F, Jia Y. Combined ultra-short-term photovoltaic power prediction based on CEEMDAN decomposition and RIME optimized AM-TCN-BiLSTM. Energy. 2025;318(1):134847. doi:10.1016/j.energy.2025.134847. [Google Scholar] [CrossRef]
19. Xiong G, Zhang J, Fu X, Chen J, Mohamed AW. Seasonal short-term photovoltaic power prediction based on GSK–BiGRU–XGboost considering correlation of meteorological factors. J Big Data. 2024;11(1):164. doi:10.1186/s40537-024-01037-x. [Google Scholar] [CrossRef]
20. Shi Y, Zhang L, Wang S, Li W, Tong R. A short-term photovoltaic power interval forecasting method based on fuzzy granular computing and CNN-BiGRU. Int J Low Carbon Technol. 2024;19:306–14. doi:10.1093/ijlct/ctad131. [Google Scholar] [CrossRef]
21. Liu L, Hu X, Chen J, Wu R, Chen F. Embedded scenario clustering for wind and photovoltaic power, and load based on multi-head self-attention. Prot Control Mod Power Syst. 2024;9(1):122–32. doi:10.23919/PCMP.2023.000296. [Google Scholar] [CrossRef]
22. Niu Y, Wang J, Zhang Z, Cao Y, Yan P, Li Z. Amplify seasonality, prioritize meteorological: strengthening seasonal correlation in photovoltaic forecasting with dual-layer hierarchical attention. Appl Energy. 2025;394(4):126104. doi:10.1016/j.apenergy.2025.126104. [Google Scholar] [CrossRef]
23. Hu K, Fu Z, Lang C, Li W, Tao Q, Wang B. Short-term photovoltaic power generation prediction based on Copula Function and CNN-CosAttention-transformer. Sustainability. 2024;16(14):5940. doi:10.3390/su16145940. [Google Scholar] [CrossRef]
24. Fan Y, Ma Z, Tang W, Liang J, Xu P. Using crested porcupine optimizer algorithm and CNN-LSTM-attention model combined with deep learning methods to enhance short-term power forecasting in PV generation. Energies. 2024;17(14):3435. doi:10.3390/en17143435. [Google Scholar] [CrossRef]
25. Wang Y, Zhang C, Fu Y, Suo L, Song S, Peng T, et al. Hybrid solar radiation forecasting model with temporal convolutional network using data decomposition and improved artificial ecosystem-based optimization algorithm. Energy. 2023;280(10):128171. doi:10.1016/j.energy.2023.128171. [Google Scholar] [CrossRef]
26. Wang W, Tian J. Optimal parameters extraction for photovoltaic models utilizing an artificial rabbit optimizer incorporating swarm-elite learning mechanism’s Levy flight strategy. Comput Electr Eng. 2025;127:110582. doi:10.1016/j.compeleceng.2025.110582. [Google Scholar] [CrossRef]
27. Zhang W, Yang J, He Q, Liu Z, Wang J, Rao Z, et al. A dual-feedback adaptive clone selection algorithm with golden sine search for parameter identification of photovoltaic models. IEEE Access. 2024;12(4):20341–57. doi:10.1109/ACCESS.2024.3362059. [Google Scholar] [CrossRef]
Cite This Article
 Copyright © 2026 The Author(s). Published by Tech Science Press.
This work is licensed under a Creative Commons Attribution 4.0 International License , which permits unrestricted use, distribution, and reproduction in any medium, provided the original work is properly cited.
 Downloads
 Citation Tools
