
 Login
Login Register
 Submit a Paper
 Propose a Special lssue
 Open Access
ARTICLE
A Two-Stage Machine Learning and Finite Element Framework for System Failure Analysis of Reinforced Concrete Flat-Slab Structures
1 School of Civil Engineering and Architecture, Zhejiang Sci-Tech University, Hangzhou, 310018, China
2 School of Civil Engineering, Tongji University, Shanghai, 200092, China
3 Zhejiang Key Laboratory of Green, Digital and Intelligent (GDI) Renovation for Urban Infrastructures, Hangzhou, 310018, China
* Corresponding Author: Shixue Liang. Email:
(This article belongs to the Special Issue: AI-Enhanced Computational Methods in Engineering and Physical Science)
Computer Modeling in Engineering & Sciences 2026, 148(3), 10 https://doi.org/10.32604/cmes.2026.087037
Received 09 June 2026; Accepted 01 September 2026; Issue published 28 September 2026
 View Full Text
 Download PDF
Abstract
Punching shear failure at a single slab–column joint can trigger rapid load redistribution and cascading damage in reinforced concrete flat-slab systems, making component-level reliability assessment insufficient for evaluating progressive-collapse risk. Moreover, direct Monte Carlo simulation (MCS) coupled with nonlinear finite element (FE) analysis is computationally prohibitive for rare-event system reliability problems involving multiple uncertainties. To address these challenges, this study proposes a two-stage machine learning–finite element (ML–FE) framework for system failure assessment of reinforced concrete flat-slab structures. In Stage I, an ML surrogate trained on 610 experimental slab–column joint tests predicts punching shear resistance and screens potentially critical realizations from a large MCS sample space. In Stage II, only the screened realizations are propagated into a nonlinear OpenSees model to simulate load redistribution, sequential joint failure, and system-level damage evolution. System reliability is then evaluated under three candidate failure criteria representing progressively more severe performance states, from initial local punching to widespread structural damage. The results show that the estimated system failure probability is strongly dependent on the adopted failure definition: local punching events frequently develop into moderate system damage, whereas only a smaller fraction progresses to severe widespread failure. For the largest Monte Carlo case, the Stage-I screening filtered approximately 99.94% of safe realizations and reduced the estimated computational time from about 26,000 h for direct MCS–FE analysis to approximately 15 h. The proposed framework contributes a computationally scalable link between experimentally informed component resistance and mechanics-based system response, enabling multi-level reliability assessment while also revealing characteristic failure-propagation paths and structural robustness of reinforced concrete flat-slab systems.Keywords
Reinforced concrete flat-slab structures are widely used in residential, commercial, and underground structures due to their flexible layout, ease of construction, and high space utilization. However, under high vertical loads, their overall load-bearing performance is often significantly affected by punching shear failure at slab-column joints. Once localized punching shear failure occurs at a slab–column joint, a rapid redistribution of internal forces may take place. This redistribution can subsequently initiate cascading failures at the structural level. Such behavior is particularly critical in flat-slab systems with limited lateral restraint. As shown in Fig. 1, several well-documented collapses have highlighted the vulnerability of flat-slab structures to punching shear–induced progressive collapse, including the collapse of 2000 Commonwealth Avenue in Boston in 1971 [1], the Sampoong Department Store collapse in Seoul in 1995 [2], and the collapse of Champlain Towers South in Surfside, Florida, in 2021 [3]. These incidents have prompted academic research into the safety and reliability assessment of flat-slab structures under uncertain conditions.
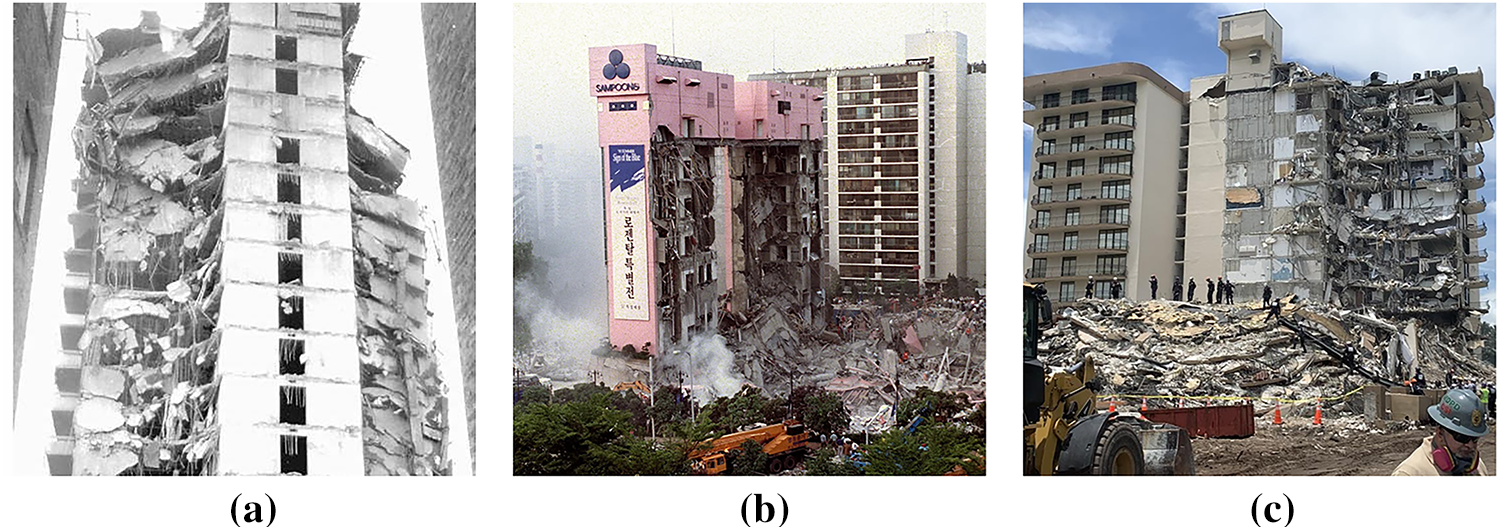
Figure 1: Representative collapse accidents of flat-slab structures associated with punching shear failure: (a) Collapse of 2000 Commonwealth Avenue in Boston; (b) Collapse of Sampoong department store in Seoul; (c) Collapse of Champlain Towers South in Surfside, Florida.
From a structural reliability perspective, the critical issue in reinforced concrete flat-slab systems is not merely the characterization of punching resistance at an isolated slab–column joint, but the establishment of a rational link between local punching limit states and structural system failure. Existing reliability-oriented studies have shown that punching failure probabilities can be evaluated efficiently by combining code-based or semi-empirical resistance models with Monte Carlo Simulation (MCS) or related probabilistic frameworks [4,5]. At the same time, system-level investigations have demonstrated that once a slab–column connection is compromised, the subsequent response may involve pronounced load redistribution, alternative load-transfer mechanisms, and progressive failure propagation in the surrounding flat-slab system [6–8]. More importantly, recent evidence indicates that collapse initiated by slab–column joint punching is mechanically distinct from the conventional column-removal idealization, which suggests that system failure cannot always be represented adequately by simplified local criteria alone [9]. However, directly embedding nonlinear finite element analyses into large-sample reliability simulation remains computationally prohibitive, particularly for rare-event system failure problems involving multiple sources of uncertainty. For this reason, surrogate-based reliability strategies have been actively developed to reduce the number of expensive model evaluations while retaining acceptable predictive accuracy [10,11]. These observations point to the need for a framework that combines efficient local punching assessment with mechanics-based system analysis for the reliability evaluation of flat-slab structures.
Existing research on punching shear behavior of slab–column joints has primarily focused on component-level resistance characterization, including experimental testing [12–14] and analytical modeling [15–17] of individual joints. These studies have provided valuable insights into local failure mechanisms and influencing parameters, forming the basis for defining limit state functions in reliability analysis. Olmati et al. [4] employed Eurocode 2 and the critical shear crack theory as a surrogate model for MCS to evaluate the probability of punching shear failure in slab-column joints under accidental loads. Feiri et al. [18] used the German code’s punching shear resistance calculation model as a surrogate model for MCS to investigate the variation patterns of system failure probability and partial safety factors in RC flat-slab structures. However, these approaches rely on code-based or semi-empirical surrogate models for punching shear capacity, which lack the ability to represent load redistribution and failure propagation at the structural system level. Beyond the nominal punching resistance of an isolated slab–column joint, the progressive-collapse resistance of flat-slab systems is governed by the coupled effects of material properties, joint detailing, boundary restraint, and post-punching load-transfer mechanisms. Zhou et al. [19] experimentally demonstrated that the steel-fiber volume fraction and the extent of the ultra-high-performance fiber-reinforced concrete (UHPFRC) region influence the initial stiffness, punching shear strength, deformation capacity, and failure mode of UHPFRC–normal-strength concrete composite flat slabs. Jiao et al. [20] showed that drop panels, shear studs, and in-plane restraints modify both the pre- and post-punching responses and may lead to successive punching failures at the column perimeter and the slab–drop-panel interface. Yang et al. [21] further reported that slab thickness, the amount and arrangement of flexural reinforcement, and the punching direction govern the post-punching suspension mechanism and residual resistance of slab–column joints under in-plane constraints. Sarvari and Esfahani [22] found that integrity reinforcement and reinforcement detailing, including concrete cover and tensile-bar diameter, significantly affect the secondary load-carrying capacity after punching. These findings indicate that the resistance of flat-slab structures to progressive collapse cannot be evaluated solely from a single nominal punching capacity, because it also depends on deformation capacity, post-punching resistance, structural continuity, and alternative load-transfer mechanisms. Therefore, a system-level analysis capable of representing load redistribution and sequential joint failure is required.
To better capture system behavior, finite element (FE)–based approaches have been increasingly employed to simulate load redistribution and progressive collapse processes in flat-slab systems [23,24]. Previous studies have demonstrated that FE models can effectively represent failure propagation and system-level response under various damage scenarios. Specifically, these detailed simulations have successfully captured the dynamic load redistribution following the sudden loss of an interior column [25], the mobilization of alternative load-transfer paths under extreme loads [26], and the cascading punching shear failures induced by varying combinations of peripheral column removals [27]. However, incorporating FE models into probabilistic reliability analysis remains challenging due to the high computational cost associated with repeated simulations. To reduce the computational cost associated with Monte Carlo simulation, a variety of methods have been proposed, including reliability approximation methods such as the FORM/SORM [28,29], importance sampling [30], subset simulation [31,32], and surrogate modeling approaches based on Kriging [33], polynomial chaos expansion [34,35], etc. These methods aim to reduce the number of required model evaluations or approximate system responses more efficiently, particularly in rare-event reliability analysis.
Recent rapid advancements in data-driven methods have enabled machine learning (ML)-based structural response prediction. Trained on large-scale experimental datasets, ML models can accurately predict the punching shear capacity of slab-column joints, incorporating inputs such as concrete strength, slab thickness, reinforcement ratio, and column dimensions. Liang et al. [36] compared several ML models for predicting the punching shear capacity of reinforced concrete slab-column joints using an experimental database, and identified concrete strength, effective depth, reinforcement ratio, and column geometry as key variables governing predictive performance. In a subsequent study, Liang et al. [37] integrated symbolic regression with the MCFT-based mechanical framework and developed a gray-box model for estimating the punching shear capacity of FRP-RC flat slabs, thereby improving accuracy while retaining physical interpretability. Feng et al. [38] investigated the punching shear behavior of UHPC-enhanced slab–column joints by combining tests, FE simulations, and ML models. Fei et al. [39] evaluated the flexural behavior of RC slabs containing recycled slurry micropowder through experimental and numerical analyses. In addition, Liang et al. [40] developed an automated ML framework for material and structural performance prediction, while Lin et al. [41] proposed deep learning surrogates for efficient stochastic phase-field modeling of quasi-brittle materials. Wu et al. [42] and Lin et al. [41] developed deep learning surrogate models for multiscale random damage analysis and random quasi-brittle material phase-field simulations, respectively. Pan and Dias [43] developed an adaptive support vector machine framework combined with MCS, and showed that the failure probability could be estimated with a substantially reduced number of training samples. Lieu et al. [44] proposed an adaptive deep neural network surrogate for structural reliability analysis and reported accurate failure-probability estimates for highly nonlinear problems using only a limited number of model evaluations. Luo et al. [45] further coupled support vector regression with an enhanced simulation strategy and demonstrated that the hybrid framework achieved accurate and robust reliability estimates at a markedly lower computational cost. Despite these advances, existing ML-assisted reliability approaches have primarily focused on approximating predefined structural responses or limit-state functions to reduce the number of high-fidelity model evaluations. Such strategies are effective for failure-probability estimation, but they do not necessarily preserve an explicit representation of load redistribution and sequential failure propagation after local damage occurs. The novelty of the present study therefore does not lie in the generic combination of ML and FE analysis, but in a hierarchical component-to-system coupling specifically developed for punching-governed flat-slab reliability. An experimentally informed ML surrogate is used only to screen realizations susceptible to local punching failure, whereas a nonlinear global FE model is retained for the screened realizations to explicitly resolve load redistribution, progressive joint failure, and system reliability under multiple damage criteria. To the authors’ knowledge, this selective coupling between data-driven local failure screening and mechanics-based system failure propagation has received limited attention in reliability assessment of reinforced concrete flat-slab structures.
The proposed framework is motivated by two challenges in system reliability analysis of flat-slab structures. First, system-level failure is a rare event, and direct MCS based on FE models becomes computationally infeasible when a large number of random realizations are required. Second, although ML models can efficiently predict local punching shear capacity, they are inherently unable to capture load redistribution, failure propagation, and structural interactions at the system level. Accordingly, the primary objective of this study is to develop a computationally efficient system reliability analysis framework for reinforced concrete flat-slab structures under uncertainty by coupling ML-based large-scale screening of local punching failure with FE-based simulation of system-level failure propagation. The main innovation of this study lies in the hierarchical component-to-system coupling of ML-based probabilistic screening and mechanics-based FE analysis. This coupling links experimentally informed joint resistance to system-level failure propagation while substantially reducing the computational demand compared with direct MCS–FE analysis. To address these challenges, ML surrogate models trained on experimental data are first employed to rapidly predict the punching shear capacity of each slab–column joint and evaluate local limit state functions across a large Monte Carlo sample space. Owing to the high computational efficiency of ML models, millions of random realizations can be screened within a short time, allowing identification of samples in which local punching shear failure may occur. Only these failure-relevant samples are subsequently propagated into a global FE model developed in OpenSees, where load redistribution, failure propagation, and system-level response are explicitly simulated. By restricting detailed structural analysis to a small subset of potentially critical realizations, the proposed framework significantly reduces the number of required system-level simulations while retaining the essential mechanics of progressive collapse. Based on this two-stage screening strategy, system failure probability and reliability indices are finally evaluated, accounting for uncertainties in material properties, geometry, and loading. Fig. 2 presents a visual summary of the entire study, illustrating the seamless transition from ML-based high-risk screening to detailed FE collapse simulation and efficiency evaluation.
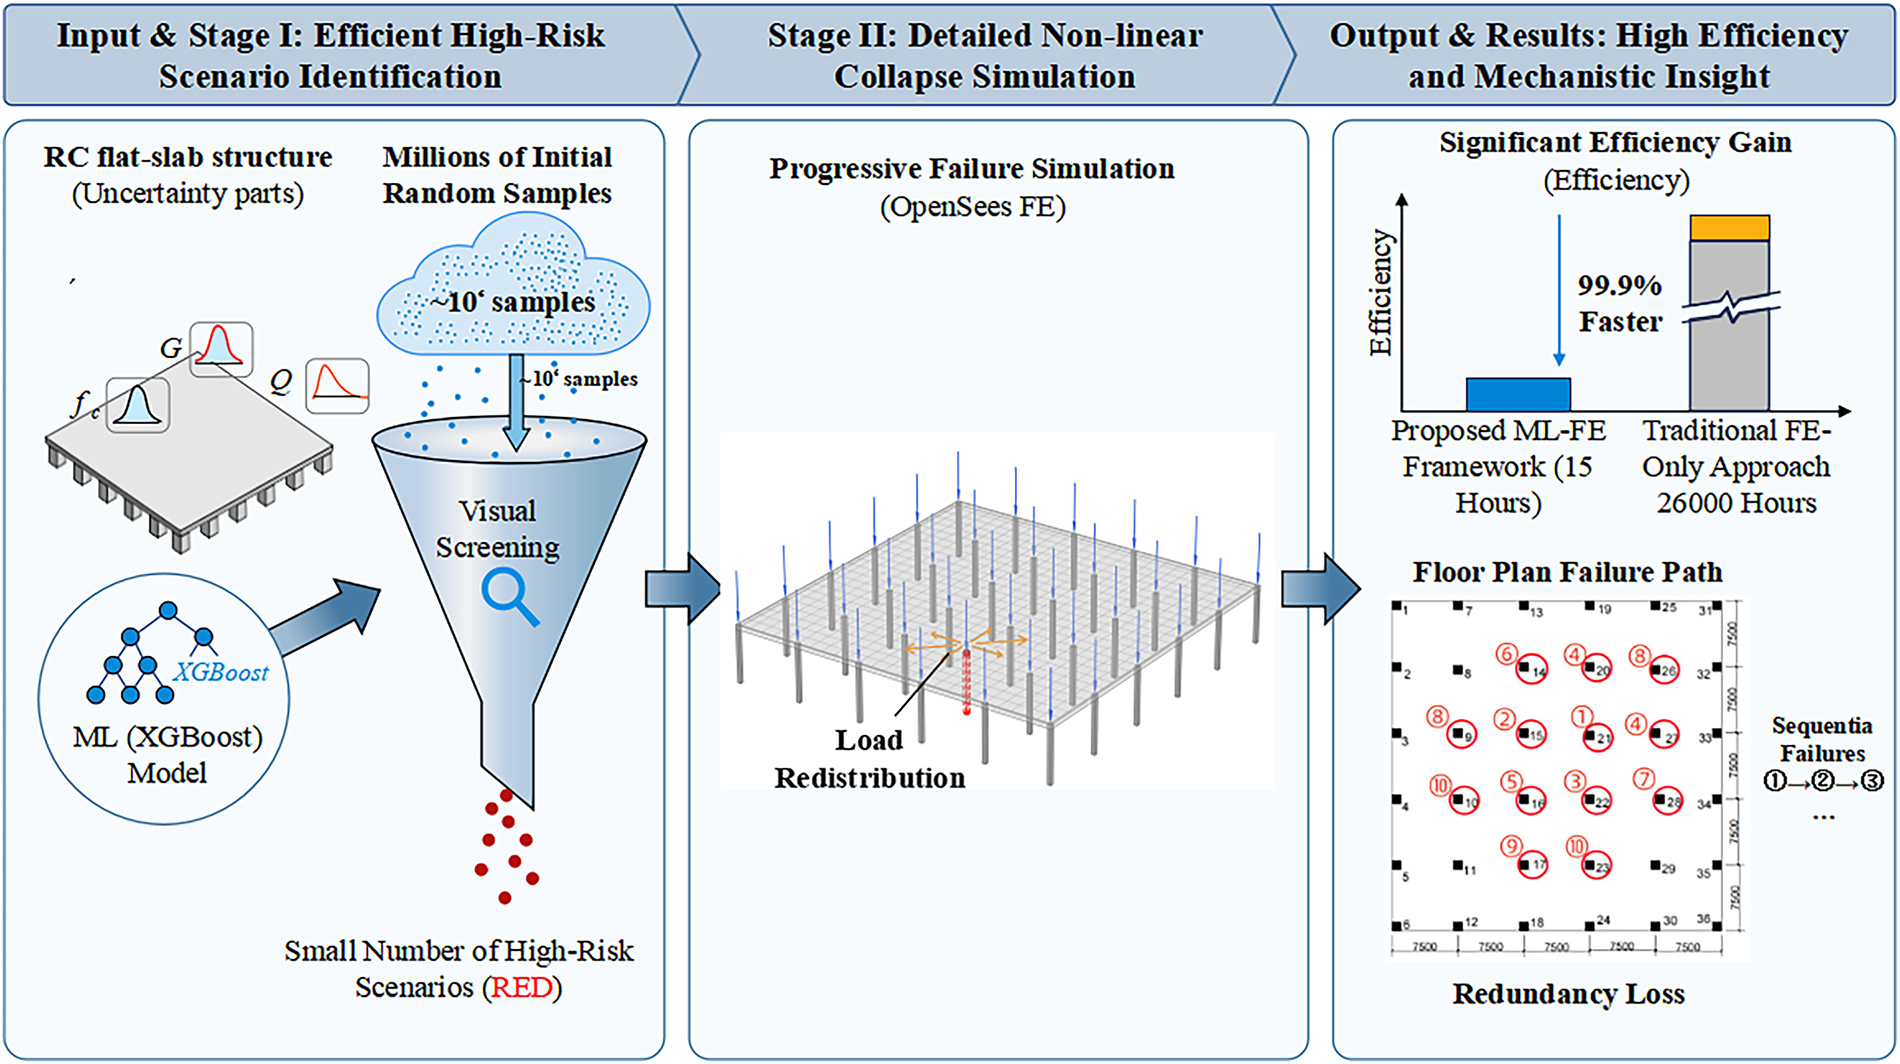
Figure 2: Comprehensive overview of the study: from ML-based high-risk screening.
2 ML-Based Model for Punching Shear Capacity at Slab-Column Joints
2.1 Dataset and Input Feature Selection
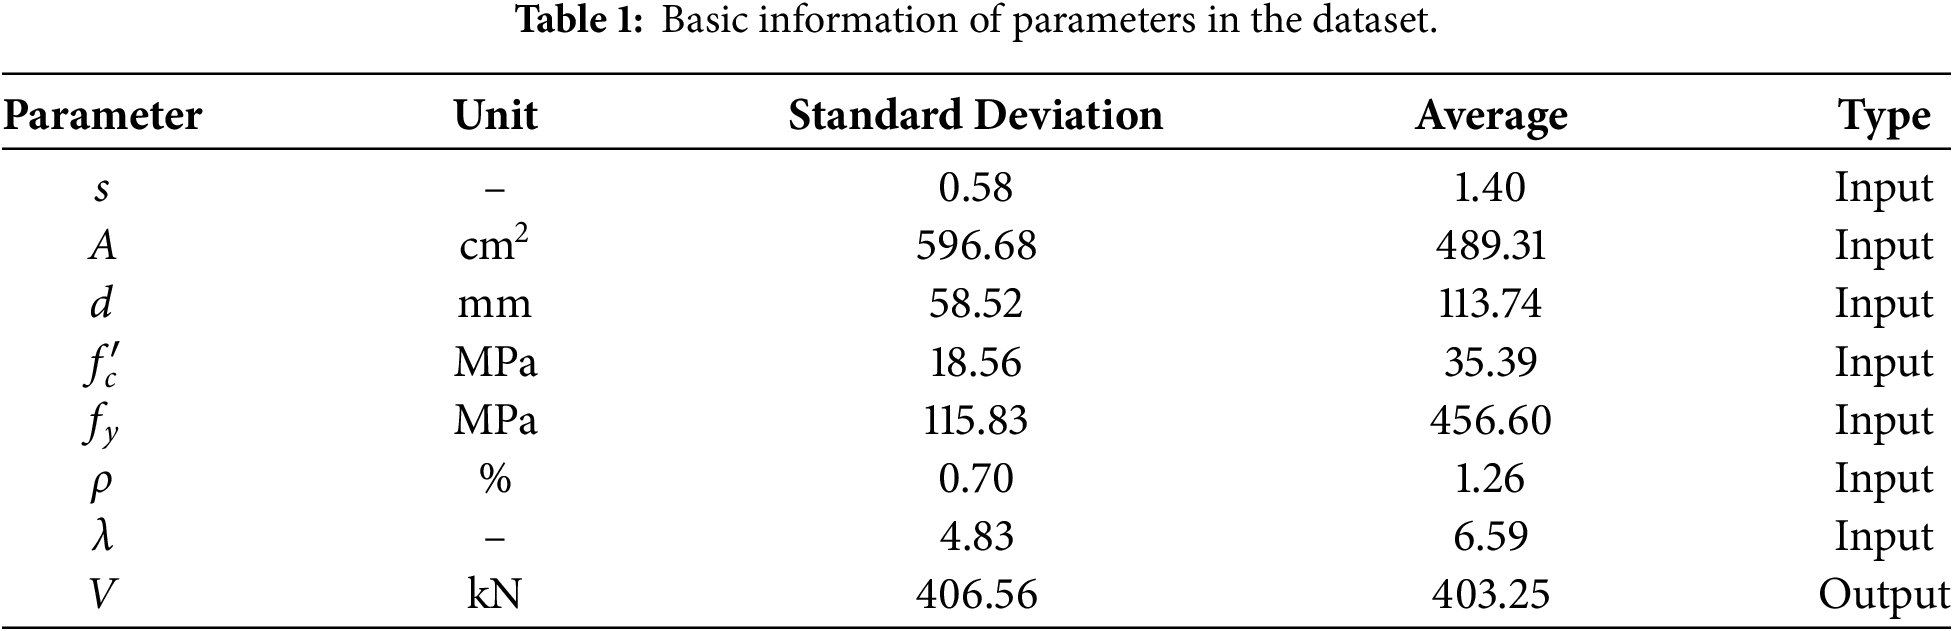
The database [46] used to establish the punching shear resistance capacity model comprises 610 sets of RC slab-column joint punching shear test results. All specimens exhibited punching shear failure as the failure mode, with ultimate punching shear capacity and relevant geometric, material, and reinforcement parameters recorded. This database exhibits good parameter diversity and data integrity.
Based on existing punching shear theory and experimental research, seven parameters significantly influencing punching shear capacity were selected as input features: cross-section shape of column (
The frequency distribution and cumulative distribution function of each variable are shown in Fig. 3, with the red line representing the cumulative distribution function of the parameters. The Pearson correlation coefficient matrix between the parameters is shown in Fig. 4, where the coefficients indicate the degree of linear correlation among the input variables.
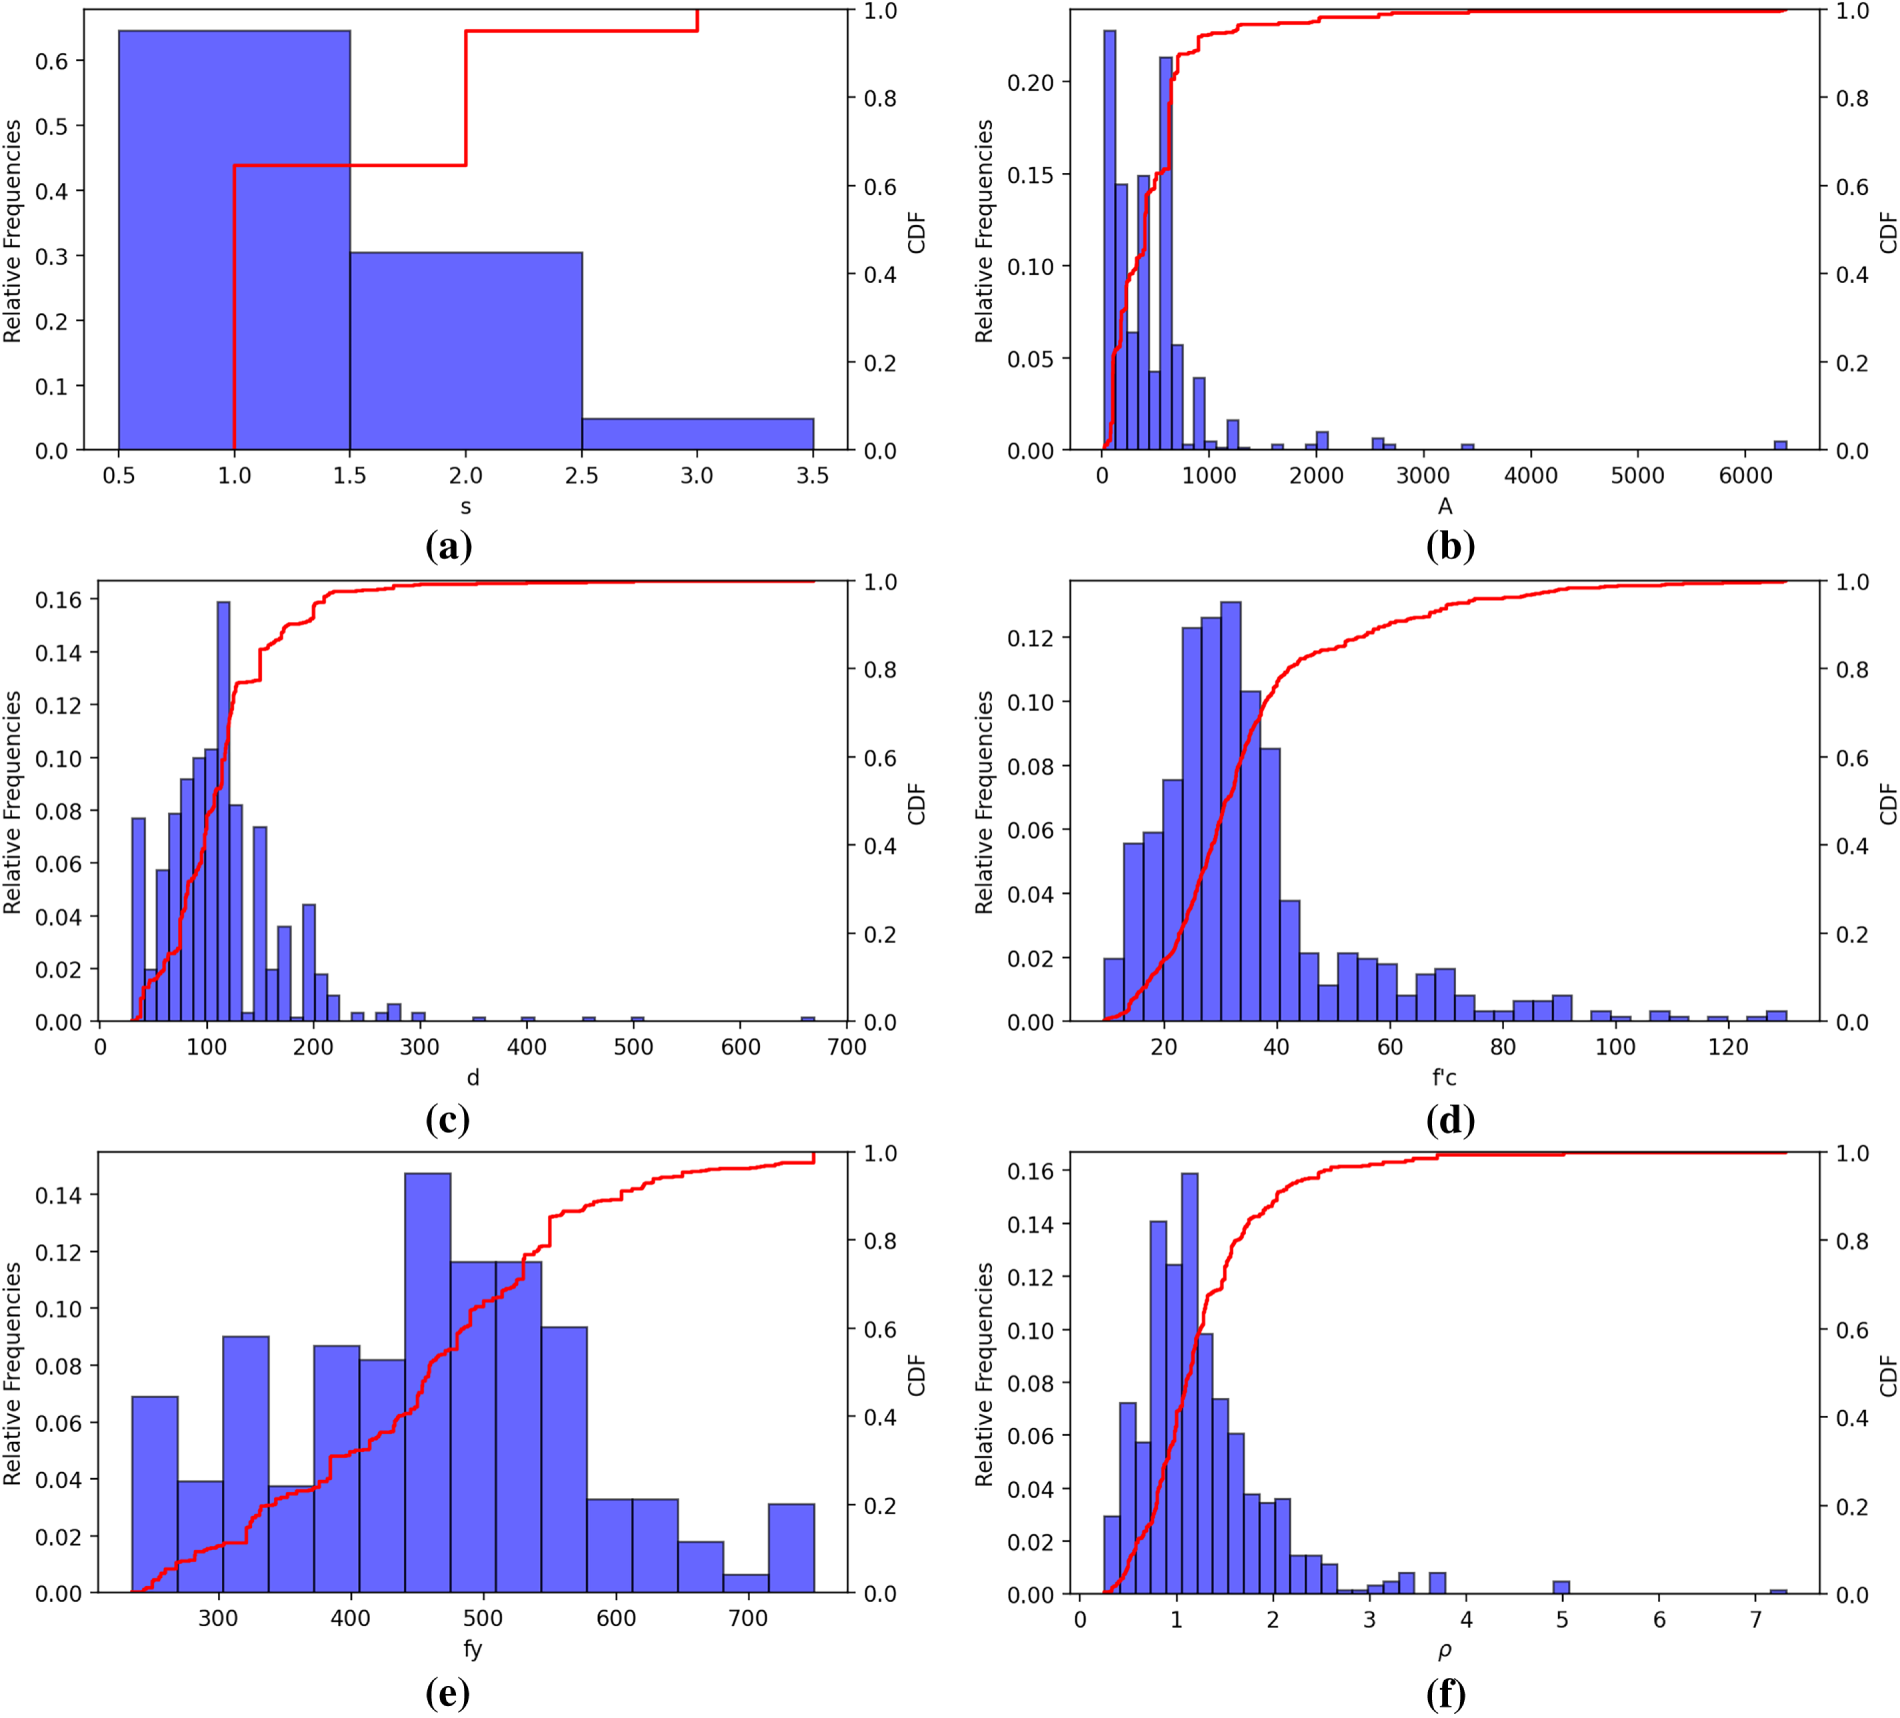
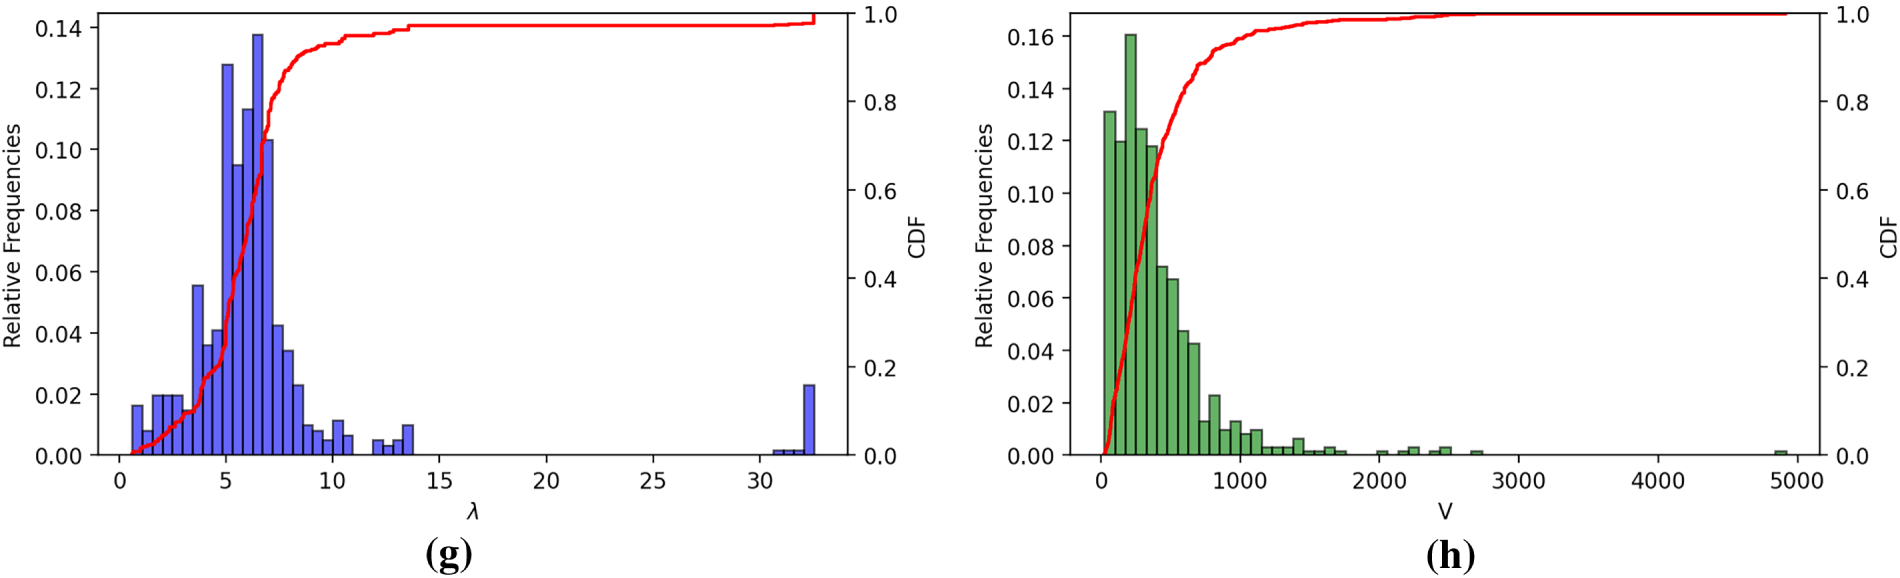
Figure 3: Distribution of parameters in the dataset: (a)
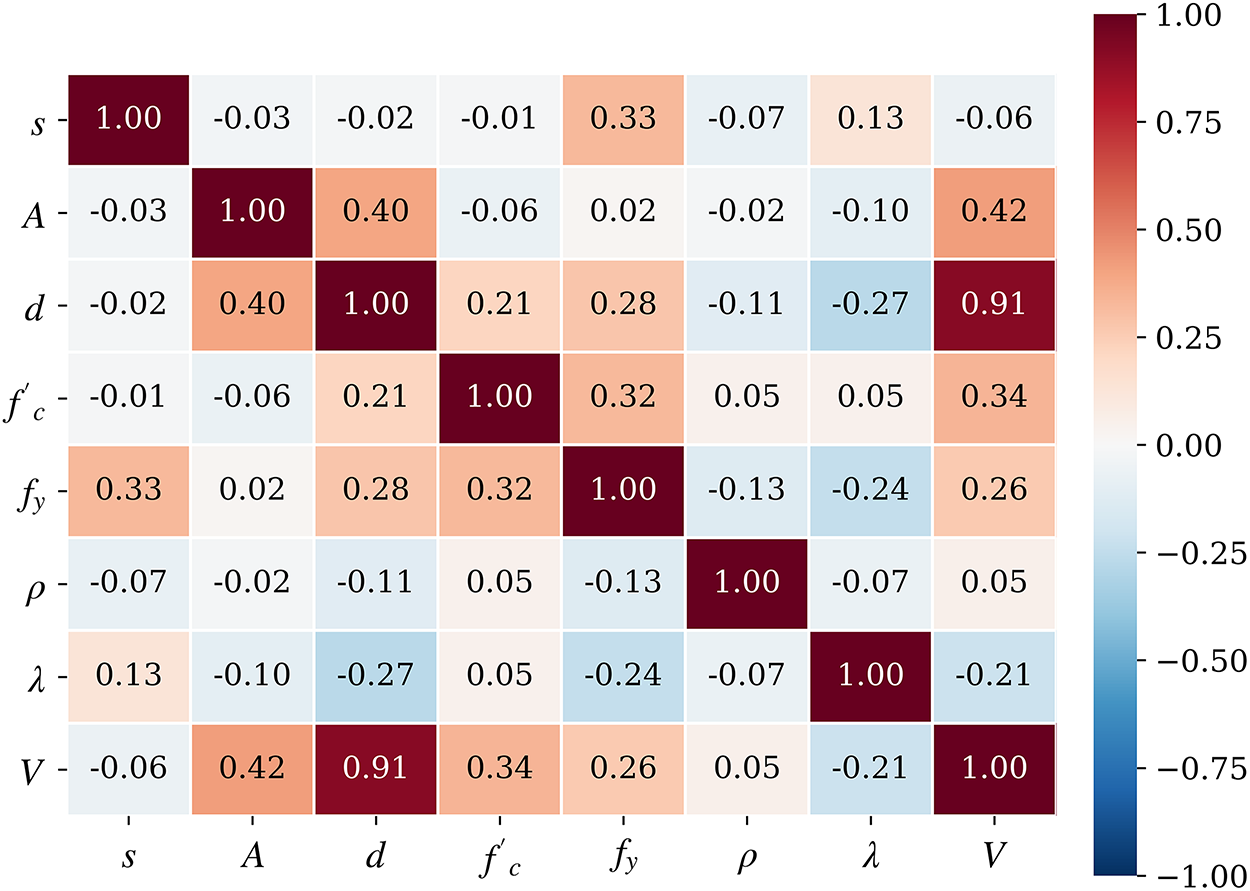
Figure 4: Correlation matrix of parameters.
2.2 Model Structure and Training Method
Based on the aforementioned database, a supervised regression framework was employed to establish a prediction model for the punching shear capacity of slab-column joints. First, the 610 sets of experimental data were randomly divided into a training set (500 sets) and a test set (110 sets) at an approximate ratio of 8:2. All model training was completed on the training set, and the test set served as independent samples to evaluate the model’s generalization capability. The entire modeling process is illustrated in the flowchart shown in Fig. 5.
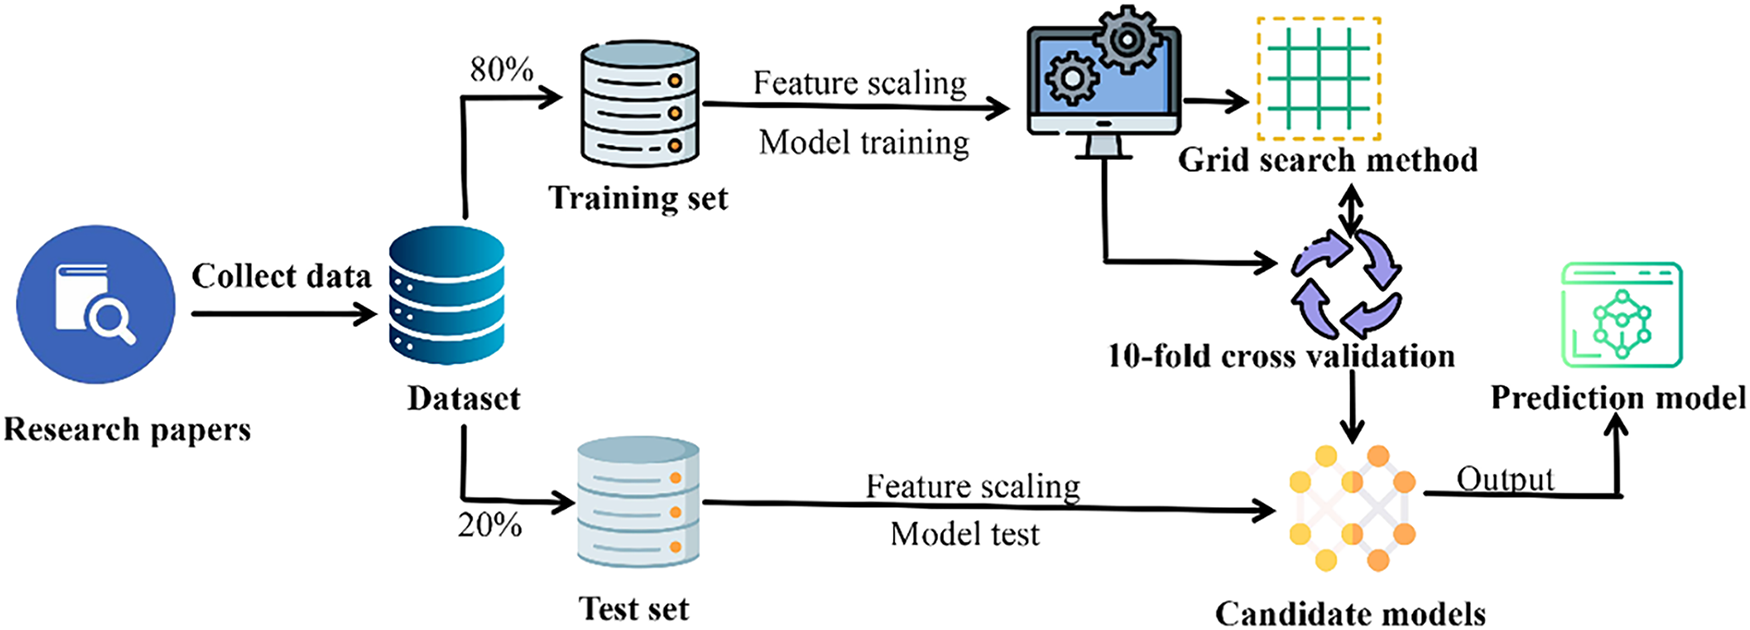
Figure 5: Machine learning modeling flowchart.
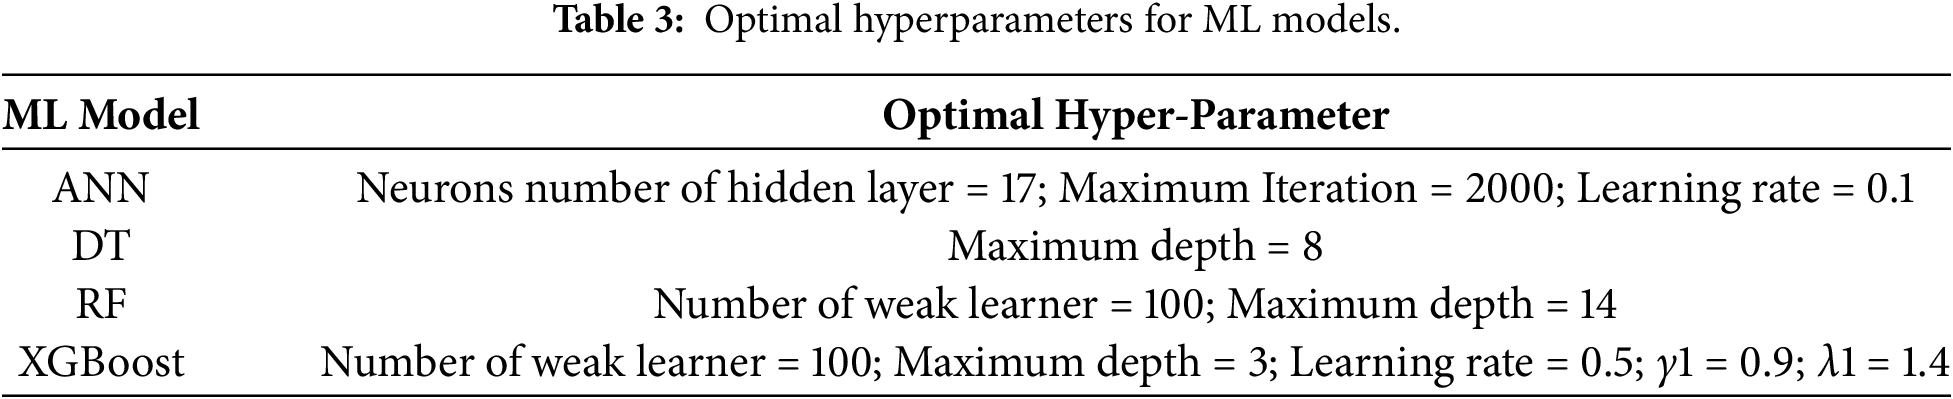
This study selected four representative supervised learning models for modeling and comparative analysis of the punching shear capacity at slab-column joints: Artificial Neural Networks (ANN), Decision Trees (DT), Random Forests (RF), and Extreme Gradient Boosting Trees (XGBoost). The model hyperparameters were tuned using grid search combined with 10-fold cross-validation on the training set. The mean cross-validation RMSE was adopted as the selection criterion, and the parameter combination yielding the lowest value was selected. The independent test set was not involved in hyperparameter tuning. The search ranges adopted for the four models are summarized in Table 2, while the optimal hyperparameters are presented in Table 3. To ensure fairness in comparing the predictive performance of different models, a consistent data partitioning scheme and feature preprocessing workflow were applied to all models during the modeling process. Validation and comparison were conducted under the same evaluation metric system.
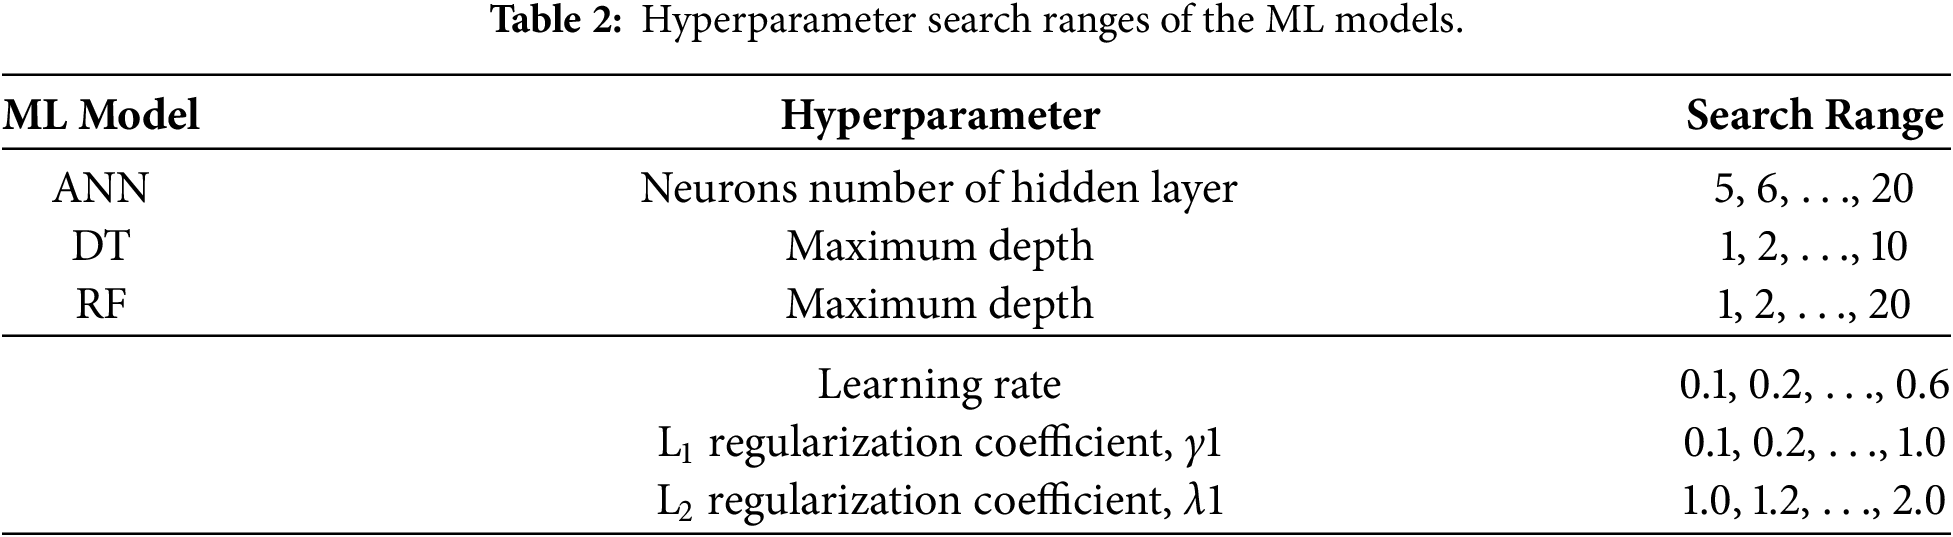
2.3 Model Prediction Performance Validation
Model prediction performance is evaluated using three metrics: Root Mean Square Error (RMSE), Mean Absolute Error (MAE), and Coefficient of Determination (R2). Let the database contain
Under the hyperparameters specified in Table 3, all four models were trained on 500 training samples and evaluated on 110 test samples to assess their generalization capabilities. Based on the statistical results of the entire dataset, the XGBoost model demonstrated the best performance across all three metrics. Its RMSE, MAE, and R2 values across the entire dataset were approximately 32.43 kN, 19.51 kN, and 0.99, respectively, significantly outperforming other candidate models such as ANN, DT, and RF.
To evaluate the predictive performance of the ML models against representative conventional formulations, two design codes [47,48] and three published punching shear models [49–51] were selected. The Tian et al. [49], Wu et al. [50], and Chetchotisak et al. [51] models were chosen because they predict the punching shear strength of RC slab–column connections, involve principal material and geometric parameters represented in the present database, and provide complementary test-derived, mechanics-based, and statistical-regression benchmarks. Specifically, the gravity-load formulation of Tian et al. [49] is primarily applicable to interior flat-plate connections subjected to concentric gravity loading; the Wu et al. [50] model combines the modified compression field theory with regression calibration and is intended for slab–column joints without punching shear reinforcement under vertical punching; and the Chetchotisak et al. [51] model is a multiple-linear-regression formulation developed from 342 concentric punching tests of connections without shear reinforcement. Accordingly, the present comparison is restricted to specimens consistent with the original connection type, loading condition, and reinforcement scope of each reference model. The resulting comparisons are presented in Fig. 6. The prediction model proposed by Chetchotisak et al. [51] demonstrated the best predictive performance in the traditional design methods, but its reliability is limited due to the absence of theoretical derivation. The mechanical models proposed by Tian et al. [49] and Wu et al. [50] exhibit significant deviations from actual punching shear resistance values. Their coefficients reflect relationships among influencing factors, indicating that punching shear resistance requires further refinement. Additionally, prediction results from design codes such as GB 50010-2010 [48] and ACI 318-19 [47] tend to be conservative, with room for improvement in prediction accuracy. In contrast, XGBoost achieves an R2 close to 1.0 while maintaining low RMSE and MAE, demonstrating significantly superior overall performance compared to the aforementioned traditional models.
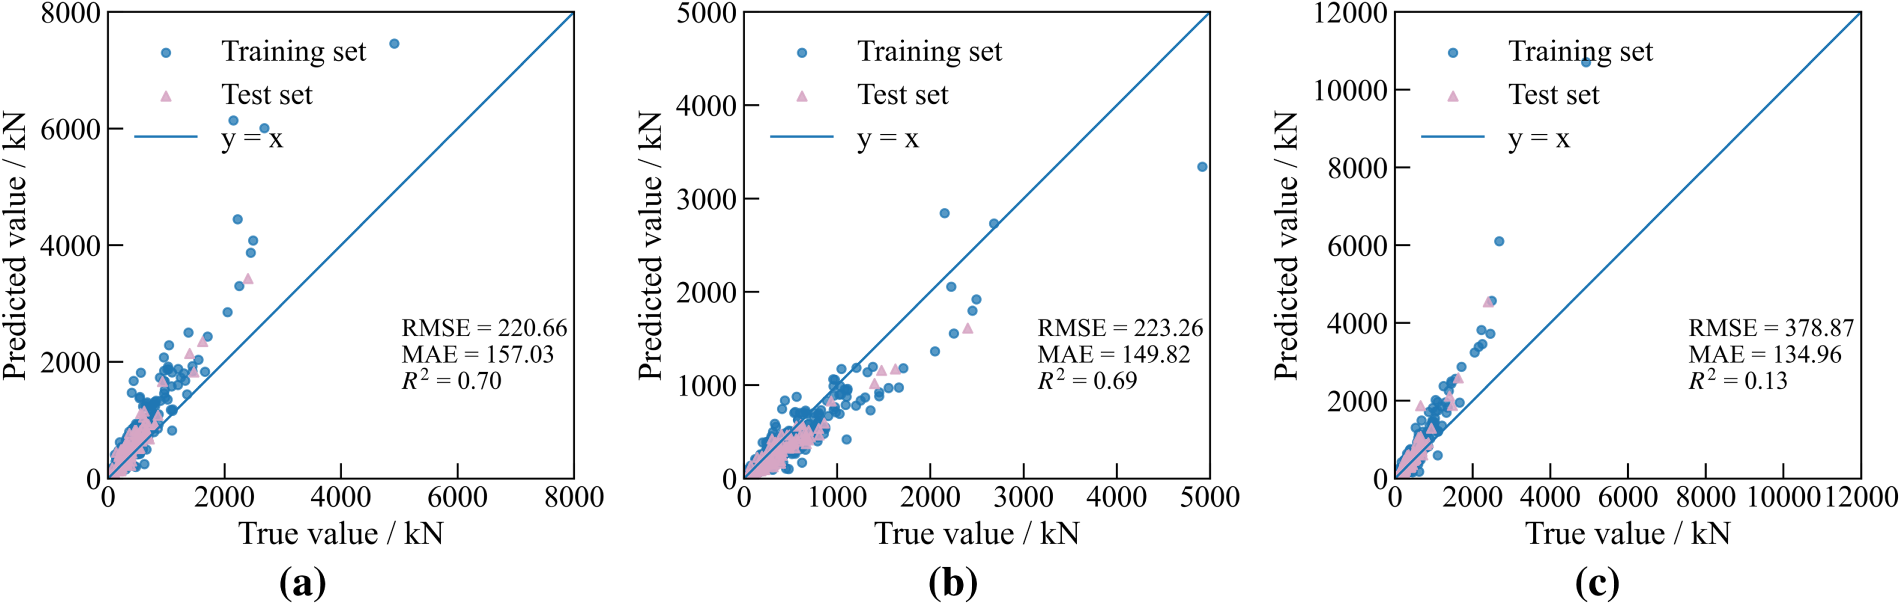
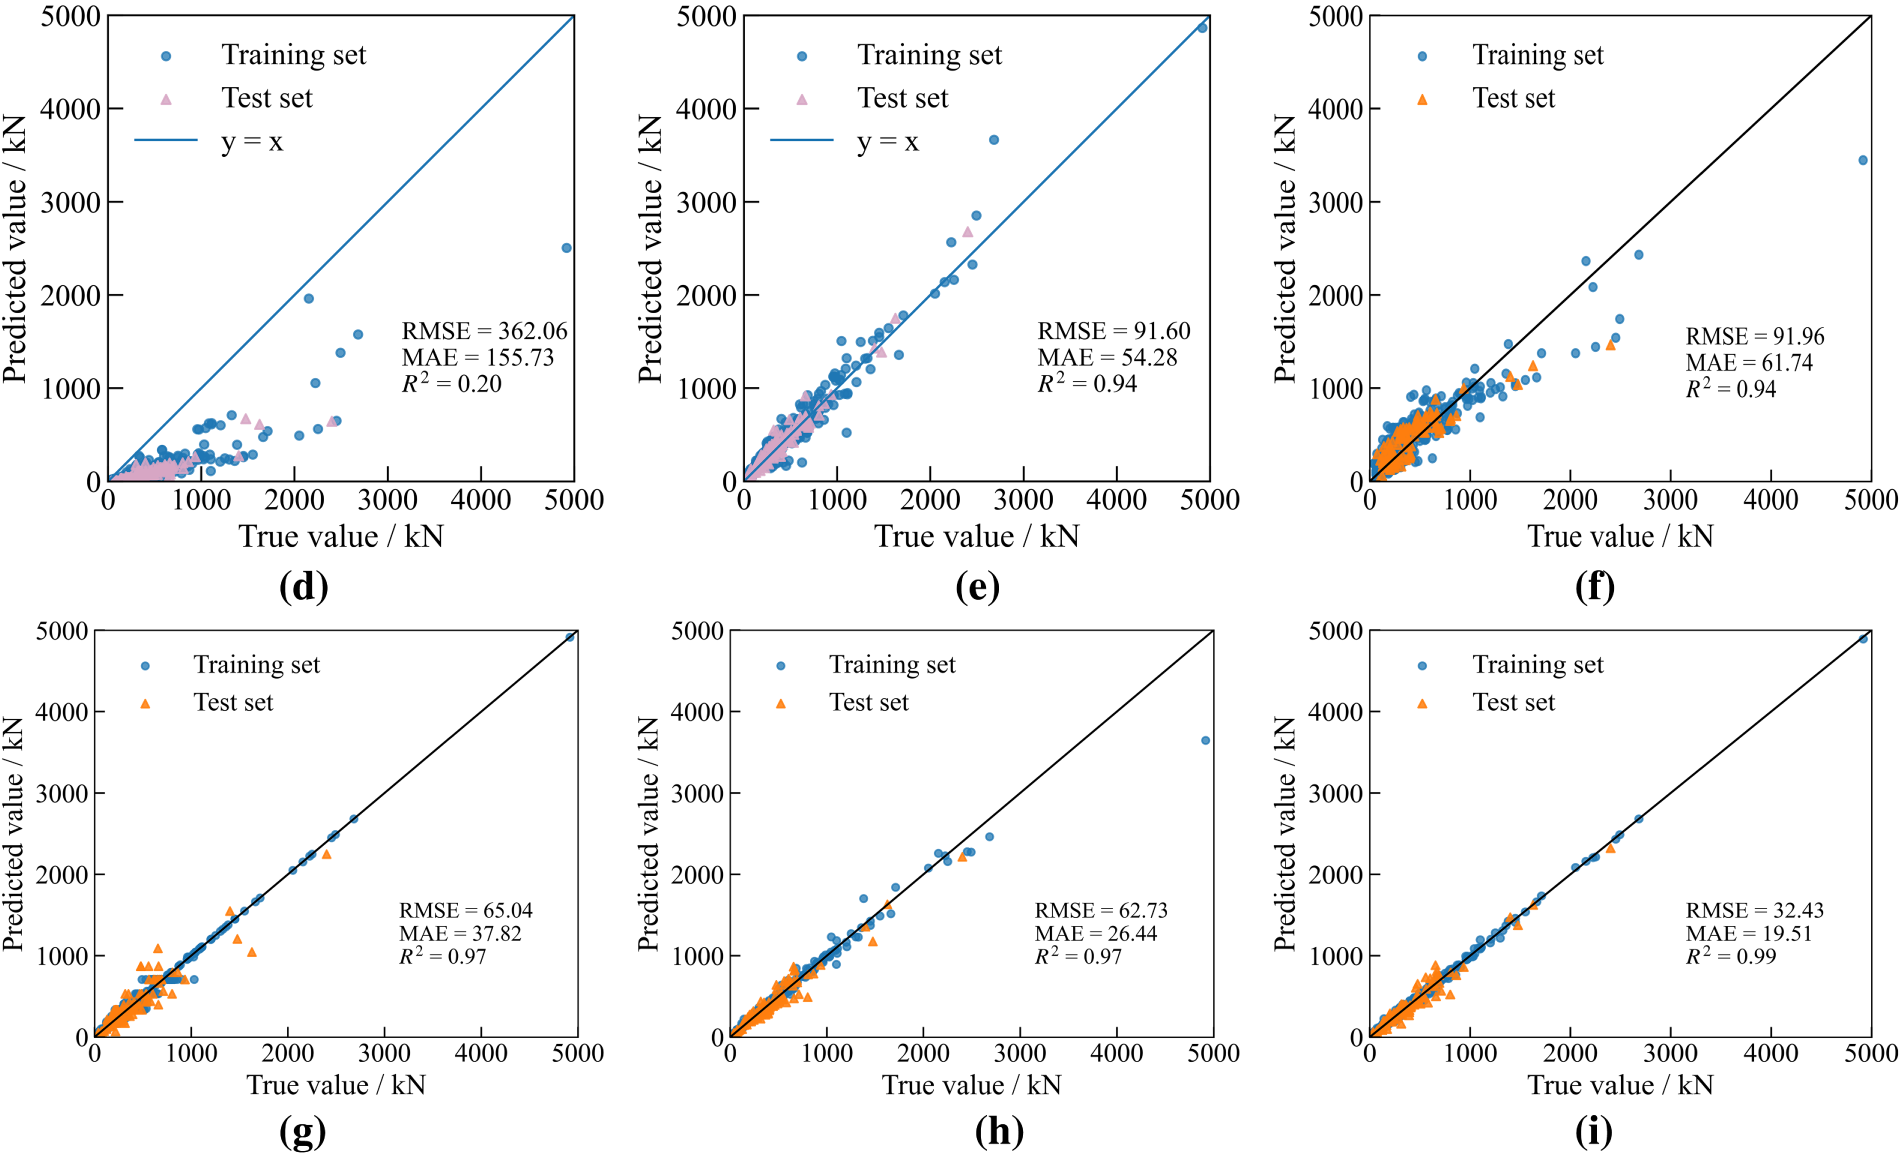
Figure 6: Prediction results of empirical models and ML models: (a) GB50010-2010 [48]; (b) ACI318-19 [47]; (c) Tian et al. [49]; (d) Wu et al. [50]; (e) Chetchotisak et al. [51]; (f) ANN; (g) DT; (h) RF; (i)XGboost.
3 ML–FE Framework for System Reliability Analysis
3.1 Structure and Uncertainty Modeling
This study selected an existing building from an actual project as the subject for reliability analysis. The prototype building (Fig. 7) is a 7-story, 5-span reinforced concrete slab-column-shear wall office building designed in accordance with the Concrete Structure Design Code (GB 50010-2010) [48] and the Seismic Design Code for Buildings (GB 50011-2010) [52]. Each floor has a height of 3 m and is supported by a 7.5 m × 7.5 m column grid.
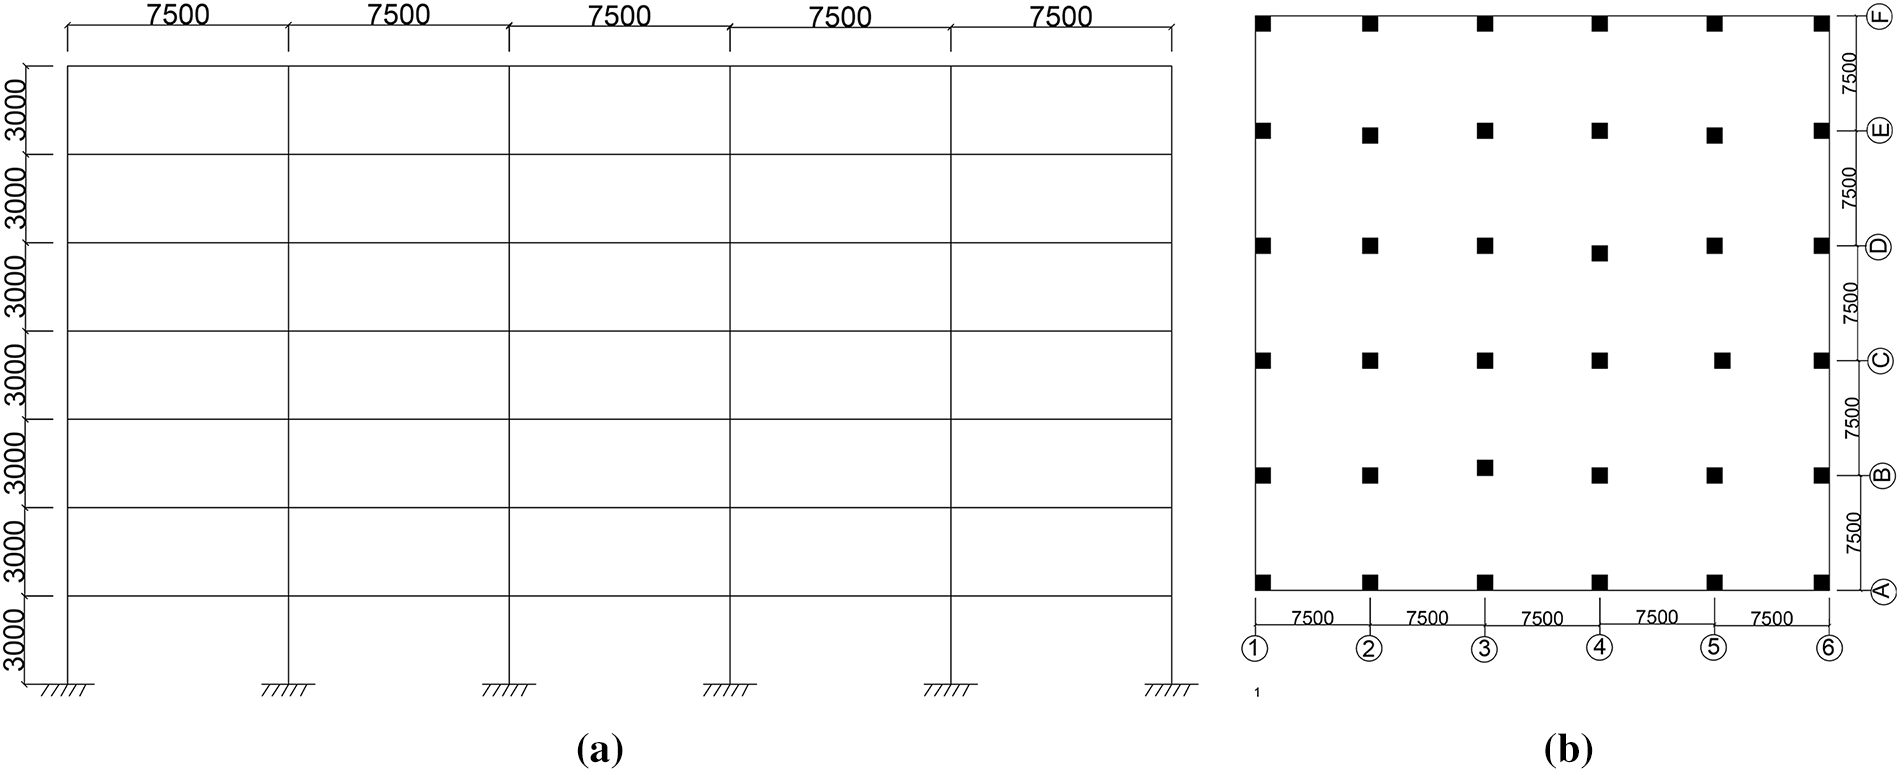
Figure 7: Prototype building: (a) Elevation; (b) Plan.
This paper selects one floor for reliability analysis, with its primary parameters shown in Table 4. The slab thickness of this floor is 230 mm, the protective layer thickness is 15 mm, and the selected longitudinal reinforcement consists of HRB400 steel bars with a diameter of 12 mm. Based on the experimental results reported by Tang et al. [53], the yield strength and ultimate tensile strength of the HRB400 reinforcement were 421 and 580 MPa, respectively, and the reinforcement ratio was 0.81%. The standard values of permanent and live loads acting on the slab are 7.0 and 2.0 kN/m2, respectively. According to the requirements of the “Unified Standard for Reliability Design of Building Structures” (GB 50068-2018) [54], during limit state design, the permanent load and live load shall be multiplied by action sub-item coefficients of 1.3 and 1.5, respectively.

A computationally efficient macro-model was established in OpenSees to investigate load redistribution and the evolution of punching-induced joint failures at the structural-system level under the combined action of dead and live loads. The flat slab was modeled using elastic ShellMITC4 elements, while the columns were represented by elasticBeamColumn elements. At each slab–column location, the slab and column-top nodes were constrained in the two in-plane directions, whereas vertical load transfer was represented by an equivalent zeroLength spring. This modeling strategy concentrates the dominant connection nonlinearity at the slab–column interfaces while retaining the global stiffness and alternative load-transfer paths of the structural system.
The equivalent spring response was parameterized using the Concrete02 and Steel01 constitutive relationships to represent the contributions of concrete and reinforcement to the vertical connection response. For joint
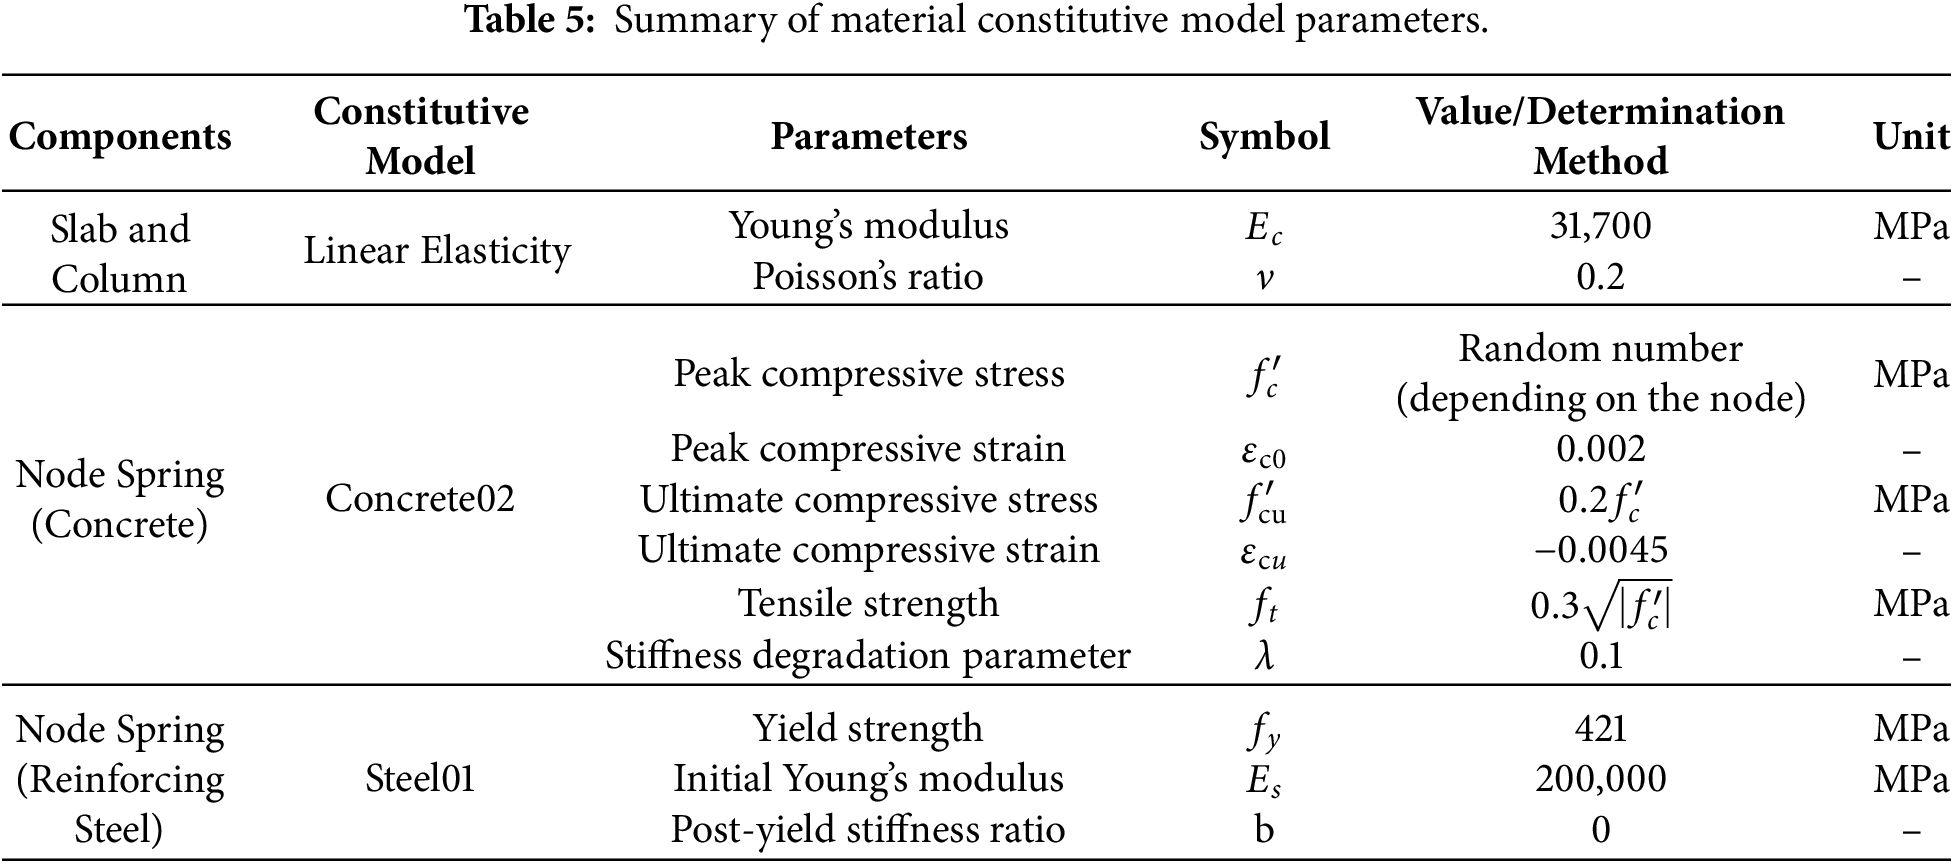
The descending branch of Concrete02 provides an idealized representation of the post-peak reduction in connection resistance, while Steel01 represents the equivalent reinforcement contribution after concrete softening. Because the analyses were conducted under a monotonically increasing factored combination of dead and live loads, no additional cyclic stiffness or strength degradation rule was introduced. A joint was classified as punching-failed when its vertical force demand satisfied
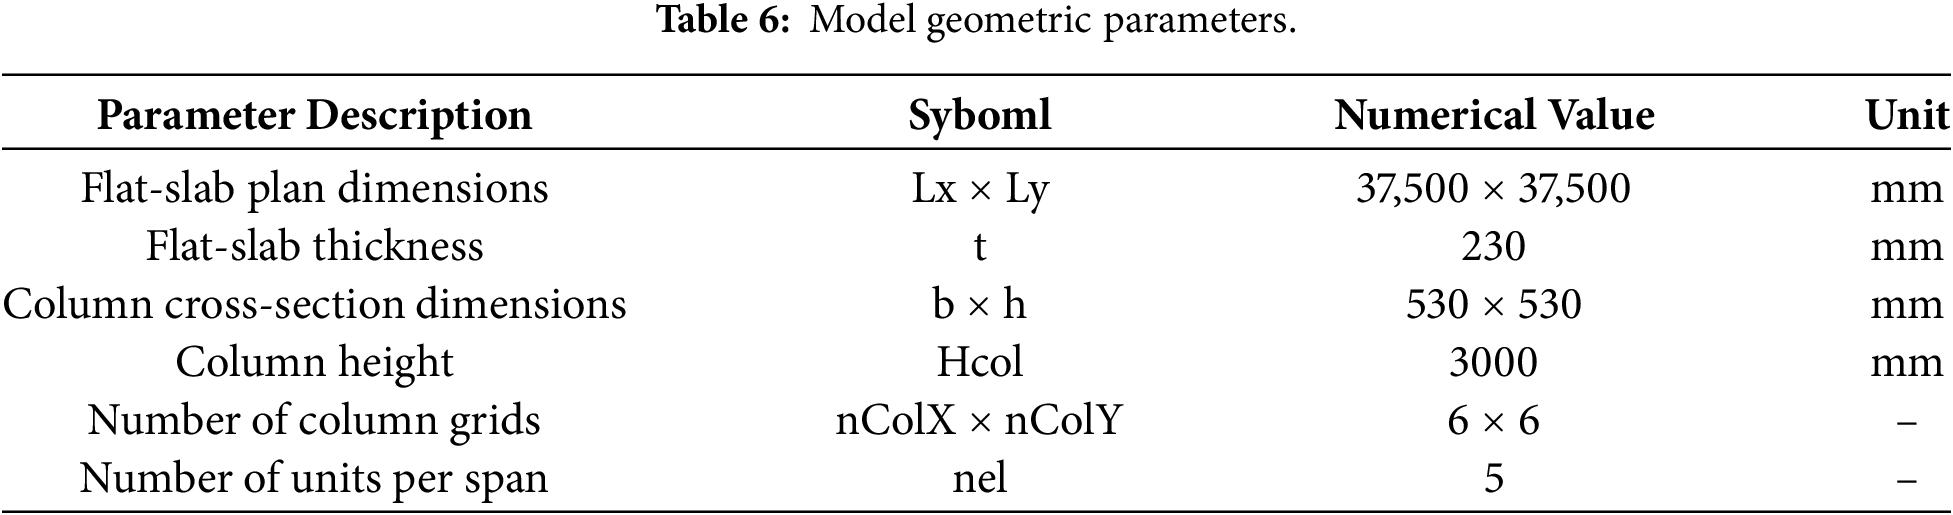
The slab and columns were modeled as elastic members because the present study focuses on punching-initiated system failure under the combined action of dead and live loads, for which the governing nonlinear response was assumed to be concentrated at the slab–column connections. This simplification also reduces the computational demand associated with the large number of repeated FE analyses required by the proposed reliability framework. Following the prescribed initial support loss, the elastic slab and columns continue to provide the global stiffness and alternative load-transfer paths necessary for evaluating structural redistribution. Nevertheless, the adopted macro-model does not explicitly represent distributed slab cracking, reinforcement yielding away from the connections, column plasticity, or nonlinear membrane and post-punching actions. These mechanisms may influence the magnitude of load redistribution and the predicted sequence of joint failures. Therefore, the system-level results should be interpreted within the scope of the adopted modeling assumptions.
This study establishes random variable models for two primary random parameters: materials and loads. Material randomness is characterized by the compressive strength

Based on the above structural parameters and probabilistic descriptions of material and loading uncertainties, a joint-level limit-state function is introduced to connect the XGBoost-predicted punching resistance with the stochastic load demand. This formulation provides the basis for Monte Carlo sample generation and for the subsequent Stage I screening in the proposed two-stage ML–FE framework.
To evaluate system reliability, the limit state function for a slab-column joint
where
Monte Carlo Simulation (MCS) is employed to generate the stochastic dataset. For the
This process yields a comprehensive dataset
3.2 Two-Stage ML–FE System Analysis Workflow
Based on the probabilistic description and joint-level limit-state function defined in Section 3.1, the proposed two-stage ML–FE framework is employed to evaluate the system failure process of flat-slab structures under uncertainty. The framework combines efficient local screening with nonlinear system-level analysis. In Stage I, the ML surrogate model is used to identify Monte Carlo realizations with potential punching shear initiation at slab–column joints. In Stage II, only the selected critical realizations are propagated into the OpenSees model to simulate load redistribution, failure propagation, and the associated system response. The overall procedure is illustrated in Fig. 8.
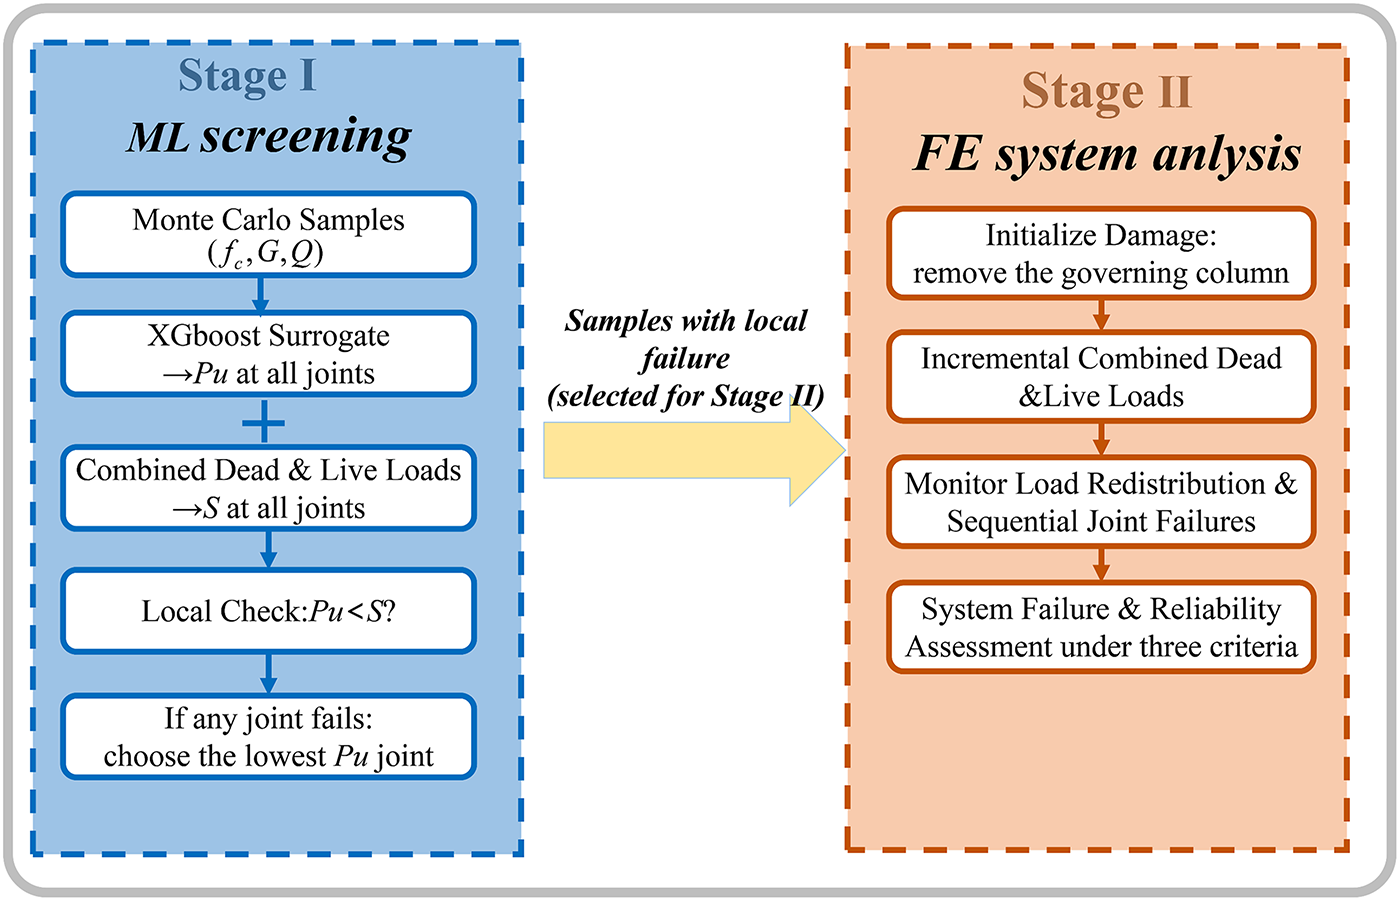
Figure 8: Two-stage ML-FE analysis workflow.
3.2.1 Stage I: Joint Punching Shear Failure State Identification
The objective of Stage I is to determine the punching shear failure state of slab-column joints at the component scale using ML surrogate models and Monte Carlo samples. Based on this assessment, samples requiring subsequent OpenSees modeling analysis are selected. For each sample group
Stage I is intended as a computational screening step rather than an independent classification model. The screening decision is directly derived from the regression-based resistance prediction through the limit-state function
3.2.2 Stage II: System Response Analysis and Failure Evolution Identification
Stage II conducts system-level response analysis on samples identified in Stage I, based on the flat-slab system FE model developed in Section 3. For a given sample, the punching shear resistance
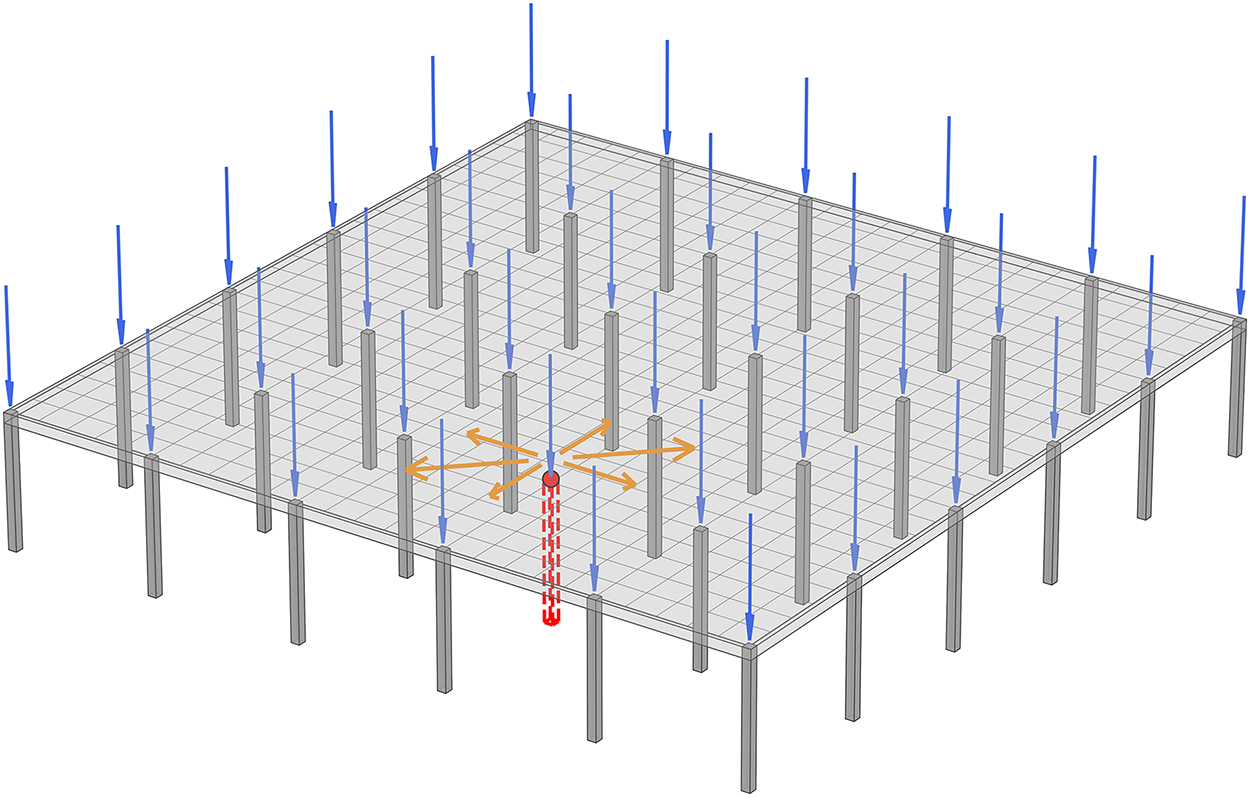
Figure 9: Schematic representation of the OpenSees model in Stage II.
Through static incremental analysis, loading proceeds to the target vertical load level. The structural model undergoes continuous redistribution of internal forces during loading. When a joint reaches its ultimate load condition (i.e., the vertical reaction at the node reaches
The system reliability analysis in this study will be conducted based on the three failure criteria described above. These criteria will form the basis for evaluating the structural system’s failure probability and assessing its performance under uncertainty.
To comprehensively track the structural response, the model records two key data sets: overall response history and node response history. The overall response history logs the analysis step, cumulative load factor, vertical displacement at the slab center point, total structural reaction force, maximum utilization factor across all joints, and cumulative total failed nodes. The joint response history records the vertical load, punching shear resistance capacity, and their ratio (i.e., utilization factor) for each slab-column joint at every analysis step.
Based on the spatiotemporal evolution data of node utilization coefficients, the sequence of joint failures can be clearly identified, enabling the creation of an intuitive joint failure path diagram that ultimately reveals the dynamic propagation mechanism of sequential collapse.
4 System Failure Criteria and Reliability Results
4.1 Definition of Failure Criteria
When conducting reliability analysis of slab-column structures based on local punching shear capacity, it is necessary to establish failure criteria for the structural system beyond the ultimate limit states at the component level. The traditional weakest-link assumption [55] posits that structural failure occurs as soon as any single slab-column joint reaches its punching shear capacity. However, simply adopting this criterion overlooks the inherent redundancy and load redistribution capabilities of flat-slab systems, thereby leading to a significant underestimation of overall system reliability. Therefore, it is necessary to introduce multi-level system failure criteria beyond joint punching shear failure standards.
Drawing on research approaches concerning structural reliability and redundancy, this paper proposes three categories of system failure criteria based on three levels: local failure, redundancy depletion, and through-failure. All three criteria are grounded in the same joint limit state function:
where
(1) Criterion 1: Failure of any node
Criterion 1 is defined as: when at least one slab-column joint satisfies.
This criterion assumes the structural system has entered a failure state. It treats the entire flat-slab system as a “weakest-link system” composed of several series-connected components, where structural reliability is entirely governed by the single weakest member. This definition applies to statically determinate bar systems or structural systems lacking redundant paths [56]. However, for flat-slab structures possessing spatial redistribution capabilities and inherent redundancy, isolated node punching shear failure does not necessarily equate to complete loss of the flat-slab system’s functional integrity or load-bearing capacity [57].
(2) Criterion 2: 15% Node Failure Limit
Criterion 2 defines system failure in terms of structural redundancy degradation and local damage control. When the ratio of the number of slab-column joints that have reached the punching shear limit state to the total number of joints is not less than the threshold
In this study,
(3) Criterion 3: 30% Node Failure Limit
Criterion 3 is used to characterize system failure states at higher damage levels. When the proportion of slab-column joints that have reached the punching shear limit state is not less than the threshold
In this paper,
This threshold is primarily based on the control level for acceptable collapse ranges under scenarios involving the removal of interior columns, as specified in the GSA Guidelines for Progressive Collapse Analysis and Design [60]. Under such more severe accident conditions, the permissible range of floor damage may be relaxed to approximately 30% of the floor area, reflecting the upper limit of consequences permitted for the structure under extreme failure scenarios.
From a mechanical perspective, when approximately 30% of the joints fail due to punching shear, a significant portion of the support paths in the flat-slab has already been lost, and the structure’s capacity for internal force redistribution may be substantially depleted. The remaining intact joints often bear significantly amplified load effects. At this point, the overall stiffness, continuity, and vertical load-transferring capacity of the system all deteriorate markedly, and the structure approaches a state of severe system damage in the context of continuous collapse [26,61]. Compared to the 15% threshold, the 30% threshold corresponds to a later and more severe damage stage; therefore, it can serve as an upper-bound criterion in system reliability analysis to describe “severe system damage” or a “state approaching total collapse.” From a probabilistic perspective, Criteria 2 and 3 define the exceedance events
4.2 Identification and Visualization of Failure Propagation Paths
To represent the spatial evolution of punching shear failure at the system level, this section visualizes the progressive collapse process based on the numerical outputs from Stage II. Specifically, the OpenSees modeling process employs a nonlinear static analysis under incremental vertical loading. Following the removal of the governing column (initial defect identified in Stage I), combined dead and live loads are applied in small increments to the damaged structure. At each analysis step, the vertical reaction force of every remaining slab-column joint is monitored and compared against its specific punching shear capacity (
By tracking the specific time steps and spatial locations of these sequential failure events, failure path maps are generated. Failure path identification relies on the hierarchical response history of joints recorded during the FE simulation. For each slab-column joint, the analysis step corresponding to the first occurrence of the limit state (
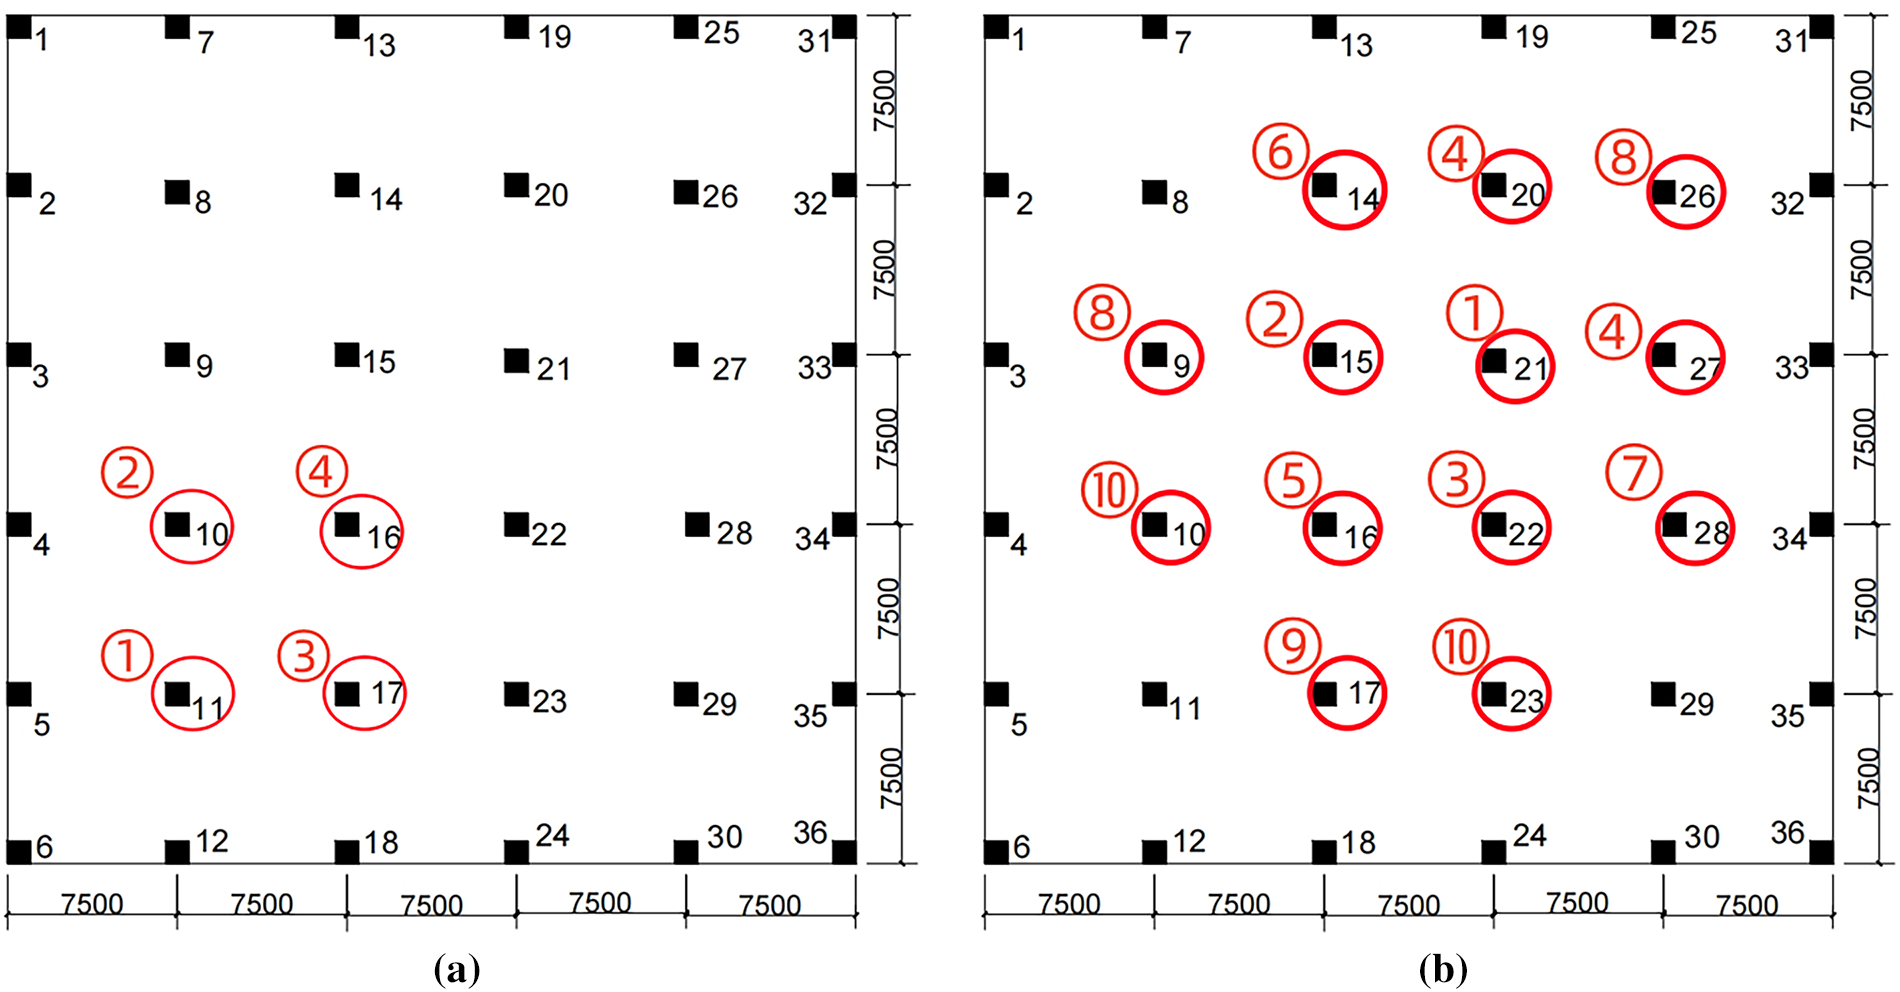
Figure 10: Punching shear failure propagation path of two samples: (a) Sample 1; (b) Sample 2.
The numbering in Fig. 10 represents the temporal sequence of failure occurrence: Number ① denotes the column position removed prior to system analysis (i.e., the initial defect location identified and selected in Phase I); When multiple initial failure nodes are identified in the same specimen during Phase I, the joint with the lowest predicted bearing capacity is selected as the initial bearing capacity loss location according to this paper’s strategy, thereby determining the column position corresponding to number ①. Subsequently, numbers ② and beyond represent jonts that sequentially experience punching shear failure during loading, with numbers increasing in order of failure occurrence.
4.3 System Failure Probability and Reliability Metrics
4.3.1 Assessment of Failure Probabilities and Structural Robustness
Based on the two-stage framework, failure probabilities are evaluated at two hierarchical levels: the component level (local punching shear initiation) and the system level (progressive collapse). Let denote the total number of Monte Carlo samples. The local failure probability,
where
The sampling uncertainty of the Monte Carlo estimate was quantified using the coefficient of variation (COV):
To evaluate the structural redundancy and the cascading nature of failure, the ratio between the system failure probability and the local failure probability is calculated. This ratio quantifies the likelihood of system collapse after a local failure event and offers insights into the structural resistance to progressive collapse. It is defined as follows:
This ratio reflects the strength of correlation between local damage and system collapse. A value close to 1.0 indicates that the occurrence of local punching shear failure almost inevitably escalates into system-level collapse, implying weak redundancy and limited capacity for load redistribution. In contrast, a value closer to 0.0 suggests that a considerable proportion of local failure events can be contained without triggering global instability, indicating a stronger ability of the structural system to mitigate failure propagation.
4.3.2 Reliability Results and Computational Efficiency
To examine the influence of different system failure definitions on structural reliability, failure probabilities were evaluated separately under the three candidate criteria introduced in Section 4.1. In addition to comparing the reliability outcomes across the three criteria, the stability of the proposed two-stage framework was examined using different Monte Carlo sample sizes. The resulting reliability metrics and computational costs are summarized in Table 8, where subtables (a)–(c) correspond to Criteria 1–3, respectively.
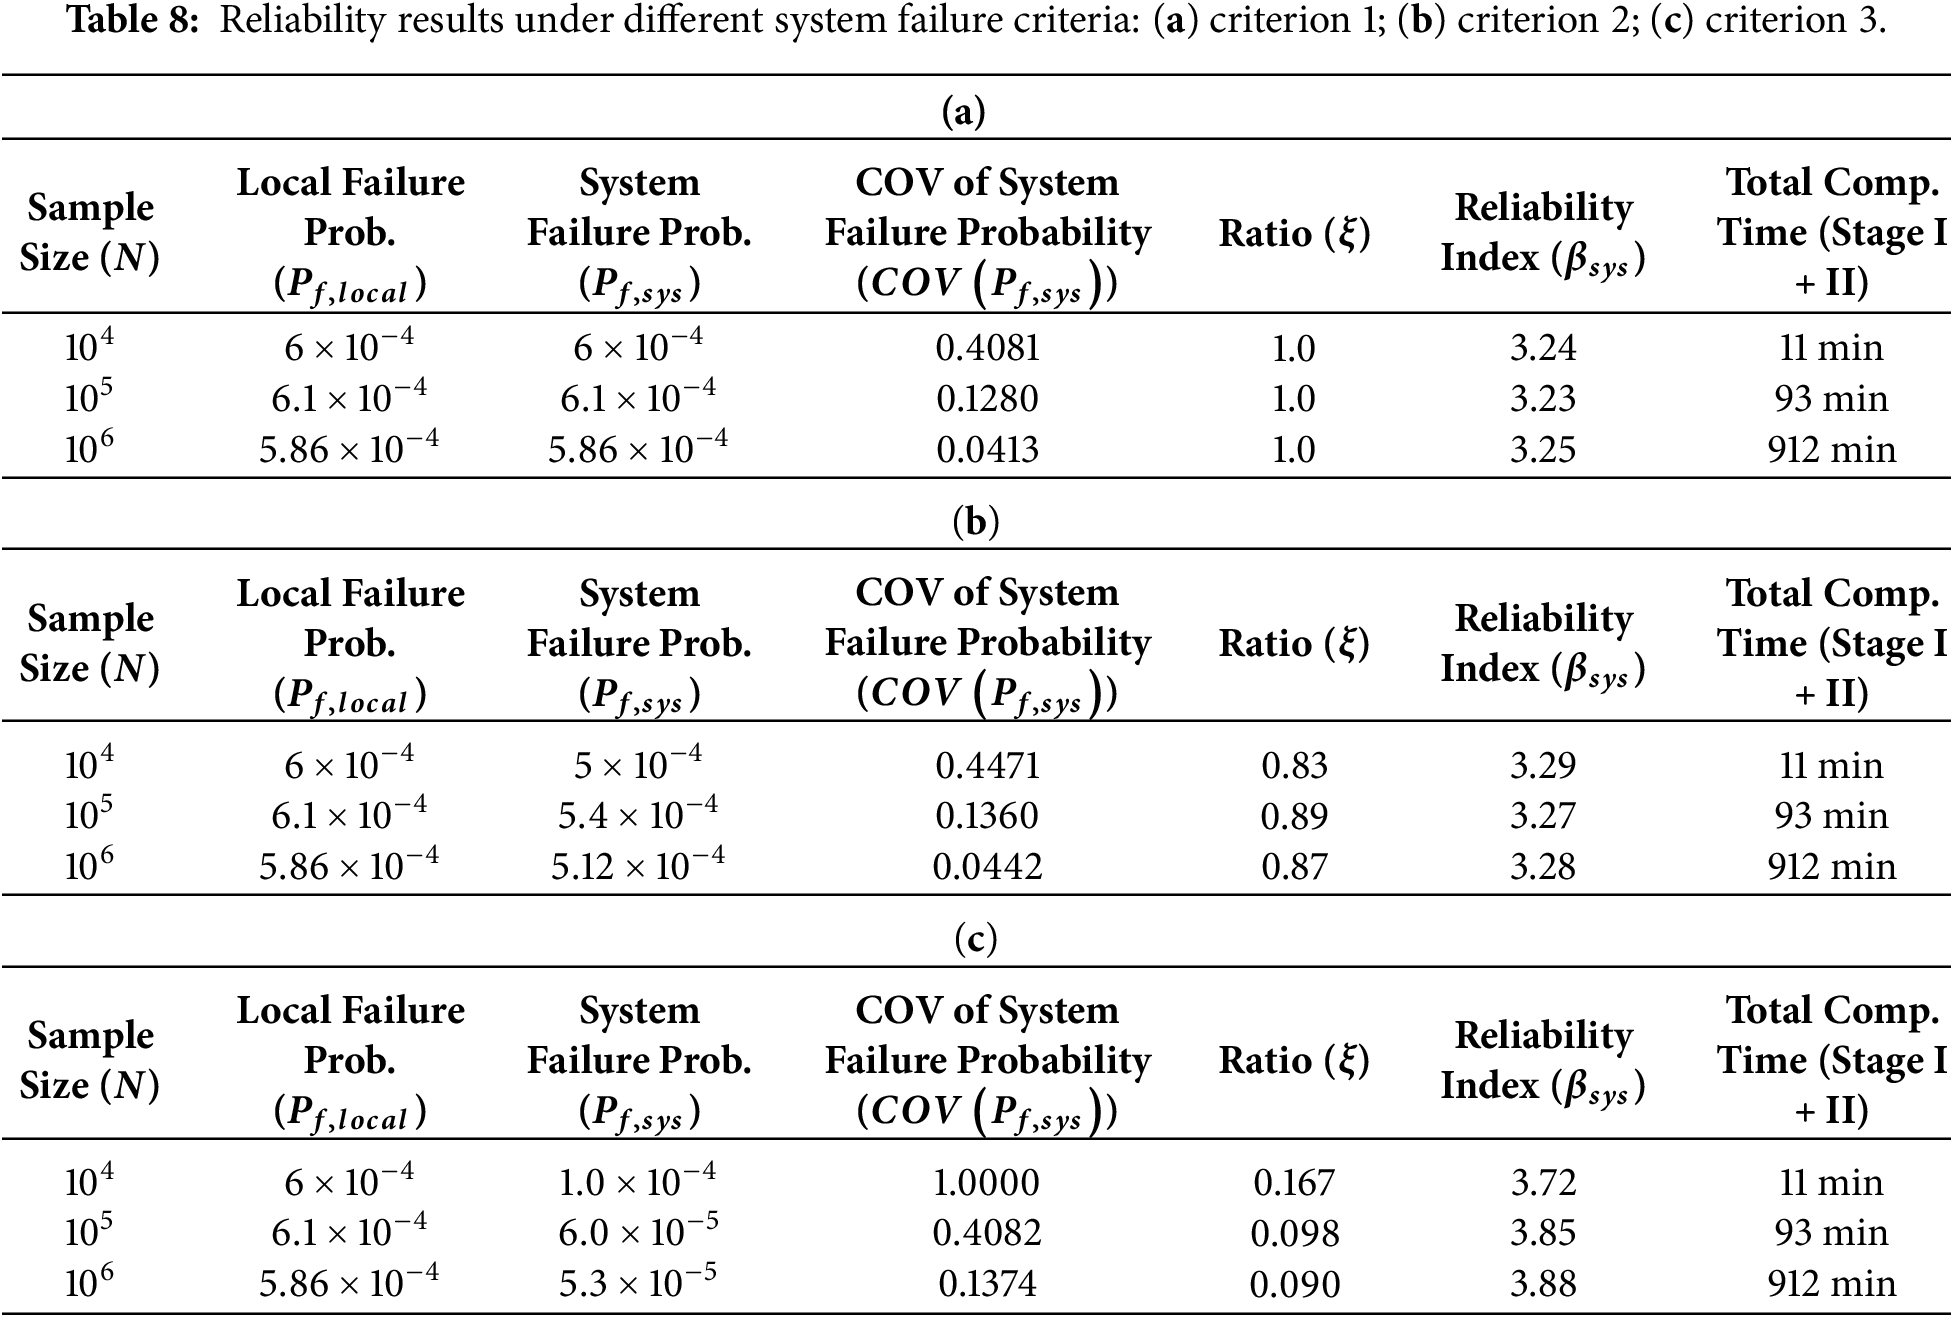
The differences among the three criteria arise from their distinct definitions of system failure. Under Criterion 1, the local and system failure probabilities are identical by definition, reflecting a conservative weakest-link assumption rather than inevitable global collapse following a single joint failure. Under Criterion 2, the close probabilities indicate that most initial local failures propagate to a moderate multi-joint damage state, whereas the markedly lower probability under Criterion 3 suggests that only a limited proportion develops into extensive system damage because of structural redundancy and load redistribution. Accordingly, Criterion 1 is suitable for conservative component-level safety checks, Criterion 2 provides a more representative basis for system-level reliability assessment, and Criterion 3 serves as a supplementary indicator of severe system damage.
Furthermore, a critical advantage of the proposed two-stage ML-FE framework lies in its computational efficiency, which is essential for large-scale system reliability analysis. Table 9 presents a comparative summary of the computational costs required to evaluate

This study proposes a probabilistic system-level failure assessment framework for reinforced concrete flat-slab structures by integrating ML–based surrogate modeling with nonlinear structural simulation. The principal findings are summarized as follows:
(1) A two-stage analytical strategy was developed to explicitly link joint-level punching shear failure with global system collapse. The XGBoost surrogate model efficiently characterizes resistance uncertainty and screens potentially critical samples within the Monte Carlo space, while nonlinear OpenSees simulations are performed only for these selected cases to capture load redistribution and progressive collapse. This staged scheme substantially reduces computational cost under the adopted modeling assumptions, making large-scale probabilistic analysis of flat-slab systems practically feasible.
(2) A spatiotemporal failure path identification method was established to interpret progressive collapse mechanisms beyond conventional probabilistic metrics. By recording the first occurrence of punching shear failure at each joint and mapping these events onto the structural grid, failure propagation diagrams were constructed to simultaneously illustrate damage localization and chronological evolution. This visualization enables consistent comparison of collapse patterns among samples and facilitates identification of critical regions and dominant propagation routes within the flat-slab system.
(3) Comparative evaluations demonstrate that ML–based predictions significantly outperform traditional design provisions and mechanical models in terms of accuracy and robustness. Among all candidate approaches, the XGBoost model achieves the lowest prediction errors and the highest coefficient of determination, supporting its use for joint-level resistance prediction and preliminary screening. The system reliability results varied substantially with the adopted failure criterion, indicating that the estimated failure probability is criterion-dependent and influenced by structural load redistribution, highlighting their vulnerability to progressive collapse once punching shear failure initiates.
Several limitations should be noted. The applicability of the XGBoost surrogate is limited by the parameter range of the experimental training database, and Stage-I screening errors may affect the estimated system failure probability. In addition, only concrete strength and dead and live loads are treated as random variables in the present example, while the adopted OpenSees macro-model simplifies the slab and columns as elastic members. Finally, the 15% and 30% failed-joint criteria are comparative damage indices rather than universally calibrated collapse thresholds. Future work will focus on broader uncertainty modeling and further system-level validation.
Overall, this study contributes a computationally tractable bridge between data-driven joint-capacity prediction and nonlinear system-level reliability analysis, thereby extending punching shear assessment from isolated slab–column joints to the progressive failure behavior of the entire structural system. The proposed framework, together with the spatiotemporal failure-path identification method, provides a quantitative basis for selecting system failure criteria, identifying critical joints and dominant propagation routes, and supporting risk-informed design and strengthening decisions for reinforced concrete flat-slab structures.
Acknowledgement: None.
Funding Statement: This research was supported by the Science Foundation of Zhejiang Province of China (Grant No. LY22E080016), the National Natural Science Foundation of China (Grant No. 51808499), and the Fundamental Research Funds of Zhejiang Sci-Tech University (Grant No. 24052126-Y).
Author Contributions: The authors confirm contribution to the paper as follows: study conception and supervision: Shixue Liang; machine-learning surrogate model development and related data support: Yuanxie Shen; integration of the surrogate model into the two-stage ML–FE framework, OpenSees finite element modeling, system reliability analysis, interpretation of results, and draft manuscript preparation: Yuanyuan Zeng. All authors reviewed and approved the final version of the manuscript.
Availability of Data and Materials: Some or all data, models, or code that support the findings of this study are available from the corresponding author upon reasonable request.
Ethics Approval: Not applicable.
Conflicts of Interest: Shixue Liang had no involvement in the peer review of this article and had no access to information regarding its peer review. Full responsibility for the editorial process for this article was delegated to another journal editor. The authors declare no other conflicts of interest.
References
1. King S, Delatte N. Collapse of 2000 commonwealth avenue: punching shear case study. J Perform Constr Facil. 2004;18:54–61. doi:10.1061/(ASCE)0887-3828(2004)18:1(54). [Google Scholar] [CrossRef]
2. Gardner NJ, Huh J, Chung L. Lessons from the Sampoong department store collapse. Cem Concr Compos. 2002;24(6):523–9. doi:10.1016/S0958-9465(01)00068-3. [Google Scholar] [CrossRef]
3. Lu X, Guan H, Sun H, Li Y, Zheng Z, Fei Y, et al. A preliminary analysis and discussion of the condominium building collapse in surfside, Florida, US, June 24, 2021. Front Struct Civ Eng. 2021;15(5):1097–110. doi:10.1007/s11709-021-0766-0. [Google Scholar] [CrossRef]
4. Olmati P, Sagaseta J, Cormie D, Jones AEK. Simplified reliability analysis of punching in reinforced concrete flat slab buildings under accidental actions. Eng Struct. 2017;130(6):83–98. doi:10.1016/j.engstruct.2016.09.061. [Google Scholar] [CrossRef]
5. Ricker M, Feiri T, Nille-Hauf K, Adam V, Hegger J. Enhanced reliability assessment of punching shear resistance models for flat slabs without shear reinforcement. Eng Struct. 2021;226(3):111319. doi:10.1016/j.engstruct.2020.111319. [Google Scholar] [CrossRef]
6. Liu J, Tian Y, Orton SL, Said AM. Resistance of flat-plate buildings against progressive collapse. I: modeling of slab-column connections. J Struct Eng. 2015;141(12):04015053. doi:10.1061/(ASCE)ST.1943-541X.0001294. [Google Scholar] [CrossRef]
7. Liu J, Tian Y, Orton SL. Resistance of flat-plate buildings against progressive collapse. II: system response. J Struct Eng. 2015;141(12):04015054. doi:10.1061/(ASCE)ST.1943-541X.0001294. [Google Scholar] [CrossRef]
8. Weng Y-H, Qian K, Fu F, Fang Q. Numerical investigation on load redistribution capacity of flat slab substructures to resist progressive collapse. J Build Eng. 2020;29(5):101109. doi:10.1016/j.jobe.2019.101109. [Google Scholar] [CrossRef]
9. Yang Z, Guo X, Li Y, Guan H, Diao M, Wang J, et al. Progressive collapse mode induced by slab-column joint failure in RC flat plate substructures: a new perspective. Eng Struct. 2023;292:116506. doi:10.1016/j.engstruct.2023.116506. [Google Scholar] [CrossRef]
10. Jiang C, Qiu H, Yang Z, Chen L, Gao L, Li P. A general failure-pursuing sampling framework for surrogate-based reliability analysis. Reliab Eng Syst Saf. 2019;183:47–59. doi:10.1016/j.ress.2018.11.002. [Google Scholar] [CrossRef]
11. Ren C, Aoues Y, Lemosse D, De Cursi ES. Ensemble of surrogates combining Kriging and artificial neural networks for reliability analysis with local goodness measurement. Struct Saf. 2022;96:102186. doi:10.1016/j.strusafe.2022.102186. [Google Scholar] [CrossRef]
12. Shehata IAEM, Regan PE. Punching in R.C. slabs. J Struct Eng. 1989;115:1726–40. doi:10.1061/(ASCE)0733-9445(1989)115:7(1726). [Google Scholar] [CrossRef]
13. Guandalini S, Burdet OL, Muttoni A. Punching tests of slabs with low reinforcement ratios. ACI Struct J. 2009;106(1):87–95. doi:10.14359/56287. [Google Scholar] [CrossRef]
14. Lips S, Ruiz MF, Muttoni A. Experimental investigation on punching strength and deformation capacity of shear-reinforced slabs. ACI Struct J. 2012;109(6):889–900. [Google Scholar]
15. Muttoni A. Punching shear strength of reinforced concrete slabs without transverse reinforcement. ACI Struct J. 2008;105(4):440–50. doi:10.14359/19858. [Google Scholar] [CrossRef]
16. Ruiz MF, Muttoni A. Applications of critical shear crack theory to punching of reinforced concrete slabs with transverse reinforcement. ACI Struct J. 2009;106(4):485–94. doi:10.14359/56614. [Google Scholar] [CrossRef]
17. Park H-G, Choi K-K, Chung L. Strain-based strength model for direct punching shear of interior slab-column connections. Eng Struct. 2011;33(3):1062–73. doi:10.1016/j.engstruct.2010.12.032. [Google Scholar] [CrossRef]
18. Feiri T, Schulze-Ardey JP, Ricker M, Hegger J. Using system reliability concepts to derive partial safety factors for punching shear with shear reinforcement: an explorative analysis. Appl Sci. 2023;13(3):1360–75. [Google Scholar]
19. Zhou Y, Shou H, Li C, Jiang Y, Tian X. Punching shear behavior of ultra-high-performance fiber-reinforced concrete and normal strength concrete composite flat slabs. Eng Struct. 2025;322(1):119123. doi:10.1016/j.engstruct.2024.119123. [Google Scholar] [CrossRef]
20. Jiao Z, Li Y, Guan H, Diao M, Yang Z, Wang J, et al. Pre- and post-punching failure performances of flat slab-column joints with drop panels and shear studs. Eng Fail Anal. 2022;140(6):106604. doi:10.1016/j.engfailanal.2022.106604. [Google Scholar] [CrossRef]
21. Yang Y, Diao M, Li Y, Guan H, Lu X. Post-punching failure mechanism and resistance of flat plate-column joints with in-plane constraints. Eng Fail Anal. 2022;138(6):106360. doi:10.1016/j.engfailanal.2022.106360. [Google Scholar] [CrossRef]
22. Sarvari S, Esfahani MR. An experimental study on post-punching behavior of flat slabs. Structures. 2020;27(4):894–902. doi:10.1016/j.istruc.2020.06.036. [Google Scholar] [CrossRef]
23. Kokot S, Anthoine A, Negro P, Solomos G. Static and dynamic analysis of a reinforced concrete flat slab frame building for progressive collapse. Eng Struct. 2012;40(4):205–17. doi:10.1016/j.engstruct.2012.02.026. [Google Scholar] [CrossRef]
24. Qian K, Weng Y-H, Li B. Impact of two columns missing on dynamic response of RC flat slab structures. Eng Struct. 2018;177(12):598–615. doi:10.1016/j.engstruct.2018.10.011. [Google Scholar] [CrossRef]
25. Yang Z, Li Y, Guan H, Diao M, Gilbert BP, Sun H, et al. Dynamic response and collapse resistance of RC flat plate structures subjected to instantaneous removal of an interior column. Eng Struct. 2022;264(6):114469. doi:10.1016/j.engstruct.2022.114469. [Google Scholar] [CrossRef]
26. Xue H, Gilbert BP, Guan H, Lu X, Li Y, Ma F, et al. Load transfer and collapse resistance of RC flat plates under interior column removal scenario. J Struct Eng. 2018;144(7):1–15. doi:10.1061/(ASCE)ST.1943-541X.0002090. [Google Scholar] [CrossRef]
27. Zhao Z, Guan H, Li Y, Xue H, Gilbert BP. Collapse-resistant mechanisms induced by various perimeter column damage scenarios in RC flat plate structures. Structures. 2024;59(6):105716. doi:10.1016/j.istruc.2023.105716. [Google Scholar] [CrossRef]
28. Breitung K. The return of the design points. Reliab Eng Syst Saf. 2024;247:110103. doi:10.1016/j.ress.2024.110103. [Google Scholar] [CrossRef]
29. Keshtegar B, Meng Z. A hybrid relaxed first-order reliability method for efficient structural reliability analysis. Struct Saf. 2017;66(2):84–93. doi:10.1016/j.strusafe.2017.02.005. [Google Scholar] [CrossRef]
30. Papaioannou I, Papadimitriou C, Straub D. Sequential importance sampling for structural reliability analysis. Struct Saf. 2016;62:66–75. doi:10.1016/j.strusafe.2016.06.002. [Google Scholar] [CrossRef]
31. Huang X, Chen J, Zhu H. Assessing small failure probabilities by AK-SS: an active learning method combining Kriging and subset simulation. Struct Saf. 2016;59(4):86–95. doi:10.1016/j.strusafe.2015.12.003. [Google Scholar] [CrossRef]
32. Zhang J, Xiao M, Gao L. An active learning reliability method combining Kriging constructed with exploration and exploitation of failure region and subset simulation. Reliab Eng Syst Saf. 2019;188(10):90–102. doi:10.1016/j.ress.2019.03.002. [Google Scholar] [CrossRef]
33. Sun Z, Wang J, Li R, Tong C. LIF: a new Kriging based learning function and its application to structural reliability analysis. Reliab Eng Syst Saf. 2017;157(3):152–65. doi:10.1016/j.ress.2016.09.003. [Google Scholar] [CrossRef]
34. Zhou Y, Lu Z, Yun W. Active sparse polynomial chaos expansion for system reliability analysis. Reliab Eng Syst Saf. 2020;202(4):107025. doi:10.1016/j.ress.2020.107025. [Google Scholar] [CrossRef]
35. Zhang J, Gong W, Yue X, Shi M, Chen L. Efficient reliability analysis using prediction-oriented active sparse polynomial chaos expansion. Reliab Eng Syst Saf. 2022;228:108749. doi:10.1016/j.ress.2022.108749. [Google Scholar] [CrossRef]
36. Liang S, Shen Y, Ren X. Comparative study of influential factors for punching shear resistance/failure of RC slab-column joints using machine-learning models. Structures. 2022;45(3):1333–49. doi:10.1016/j.istruc.2022.09.110. [Google Scholar] [CrossRef]
37. Liang S, Shen Y, Gao X, Cai Y, Fei Z. Symbolic machine learning improved MCFT model for punching shear resistance of FRP-reinforced concrete slabs. J Build Eng. 2023;69(3):106257. doi:10.1016/j.jobe.2023.106257. [Google Scholar] [CrossRef]
38. Feng S, Gu K, Liang S. Punching shear behavior of slab-column joints with partial UHPC enhancement: experimental, numerical, and data-driven predictions. Adv Struct Eng. 2026. doi:10.1177/13694332261415700. [Google Scholar] [CrossRef]
39. Fei Z, Liang S, Lin X, Feng S. Experimental and numerical study of flexural behavior of reinforced concrete slabs containing recycled slurry micropowder as cement replacement. Structures. 2025;82(17):110660. doi:10.1016/j.istruc.2025.110660. [Google Scholar] [CrossRef]
40. Liang S, Fei Z, Wu J, Lin X. Tree-based pipeline optimization-based automated-machine learning model for performance prediction of materials and structures: case studies and UI design. Struct Control Health Monit. 2024;2024:1485739. doi:10.1155/2024/1485739. [Google Scholar] [CrossRef]
41. Lin X, Liang S, Feng S. Deep learning–based surrogates for efficient phase-field modeling of stochastic quasi-brittle materials. ASCE ASME J Risk Uncertain Eng Syst Part A Civ Eng. 2025;11(3):04025039. doi:10.1061/AJRUA6.RUENG-1575. [Google Scholar] [CrossRef]
42. Wu J, Liu W, Liang S. Multiscale random damage analysis through deep learning–driven surrogate models. Int J Multiscale Comput Eng. 2025;23(4):27–48. doi:10.1615/IntJMultCompEng.2024054201. [Google Scholar] [CrossRef]
43. Pan Q, Dias D. An efficient reliability method combining adaptive support vector machine and Monte Carlo simulation. Struct Saf. 2017;67(4):85–95. doi:10.1016/j.strusafe.2017.04.006. [Google Scholar] [CrossRef]
44. Lieu QX, Nguyen KT, Dang KD, Lee S, Kang J, Lee J. An adaptive surrogate model to structural reliability analysis using deep neural network. Expert Syst Appl. 2022;191:116104. doi:10.1016/j.eswa.2021.116104. [Google Scholar] [CrossRef]
45. Luo C, Keshtegar B, Zhu S-P, Niu X. EMCS-SVR: hybrid efficient and accurate enhanced simulation approach coupled with adaptive SVR for structural reliability analysis. Comput Methods Appl Mech Eng. 2022;400:115499. doi:10.1016/j.cma.2022.115499. [Google Scholar] [CrossRef]
46. Shen L, Shen Y, Liang S. Reliability analysis of RC slab-column joints under punching shear load using a machine learning-based surrogate model. Buildings. 2022;12(10):1750. doi:10.3390/buildings12101750. [Google Scholar] [CrossRef]
47. American Concrete Institute. Building code requirements for structural concrete (ACI 318-19) and commentary. Farmington Hills, MI, USA: American Concrete Institute; 2019. [Google Scholar]
48. Ministry of Housing and Urban-Rural Development of the People’s Republic of China. GB 50010—2010 code for design of concrete structures. Beijing, China: China Architecture & Building Press; 2015. [Google Scholar]
49. Tian Y, Jirsa JO, Bayrak O. Strength evaluation of interior slab-column connections. ACI Struct J. 2008;105(6):692–700. [Google Scholar]
50. Wu LF, Huang TC, Tong YL, Liang SX. A modified compression field theory based analytical model of RC slab-column joint without punching shear reinforcement. Buildings. 2022;12(2):226. doi:10.3390/buildings12020226. [Google Scholar] [CrossRef]
51. Chetchotisak P, Ruengpim P, Chetchotsak D, Yindeesuk S. Punching shear strengths of RC slab-column connections. Predict Reliab. 2018;22(8):3066–76. doi:10.1007/s12205-017-0456-6. [Google Scholar] [CrossRef]
52. Ministry of Housing and Urban-Rural Development of the People’s Republic of China. GB 50011—2010 code for seismic design of buildings. Beijing, China: China Architecture & Building Press; 2016. [Google Scholar]
53. Tang M, Yi W, Liu L. Investigation on seismic performance of interior slab-column connections subjected to reversed cyclic loading. Earthq Eng Eng Dyn. 2019;39:109–21. [Google Scholar]
54. Ministry of Housing and Urban-Rural Development of the People’s Republic of China. GB 50068—2018 unified standard for reliability design of building structures. Beijing, China: China Architecture & Building Press; 2018. [Google Scholar]
55. Ditlevsen O, Madsen HO. Structural reliability methods. Hoboken, NJ, USA: John Wiley & Sons, Inc.; 1996. [Google Scholar]
56. Thoft-Christensen P, Sørensen JD. Reliability of structural systems with correlated elements. Appl Math Model. 1982;6(3):171–8. doi:10.1016/0307-904X(82)90006-3. [Google Scholar] [CrossRef]
57. Fernández Ruiz M, Mirzaei Y, Muttoni A. Post-punching behavior of flat slabs. ACI Struct J. 2013;110(5):801–12. doi:10.14359/51685833. [Google Scholar] [CrossRef]
58. European Commission JRC. Structural robustness and disproportionate collapse in building structures. Luxembourg: Publications Office of the European Union; 2024. [Google Scholar]
59. Izzuddin BA, Vlassis AG, Elghazouli AY, Nethercot DA. Progressive collapse of multi-storey buildings due to sudden column loss—Part I: simplified assessment framework. Eng Struct. 2008;30(5):1308–18. doi:10.1016/j.engstruct.2007.07.011. [Google Scholar] [CrossRef]
60. U.S. General Services Administration. Alternate path analysis and design guidelines for progressive collapse resistance. Washington, DC, USA: U.S. General Services Administration; 2016. [Google Scholar]
61. Ma F, Gilbert BP, Guan H, Xue H, Lu X, Li Y. Experimental study on the progressive collapse behaviour of RC flat plate substructures subjected to corner column removal scenarios. Eng Struct. 2019;180:728–41. doi:10.1016/j.engstruct.2018.11.043. [Google Scholar] [CrossRef]
Cite This Article
 Copyright © 2026 The Author(s). Published by Tech Science Press.
This work is licensed under a Creative Commons Attribution 4.0 International License , which permits unrestricted use, distribution, and reproduction in any medium, provided the original work is properly cited.
 Downloads
 Citation Tools
