
 Login
Login Register
 Submit a Paper
 Propose a Special lssue
 Open Access
ARTICLE
AMASA-YOLO: Adaptive Spectral Mamba-Inspired and Sparse-Guided Attention for MRI Brain Tumor Detection
1 School of Electrical Engineering, International University, Ho Chi Minh City, Vietnam
2 Vietnam National University, Ho Chi Minh City, Vietnam
* Corresponding Author: Kien Trang. Email:
(This article belongs to the Special Issue: Recent Advances in Signal Processing and Computer Vision, 2nd Edition)
Computer Modeling in Engineering & Sciences 2026, 148(3), 45 https://doi.org/10.32604/cmes.2026.087493
Received 17 June 2026; Accepted 27 August 2026; Issue published 28 September 2026
 View Full Text
 Download PDF
Abstract
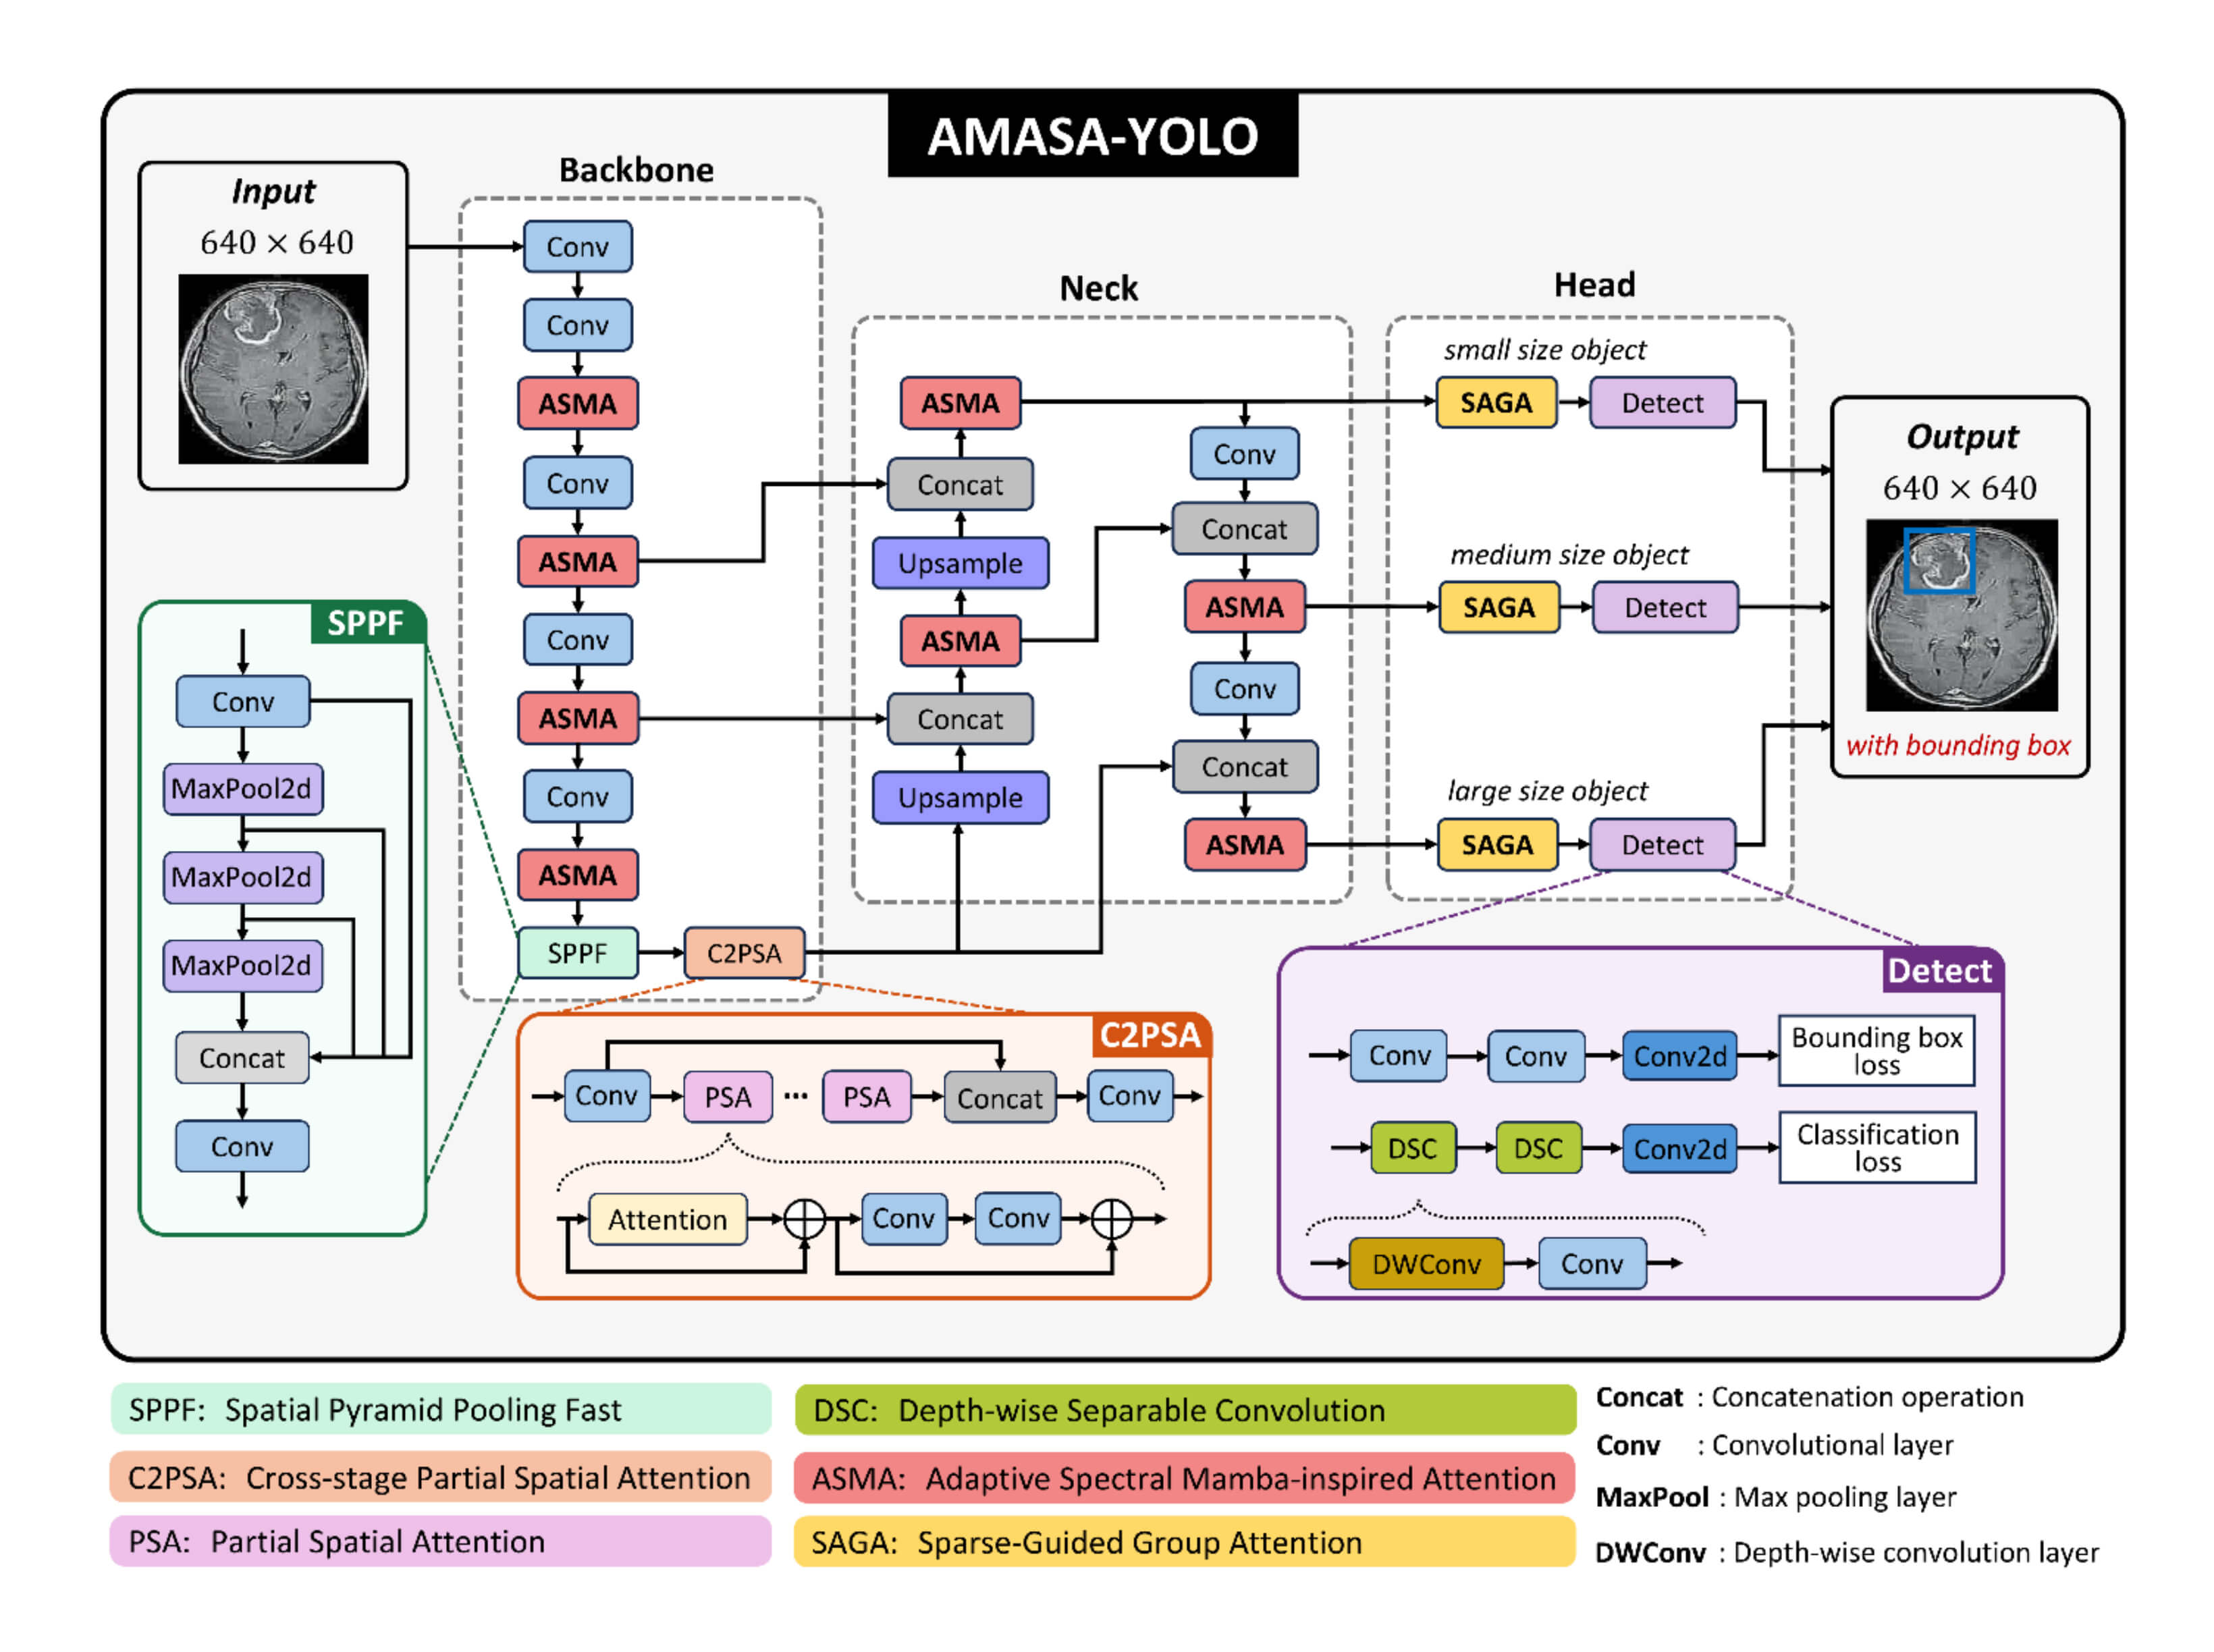
Brain tumor detection from magnetic resonance imaging (MRI) is an important task for supporting early diagnosis and treatment planning. However, accurate detection is still challenging because tumor regions often have weak boundaries, variety of sizes, and similar intensity. To address these issues, we propose AMASA-YOLO, which is an adaptive spectral and sparse-guided attention framework for MRI brain tumor detection. Our model is built on a YOLO-based architecture and introduces two main modules. First, the Adaptive Spectral Mamba-Inspired Attention (ASMA) block is used to improve feature extraction by combining spatial attention with spectral feature refinement. This allows the model to capture long-range information while preserving texture and boundary-related details. Second, the Sparse-Guided Group Attention (SAGA) block is added before the detection head to strengthen multi-scale feature representation through sparse self-attention and cascaded group attention. The proposed method is evaluated on the BraTS20 and Br35H datasets and compared with several recent detection models. Experimental results show that AMASA-YOLO achieves strong performance in several key metrics on both datasets. It reaches 0.9545 recall, 0.9579 mAP50, and 0.7198 mAP50-95 on the BraTS20, and 0.9557 mAP50 on the Br35H. The ablation studies and qualitative results further demonstrate that ASMA and SAGA improve tumor localization and detection robustness, indicating that the proposed model can provide a promising MRI-based brain tumor localization framework with moderate computational complexity.Graphic Abstract
Keywords
A brain tumor is an abnormal proliferation of cells producing abnormal tissue within or surrounding areas of the brain [1,2]. Brain tumors can be classified as either benign or malignant. Benign tumors, such as meningiomas and pituitary tumors, generally grow slowly and usually do not invade surrounding tissues. On the other hand, malignant tumors such as glioblastomas pose dangerous threats with rapid growth capacity, are highly invasive, and are often difficult to remove completely. The development of these tumors leads to the disruption of neural function, resulting in critical neurological impairments with severe symptoms such as headaches, vision impairment, or decline in cognitive ability, etc. Without early diagnosis and appropriate treatment, brain tumors may develop further and cause long-term neurological complications such as memory loss, critical physical disability, or life-threatening conditions [3].
The treatment of brain tumors requires different therapeutic approaches depending on the stage and progression of the tumor. The tumor’s complex shape and heterogeneous structure make clinical diagnosis challenging. Therefore, early detection and accurate tumor localization are critical for diagnosis, prognosis, and treatment planning. In recent years, advances in automatic object detection methods in medical imaging have significantly assisted doctors and clinical experts in the diagnostic process, especially in brain tumor detection and segmentation [4]. Conventional Machine Learning (ML) approaches have been applied to brain tumor detection and segmentation tasks. However, their performance often depends significantly on manually designed or handcrafted features, such as texture, shape, and intensity characteristics, which may limit their ability to effectively represent complex and multidimensional medical image data. On the other hand, Deep Learning (DL) models have achieved remarkable results due to the exceptional feature extraction capabilities of the Convolutional Neural Networks (CNNs) in the medical image analysis field, particularly in brain tumor detection and segmentation tasks [5,6].
With the rapid advancement of DL, object detection architectures have achieved remarkable performance across various applications. Some notable examples include Region-Based Convolutional Neural Network (R-CNN) [7], Single Shot MultiBox Detector (SSD) [8], and the variants of You Only Look Once (YOLO) series [9–13]. Among these methods, the YOLO family has gained significant attention due to its strong detection performance, high efficiency, and continuous development across multiple generations. The YOLO-based models are widely recognized for their end-to-end, rapid image processing and high efficiency via sequential probability predictions over grid partitions, offering significant opportunities for medical image applications that require quick and accurate detection. In recent years, several studies have developed YOLO-based models with various modifications for brain tumor detection to support clinical diagnosis [14–16]. However, several difficulties remain for further improvement, including low detection accuracy for small, irregularly shaped, or low-contrast tumors, poor performance on high-dimensional, complex Magnetic Resonance Imaging (MRI) images, and difficulties in capturing long-range dependencies.
The development of the Vision Transformer (ViT) structure has attracted significant attention, particularly in the field of medical image analysis. The ability to extract global context features via the transformer module’s self-attention mechanism has enabled modeling for long-range dependencies more effectively than conventional convolution-based approaches [17]. The Real-Time Detection Transformer (RT-DETR) [18] leverages a transformer-based design to improve the performance of the detection task. However, transformer-based models normally require extensive input data to achieve effective global feature extraction, resulting in high computational cost and intensive memory demands, thereby limiting practical implementation. On the other hand, State-space models (SSMs) such as Vision Mamba [19] allow more effective analysis of long-range dependencies via a selective scan mechanism along the input sequence, while significantly reducing computational cost that scales linearly with the input sequence length. Thus, it enables a better understanding of long-range features without sacrificing computational cost or intensive memory requirements.
Although the existing models have achieved positive results in the general object detection tasks, medical image analysis remains challenging. The targets may lack clear boundaries and may be partially occupied by other objects, which directly affect the model’s performance. In terms of MRI, the detection task is still difficult because tumor regions can have large variations in size, shape, intensity, and location [20]. Some tumors appear with unclear margins and have similar intensity to nearby normal tissues, which makes it harder for the model to separate the tumor from surrounding brain structures. These factors can reduce the stability of feature extraction and weaken the generalization ability of the model when testing data come from different centers or imaging conditions [21]. Recent studies tried to improve this by using ensemble transfer learning [22] and optimized EfficientNet-based models [23]. Another study [24] tried to use the foundation of contrastive learning with a dual-branch design to deal with the limited-label conditions. These works demonstrate the value of strong feature extraction, but they mainly focus on image-level recognition rather than precise tumor localization. Regarding the detection task, although recent YOLO-based detectors have shown promising performance for brain tumor localization, three issues remain inadequately addressed. First, MRI tumors often have weak boundaries and similar intensity to surrounding tissues, making purely spatial convolutional features unstable. Second, many YOLO-based models focus on local multi-scale features but have limited ability to model long-range contextual relations across the brain region. Third, frequency-domain information, which may contain useful boundary and texture cues, is rarely combined adaptively with spatial attention in MRI detection. These limitations motivate a new framework, where it learns complementary spatial-spectral representations and is able to refine multi-scale features before detection.
In this paper, we propose AMASA-YOLO, an adaptive spectral and sparse-guided attention framework for MRI brain tumor detection. The main idea is to improve tumor localization by learning both spatial and spectral feature representations from MRI images. To achieve this, the proposed model introduces an Adaptive Spectral Mamba-Inspired Attention (ASMA) block to capture long-range spatial features while refining frequency-domain information. This design helps the network focus on weak tumor boundaries and important texture patterns. In addition, a Sparse-Guided Group Attention (SAGA) block is used to further refine multi-scale features in the detection stage. By combining sparse self-attention and cascaded group attention, SAGA helps the model handle tumors with different sizes, shapes, and appearances. Thus, the proposed framework aims to improve detection accuracy while maintaining reasonable computational complexity for practical medical image analysis. The contributions of our work are highlighted as follows:
• We propose the AMASA-YOLO model, which is an adaptive spectral and sparse-guided attention framework for MRI brain tumor detection. This mainly aims to improve localization accuracy in more complicated tumor cases.
• We introduce the ASMA block, which combines Mamba-Inspired spatial attention with spectral information refinement to better capture long-range features, preserve boundary and texture-related information.
• We design the SAGA block to strengthen multi-scale feature refinement through sparse self-attention and cascaded group attention, improving detection across different tumor sizes and appearances.
• Experiments on BraTS20 and Br35H datasets show that the proposed method achieves strong performance compared with recent baselines in several metrics, and overall tumor detection stability.
The remainder of this manuscript is structured as the following sections. Section 2 reviews related studies on YOLO-based models for brain tumor detection, long-range dependency modeling in medical imaging and spectral and attention-based feature refinement. Section 3 presents the proposed AMASA-YOLO model in detail, including the ASMA block and SAGA blocks. Then, Section 4 provides the experimental results with configuration details and metric assessment, covering quantitative and qualitative evaluations as well as ablation studies. Finally, Section 5 concludes the paper and outlines directions for future work.
2.1 YOLO-Based Models for Brain Tumor Detection
The DL approaches have greatly improved medical image analysis over time, especially CNN-based models, which have significantly advanced feature extraction, classification, detection, and segmentation in existing medical image analysis challenges. In particular, YOLO-based variant models, which efficiently adapt CNN modules to their structure, have proven highly effective for medical object detection across several applications, including brain tumor detection [25,26]. Over the last decade, the YOLO model has undergone various developments, including architecture enhancements, multi-scale feature pyramid analysis, and the incorporation of attention mechanisms [27], to increase the model’s robustness and improve detection results.
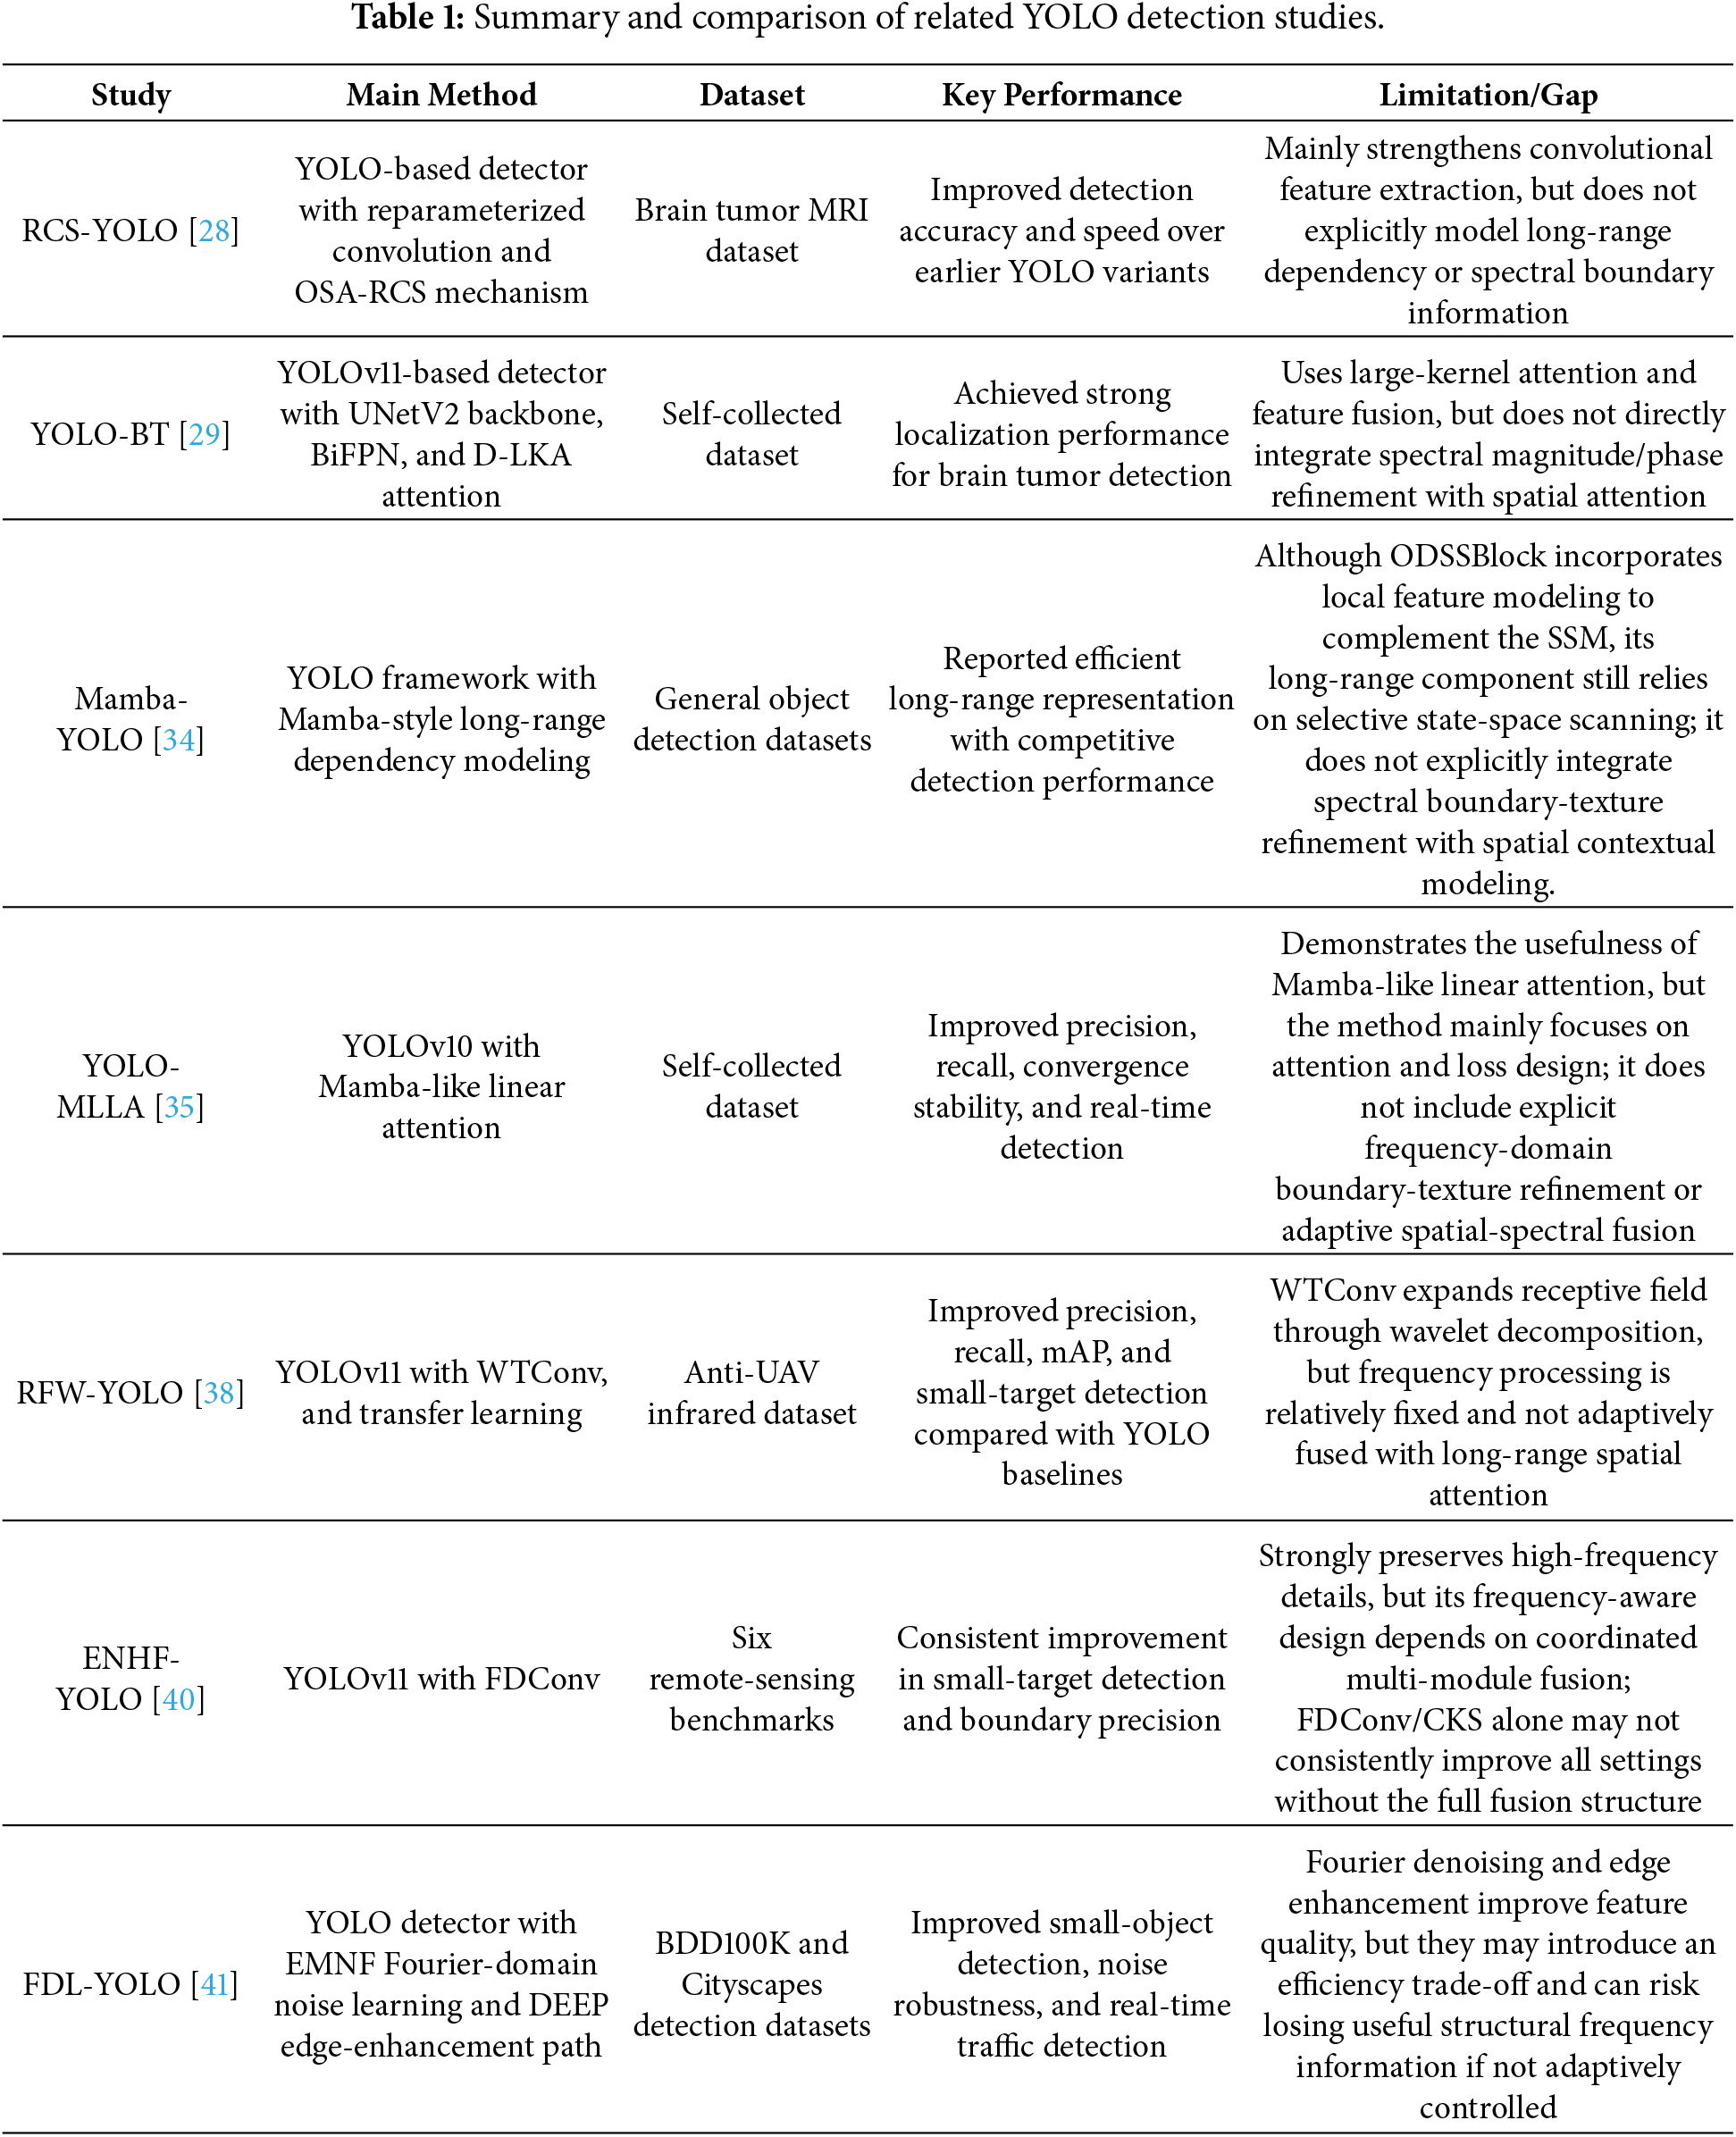
In recent years, several YOLO-based DL models have been proposed specifically aimed at brain tumor detection and segmentation problem. The RCS-YOLO was introduced in [28] to improve the performance of YOLO-based models for brain tumor detection. The RCS-YOLO implements Reparameterized Convolution in Shuffle Channel, incorporating the One-Shot Aggregation (OSA-RCS) mechanism, and outperforms predecessor YOLO versions in both accuracy and processing speed. Another approach has tackled the brain tumor detection task by constructing a YOLOv8 backbone, YOLO-NeuroBoost [3], that incorporates a dynamic Convolution layer, KernelWarehouse, and a CBAM attention mechanism. In another study, the YOLO-BT model in [29] was proposed with an architecture based on YOLOv11 and UNetV2 as the backbone for brain tumor detection in MRI images. The authors introduced the Bi-directional Feature Pyramid Network (BiFPN) module to produce two-way fusion of cross-scale features, and added the Deformable Large Kernel Attention (D-LKA) mechanism to improve the model’s performance against small and irregular tumor morphology. The YOLO-BT model achieves the highest values of 0.945 in mAP50 and 0.672 in mAP50-95 from the Figshare Brain tumor dataset.
The main advantage of the architectures is their ability to process images quickly and their high resolution of local multi-scale details. However, the primary disadvantage is their limited range of convolutional responses, which makes it challenging to model long-range dependencies in complex MRI cases. Thus, investigating long-range features has become a more effective way to capture global spatial context, which can help address the limited ability of conventional convolution-based YOLO architectures to model long-range relationships in complex medical images.
2.2 Long-Range Dependency Modeling in Medical Imaging
Several studies have been conducted to incorporate the advantages of global context and long-range dependencies into the YOLO-based models, such as YOLOS and ViT-YOLO [30,31]. More recent YOLO architectures have also introduced attention-based mechanisms to improve contextual feature modeling. For example, YOLOv11 and YOLOv12 incorporate the attention module together with convolution-based blocks, enabling enhanced feature interaction without being characterized as a CNN-Transformer hybrid architecture. Other recent YOLO variants have investigated more explicit attention-oriented designs for capturing long-range dependencies. On the other hand, the YOLOv13 model [13] introduced a global hypergraph correlation module, Hypergraph-based Adaptive Correlation Enhancement (HyperACE), that leverages long-range dependencies within a hypergraph network for efficient global cross-location and cross-scale feature fusion.
Mamba has recently emerged as an SSM approach that excels at modeling long-range dependencies with high efficiency and computational speed [32]. Since then, many researchers have explored with the use of Mamba in medical image analysis as an alternative module for ViT, such as U-Mamba [33], Vision Mamba [19], etc. Mamba has also been integrated into YOLO-based models to exploit global context, expand the model’s receptive field, and further improve its performance. The Mamba-YOLO [34] introduced the ODSSBlock to replace the conventional C2F module, which combines local spatial features extracted by the LSBlock in combination with the linear long-range dependencies from the SSM presented in Mamba to enhance the model’s robustness. Another approach also integrates the Mamba-Like Linear Attention (MLLA) [35] to capture long-range dependencies while preserving the computational efficiency.
Although ViT-based architectures can effectively model global contextual information, they generally require substantial computational resources and large amounts of training data. Mamba-based State Space Models (SSMs) provide an efficient alternative for modeling long-range dependencies with linear computational complexity. When adapted to visual tasks, however, Mamba-style SSMs commonly use selective scanning to transform two-dimensional feature maps into directional sequences for state-space processing. Such sequential modeling may not fully preserve fine-grained local spatial structures if used alone. Mamba-YOLO mitigates this limitation through its ODSSBlock, which combines the SS2D-based long-range modeling mechanism with convolutional and gated local feature processing in the RG Block. Therefore, the limitation is associated with the selective state-space scanning mechanism rather than Mamba-YOLO as a complete detection architecture. Nevertheless, effectively balancing local structural information with long-range contextual dependencies remains important for medical image analysis, particularly for detecting irregular tumor boundaries and preserving subtle edge and texture information.
2.3 Spectral and Attention-Based Feature Refinement
Implementing frequency-domain techniques to analyze, denoise, restore images, extract insightful information, etc., has been intensively developing across a broad range of applications. In [36], the Discrete Wavelet Transform (DWT) techniques are implemented in the max pooling-wavelet hybrid layer (MWHL). It is designed to generate shallow, high-frequency components to enhance deep semantic representations, thereby reducing quality loss in image restoration and semantic ambiguity in infrared small-target detection. In another approach [37], the High-Low Frequency Decomposition (HLFD) block is introduced for image enhancement and restoration within the HLNet. The HLFD blocks enable the HLNet to address multiple image degradations by efficiently exploiting high- and low-frequency information during feature extraction stages.
On the other hand, frequency-domain analysis techniques are also used to enhance feature extraction and attention mechanisms. The RFW-YOLO [38] implements the Wavelet Transform Convolution (WTConv) [39] module in a YOLOv11 backbone structure, which exploits the wavelet transform’s multi-resolution analysis capability to enrich the feature extraction process via expanding the receptive field of the model. A similar approach is also presented in ENHF-YOLO [40] for small-target detection in remote sensing, which uses the Frequency Domain Dynamic Convolution (FDConv) module to enhance fine-grained features via convolutional layers with frequency-aware kernels. In another study, the Fourier transform is implemented in the Efficient Multi-scale feature extraction and Noise Filtering (EMNF) and differential edge enhancement detection path (DEEP) modules of the FDL-YOLO [41] to enhance feature extraction while maximizing computational efficiency for real-time traffic detection problem. However, relying solely on frequency-domain techniques may lead to the omission of essential spatial features, especially in complex medical image applications. Therefore, exploiting both spatial and spectral representations proved an effective and meaningful feature-extraction step in YOLO-based models.
Despite the notable achievements of YOLO-based models and Mamba in medical image analysis, there remain research gaps in a precise, real-time deep learning architecture that efficiently and robustly models long-range dependencies under complex and limited MRI brain images. Persistent limitations in brain tumor detection include insufficient modeling of long-range dependencies, difficulties in capturing irregular tumor morphology, and challenges in detecting tumors in heterogeneous or infiltrative regions [42]. The YOLO backbone provides rich, locally extracted features from input images, whereas the Mamba-based modules model global context features more efficiently and effectively. Moreover, spectral representations would greatly contribute to the feature extraction step by providing frequency-domain information combined with spatially extracted features in YOLO backbones.
However, a major drawback in the frequency domain processing of images is that no information regarding the spatial structure of the image is kept. This precision in spatial location is frequently lost, leading to high localization errors or shifted bounding boxes. Based on previous studies, it is expected that a DL model constructed with these techniques will achieve high detection performance in brain tumor detection. Indeed, the domain imbalance is addressed directly by designing a learnable gated fusion layer within the ASMA block, as in AMASA-YOLO. Our network does not use a fixed spectral transform; instead, it flexibly allocates the spatial interactions of the tokens to reconstructed frequency components depending on the feature maps. This provides our framework with a unique point of view that offers a balanced representation best suited for complex, weak-boundary medical images. To better clarify the gaps, Table 1 summarizes representative YOLO-based, attention-based, Mamba-related, and frequency-domain detection studies. Since these methods were evaluated under different datasets and experimental protocols, the table does not compare exact numerical values directly. Instead, it summarizes the key reported performance and the main technical limitation of each method.
To evaluate the effectiveness of our proposed models in brain tumor detection, this paper used two publicly available datasets of brain tumor MRI data:
The first dataset is the Brain Tumor Segmentation Challenge 2020 (BraTS20) [43–45]. It is a high-quality, multi-institutional dataset for brain tumor analysis, specifically segmentation and diagnosis of glioma. It contains multimodal MRI scans from multiple clinical centers, which helps to increase data diversity and model generalization. The original 3D MRI volumes were converted into 2D detection samples. To ensure objectivity, fairness, and reduce the risk of data leakage from neighboring slices of the same volume, only one representative slice was extracted from each sample. In this work, the T2-FLAIR modality was used because it provides clear tumor-related abnormal regions in glioma MRI. The selected slice was the axial slice with the maximum lesion coverage based on the corresponding segmentation mask. The bounding box was generated by finding the minimum and maximum coordinates of all nonzero lesion pixels in the selected mask.
Secondly, the Brain Tumor Detection 2020 (Br35H) dataset [46] is a binary brain tumor magnetic resonance imaging (MRI) dataset that is widely used in some studies. Due to its simplicity and ease of use, it can be used in classification and detection studies. The images were already provided as 2D MRI samples, so no slice extraction was required. Since the original dataset description does not clearly define the MRI modality of each image, Br35H was treated as a heterogeneous 2D MRI support dataset.
All images were resized to a resolution of
The proposed AMASA-YOLO framework is mainly built upon YOLOv11 [11] architecture. Indeed, several core YOLO-based components are still kept to preserve the advantages of the original model. As shown in Fig. 1, the model pipeline is designed for brain tumor detection from MRI images. First, a
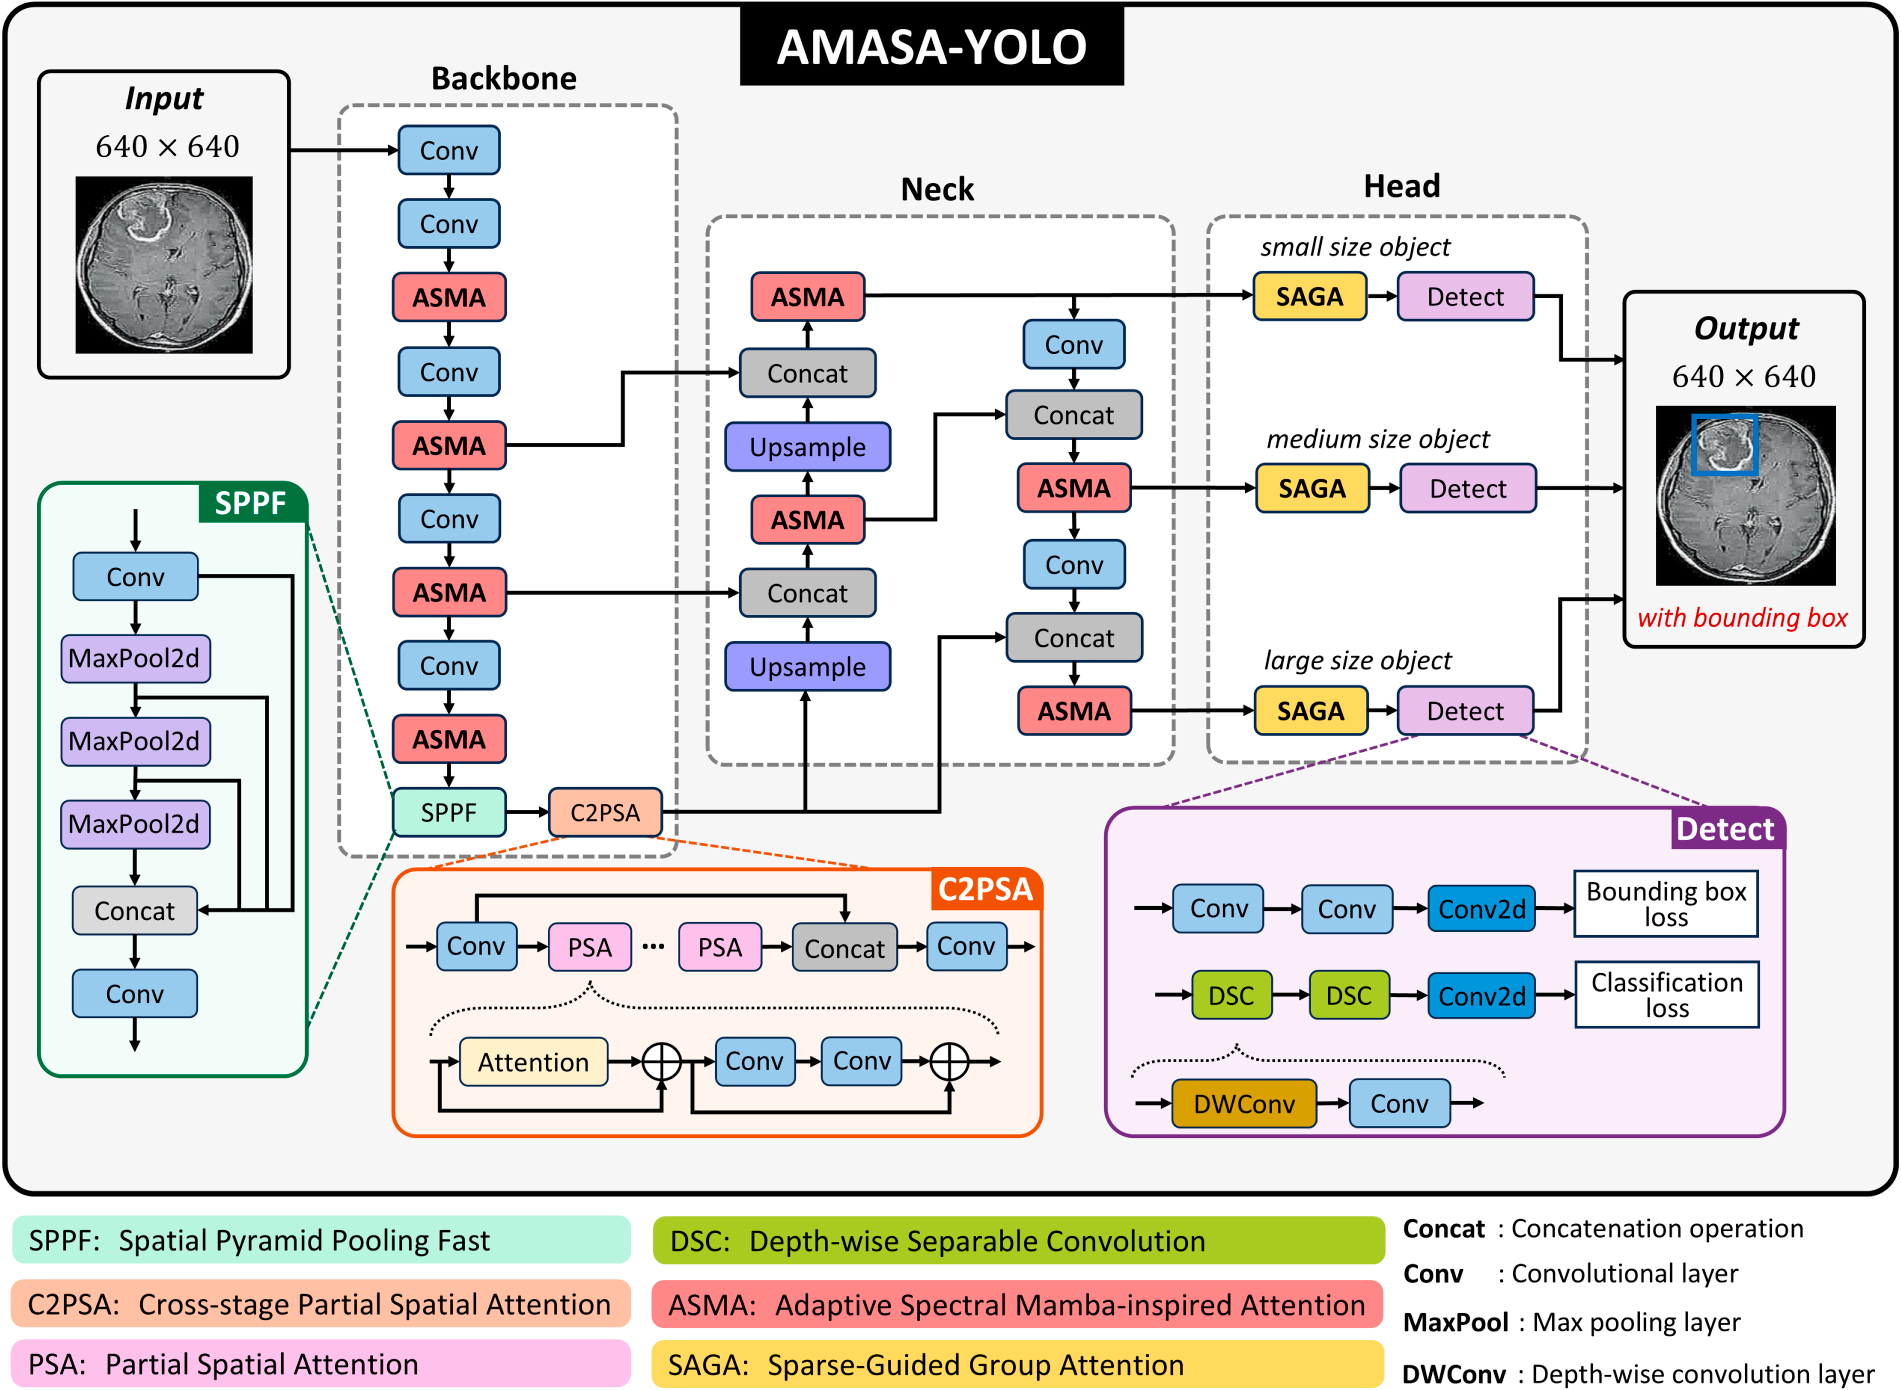
Figure 1: The proposed AMASA-YOLO architecture for brain tumor MRI detection.
In this work, several important blocks from YOLOv11, including SPPF, C2PSA, and Detect, are kept to maintain the advantages of the YOLO-based architecture. The SPPF module is placed near the end of the backbone to handle objects of different sizes. It is specifically designed to extract multi-scale image features, allowing the model to better recognize objects with diverse spatial dimensions. This process is achieved using a series of max-pooling operations with different kernel sizes, which helps the module capture and combine multi-scale contextual information effectively. In addition, the Cross-Stage Partial Spatial Attention (C2PSA) module is used as the final block of the backbone to enhance the attention mechanism. This module helps the model focus more on important regions in the feature maps by learning spatial relationships. Its internal structure contains dual Partial Spatial Attention (PSA) modules, where each branch extracts complementary spatial features. This design helps the model prioritize meaningful spatial information while maintaining a good balance between processing speed and accuracy. Finally, the detection stage adopts a decoupled head, where the bounding box regression and class prediction are separated into two independent branches. The detection head also includes several standard convolutional and depth-wise convolutional layers to further refine features from earlier stages and improve their spatial and semantic representations. Overall, this design enhances the architecture and achieves better overall detection performance than earlier YOLO versions.
3.3 Adaptive Spectral Mamba-inspired Attention
To improve feature representation and also maintain computational efficiency, we propose the Adaptive Spectral Mamba-Inspired Attention (ASMA) block, as depicted in Fig. 2. In particular, ASMA aims to improve feature representation by combining two complementary branches, such as a token-based attention branch for local–global spatial feature modeling and a frequency refinement branch for spectral enhancement, which is inspired by [47] and [48]. This design aims to solve two issues in MRI tumor detection. The spatial branch captures long-range contextual relations so that the model can understand tumor location relative to surrounding brain structures. The spectral branch refines magnitude and phase information to strengthen texture and boundary information. The learnable gate then balances these two feature types, so the network can emphasize spatial localization or spectral detail depending on the input feature response.
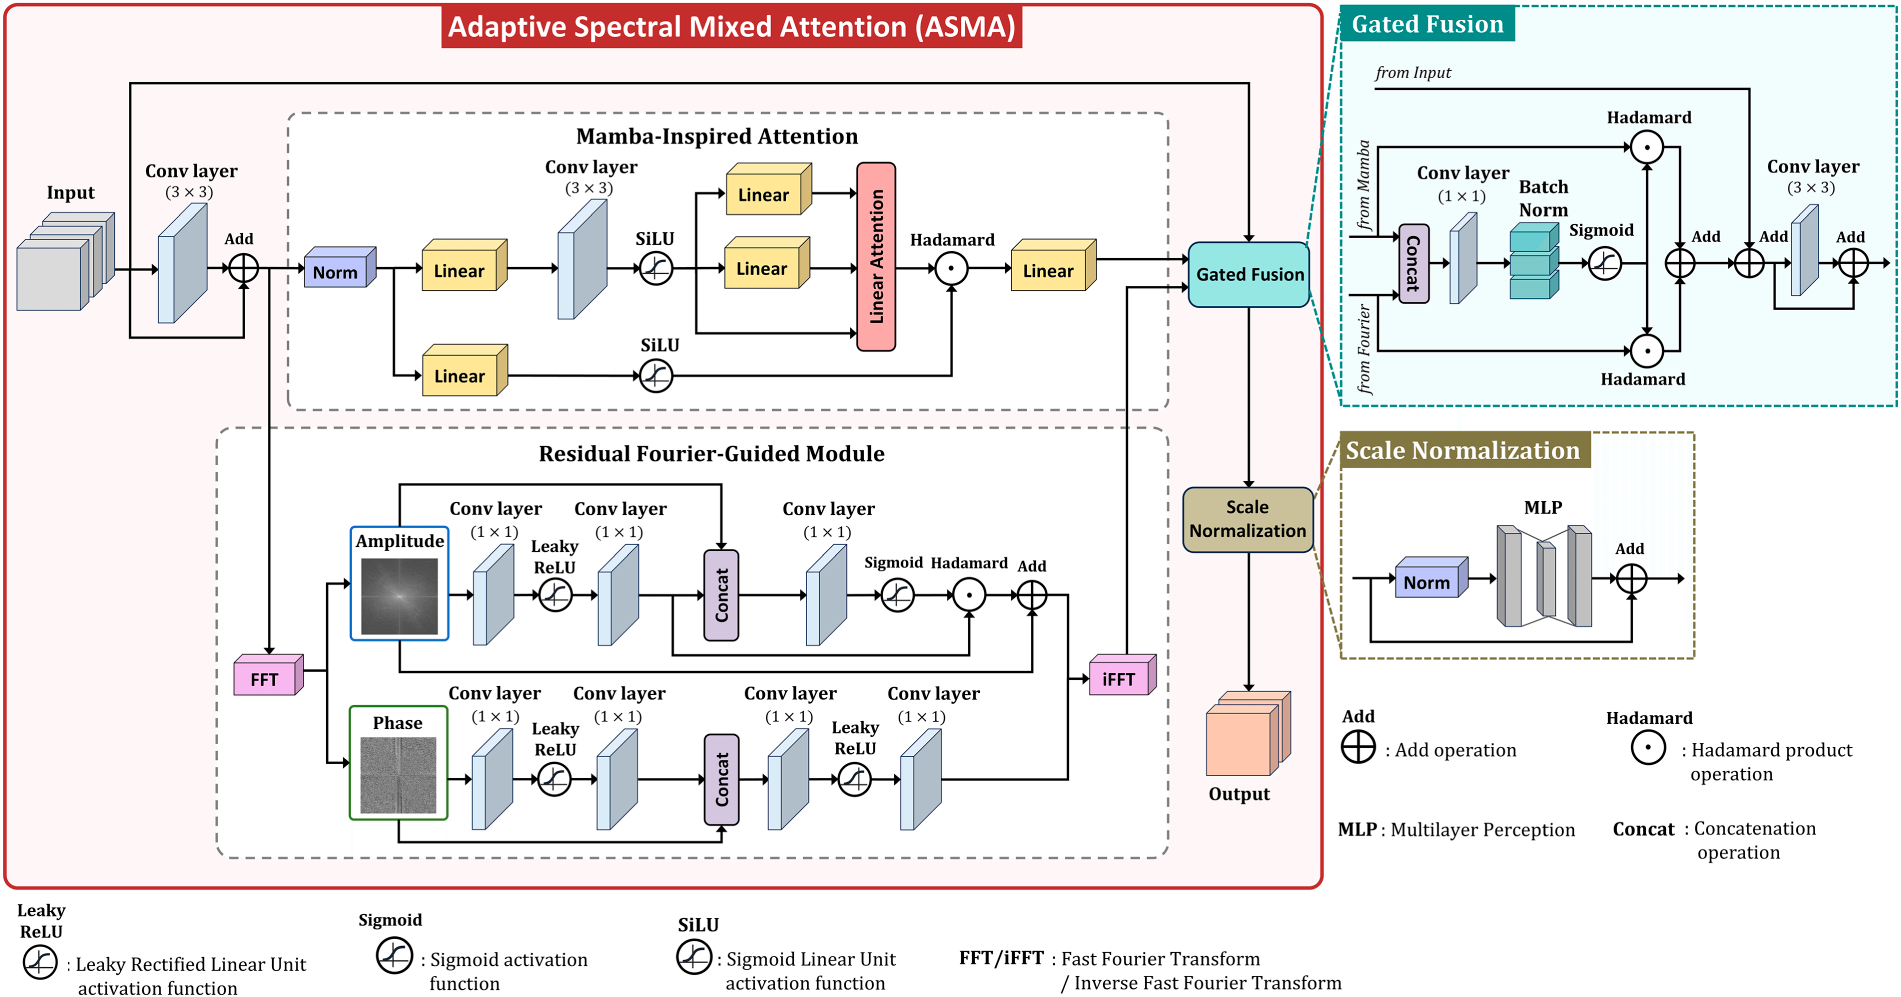
Figure 2: Architecture of the proposed ASMA block.
Initially, the input feature map is defined as
Since depth-wise convolution processes each channel separately, it can preserve channel-wise information while also adding nearby context. This is important for detection tasks because object boundaries and small local patterns often need to be maintained before combining global feature information.
The first branch is the Mamba-Inspired Linear Attention Branch. First, the input feature
where
In this design, it is noticed that only query and key are generated by a learnable linear layer. The value feature is directly taken from the input token feature
where
where
In parallel with the attention branch, the second branch is the frequency refinement. The input feature is first projected by a
where
where
The refined magnitude and phase are then used to reconstruct the complex spectrum and recover the spatial-domain feature:
where
After passing through the two branches, the spatial attention feature
where BN denotes batch normalization; Concat is channel-wise concatenation; and
This gate allows the network to adaptively decide whether spatial-attention information or frequency-refined information should be emphasized for each feature response. Then, the fused feature is added back to the input through residual learning as
where
3.4 Sparse-Guided Group Attention
To refine intermediate feature attention, we develop a combination of two types of attention inspired by [49] and [50], which we call Sparse-Guided Group Attention (SAGA), as shown in Fig. 3. The Sparse Self-Attention performs self-attention after rearranging the feature map into small sparse groups, while Cascaded Group Attention applies window-based attention with cascaded interaction across different channel groups. Since these two components process features using different attention mechanisms, combining them sequentially helps the model refine the same feature map through two complementary attention stages, rather than relying on a single mechanism. These blocks are placed before the detection heads because tumor size varies strongly across images. This design may help the detection head receive stronger scale-aware features for small, medium, and large tumor regions.
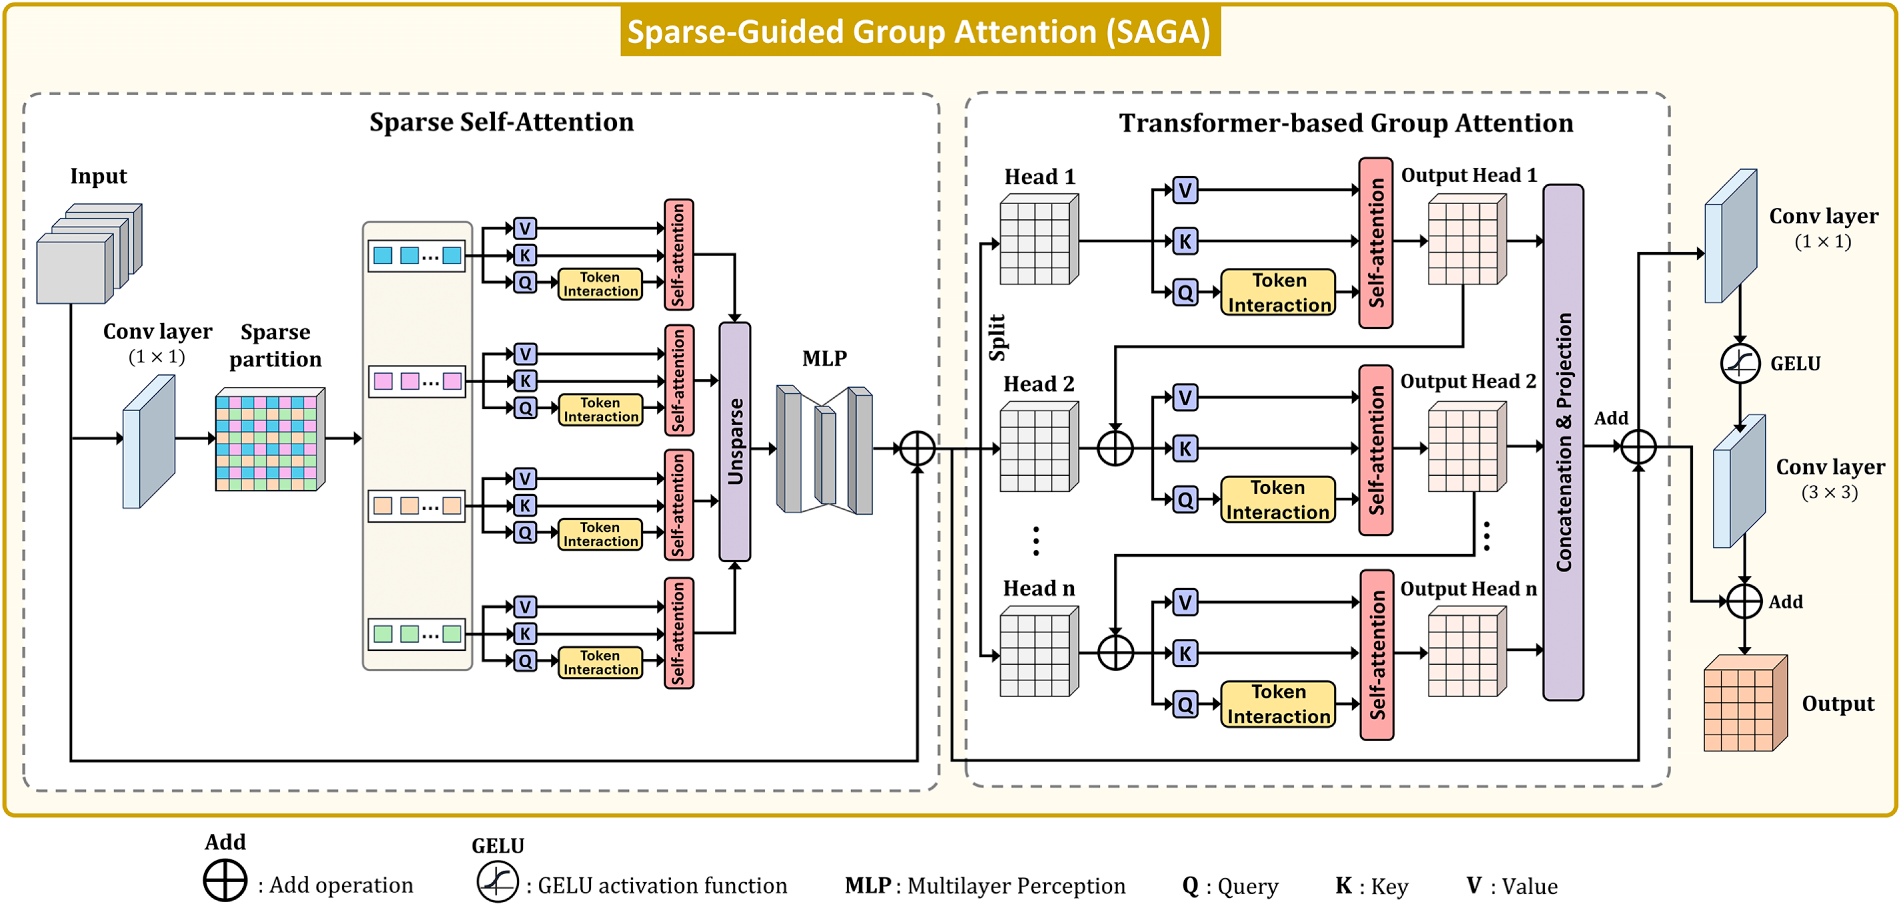
Figure 3: Architecture of the proposed SAGA block.
First, the input feature map is represented as
This step aims to enrich the feature map with local spatial features while keeping the same feature shape. Next, the feature map is rearranged into many small sparse groups with size
After rearrangement, the feature map is converted into a collection of short token sequences, represented as
where
After Sparse Self-Attention, the feature map is normalized again before being passed to the next stage. This stage operates directly on 2D features using window-based attention. The feature map is first partitioned into non-overlapping windows of size
Thus, the windowed feature representation can be defined as
where
where
where
Finally, a lightweight fusion branch can be applied for additional local refinement via a series of convolution and activation layers:
where GELU represents the Gaussian Error Linear Unit activation function. Overall, SAGA benefits from both sparse grouped interactions and progressive local contextual modeling.
To achieve the accuracy of object detection as for models based on YOLO, loss function optimization and non-maximum suppression (NMS) are essential and important steps. These processes assure proper prediction of the coordinates of the bounding boxes and classification of the target objects in the model. Because of the nature of anchor boxes and grid-based detection, there are models that create several overlapping rectangular boxes for the same object. These redundancies in detections are removed as a post-processing step using NMS. It chooses the bounding box which has the maximum confidence measure and removes the rest of the boxes around it which have a high Intersection over Union (IoU) with it.
Generalized-IoU (GIoU) [51] extends conventional IoU by additionally considering the smallest enclosing box that contains both the predicted and ground-truth bounding boxes. This provides an optimization signal even when the two boxes do not overlap. Although IoU directly measures the spatial overlap between predicted and ground-truth boxes, the conventional IoU loss cannot provide an effective gradient for bounding-box regression when the boxes are non-overlapping. In addition, IoU does not explicitly consider the distance between the center points of the two boxes. To address these limitations, Distance-IoU (DIoU) [52] incorporates the normalized distance between the center points of the predicted and ground-truth boxes into the loss function, thereby improving bounding-box regression. However, DIoU may still have limitations in describing differences in box geometry when the center points of the two bounding boxes coincide or are very close. Therefore, additional geometric information, such as the aspect ratio of the bounding boxes, can be incorporated into the loss function.
To overcome the limitation of DIoU, Complete IoU (CIoU) [53] is effective in reducing the localization error of large or irregularly shaped objects due to the constraint of shape consistency. This is done by considering the normalized distance between center points as well as the aspect ratios of the boxes. The CIoU loss function is directly derived from the DIoU, as given below:
where
The width
Compared to GIoU and DIoU, CIoU offers sufficient applicability for this task because it maintains a practical balance between computational complexity and the ability to accurately detect the variation in size of objects. Consequently, CIoU is selected as our optimization method during the training process.
For evaluation, all experiments were conducted on a computer equipped with an Intel Core i5-7500 CPU and an RTX 3060 GPU with 12 GB of memory. The implementation was developed using PyTorch 2.11 with CUDA 12.8. In this study, we used a random image-level data partitioning strategy, where 75% of the images were assigned for training, 5% for validation, and the remaining 20% were used for testing, as shown detail in Table 2. It is important to note that the proposed model is designed as a single-image detection framework. Therefore, it does not depend on multi-view fusion of the same patient. Each image is treated as an independent sample during both training and inference. All images were resized to 640

To evaluate the proposed model, we use several common object detection metrics, including precision, recall, mAP50, and mAP50-95. These metrics are selected because they can measure both the detection ability and the localization quality of the model. In this study, mAP50 and mAP50-95 are mainly used for comparing the proposed method with other baseline models and for analyzing the ablation results.
Precision measures how many predicted tumor regions are actually correct out of all the regions predicted by the model. It is computed as
where
where
In addition, mAP50 is used to evaluate the average precision when the Intersection over Union (IoU) threshold is fixed at 0.50. Basically, a predicted bounding box is considered as correct when its IoU with the ground-truth box is equal to or higher than 0.50. The mAP50 is calculated as:
where
where
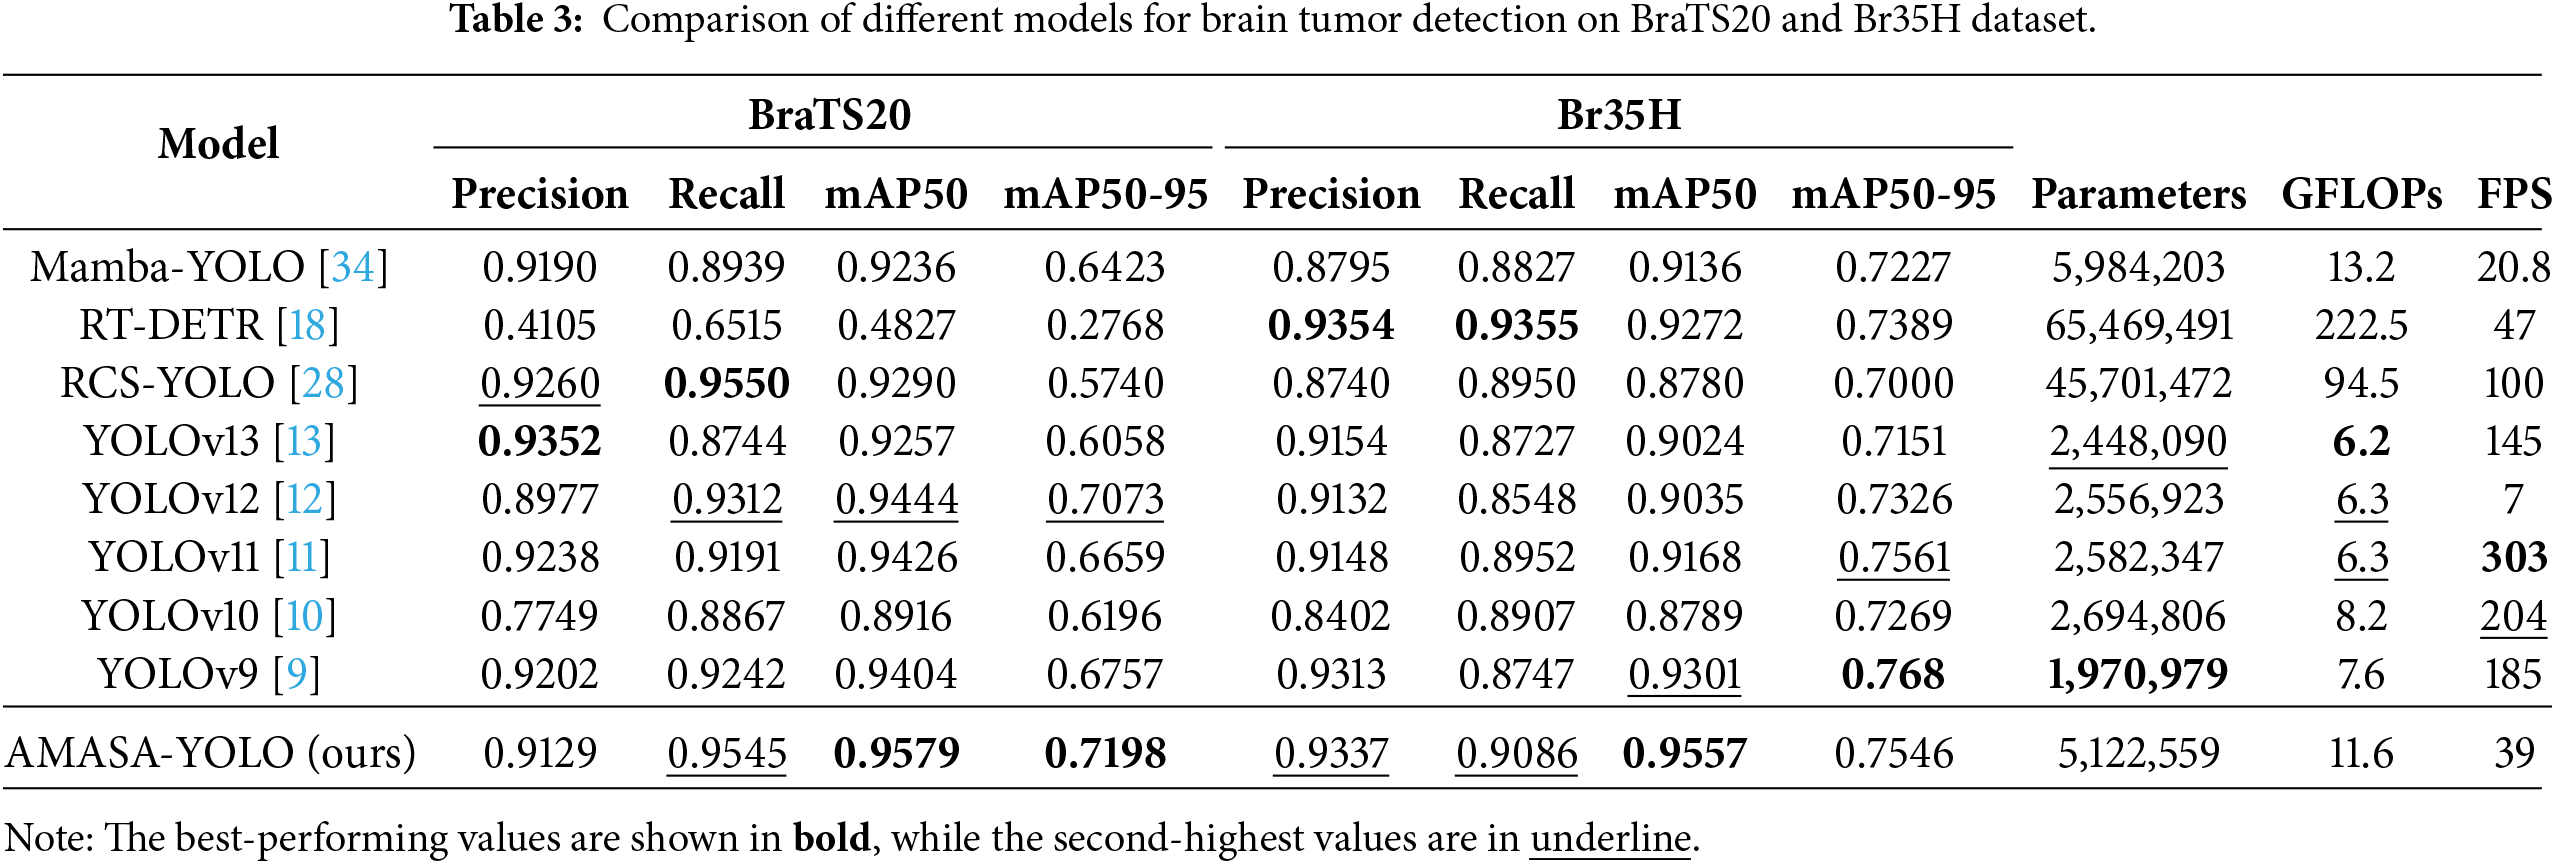
The quantitative comparison in Table 3 illustrates the effectiveness of our AMASA-YOLO model against the latest object detection architectures, including YOLOv9 through YOLOv13 [9–13], RT-DETR [18], Mamba-YOLO [34] and RCS-YOLO [28]. Overall, the results show that AMASA-YOLO achieves strong and stable performance on both datasets. On the BraTS20 dataset, our model obtains the best mAP50 and mAP50-95, with values of 0.9579 and 0.7198, respectively. It also achieves the second-best recall of 0.9545, which is very close to RCS-YOLO. This indicates that AMASA-YOLO can detect tumor regions effectively while also maintaining better localization quality under a stricter IoU range. Although its precision is slightly lower than YOLOv13 and RCS-YOLO, the overall detection performance is higher, especially in terms of mAP50 and mAP50-95. For the Br35H dataset, AMASA-YOLO also achieves the highest mAP50 of 0.9557 and obtains competitive precision and recall. This suggests that the model keeps good detection ability on two different brain tumor datasets. In terms of model complexity, AMASA-YOLO uses 5.12M parameters and 11.6 GFLOPs, which is much lighter than RT-DETR while still giving better or comparable accuracy in most metrics. For inference speed, AMASA-YOLO reaches 39 FPS. Although it is slower than several lightweight YOLO baselines, it still satisfies real-time detection requirements. Overall, these results show that AMASA-YOLO provides a practical trade-off between detection accuracy, model size, and inference speed, with particularly strong performance in recall and mAP-based localization metrics.
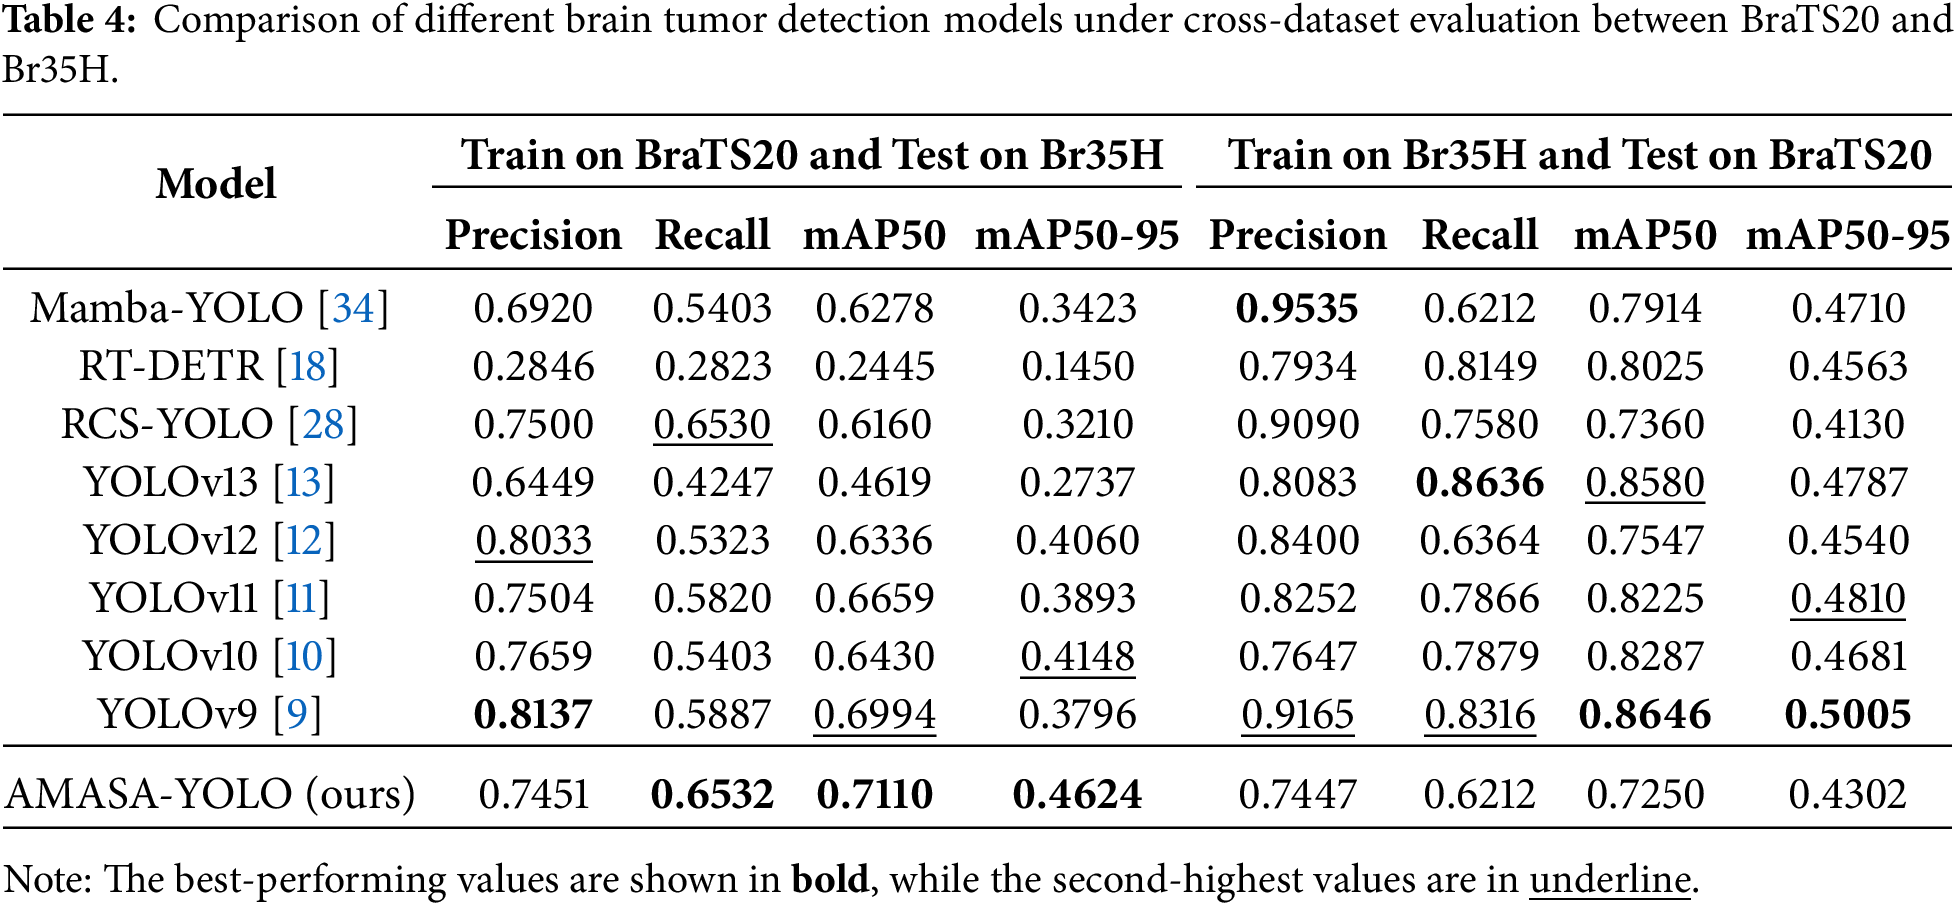
To further evaluate the generalization ability of the proposed model, we conducted cross-dataset testing between BraTS20 and Br35H, as shown in Table 4. In this setting, the model was trained on one dataset and directly tested on the other dataset without additional fine-tuning. When trained on BraTS20 and tested on Br35H, AMASA-YOLO achieves the best mAP50 and mAP50-95 among all compared methods. This indicates that the proposed spatial-spectral feature refinement and sparse-guided attention design can maintain stronger localization ability when transferred to an unseen dataset. Its recall is also the second-best and very close to RCS-YOLO, showing that the model can still detect many tumor cases under cross-dataset conditions. When trained on Br35H and tested on BraTS20, AMASA-YOLO does not achieve the best result, while YOLOv9 and YOLOv13 perform better in several metrics. This result suggests that cross-dataset generalization remains challenging, especially when the training dataset and testing dataset have different image characteristics.
These results also help clarify the novelty of the proposed AMASA-YOLO framework. Compared with standard YOLO-based models, the proposed method does not only modify the backbone depth or detection head, but introduces adaptive spatial-spectral feature learning through ASMA. This allows the model to capture long-range contextual information while preserving boundary and texture-related details, which is important for MRI tumor regions with weak margins. Compared with RT-DETR, AMASA-YOLO achieves stronger detection performance with much lower computational cost, showing that the proposed attention design can improve accuracy without relying on a very large transformer-based detector. Compared with Mamba-YOLO, the proposed ASMA block further combines Mamba-inspired spatial attention with frequency-domain refinement, which may explain the stronger recall and mAP50-95 on BraTS20. Therefore, the results in Table 3 indicate that the novelty of AMASA-YOLO lies in the combination of spatial-spectral feature extraction and sparse-guided multi-scale attention, rather than only adding model complexity.
In addition, we conducted a precision–recall (PR) curve plot analysis of different models on the BraTS20 and Br35H datasets, as shown in Fig. 4. AMASA-YOLO shows a stable curve close to the upper-right region on both datasets, which means a good balance between precision and recall. For the BraTS20 dataset, despite the smaller number of samples, AMASA-YOLO still maintains competitive precision at high recall. For the Br35H dataset, where more data samples are available, the advantage of AMASA-YOLO becomes clearer, as its curve remains higher and drops later than most baseline models. This suggests that the proposed model may benefit from larger data variation, as the advantage becomes clearer on Br35H.
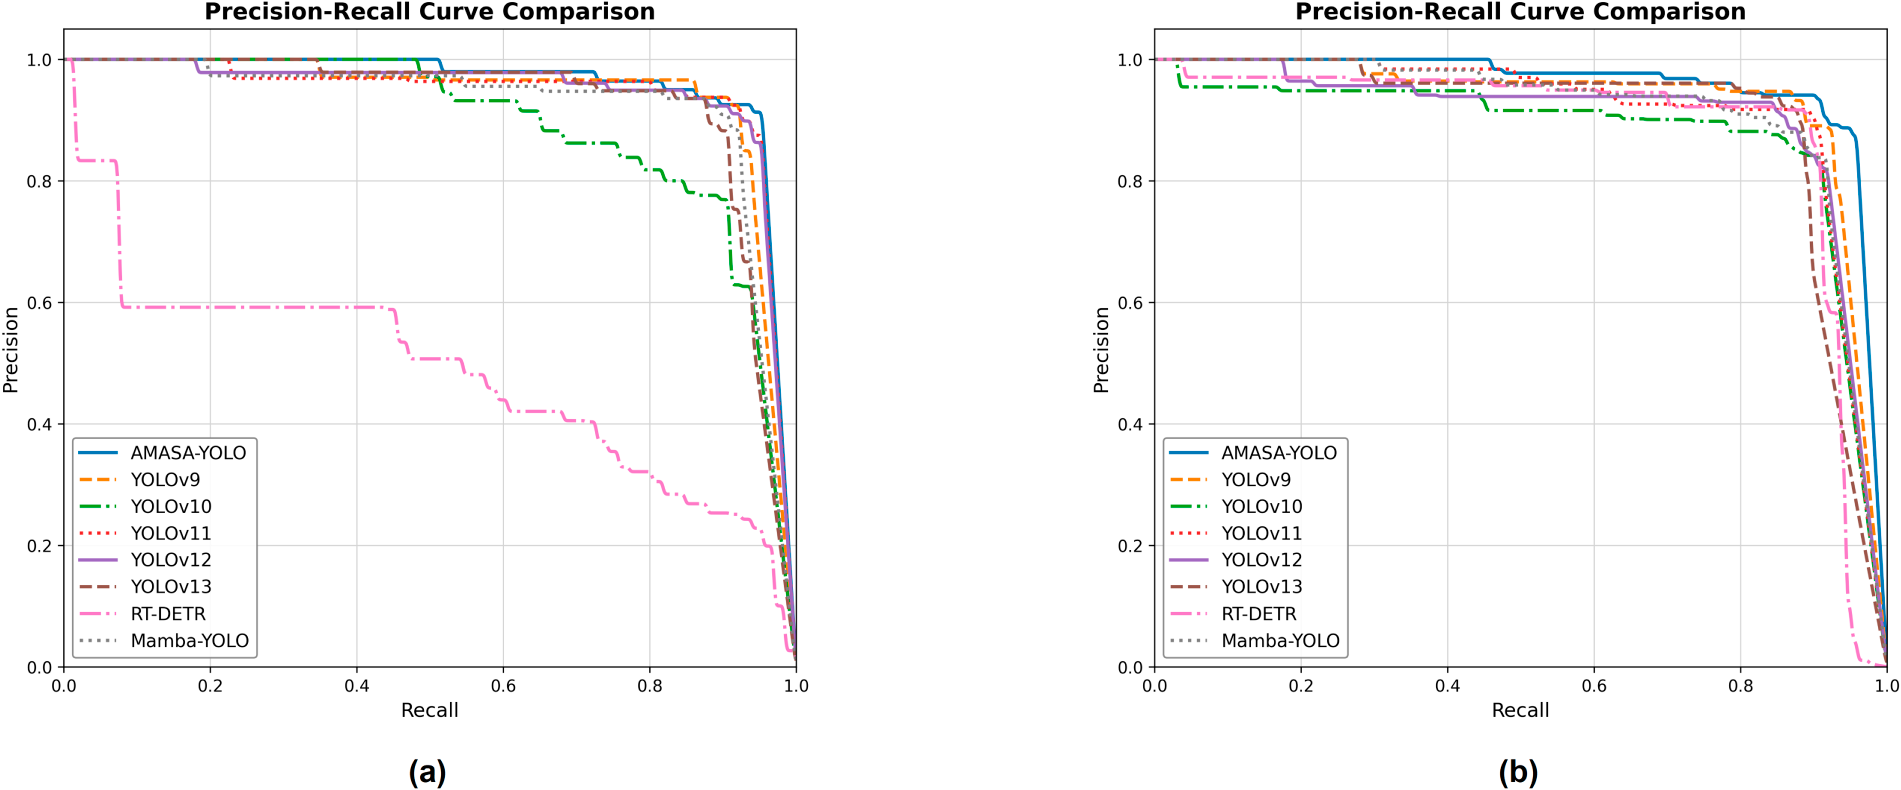
Figure 4: PR curves of different models on (a) BraTS20 dataset and (b) Br35H dataset.
To further evaluate the confidence behavior of each detection model, Fig. 5 presents the F1-confidence curves on the given datasets. On the BraTS20 dataset, AMASA-YOLO keeps a high F1 score across a wide confidence range and shows a more stable curve than most baseline models. This means the model can maintain a good balance between precision and recall under different confidence thresholds. For the Br35H dataset, the advantage of AMASA-YOLO is also clear, as it achieves one of the highest values in the early and middle range and remains stable before dropping at very high confidence values. Thus, these results show that AMASA-YOLO provides more stable tumor detection and demonstrates greater robustness to changes in confidence thresholds compared with the baseline models.
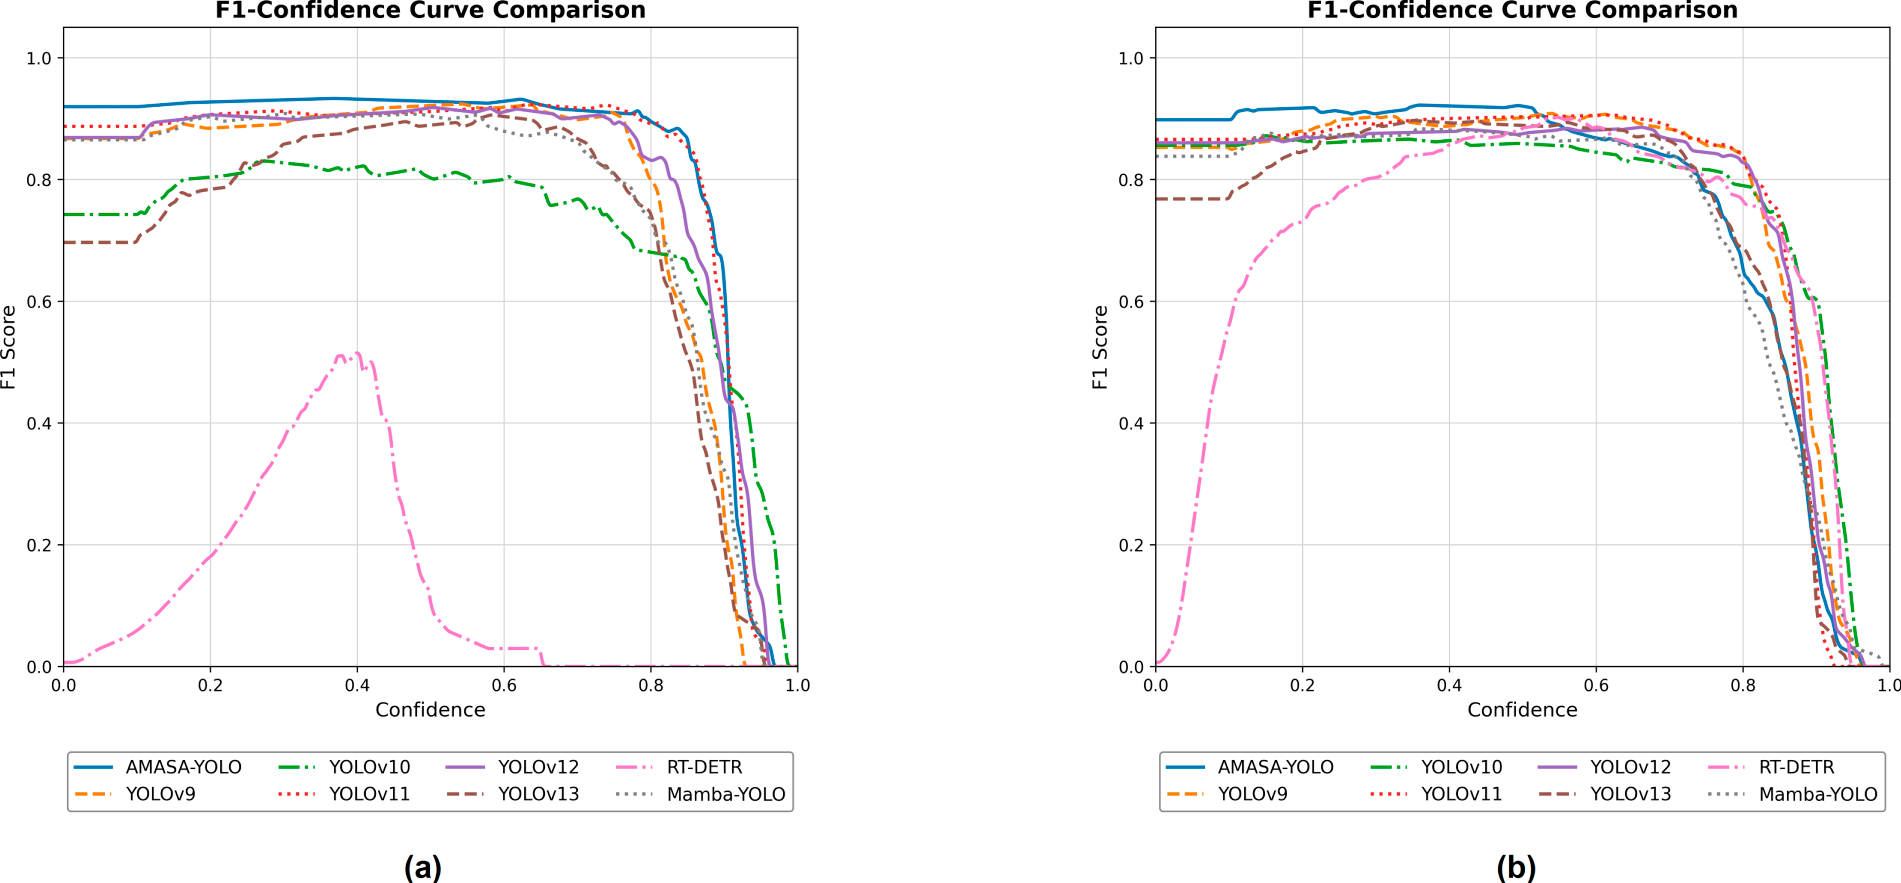
Figure 5: F1-Confidence curves of different models on (a) BraTS20 dataset and (b) Br35H dataset.
These results suggest that the performance gain of AMASA-YOLO is not only caused by adding more model complexity, but also by how the proposed modules refine the feature representation. In particular, ASMA helps the network learn both spatial and spectral information, which is useful for MRI images where tumor regions may have weak boundaries and texture patterns similar to surrounding tissues. This can explain that our model achieves strong recall and mAP-based results, especially on BraTS20 where tumor appearances are more complex. At the same time, SAGA further improves the detection stage by refining multi-scale features before prediction. This helps the model keep a better balance between precision and recall across different confidence thresholds. Compared with RT-DETR, AMASA-YOLO also uses much fewer parameters and GFLOPs, showing that the proposed design improves detection performance without depending on a very large model. Thus, the quantitative results indicate that the spatial-spectral feature learning in ASMA and the multi-scale attention refinement in SAGA are both important for stable brain tumor detection.
To provide a comprehensive evaluation, Fig. 6 presents a qualitative comparison between AMASA-YOLO and other detection models on representative samples from the BraTS20 and Br35H datasets. Overall, AMASA-YOLO produces bounding boxes, which are more consistent with the ground-truth annotations across tumors with different sizes and appearances. In several cases, the baseline models can still detect the tumor region, but their predicted boxes are less accurate and less stable. Indeed, common issues include shifted localization, oversized boxes, duplicated boxes, or missed tumor areas. These issues are more noticeable in challenging cases where the tumor boundary is unclear, the image contrast is low, or the tumor occupies only a small region. In contrast, AMASA-YOLO provides more compact and accurate predictions, especially for irregular tumor shapes and varying intensity patterns. These visual results are consistent with the quantitative findings and further demonstrate the model’s ability to improve both tumor localization and detection robustness across different brain MRI datasets
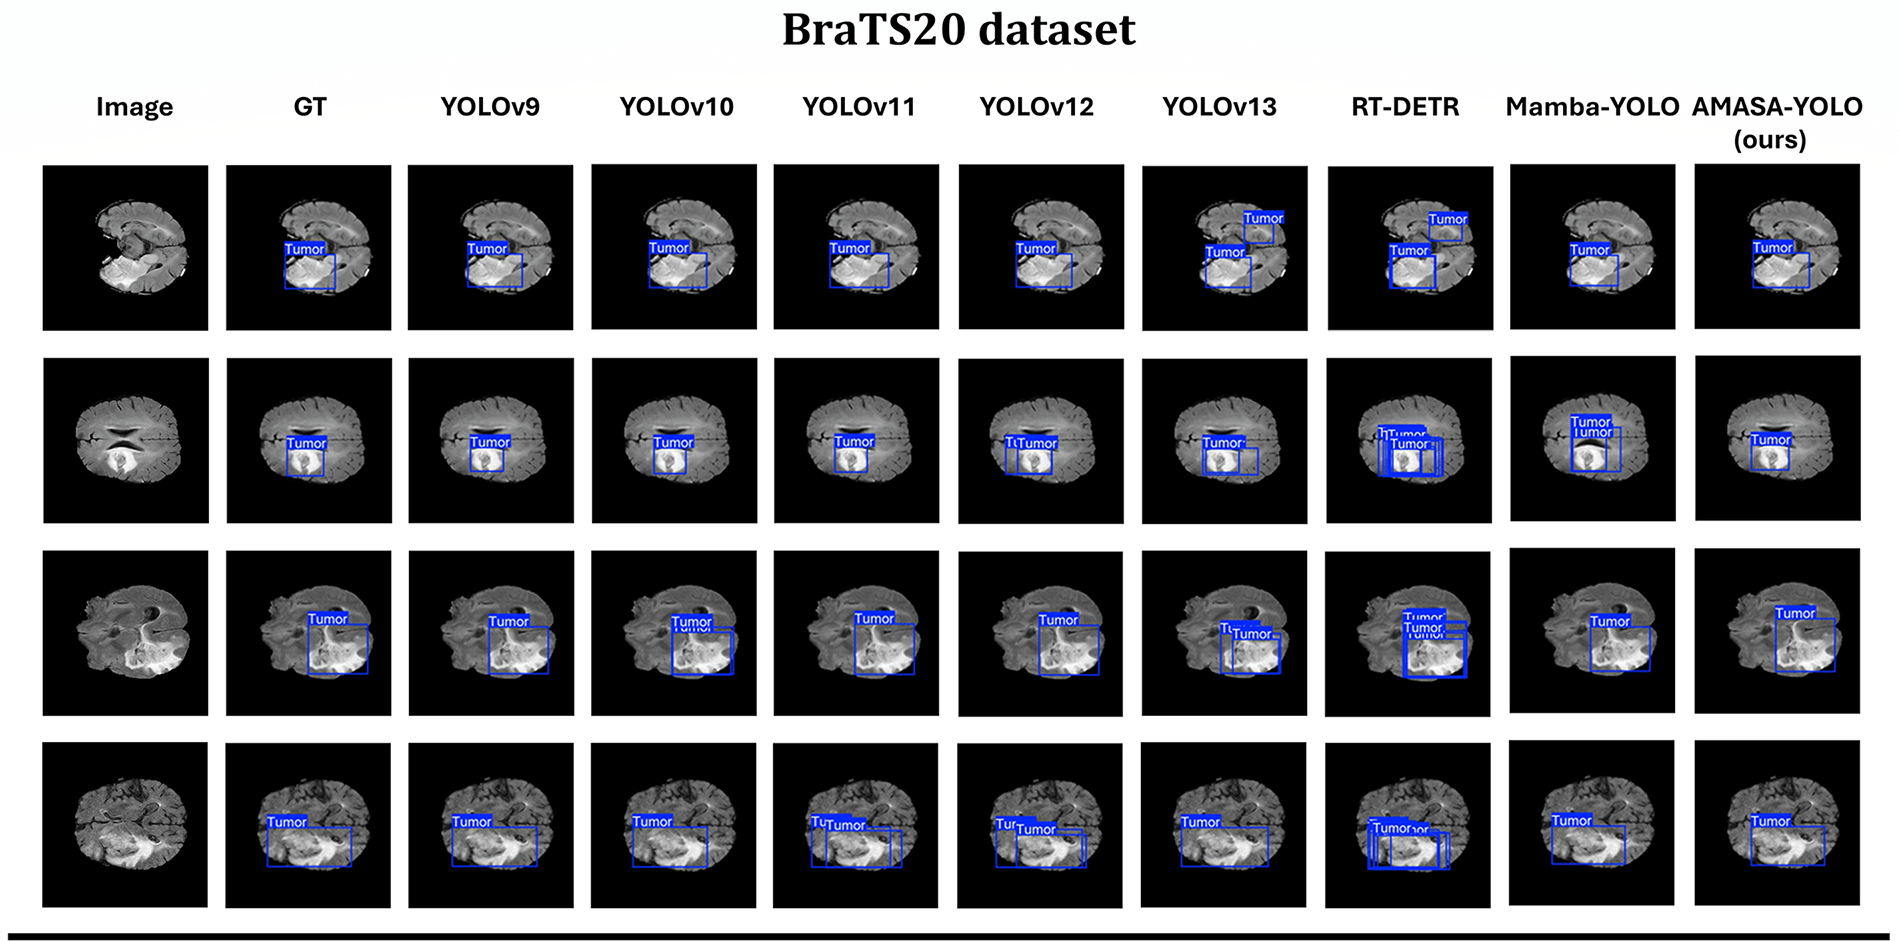
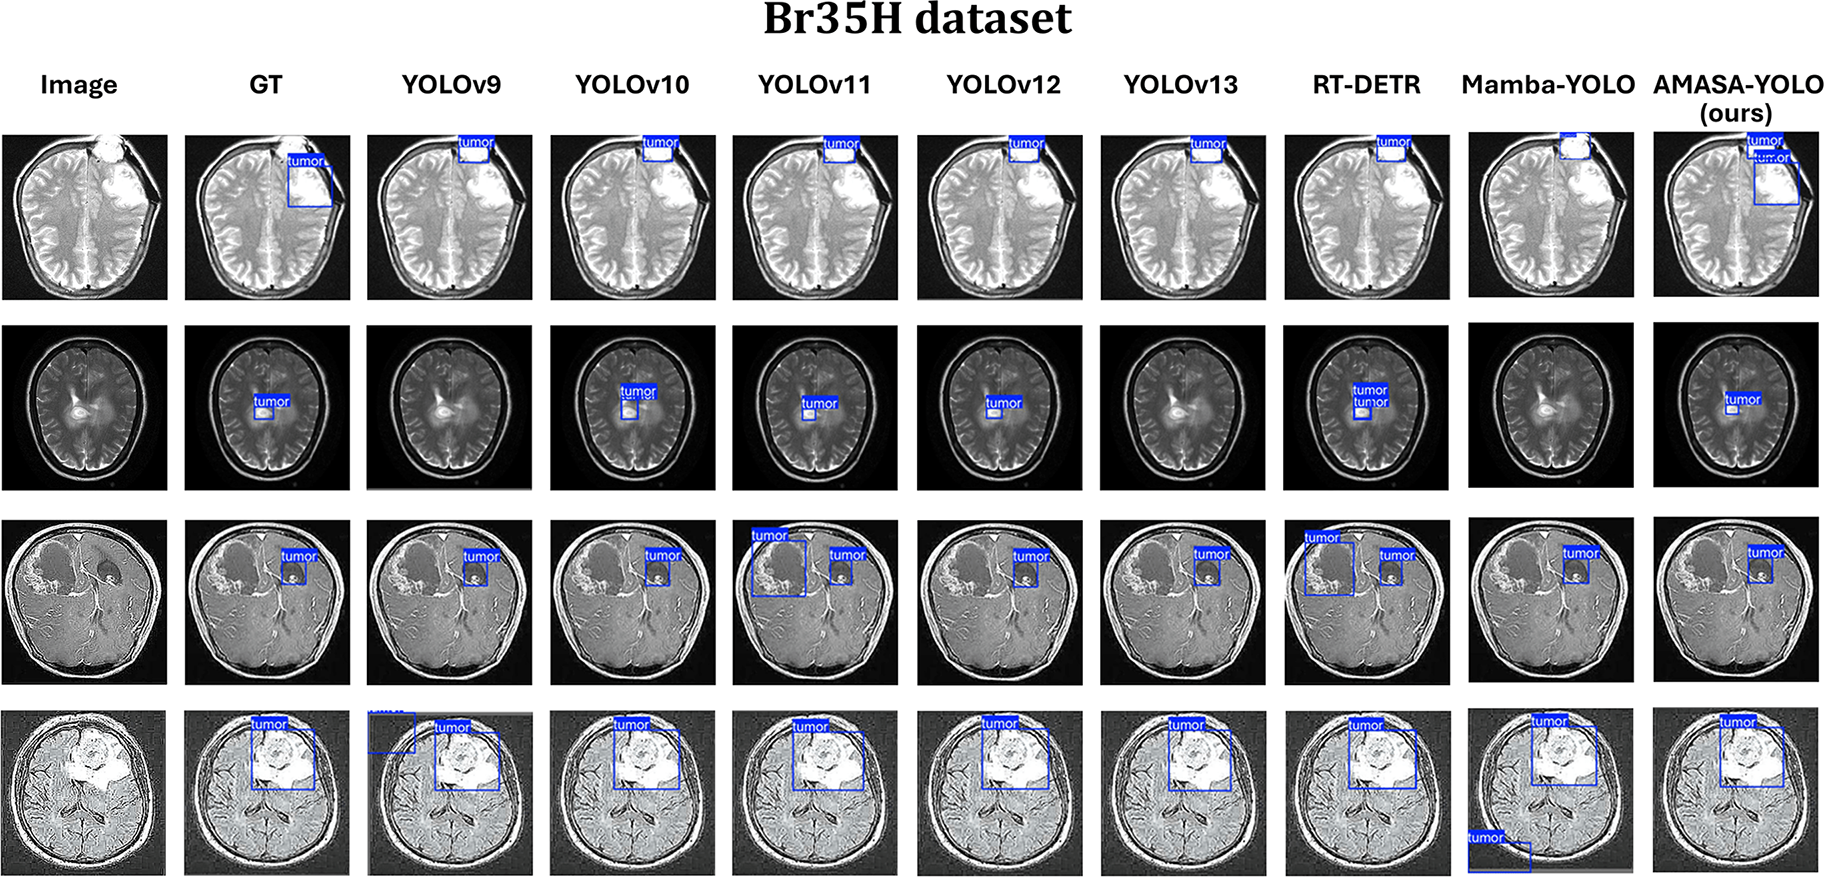
Figure 6: Qualitative results of different sample detection models on BraTS20 and Br35H datasets.
Furthermore, Fig. 7 shows several typical error cases of AMASA-YOLO. In the first case, the model successfully detects the tumor but gives a larger box than the ground truth, mainly due to the extremely weak boundary between the tumor and the nearby bright tissue. In the second case, the main tumor is correctly detected, but an extra false positive appears in another bright region. In the third case, the model captures the abnormal area, but the box is slightly shifted, while the tumor region in the fourth case is split into two predictions instead of being enclosed by a single bounding box. These cases suggest that further improvement is still needed to optimize boundary sensitivity and reduce false-positive predictions in complex imaging scenarios.
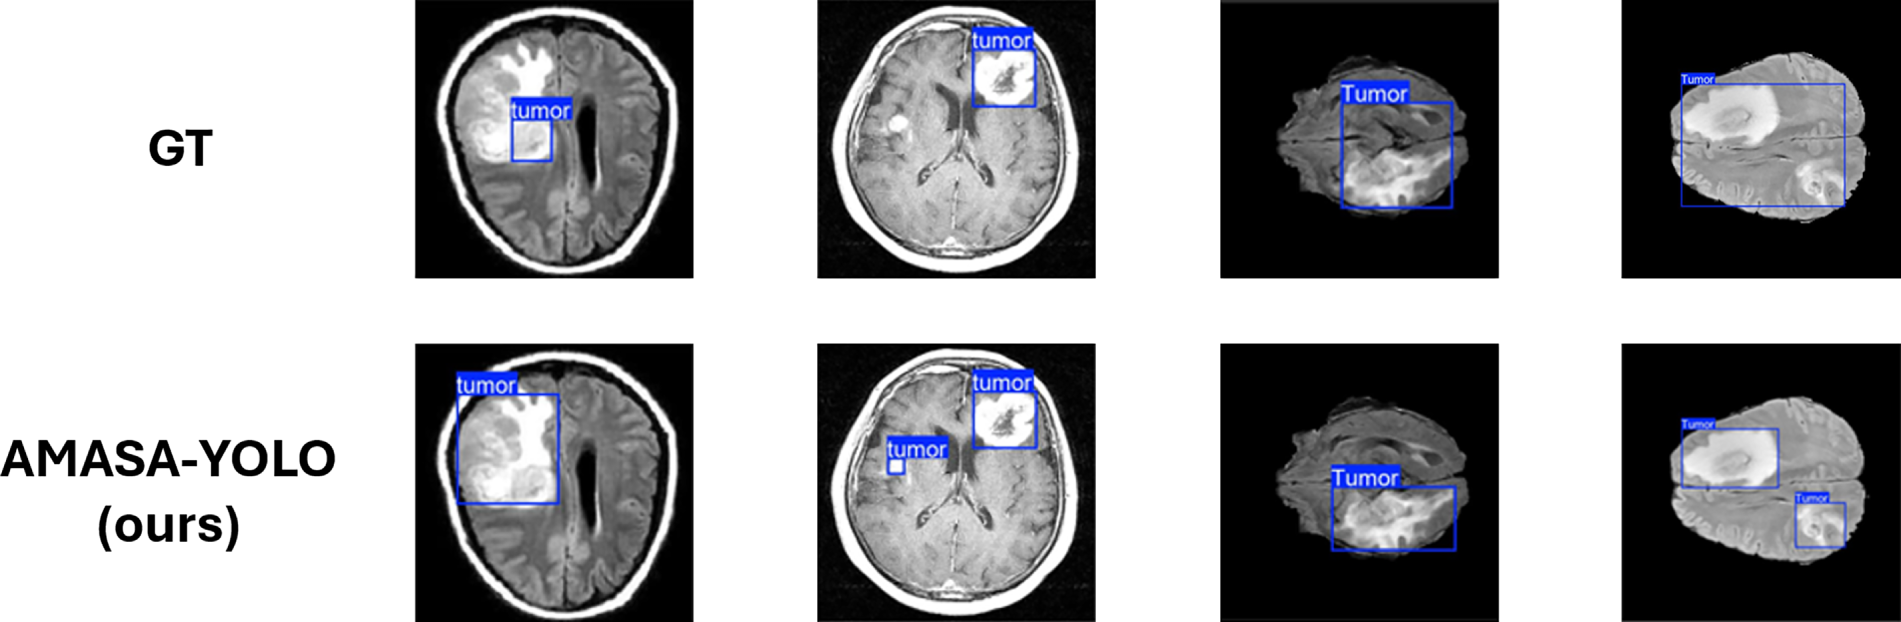
Figure 7: Representative error cases of AMASA-YOLO.
The visual comparison further supports the role of the proposed architecture. Many baseline models can detect the general tumor area, but their boxes are sometimes shifted, duplicated, or do not match the ground truth. This shows that detecting tumor-like intensity is not enough; the model also needs to understand the spatial location and boundary structure of the mass. AMASA-YOLO gives more consistent predictions in the shown examples because ASMA strengthens both spatial attention and spectral feature refinement, while SAGA improves feature selection at different detection scales. This combination helps the model focus on more relevant tumor regions instead of only responding to bright or high-contrast areas. However, the error cases also show that the model still has difficulty when the tumor boundary is extremely unclear or when nearby tissues have similar intensity. Therefore, although AMASA-YOLO improves localization in many cases, further boundary-aware learning may still be needed for more difficult MRI cases.
4.5.1 Effect of Proposed Approaches
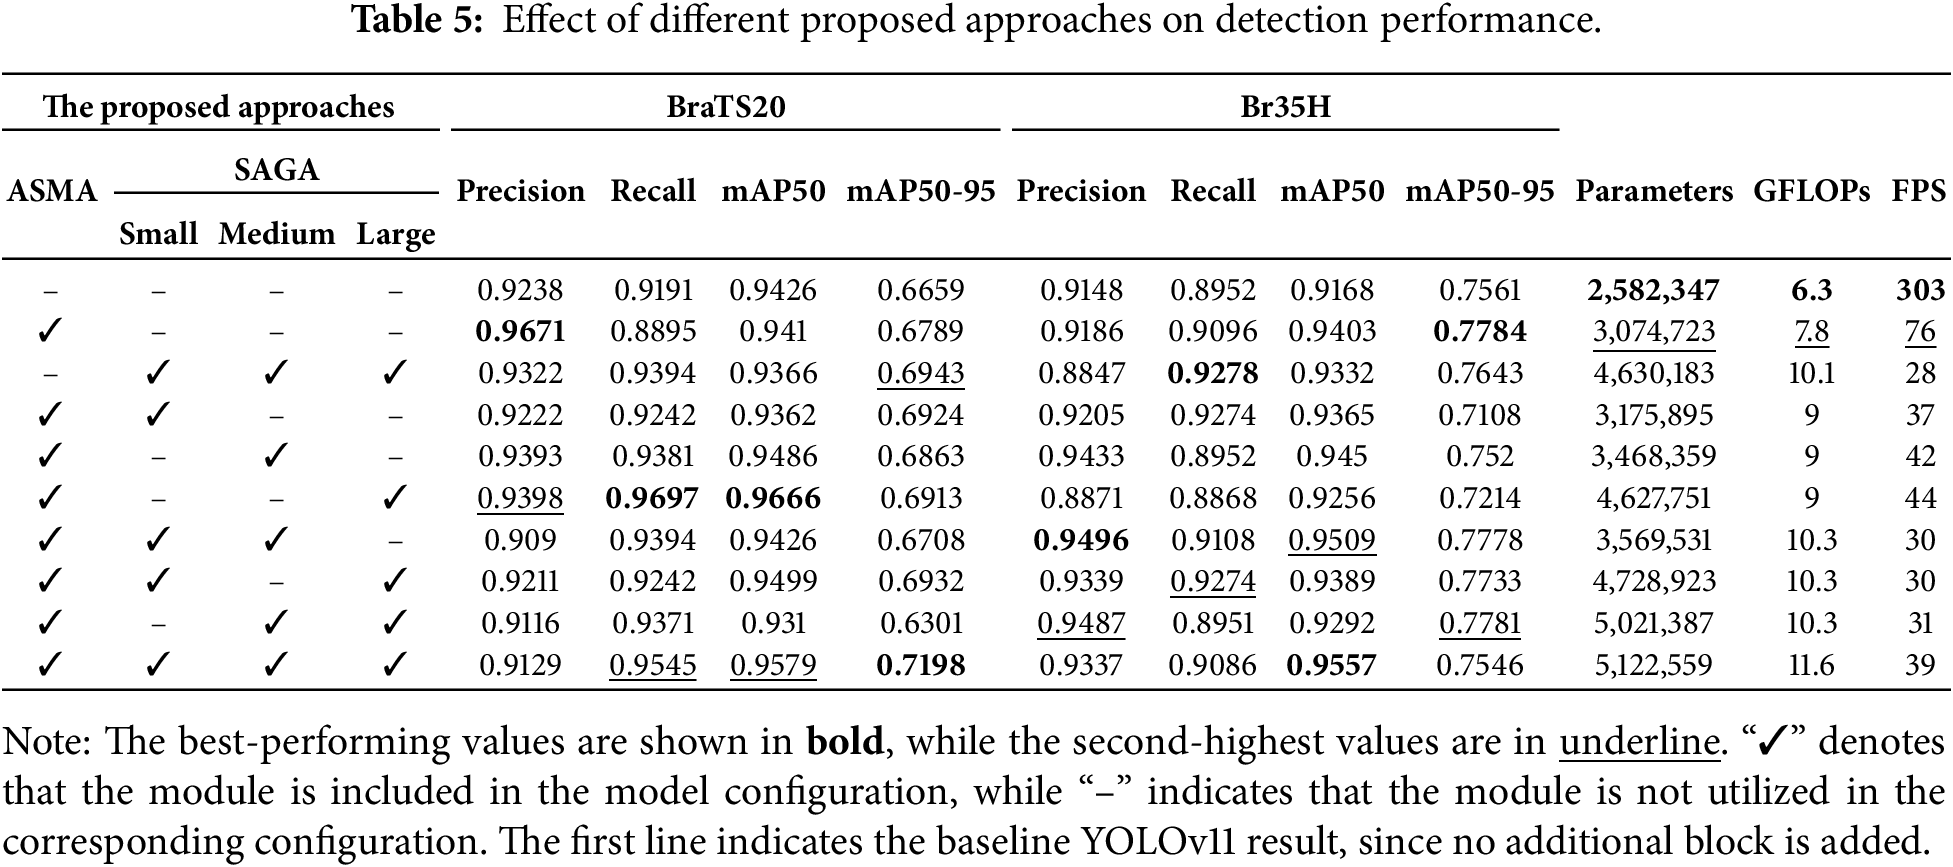
To assess the contribution of the proposed architecture, Table 5 presents the ablation study of the proposed ASMA and SAGA modules under different placement configurations. Using ASMA alone keeps the model lightweight and gives strong precision, which implies that it improves feature extraction with low computational cost. When SAGA is added to the detection head, recall and mAP are generally improved, indicating that SAGA helps enhance tumor detection across different scales. The final AMASA-YOLO setting, which combines ASMA with SAGA in all three detection branches, achieves the best overall results on the BraTS20 dataset, including 0.9545 of recall, 0.9579 of mAP50, and 0.7198 of mAP50-95. It also gives the highest mAP50 on the Br35H dataset, reaching 0.9557. Although this setting slightly increases the number of parameters and GFLOPs, the additional computational cost remains reasonable. These results demonstrate that ASMA and SAGA work well together, leading to improvements in both feature representation and multi-scale tumor detection.
4.5.2 Effect of Feature Extraction Backbone
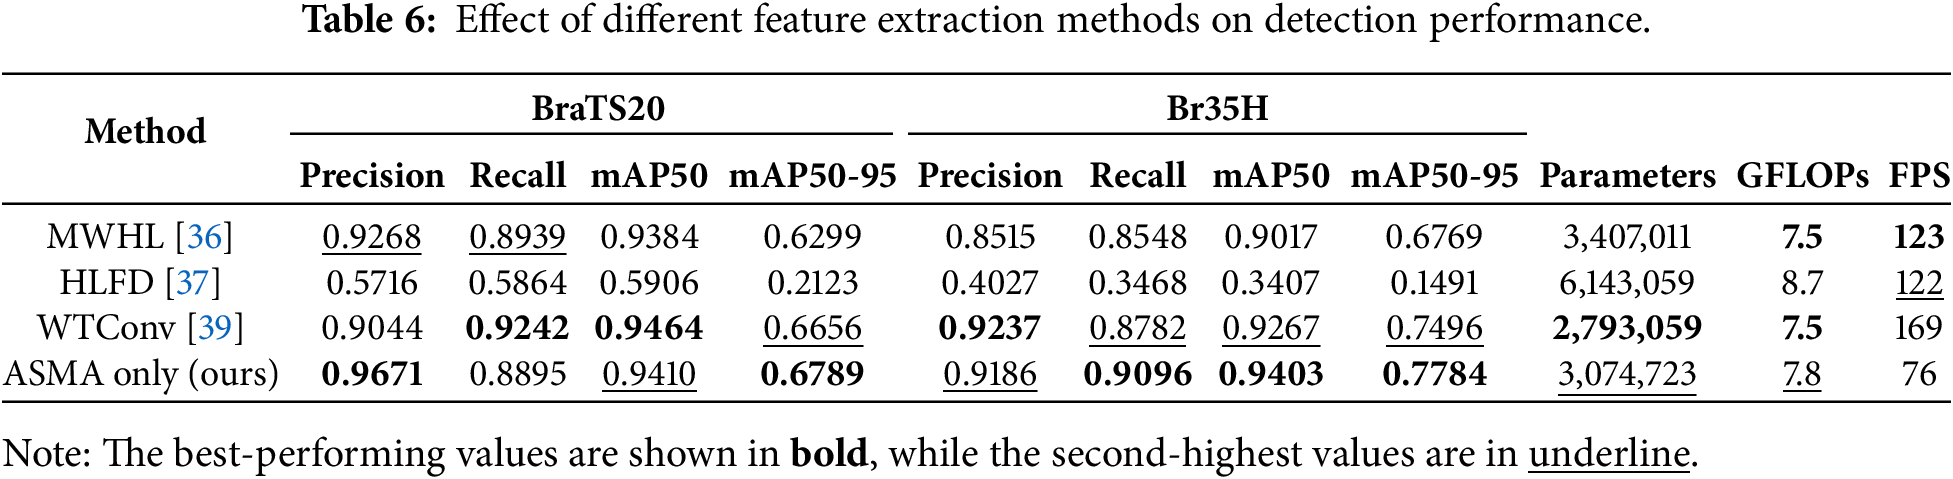
Table 6 compares ASMA with other feature extraction methods based on spectral information. Max Pooling-Wavelet Hybrid Layer (MWHL) [36], High-Low Frequency Decomposition (HLFD) [37], and Wavelet Transform Convolution (WTConv) [39] are used to replace the feature-extraction modules in the main framework. It is clear that WTConv gives strong recall and mAP50 on BraTS20, showing that wavelet-based features can help the model capture useful frequency cues. However, ASMA achieves the highest precision and mAP50-95 on the BraTS20 dataset, while also obtains the best recall, mAP50, and mAP50-95 on the Br35H dataset. This suggests that ASMA is not only effective in detecting tumors, but also provides more stable and reliable localization under stricter evaluation criteria. A key reason for this phenomenon is that ASMA does not only use spectral components directly. Instead, it combines spectral modeling with spatial attention, allowing the network to focus on important tumor regions while still simultaneously learning spectral information. Compared with MWHL, HLFD, and WTConv, this design is more suitable for brain tumor detection, where both boundary details and spatial location are important. In addition, ASMA keeps a moderate model size with 3.07M parameters and 7.8 GFLOPs. This demonstrates that the module can improve the detection performance without introducing a substantial computational cost.
4.5.3 Effect of Attention Module
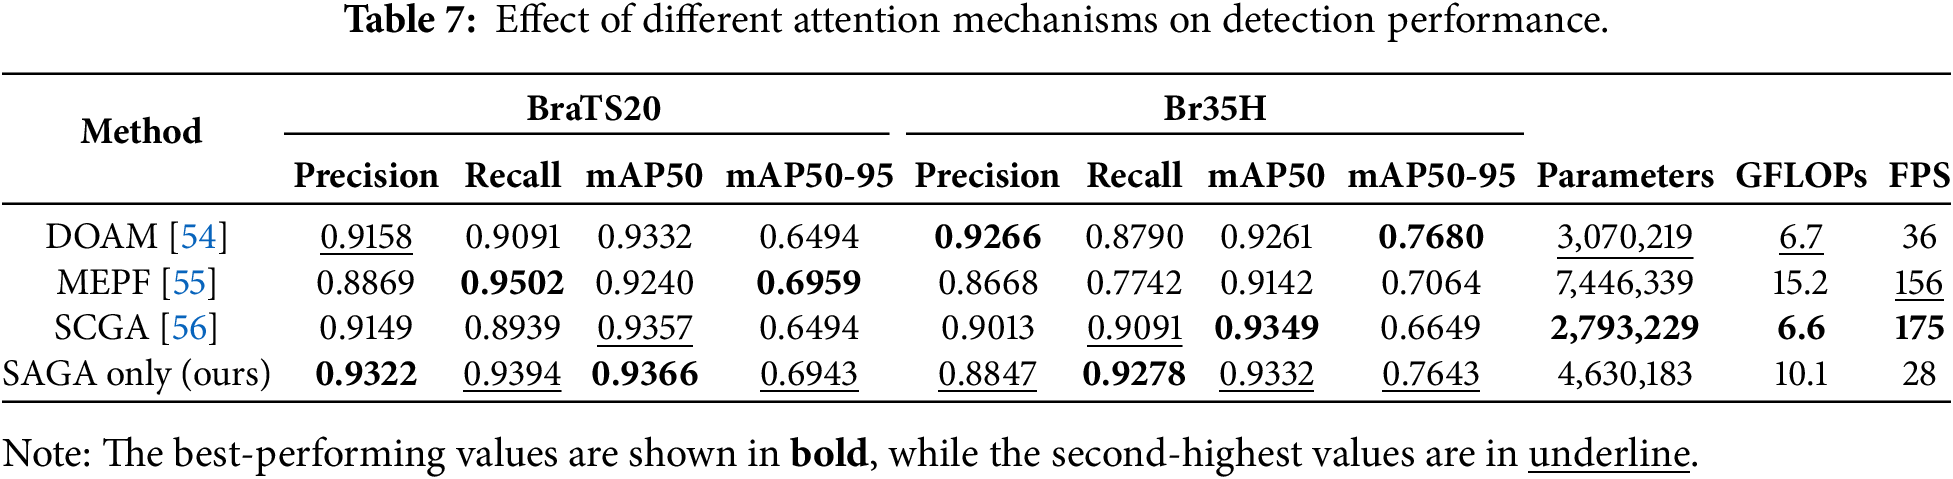
The comparison between SAGA with several attention mechanisms placed near the detection head, including Dynamic Omni-Attention Mechanism (DOAM) [54], Mask Enhanced Pixel-level Fusion (MEPF) [55], and Spatial Channel Group Attention (SCGA) [56], is shown in Table 7. For fair comparison, DOAM, MEPF, and SCGA were inserted at the same detection-head location as SAGA and trained using the same dataset split, input size, optimizer, augmentation, and epoch settings. No additional dataset-specific tuning was applied except channel-size alignment required to match the YOLO feature maps. In general, SAGA gives the most balanced performance across both datasets. For the BraTS20 dataset, SAGA achieves the best precision of 0.9322 and mAP50 of 0.9366, while also obtaining the second-best recall and mAP50-95. For the Br35H dataset, SAGA obtains the highest recall of 0.9278 and the second-best mAP50 and mAP50-95, indicating better ability to detect more tumor regions across different samples. Compared with DOAM and SCGA, which mainly focus on spatial-channel interaction, SAGA further combines sparse self-attention with cascaded group attention. This design enables the model to first refine sparse spatial regions and then strengthen channel-group interactions in a progressive way. As a result, the model can capture more discriminative features for tumor detection at different scales. In addition, SAGA keeps a moderate computational complexity with 4.63M parameters and 10.1 GFLOPs. Overall, these results suggest that SAGA is effective as an attention block in the detection head, especially for improving multi-scale tumor localization while maintaining stable performance across different datasets.
4.5.4 Effect of Bounding Box Optimization Method
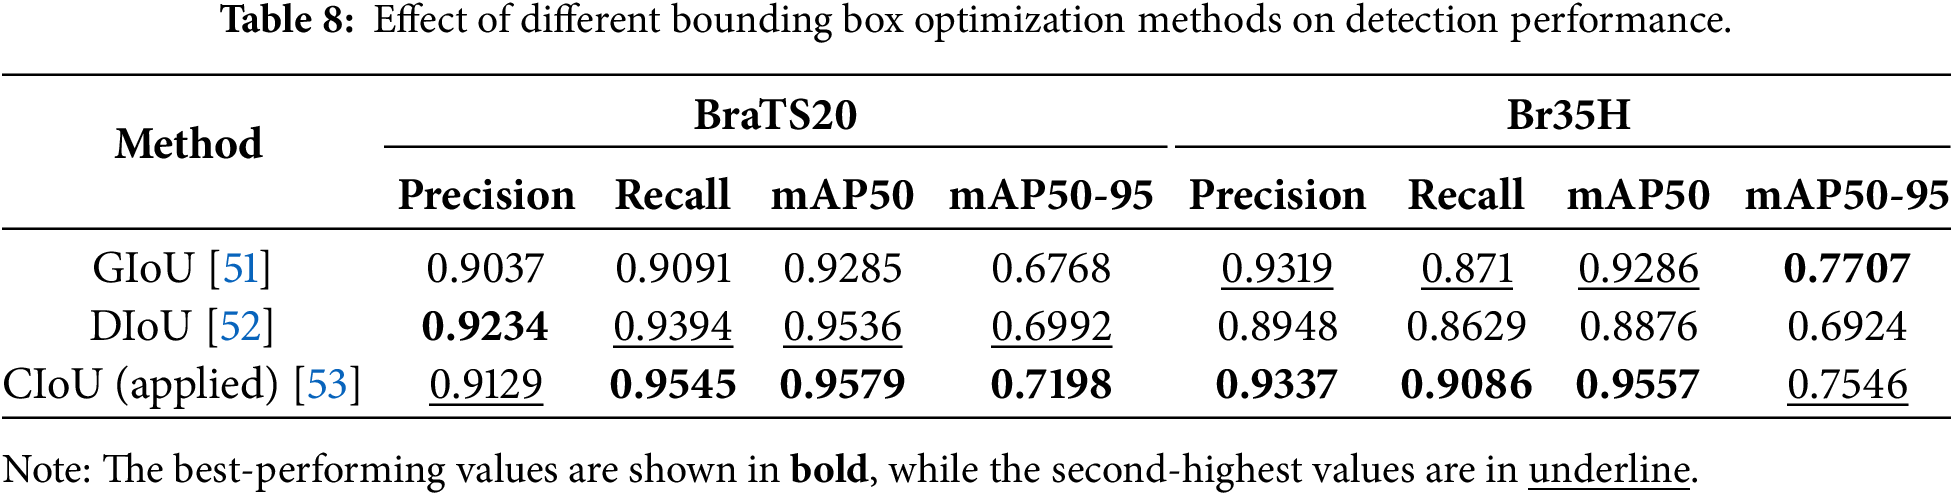
The primary objective of this optimization is to improve bounding box regression for brain tumor detection. Several IoU-based loss functions have been proposed to improve the traditional IoU formulation. In this work, GIoU [51], DIoU [52], and CIoU [53] are evaluated to determine the most suitable method, as shown in Table 8. The results indicate that CIoU provides the best overall performance across both datasets. On the BraTS20 dataset, CIoU achieves the highest recall, mAP50, and mAP50-95, while on the Br35H dataset, it obtains the best precision, recall, and mAP50. Although DIoU and GIoU achieve slightly better results in a few individual metrics, CIoU demonstrates more consistent performance across most evaluation measures. Based on these findings, CIoU is selected as the bounding box optimization method in the proposed model. Therefore, its ability to maintain strong and balanced performance across different datasets makes it the most suitable choice for brain tumor detection.
We proposed AMASA-YOLO in this study, which is an adaptive spectral and sparse-guided attention framework for MRI brain tumor detection. The model is built on a YOLO-based framework and introduces two main modules: Adaptive Spectral Mamba-Inspired Attention (ASMA) and Sparse-Guided Group Attention (SAGA). ASMA improves feature extraction by combining spatial attention with spectral feature refinement. This helps the model enhance in capturing long-range information and texture-related details. SAGA is placed in the detection head to further enhance multi-scale feature representation through sparse self-attention and cascaded group attention. Together, these modules allow the model to better detect tumors with different sizes, intensities, and weak tumor boundaries. Experiments on the BraTS20 and Br35H datasets show that AMASA-YOLO achieves strong performance in key metrics compared with recent detection models.
However, some limitations still remain. The main failure cases are related to boundary ambiguity and high-intensity regions. Oversized boxes appear when the mass boundary is weak, and the model includes nearby bright tissues. False positives occur when normal regions have similar intensity patterns to mass regions. A possible solution for future work is to add a lightweight auxiliary segmentation branch during training. This means that the model can learn an auxiliary tumor-mask prediction using Dice/Binary Cross-Entropy loss, while the detection head still outputs bounding boxes. Indeed, a boundary-aware penalty could also be considered by assigning a higher loss to predicted boxes that extend far beyond the mask-derived mass boundaries. These strategies may reduce oversized boxes and false positives by forcing the detector to learn finer tumor contours. Another case of splitting box predictions may happen because the current model processes each 2D slice independently and does not use inter-view information. This can be improved by multi-view fusion, where axial, sagittal, and coronal features are encoded separately and fused before the detection head. Thus, it may be extended to a 2.5D framework without the heavy cost of full 3D detection. Furthermore, external validation on larger datasets testing should also be explored to better evaluate clinical generalization. These directions can further improve robustness and potential practical value, though additional external validation is still needed.
Acknowledgement: This research is funded by Vietnam National University Ho Chi Minh City (VNU-HCM) under a project within the framework of the Program titled “Strengthening the capacity for education and basic scientific research integrated with strategic technologies at VNU-HCM, aiming to achieve advanced standards comparable to regional and global levels during the 2025-2030 period, with a vision toward 2045”.
Funding Statement: This research is funded by Vietnam National University Ho Chi Minh City (VNU-HCM) under the grant number CB2025-28-16.
Author Contributions: The authors confirm contribution to the paper as follows: conceptualization, Bao Quoc Vuong and Kien Trang; methodology, Bao Quoc Vuong and Kien Trang; software, Bao Quoc Vuong; validation, Bao Quoc Vuong and Kien Trang; formal analysis, Bao Quoc Vuong; investigation, Bao Quoc Vuong and Kien Trang; resources, Kien Dinh Vu, Kien Trang and An Hoang Nguyen; data curation, Kien Dinh Vu; writing—original draft preparation, Bao Quoc Vuong and Kien Dinh Vu; writing—review and editing, Kien Dinh Vu, Kien Trang and An Hoang Nguyen; visualization, Bao Quoc Vuong and Kien Trang; supervision, Kien Trang; project administration, Bao Quoc Vuong; funding acquisition, Bao Quoc Vuong. All authors reviewed and approved the final version of the manuscript.
Availability of Data and Materials: The datasets analyzed during the current study are publicly available from previously published sources. The Brain Tumor Segmentation Challenge 2020 (BraTS20) dataset is introduced in the following publications: https://doi.org/10.1109/TMI.2014.2377694; https://doi.org/10.1038/sdata.2017.117; https://arxiv.org/abs/1811.02629. The Brain Tumor Detection 2020 (Br35H) dataset is introduced in https://dx.doi.org/10.21227/tbkk-q937. These datasets were used in accordance with their respective data-access and usage conditions.
Ethics Approval: Not applicable. This study used retrospective, publicly available, and de-identified ultrasound images from two datasets: Brain Tumor Segmentation Challenge 2020 (BraTS20), and Brain Tumor Detection 2020 (Br35H). Because all data from these datasets were anonymized and publicly accessible, no additional institutional ethics approval was required for the present secondary analysis. The original data collections were conducted by the institutions responsible for these datasets.
Conflicts of Interest: The authors declare no conflicts of interest.
References
1. Montalbo FJP. A computer-aided diagnosis of brain tumors using a fine-tuned YOLO-based model with transfer learning. KSII Trans Internet Inf Syst. 2020;14(12):4816–34. [Google Scholar]
2. Badža MM, Barjaktarović MČ. Classification of brain tumors from MRI images using a convolutional neural network. Appl Sci. 2020;10(6):1999. doi:10.3390/app10061999. [Google Scholar] [CrossRef]
3. Chen A, Lin D, Gao Q. Enhancing brain tumor detection in MRI images using YOLO-NeuroBoost model. Front Neurol. 2024;15:1445882. [Google Scholar]
4. Bouhafra S, El Bahi H. Deep learning approaches for brain tumor detection and classification using MRI images (2020 to 2024a systematic review. J Imaging Inform Med. 2024;38(3):1403–33. doi:10.1007/s10278-024-01283-8. [Google Scholar] [CrossRef]
5. Hossain A, Islam MT, Almutairi AF. A deep learning model to classify and detect brain abnormalities in portable microwave based imaging system. Sci Rep. 2022;12(1):6319. [Google Scholar]
6. Samee NA, Mahmoud NF, Atteia G, Abdallah HA, Alabdulhafith M, Al-Gaashani MSAM, et al. Classification framework for medical diagnosis of brain tumor with an effective hybrid transfer learning model. Diagnostics. 2022;12(10):2541. doi:10.3390/diagnostics12102541. [Google Scholar] [CrossRef]
7. Ren S, He K, Girshick R, Sun J. Faster R-CNN: towards real-time object detection with region proposal networks. IEEE Trans Pattern Anal Mach Intell. 2017;39(6):1137–49. doi:10.1109/tpami.2016.2577031. [Google Scholar] [PubMed] [CrossRef]
8. Liu W, Anguelov D, Erhan D, Szegedy C, Reed S, Fu CY, et al. SSD: single shot multiBox detector. In: Leibe B, Matas J, Sebe N, Welling M, editors. Computer vision—ECCV 2016. Berlin/Heidelberg, Germany: Springer; 2016. p. 21–37. [Google Scholar]
9. Wang CY, Yeh IH, Liao HYM. YOLOv9: learning what you want to learn using programmable gradient information. arXiv:2402.13616. 2024. [Google Scholar]
10. Wang A, Chen H, Liu L, Chen K, Lin Z, Han J, et al. YOLOv10: real-time end-to-end object detection. arXiv: 2405.14458. 2024. [Google Scholar]
11. Glenn J. YOLOv11 release v8.3.50. 2024 [cited 2026 Jan 1]. Available from: https://github.com/ultralytics/ultralytics/releases/tag/v8.3.50. [Google Scholar]
12. Tian Y, Ye Q, Doermann D. YOLOv12: attention-centric real-time object detectors. arXiv:2502.12524v1. 2024. [Google Scholar]
13. Lei M, Li S, Wu Y, Hu H, Zhou Y, Zheng X, et al. YOLOv13: real-time object detection with hypergraph-enhanced adaptive visual perception. arXiv:2506.17733v2. 2025. [Google Scholar]
14. Dixit A, Singh P. Brain tumor detection using fine-tuned YOLO model with transfer learning. In: Gupta M, Ghatak S, Gupta A, Mukherjee AL, editors. Artificial intelligence on medical data. Singapore: Springer Nature; 2023. p. 363–71. [Google Scholar]
15. Elazab N, Gab-Allah WA, Elmogy M. A multi-class brain tumor grading system based on histopathological images using a hybrid YOLO and RESNET networks. Sci Rep. 2024;14(1):4584. [Google Scholar]
16. Raju N, Srinivas K, Rajesh C, Chintakindi BM. Advanced brain tumor detection using YOLO-11 in MRI images. Alex Eng J. 2025;132:181–90. [Google Scholar]
17. Dosovitskiy A, Beyer L, Kolesnikov A, Weissenborn D, Zhai X, Unterthiner T, et al. An image is worth 16 × 16 words: transformers for image recognition at scale. In: Transformers for image recognition at scale. In: Proceedings of the 9th International Conference on Learning Representations, ICLR 2021; 2021 May 3–7; Virtual. [Google Scholar]
18. Zhao Y, Lv W, Xu S, Wei J, Wang G, Dang Q, et al. DETRs beat YOLOs on real-time object detection. In: Proceedings of the 2024 IEEE/CVF Conference on Computer Vision and Pattern Recognition (CVPR); 2024 Jun 16–22; Seattle, WA, USA. p. 16965–74. [Google Scholar]
19. Zhu L, Liao B, Zhang Q, Wang X, Liu W, Wang X. Vision Mamba: efficient visual representation learning with bidirectional state space model. Proc Mach Learn Res. 2024;235:62429–42. [Google Scholar]
20. Mohammed YMA, El Garouani S, Jellouli I. A survey of methods for brain tumor segmentation-based MRI images. J Comput Des Eng. 2023;10(1):266–93. doi:10.1093/jcde/qwac141. [Google Scholar] [CrossRef]
21. Dorfner FJ, Patel JB, Kalpathy-Cramer J, Gerstner ER, Bridge CP. A review of deep learning for brain tumor analysis in MRI. npj Precis Oncol. 2025;9(1):2. doi:10.1038/s41698-024-00789-2. [Google Scholar] [CrossRef]
22. Natha S, Laila U, Gashim IA, Mahboob K, Saeed MN, Noaman KM. Automated brain tumor identification in biomedical radiology images: a multi-model ensemble deep learning approach. Appl Sci. 2024;14(5):2210. [Google Scholar]
23. Abdul S, Siraj M, Altamimi M, Shah A, Mahmud M. Automated brain tumor classification from magnetic resonance images using fine-tuned EfficientNet-B6 with bayesian optimization approach. Comput Model Eng Sci. 2025;145(3):4179–201. [Google Scholar]
24. Ge Y, Xu L, Wang X, Que Y, Piran MJ. A novel framework for multimodal brain tumor detection with scarce labels. IEEE J Biomed Health Inform. 2025;29(8):5368–80. [Google Scholar]
25. Cai Z, Zhou K, Liao Z. A systematic review of YOLO-based object detection in medical imaging: advances, challenges, and future directions. Comput Mater Contin. 2025;85(2):2255–303. [Google Scholar]
26. Murat AA, Kiran MS. A comprehensive review on YOLO versions for object detection. Eng Sci Technol Int J. 2025;70(20):102161. [Google Scholar]
27. Wang CY, Liao HYM. YOLOv1 to YOLOv10: the fastest and most accurate real-time object detection systems. APSIPA Trans Signal Inf Process. 2024;13(1):1–38. [Google Scholar]
28. Kang M, Ting CM, Ting FF, Phan RCW. RCS-YOLO: a fast and high-accuracy object detector for brain tumor detection. In: Proceedings of Medical Image Computing and Computer Assisted Intervention—MICCAI 2023; 2023 Oct 8–12; Vancouver, BC, Canada. [Google Scholar]
29. Xiong M, Wu A, Yang Y, Fu Q. Efficient brain tumor segmentation for MRI images using YOLO-BT. Sensors. 2025;25(12):3645. doi:10.3390/s25123645. [Google Scholar] [CrossRef]
30. Fang Y, Liao B, Wang X, Fang J, Qi J, Wu R, et al. You only look at one sequence: rethinking transformer in vision through object detection. Adv Neural Inf Process Syst. 2021;34:26183–97. [Google Scholar]
31. Zhang Z, Lu X, Cao G, Yang Y, Jiao L, Liu F. ViT-YOLO: transformer-based YOLO for object detection. In: Proceedings of the IEEE/CVF International Conference on Computer Vision Workshops; 2021 Oct 11–17; Virtual. p. 2799–808. [Google Scholar]
32. Dao T, Gu A. Transformers are SSMs: generalized models and efficient algorithms through structured state space duality. In: Proceedings of the International Conference on Machine Learning (ICML); 2024 Jul 21–27; Vienna, Austria. [Google Scholar]
33. Ma J, Li F, Wang B. U-Mamba: enhancing long-range dependency for biomedical image segmentation. arXiv:2401.04722. 2024. [Google Scholar]
34. Wang Z, Li C, Xu H, Zhu X, Li H. Mamba YOLO: a simple baseline for object detection with state space model. Proc AAAI Conf Artif Intell. 2025;39(8):8205–13. doi:10.1609/aaai.v39i8.32885. [Google Scholar] [CrossRef]
35. Yang H, Zhao M, Qiu Y, Mu M, Li Y, Zhang B. YOLOv10 fire detection method combined with Mamba attention mechanism. In: Proceedings of the 2025 5th International Symposium on Artificial Intelligence and Intelligent Manufacturing (AIIM); 2025 Sep 19–21; Chengdu, China. p. 1–4. [Google Scholar]
36. Liu P, Li A, Lu Y, Zhang T, Yang M, Zhou Q. PQGNet: perceptual query guided network for infrared small target detection. IEEE Trans Geosci Remote Sens. 2026;64:1–12. [Google Scholar]
37. Chen G, Dai K, Yang K, Hu T, Chen X, Yang Y, et al. Bracketing image restoration and enhancement with high-low frequency decomposition. In: Proceedings of the 2024 IEEE/CVF Conference on Computer Vision and Pattern Recognition Workshops (CVPRW); 2024 Jun 16–22; Seattle, WA, USA. p. 6097–107. [Google Scholar]
38. Li Z, Xue Y, Song Q. RFW-YOLO: a multi-scale feature fusion method for infrared anti-UAV detection based on WTConv. Adv Intell Comput Technol Appl. 2025;15843:52–62. [Google Scholar]
39. Finder SE, Amoyal R, Treister E, Freifeld O. Wavelet convolutions for large receptive fields. In: Leonardis A, Ricci E, Roth S, Russakovsky O, Sattler T, Varol G, editors. Computer vision—ECCV 2024. Berlin/Heidelberg, Germany: Springer; 2024. [Google Scholar]
40. Chang B, Shi H, Jin H, Liu G, Han L, Wei H, et al. ENHF-YOLO: enhanced high-frequency domain feature extraction of small targets in remote sensing. In: Proceedings of the ICASSP 2026—2026 IEEE International Conference on Acoustics, Speech and Signal Processing (ICASSP); 2026 May 4–8; Barcelona, Spain. p. 20227–31. [Google Scholar]
41. Ling H, Li L, Pan D, Zhang Y. FDL-YOLO: efficient real-time traffic detection network based on frequency domain learning. J Supercomput. 2025;81(8):966. [Google Scholar]
42. Sun L, Zheng L, Xin Y. FALS-YOLO: an efficient and lightweight method for automatic brain tumor detection and segmentation. Sensors. 2025;25(19):5993. [Google Scholar]
43. Menze BH, Jakab A, Bauer S, Kalpathy-Cramer J, Farahani K, Kirby J, et al. The multimodal brain tumor image segmentation benchmark (BRATS). IEEE Trans Med Imaging. 2015;34(10):1993–2024. doi:10.1109/tmi.2014.2377694. [Google Scholar] [CrossRef]
44. Bakas S, Akbari H, Sotiras A, Bilello M, Rozycki M, Kirby JS, et al. Advancing the cancer genome Atlas glioma MRI collections with expert segmentation labels and radiomic features. Sci Data. 2017;4(1):170117. doi:10.1038/sdata.2017.117. [Google Scholar] [CrossRef]
45. Bakas S, Reyes M, Jakab A, Bauer S, Rempfler M, Crimi A, et al. Identifying the best machine learning algorithms for brain tumor segmentation, progression assessment, and overall survival prediction in the BRATS challenge. arXiv:1811.02629. 2019. [Google Scholar]
46. Br35H HA. Br35H:: brain tumor detection 2020. IEEE Dataport. 2025. doi:10.21227/tbkk-q937. [Google Scholar] [CrossRef]
47. Zhang T, Liu P, Zhong Z, Zhang Z, Zhou Q. Beyond illumination: fine-grained detail preservation in extreme dark image restoration. arXiv:2508.03336. 2025. [Google Scholar]
48. Han D, Wang Z, Xia Z, Han Y, Pu Y, Ge C, et al. Demystify mamba in vision: a linear attention perspective. arXiv:2405.16605. 2024. [Google Scholar]
49. Su L, Ma X, Zhu X, Niu C, Lei Z, Zhou JZ. Can we get rid of handcrafted feature extractors? SparseViT: nonsemantics-centered, parameter-efficient image manipulation localization through spare-coding transformer. arXiv:2412.14598. 2024. [Google Scholar]
50. Liu X, Peng H, Zheng N, Yang Y, Hu H, Yuan Y. EfficientViT: memory efficient vision transformer with cascaded group attention. arXiv:2305.07027. 2023. [Google Scholar]
51. Rezatofighi H, Tsoi N, Gwak J, Sadeghian A, Reid I, Savarese S. Generalized intersection over union: a metric and a loss for bounding box regression. In: Proceedings of the 2019 IEEE/CVF Conference on Computer Vision and Pattern Recognition (CVPR); 2019 Jun 15–20; Long Beach, CA, USA. p. 658–66. [Google Scholar]
52. Zheng Z, Wang P, Liu W, Li J, Ye R, Ren D. Distance-IoU loss: faster and better learning for bounding box regression. Proc AAAI Conf Artif Intell. 2020;34(7):12993–3000. [Google Scholar]
53. Zheng Z, Wang P, Ren D, Liu W, Ye R, Hu Q, et al. Enhancing geometric factors in model learning and inference for object detection and instance segmentation. IEEE Trans Cybern. 2022;52(8):8574–86. doi:10.1109/tcyb.2021.3095305. [Google Scholar] [PubMed] [CrossRef]
54. Peng J, Li M, Wang B, Wang H. Omni contextual aggregation networks for high-fidelity image inpainting. IEEE Trans Circuits Syst Video Technol. 2025;35(6):6129–44. doi:10.1109/tcsvt.2025.3532321. [Google Scholar] [CrossRef]
55. Zhang Q, Wang W, Liu Y, Zhou L, Zhao H, An J, et al. Selective structured state space for multispectral-fused small target detection. arXiv:2505.14043. 2025. [Google Scholar]
56. Trang K, Ting FF, Vuong BQ, Ting CM. MANGA-YOLO: a Mamba-inspired YOLO model with group attention for breast mass detection in mammograms. Comput Biol Med. 2025;199:111339. [Google Scholar]
Cite This Article
 Copyright © 2026 The Author(s). Published by Tech Science Press.
This work is licensed under a Creative Commons Attribution 4.0 International License , which permits unrestricted use, distribution, and reproduction in any medium, provided the original work is properly cited.
 Downloads
 Citation Tools
