
 Login
Login Register
 Submit a Paper
 Propose a Special lssue
 Open Access
ARTICLE
Integrative transcriptomic analysis identifies resistin as a candidate serum marker associated with atopic dermatitis severity
Department of Dermatology, Second Xiangya Hospital, Hunan Key Laboratory of Medical Epigenomics, Clinical Medical Research Center of Major Skin Diseases and Skin Health of Hunan Province, Central South University, Changsha, China
* Corresponding Author: Jieyue Liao. Email:
# These authors contributed equally to this work
(This article belongs to the Special Issue: Inflammation in Disease: When Cytokine Conversations Tell the Whole Story)
European Cytokine Network 2026, 37(3), 331-348. https://doi.org/10.32604/ecn.2026.086314
Received 28 May 2026; Accepted 14 September 2026; Issue published 28 September 2026
 View Full Text
 Download PDF
Abstract
Background: Atopic dermatitis (AD) is associated with systemic immune dysregulation, but peripheral molecular markers that reliably reflect clinical severity remain insufficiently validated. Using complementary bulk and single-cell transcriptomics, we prioritized peripheral markers and evaluated them in independent clinical cohorts. Methods: Public peripheral blood mononuclear cell (PBMC) transcriptomes were analyzed by differential-expression analysis, weighted gene co-expression network analysis (WGCNA) with power-sensitivity and preservation assessments, immune-cell deconvolution, LASSO, and random forest. Descriptive single-gene receiver operating characteristic (ROC) curves summarized candidate discrimination in the discovery cohort. Selected transcripts were evaluated by RT-qPCR in a PBMC cohort, and serum resistin by ELISA in a separate non-overlapping cohort. Severity associations were examined using multivariable models adjusted for age, sex, and BMI. Results: After correction for multiple module–trait comparisons, WGCNA identified an internally preserved conventional module inversely associated with AD. Power-stable WGCNA-unassigned genes formed an exploratory pool intersected with AD-associated differentially expressed genes. LASSO retained RETN, AZU1, RNASE3, and MS4A3 as computational candidates, and all four genes received relatively high importance rankings in the complementary random-forest analysis. Descriptive within-cohort analyses yielded apparent areas under the curve of 0.750, 0.736, 0.706, and 0.689, respectively, and were not interpreted as independent diagnostic validation. RT-qPCR showed higher RETN, AZU1, and RNASE3 expression in AD PBMC preparations. Deconvolution and single-cell analysis supported a predominantly classical-monocyte-associated expression context for RETN. Serum resistin concentrations were higher in AD and remained positively associated with SCORAD and DLQI after adjustment, although bootstrap analyses indicated uncertainty. Conclusions: Resistin is a candidate peripheral marker associated with AD severity. Its mechanistic significance and clinical utility require functional studies and independent prospective longitudinal validation.Keywords
Supplementary Material
Supplementary Material FileAtopic dermatitis (AD) is a prevalent, chronic, and relapsing inflammatory skin disease characterized primarily by intense pruritus, eczematous lesions, and xerosis, which profoundly impairs the quality of life of affected individuals [1–4]. For a long time, AD was predominantly regarded as a localized disorder triggered by epidermal barrier dysfunction; however, accumulating evidence underscores that AD is fundamentally a systemic disease accompanied by generalized immune dysregulation, potentially involving multiple extra-cutaneous organs such as the respiratory system (e.g., allergic rhinitis and asthma) and the gastrointestinal tract (e.g., food allergy and eosinophilic esophagitis), as well as the metabolic system (e.g., obesity and diabetes) and the cardiovascular systems (cardiovascular events), frequently accompanied by severe psychological burdens like anxiety and depression [5–9].
In patients with AD, robust inflammatory responses are not only restricted to localized skin lesions but are also manifested as significant alterations in the peripheral immune microenvironment, including the aberrant activation of peripheral blood mononuclear cells (PBMCs), imbalance of T-cell subsets, and the systemic release of various pro-inflammatory cytokines such as IL-4 and IL-13 [10–12]. During the systemic progression of AD, abnormal fluctuations of circulating cytokines and their complex crosstalk play a central role, collectively forming a highly interconnected peripheral inflammatory network. Although canonical type 2 cytokines, including IL-4 and IL-13, are well-established regulators of local skin inflammation and epidermal barrier dysfunction, they remain insufficient to fully explain the extensive immune remodeling observed in the peripheral blood of AD patients. In recent years, an increasing number of pro-inflammatory cytokines derived from myeloid and epithelial cells have been shown to participate in the systemic propagation of inflammation in AD and may serve as critical links between localized skin lesions and systemic immune dysregulation. Meanwhile, deeper investigation into the peripheral cytokine network in AD has also accelerated the development of disease-associated biomarkers.
Current management of AD generally follows a stepwise, severity-oriented strategy. According to contemporary guideline-based approaches, basic measures such as patient education, trigger or allergen avoidance, and regular use of emollients constitute the foundation of treatment across disease severities [13,14]. For mild-to-moderate disease, topical anti-inflammatory therapies, including topical corticosteroids and topical calcineurin inhibitors, remain central options, while wet-wrap therapy and phototherapy may be considered in selected patients with insufficient control. The therapeutic landscape has further expanded with newer non-steroidal topical agents, including topical phosphodiesterase-4 inhibitors such as difamilast ointment, recently approved for the treatment of mild-to-moderate AD [15,16]. For moderate-to-severe or refractory AD, systemic therapy may be required when adequate topical treatment and phototherapy fail to achieve sufficient disease control, with available options including conventional immunosuppressants, biologics targeting type 2 inflammatory pathways, and oral Janus kinase inhibitors. Despite these advances, treatment selection and response monitoring still largely depend on clinical severity scores and conventional laboratory indicators, underscoring the need for objective, minimally invasive biomarkers that reflect systemic immune activity.
Against this therapeutic background, the identification of accurate peripheral blood biomarkers has become a critical strategy for improving disease monitoring, patient stratification, and individualized management in AD. In clinical practice, disease monitoring and severity assessment of AD primarily rely on semi-quantitative scoring systems, including the SCORing Atopic Dermatitis (SCORAD) index, the Eczema Area and Severity Index (EASI), and the Dermatology Life Quality Index (DLQI) [17–19]. However, these clinical scoring tools are inherently subjective, susceptible to inter-observer variability, and unable to precisely reflect underlying molecular alterations or real-time disease activity. In addition, although conventional laboratory indicators such as serum immunoglobulin E (IgE) are widely used, they predominantly reflect extrinsic allergic phenotypes and do not consistently correlate with disease activity across all patient populations [20]. Against this background, circulating peripheral cytokines closely associated with disease activity have gradually emerged as promising candidate biomarkers for AD. Several key cytokines, including thymus and activation-regulated chemokine (TARC/CCL17) and macrophage-derived chemokine (MDC/CCL22), have subsequently been proposed as serological biomarkers for AD. Nevertheless, most of these candidate molecules were identified through hypothesis-driven strategies based on established inflammatory pathways, particularly the Th2/Th22 axis. Although such approaches possess substantial biological rationale, they inevitably carry the risk of overlooking other circulating molecules with potential clinical relevance. In recent years, the integration of high-throughput sequencing technologies, such as RNA sequencing (RNA-seq), with artificial intelligence (AI)-based machine learning algorithms has provided a powerful and unbiased analytical framework for dimensionality reduction and feature extraction from large-scale multi-omics datasets, thereby facilitating the discovery of molecular biomarkers for complex inflammatory skin diseases [21–23]. However, the majority of currently available AD biomarkers are still primarily derived from lesional skin tissues (skin biopsies) or dermal interstitial fluid. Although these tissue-based biomarkers can directly reflect local immune characteristics, skin biopsy is an invasive procedure that may cause trauma and discomfort to patients. Moreover, the spatial heterogeneity of skin lesions further limits its broad application in dynamic disease monitoring. In contrast, peripheral blood biomarkers possess several notable advantages, including minimal invasiveness, ease of acquisition, and the ability to reflect systemic immune homeostasis. Nevertheless, there remains a lack of peripheral blood biomarkers that have been validated through large-scale transcriptomic analyses and can accurately reflect disease severity in AD. PBMCs contain circulating monocytes and lymphocyte subsets that participate in the systemic immune responses associated with AD. Their transcriptomes can capture both cell-intrinsic activation programs and changes in circulating immune-cell composition that may accompany disease activity and treatment. Previous cross-tissue transcriptomic analysis demonstrated that PBMC transcriptional modules were associated with specific cutaneous phenotypes in AD, while longitudinal changes in PBMC modules were aligned with clinical severity trajectories and treatment history. Independent blood transcriptomic studies have also identified inflammatory, myeloid, and eosinophil-related expression signatures associated with AD disease activity and treatment response [24,25]. These observations support the use of PBMC transcriptomics as a minimally invasive discovery platform for systemic candidate biomarkers. Nevertheless, PBMC transcriptional changes are not direct surrogates for molecular activity within skin lesions and may be influenced by immune-cell composition, age, treatment exposure, comorbidities, and other systemic factors. We therefore used PBMC transcriptomics for candidate discovery and required independent RT-qPCR and circulating-protein validation, rather than assuming a direct correspondence between PBMC expression and cutaneous disease activity.
In this study, we used complementary bulk and single-cell PBMC transcriptomic analyses to identify candidate peripheral markers associated with AD. Differential-expression analysis and WGCNA, including multiple-testing correction, soft-thresholding sensitivity analysis and internal preservation assessment, were applied to a public bulk PBMC dataset. Because genes not assigned to conventional WGCNA modules do not constitute a biologically coherent module, genes that retained an unassigned classification across the tested powers were used only as an exploratory pool for intersection with AD-associated differentially expressed genes. Protein-interaction analysis was followed by LASSO-based candidate selection, with random forest used as a complementary feature-ranking approach. Apparent single-gene discrimination within the discovery cohort was treated as descriptive rather than as independently validated diagnostic performance.
Selected candidates were subsequently evaluated using RT-qPCR in an independent PBMC cohort. Single-cell RNA sequencing and immune-cell deconvolution were used to examine their cellular context. The RETN-encoded protein resistin was further assessed by ELISA in a separate, non-overlapping serum cohort, and its cross-sectional associations with SCORAD, DLQI and total IgE were examined. Given the observational design and limited clinical sample size, these analyses were intended to prioritize and preliminarily evaluate candidate peripheral markers rather than establish diagnostic utility, longitudinal predictive value or causal inflammatory mechanisms.
All datasets analyzed in this study were retrieved from the Gene Expression Omnibus (GEO) database (https://www.ncbi.nlm.nih.gov/geo/).
The processed gene-level expression matrix of GSE256050 was downloaded from the Gene Expression Omnibus database. The complete processed matrix contained 77 samples, including 48 PBMC samples and 29 skin samples. The PBMC component comprised 28 patients with AD and 20 healthy controls: 10 childhood AD samples, nine adult AD samples, nine elderly AD samples, 10 adult healthy-control samples, and 10 elderly healthy-control samples [26]. The skin component comprised 23 AD lesion samples and six healthy skin samples. Because the processed dataset did not include a corresponding childhood healthy-control PBMC group, the 10 childhood AD PBMC samples were excluded a priori. Including childhood AD samples without childhood controls would have made childhood age group inseparable from disease status and could therefore have introduced substantial age-related confounding. Adult and elderly PBMC samples were retained because corresponding healthy-control samples were available for both age groups. Accordingly, the final bulk-transcriptomic cohort included 38 PBMC samples: 18 patients with AD, comprising nine adults and nine elderly individuals, and 20 healthy controls, comprising 10 adults and 10 elderly individuals. This sample selection was defined according to age-group comparability and sample availability and was not based on gene-expression results.
All 29 skin samples, including 23 AD lesion samples and six healthy skin samples, were excluded because the present study was specifically designed to identify peripheral blood-derived candidate biomarkers. No bulk skin RNA-sequencing data from GSE256050 were analyzed in the present study. GSE189188 represents high-throughput single-cell RNA sequencing (scRNA-seq) datasets obtained from PBMC samples of AD patients and healthy controls. The overall analytical workflow of this study is depicted in figure 1.
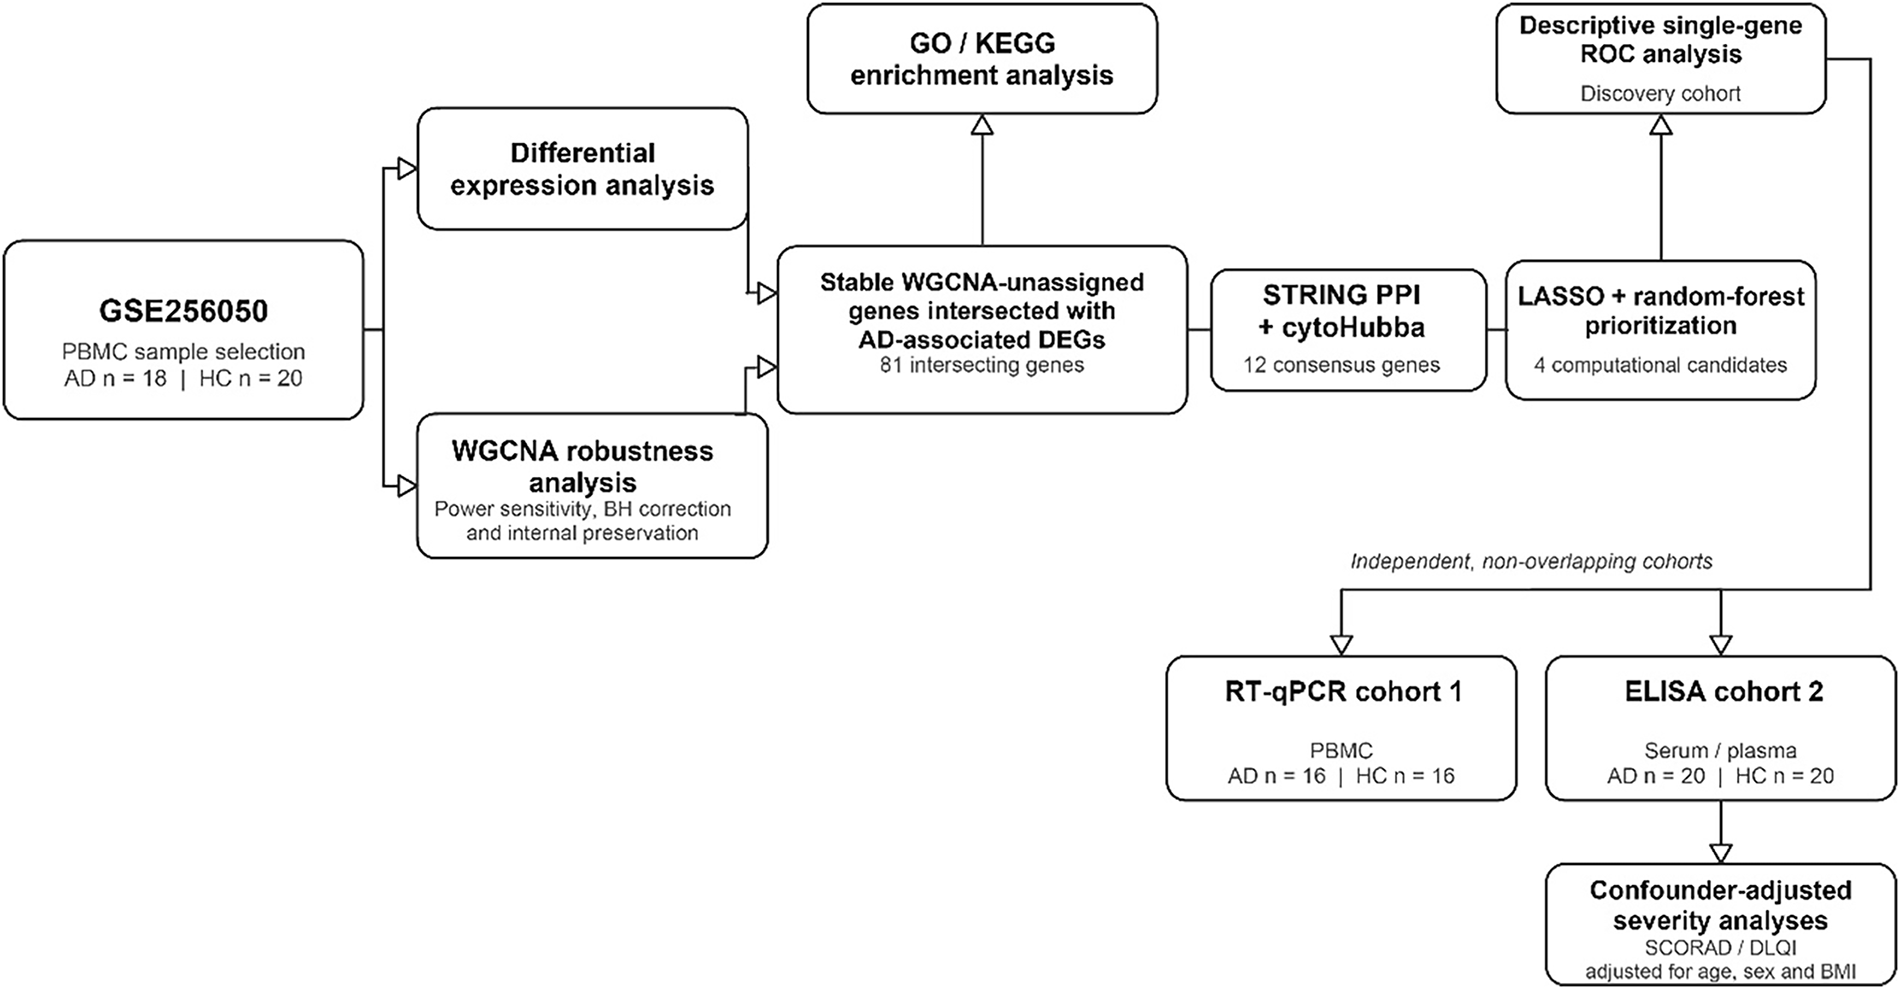
Figure 1: Schematic of the research workflow.
Weighted gene co-expression network analysis (WGCNA) was performed using the ‘WGCNA’ package (version 1.74) in R 4.6.1 (R Foundation for Statistical Computing, Vienna, Austria) [27]. Following prespecified sample selection and quality control, the expression matrix comprised 38 PBMC samples, including 18 patients with AD and 20 healthy controls, and 9051 genes that passed the variability filter. An unsigned weighted co-expression network was constructed using Pearson correlations. Candidate soft-thresholding powers from 1 to 30 were evaluated by jointly examining the scale-free topology fit and mean connectivity. The automated estimate was power 16; however, power 20 was retained as the reference setting because the topology-fit curve had reached a stable plateau while maintaining non-zero network connectivity. To determine whether the results depended on this choice, the complete network analysis was repeated at powers 16, 18, 20, 22 and 24.
At each power, the adjacency matrix was transformed into an unsigned topological overlap matrix. Genes were clustered using average-linkage hierarchical clustering and assigned to conventional co-expression modules using dynamic tree cutting with a minimum module size of 50, deepSplit = 2 and a module-merging threshold of 0.25. Module eigengenes were correlated with binary disease status using Pearson correlation. p-values were adjusted using the Benjamini–Hochberg procedure across all displayed module–trait comparisons within each network analysis. Both nominal p-values and BH-adjusted false discovery rates were retained in the supplementary results.
In accordance with WGCNA terminology, genes labelled grey were considered unassigned genes rather than members of a conventional co-expression module. Consequently, no formal grey-module eigengene or intramodular membership interpretation was applied. The first principal component of the grey-labelled genes was calculated only as a descriptive summary of their aggregate expression. Because the sign of a principal component is mathematically arbitrary, its direction was standardized such that higher PC1 scores corresponded to AD; this orientation did not alter the absolute correlation, explained variance, p-value or BH-adjusted FDR.
Robustness across soft-thresholding powers was evaluated by comparing module sizes, module–trait associations and the Jaccard overlap between each reference module at power 20 and its best-matching module at the other tested powers. For grey-labelled genes, the frequency with which each gene remained unassigned across powers was calculated. Internal module preservation was further evaluated by stratifying the cohort into two balanced subsets, each containing nine patients with AD and 10 healthy controls. Networks were constructed independently in each half, and preservation was assessed bidirectionally using the WGCNA modulePreservation function with 200 permutations. Zsummary and medianRank were reported for conventional modules. Grey-labelled genes were excluded from formal module-preservation interpretation because they do not constitute a conventional module.
2.3 Differential Expression Analysis
Differential expression analysis between the AD and healthy control groups was performed using the GEO2R (https://www.ncbi.nlm.nih.gov/geo/geo2r/?acc=GSE256050) online analysis tool provided by the National Center for Biotechnology Information Gene Expression Omnibus (NCBI GEO). The AD and healthy control samples were assigned to their respective groups before analysis. To account for multiple comparisons, the p-values generated by GEO2R were adjusted using the Benjamini–Hochberg false discovery rate procedure. Differentially expressed genes (DEGs) were defined as genes with a Benjamini–Hochberg-adjusted p-value (FDR) <0.05 and an absolute log2 fold change (|log2FC|) ≥0.5. Genes with log2FC ≥0.5 and log2FC ≤−0.5 were classified as upregulated and downregulated DEGs, respectively. Only genes meeting both the FDR and effect-size thresholds were retained for subsequent intersection, functional enrichment, protein–protein interaction network, and candidate-gene prioritization analyses.
2.4 Functional Enrichment Analysis
To characterize the functional landscape of the candidate genes, over-representation analysis was performed on the 81 genes shared between the AD-associated DEGs and the WGCNA-unassigned gene set. Gene Ontology (GO) and Kyoto Encyclopedia of Genes and Genomes (KEGG) enrichment analyses were conducted using the R package clusterProfiler (version 4.20.0), together with the organism annotation package org.Hs.eg.db (version 3.23.1) and the KEGG organism code “hsa” for Homo sapiens. No custom background universe was specified; therefore, enrichGO and enrichKEGG used the genes annotated in their respective organism and pathway databases as the default enrichment backgrounds. GO analysis was restricted to the Biological Process and Molecular Function ontologies because the analysis was intended to characterize the biological processes and molecular activities represented by the candidate genes rather than their subcellular localization. p-values were adjusted using the Benjamini–Hochberg procedure, and terms with an adjusted p-value <0.05 were considered statistically significant. The top-ranked terms were displayed according to adjusted p-value.
A protein functional-association network was constructed using STRING version 12.0 (accessed 28 October 2025), with Homo sapiens selected as the organism (NCBI taxonomy ID 9606). The full STRING network was generated using evidence-mode edge representation and a minimum required interaction score of 0.150. All available evidence sources were enabled, including text mining, experiments, curated databases, co-expression, genomic neighborhood, gene fusion and gene co-occurrence. No additional first- or second-shell interactors were added. Query proteins without qualifying interactions were retained as disconnected nodes but did not contribute to edge-based topology rankings. To explore the functional associations among the identified genes, protein-protein interaction (PPI) networks were subsequently visualized using Cytoscape software (version 3.10.3). Furthermore, the cytoHubba plugin (version 0.1) was employed to pinpoint central hub genes by evaluating their topological significance within the network. Five cytoHubba algorithms were applied: Degree, density of maximum neighborhood component (DMNC), edge percolated component (EPC), maximal clique centrality (MCC), and maximum neighborhood component (MNC).
2.6 Machine-Learning-Based Candidate Prioritization and Descriptive ROC Analysis
Twelve genes consistently ranked by all five cytoHubba algorithms were entered into two complementary machine-learning-based feature-prioritization procedures. All analyses were performed in the discovery cohort comprising 18 patients with AD and 20 healthy controls. Because of the limited sample size, LASSO regression and random forest were used to rank and prioritize candidate genes rather than to construct a clinically validated diagnostic classifier.
LASSO-penalized binomial regression was implemented using the ‘glmnet’ package (version 4.1-10) with α = 1. Predictor standardization was performed internally by ‘glmnet’ [28]. The regularization parameter λ was selected by tenfold cross-validation using binomial deviance as the optimization criterion. Both the minimum-deviance value (lambda.min) and the one-standard-error value (lambda.1se) were displayed, and genes with non-zero coefficients at lambda.min were retained.
Random-forest analysis was performed using the ‘randomForest’ package (version 4.7-1.2) [29]. A total of 500 trees were grown, and the number of variables considered at each split was left at the package default for classification. Overall and class-specific out-of-bag error rates were monitored across trees. Candidate genes were ranked using the Mean Decrease in Gini impurity. Random forest analysis was performed as a complementary feature-ranking approach. The random-forest importance ranks of the genes retained by LASSO were examined to determine whether their prioritization was supported by an alternative algorithm. For descriptive visualization of cross-method ranking concordance, the ten highest-ranked random-forest features were compared with the four LASSO-retained genes using a Venn diagram. The top-10 boundary was used only as a visualization convention and was not treated as a statistically optimized cutoff or an independent feature-selection criterion. Candidate-gene retention was determined by LASSO, whereas random forest provided complementary ranking support.
Genes retained by LASSO were defined as computational candidates. Random-forest importance rankings were subsequently used to provide complementary evidence regarding the relative importance of these candidates. Because feature selection was performed using the complete discovery cohort rather than exclusively within an independent training subset, subsequent ROC analyses were treated as descriptive assessments of apparent within-cohort discrimination. Normalized expression of each candidate gene was entered directly as a continuous marker; no ANN-derived probability or multigene diagnostic score was used. AUCs and 95% confidence intervals were estimated using 2000 stratified bootstrap replicates. These estimates were not interpreted as independent or externally validated diagnostic performance.
2.7 Immune Infiltration and Single-Cell Analysis
Relative immune-cell fractions were estimated using the CIBERSORT R script (version 1.04) with the LM22 leukocyte signature matrix. The analysis was performed in relative mode with 1000 permutations [30]. The associations between candidate biomarkers and these immune populations were evaluated through Pearson correlation analysis. For single-cell analysis, the GSE189188 dataset was processed into a Seurat object using R with the ‘Seurat’ package (version 5.1.0). Following standardized quality control and filtration, we executed Principal Component Analysis (PCA) on the 2000 most variable genes. Unsupervised cell clustering was conducted utilizing the graph-based FindNeighbors and FindClusters functions, followed by Uniform Manifold Approximation and Projection (UMAP) for two-dimensional visualization. To identify cluster-specific marker genes, the FindAllMarkers function was employed using the Wilcoxon rank-sum test (filtering thresholds: log2 fold change ≥ 0.25, min.pct = 0.25). Finally, major cell populations and fine-grained sub-clusters (e.g., myeloid subtypes) were manually annotated based on the expression profiles of classical, well-established canonical marker genes.
2.8 Clinical Validation Cohorts
Two mutually exclusive retrospective clinical validation cohorts were assembled according to the availability of stored biospecimens. Cohort 1 comprised 16 patients with AD and 16 healthy controls with available PBMC samples and was used exclusively for RT-qPCR validation. Cohort 2 comprised 20 patients with AD and 20 healthy controls with available serum samples and was used for ELISA measurement of circulating resistin. Detailed SCORAD, DLQI and serum IgE data were available for the 20 patients with AD in cohort 2. No participants overlapped between the two cohorts.
2.9 Real-Time Quantitative PCR
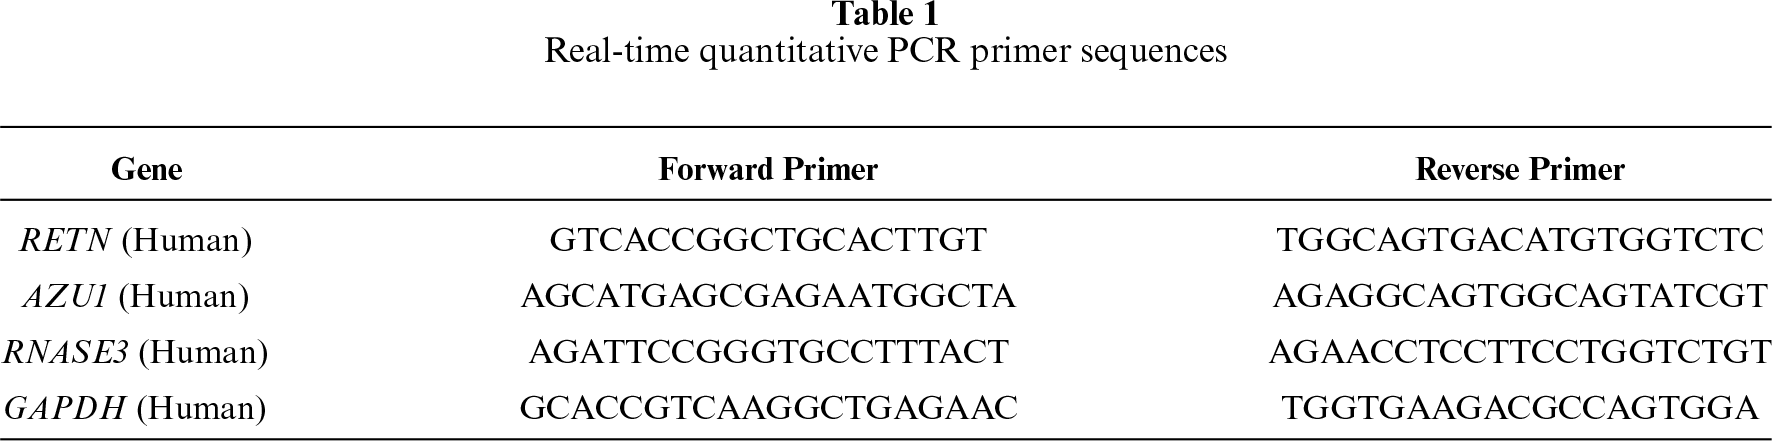
A retrospective cohort of PBMC samples from 16 patients with atopic dermatitis (AD) and 16 healthy controls was assembled for experimental validation by RT-qPCR. Peripheral blood for PBMC isolation was collected in EDTA-anticoagulated tubes. PBMCs were isolated within 24 h after collection, lysed in TRIzol reagent (Cat. No. 15596026, Invitrogen, Carlsbad, CA, USA), and stored at −80°C until RNA extraction. The study protocol was reviewed and approved by the Ethics Committee of the Second Xiangya Hospital, Central South University (Approval number: LYF20260052). Total RNA was extracted using TRIzol reagent, and first-strand complementary DNA (cDNA) was synthesized using Evo M-MLV RT Reaction Mix (Cat. No. AG11728, Accurate Biology, Changsha, China). Quantitative PCR was performed on a 7900 Real-Time PCR System (Applied Biosystems, Foster City, CA, USA) using SYBR Green Premix Pro Taq HS qPCR Kit (Cat. No. AG11701, Accurate Biology). Each reaction was prepared in a final volume of 20 μL containing 10 μL of 2× SYBR Green Pro Taq HS Premix, 0.4 μL of forward primer (10 μM), 0.4 μL of reverse primer (10 μM), cDNA template corresponding to no more than 100 ng of input RNA, 0.4 μL of ROX Reference Dye (20 μM), and RNase-free water to 20 μL. The cDNA template volume did not exceed 10% of the total reaction volume. The amplification program consisted of an initial denaturation at 95°C for 30 s, followed by 40 cycles of denaturation at 95°C for 5 s and annealing/extension at 60°C for 30 s. A dissociation-curve analysis was subsequently performed to verify amplification specificity. Relative gene expression was calculated using the 2−ΔΔCt method, with GAPDH serving as the reference gene for normalization. The primer sequences are provided in table 1.
2.10 Enzyme-Linked Immunosorbent Assay (ELISA)
Peripheral blood for serum preparation was collected in tubes without anticoagulant. Following clot formation and centrifugation, serum was aliquoted and stored at −80°C until ELISA measurement. Serum resistin concentrations were quantified using a commercially available Human Resistin ELISA Kit (Cat. No. CSB-E06884h; Cusabio Biotech, Wuhan, China) in strict accordance with the manufacturer’s instructions. Briefly, serum samples and recombinant standards were added to the provided pre-coated 48-well microplate, followed by sequential incubations with a biotin-conjugated detection antibody and a horseradish peroxidase (HRP)-avidin conjugate. The colorimetric reaction was developed using TMB substrate and terminated with a stop solution. The optical density (OD) was measured at 450 nm using a Tecan Infinite microplate reader (Tecan, Männedorf, Switzerland). Absolute concentrations were calculated based on the generated standard curve.
2.11 Confounder-Adjusted Analysis of Serum Resistin and Clinical Severity
Because serum resistin concentrations were right-skewed, resistin values were log2-transformed before regression analysis. Among the 20 patients with AD in the ELISA cohort, separate multivariable linear-regression models were constructed for SCORAD and DLQI, with log2-transformed serum resistin concentration as the exposure of interest. Age, sex and body mass index (BMI) were selected a priori as adjustment variables because of their potential associations with circulating resistin concentrations and clinical disease severity. The regression coefficient for log2-transformed resistin therefore represents the estimated difference in clinical score associated with a doubling of serum resistin concentration.
Given the limited sample size, the primary models were restricted to age, sex and BMI to reduce the risk of overfitting. Heteroscedasticity-consistent HC3 standard errors were used, and 95% confidence intervals were calculated for the adjusted regression coefficients. Benjamini–Hochberg correction was applied across the two primary clinical outcomes. Model influence was examined using Cook’s distance. As a sensitivity analysis, percentile confidence intervals were estimated using 10,000 nonparametric bootstrap resamples.
Data distributions were assessed using the Shapiro–Wilk test and visual inspection. Between-group comparisons were performed using two-sided Mann–Whitney U tests for non-normally distributed continuous variables. Serum resistin concentrations were right-skewed and were therefore log2-transformed before correlation and regression analyses. Unadjusted associations of log2-transformed serum resistin concentrations with SCORAD, total serum IgE and DLQI were evaluated using two-sided Pearson correlation tests. Pearson’s correlation coefficients, 95% confidence intervals and two-sided p-values were reported. Separate multivariable linear-regression models were subsequently fitted for SCORAD and DLQI using log2-transformed serum resistin as the exposure of interest, with adjustment for age, sex and BMI. Where multiple related hypotheses were tested, p-values were adjusted using the Benjamini–Hochberg procedure. All tests were two-sided, and adjusted p-value <0.05 was considered statistically significant. Statistical analyses and figure generation were performed using R version 4.6.1 with the relevant package versions reported above.
3.1 WGCNA Reveals an Inverse Module–AD Association and Disease-Related Signals among Unassigned Genes
After quality control, PBMC expression profiles from 38 participants, including 18 patients with atopic dermatitis (AD) and 20 healthy controls (HCs), were included in the weighted gene co-expression network analysis (WGCNA). Hierarchical clustering did not identify any samples requiring exclusion, and 9051 genes that passed the variability filter were retained for network construction (figure 2A). An extended assessment of soft-thresholding powers from 1 to 30 showed that the signed scale-free topology fit increased rapidly and approached a plateau from approximately power 16 onwards, whereas mean connectivity progressively decreased with increasing power (figure 2B,C). The automated power estimate was 16; however, power 20, as used in the original analysis, was retained as the reference setting, and powers 16, 18, 20, 22 and 24 were subsequently examined in sensitivity analyses. At power 20, the reference network identified three conventional co-expression modules—brown, yellow and red—containing 4373, 3183 and 85 genes, respectively. A further 1410 genes were labelled grey because they were not assigned to a conventional co-expression module by dynamic tree cutting (figure 2D).
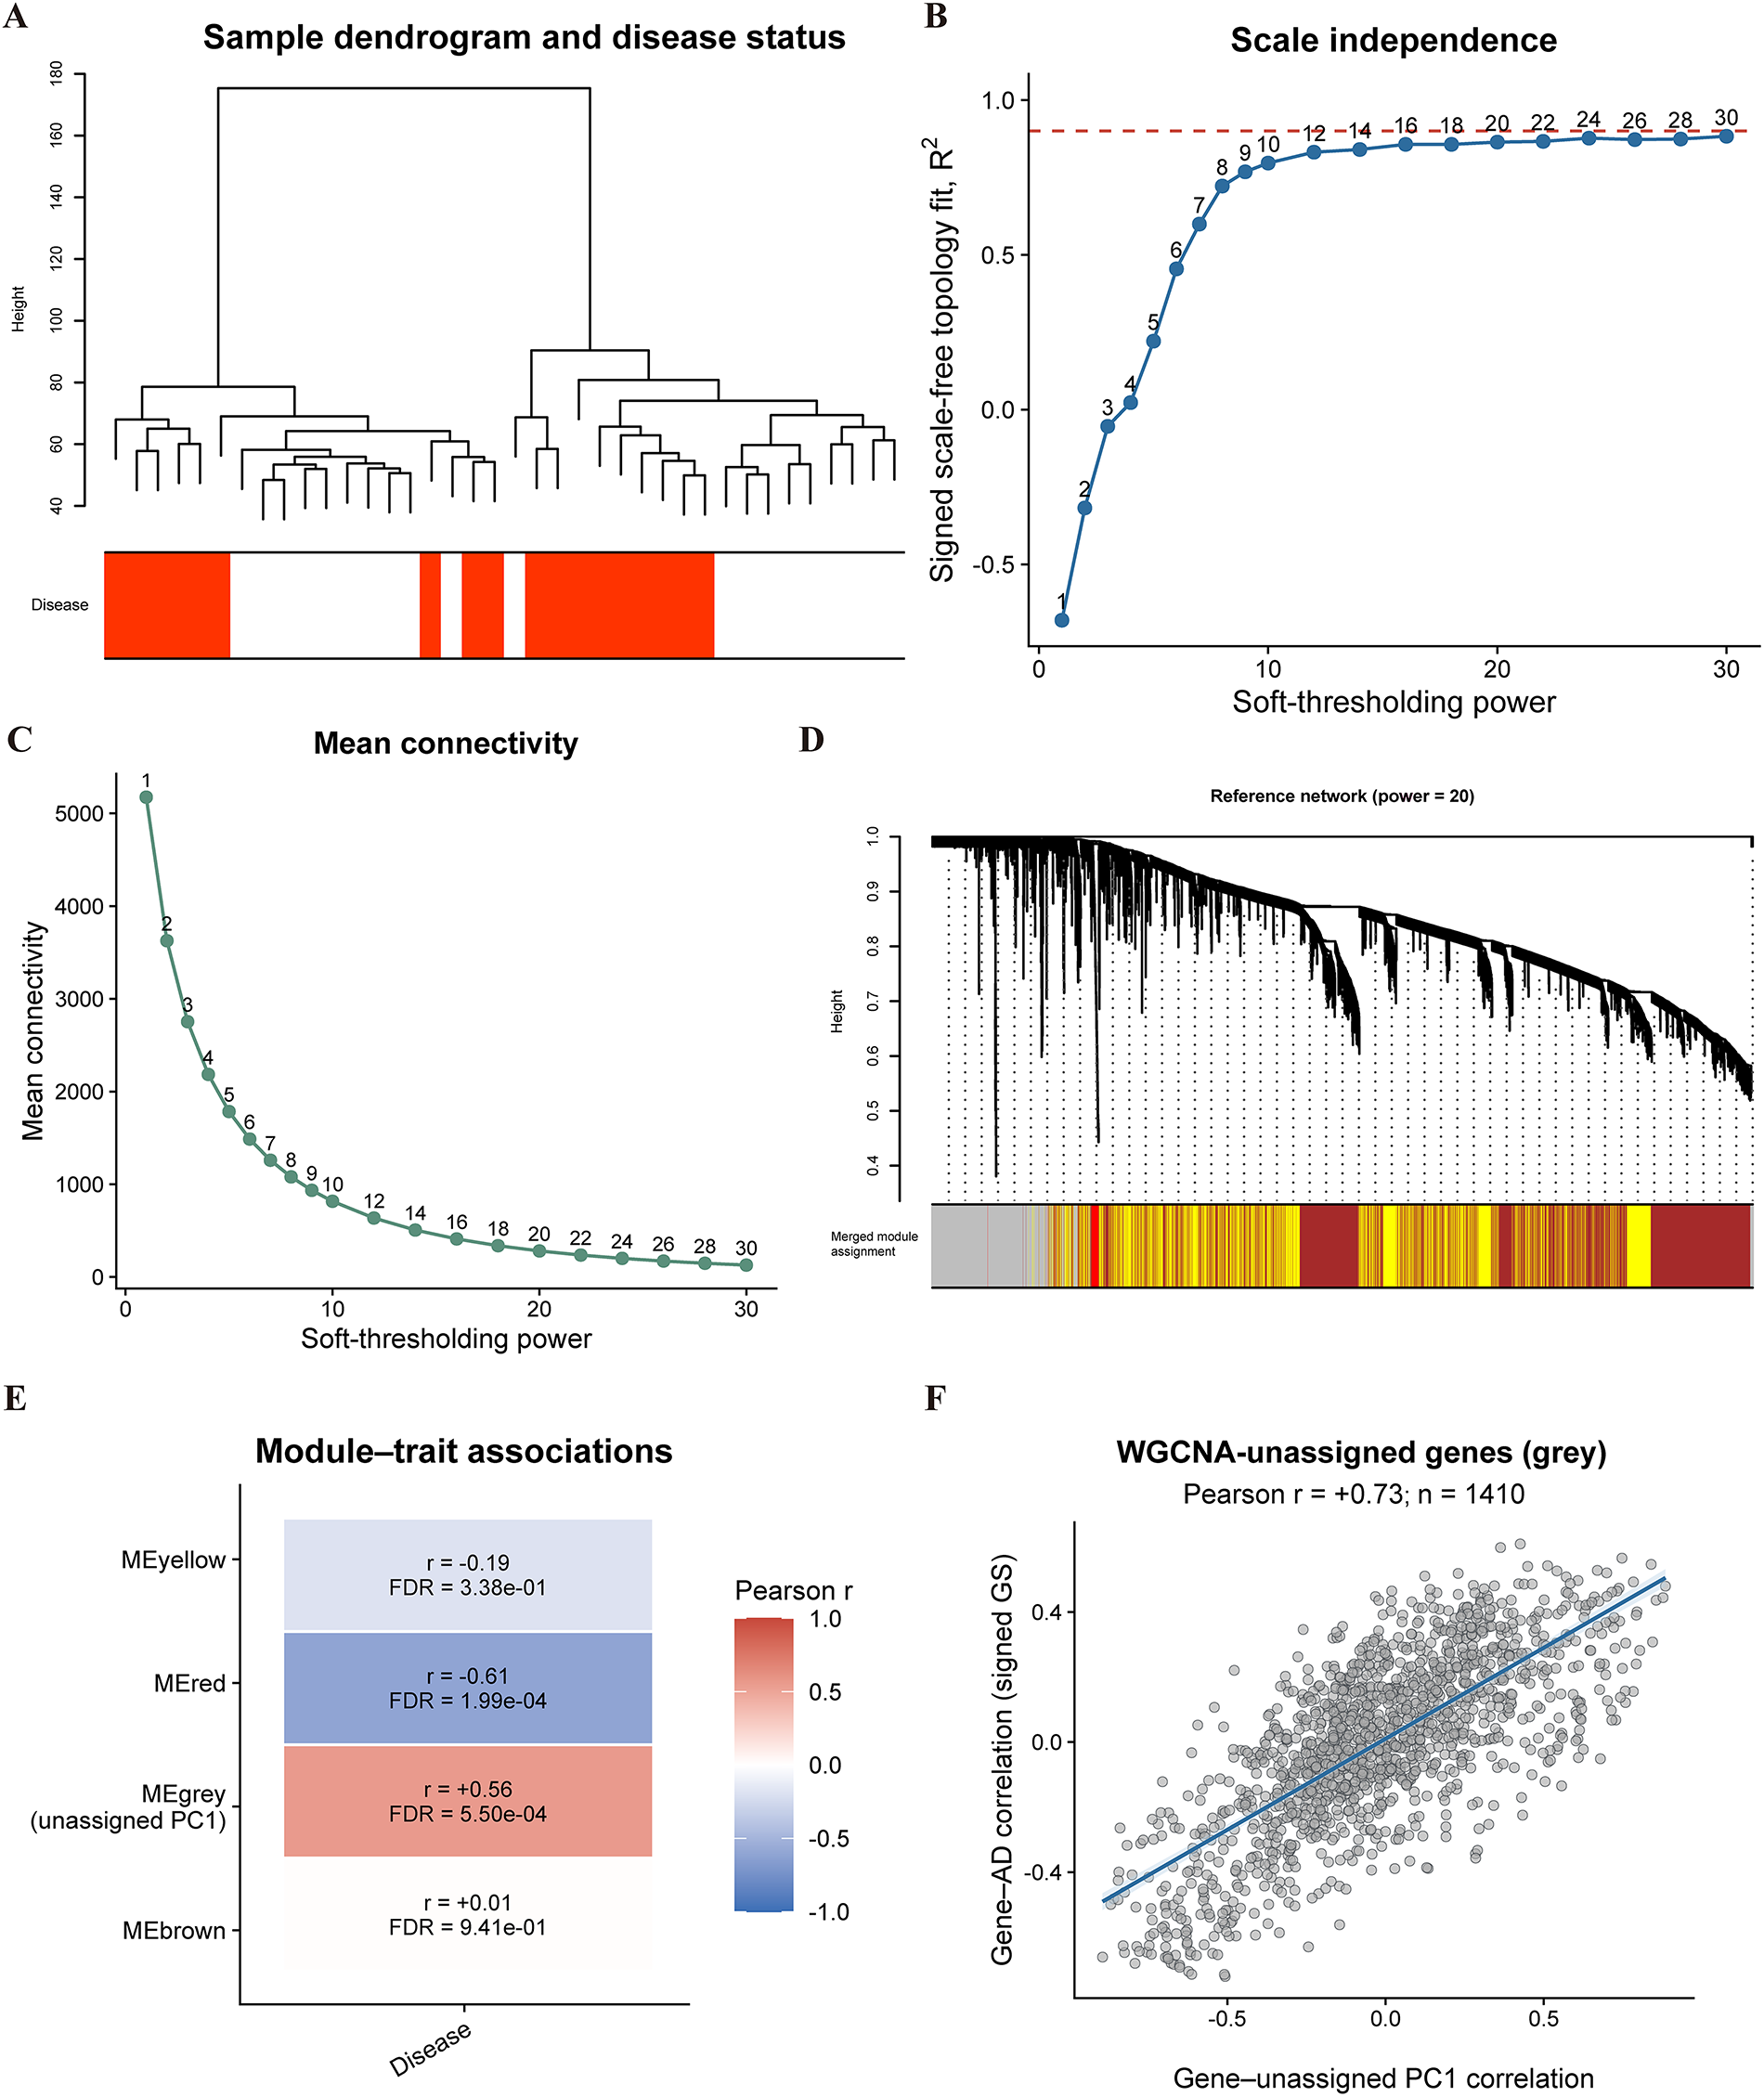
Figure 2: Construction of the PBMC co-expression network and evaluation of AD-associated transcriptional patterns. (A) Hierarchical clustering of 38 PBMC samples, including 18 patients with atopic dermatitis (AD) and 20 healthy controls (HCs). The colour bar indicates disease status, Red = AD, White = HC. No samples were excluded on the basis of hierarchical clustering. (B) Signed scale-free topology fit across soft-thresholding powers from 1 to 30. The dashed horizontal line denotes the (R2 = 0.90) reference level. The topology fit increased rapidly and approached a plateau from approximately power 16 onwards. (C) Mean network connectivity across the tested soft-thresholding powers. Power 20, as used in the original analysis, was retained as the reference setting after jointly considering the topology-fit plateau and mean connectivity. (D) Gene dendrogram and final assignments obtained from the reference network at power 20. The brown, yellow and red colours denote conventional co-expression modules containing 4373, 3183 and 85 genes, respectively. Grey denotes 1410 genes that were not assigned to a conventional module. (E) Associations between conventional module eigengenes or the descriptive unassigned-gene PC1 and AD status. Each cell shows the Pearson correlation coefficient and the Benjamini–Hochberg-adjusted false discovery rate (BH-FDR). The red-module eigengene was significantly inversely associated with AD. The unassigned-gene PC1 was oriented such that higher scores corresponded to AD; this sign convention did not affect the absolute correlation or statistical significance. Grey-labelled genes were not interpreted as a conventional co-expression module. (F) Relationship between each unassigned gene’s correlation with the direction-oriented unassigned-gene PC1 and its signed correlation with AD status. Each point represents one of the 1410 WGCNA-unassigned genes. The blue line represents the linear regression fit, and the shaded region indicates the 95% confidence interval. The reported gene-level correlation was interpreted descriptively and was not used as evidence that the grey-labelled genes constituted a coherent module. AD, atopic dermatitis; HC, healthy control; WGCNA, weighted gene co-expression network analysis; PC1, first principal component; GS, gene significance; BH-FDR, Benjamini–Hochberg false discovery rate.
Following Benjamini–Hochberg correction, the red module showed the strongest association with AD status (r = −0.609, BH-FDR <0.001), whereas neither the yellow (r = −0.190, BH-FDR = 0.34) nor the brown module (r = 0.012, BH-FDR = 0.94) reached statistical significance (figure 2E). Under the native WGCNA eigengene orientation, the red-module eigengene was inversely associated with AD. Although this inverse association may represent a biologically relevant transcriptional program, its overall direction was not well aligned with the specific objective of the downstream analysis, which was to prioritize candidate biomarkers positively associated with AD and potentially elevated in the circulation. Meanwhile, the limited disease associations of the yellow and brown modules indicated that the conventional modules did not provide a positively AD-associated module suitable for this biomarker-oriented prioritization strategy. The red module was therefore retained and reported as a formal network-level finding but was not selected as the principal source of experimental candidates. Importantly, its inverse association was used only as one consideration in relation to the study objective; it was not interpreted as evidence that the red module lacked biological relevance.
Because the grey-labelled genes were not assigned to a conventional co-expression module, they were not interpreted using a formal module eigengene. Instead, their first principal component (PC1) was calculated as a descriptive summary of their aggregate expression pattern. The PC1 direction was standardized such that higher scores corresponded to AD, yielding a significant descriptive association with disease status (r = 0.558, BH-FDR <0.001; figure 2E). This sign orientation did not alter the absolute correlation, explained variance, p-value or BH-FDR. At the gene level, correlations with the direction-oriented unassigned-gene PC1 were positively related to signed gene–AD correlations (r = 0.730, p <0.0001; figure 2F). Because individual genes are not statistically independent observations and the grey set does not represent a conventional module, this gene-level relationship was interpreted descriptively rather than as evidence of module coherence.
Sensitivity analysis further showed that 1003 of the 1410 reference unassigned genes remained unassigned across all five tested powers, whereas 1183 remained unassigned at four or more of the five powers (Supplementary Fig. S1). Collectively, these observations indicated that the WGCNA-unassigned gene set contained reproducible disease-associated transcriptional signals that were not captured by the conventional modules. We therefore retained these genes as an exploratory candidate pool rather than defining them as a key co-expression module. To avoid prioritizing genes solely on the basis of unassigned status or the descriptive PC1 association, the WGCNA-unassigned genes were subsequently intersected with independently identified AD-associated differentially expressed genes. Only candidates supported by this convergent gene-level evidence were advanced to downstream enrichment, protein–protein interaction and feature-prioritization analyses.
3.2 Functional Enrichment and Pathway Analysis of AD-Associated Candidate Genes
The distributions of normalized PBMC transcript counts were comparable across the 20 healthy control and 18 AD samples, supporting subsequent between-group differential-expression analysis (figure 3A). Using a threshold of an absolute log2 fold change no less than 0.5 and a Benjamini–Hochberg-adjusted p-value below 0.05, 934 AD-associated differentially expressed genes (DEGs) were identified, including 633 upregulated and 301 downregulated genes (figure 3B).
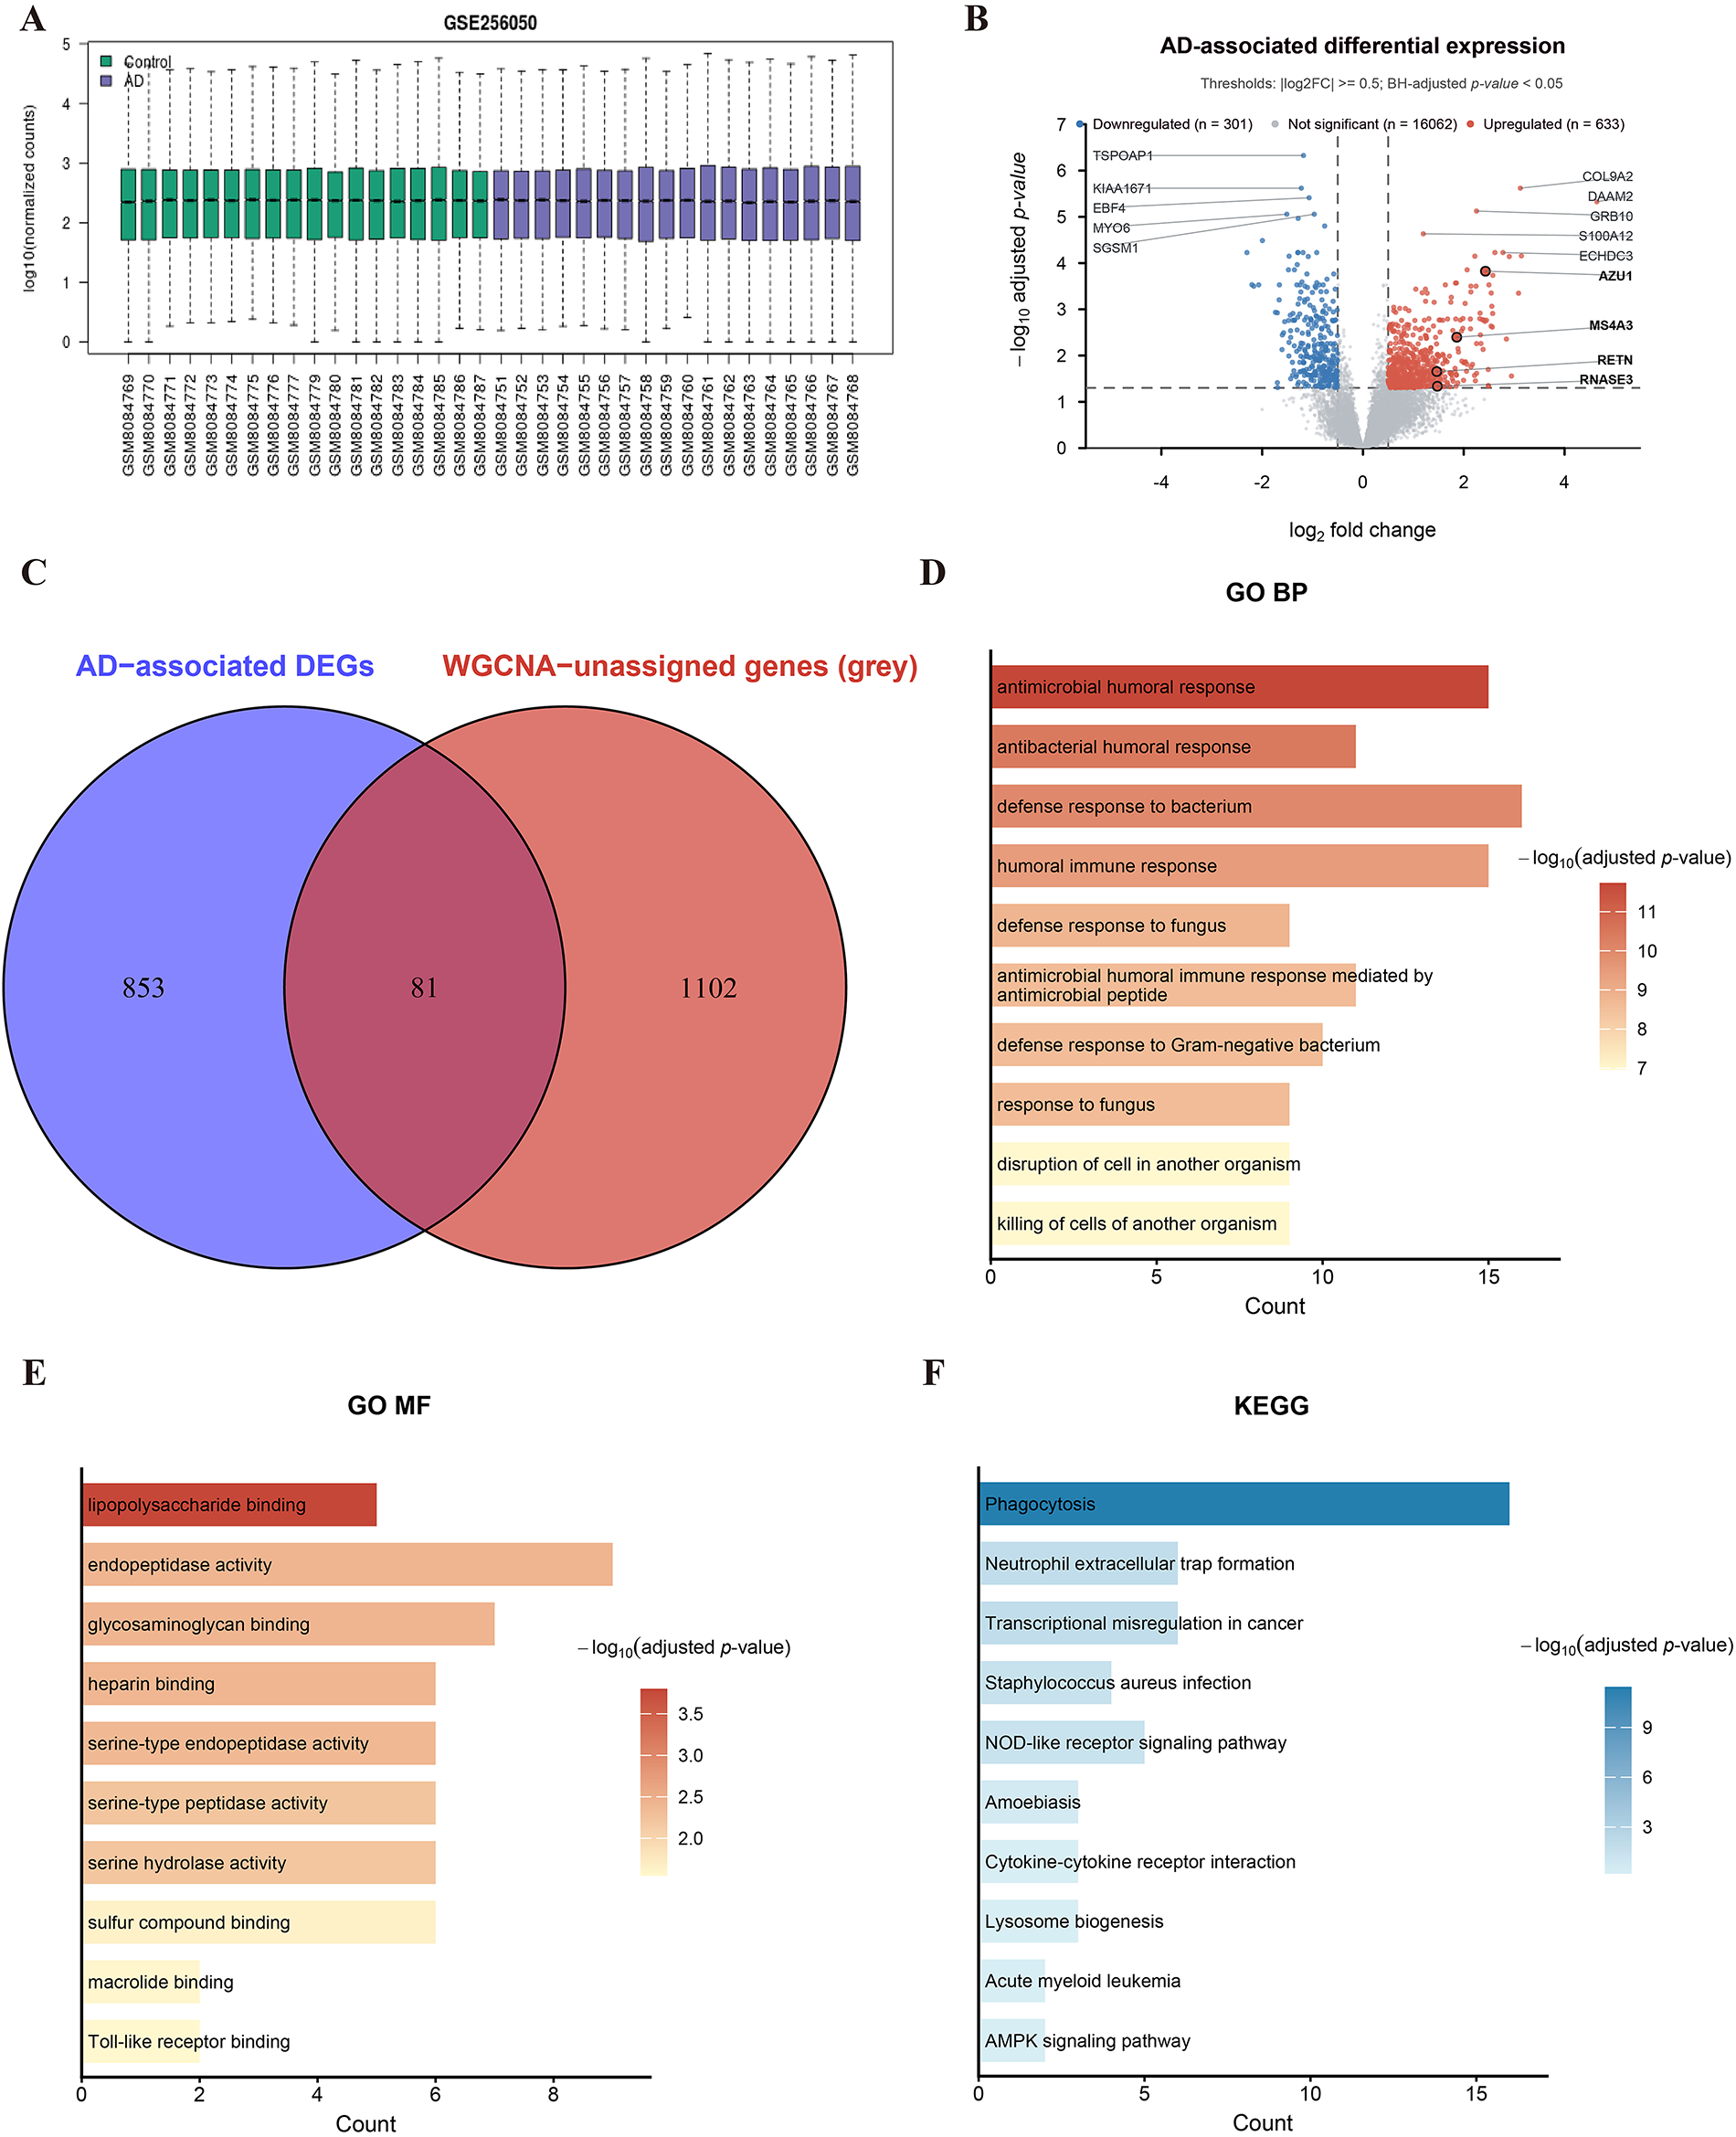
Figure 3: Integrated differential-expression and WGCNA screening identified candidate genes in atopic dermatitis. (A) Boxplots showing the distributions of log10-transformed normalized transcript counts across peripheral blood mononuclear cell samples from patients with atopic dermatitis (AD; n = 18) and healthy controls (HC; n = 20). The centre line indicates the median, the box represents the interquartile range and the whiskers extend to 1.5 times the interquartile range. (B) Volcano plot of differential gene expression between the AD and healthy control groups. Genes with an absolute log2 fold change no less than 0.5 and a Benjamini–Hochberg-adjusted p-value below 0.05 were defined as AD-associated differentially expressed genes. A total of 934 DEGs were identified, comprising 633 upregulated and 301 downregulated genes. Dashed lines indicate the prespecified fold-change and adjusted-p-value thresholds. (C) Venn diagram showing the intersection between 934 AD-associated DEGs and 1183 genes classified as WGCNA-unassigned in the original screening network, yielding 81 candidate genes. The grey designation represents genes not assigned to a conventional co-expression module and is not interpreted as a biologically coherent module. (D–F) Functional enrichment analysis of the 81 intersecting genes. The ten top-ranked terms are shown for Gene Ontology biological process (D), Gene Ontology molecular function (E) and Kyoto Encyclopedia of Genes and Genomes (KEGG) pathway analysis (F). Bar length represents the number of input genes assigned to each term, and colour represents −log10 of the Benjamini–Hochberg-adjusted p-value. GO panels display terms with adjusted p-value <0.05. For KEGG analysis, the ten top-ranked pathways are shown for completeness, whereas only pathways with adjusted p-value <0.05 were considered statistically significant.
In the original WGCNA screening network, 1410 genes were classified as unassigned genes rather than members of conventional co-expression modules. Sensitivity analysis further showed that, across all five tested soft-thresholding powers, 1183 out of 1410 candidate genes remained unassigned in at least four of the five powers (Supplementary Fig. S1). Intersection of these genes with the 934 AD-associated DEGs yielded 81 candidate genes for subsequent functional and network analyses (figure 3C). These findings indicate that the candidate set was largely insensitive to the choice of soft-thresholding power, although the unassigned genes were not interpreted as a conventional co-expression module.
Functional enrichment analysis revealed that the 81 intersecting genes were predominantly associated with antimicrobial and innate immune responses. Gene Ontology biological process analysis identified significant enrichment in antimicrobial and antibacterial humoral responses, defense responses to bacteria and fungi, and antimicrobial peptide-mediated immune responses (figure 3D, Supplementary Table S1). Molecular function terms were enriched for lipopolysaccharide binding, endopeptidase and serine-type peptidase activities, glycosaminoglycan and heparin binding, and Toll-like receptor binding (figure 3E, Supplementary Table S2). KEGG analysis further highlighted phagocytosis, neutrophil extracellular trap formation, Staphylococcus aureus infection and NOD-like receptor signalling among the statistically significant pathways (figure 3F, Supplementary Table S3). Collectively, these results indicate that the intersecting gene set was enriched for antimicrobial defence, neutrophil-associated effector functions and innate immune recognition, providing a biologically relevant candidate pool for downstream PPI and biomarker-prioritization analyses.
3.3 Integrated Network and Machine-Learning Feature Selection Prioritizes RETN, AZU1, and RNASE3 for Experimental Follow-Up
To refine the 81 genes shared between the AD-associated DEGs and the WGCNA-unassigned gene set, we first constructed a STRING-derived protein functional-association network (figure 4A). Network nodes were ranked using five complementary cytoHubba algorithms—Degree, density of maximum neighborhood component (DMNC), edge percolated component (EPC), maximal clique centrality (MCC), and maximum neighborhood component (MNC). Twelve genes were consistently ranked among the top 20 candidates by all five algorithms and were retained for subsequent feature-selection analyses (figure 4B).
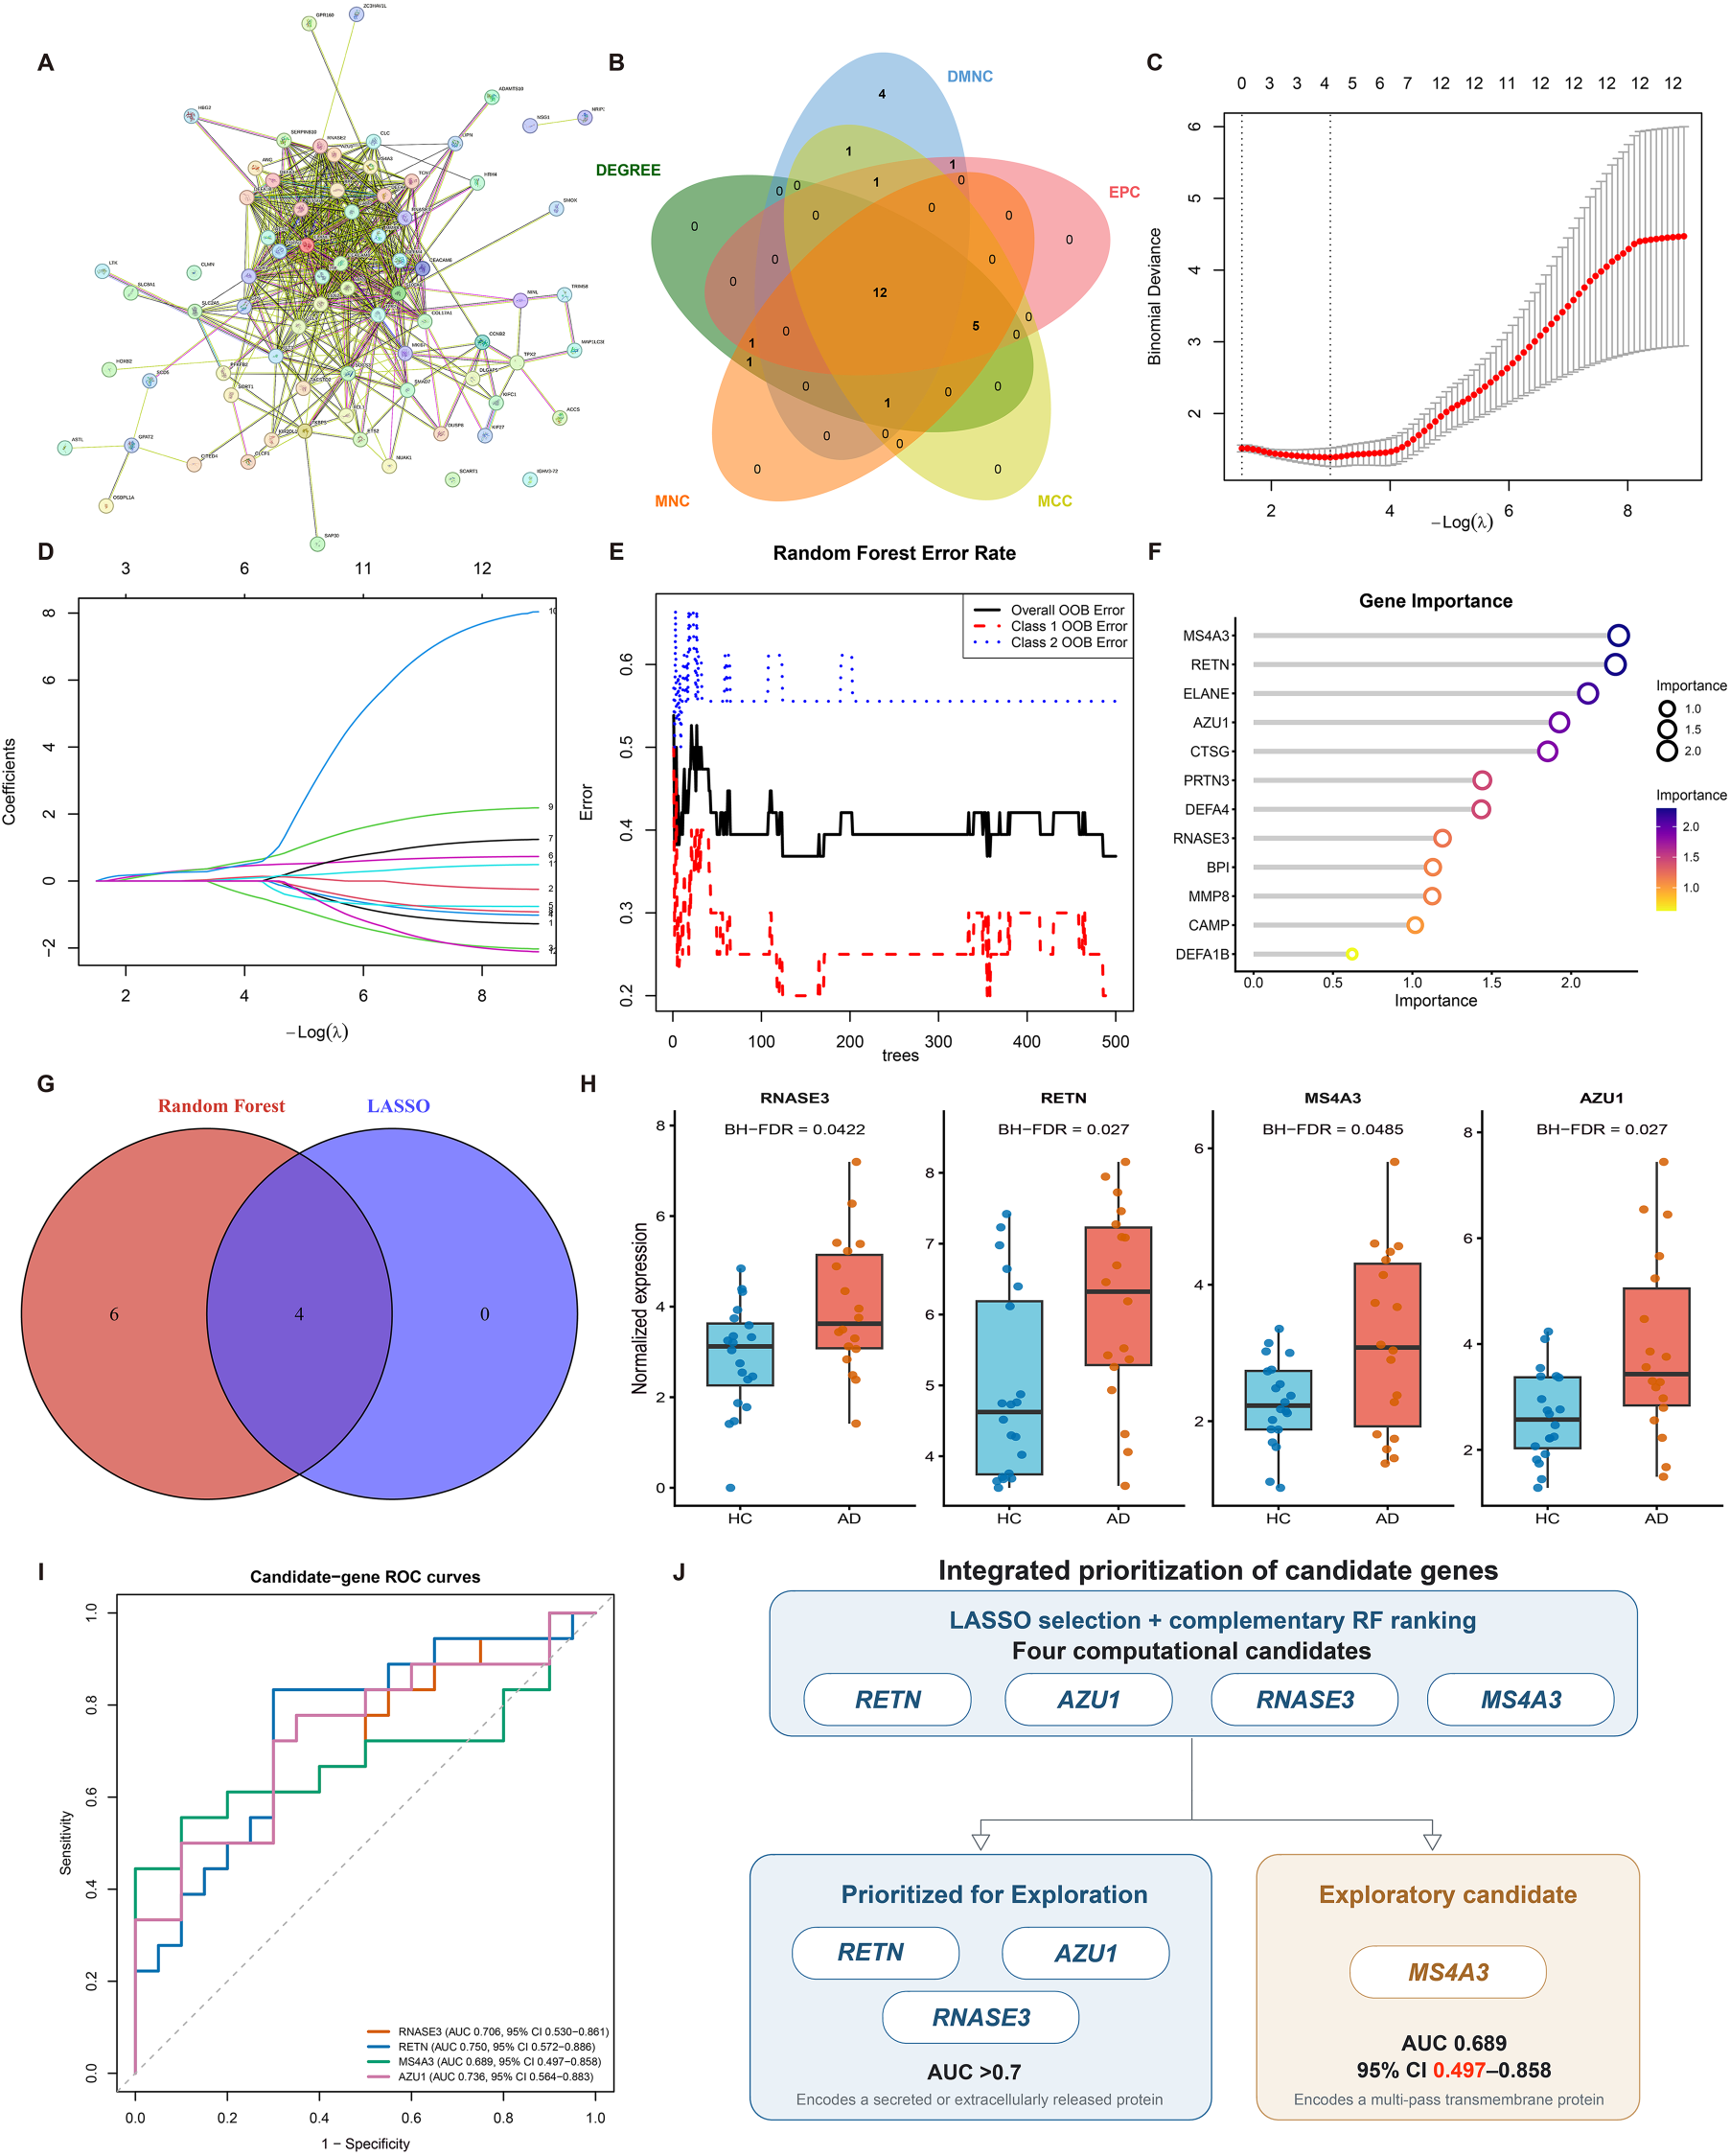
Figure 4: Integrated network and machine-learning prioritization of candidate genes for experimental evaluation. (A) STRING-derived protein functional-association network constructed from the 81 genes shared between the AD-associated differentially expressed genes and the WGCNA-unassigned gene set. Nodes represent protein products, and edges represent known or predicted functional associations. (B) Venn diagram comparing the top-ranked genes identified using five cytoHubba algorithms: Degree, density of maximum neighborhood component (DMNC), edge percolated component (EPC), maximal clique centrality (MCC), and maximum neighborhood component (MNC). Twelve genes were common to all five rankings. (C) Tenfold cross-validation curve for the LASSO binomial model. Red points indicate the mean cross-validated binomial deviance, and error bars represent the corresponding standard errors. The vertical dotted lines indicate the minimum-deviance penalty parameter and the one-standard-error criterion. (D) LASSO coefficient trajectories as a function of the regularization parameter λ. Four genes had non-zero coefficients at the selected minimum-deviance λ. (E) Overall and class-specific out-of-bag error rates across 500 trees in the random forest analysis. (F) Random-forest variable-importance ranking of the analyzed genes. MS4A3, RETN, AZU1, and RNASE3—the four genes retained by LASSO—ranked first, second, fourth, and eighth, respectively. (G) Descriptive Venn diagram showing that all four LASSO-retained genes were represented among the ten highest-ranked features in the complementary random-forest analysis. The Random Forest top-10 boundary was used only to visualize cross-method ranking concordance and did not constitute a statistically optimized or independent feature-selection threshold. (H) Normalized expression of the four computationally prioritized candidates in healthy controls (HC, n = 20) and patients with atopic dermatitis (AD, n = 18). Each point represents one individual. Boxes indicate the interquartile range, central lines denote medians, and whiskers extend to 1.5 times the interquartile range. Between-group comparisons were performed using two-sided Wilcoxon rank-sum tests, with Benjamini–Hochberg correction across the four genes. BH-adjusted p-values are shown. (I) Descriptive single-gene ROC curves generated by directly using normalized gene expression as a continuous marker in the complete discovery cohort (n = 38). AUCs and 95% confidence intervals were estimated using 2000 stratified bootstrap replicates. These analyses describe apparent within-cohort discrimination and do not constitute independent diagnostic validation. (J) Integrated prioritization of the four computational candidates. RETN, AZU1, and RNASE3 were prioritized for subsequent experimental investigation based on an apparent AUC >0.70 and the secretion or extracellular release of their encoded proteins. MS4A3 was retained as an exploratory candidate because its apparent AUC was 0.689, its 95% CI included 0.50, and it encodes a multi-pass transmembrane protein.
LASSO regression retained four genes with nonzero coefficients: MS4A3, RETN, AZU1, and RNASE3 (figure 4C,D). These genes were therefore designated as the computational candidates for subsequent evaluation. Random forest provided a complementary ranking of gene importance rather than an additional cutoff-based selection step. MS4A3, RETN, AZU1, and RNASE3 ranked first, second, fourth, and eighth, respectively, in the random-forest importance ranking (figure 4E,F). All four LASSO-retained genes were represented among the ten highest-ranked random-forest features, as descriptively illustrated in figure 4G. The top-10 boundary was used solely to visualize cross-method ranking concordance and was not considered a statistically optimized or independent feature-selection threshold. Thus, MS4A3, RETN, AZU1, and RNASE3 were carried forward as LASSO-selected candidates supported by relatively high random-forest importance rankings.
All four candidates showed higher normalized expression in the AD group than in healthy controls (AD, n = 18; HC, n = 20). The between-group differences remained significant after Benjamini–Hochberg correction for RNASE3 (BH-adjusted p = 0.04), RETN (BH-adjusted p = 0.03), MS4A3 (BH-adjusted p = 0.049), and AZU1 (BH-adjusted p = 0.03) (figure 4H).
Descriptive single-gene ROC analyses performed in the complete discovery cohort showed apparent AUCs of 0.750 for RETN (95% CI, 0.572–0.886), 0.736 for AZU1 (95% CI, 0.564–0.883), 0.706 for RNASE3 (95% CI, 0.530–0.861), and 0.689 for MS4A3 (95% CI, 0.497–0.858) (figure 4I). These estimates represent within-cohort descriptive discrimination and should not be interpreted as independent diagnostic validation.
For subsequent experimental investigation, the computational evidence was integrated with the descriptive discrimination and biological accessibility of the encoded proteins (figure 4J). RETN, AZU1, and RNASE3 each had an apparent AUC exceeding 0.70 and encode secreted or extracellularly released proteins, supporting their prioritization for further experimental evaluation. By contrast, although MS4A3 was retained as a computational candidate, its AUC was below 0.70, its 95% CI included 0.50, and it encodes a multi-pass transmembrane protein. MS4A3 was therefore reported as an exploratory candidate but was not advanced to the same experimental-priority tier. This integrated prioritization provided the rationale for selecting RETN, AZU1, and RNASE3 for downstream validation.
3.4 Estimated Peripheral Immune-Cell Composition and Cell-Type Expression Patterns of Candidate Genes
We next utilized CIBERSORT to assess the immune infiltration landscape of the RNA-seq dataset using a deconvolution algorithm. The estimated proportions of CD8+ T cells and NK cells were lower in the AD group, whereas the estimated proportion of naïve CD4+ T cells was higher (figure 5A,B). Correlation analysis between the target genes and immune cell proportions revealed that AZU1 expression positively correlated with the proportion of CD4+ naïve cells (figure 5C). RETN expression was positively associated with activated CD4+ T memory (Tmem) cells but negatively correlated with CD4+ naïve cells, activated dendritic cells (DCs), and eosinophils (figure 5D). RNASE3 expression showed a significant positive correlation with activated CD4+ Tmem cells and a negative correlation with resting CD4+ Tmem cells and activated DCs (figure 5E). To identify the specific cellular sources of RETN, AZU1, and RNASE3, we analyzed scRNA-seq data from the PBMCs of AD patients and healthy controls. These three genes were predominantly expressed in the myeloid cell cluster (figure 5F,G) (Supplementary Table S4). Fine-grained sub-clustering of myeloid cells revealed that RETN expression was significantly higher than that of AZU1 and RNASE3, primarily originating from classical monocyte subsets (figure 5H,I) (Supplementary Table S5).
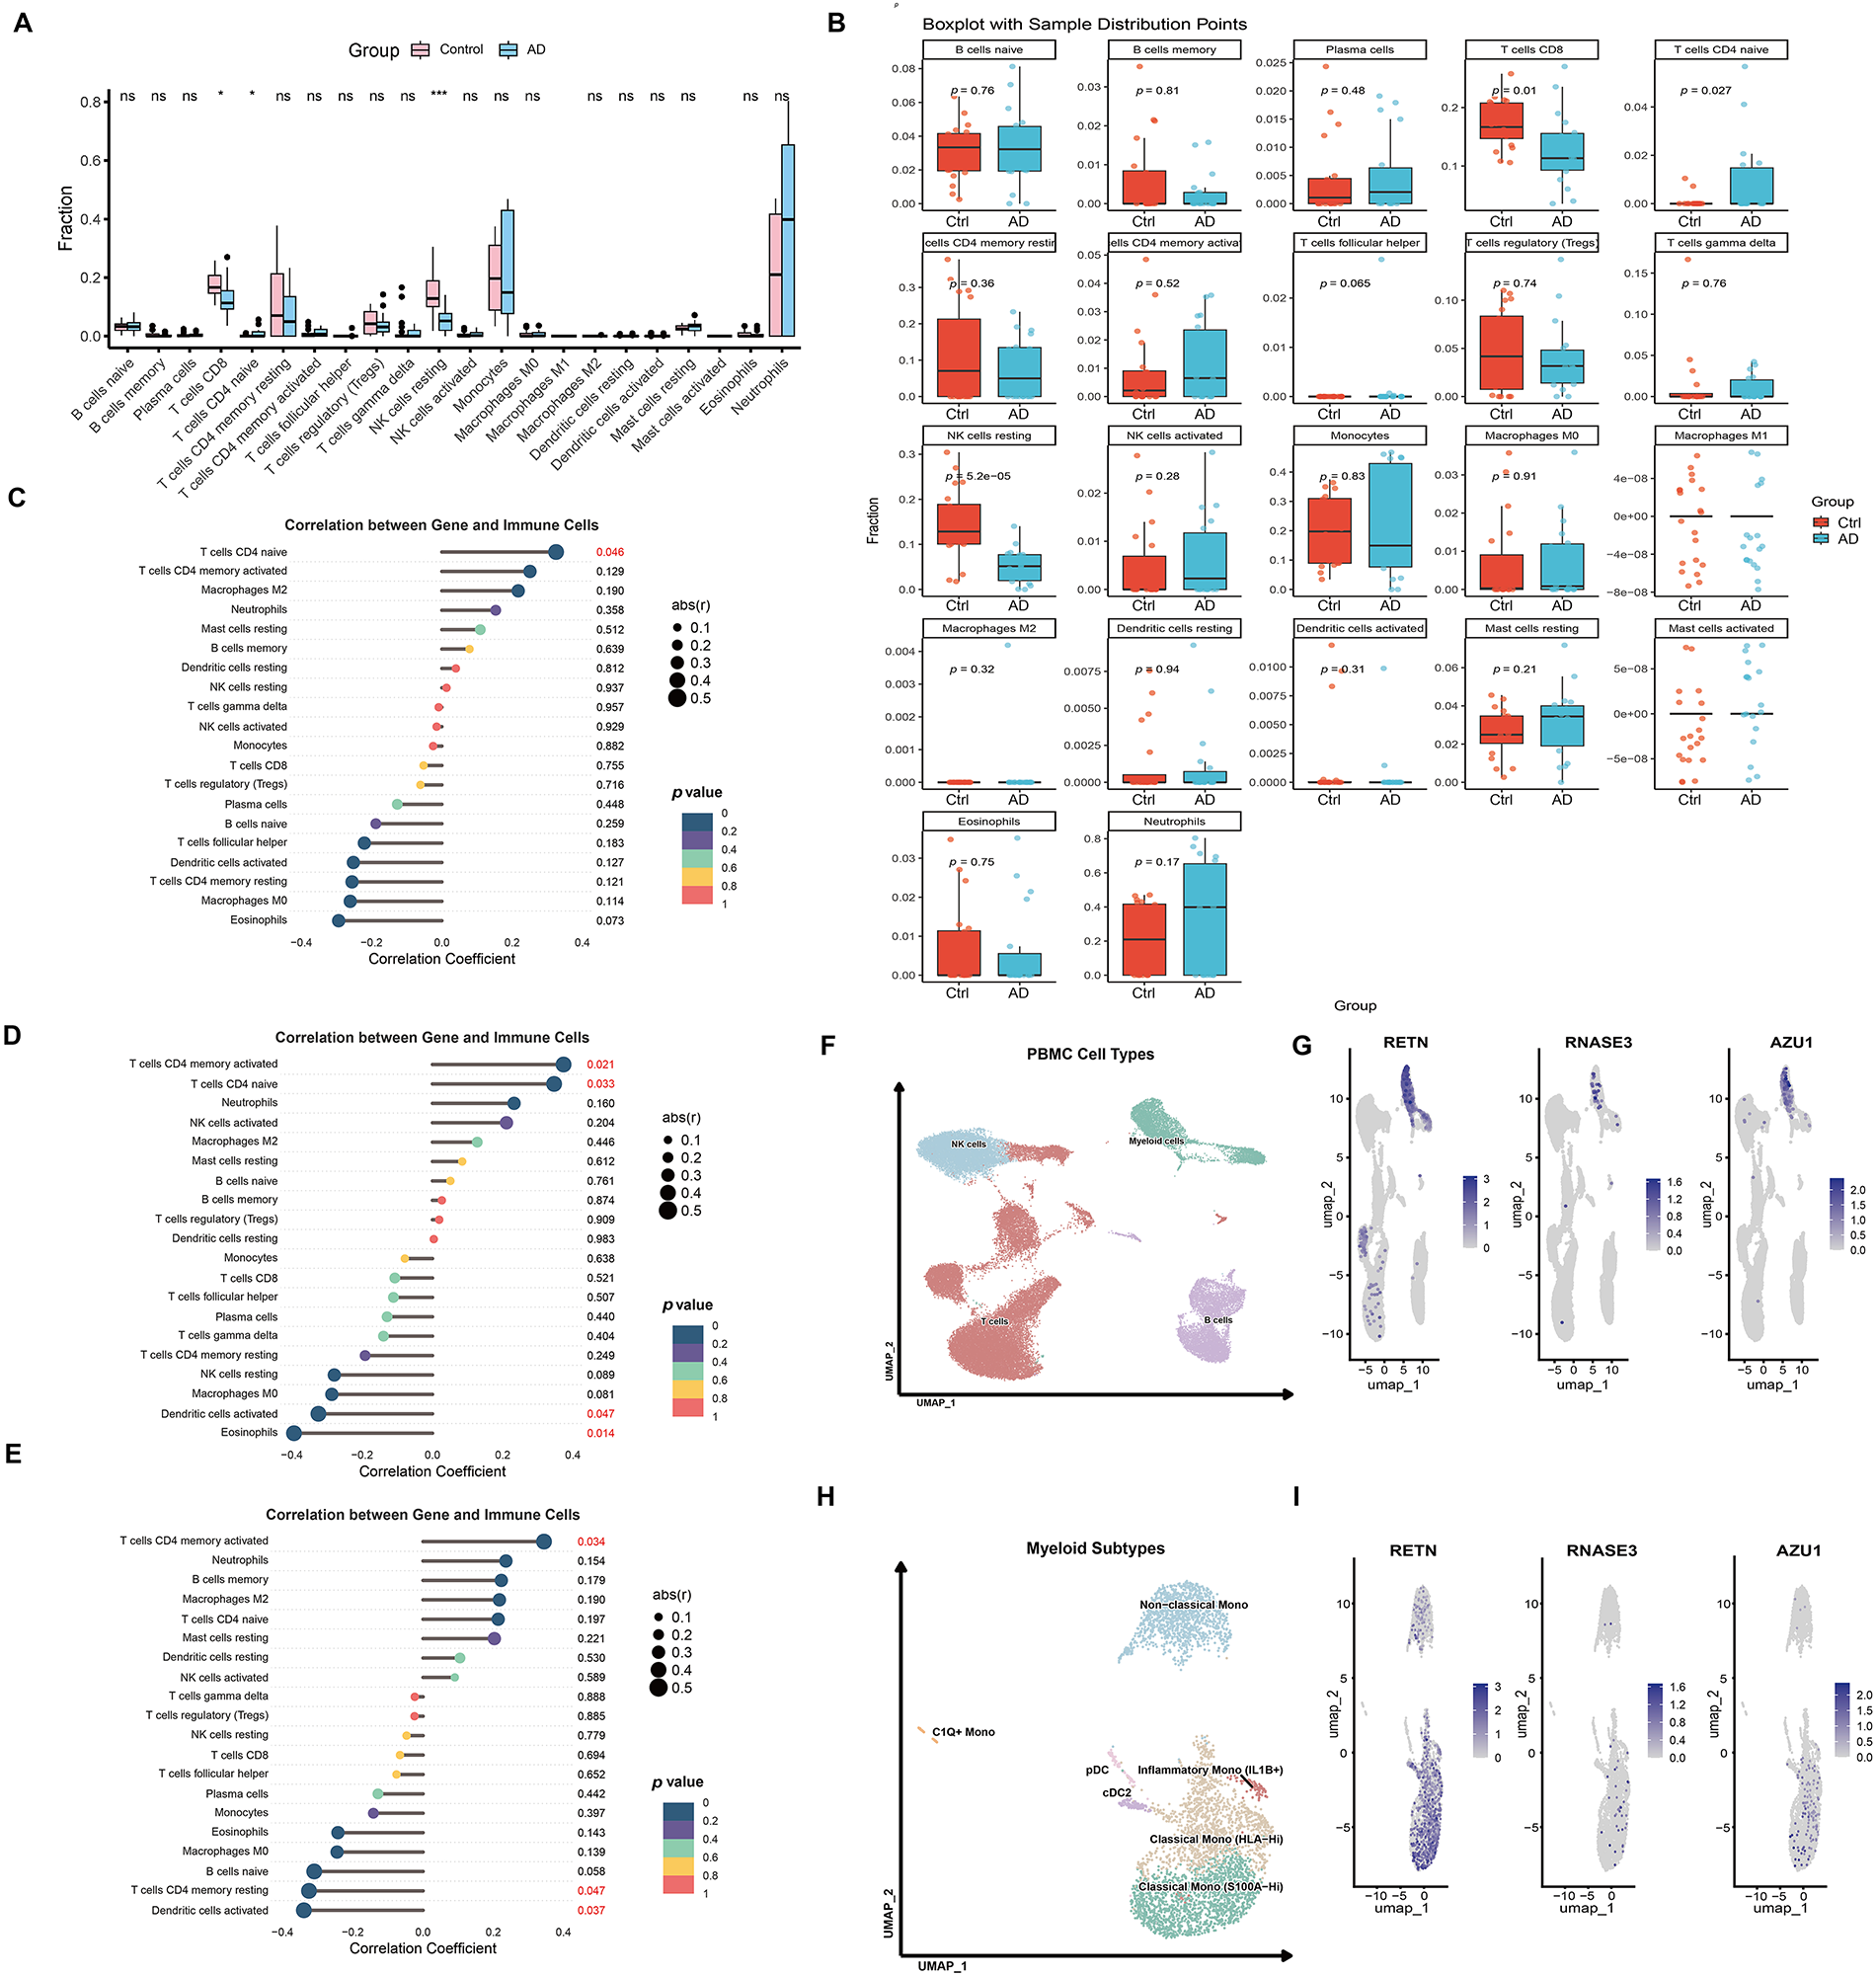
Figure 5: CIBERSORT-estimated immune-cell composition and single-cell expression patterns of candidate genes in AD. (A) Fractional distribution of peripheral blood immune cells. (B) Boxplot of differences in immune cell subpopulations. (C–E) Correlation analysis of AZU1, RETN, and RNASE3 expression with immune cell infiltration levels. (F) UMAP plot of major PBMC subpopulations, including T, B, NK, and myeloid cells. (G) Feature plots showing RETN, RNASE3, and AZU1 expression localized in myeloid clusters. (H) UMAP sub-clustering of PBMC myeloid cells into classical (S100A-Hi, HLA-Hi), non-classical, and inflammatory monocyte subsets. (I) Feature plots showing RETN as the dominant marker in classical monocyte subsets. In panel A, ns indicates p ≥ 0.05; *p <0.05; and ***p <0.001.
3.5 Experimental Validation of Candidate Biomarkers and Clinical Relevance of Serum Resistin
To experimentally verify the transcript levels of these candidate biomarkers, we performed RT-qPCR on PBMCs isolated from an independent cohort comprising 16 AD patients and 16 healthy controls. The results demonstrated a significant upregulation in the relative mRNA expression of RETN, AZU1, and RNASE3 among AD patients (figure 6A–C). However, AZU1 and RNASE3 are predominantly enriched in neutrophils and eosinophils, respectively [31,32]. Their detection in PBMC preparations may therefore reflect the co-isolation of low-density granulocytes, residual granulocytes, or processing-related cellular material rather than transcription within canonical mononuclear-cell populations. Because direct post-isolation purity measurements were unavailable for this retrospective cohort, the AZU1 and RNASE3 RT-qPCR findings were interpreted as exploratory signals detected in PBMC preparations rather than definitive evidence of mononuclear-cell expression. In contrast, RETN is primarily derived from monocytes. Consequently, compared to AZU1 and RNASE3, RETN may serve as a more disease-associated signature for AD at the PBMC level. To proceed, we examined the levels of the RETN-encoded protein resistin in the peripheral blood of AD patients (Supplementary Table S6), finding that serum resistin concentrations were significantly elevated in AD patients compared to healthy controls (figure 6D). Because serum resistin concentrations were right-skewed, they were log2-transformed before correlation analysis. Pearson correlation analysis showed that log2-transformed serum resistin concentrations were positively correlated with SCORAD scores (r = 0.633, 95% CI 0.265–0.840, p = 0.003; figure 6E). No statistically significant linear correlation was observed between log2-transformed serum resistin and total serum IgE concentrations (r = 0.305, 95% CI −0.159–0.659, p = 0.191; figure 6F). Log2-transformed serum resistin concentrations were also positively correlated with DLQI scores (r = 0.529, 95% CI 0.113–0.787, p = 0.017; figure 6G). All three analyses included 20 patients with AD. All analyses included 20 patients with AD. To assess whether the relationships between serum resistin and clinical severity were independent of basic demographic and anthropometric factors, we performed multivariable linear-regression analyses adjusted for age, sex and BMI. After adjustment, each doubling of serum resistin concentration was associated with a 7.28-point higher SCORAD score (β = 7.283; HC3 SE = 2.425; 95% CI, 2.114–12.453; BH-FDR = 0.02; adjusted R2 = 0.377) and a 3.49-point higher DLQI score (β = 3.488; HC3 SE = 1.464; 95% CI, 0.366–6.609; BH-FDR = 0.03; adjusted R2 = 0.175) (Supplementary Fig. S2 and Supplementary Tables S6 and S7).
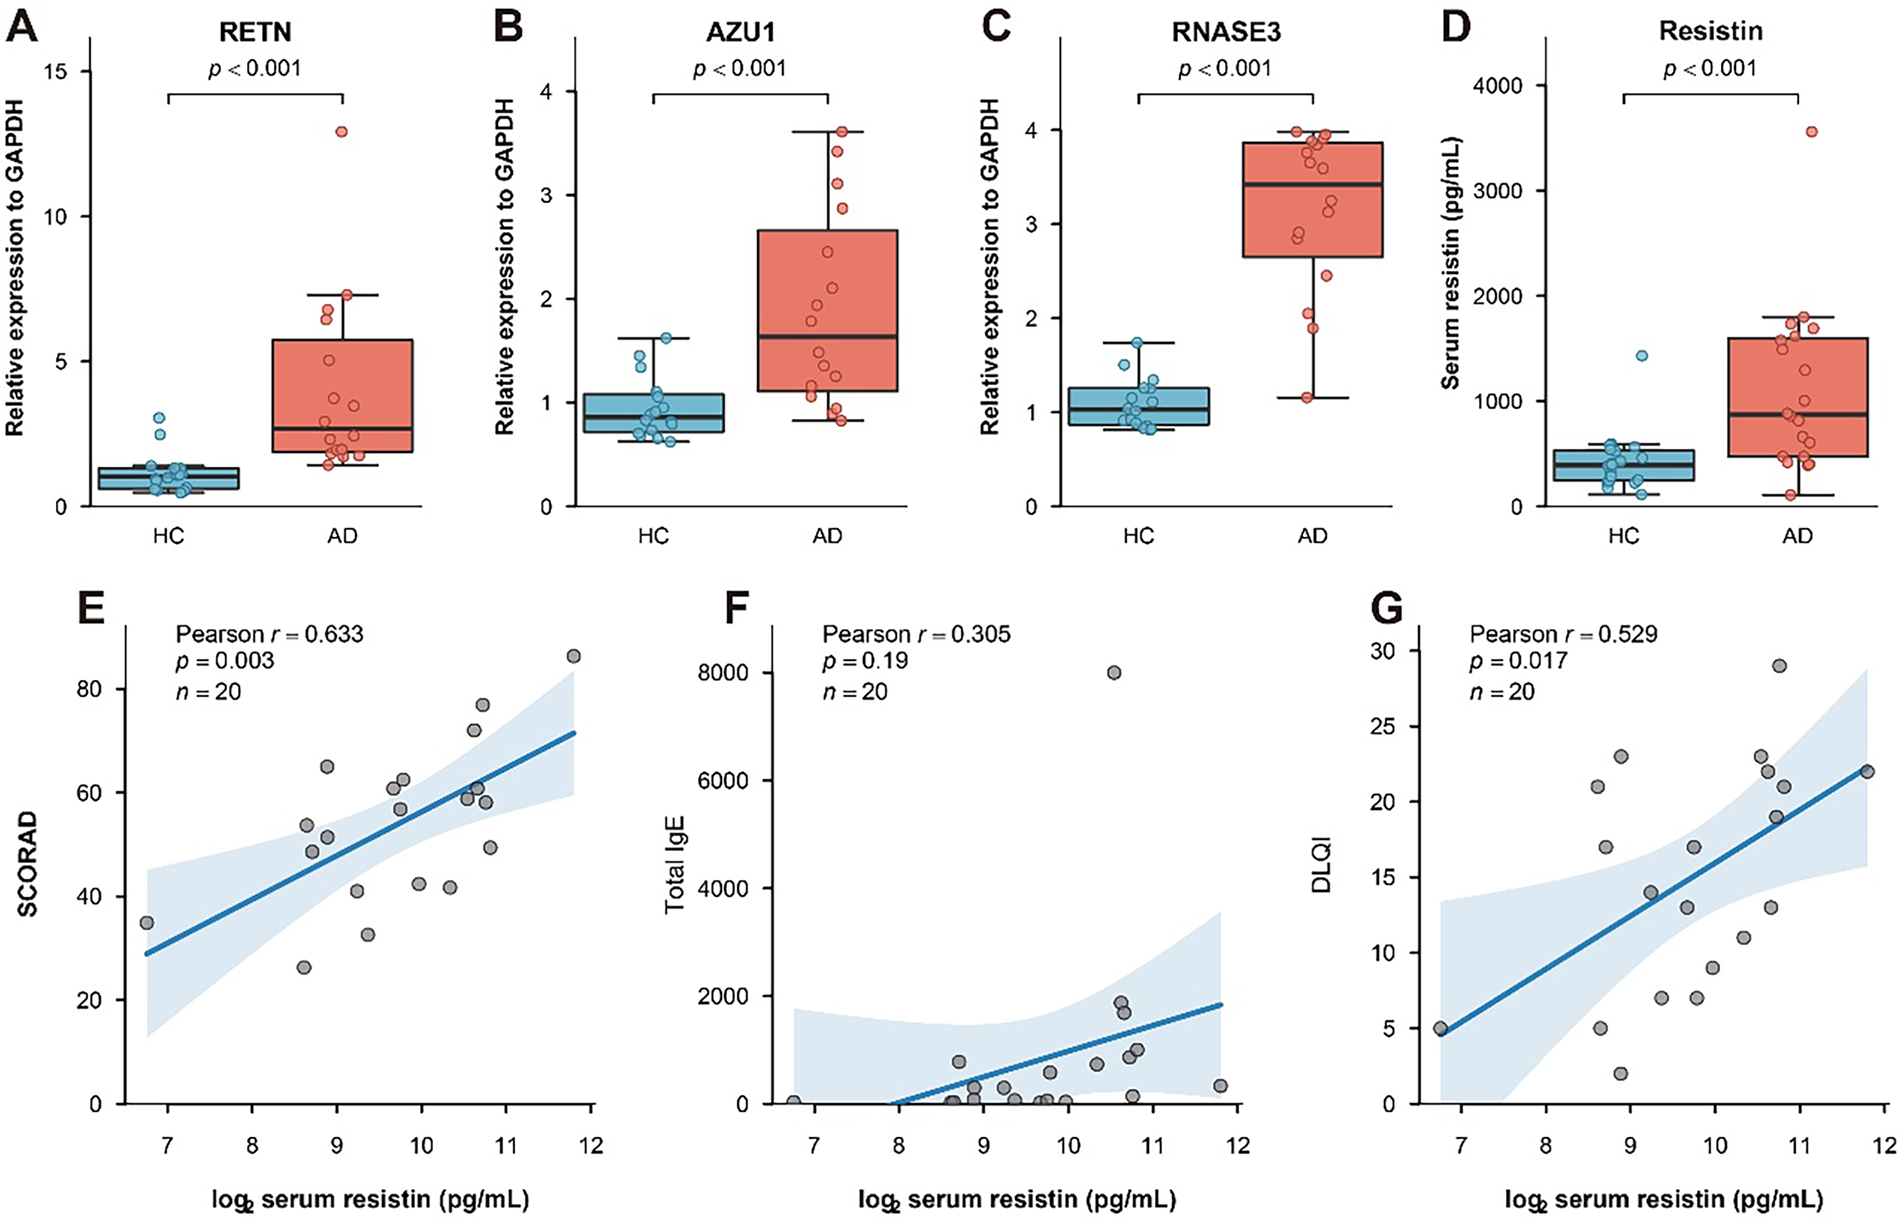
Figure 6: Experimental validation of candidate gene expression and association of serum resistin with clinical phenotypes in AD. (A–C) Relative expression levels of RETN (A), AZU1 (B), and RNASE3 (C) in PBMC preparations from validation cohort 1, comprising 16 patients with AD and 16 healthy controls. Expression was normalized to GAPDH and calculated using the 2−ΔΔCt method. (D) Serum resistin concentrations measured by ELISA in validation cohort 2, comprising 20 patients with AD and 20 healthy controls. The two clinical validation cohorts were independent and non-overlapping. Boxes represent the interquartile range, centre lines indicate medians, and whiskers extend to the most extreme observations within 1.5 times the interquartile range. Each point represents one participant. (E–G) Pearson correlations between log2-transformed serum resistin concentrations and SCORAD scores (E), total serum IgE concentrations (F), and DLQI scores (G) among 20 patients with AD. Each point represents one participant. Solid lines indicate linear regression fits, and shaded areas represent 95% confidence bands. Pearson’s r and two-sided p-values are shown. Statistical significance in panels A–D was assessed using two-sided Mann–Whitney U tests. Shaded areas in panels E–G indicate 95% confidence intervals for the fitted regression lines.
Influence diagnostics did not identify a single observation with an extreme influence on either fitted model; the maximum Cook’s distances were 0.266 for SCORAD and 0.248 for DLQI. In the 10,000-replicate bootstrap sensitivity analysis, the median coefficients remained positive for both SCORAD (median β = 7.20; percentile 95% CI, −0.38 to 11.37) and DLQI (median β = 3.59; percentile 95% CI, −0.22 to 7.00), although both bootstrap intervals included zero. These findings indicate that the adjusted associations were directionally consistent but remained imprecisely estimated because of the limited sample size.
Traditionally, the etiology of Atopic Dermatitis (AD) was considered a localized skin inflammation, with epidermal barrier dysfunction, microbial dysbiosis, and the “itch-scratch cycle” viewed as the primary drivers of pathogenesis. However, advances in understanding the molecular features and comorbidities of AD indicate that the disease can involve systemic immune alterations and is associated with metabolic and cardiovascular conditions, rather than being exclusively confined to the skin [33,34]. The evolution of biomarker research reflects this conceptual shift. Early studies focused primarily on lesion-derived biomarkers at baseline, such as type 2 cytokines (e.g., IL-13) and skin barrier proteins (e.g., filaggrin and loricrin) [35,36]. Nevertheless, in clinical practice, skin biopsies are significantly less accessible and more invasive than blood sampling. Consequently, as the systemic inflammatory nature of AD is further emphasized, investigating peripheral blood biomarkers has become a pivotal trend.
Established circulating biomarkers provide an essential benchmark for interpreting RETN/resistin. Among these markers, serum TARC/CCL17 currently has the strongest evidence base for association with AD severity and treatment-related changes, and it has been incorporated into clinical assessment in some settings. MDC/CCL22 has also been associated with disease severity and therapeutic response, although its evidence base, assay standardization, and clinical implementation remain less developed than those of TARC/CCL17 [37,38]. Peripheral eosinophil counts and total serum IgE are readily available indicators of type 2 inflammation and allergic sensitization; however, their relationships with disease activity are heterogeneous. Total IgE may be normal in intrinsic AD and is not consistently correlated with severity, whereas eosinophil counts are influenced by the eosinophilic phenotype, concomitant atopic diseases, treatment, and other clinical factors. Accordingly, these markers provide related but non-equivalent information about AD biology [14,38].
Within this context, RETN/resistin should not be interpreted as replacing or outperforming established biomarkers. Instead, its predominant expression in circulating monocytes raises the possibility that it may provide complementary information regarding myeloid and innate immune activation that is not fully captured by markers centered on allergic sensitization or type 2 chemotaxis. In the present cohort, circulating resistin was associated with SCORAD and DLQI but was not significantly correlated with total IgE. This finding suggests biological non-redundancy in this cohort but does not establish that resistin is independent of IgE across AD phenotypes. Moreover, because TARC/CCL17 and MDC/CCL22 were not measured in the present validation cohort, direct comparative or incremental biomarker performance could not be evaluated. Prospective studies measuring resistin alongside TARC/CCL17, MDC/CCL22, absolute eosinophil counts, total IgE, and validated clinical scores will therefore be required to determine whether resistin provides additional clinical information beyond established markers.
Against this background, transcriptome-based screening provides a complementary strategy for identifying peripheral candidates beyond established biomarkers. In this study, we analyzed bulk and single-cell PBMC transcriptomic data in a complementary manner rather than through direct joint modelling. WGCNA was used to characterize co-expression structures, whereas LASSO regression and random forest were used as exploratory feature-prioritization approaches. LASSO retained four computational candidates, namely RETN, AZU1, RNASE3, and MS4A3, all of which also received relatively high importance rankings in the complementary random-forest analysis. The computational analyses were intended to prioritize candidates for biological evaluation rather than to construct a clinically validated diagnostic classifier or identify regulatory mechanisms across tissues.
At the network level, the conventional red module showed the strongest inverse association with AD after correction for multiple module–trait comparisons and demonstrated internal preservation. In contrast, genes classified as grey were not assigned to a conventional co-expression module and were therefore not interpreted as a biologically coherent module. Nevertheless, sensitivity analysis showed that 1003 of the 1410 genes classified as unassigned at the reference power retained this status across all five tested powers, whereas 1183 remained unassigned at four or more of the five tested powers. To avoid making the exploratory pool excessively dependent on a single network reconstruction while still requiring high assignment stability, the 1183 genes retaining unassigned status in at least four of five analyses were used for intersection with the AD-associated differentially expressed genes. Enrichment analysis of the 81 overlapping genes highlighted antimicrobial humoral responses, antibacterial defence, lipopolysaccharide binding, endopeptidase activity, phagocytosis, neutrophil extracellular-trap formation, and Staphylococcus aureus infection-related pathways. These findings are compatible with altered host-defence and myeloid-associated transcriptional signals in peripheral blood. However, gene-set enrichment does not demonstrate pathway activation or establish that cutaneous infection causes systemic inflammatory propagation. The enrichment may also be influenced by differences in circulating cell composition or residual granulocyte-associated signals in PBMC preparations.
Utilizing a protein-protein interaction (PPI) network and various algorithms, we identified 12 hub genes, after which LASSO regression retained RETN, AZU1, RNASE3, and MS4A3 as computational candidates. All four genes also received relatively high importance rankings in the complementary random-forest analysis. Descriptive single-gene ROC analyses yielded apparent AUCs ranging from 0.689 to 0.750, indicating modest within-cohort discrimination rather than excellent diagnostic performance. For subsequent experimental evaluation, RETN, AZU1, and RNASE3 were prioritized because they encode secreted or extracellularly released proteins and showed apparent AUCs above 0.70. MS4A3, which encodes a multi-pass transmembrane protein and showed an apparent AUC of 0.689, was retained as an exploratory computational candidate. This prioritization does not exclude a potential biological role for MS4A3. These analyses were performed in the same cohort used for candidate selection and are therefore susceptible to optimism and selection bias. Accordingly, we did not interpret them as evidence of a validated diagnostic classifier. Instead, the computational results were used to prioritize candidates for subsequent biological evaluation. Although the independent RT-qPCR and ELISA cohorts supported the expression direction of the selected candidates and the elevation of circulating resistin, respectively, these experiments did not constitute external validation of a transcriptomic diagnostic model. Larger independent transcriptomic cohorts and fully nested resampling procedures, in which feature selection and model tuning are repeated within each training fold, will be required to establish diagnostic performance and generalizability.
AD is characterized by the systemic polarization of helper T cells (Th2/17/22) and complex immune cell cross-talk [20,39]. Using CIBERSORT—a machine learning-based digital cytometry tool—we observed significant downregulation of CD8+ T and NK cells in AD patients, alongside an increase in CD4+ naïve T cells. Correlation analysis showed that high expression of RETN and RNASE3 synchronized with increased circulating activated CD4+ memory T cells, signifying systemic T cell-mediated activation. Conversely, their negative correlation with activated dendritic cells (DCs) and RETN’s negative correlation with eosinophils likely reflects the massive recruitment of these effector cells from the circulation to the inflamed skin rather than a decrease in their production.
To further examine the cellular distribution of the prioritized genes, we re-analyzed a peripheral-blood scRNA-seq dataset containing samples from patients with AD and healthy controls. The analysis indicated that the detectable expression of these genes was concentrated primarily within myeloid cell populations. Detailed sub-clustering and tracing of myeloid cells from both AD patients and healthy controls revealed that the expression abundance of RETN was significantly higher than that of AZU1 and RNASE3. RETN was found to predominantly originate from various classical monocyte subsets, specifically S100-hi and HLA-hi classical monocytes. Feature plots further demonstrated that while RETN showed robust expression, AZU1 and RNASE3 exhibited lower levels at the myeloid cell level. This discrepancy may stem from inherent differences in capture technologies between bulk RNA-seq and scRNA-seq.
AZU1 is an antimicrobial glycoprotein synthesized and stored in the secretory and azurophilic granules of neutrophils [31,32]. RNASE3 is primarily expressed in eosinophils and encodes eosinophil cationic protein (ECP), a potent cytotoxic secretory protein with bactericidal and antiviral properties [40]. ECP is released by activated eosinophils and serves as an established marker of eosinophilic inflammation [41]. Because conventional neutrophils and eosinophils are largely depleted during PBMC isolation and may be underrepresented in droplet-based scRNA-seq datasets, the low detection of AZU1 and RNASE3 is biologically and technically plausible. Conversely, the detection of these transcripts in bulk PBMC or RT-qPCR preparations may be influenced by co-isolated low-density granulocytes, residual granulocytes, ambient RNA, or processing-related cellular material [42]. Human RETN is expressed predominantly by monocytes and macrophages, consistent with its localization in our single-cell analysis [43–45]. These findings can be interpreted within the broader framework of immunometabolism, which links cellular metabolic programs to immune-cell activation and effector function [46]. Previous metabolomic and cytokine-profiling studies have identified alterations in amino-acid and fatty-acid metabolism in AD, supporting an immunometabolic component of the disease. Resistin has also been associated with myeloid-cell inflammatory signaling, including CAP1-dependent signaling in experimental systems outside AD [44]. However, the present study did not assess metabolic flux, metabolite concentrations, mitochondrial function, or RETN/CAP1-dependent signaling. Our findings therefore provide a biological and immunometabolic context for RETN but do not establish that resistin mediates metabolic reprogramming in AD.
To investigate whether the elevated transcript levels of RETN in PBMCs translate into corresponding protein levels in the circulation, we measured serum resistin concentrations in patients with AD and healthy controls using ELISA. Crucially, the serum levels of resistin exhibited a significant positive correlation with both SCORAD and DLQI scores. The associations between serum resistin and both SCORAD and DLQI remained statistically significant in the primary models after adjustment for age, sex and BMI. Specifically, a doubling of serum resistin concentration was associated with approximately 7.3-point and 3.5-point increases in SCORAD and DLQI, respectively. Nevertheless, percentile confidence intervals from the bootstrap sensitivity analysis included zero, highlighting the limited precision imposed by the small sample size. These findings should therefore be interpreted as exploratory evidence of a severity-associated relationship rather than definitive evidence of an independently validated clinical biomarker.
Circulating resistin is not specific to AD and may be influenced by adiposity, metabolic dysfunction, systemic inflammation, infection, smoking, cardiovascular risk and treatment exposure. Although the eligibility criteria reduced several major metabolic and inflammatory confounders and the primary models adjusted for age, sex and BMI, the small cohort did not permit simultaneous adjustment for all potentially relevant variables. These findings underscore that RETN and its encoded protein, resistin, may function as candidate biomarkers of disease severity and clinical activity. Log2-transformed serum resistin concentrations were positively correlated with SCORAD and DLQI but did not show a statistically significant linear association with total serum IgE on the prespecified analytical scale. This finding suggests that the observed relationship between resistin and clinical severity was not paralleled by a clear linear relationship with total IgE in this small cohort. However, given the limited sample size and the right-skewed distribution of IgE, the absence of a statistically significant Pearson correlation should not be interpreted as evidence that resistin is unrelated to allergic or IgE-associated inflammation. In addition, inconsistent findings regarding serum resistin in AD have been reported. Farag et al. found that serum resistin levels were lower in AD patients than in healthy controls and that lower resistin levels were associated with greater disease severity and leukocytosis [47]. They also reported that the RETN rs3745367 GG genotype was associated with reduced serum resistin levels, more severe AD, and leukocytosis, suggesting that population-specific genetic background may influence circulating resistin levels. In contrast, our study identified increased RETN expression in PBMC transcriptomic data and further validated a positive association between serum resistin levels and SCORAD scores by ELISA. These divergent findings may reflect differences in population genetic background, age distribution, AD phenotype or endotype, inflammatory stage, metabolic context, sample processing, and assay platforms. Because rs3745367 genotype information was not available in our RNA-seq cohort, we could not directly examine whether this polymorphism affected RETN expression or serum resistin levels. Therefore, resistin should be interpreted as a candidate severity-associated biomarker that requires further validation across genetically and clinically diverse AD populations, rather than as a universally consistent biomarker for all AD patients. More broadly, previous studies have demonstrated that circulating inflammatory biomarkers and composite inflammation-based scores may provide clinically relevant prognostic information, although their performance is strongly dependent on the definition and composition of the study cohort. In a retrospective cohort of 98 patients with sarcoma and pleural dissemination, Schwab et al. reported that elevated C-reactive protein (CRP) and lactate dehydrogenase (LDH) levels and a higher modified Glasgow Prognostic Score were associated with shorter overall survival, with CRP remaining statistically significant in multivariable analysis [48]. Importantly, the study explicitly defined the clinical condition of interest, recruitment period, biomarker sampling time point, and survival time origin. Nevertheless, its single-center design, potential selection bias, and heterogeneous disease composition limited the generalizability of the findings. Although the clinical context differs from AD, this study illustrates a broader principle relevant to circulating inflammatory biomarkers: associations identified within a discovery cohort or an internally derived composite signature should not be assumed to generalize across populations. Accordingly, the association between circulating resistin and AD severity observed in the present study should be regarded as exploratory.
This study has certain limitations. The sample size for research was relatively small, and the cohorts lacked multi-ethnic representation and diverse clinical phenotypes. Future large-scale trials are necessary to validate the universality of these biomarkers. In addition, paired skin and PBMC transcriptomic samples and longitudinal clinical assessments were not available in the present validation cohorts. We therefore could not determine whether within-patient changes in PBMC RETN expression or circulating resistin directly parallel changes in lesional skin inflammation. TARC/CCL17 and MDC/CCL22 were also not measured in the validation cohort, precluding head-to-head comparison with these established biomarkers. Future prospective studies should incorporate paired skin and blood sampling, serial disease-severity assessments, and simultaneous measurement of resistin, TARC/CCL17, MDC/CCL22, absolute eosinophil counts, and total IgE. Such studies should evaluate whether resistin contributes incremental information beyond established clinical and laboratory markers rather than relying only on univariable correlations.
By integrating bulk and single-cell transcriptomic analyses with machine-learning-based feature prioritization and clinical measurements, this study identified RETN/resistin as a monocyte-associated candidate peripheral marker correlated with AD severity. The convergence of transcript-level, cell-type-expression, and circulating-protein observations supports further evaluation of resistin in AD, but does not establish a causal role in immune signaling or its clinical utility for longitudinal disease monitoring. Functional studies and independent longitudinal validation are therefore required. If future functional studies confirm a pathogenic role for monocyte-derived resistin, these observations may motivate investigation of myeloid–metabolic inflammatory pathways and biomarker-guided patient stratification; however, the present data do not establish resistin as a therapeutic target.
Acknowledgement: We sincerely thank all the volunteers for their participation in this study.
Funding Statement: This study was supported by grants from the National Natural Science Foundation of China (Grant No. 82573982). The funding organizations had no role in the design and conduct of the study; collection, management, analysis, and interpretation of the data; preparation, review, or approval of the manuscript; and decision to submit the manuscript for publication.
Author Contributions: Jieyue Liao: Conceptualization, Project administration, Supervision. Shengjie Xue: Investigation, Formal analysis, Writing—original draft. Shiyu Ni: Investigation, Writing—original draft. Zehao Lan: Investigation, Data curation. All authors reviewed and approved the final version of the manuscript.
Availability of Data and Materials: The datasets analyzed in this study (GSE256050, GSE189188) are available in the public Gene Expression Omnibus (GEO) database. The other experimental and clinical data that support the findings of this study are available from the Corresponding Author, Jieyue Liao, upon reasonable request.
Ethics Approval: The study protocol involving human participants was reviewed and approved by the Medical Ethics Committee of the Second Xiangya Hospital, Central South University (Approval number: LYF20260052). All clinical procedures were conducted in accordance with the ethical standards of the institutional and national research committees and with the 1964 Declaration of Helsinki and its later amendments. Written informed consent was obtained from all participants before enrollment and biospecimen collection.
Conflicts of Interest: The authors declare no conflicts of interest.
Supplementary Materials: The supplementary material is available online at https://www.techscience.com/doi/10.32604/ecn.2026.086314/s1.
References
1. Guttman-Yassky E, Renert-Yuval Y, Brunner PM. Atopic dermatitis. Lancet 2025;405(10478):583–96. doi:10.1016/S0140-6736(24)02519-4. [Google Scholar] [CrossRef]
2. Polaskey MT, Chovatiya R. Moving beyond biology: the critical role of social and structural determinants in atopic dermatitis. Int J Dermatol 2025;64(2):272–81. doi:10.1111/ijd.17491. [Google Scholar] [CrossRef]
3. Ständer S. Atopic dermatitis. N Engl J Med 2021;384(12):1136–43. doi:10.1056/nejmra2023911. [Google Scholar] [CrossRef]
4. Langan SM, Irvine AD, Weidinger S. Atopic dermatitis. Lancet 2020;396(10247):345–60. doi:10.1016/S0140-6736(20)31286-1. [Google Scholar] [CrossRef]
5. Schuler CF IV, Tsoi LC, Billi AC, Harms PW, Weidinger S, Gudjonsson JE. Genetic and immunological pathogenesis of atopic dermatitis. J Invest Dermatol 2024;144(5):954–68. doi:10.1016/j.jid.2023.10.019. [Google Scholar] [CrossRef]
6. Davis KL, Claudio-Etienne E, Frischmeyer-Guerrerio PA. Atopic dermatitis and food allergy: more than sensitization. Mucosal Immunol 2024;17(5):1128–40. doi:10.1016/j.mucimm.2024.06.005. [Google Scholar] [CrossRef]
7. Silverberg JI. Comorbidities and the impact of atopic dermatitis. Ann Allergy Asthma Immunol 2019;123(2):144–51. doi:10.1016/j.anai.2019.04.020. [Google Scholar] [CrossRef]
8. Paller AS, Spergel JM, Mina-Osorio P, Irvine AD. The atopic march and atopic multimorbidity: many trajectories, many pathways. J Allergy Clin Immunol 2019;143(1):46–55. doi:10.1016/j.jaci.2018.11.006. [Google Scholar] [CrossRef]
9. Lei D, Zhang J, Zhu T, Zhang L, Man MQ. Interplay between diabetes mellitus and atopic dermatitis. Exp Dermatol 2024;33(6):e15116. doi:10.1111/exd.15116. [Google Scholar] [CrossRef]
10. Akdis CA, Arkwright PD, Brüggen MC, et al. Type 2 immunity in the skin and lungs. Allergy 2020;75(7):1582–605. doi:10.1111/all.14318. [Google Scholar] [CrossRef]
11. Choi JE, Di Nardo A. Skin neurogenic inflammation. Semin Immunopathol 2018;40(3):249–59. doi:10.1007/s00281-018-0675-z. [Google Scholar] [CrossRef]
12. Monedeiro F, Ehall B, Tiffner K, et al. Characterization of inflammatory mediators and metabolome in interstitial fluid collected with dermal open flow microperfusion before and at the end of dupilumab treatment in atopic dermatitis. J Proteome Res 2024;23(8):3496–514. doi:10.1021/acs.jproteome.4c00153. [Google Scholar] [CrossRef]
13. Wollenberg A, Kinberger M, Arents B, et al. European guideline (EuroGuiDerm) on atopic eczema: living update. J Eur Acad Dermatol Venereol 2025;39(9):1537–66. doi:10.1111/jdv.20639. [Google Scholar] [CrossRef]
14. Saeki H, Ohya Y, Arakawa H, et al. Executive summary: Japanese guidelines for atopic dermatitis (ADGL) 2024. Allergol Int 2025;74(2):210–21. doi:10.1016/j.alit.2025.01.003. [Google Scholar] [CrossRef]
15. Freitas E, Torres T. Difamilast for the treatment of atopic dermatitis. J Int Med Res 2023;51(6):1–17. doi:10.1177/03000605231169445. [Google Scholar] [CrossRef]
16. Saeki H, Ito K, Yokota D, Tsubouchi H. Difamilast ointment in adult patients with atopic dermatitis: a phase 3 randomized, double-blind, vehicle-controlled trial. J Am Acad Dermatol 2022;86(3):607–14. doi:10.1016/j.jaad.2021.10.027. [Google Scholar] [CrossRef]
17. Oranje AP, Glazenburg EJ, Wolkerstorfer A, de Waard-van der Spek FB. Practical issues on interpretation of scoring atopic dermatitis: the SCORAD index, objective SCORAD and the three-item severity score. Br J Dermatol 2007;157(4):645–8. doi:10.1111/j.1365-2133.2007.08112.x. [Google Scholar] [CrossRef]
18. Finlay AY, Khan GK. Dermatology life quality index (DLQI)—a simple practical measure for routine clinical use. Clin Exp Dermatol 1994;19(3):210–6. doi:10.1111/j.1365-2230.1994.tb01167.x. [Google Scholar] [CrossRef]
19. Hanifin JM, Thurston M, Omoto M, et al. The eczema area and severity index (EASIassessment of reliability in atopic dermatitis. Exp Dermatol 2001;10(1):11–8. doi:10.1034/j.1600-0625.2001.100102.x. [Google Scholar] [CrossRef]
20. Tokura Y, Hayano S. Subtypes of atopic dermatitis: from phenotype to endotype. Allergol Int 2022;71(1):14–24. doi:10.1016/j.alit.2021.07.003. [Google Scholar] [CrossRef]
21. Nakajima S, Nakamizo S, Nomura T, Ishida Y, Sawada Y, Kabashima K. Integrating multi-omics approaches in deciphering atopic dermatitis pathogenesis and future therapeutic directions. Allergy 2024;79(9):2366–79. doi:10.1111/all.16183. [Google Scholar] [CrossRef]
22. Dessie EY, Ding L, Satish L, Mersha TB. Co-expression network and machine learning analysis of transcriptomics data identifies distinct gene signatures and pathways in lesional and non-lesional atopic dermatitis. J Pers Med 2024;14(9):960. doi:10.3390/jpm14090960. [Google Scholar] [CrossRef]
23. Peng S, Yan W, Yan Y, Tang Q, Feng H, Huang X. AP2M1 as the potential biomarker for prediction of the response of atopic dermatitis to Dupilumab therapy: multi-omics analysis and evidence. Int J Biol Macromol 2025;297(5):139757. doi:10.1016/j.ijbiomac.2025.139757. [Google Scholar] [CrossRef]
24. Sekita A, Kawasaki H, Fukushima-Nomura A, et al. Multifaceted analysis of cross-tissue transcriptomes reveals phenotype-endotype associations in atopic dermatitis. Nat Commun 2023;14(1):6133. doi:10.1038/s41467-023-41857-8. [Google Scholar] [CrossRef]
25. Möbus L, Rodriguez E, Harder I, et al. Blood transcriptome profiling identifies 2 candidate endotypes of atopic dermatitis. J Allergy Clin Immunol 2022;150(2):385–95. doi:10.1016/j.jaci.2022.02.001. [Google Scholar] [CrossRef]
26. Luo Y, Fang X, Zhou Y, et al. Senescent fibroblasts and innate immune cell activation might play a role in the pathogenesis of elderly atopic dermatitis. J Dermatol Sci 2024;114(3):94–103. doi:10.1016/j.jdermsci.2024.04.002. [Google Scholar] [CrossRef]
27. Langfelder P, Horvath S. WGCNA: an R package for weighted correlation network analysis. BMC Bioinform 2008;9(1):559. doi:10.1186/1471-2105-9-559. [Google Scholar] [CrossRef]
28. Engebretsen S, Bohlin J. Statistical predictions with glmnet. Clin Epigenet 2019;11(1):123. doi:10.1186/s13148-019-0730-1. [Google Scholar] [CrossRef]
29. Hu J, Szymczak S. A review on longitudinal data analysis with random forest. Brief Bioinform 2023;24(2):bbad002. doi:10.1093/bib/bbad002. [Google Scholar] [CrossRef]
30. Newman AM, Steen CB, Liu CL, et al. Determining cell type abundance and expression from bulk tissues with digital cytometry. Nat Biotechnol 2019;37(7):773–82. doi:10.1038/s41587-019-0114-2. [Google Scholar] [CrossRef]
31. Shoemark A, Johnson ED, Shuttleworth M, et al. Azurocidin-1 as a mediator of bronchiectasis severity, epithelial defence, and target of dipeptidyl peptidase-1 inhibition: an international, multicohort study. Lancet Respir Med 2026;14(6):493–504. doi:10.1016/S2213-2600(25)00334-0. [Google Scholar] [CrossRef]
32. Tapper H, Karlsson A, Mörgelin M, Flodgaard H, Herwald H. Secretion of heparin-binding protein from human neutrophils is determined by its localization in azurophilic granules and secretory vesicles. Blood 2002;99(5):1785–93. doi:10.1182/blood.V99.5.1785. [Google Scholar] [CrossRef]
33. Brunner PM, Suárez-Fariñas M, He H, et al. The atopic dermatitis blood signature is characterized by increases in inflammatory and cardiovascular risk proteins. Sci Rep 2017;7(1):8707. doi:10.1038/s41598-017-09207-z. [Google Scholar] [CrossRef]
34. Guttman-Yassky E, Krueger JG, Lebwohl MG. Systemic immune mechanisms in atopic dermatitis and psoriasis with implications for treatment. Exp Dermatol 2018;27(4):409–17. doi:10.1111/exd.13336. [Google Scholar] [CrossRef]
35. Guttman-Yassky E, Diaz A, Pavel AB, et al. Use of tape strips to detect immune and barrier abnormalities in the skin of children with early-onset atopic dermatitis. JAMA Dermatol 2019;155(12):1358–70. doi:10.1001/jamadermatol.2019.2983. [Google Scholar] [CrossRef]
36. Park CO, Kim SM, Lee KH, Bieber T. Biomarkers for phenotype-endotype relationship in atopic dermatitis: a critical review. eBioMedicine 2024;103(1):105121. doi:10.1016/j.ebiom.2024.105121. [Google Scholar] [CrossRef]
37. Kwon YS, Oh SH, Wu WH, et al. CC chemokines as potential immunologic markers correlated with clinical improvement of atopic dermatitis patients by immunotherapy. Exp Dermatol 2010;19(3):246–51. doi:10.1111/j.1600-0625.2009.00971.x. [Google Scholar] [CrossRef]
38. Furukawa H, Takahashi M, Nakamura K, Kaneko F. Effect of an antiallergic drug (Olopatadine hydrochloride) on TARC/CCL17 and MDC/CCL22 production by PBMCs from patients with atopic dermatitis. J Dermatol Sci 2004;36(3):165–72. doi:10.1016/j.jdermsci.2004.09.001. [Google Scholar] [CrossRef]
39. Brunner PM, Guttman-Yassky E, Leung DY. The immunology of atopic dermatitis and its reversibility with broad-spectrum and targeted therapies. J Allergy Clin Immunol 2017;139(4S):S65–76. doi:10.1016/j.jaci.2017.01.011. [Google Scholar] [CrossRef]
40. Munthe-Kaas MC, Gerritsen J, Carlsen KH, et al. Eosinophil cationic protein (ECP) polymorphisms and association with asthma, s-ECP levels and related phenotypes. Allergy 2007;62(4):429–36. doi:10.1111/j.1398-9995.2007.01327.x. [Google Scholar] [CrossRef]
41. Vernet R, Matran R, Zerimech F, et al. Identification of novel genes influencing eosinophil-specific protein levels in asthma families. J Allergy Clin Immunol 2022;150(5):1168–77. doi:10.1016/j.jaci.2022.05.017. [Google Scholar] [CrossRef]
42. Wigerblad G, Cao Q, Brooks S, et al. Single-cell analysis reveals the range of transcriptional states of circulating human neutrophils. J Immunol 2022;209(4):772–82. doi:10.4049/jimmunol.2200154. [Google Scholar] [CrossRef]
43. Taouis M, Benomar Y. Is resistin the master link between inflammation and inflammation-related chronic diseases? Mol Cell Endocrinol 2021;533(5):111341. doi:10.1016/j.mce.2021.111341. [Google Scholar] [CrossRef]
44. Sudan SK, Deshmukh SK, Poosarla T, et al. Resistin: an inflammatory cytokine with multi-faceted roles in cancer. Biochim Biophys Acta Rev Cancer 2020;1874(2):188419. doi:10.1016/j.bbcan.2020.188419. [Google Scholar] [CrossRef]
45. Schwartz DR, Lazar MA. Human resistin: found in translation from mouse to man. Trends Endocrinol Metab 2011;22(7):259–65. doi:10.1016/j.tem.2011.03.005. [Google Scholar] [CrossRef]
46. Sheng JX, Liu YJ, Yu J, et al. Recent insights into the roles and therapeutic potentials of GLS1 in inflammatory diseases. J Pharm Anal 2025;15(12):101292. doi:10.1016/j.jpha.2025.101292. [Google Scholar] [CrossRef]
47. Farag AGA, Hammam MA, Khaled HN, et al. Resistin adipokin in atopic dermatitis patients: a clinical, biochemical, and genetic study. J Cosmet Dermatol 2020;19(11):2929–35. doi:10.1111/jocd.13338. [Google Scholar] [CrossRef]
48. Schwab H, Collaud S, Bauer S, et al. The prognostic potential of circulating biomarkers for sarcoma patients with pleural dissemination. Pathol Oncol Res 2025;31:1612133. doi:10.3389/pore.2025.1612133. [Google Scholar] [CrossRef]
Cite This Article
 Copyright © 2026 The Author(s). Published by Tech Science Press.
This work is licensed under a Creative Commons Attribution 4.0 International License , which permits unrestricted use, distribution, and reproduction in any medium, provided the original work is properly cited.
 Downloads
 Citation Tools
