
 Submit a Paper
 Propose a Special lssue
 Open Access
ARTICLE
Quality Control at Nomophobia and Dependency to Technological Gadgets
Pusat GENIUS@Pintar Negara, Universiti Kebangsaan Malaysia, Selangor, 43600, Malaysia
* Corresponding Author: Huay Woon You. Email:
International Journal of Mental Health Promotion 2023, 25(8), 891-901. https://doi.org/10.32604/ijmhp.2023.028205
Received 04 December 2022; Accepted 13 February 2023; Issue published 06 July 2023
 View Full Text
 Download PDF
Abstract
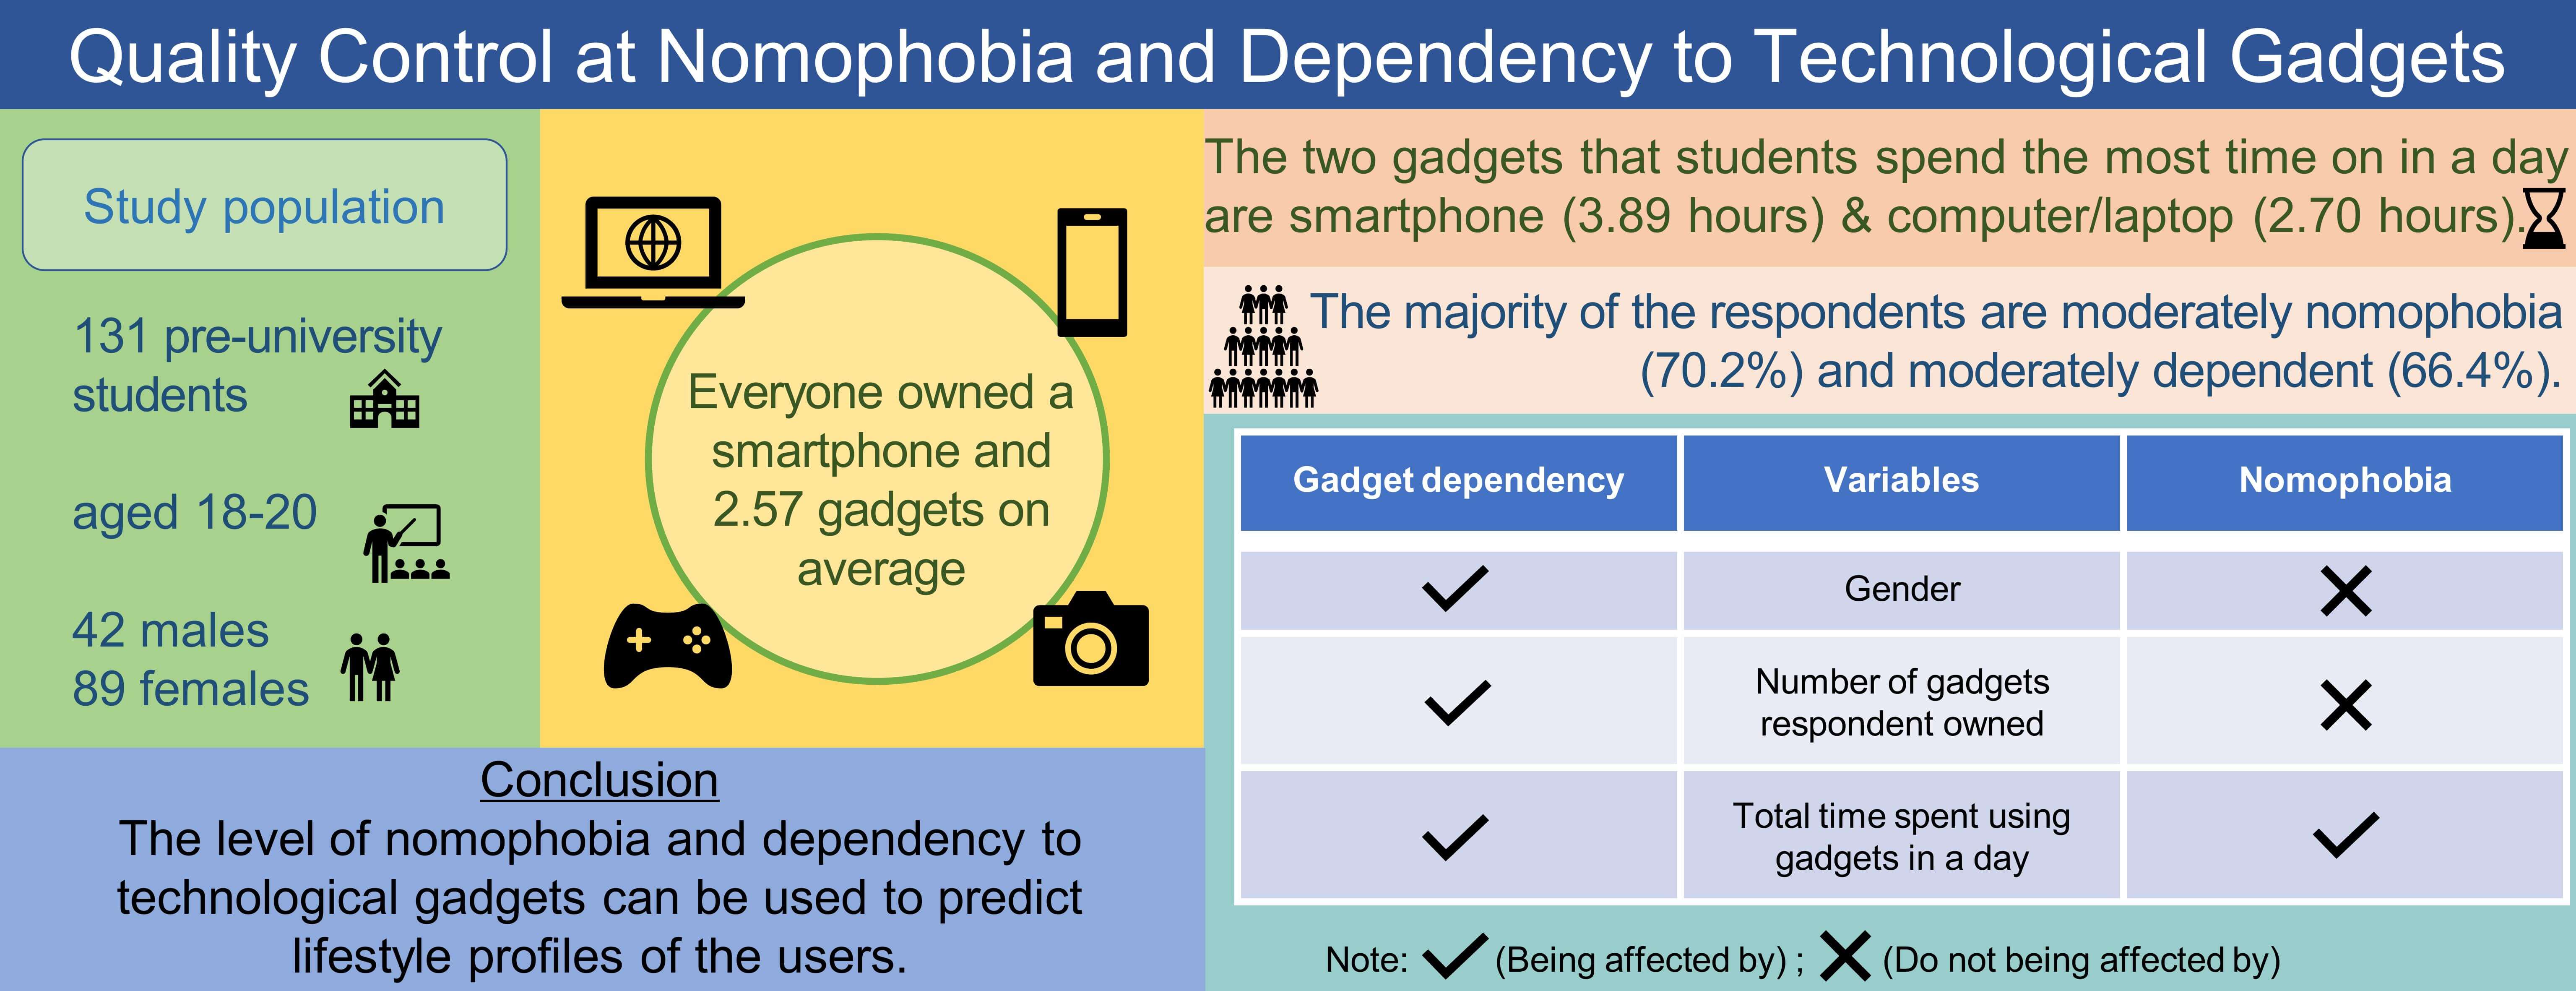
This study aims to investigate the phenomenon of technological gadget usage among pre-university students, which include the time spent using them, as well as their purpose and influence. A descriptive research design was adopted in this study. 131 pre-university students were randomly selected to answer a structured questionnaire. They were informed two weeks earlier to keep track on their time spent on technological devices, before answering the questionnaire. Findings showed that 99.2% of the respondents owned at least two technological gadgets, and all respondents own a smartphone. The main two gadgets that respondents spend at least 4 h a day on are smartphones (65.6%) and computers/laptops (21.4%). This indicates that smartphones are commonly used and owned among the respondents. The majority of the respondents are moderately nomophobia and moderately dependent on smartphones (70.2% and 66.4%, respectively). Correlation analysis demonstrates that the total time spent on gadgets in a day has a significant positive correlation with gadget dependency and total number of gadgets owned. Meanwhile, logistic regression was conducted to estimate the probability of nomophobia and dependency using total time spent and total number of technological gadgets. From the findings, it was demonstrated that when the total time spent on using technological gadgets increasing, there is greater probability that the respondents develop nomophobia and dependency. This indicates that nomophobia and dependency to technological gadgets can be used to predict lifestyle profiles. The use of technological gadgets can bring both benefit and harm to its user. In light of this, user has to remain rational in order to derive maximum benefit from it.Graphic Abstract
Keywords
The rapid advancement of technology has led to the invention and development of numerous technological gadgets such as smartphones, tablets, and laptops, to name a few. These gadgets captivate users’ attention as they are designed to make our life easier in terms of daily communication, information searching, navigation, and entertainment. Due to the constant added features and expanding functionalities of technology gadgets, our reliance on these gadgets to perform daily tasks has been rapidly increased. However, overdependence on technological gadgets can have serious consequences, especially for teenagers who are still at an impressionable age [1].
According to Cha and Seo [2], young people and teenagers would be more susceptible to technological gadget addiction as compared with other age groups, because they are yet to develop self-control in gadget use. As a results, technological gadgets users find it challenging to detach from using their technological devices. In addition, individuals become anxious when they are away from their technological devices, for example smartphone. This phenomenon is known as nomophobia (NO MObile PHone phoBIA). It describes the anxiety that occurs from losing or being away from one’s technological device as well as the fear of not being able to use it. Nomophobia among teenagers can suffer from a variety of physical and psychological health problems. The issue of nomophobia and dependency to technological gadgets should not be overlooked, as it may have an impact on our daily life. Nomophobia can be defined as a constant dependency on one’s gadget, to cater to the psychological needs and extraneous necessities, causing a constant attachment to one’s gadget, which leads to loss of productivity and chronic side effects such as depression [1].
There are five stages of usage, namely, “First use”, “Continued use”, “Tolerance”, “Dependence” and “Addiction”. Nomophobia is considered as a type of behavioral addiction to smartphone. Hence, we can say that nomophobia also develops dependency to technological gadgets, but being dependent on a gadget might not develop nomophobia [3]. The level of dependency on technological gadgets refers to the reliance on technological gadgets for specific, unavoidable purposes such as accessing study material, information searching and completing assignments, which do not satisfy the characteristics of being addicted. They might feel stressed or uneasy if they were unable to access their gadgets for study purposes. The usage of gadgets in this context is more towards studying than entertainment such as playing online games.
Technological gadgets are becoming more common in our daily life. The implementation of technological innovations such as video streaming servers in today’s education system enable higher educational institutes to monitor the students’ learning attitudes and academic performance easily. This will help the educators to recognize the capability of each students and adjust their teaching modules accordingly in order to increase students’ motivation in learning followed by an increase in the retention rate and pass percentage of their students [4]. Moreover, the usage of technological gadgets in physical education through mobile applications was found to be effective in promoting students’ internal motivation for physical activities. Students especially those with average or below average performance during usual physical education classes showed rapid increase in motor performances after integrating mobile application to keep track of their physical activity sessions [5].
Technological gadgets however, can have unfavorable effect on its user if overused. A study conducted in China found that many schools transitioned into online learning due to the enforcement of self isolation during the COVID-19 pandemic. It caused some of the students to suffer from psychosocial issues which include loneliness, fear and anxiety. They tend to immerse themselves in the virtual world as a form of escape from these psychosocial problems. Problematic mobile phone usage among these students can directly influence their learning by inducing mathematics anxiety followed by indirect influence on mathematics self-efficacy, resulting in poor academic performances [6]. According to the aforementioned information, it is crucial that users practice self-regulation to gain maximum benefit from technological gadgets usage.
The use of technological gadgets is unavoidable. Users need to manage their time and determine the priorities in daily life as a guidance in using these gadgets. Muduli [7] stated that usage of any product should be necessity-driven rather than luxury-driven, so that unnecessary wasting of time can be avoided. In other words, it means that technological gadgets users should only use these gadgets when needed. This is parallel with target 4.7 of the Sustainable Development Goals constructed up by the United Nations General Assembly to “ensure that all learners acquire the knowledge and skills needed to promote sustainable development, including, among others, through education for sustainable development and sustainable lifestyles” by the year 2030.
This paper will create awareness among research participants and encouraging them to make an effort in controlling and managing their behavior while using technological gadgets to harvest only the technology’s benefits for sustainable development and lifestyles. Furthermore, this study will provide details on the usage pattern of technological gadgets among pre-university students which is a useful knowledge for various parties such as, parents, researchers, educators, and policy-makers toward sustainability and collective well-being.
Last but not least, numerous studies on technology gadgets usage have been conducted in the past, with most of them focusing on the impact on academic performance, mental health or social competencies [8–10]. Moreover, previous studies paid attention mainly on primary or secondary school students. There is a scarcity of data on the status of technological gadgets usage among pre-university students. Pre-university students are the first time to study away from hometown and experience less parental or guardian monitoring. Therefore, the present study investigates technological gadgets dependency and nomophobia among pre-university students.
Fig. 1 shows a flowchart of the research process in this study from the sample design to the data analysis. If the instrument does not pass the threshold Cronbach’s Alpha value of 0.6, it will be deemed invalid [11]. Further modification of the instrument is needed to ensure its reliability. Detailed procedures are discussed in the following subsections.
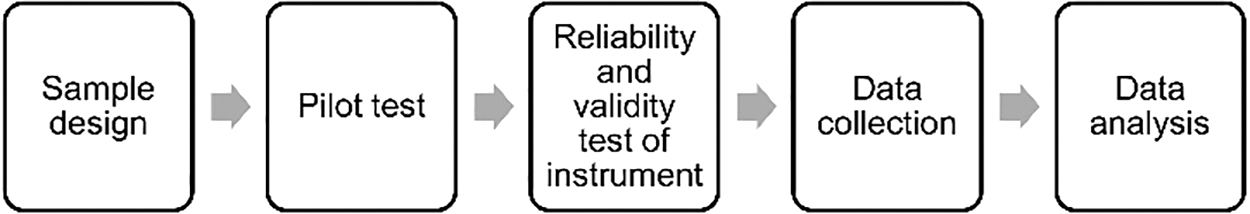
Figure 1: Research process flowchart.
A pilot test was conducted among 35 students through a simple random sampling method to validate the self-administered questionnaire. Two weeks before the commencement of the pilot test, participants were notified to take note of their average time spent on technological devices and their recent health status to ensure reliability of the data obtained. Reliability test was done based on the collected data using IBM SPSS Statistics Version 25.
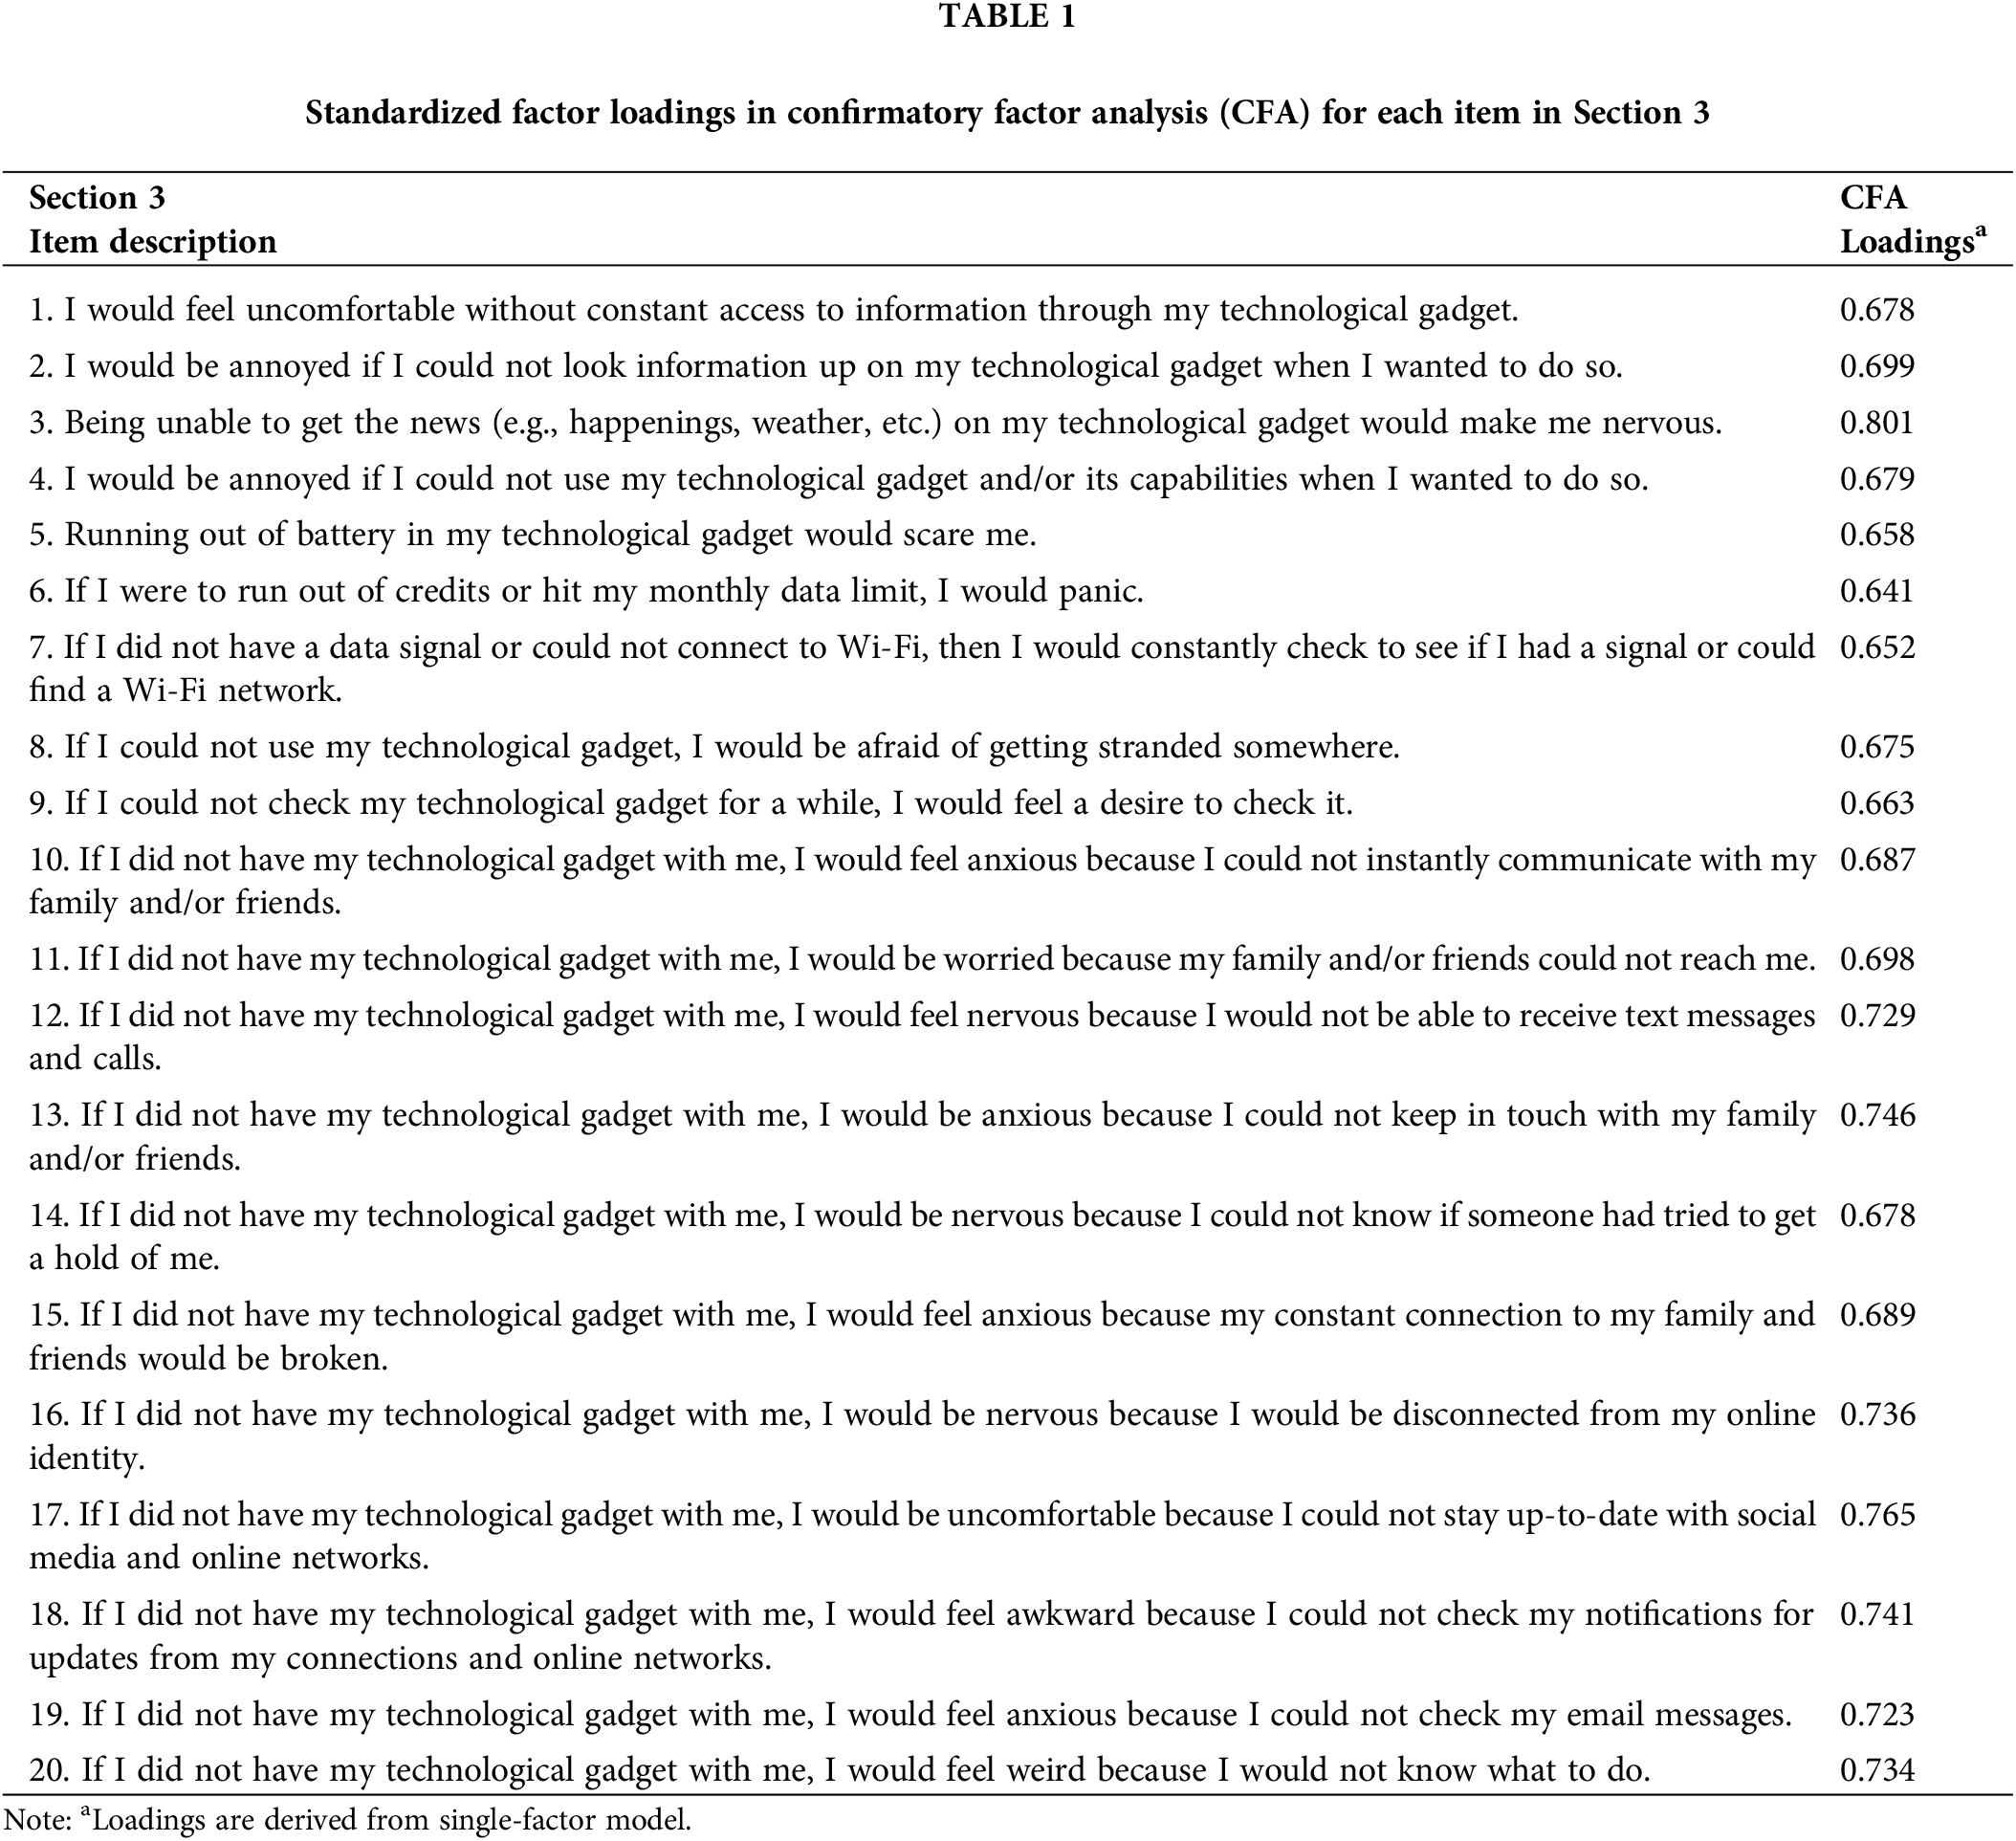
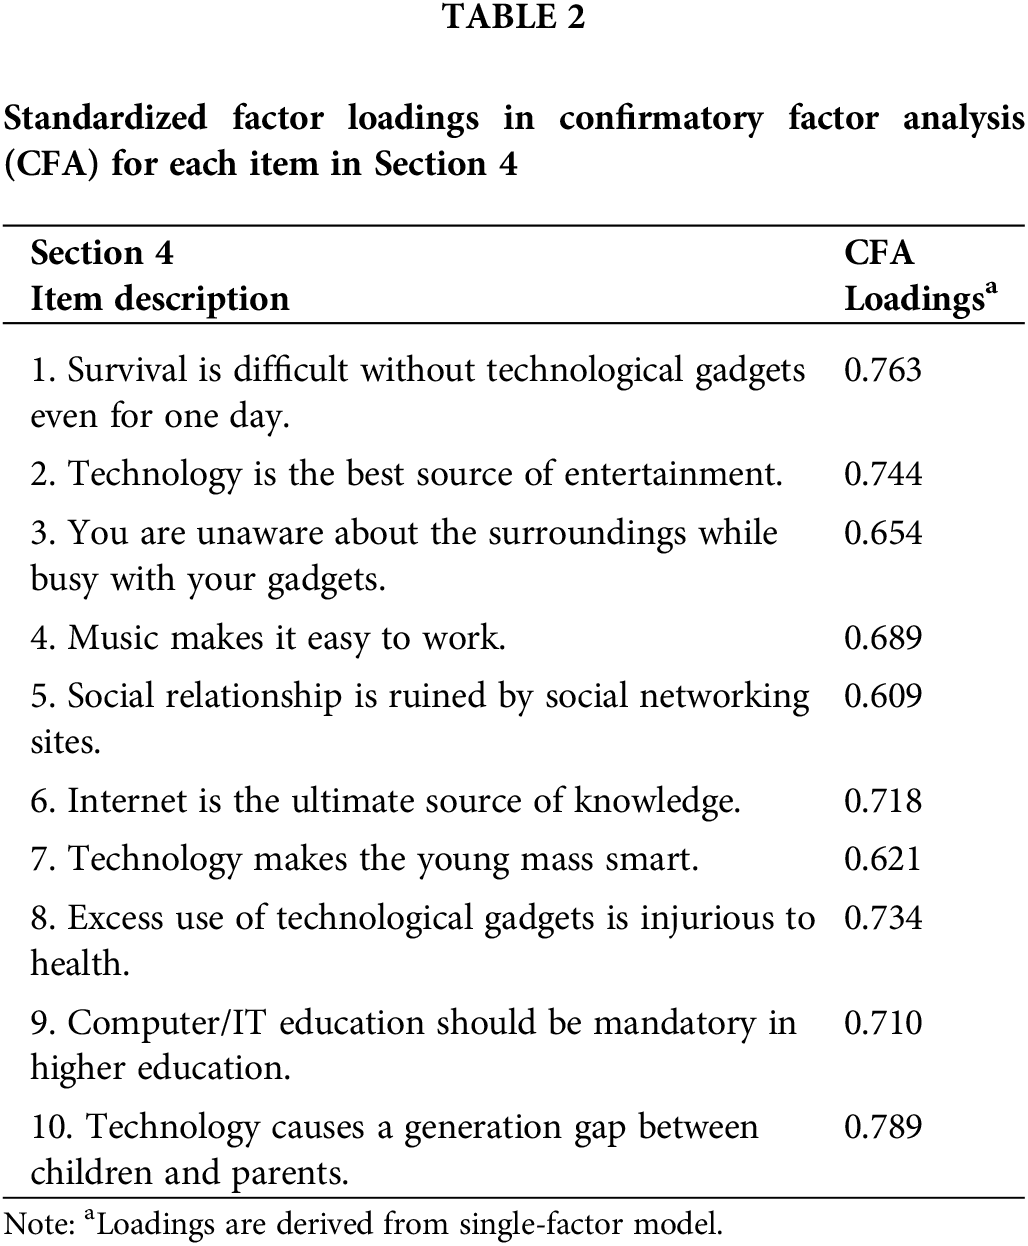
According to Hulin et al. [11], 0.6 ≤ α ≤ 0.7 indicates an acceptable level of reliability while 0.7 ≤ α ≤0.9 shows a good level of reliability. Note that α is the Cronbach’s Alpha value. The questionnaire consists of five sections with Section 1 and Section 2 being the demographic section and technological gadgets profile, for example, the number of technological gadgets owned by the respondents, respectively. Sections 3, 4 and 5 were used to measure nomophobia, technological gadgets dependency and anxiety and depression, respectively. The Cronbach’s Alpha value for Section 3 of the questionnaire was found to be 0.825. For Sections 4 and 5, the corresponding α value is 0.614 and 0.650, respectively. This demonstrates that the questionnaire is in acceptable level and good level of reliability.
To investigate the validity of the underlying research instrument, exploratory factor analysis (EFA) and confirmatory factor analysis (CFA) have been conducted. Here, Sections 3 and 4 have been validated using CFA, while Section 5 has been validated using EFA. Data collected was subjected to principal axis factoring. Tables 1 and 2 demonstrate the factor loadings for Sections 3 and 4, respectively. From the analysis, Kaiser-Meyer-Olkin (KMO) Measure of Sampling Adequacy reports the value of 0.847 and 0.770, for Sections 3 and 4, respectively. Generally, value of 0.6 and above suggests that the data are suitable for factor analysis. This is in line with the Bartlett’s Test of Sphericity, which also indicates significance for both sections. From Tables 1 and 2, all the factor loadings in the Sections 3 and 4 were strong (0.609 to 0.801). This showing the satisfactory item fit across all the items. From the EFA findings (Section 5), the KMO value is 0.770 and Bartlett’s Test of Sphericity is significant, which indicate that it is suitable to conduct factor analysis. Two factors (with eigenvalues exceeding 1) were identified as underlying research instrument. In total, these factors accounted for around 78% of the variance in the questionnaire data.
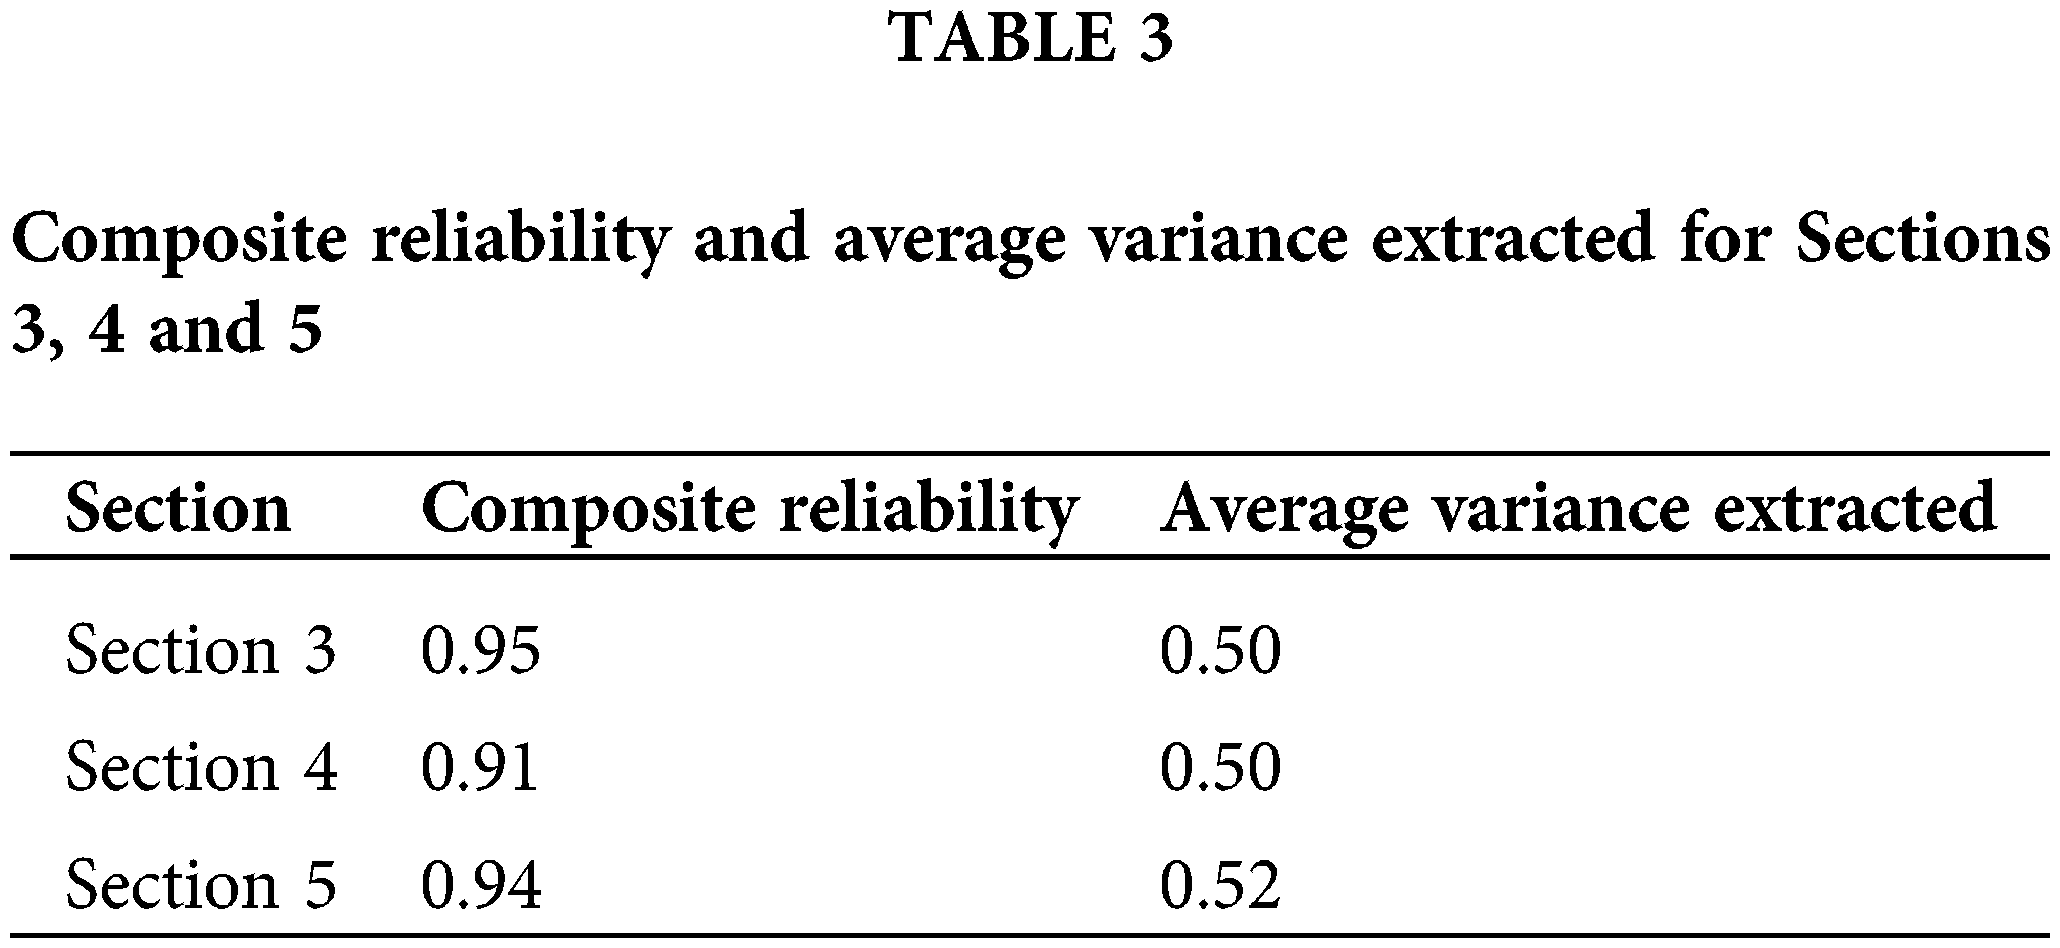
In addition, important indices such as composite reliability (CR) and average variance extracted (AVE) have been computed and displayed in Table 3. The CR, analogous to Cronbach’s Alpha values, range from 0.91 to 0.95 and the recommended value is 0.70. From Table 3, the AVE achieves the recommended minimum 0.50. Therefore, it was proved that all the items tested were valid and reliable in this study.
This cross-sectional descriptive study was conducted among pre-university students aged between 18 and 20 years old in the 2019/2020 session. We employed simple random sampling method to recruit respondents for this study. The inclusion criteria to participate in this study is such that students are required to possess at least one technological device. Two weeks prior to data collection process, respondents were notified to take note of their time spent on technological devices and their recent health status. Two weeks upon notifying the respondents, questionnaires were disseminated to the students. A total of 150 questionnaires were distributed. However, only 131 questionnaires were returned, with a response rate of 87.33%.
Instrumentation and data analysis
All the data that has been collected will be analyzed using IBM SPSS Statistics Version 25. The questionnaire consisted of five main sections with several subsections which are clearly structured. The first section contained demographic questions such as gender, age and household income. The classification of household income was based on a survey conducted by the Department of Statistics Malaysia [12]. Three different categories represent household income, namely, low, middle and high. Individuals with a household income of below or not more than RM3,860 (USD948) were considered to be under the low income category, while individuals with a household income of between RM3,860 (USD948) to RM8,319 (USD2,043) were considered under the middle income category. Lastly, the high income category was for individuals with a household income of at least RM8,319 (USD2,043).
The second section investigated the number of technological gadgets owned by the respondents, type of gadgets used, time spent on using different gadgets and purpose of using the gadgets. The third section comprises 20 questions pertaining to nomophobia level among students. It is rated according to a 7-point Likert scale from strongly disagree to strongly agree. Here, a total score of less than or equal to 20 was considered for normal users. A score ranging from 21 to 59 was considered for mild nomophobia level. Meanwhile, a total score 60–99 and 100–140 reflected moderate nomophobia level and severe nomophobia level, respectively. This section was adapted from Yildirim and Correia [13].
The fourth section of the questionnaire consists of 10 questions related to dependency of respondents on technological gadgets. The questions were rated on a 5-point Likert scale from strongly disagree to strongly agree. In this section, a total score from 10 to 16 was regarded as having a low dependency on technological gadgets. On the other hand, a total score of 17–33 and 34–50 was regarded as having a moderate and high dependency on technological gadgets, respectively. This section was adapted from Muduli [7]. The fifth section consists of 15 items which were used to evaluate anxiety and depression symptoms. There are four selections for each items, which are not at all, slightly, moderately and extremely. The respondent is required to select one answer which best describes themselves. The rights to use and modify the questionnaire were first acquired by the researchers.
The results of descriptive analysis are discussed in this section, followed by inferential analysis. Table 4 shows the demographic characteristics of the respondents. In this study, 150 students (75.38%) were randomly selected. Among the 150 students, only 131 (87.33%) questionnaires were returned. From Table 4, 32.1% of respondents were male and 67.9% were female. All students varied between 18 to 20 years old. The majority of the students belong to the high income category (55.7%), followed by the middle income category (31.3%) and the low income category (13.0%). This shows that the respondents are able to afford at least one type of technological gadget, as shown in Fig. 2.
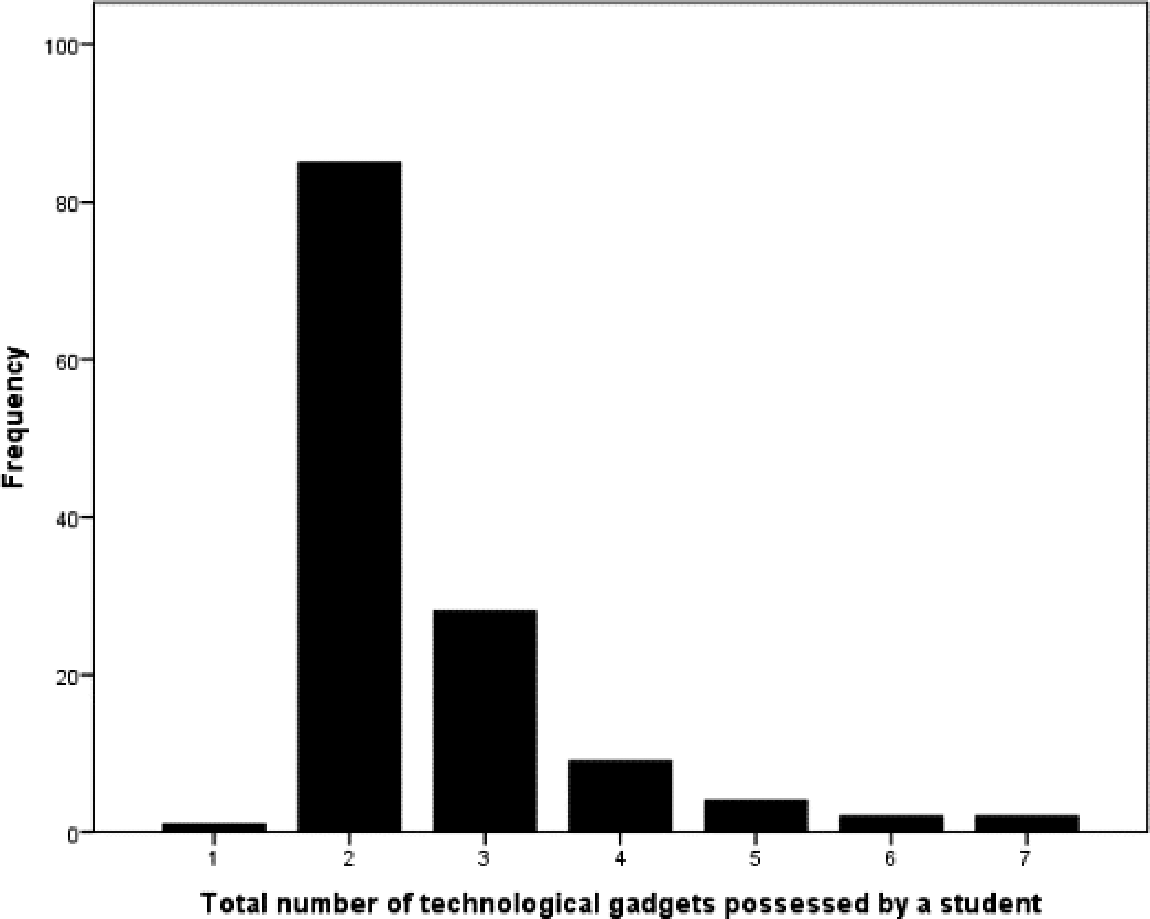
Figure 2: Total number of technological gadgets owned by the respondents.
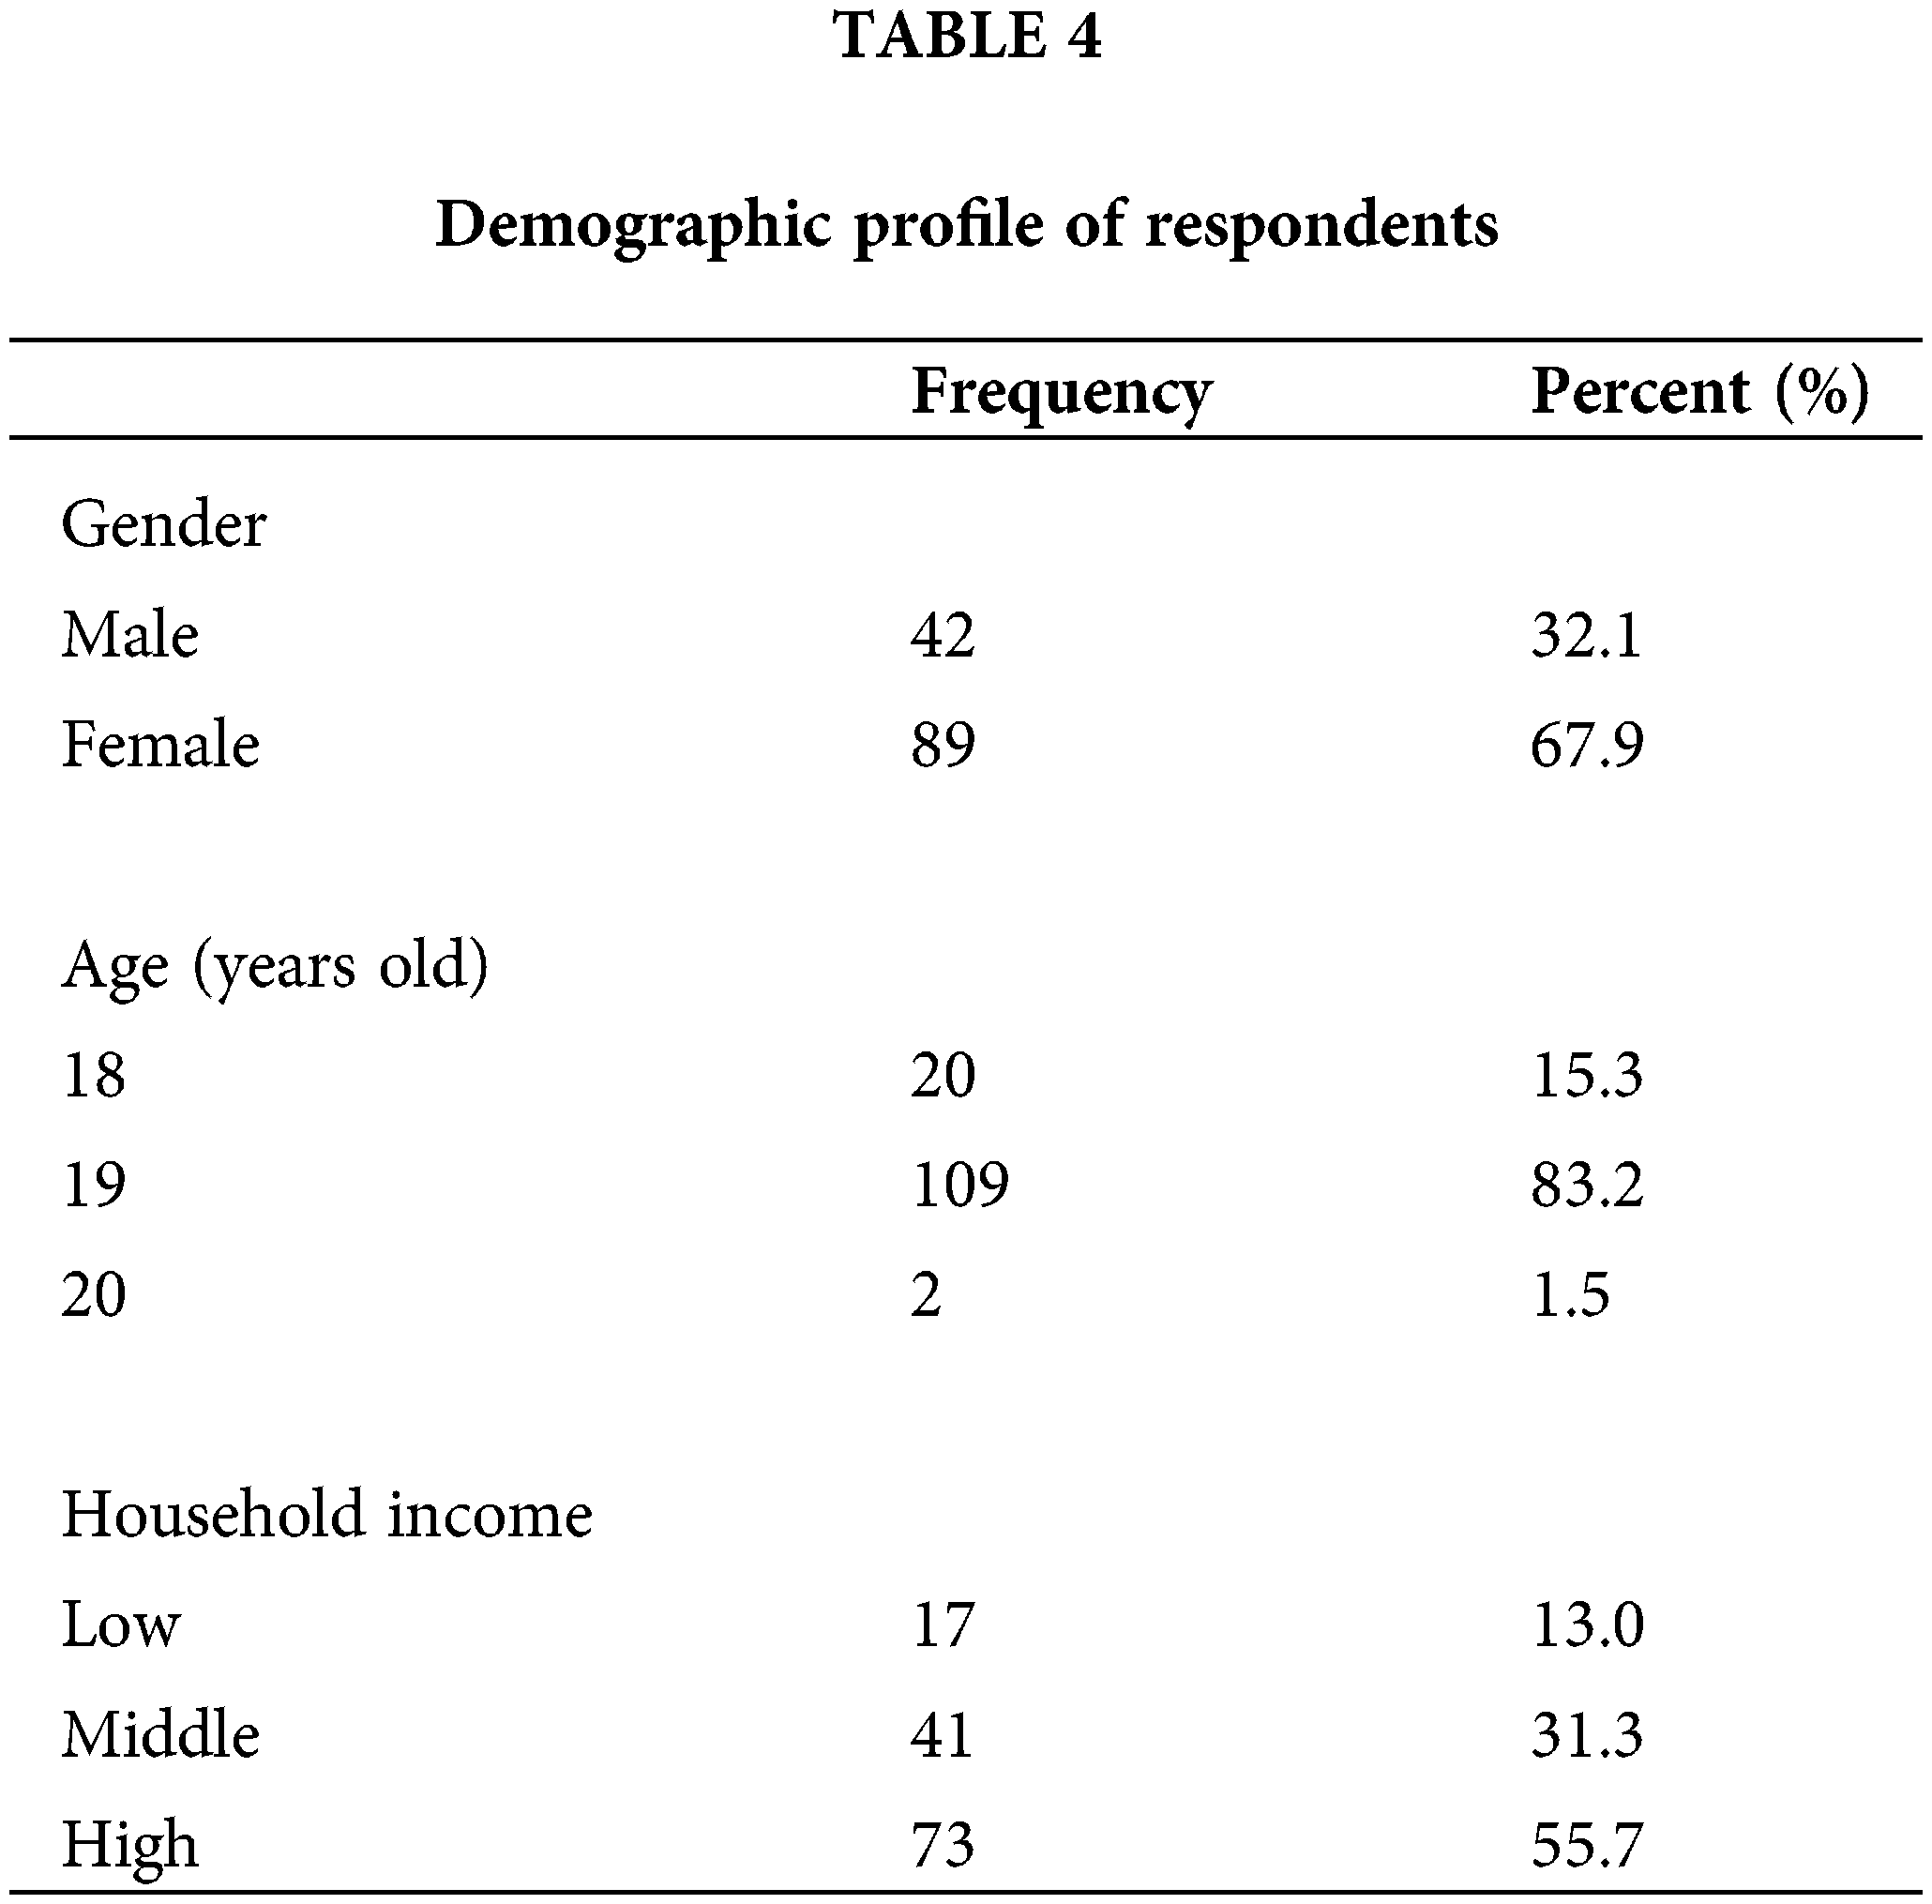
Fig. 2 presents the total number of technological gadgets owned by the respondents. It shows that almost all the students (99.2%) own at least two technological gadgets. On average, every respondent owned 2.57 technological gadgets. There were no respondents found to possessed zero number of technological gadgets, supporting the results in Table 4 that most respondents were able to afford at least one type of technological gadget as they came from families with a high income category.
Types of gadgets possessed by the respondents are presented in Table 5. From Table 5, we can see that smartphones are owned by all the students. Meanwhile, 98.5% of the respondents owned a computer/laptop. This demonstrates that these technological devices are commonly used among the pre-university students for various purposes, such as long-distance communication and information searching. There are 24.4% of students owned a tablet.
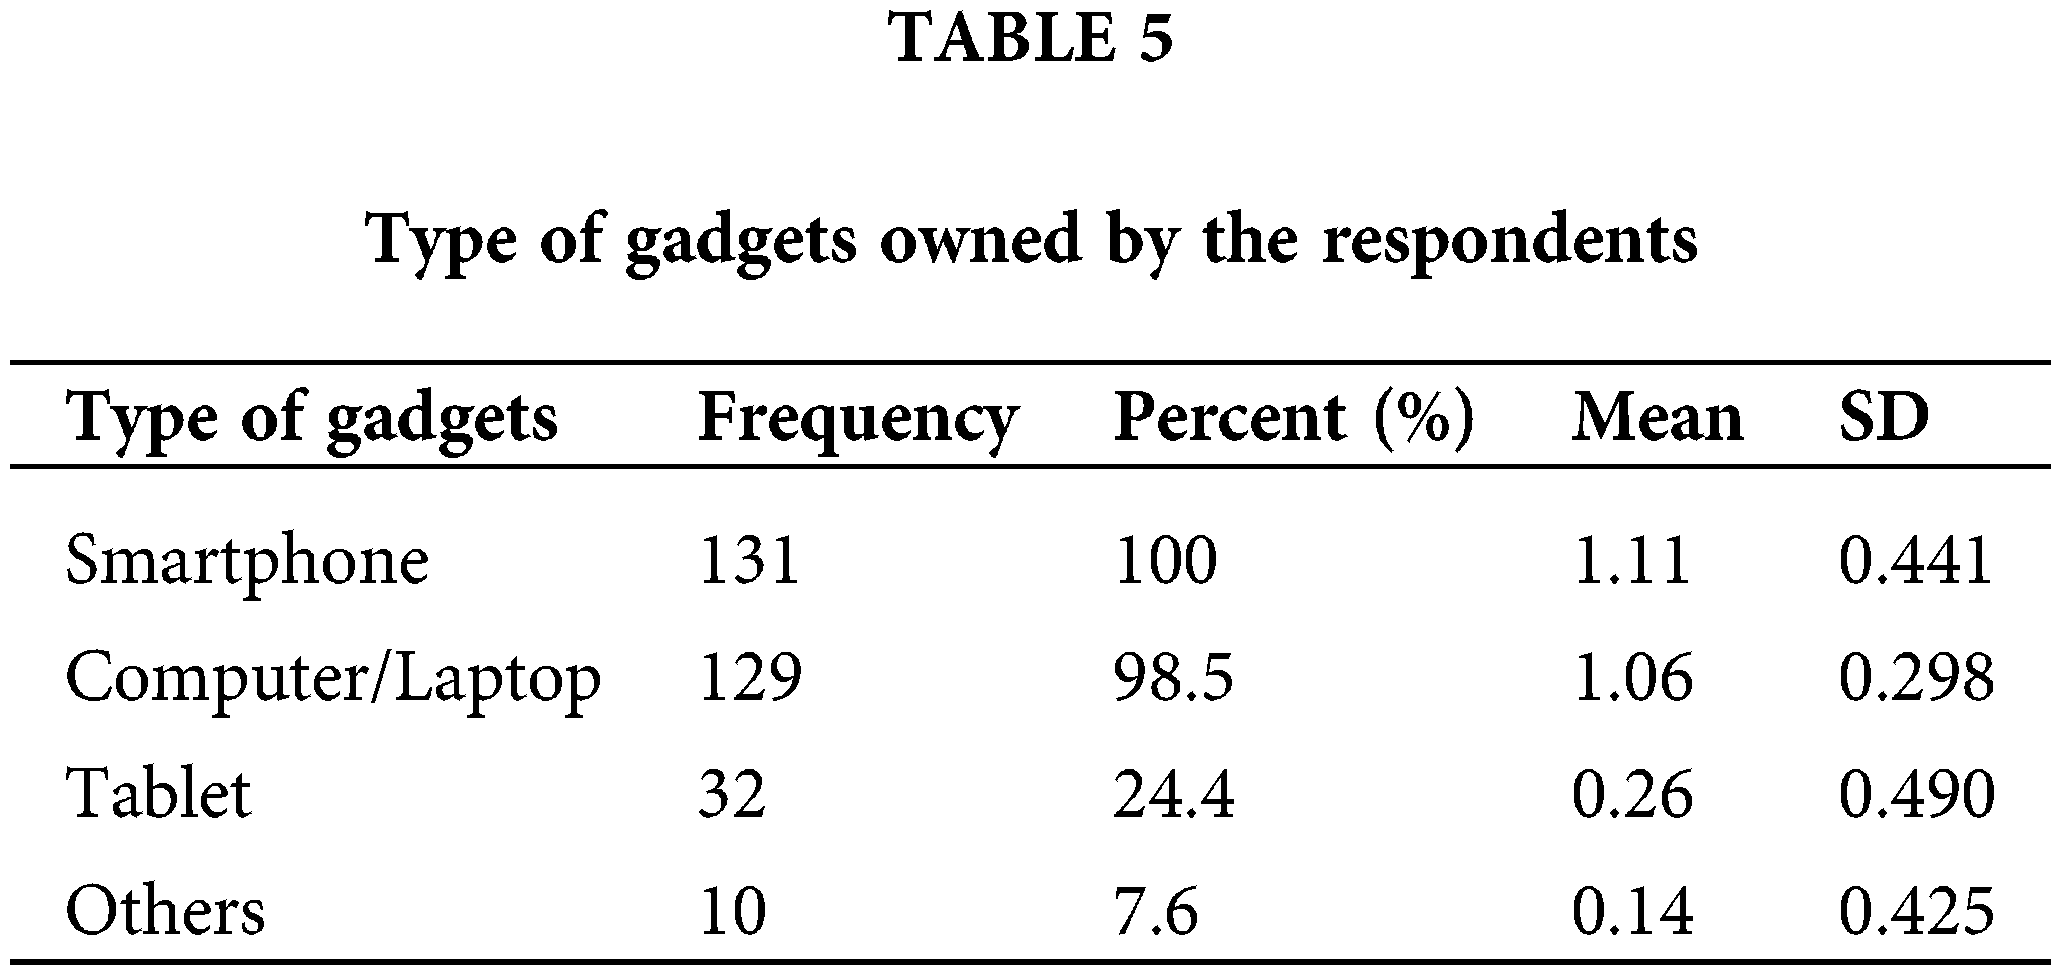
On the other hand, 7.6% owned the Others such as digital camera and PlayStation. Possession of other technological gadgets such as digital camera and PlayStation was minimal because the students’ main responsibility was studying as they aimed to give their best performance academically through assignments or group projects which were done mostly on laptop or smartphones instead of game consoles and other gadgets.
Table 6 shows the time spent daily on using technological gadgets among the respondents. From among 131 students, it was found that the majority, which was 65.6%, used a smartphone for more than 4 h per day. With regard to computer/laptop usage, 35.1% of the respondents spent about 2 to 4 h on this type of gadget in a day. In terms of tablet and other technological gadget usage, the results show that 75.6% and 92.4% of respondents, respectively, do not use tablet devices and other technological gadgets.
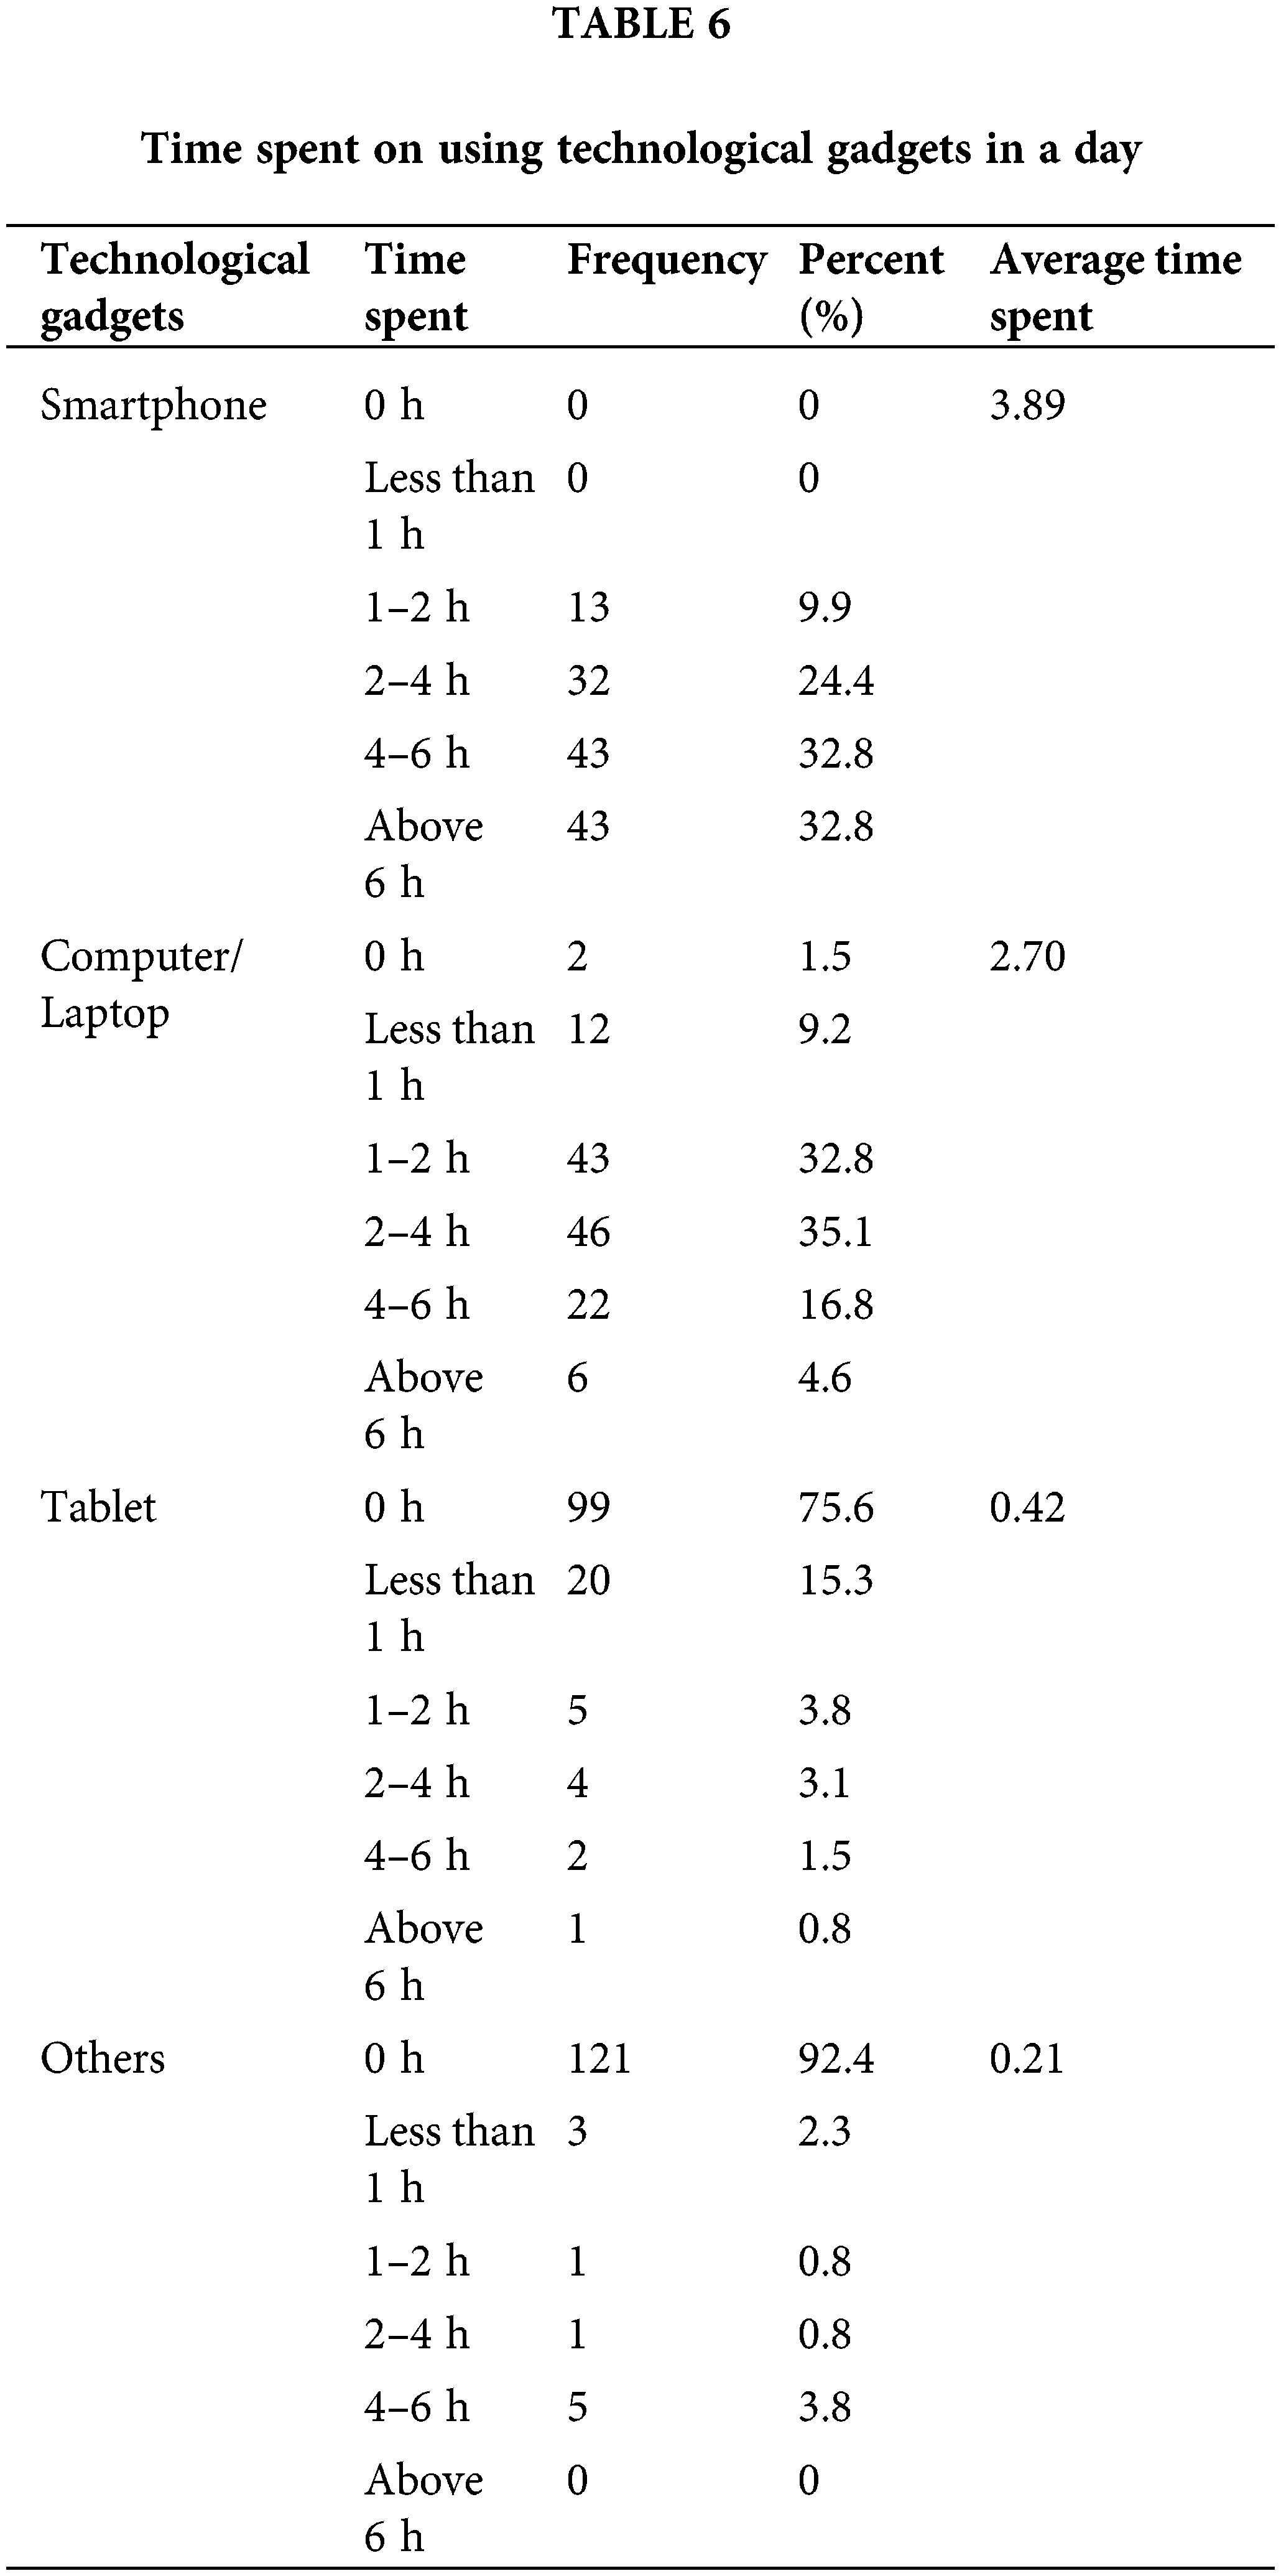
This indicates that the ownership and use of tablets and other technological gadgets is not as high as smartphones and computers/laptops. Meanwhile, the two gadgets that students spend the most time on in a day are smartphone (3.89) and computer/laptop (2.70).
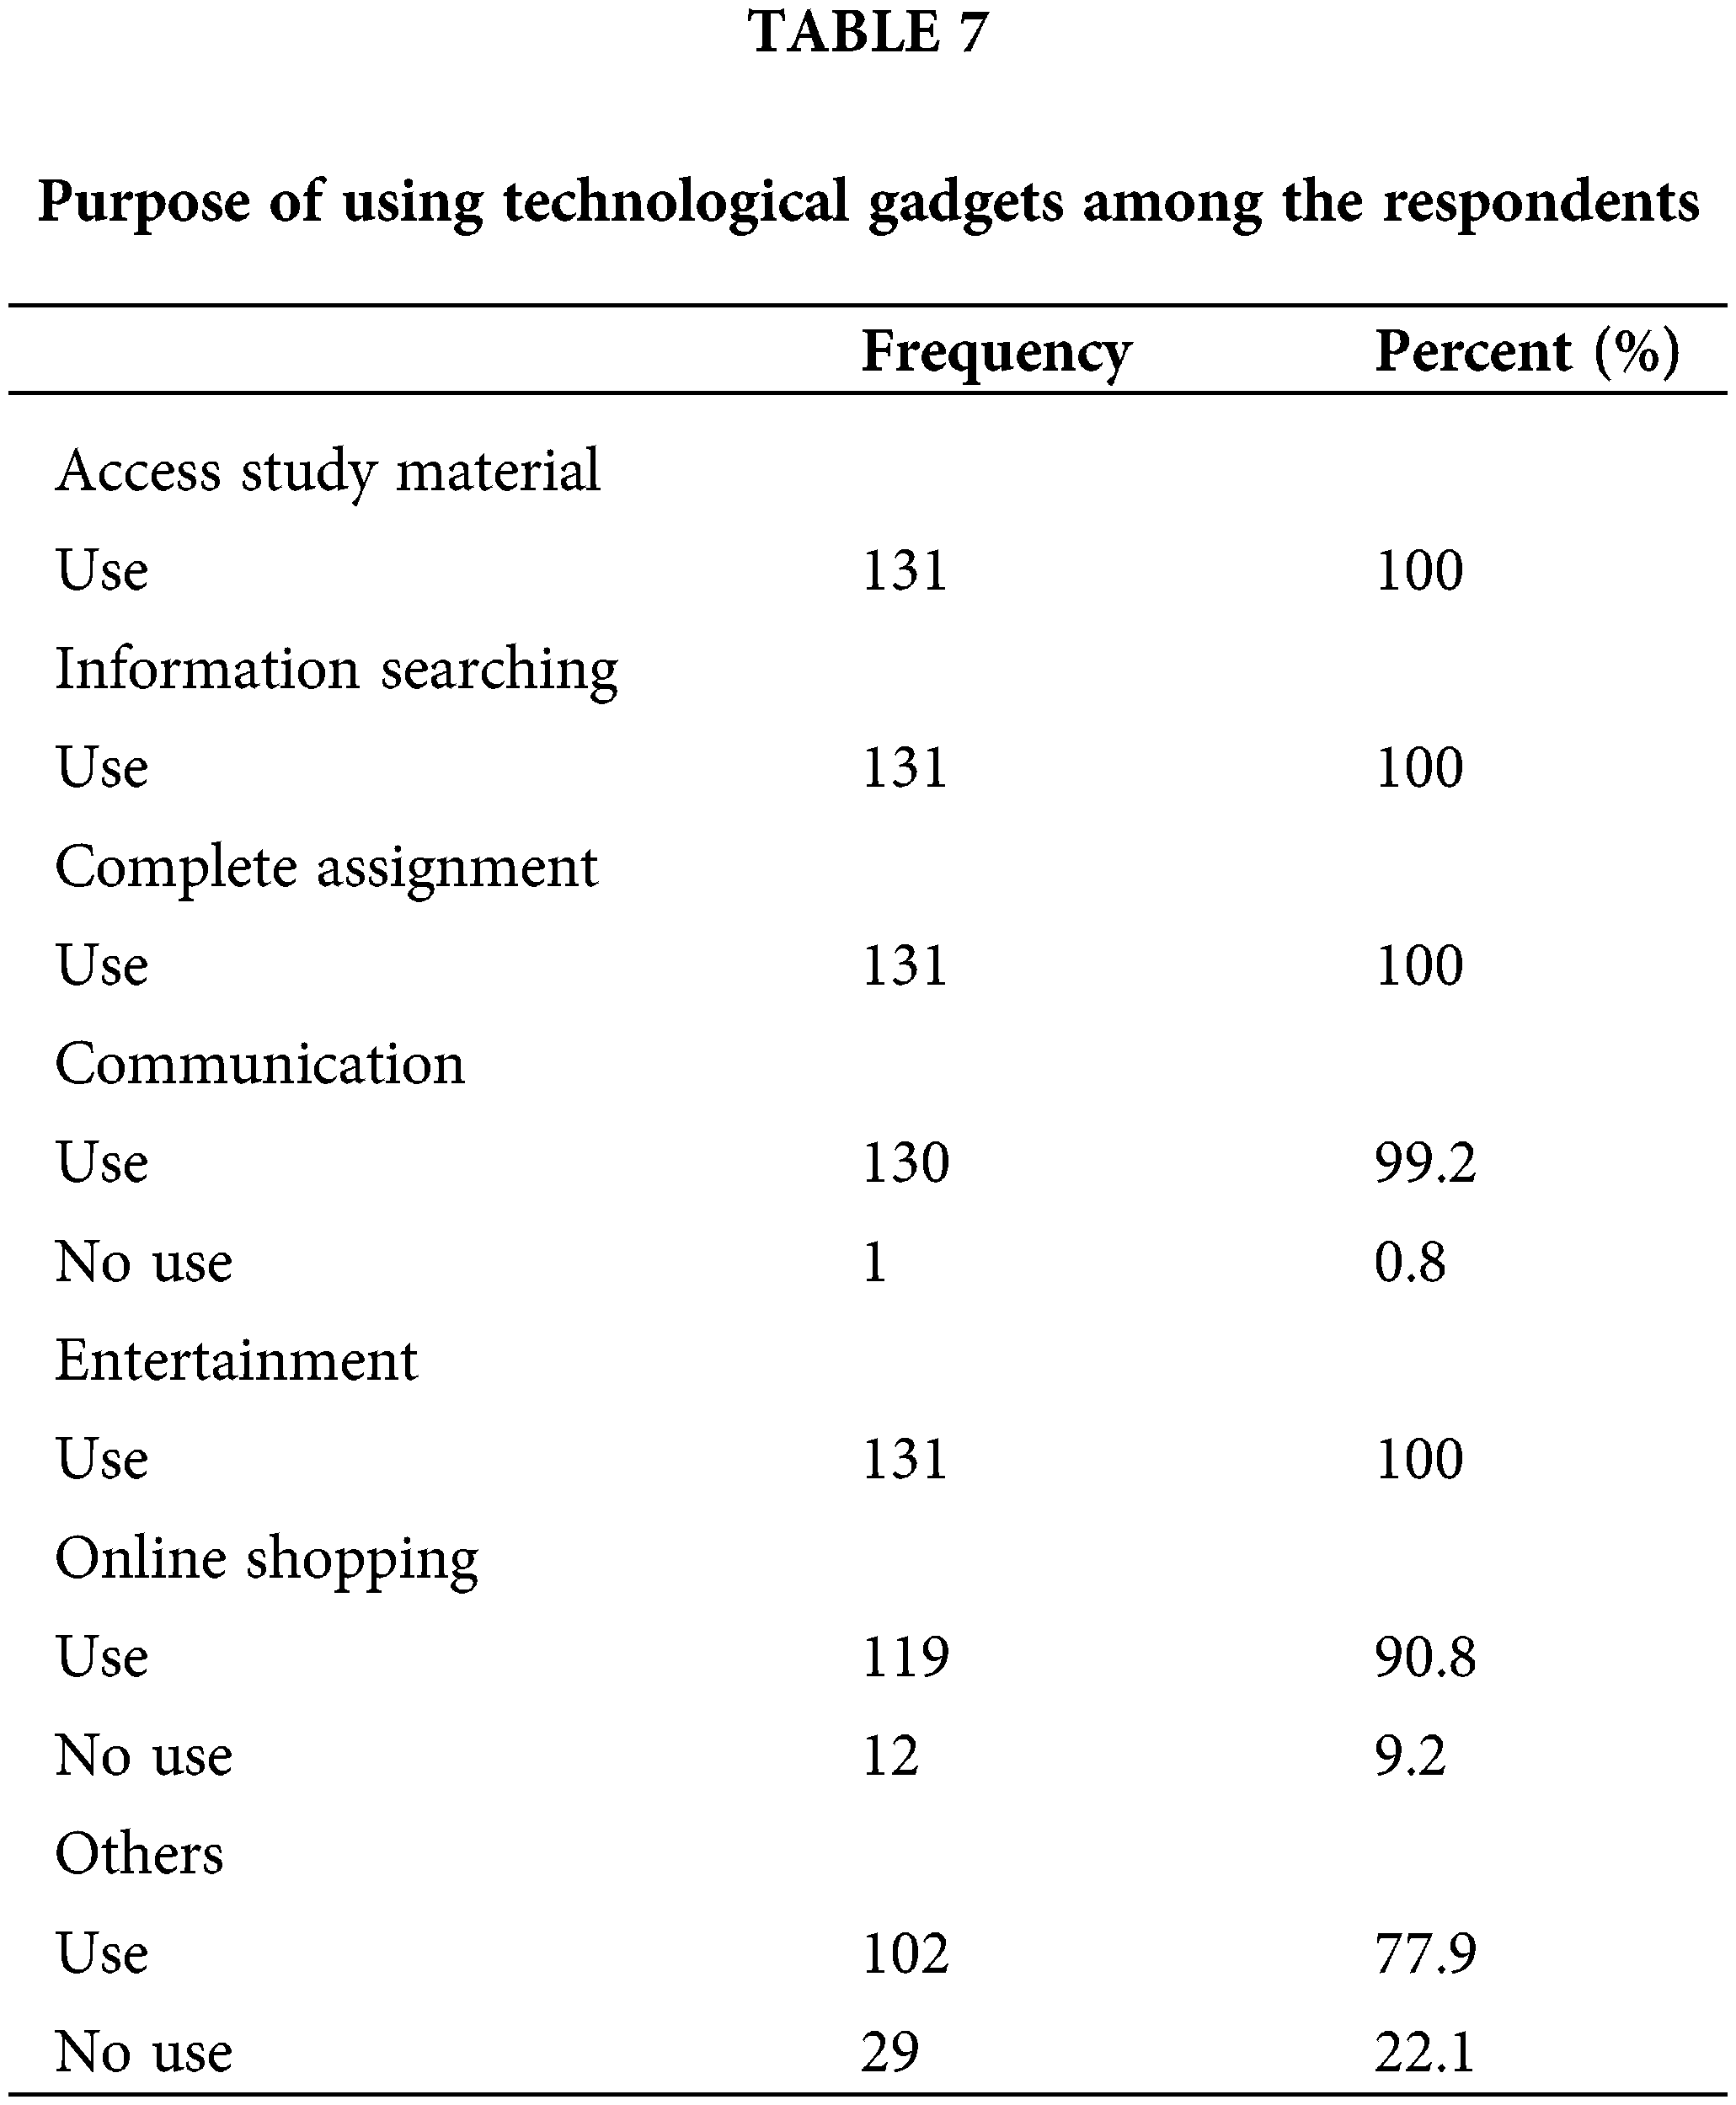
Table 7 depicts the purpose of using technological gadgets among the respondents. From the findings, all respondents used technological gadgets to access study material, search for information, complete assignments and engage in entertainment. About 99.2% and 90.8% of the respondents used technological gadgets for communication and online shopping, respectively. On the contrary, 77.9% of the respondents have different purposes for using the gadgets, which is the Others, such as video editing and creating presentations for school activities.
Nomophobia refers to a psychological condition when people have fear of being refrain from smartphone connectivity and is categorized under anxiety disorders. It is considered as a modern phobia of the digital era and it is related to the addiction problems [13]. Table 8 shows that none of the 131 respondents were identified as normal users. The majority of the respondents, i.e., 70.2%, were classified as moderate nomophobia, followed by 26.7% of the respondents classified as severe nomophobia. Meanwhile, 3.1% of the respondents were categorized as mild nomophobia.

The findings on the level of dependency on technological gadgets among the respondents are also displayed in Table 8. The analysis indicates that 87 respondents (66.4%) and 44 respondents (33.6%) have moderate and high dependency on technological gadgets, respectively. However, none of the respondents were identified as having a low dependency level, implying that technological gadgets play a pivotal role in the daily life of the respondents.
Meanwhile, the hypothesis testing was conducted with respect to gender. Based on the analysis of the findings, there is sufficient evidence to show that there is a significant difference in gadget dependency based on gender. However, it has been discovered that there is no gender difference in nomophobia level.
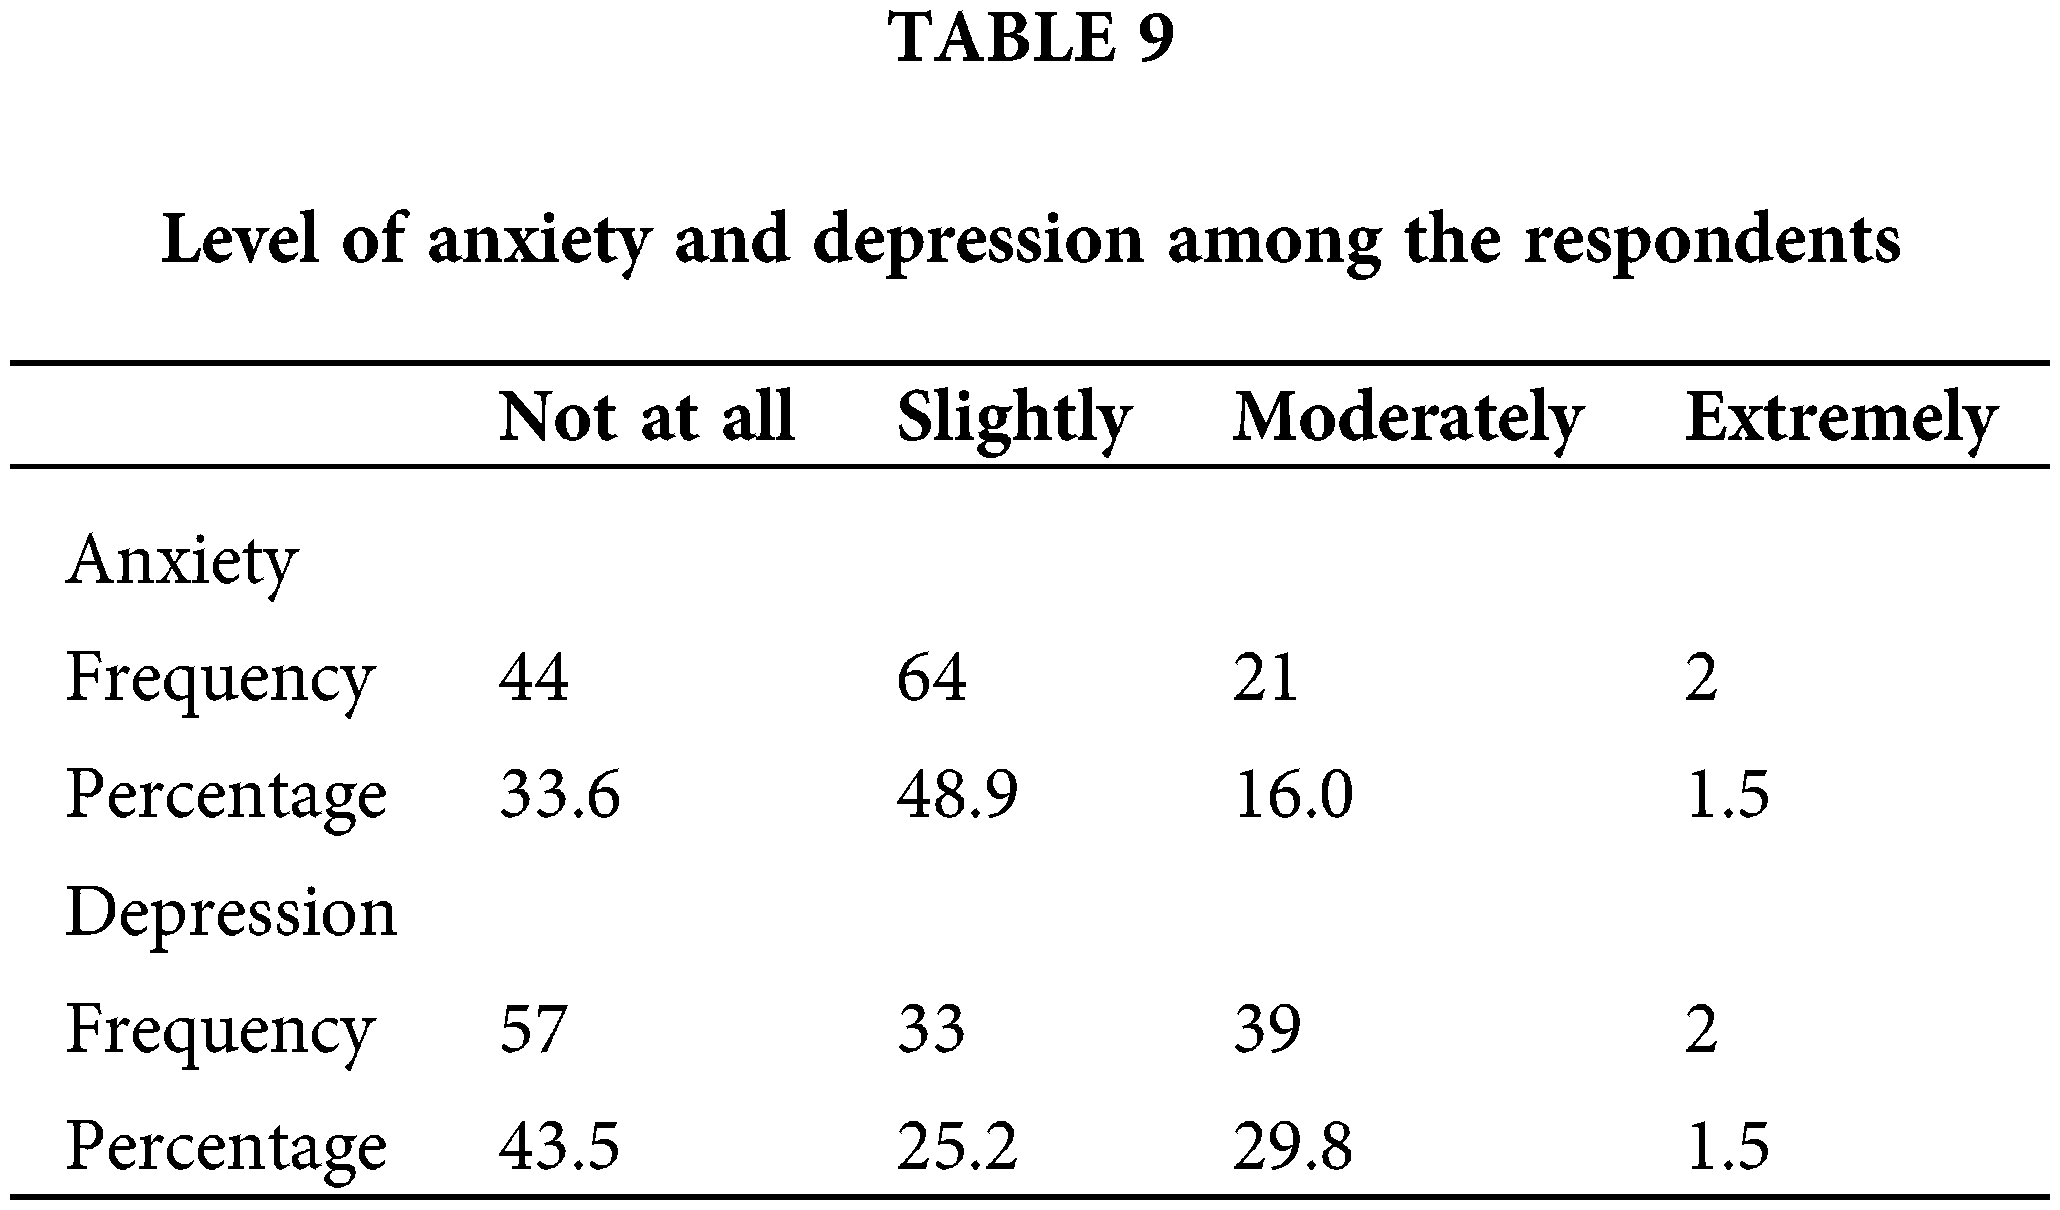
Table 9 demonstrates the level of anxiety and depression among the respondents. The findings indicate that two respondents (1.5%) are suffering from extreme anxiety and depression, respectively. A total of 21 respondents (16.0%) and 39 respondents (29.8%) experienced moderate anxiety and moderate depression, respectively. Another 44 respondents (33.6%) did not experience anxiety while 57 respondents (43.5%) did not experience depression at all.
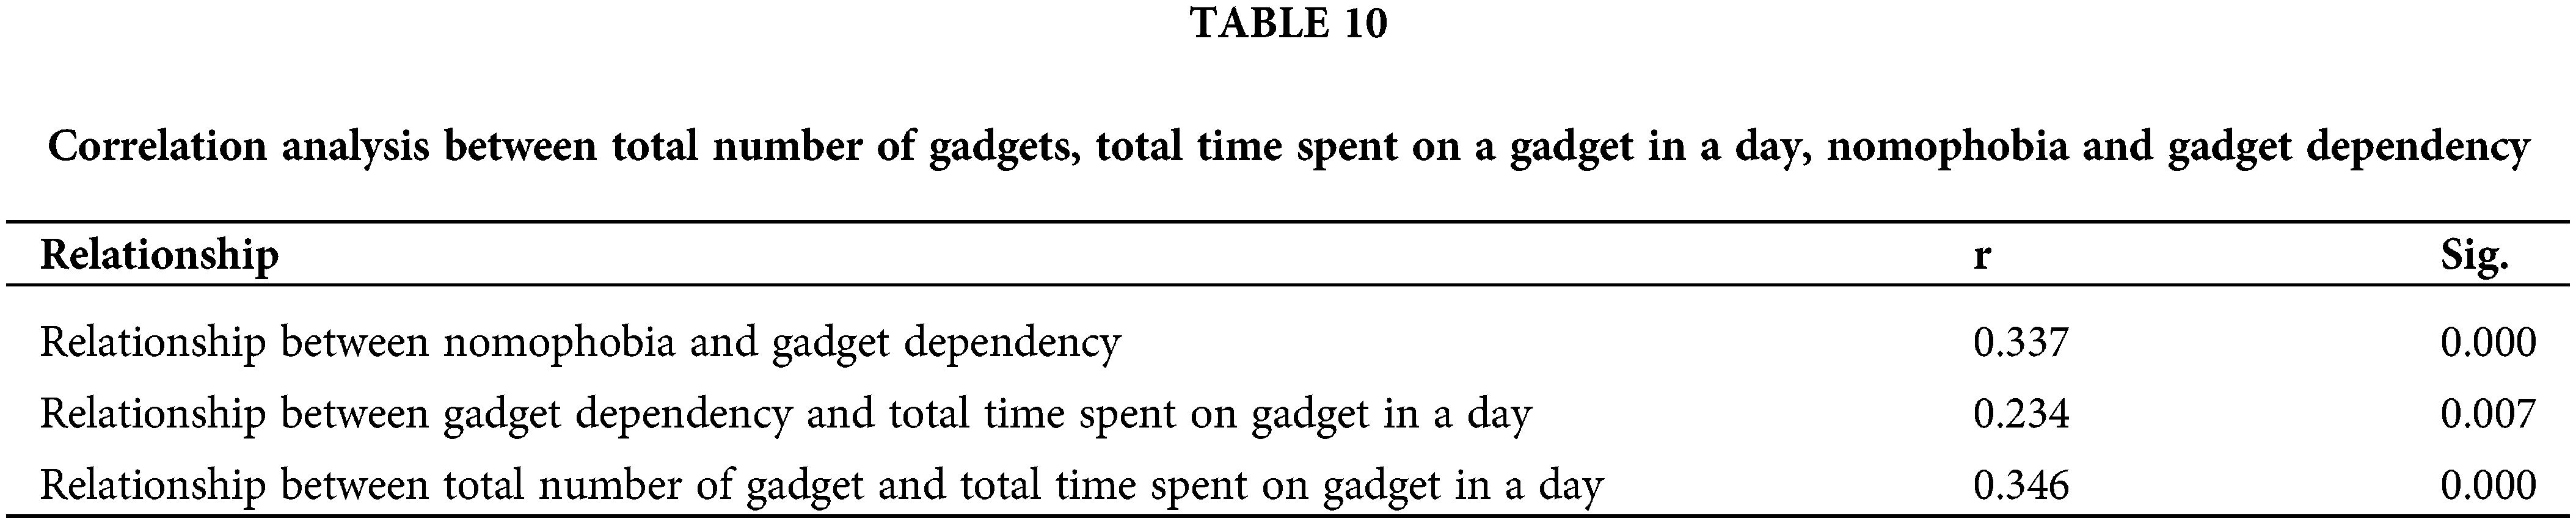
With reference to Table 10, correlation analysis was conducted. The results show that nomophobia has a significant positive correlation with gadget dependency. This demonstrates that gadget dependency can lead to nomophobia, as mentioned above. Meanwhile, there is a positive correlation between gadget dependency and the total number of gadgets, with total time spent on a gadget in a day. This demonstrates that an increase in the number of gadgets the respondents owned, reflects an increase in the time spent on a gadget in a day. Similarly, when the total time spent on a gadget in a day increases, it will increase gadget dependency. The correlation analysis results in Table 10 suggest that a linear and positive relationship exists among the population.
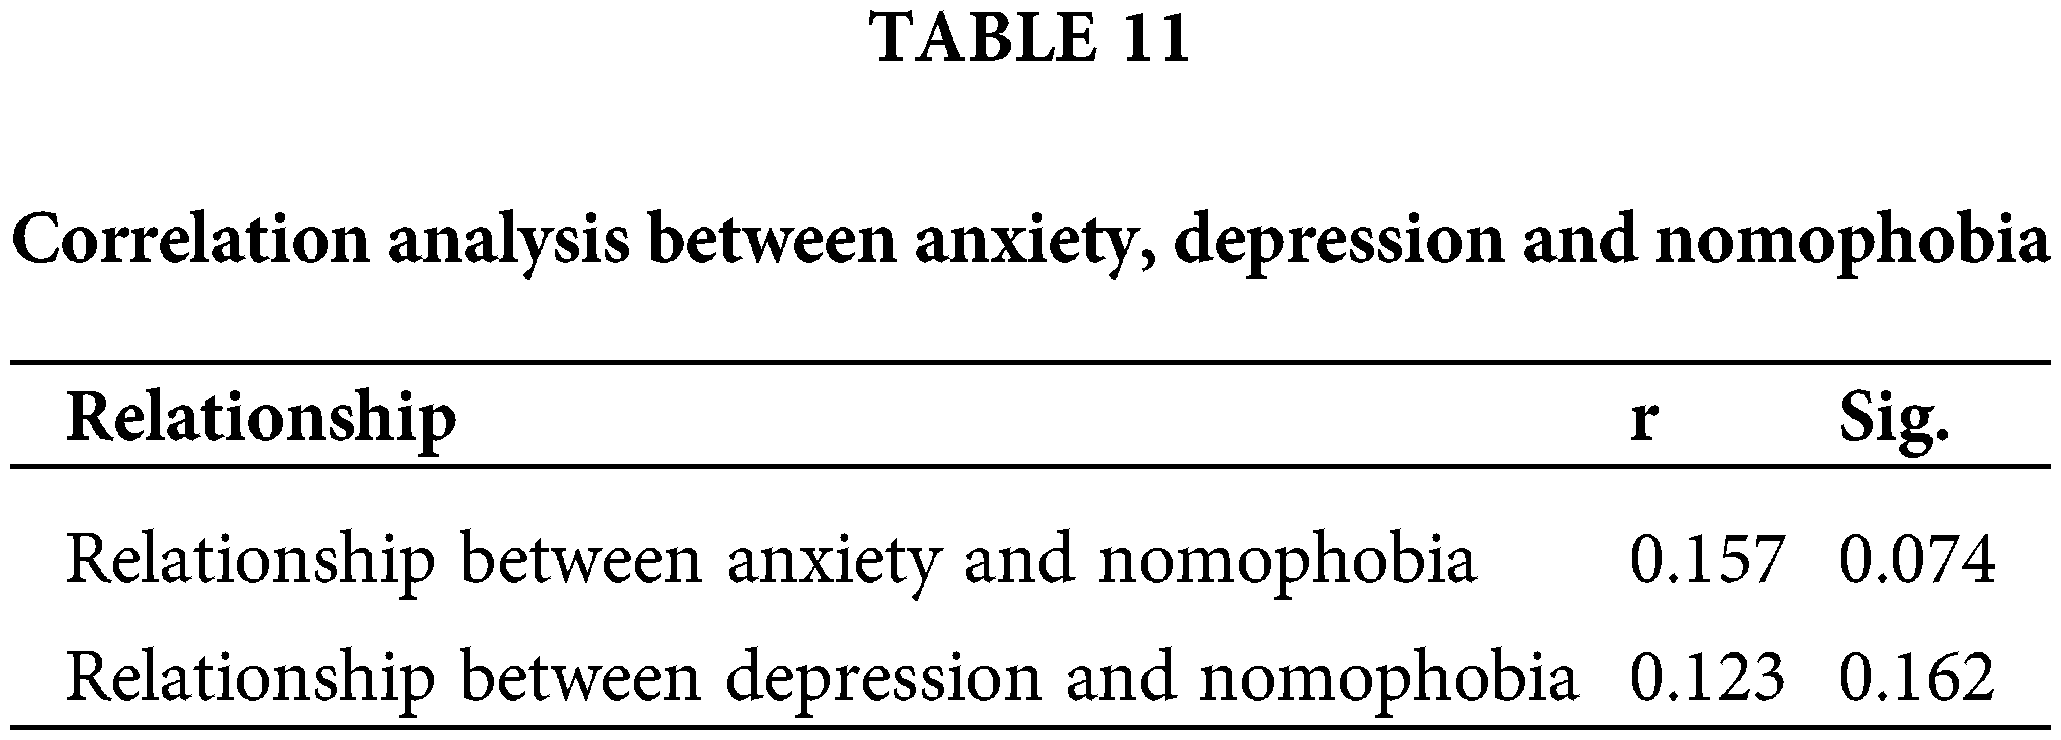
When correlation analysis was conducted based on Table 11, it was noticed that there was a weak positive correlation between anxiety and depression with nomophobia. This indicated that the more severe the nomophobia level, the more severe the anxiety and depression levels. This result was in line with multiple studies conducted in the past, which will be mentioned in the discussion section. However, there was no significant relationship between anxiety and depression, with nomophobia. This showed insufficient evidence to suggest that a positive correlation also exists in the population for anxiety and depression, with nomophobia.
Multivariate analysis (MANOVA) was conducted based on the variables from Tables 9 and 10 with respect to gender and household income. Here, anxiety, depression, total number of gadgets, total time spent on a gadget in a day, nomophobia and gadget dependency were considered as dependent variables while gender and household income were considered as fixed factors.
The multivariate tests results based on Wilks’ lambda criteria showed that there was a significant effect of the gender on the six dependent variables (Wilks’ lambda = 0.903, F(6,124) = 2.228, p-value < 0.05, partial η2 = 0.097). More specifically as shown in Table 12, where a p-value of ≤0.05 is considered significant, the tests of between-subject effects showed significant effects for gender difference on gadget dependency. No significant differences were found for difference in gender on total number of gadgets, total time spent on a gadget in a day, nomophobia, anxiety and depression from the analyses. These findings once again proved the results of hypothesis testing obtained in Table 8.
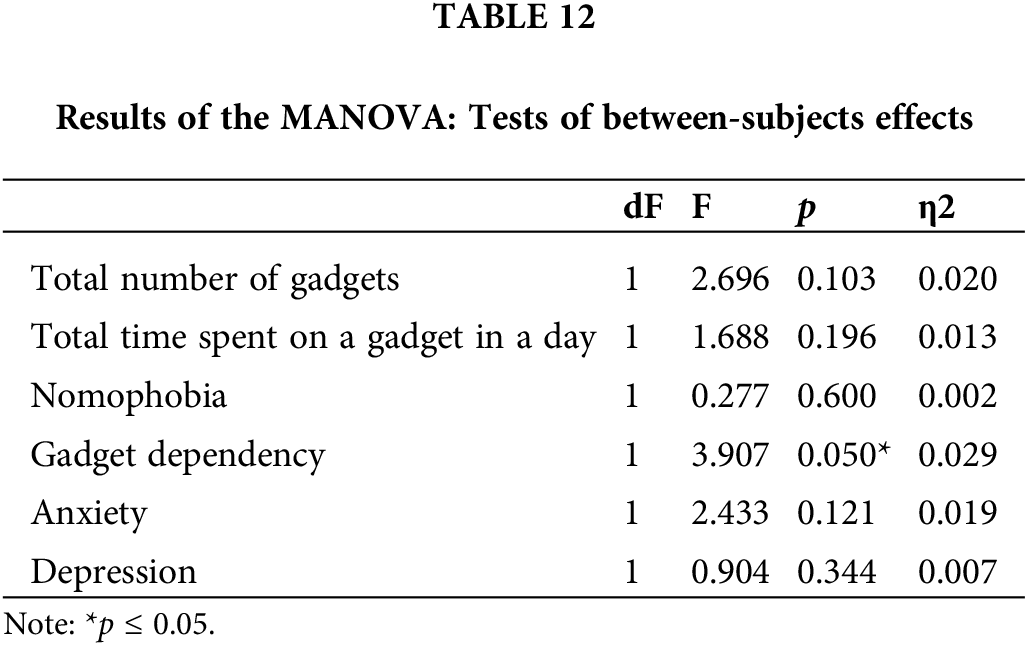
MANOVA analysis with respect to household income based on Wilks’ lambda criteria was statistically non-significant on the six dependent variables (Wilks’ lambda = 0.914, F(12,246) = 0.937, p-value = 0.510, partial η2 = 0.044). This indicates the absence of the meaningful household income differences on overall dependent variables. As seen from Table 13, means and standard deviations for each dependent variable are presented with respect to different categories of household income. The mean and standard deviation for three household income categories in each dependent variable showed no much difference from each other.
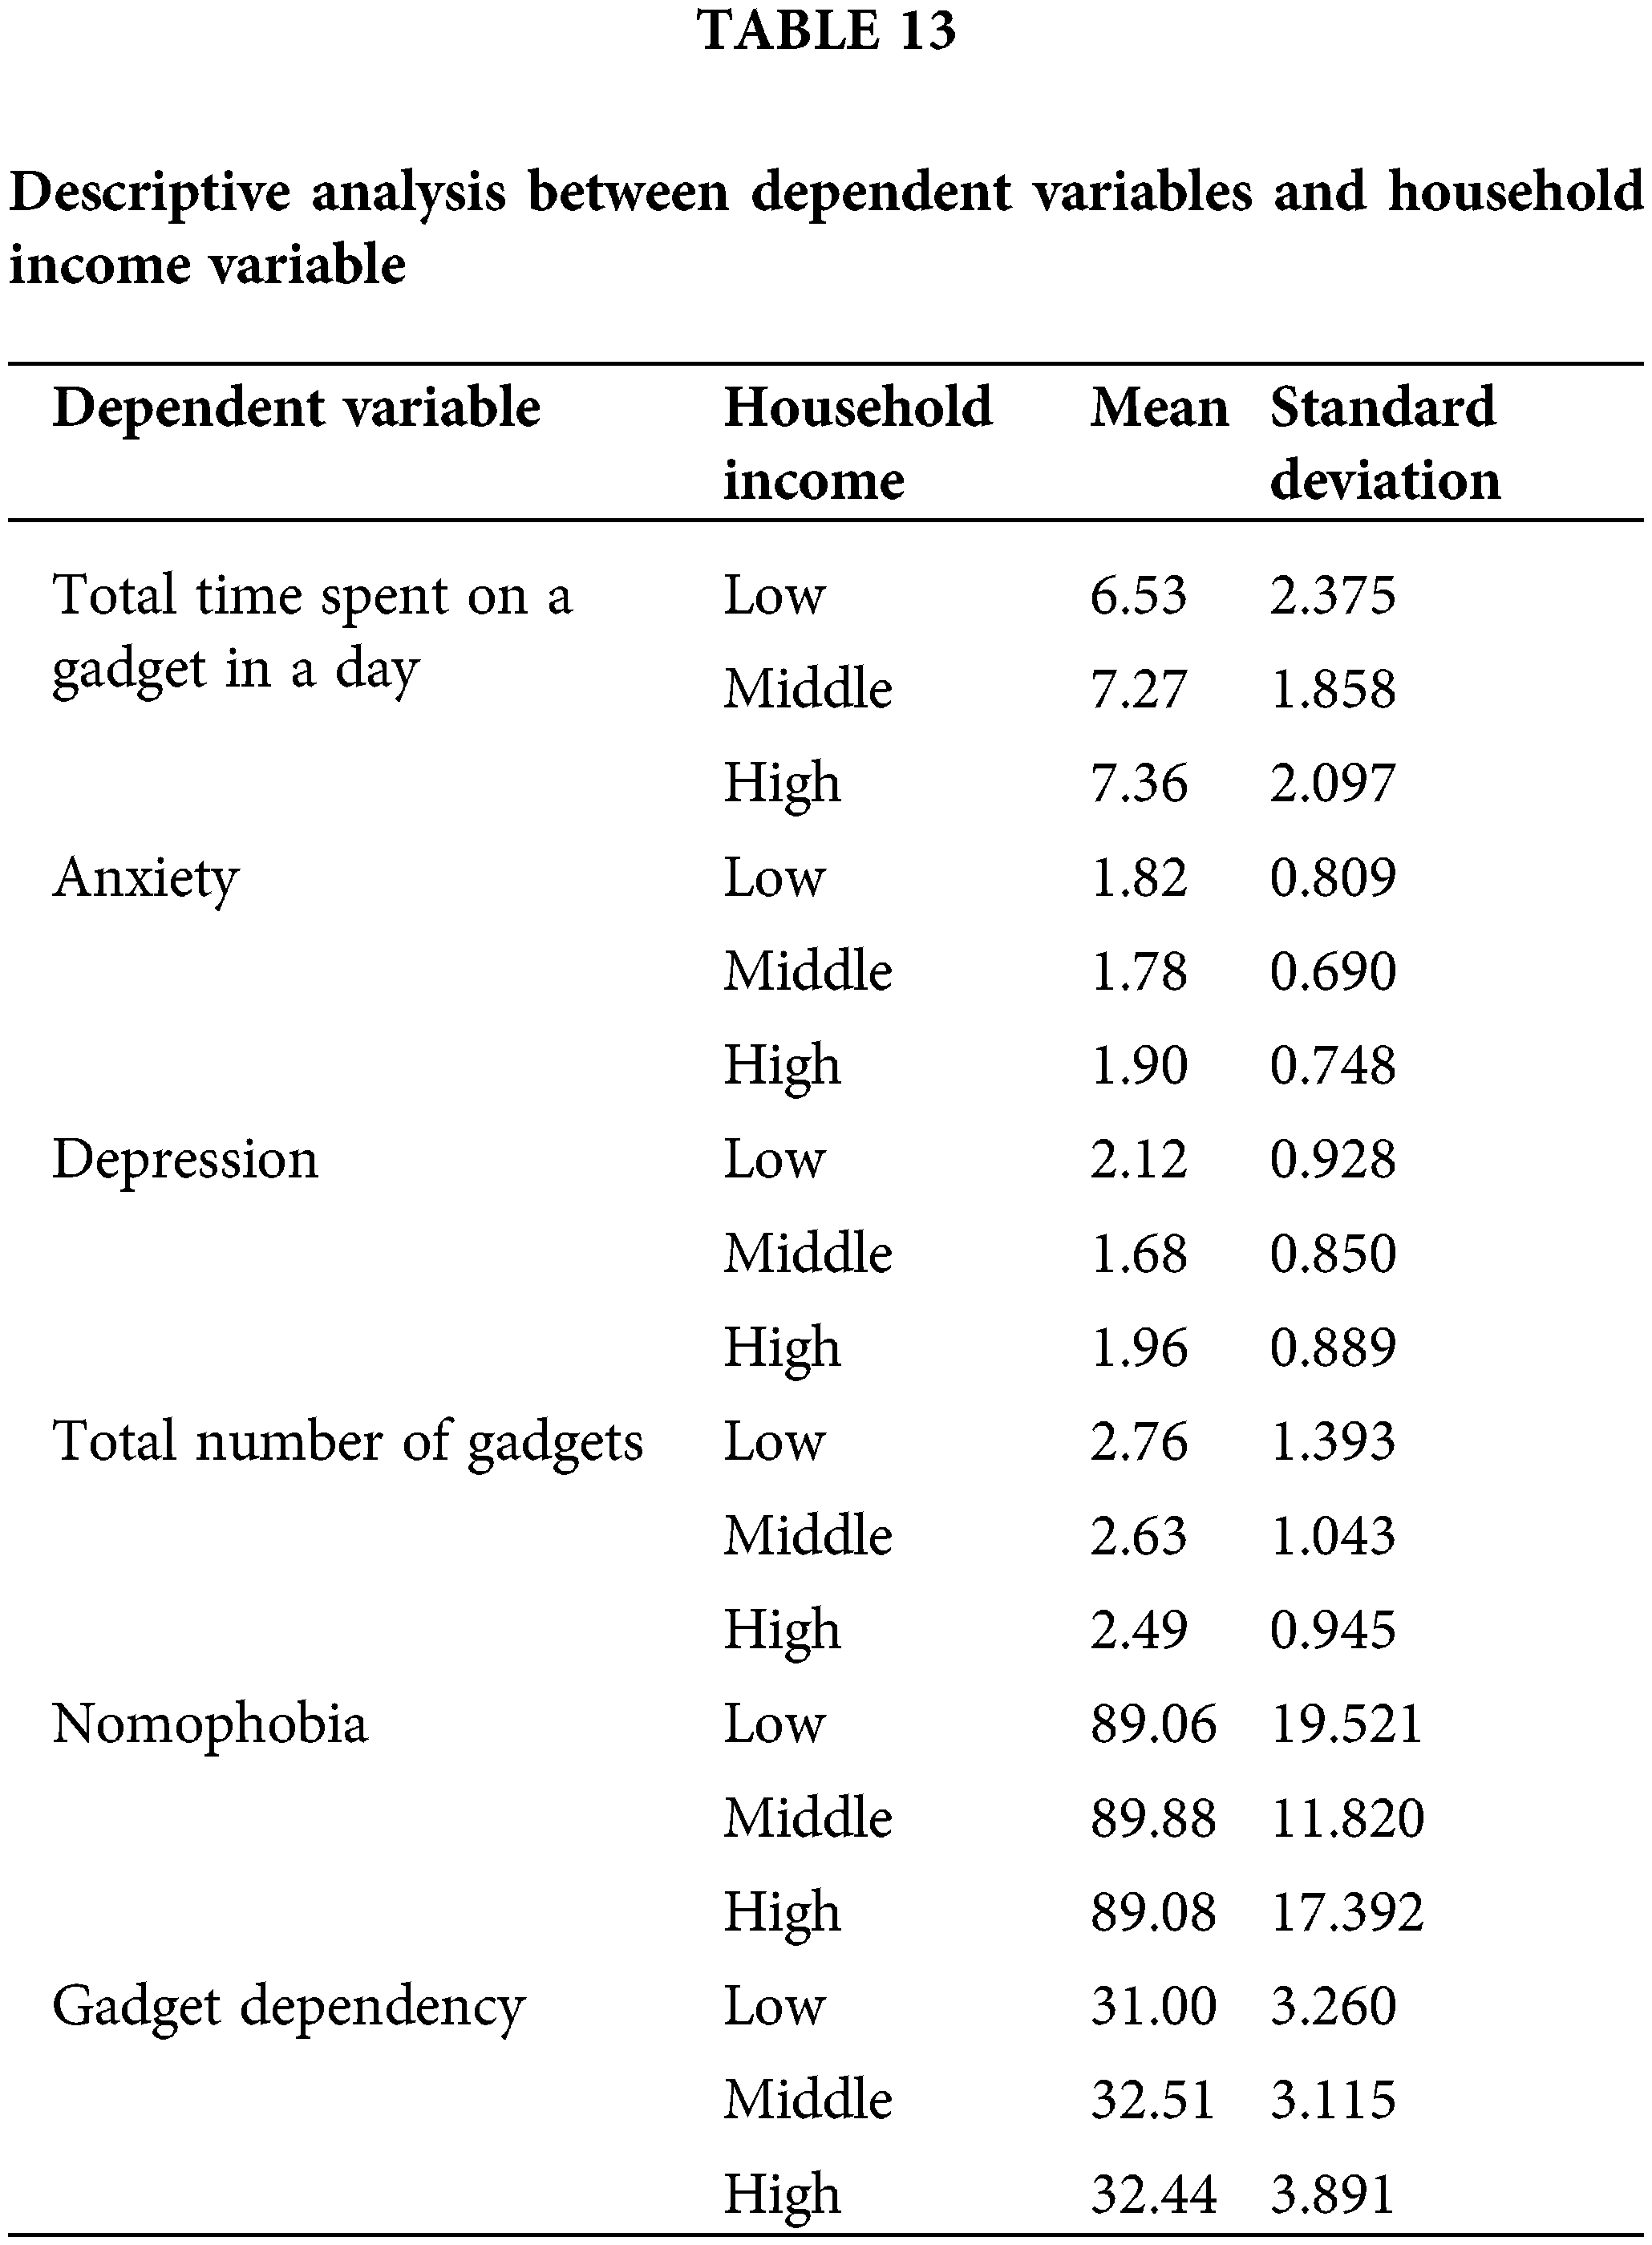
For example, based on the dependent variable total number of gadgets, the mean values for low, middle and high income categories were 2.76, 2.63 and 2.49, respectively. Meanwhile, the values of standard deviation for low, middle and high income categories were 1.393, 1.043 and 0.945, respectively. Hence, it was apparent that there was no significant effect of the household income on the six dependent variables.
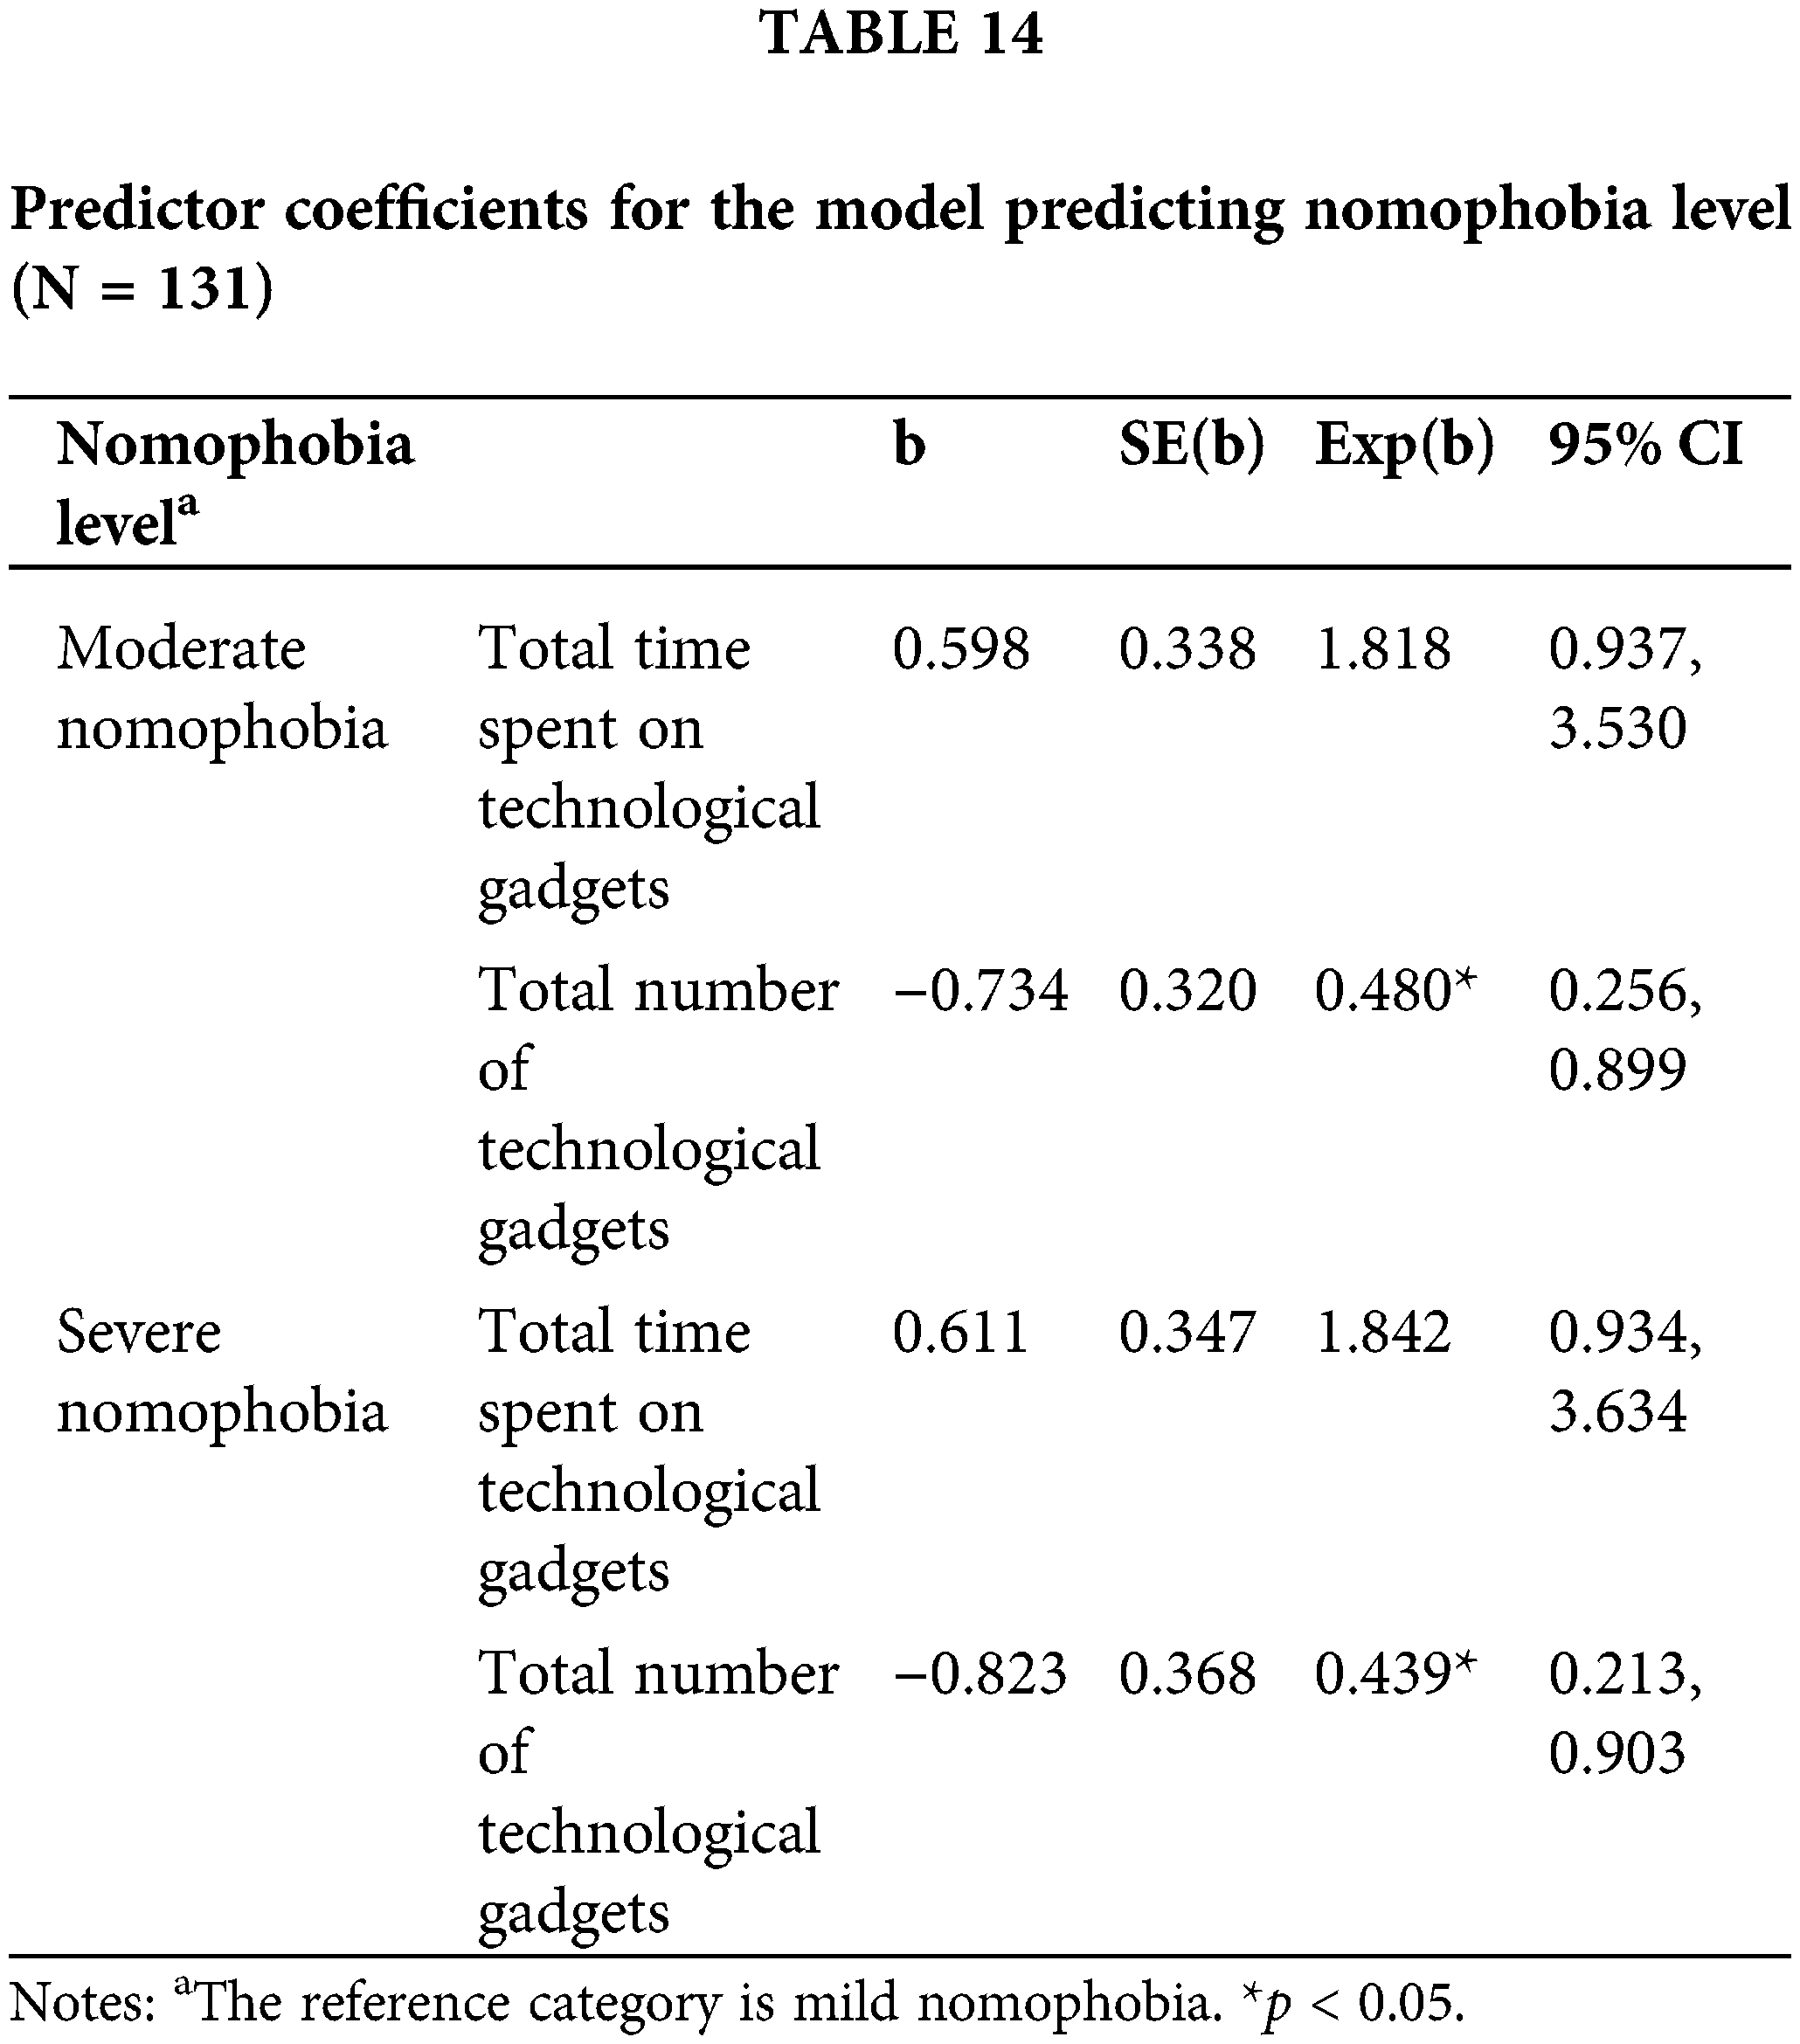
In order to estimate the probability of nomophobia and dependency for respondents, logistic regression will be conducted. Here, total time spent on a gadget in a day and total numbers of gadgets will be taken as independent variables to predict the level of nomophobia and gadget dependency. Note that the binary logistic regression and multinomial logistic regression will be used to predict the level of dependency and level of nomophobia, respectively. Table 14 allows us to determine which of the independent variables significantly predict whether a participant falls into the “moderate nomophobia” or “severe nomophobia” category (i.e., comparison group) vs. the “mild nomophobia” category (i.e., baseline). Here, mild nomophobia is the reference category. From the results, total number of technological gadgets at moderate nomophobia and severe nomophobia is significant with p < 0.05.
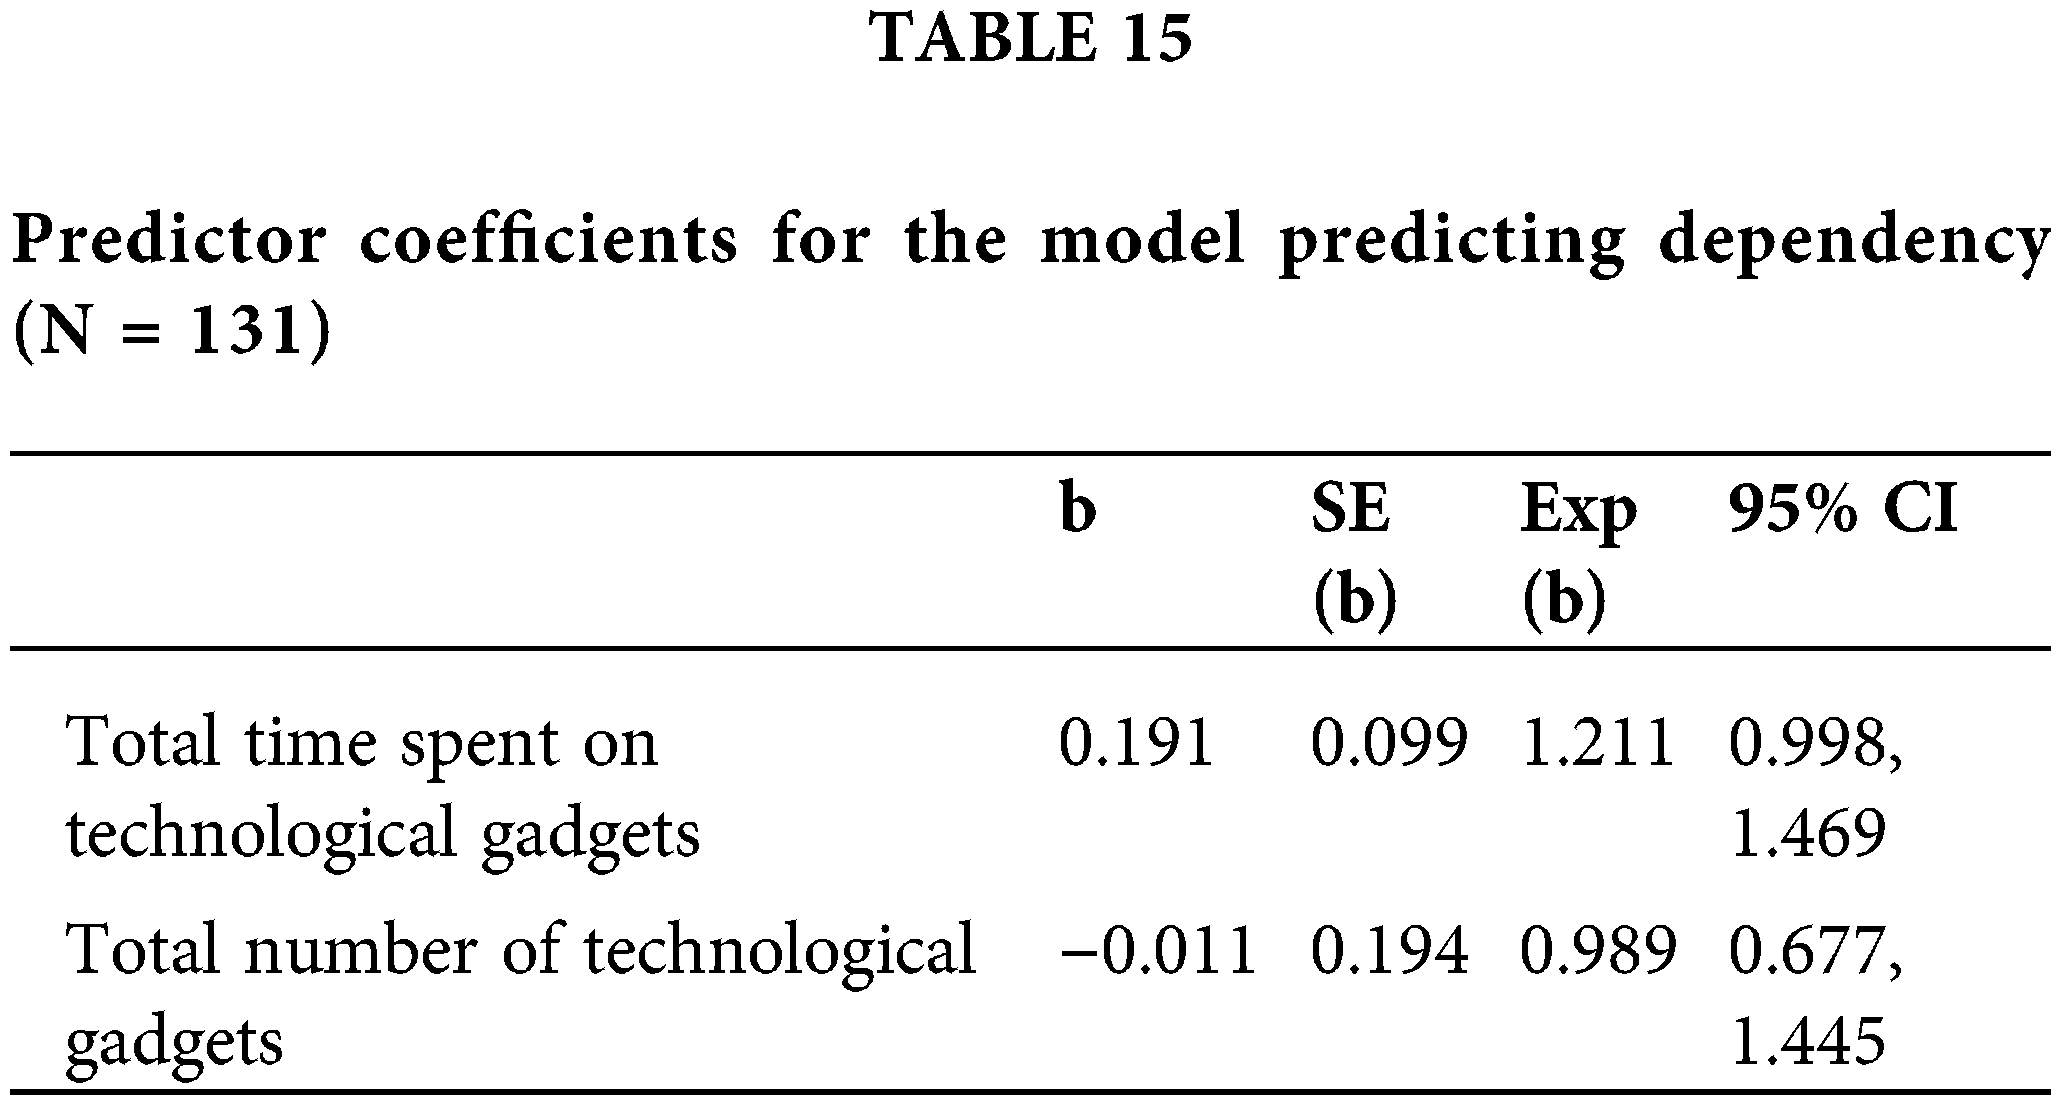
In order to estimate the probability of developing dependency, a binary logistic regression analysis was conducted. The probability of developing dependency was estimated using total time spent and total number of technological gadgets. Hosmer and Lemeshow test results confirmed that the model was a good fit for the data, χ2 (df = 8, N = 131) = 5.26, p = 0.729. Coefficients for the model’s predictors are presented in Table 15.
In this study, we found that all respondents (100%) used technological gadgets to access study material, search for information, complete assignments and engage in entertainment (see Table 7). Meanwhile, not all respondents used their gadgets for purposes such as communication, online shopping and others for example, video editing and creating presentations for school activities. These findings were quite similar to that conducted by You et al. [14], where schoolwork, entertainment and social networking were the most frequent online activities done by the participants, followed by online shopping and online gaming. From here, it could be understand that spending a lengthy time on technological gadgets does not necessarily signify the trait of nomophobia. The time spent for purposes such as accessing study material, information searching, completing assignments and communication were unavoidable, and were known as necessity driven for students. On the contrary, those who spent extra hours on technological gadgets for pleasure-driven purposes such as online gaming, social networking and watching movies were probably at a higher risk for nomophobia [7].
We also identified that majority of the respondents belong to moderate nomophobia, severe nomophobia being second, mild nomophobia being third whereas none of the respondents were identified as normal users (see Table 8). Compared to a study in Turkey, the results showed that 8.5% of the university students were severely nomophobia, 71.5% were moderate and 20.0% were mildly nomophobia [15]. Another study of university students in Kuwait discovered that 18.0% were mild nomophobia, while 56.2% and 25.8% were moderate nomophobia and severe nomophobia, respectively [16]. The results from all the above studies highlight that nomophobia was very common among university students. This could be due to several factors including the availability of time, Internet literacy, unlimited access to the Internet, the psychological and developmental characteristics of young adulthood and limited or no parental supervision as they were living far apart [17]. Therefore, university students were the highly vulnerable group to develop nomophobia. Here, preventive measures should be implemented to avoid the further development of nomophobia and promote a healthy lifestyle.
From Table 8, we found that most of the respondents were classified as moderate dependency, 44 respondents (33.6%) being high dependency while no respondents fell into the low dependency category. This reflected the significance of technological gadgets in daily life of the respondents. Our findings were higher when compared to a similar study conducted in China among 1062 Chinese undergraduates, where the prevalence of high dependency was found to be 21.3% [18]. The prevalence of high dependency in our study was found to be lower when compared to another similar study done in 2018 in Karnataka, India among 200 undergraduates, where the high dependency was 45% [19]. The disparity in results may be attributed to performing the latter research among the undergraduates of similar disciplines.
As shown in Table 8, we conducted hypothesis testing with respect to gender and found sufficient evidence to show that there was a significant difference in gadget dependency based on gender. Our finding was similar to a previous study, which reported that gender was significantly associated with gadget dependency (significant score = 0.008) [19]. However, we found no difference in nomophobia with respect to gender through hypothesis testing. This implied that difference in gender did not affect respondents’ nomophobia level. Our result was supported by studies made by Argumosa-Villar et al. and Kaviani et al. [20,21]. Meanwhile, this finding was contradict to the other studies [22,23] which revealed there was a significant difference in nomophobia based on gender. The difference in our results from other studies may be due to the difference in the purpose of technological gadgets usage among male and female respondents. Further investigations were needed to study the influence of gender on nomophobia.
In reference to Table 11, our study revealed a weak positive correlation between anxiety and depression with nomophobia. This result was in line with the study by Kara et al. [24], where anxiety was found to have a significant correlation with nomophobia. Gadget-induced anxiety could have long term negative effects on one’s overall health if one is constantly connected to the gadget. Moreover, Sharma et al. [25] found that nomophobia was significantly associated with anxiety and depression. Our findings were also consistent with the study conducted by Santl et al. [26], which revealed that individuals with more severe nomophobia level were reported with more severe level of depression and anxiety. Even though there was a weak positive correlation, we were unable to prove a significant relationship between anxiety and depression, with nomophobia. This showed insufficient evidence to suggest that a positive correlation also existed in the population for anxiety and depression, with nomophobia.
Based on multivariate analysis of variance (MANOVA) (refer Table 12), gender was statistically significant to gadget dependency. This finding was supported by Kumar et al. and Yang et al. [19,27], as they stated that female adolescents exhibited a higher degree of gadget dependence compared to male adolescents. Another study by Mabaroh and Sugianti [28] found that gender was statistically significant to depression, which was contradict with our finding. As for gender and nomophobia, this study found that gender was statistically non-significant to nomophobia. This result was different from that of Arpaci et al. and Qutishat et al. [22,23] but similar to that of Argumosa-Villar et al. and Kaviani et al. [20,21]. Findings from MANOVA managed to support the results obtained from hypothesis testing in Table 8. In view of this, an in-depth data analysis is worth to focus to identify the nomophobia and gadget dependency.
From Table 14, when there is an hour increase in total time spend, the odds ratio of developing moderate nomophobia rather than mild nomophobia by 1.818 with the assumption that the number of gadgets is held constant. Similarly, looking at total time spend for severe nomophobia level, the Exp(b) is 1.842. This represents that for every one hour added to time spend, the odds ratio of the participant facing severe nomophobia rather than mild nomophobia increase by 84.2%. For the “moderate nomophobia”, the “total number of technological gadgets” predictor is negative and significant (b = −0.734, SE(b) = 0.320, p < 0.05). This indicates that for each one unit increase on the technological gadgets, the log-odds of a case falling into the “moderate nomophobia” category (relative to the “mild nomophobia” category) is predicted to decrease 0.734 units. Meanwhile, Exp(b) = 0.480 shows that with increasing total number of technological gadgets on this predictor, the odds of falling into the “moderate nomophobia” category as changing by a factor of 0.480. In summary, by looking at the Exp(b), it demonstrates that as total time spent is increasing, there is greater probability the participants develop “moderate nomophobia” or “severe nomophobia” compare to the “mild nomophobia”. On the contrary, with increasing total number of technological gadgets, the probability of developing “moderate nomophobia” or “severe nomophobia” is decreasing and the probability of developing “mild nomophobia” is increasing. This shows that the participant may have high number of technological gadgets used for various purposes for example academic as mentioned before.
As demonstrated in Table 15, the odds ratio for total number of technological gadgets indicated that if an increase of one unit of technological gadgets, there was a predicted 1.1% reduction in the probability of a participant in developing high dependency. On the other hand, as Exp(b) is 1.211 for total time spent on technological gadgets in a day, this indicates that a higher probability of developing high dependency. Last but not least, scarcity of time caused this study to concentrate solely on technological gadgets users. Upcoming studies may include a control group to enable a thorough comparison between with and without the usage of technological gadgets in order to have in-depth study. Future researchers could consider employing different methods of data collection such as doing weeks of observation and interviews to have an overview of the status of nomophobia and gadget dependency.
Technology acts as the driving force that propels the lives of today’s modern society. Following this, many types of technological devices have been invented. It is unavoidable that technological devices have become a substitute in our daily life. This study can provide awareness to society about the influences of technological gadgets among pre-university students. The students of today will become adults in the future, who will influence the next generation. Meanwhile, the technological gadget usage pattern will have an impact on the social skills and attitudes, which is worth to investigate. The total time spent on gadget in a day has a significant positive correlation with gadget dependency and total number of gadget. In addition, nomophobia has a weak positive correlation with anxiety and depression. This highlights that nomophobia adversely affect the mental health. There is a high percentage of the respondents belongs to the moderate level of nomophobia and dependency to technological gadgets. Besides, they shared a significant and positive correlational and predictive relationship. Difference in gender was found to affect gadget dependency. Meanwhile, logistic regression analysis demonstrated that with the increasing of total time spent on technological gadgets, it will increase the probability of developing moderate and severe nomophobia in comparison with the mild nomophobia. With these findings, appropriate measures can be taken to overcome this situation. Moreover, respondents were made aware of this when answering the questionnaire. This will encourage the respondents to make an effort in controlling and managing their behavior while using technological gadgets. Further research can be conducted to investigate the impact of nomophobia on the users’ lifestyle.
Funding Statement: This work is supported and funded by the Universiti Kebangsaan Malaysia, Geran Galakan Penyelidikan, GGP-2020-040.
Author Contributions: The authors confirm contribution to the paper as follows: study conception and design: Pearlyne Willie Wong, Huay Woon You; data collection: Pearlyne Willie Wong; analysis and interpretation of results: Pearlyne Willie Wong, Huay Woon You; draft manuscript preparation: Pearlyne Willie Wong, Huay Woon You. All authors reviewed the results and approved the final version of the manuscript.
Conflicts of Interest: The authors declare that they have no conflicts of interest to report regarding the present study.
References
1. Bhattacharyya R. Addiction to modern gadgets and technologies across generations. Eastern J Psychiatr [Internet]. 2015;18(2):27–37. doi:https://doi.org/10.5005/EJP-18-2-27. [Google Scholar] [CrossRef]
2. Cha SS, Seo BK. Smartphone use and smartphone addiction in middle school students in Korea: prevalence, social networking service, and game use. Health Psychol Open [Internet]. 2018;5(11–15, doi:https://doi.org/10.1177/2055102918755046. [Google Scholar] [PubMed] [CrossRef]
3. Fluyau D, Charlton TE. Drug addictionhttps://www.ncbi.nlm.nih.gov/books/NBK549783/. [Accessed 2022]. [Google Scholar]
4. Liu S, Yu Q, Hossain MM, Doig S, Bao R, Zhao Y, et al. Meeting 24-h movement guidelines is related to better academic achievement: findings from YRBS, 2019 cycle. Int J Ment Health Promot [Internet]. 2022;24(1):13–24. doi:https://doi.org/10.32604/IJMHP.2021.017660. [Google Scholar] [CrossRef]
5. Alqassim AY, Mahfouz MS, Hakami MM, Faqih AAA, Shugairi AA, Alsanosy MR, et al. Depression, anxiety, stress and their association with the use of electronic devices among adolescents during the COVID-19 pandemic. Int J Ment Health Promot [Internet]. 2022;24(2):251–61. doi:https://doi.org/10.32604/ijmhp.2022.019000. [Google Scholar] [CrossRef]
6. Chen S, Jiang H, Guan J. Exploring the influence of problematic mobile phone use on mathematics anxiety and mathematics self-efficacy: an empirical study during the COVID-19 pandemic. Sustain [Internet]. 2022;14(15):9032. doi:https://doi.org/10.3390/su14159032. [Google Scholar] [CrossRef]
7. Muduli JR. Addiction to technological gadgets and its impact on health and lifestyle: a study on college students (Doctoral Dissertation). National Institute of Technology Rourkela: India; 2014. [Google Scholar]
8. Othman N, Kelana MKSB, Jamaludin TTS. The impact of electronic gadget uses with academic performance among secondary school students. Int J Clin Pract [Internet]. 2020;2(2):56–60. [Google Scholar]
9. SAMS Esa, NHM Nawi, Sombuling A. Excessive smartphone usage among early adolescents: impact on social competence. Jurnal Psikologi Malaysia [Internet]. 2018;32(2):1–11 [Google Scholar]
10. Ashari ZM, Ngadiman AA, Zainudin NF, Jumaat NF. The relationship between knowledge and attitude towards technology gadget usage with students’ socio-emotions development. Int J Interact Mob Technol [Internet]. 2018;12(7):152–63 doi:https://doi.org/10.3991/ijim.v12i7.9711. [Google Scholar] [CrossRef]
11. Hulin C, Netemeyer R, Cudeck R. Can a reliability coefficient be too high? J Consum Psychol [Internet]. 2001;10(1/2):55–8. [Google Scholar]
12. Department of Statistics Malaysia Report of household income and basic amenities survey 2016https://www.dosm.gov.my/v1/index.php?r=column/pdfPrev&id=RUZ5REwveU1ra1hGL21JWVlPRmU2Zz09. [Accessed 2017]. [Google Scholar]
13. Yildirim C, Correia AP. Exploring the dimensions of nomophobia: development and validation of a self-reported questionnaire. Comput Hum Behav [Internet]. 2015;49:130–37. doi:https://doi.org/10.1016/j.chb.2015.02.059. [Google Scholar] [CrossRef]
14. You HW, Daud N, Razak NF. An assessment of internet addiction among pre-university students. Pertanika J Soc Sci Humanit [Internet]. 2021;29(1):221–28. doi:https://doi.org/10.47836/pjssh.29.1.13. [Google Scholar] [CrossRef]
15. Gurbuz IB, Ozkan G. What is your level of nomophobia? An investigation of prevalence and level of nomophobia among young people in Turkey. Community Ment Health J [Internet]. 2020;56(5):814–22. doi:https://doi.org/10.1007/s10597-019-00541-2. [Google Scholar] [PubMed] [CrossRef]
16. Al-Balhan EM, Khabbache H, Watfa A, Re TS, Zerbetto R, Bragazzi NL. Psychometric evaluation of the Arabic version of the nomophobia questionnaire: confirmatory and exploratory factor analysis-Implications from a pilot study in Kuwait among university students. Psychol Res Behav [Internet]. 2018;11:471–82. doi:https://doi.org/10.2147/PRBM.S169918. [Google Scholar] [PubMed] [CrossRef]
17. Baturay MH, Toker S. Internet addiction among college students: some causes and effects. Educ Inf Technol [Internet]. 2019;24:2863–85. doi:https://doi.org/10.1007/s10639-019-09894-3. [Google Scholar] [CrossRef]
18. Long J, Liu TQ, Liao YH, Qi C, He HY, et al. Prevalence and correlates of problematic smartphone use in a large random sample of Chinese undergraduates. BMC Psych [Internet]. 2016;16:408. doi:https://doi.org/10.1186/s12888-016-1083-3. [Google Scholar] [PubMed] [CrossRef]
19. Kumar AK, Sherkhane MS. Assessment of gadgets addiction and its impact on health among undergraduates. Int J Community Med Public Health [Internet]. 2018;5(8):3624–28. doi:https://doi.org/10.18203/2394-6040.ijcmph20183109. [Google Scholar] [CrossRef]
20. Argumosa-Villar L, Boada-Grau J, Vigil-Colet A. Exploratory investigation of theoretical predictors of nomophobia using the Mobile Phone Involvement Questionnaire (MPIQ). J Adolesc [Internet]. 2017;56:127–35. doi:https://doi.org/10.1016/j.adolescence.2017.02.003. [Google Scholar] [PubMed] [CrossRef]
21. Kaviani F, Robards B, Young KL, Koppel S. Nomophobia: is the fear of being without a smartphone associated with problematic use? Int J Environ Res Public Health [Internet]. 2020;17:6024. doi:https://doi.org/10.3390/ijerph17176024. [Google Scholar] [PubMed] [CrossRef]
22. Arpaci I. Gender differences in the relationship between problematic internet use and nomophobia. Curr Psychol [Internet]. 2022;41(9):6558–67. doi:https://doi.org/10.1007/s12144-020-01160-x. [Google Scholar] [CrossRef]
23. Qutishat M, Lazarus ER, Razmy AM, Packianathan S. University students’ nomophobia prevalence, sociodemographic factors and relationship with academic performance at a University in Oman. Int J Africa Nurs Sci [Internet]. 2020;13:100206. doi:https://doi.org/10.1016/j.ijans.2020.100206. [Google Scholar] [CrossRef]
24. Kara M, Baytemir K, Inceman-Kara F. Duration of daily smartphone usage as an antecedent of nomophobia: exploring multiple mediation of loneliness and anxiety. Behav Inf Technol [Internet]. 2021;40(1):85–98. doi:https://doi.org/10.1080/0144929X.2019.1673485. [Google Scholar] [CrossRef]
25. Sharma M, Amandeep, Mathur DM, Jeenger J. Nomophobia and its relationship with depression, anxiety, and quality of life in adolescents. Ind Psychiatry J [Internet]. 2019;28(2):231–36. doi:https://doi.org/10.4103/ipj.ipj_60_18. [Google Scholar] [PubMed] [CrossRef]
26. Santl L, Brajkovic L, Kopilaš V. Relationship between nomophobia, various emotional difficulties, and distress factors among students. Eur J Investig Health Psychol [Internet]. 2022;12(7):716–30. doi:https://doi.org/10.3390/ejihpe12070053. [Google Scholar] [PubMed] [CrossRef]
27. Yang SY, Lin CY, Huang YC, Chang JH. Gender differences in the association of smartphone use with the vitality and mental health of adolescent students. J Am Coll Health [Internet]. 2018;66(7):693–701. doi:https://doi.org/10.1080/07448481.2018.1454930. [Google Scholar] [PubMed] [CrossRef]
28. Mabaroh B, Sugianti L. Gadget addiction and the students’ achievement. Int J Soc Learning [Internet]. 2021;1(3):321–32. doi:https://doi.org/10.47134/ijsl.v1i3.59. [Google Scholar] [CrossRef]
Cite This Article
 Copyright © 2023 The Author(s). Published by Tech Science Press.
This work is licensed under a Creative Commons Attribution 4.0 International License , which permits unrestricted use, distribution, and reproduction in any medium, provided the original work is properly cited.
 Downloads
 Citation Tools