
 Submit a Paper
 Propose a Special lssue
 Open Access
ARTICLE

Psychometric Properties of the Thai Version of the Weight Stigma Exposure Inventory (WeSEI)
1 Department of Public Health, College of Medicine, National Cheng Kung University, Tainan, 701401, Taiwan
2 Department of Physical Therapy, College of Health Sciences, Christian University of Thailand, Nakhon Pathom, 73140, Thailand
3 Department of Physical Therapy, Faculty of Associated Medical Sciences, Chiang Mai University, Chiang Mai, 50200, Thailand
4 Faculty of Nursing, Mahidol University, Bangkok, 10700, Thailand
5 College of Sports Science and Technology, Mahidol University, Phutthamonthon, Nakhon Pathom, 73170, Thailand
6 Chinese Academy of Education Big Data, Faculty of Education, Qufu Normal University, Qufu, 273165, China
7 Department of Medical Research, E-Da Hospital, I-Shou University, Kaohsiung, 82445, Taiwan
8 Department of Psychiatry, Hualien Tzu-Chi Hospital, Buddhist Tzu Chi Medical Foundation, 707 Sec. 3, Chung Yang Rd., Hualien, 970473, Taiwan
9 Department of Psychiatry, School of Medicine, Tzu Chi University, 2 Chien-kuo Rd., Hualien, 970302, Taiwan
10 School of Social Sciences, Faculty of Arts, Monash University, 20 Chancellors Walk, Clayton, VIC 3800, Australia
11 Institute of Allied Health Sciences, College of Medicine, National Cheng Kung University, Tainan, 701401, Taiwan
12 Biostatistics Consulting Center, National Cheng Kung University Hospital, College of Medicine, National Cheng Kung University, Tainan, 701401, Taiwan
13 School of Nursing, College of Nursing, Kaohsiung Medical University, Kaohsiung, 807378, Taiwan
* Corresponding Authors: Hsin-Chi Tsai. Email: ; Chung-Ying Lin. Email:
International Journal of Mental Health Promotion 2025, 27(11), 1645-1661. https://doi.org/10.32604/ijmhp.2025.071081
Received 31 July 2025; Accepted 31 October 2025; Issue published 28 November 2025
 View Full Text
 Download PDF
Abstract
Background: Weight stigma is prevalent and has multiple sources, which have significant effects on individual, social, physical, and psychological health. This study evaluated the psychometric properties of the Thai version of WeSEI to provide a valid tool to assess weight stigma in Thai young adults. Methods: A cross-sectional online survey recruited 517 Thai university students from October 2024 to May 2025. All participants completed demographic information and standardized self-reported instruments, including WeSEI, Depression, Anxiety, and Stress scale 21 (DASS-21), Weight Self-Stigma Questionnaire (WSSQ), and Perceived Weight Stigma Scale (PWSS). The psychometric properties of the Thai version of WeSEI were examined via confirmatory factor analysis (CFA) with some validity indices. Results: The 7-factor structure of the Thai version of the WeSEI was supported across sex and weight status subgroups, indicating good construct validity. In addition, internal consistency (Cronbach’s α = 0.972; McDonald’s ω = 0.972), convergent, and discriminant validity also indicated that the Thai version of the WeSEI had good psychometric properties and assessed weight stigma among young people in Thailand. Conclusions: Sound psychometric properties of the Thai adaptation of WeSEI allows the identification of various sources contributing to weight stigma and to identify those experiencing high levels of weight stigma. It also provides evidence to support targeted interventions to reduce weight stigma and its associated mental health impacts in further research. Further studies are necessary to explore the utilization of WeSEI for weight stigma in Thailand.Keywords
Globally, the prevalence of overweight and weight stigma has been growing [1,2,3]. More specifically, in Thailand, a recent study on obesity trends showed an increase from 33.9% in 2012 to 44.8% in 2018, with the average body mass index (BMI) rising from 23.9 kg/m2 to 25.0 kg/m2 [4]. This upward trend is particularly concerning among women, with obesity rates reaching 51.1% in 2018, compared to 32.7% for men [4]. Influenced by cultural standards, young Thai women hold a complex view of body weight. Many young Thai women express dissatisfaction about their body weight, leading to negative body image and self-esteem issues. This is often exacerbated by media portrayals of idealized body types. To achieve their desired weight, some Thai women engage in unhealthy practices such as extreme dieting and the use of diet pills [5].
Weight stigma refers to the negative attitudes (such as judgmental views, stereotyping, disdain, or disgust), beliefs (including health misconceptions, moral judgments, and social norms), and behaviors (e.g., stigma, verbal abuse, and social exclusion) directed at individuals based on their body weight or size [6,7]. Weight stigma can manifest across various social networks, including family, friends, and peers. Social influences may contribute through negative comments about weight, unrealistic expectations, and modeling bias to significantly impact individuals’ physical (e.g., purging and high eating disorder risk) and mental health (e.g., anxiety and depressive symptoms) [8,9].
There are three interconnected forms of weight stigma: observed weight stigma, perceived weight stigma, and weight-based self-stigma [10]. Weight-based self-stigma involves the internalization of negative beliefs about one’s own body weight. Perceived weight stigma is defined as an individual’s belief that they are being judged or discriminated against because of their weight. Observed weight stigma occurs when individuals witness discriminatory behaviors or negative attitudes directed at others due to their weight. These stigmas may relate to mental health problems (e.g., depression and anxiety), low self-esteem, and feelings of shame [11], resulting in social anxiety and avoidance behaviors that impact overall quality of life [12,13]. Additionally, they reinforce societal biases and contribute to a culture of stigma [14].
Individuals with a higher body weight, categorized by BMI, often face more stigma, bias, and derogatory remarks resulting in feelings of shame, diminished self-esteem, and anxiety [15]. This negative self-perception can contribute to mental health issues such as depression and social isolation, as individuals may withdraw from social interactions to avoid judgment [15,16,17,18]. The impact of weight stigma extends beyond those who are overweight; it also significantly affects individuals with an average body weight. People of average weight may internalize societal biases, developing unhealthy attitudes toward body image and weight, which can lead to anxiety about their appearance and a fear of gaining weight [19]. This can result in disordered eating behaviors, such as restrictive dieting or excessive exercise, as they strive to conform to societal standards of thinness [20].
Weight stigma is diverse, and it is deeply embedded across social structures. It can originate from various sources, including individuals, families (such as parents), social networks (like friends, peers, and significant others), and even strangers [19]. Beyond interpersonal sources, non-interpersonal sources (such as media and online content) play a significant role in weight stigma [21]. Weight stigma can be found in workplaces, schools, online environments, healthcare settings, and more. The pervasive and complex nature of weight stigma contributes to psychological distress and adverse physical health effects, such as eating disorders, emotional eating, irregular eating patterns, alcohol-related diseases, sleep disturbances, decreased physical activity, and weight gain [22]. These effects adversely impact individuals and place a considerable strain on healthcare systems and society at large [23].
Researchers have developed a variety of measurement instruments to explore the prevalence of weight stigma and identify its sources [24,25]. The existing literature presents several tools designed to evaluate weight stigma from external sources, including the Stigmatizing Situations Inventory (SSI) [26], the Weight Bias Internalization Scale (WBIS) [27], the Physical Appearance Related Teasing Scale (PARTS) [28], the Weight Self Stigma Questionnaire (WSSQ) [29], the Perceived Weight Stigma Scale (PWSS) [30], the Scale for Treatment-based Experiences of Weight Stigma (STEWS) [31], and the Fat Microaggressions Scale (FMS) [32]. The SSI, WBIS, and PARTS are specifically targetted to evaluate individuals’ experiences of weight stigmatization from interpersonal sources. The WSSQ assesses self-stigma related to individuals’ weight, and the PWSS evaluates the perceived weight stigma based on weight perception. In contrast, the STEWS addresses weight stigma experiences related to eating disorders as perceived by individuals from healthcare providers and peers. The FMS is used to assess the frequency of fat microaggressions encountered from interpersonal and media sources in individuals with higher weight. Empirical evidence indicates that these tools are acknowledged as being effective in evaluating the external stigmatization or stigma faced by individuals with overweight.
The Weight Stigma Exposure Inventory (WeSEI) is a newly developed tool aimed at evaluating weight stigma exposure from diverse sources, including social media, traditional media, television, parents, friends, significant others, and strangers [33]. Previous weight stigma assessment tools primarily assessed participants’ internalized weight stigma (e.g., WSSQ) and weight stigma perceived by individuals (e.g., PWSS). The WeSEI is different from those tools in that it assesses external sources of weight stigma from both interpersonal and non-interpersonal perspectives among individuals across weight statuses (i.e., underweight, average weight, and overweight). It is grounded in a comprehensive theoretical framework that emphasizes external experiences of weight stigma, allowing for a deeper understanding of the social environment’s impact on individuals. The WeSEI considers cultural differences in both Asian populations and Western societies. Presently, the WeSEI shows strong psychometric properties and is confirmed to be a multidimensional structure, providing a more comprehensive weight stigma evaluation. Therefore, localizing WeSEI is crucial for ensuring it can reflect the unique social and cultural factors of the Thai population, since weight stigma may manifest differently across cultures. Its validation among Taiwanese, Chinese, Indonesian, Turkish, and Malaysian populations underscores its cultural relevance, establishing it as an effective instrument for assessing weight stigma across Asian countries [33,34,35,36,37].
Existing research indicates that Thailand has the highest score (Mean [SD]: 32.71 [8.31]) on the WSSQ among Asian countries, including Taiwan, China, Hong Kong, Indonesia, and Malaysia [33,34,36,37]. Therefore, a validated instrument with strong psychometric properties that encompasses different cultural contexts is needed to achieve a more thorough understanding of the various sources and effects of weight stigma in Thailand.
This study aimed to evaluate the psychometric properties of the Thai version of the WeSEI in Thai young adults. Based on existing literature, the following hypotheses were made: (Hypothesis 1) the WeSEI has a seven-factor structure, which is consistent with the factor structure reported in previous research [33,34,35,36,37]; and (Hypothesis 2) the WeSEI score significantly correlates with other weight stigma measures (i.e., PWSS and WSSQ).
This study employed a cross-sectional design involving university students from Thailand. Participants were recruited via an online survey (SurveyMonkey). We adopted a convenience sampling method to efficiently recruit a sufficient sample size to provide initial psychometric evidence. The survey was disseminated by the research team via various social media channels, such as Facebook, Twitter/X, and university forums. The participants were recruited over an eight-month period from October 2024 to May 2025. After obtaining informed consent, presented at the start of the online questionnaire, participants were requested to complete demographic information and standardized self-reported instruments, including WeSEI, Depression, Anxiety, and Stress Scale 21 (DASS-21), Weight Self-Stigma Questionnaire (WSSQ), and Perceived Weight Stigma Scale (PWSS). Participants were eligible if they met the following requirements: (1) aged 18 years and older; (2) able to read and understand the Thai language; (3) currently residing in Thailand and enrolled in a Thai university (undergraduates and postgraduates). This study was conducted with the approval of the Human Research Ethics Committee of National Cheng Kung University (NCKU HREC-E-110-486-2) and was subsequently endorsed by the ethics committee at Mahidol University.
2.2.1 Background Information with Demographics
Background information was self-reported by the participants on the following variables: age (years), sex (male or female), height (cm), weight (kg), current educational level, marital status, and acute or chronic disease. Self-reported height and weight were used to calculate body mass index (BMI). Participants were further divided into groups based on BMI cutoff values of the Thai standard for overweight status (BMI ≥ 23.0 or BMI < 23.0) [38], the Western standard for overweight status (BMI ≥ 25.0 or BMI < 25.0), and Obesity status (BMI ≥ 30.0 or BMI < 30.0) [38].
2.2.2 Weight Stigma Exposure Inventory (WeSEI) and Its Translation Procedure
The WeSEI is a recently developed 35-item instrument to assess observed (or exposure to) weight stigma from different interpersonal and non-interpersonal sources [33]. Each source contains 5 items, and each item is rated on a 5-point Likert scale ranging from 1 (never) to 5 (almost always). The WeSEI has shown good psychometric properties with multilingual versions across different countries (in Chinese, Turkish, and Malay), with a 7-factor structure confirmed by confirmatory factor analysis (CFA), including social media, traditional media, television, parents, friends, significant others, and strangers [33,34,35,36,37]. Sample items are “I have observed negative statements about weight (e.g., overweight is pathetic; fat people are useless and lazy) on social media” (social media). “I have observed negative statements about weight (e.g., overweight is pathetic; fat people are useless and lazy) in traditional media” (traditional media). “The TV series/movies I watched portray overweight/obese individuals in a negative way (e.g., overweight is pathetic; fat people are useless and lazy)” (television). “My parents and siblings have negative beliefs about weight (e.g., overweight is pathetic; fat people are useless and lazy)” (parents). “My friends/peers have negative beliefs about weight (e.g., overweight is pathetic; fat people are useless and lazy)” (friends). “My significant other has negative beliefs about weight (e.g., overweight is pathetic; fat people are useless and lazy)” (significant others), and “I have observed negative beliefs about weight (e.g., overweight is pathetic; fat people are useless and lazy) from strangers” (strangers).
After obtaining permission from the original scale developers, the WeSEI was translated into Thai following standardized guidelines proposed by Beaton et al. [39], consisting of three main steps. The first step was forward translation. The original English version of WeSEI was independently translated into Thai by two translators (i.e., one from the sports science major and another from nursing), combining an initial translated draft. The second step was backward translation. Two other independent translators, fluent in both Thai and English, translated an initial Thai draft back into English. The final step was reconciliation; an expert panel (i.e., two nursing professionals and one psychologist) reviewed all the reports (i.e., two forward translations, initial Thai draft, two backward translations, and original English version) to identify and resolve any discrepancies in meaning in the final Thai translation of the WeSEI. However, some English terms (i.e., Internet memes and traditional media) could not be directly translated into Thai. After discussion among the expert panel, the term “internet memes” was replaced with a Thai word meaning “joke”. The English word was placed in parentheses for further explanation. For “traditional media”, there was a lack of evidence supporting whether it should be translated as “conventional media” or “mainstream media” in Thai language. Finally, the expert panel made a critical decision to use a Thai word meaning “mainstream media” to reflect the primary media in Thai society. Therefore, the final Thai version of WeSEI was deemed to be conceptually equivalent and culturally relevant. It was considered comparable to the original version in both concept and cross-cultural adaptation.
2.2.3 Depression, Anxiety, and Stress Scale 21 (DASS-21)
The DASS-21 is a validated scale with psychometric properties used to assess depression, anxiety, and stress symptoms [40,41,42]. The scale consists of 21 questions, 7 questions in each component (depression, anxiety, and stress). Participants responded to each question ranging from 0 (did not apply to them) to 3 (very much, or most of the time). In addition to the total score, the subscale scores for each component (depression, anxiety, and stress) were also used in subsequent analyses. The embedded item scores of DASS-21 were summed to calculate the total score and each subscale score. A higher score indicates a higher level of depression, anxiety, or stress. Sample items are “I couldn’t seem to experience any positive feeling at all” (depression), “I was aware of dryness of my mouth” (anxiety), and “I found it hard to wind down” (stress). The DASS-21 has been translated into the Thai language with acceptable internal consistency (stress subscale: Cronbach’s α = 0.80; anxiety subscale: 0.73; depression subscale: 0.80; and full scale: 0.90) [43]. The internal consistency of DASS-21 was good in the present study (stress subscale: α = 0.94; anxiety subscale: 0.94; depression subscale: 0.92; and full scale: 0.97).
2.2.4 Weight Self-Stigma Questionnaire (WSSQ)
The WSSQ was used to assess participants’ self-perception of weight stigma [29]. The WSSQ has two domains (fear of enacted stigma [6 items] and self-devaluation [6 items]) with a total of 12 items. WSSQ items were rated on a five-point Likert scale from 1 (strongly Disagree) to 5 (strongly Agree). The scores of all items were totaled, with a higher score signifying a greater level of weight-based self-stigma. A sample item is “I’ll always go back to being overweight”. The WSSQ has been translated into the Thai language with acceptable internal consistency (fear of enacted stigma: α = 0.86; self-devaluation: 0.83; and total score: 0.88) [44]. The WSSQ had good internal consistency in the present study (fear of enacted stigma: α = 0.94; self-devaluation: 0.94; and total score: 0.96).
2.2.5 Perceived Weight Stigma Scale (PWSS)
The PWSS is an instrument for assessing participants’ self-reported perceived weight stigma [30]. It consists of 10 items with a dichotomous scale (0 = no; 1 = yes). All item scores are summed, and a higher score indicates a higher level of perceived weight stigma. A sample item is “People act as if you are inferior”. The PWSS has been translated into Thai language with acceptable internal consistency (α = 0.85) [44]. The PWSS also showed good internal consistency in the present study (α = 0.90).
The participants’ characteristics were described as mean (SD) or median (Q1–Q3), and the categorical characteristics were n (%). Descriptive statistics for all items and the total score of WeSEI were calculated. CFA was used to evaluate the 7-factor structure of the WeSEI and to estimate factor loading, with diagonally weighted least squares (DWLS) estimation. The DWLS estimation was used because this estimation is designed for Likert-type scale responses (e.g., five-point Likert scale used in the WeSEI) [45]. If items had a loading >0.4 and only loaded on one factor, the structure was considered acceptable [46]. To evaluate model fit in CFA, the comparative fit index (CFI), Tucker-Lewis Index (TLI), root-mean-square error of approximation (RMSEA) with a 90% confidence interval (CI), and standardized root mean square residual (SRMR) were used. Data-model fit is good when CFI and TLI are greater than 0.9, and RMSEA and SRMR are less than 0.08 [47]. Some literature also indicates that RMSEA [47] and SRMR <0.1 are acceptable [48]. Cronbach’s α and McDonald’s ω coefficients were utilized to assess the internal consistency in the total scale and subscales [49]. In addition, item-rest correlations of the items in each subscale were calculated.
Multi-group CFA (MGCFA) was used to test measurement invariance across sex (male vs. female) and weight status based on the Thai standard (higher weight vs. non-higher weight). The MGCFA involved four nested models: (1) M1: structural invariance model (the baseline model, based on the 7-factor structure of the WeSEI), (2) M2: metric invariance (the model were constrained factor loadings, based on M1), (3) M3: scalar invariance (factor loadings and item intercepts were constrained, based on M1), and (4) residual invariance (factor loadings, item intercepts, and residuals were constrained, based on M1). The differences in CFI (ΔCFI), RMSEA (ΔRMSEA), and SRMR (ΔSRMR) between each two nested models were calculated to assess measurement invariance. According to Chen’s (2007) recommendations [50], if ΔCFI > −0.01, ΔRMSEA < 0.015, and ΔSRMR < 0.01, measurement invariance was supported.
We also estimated the average variance extracted (AVE) to examine convergent validity, and composite reliability (CR) to evaluate internal consistency. A good convergent validity was met by AVE values above 0.5, and there was good internal consistency when CR > 0.7 [51]. Furthermore, we used the heterotrait-monotrait (HTMT) ratio to assess discriminant validity. When the HTMT value was below 0.90, discriminant validity was good [51].
Structural equation modeling (SEM) can construct the latent variable and correct the measurement error to get a robust estimation of the correlation between latent variables (i.e., the entire WeSEI and each factor construct) and independent variables (i.e., the external criterion measures used in the present study). SEM was used to examine the correlations between eight variables from the WeSEI (i.e., its total score and seven subfactors) and multiple external criteria, including BMI, DASS-21 total and subscale scores, and total scores of the WSSQ and PWSS (Fig. 1). We conducted 14 SEM models in total, including a subfactors model (A) and a total model (B) for seven external criteria. The standardized coefficients were reported. The PWSS and WSSQ include perceptions and self-evaluations of weight stigma, which were positively related to the stigma experience measured by the WeSEI. Further, the concurrent validity between the total score and each factor of the WeSEI with the WSSQ and PWSS was examined by SEM. Pearson correlations were calculated to estimate the correlation between total scores (e.g., whole scale and factors) and multiple external criteria. The correlation coefficient was evaluated by: 0.12 indicates a small, 0.24 moderate, and 0.41 large level correlation [52].
Furthermore, the known-groups validity was assessed by comparing the difference in WeSEI scores between groups with different weight categories using analysis of variance (ANOVA). Specifically, the weight categories were classified according to the cutoffs defining higher weight and obesity in Thai and Western standards, respectively. We conducted the ANOVAs for the overall WeSEI and its individual subscales. Cohen’s d was used to evaluate effect sizes (0.15 indicates small, 0.36 moderate, and 0.65 large effects) [52].
R-4.4.1 was used for statistical analysis with the psych package for internal consistency, the lavaan package for CFA (including MGCFA) and SEM, and the semTools package for convergent and discriminant validity.
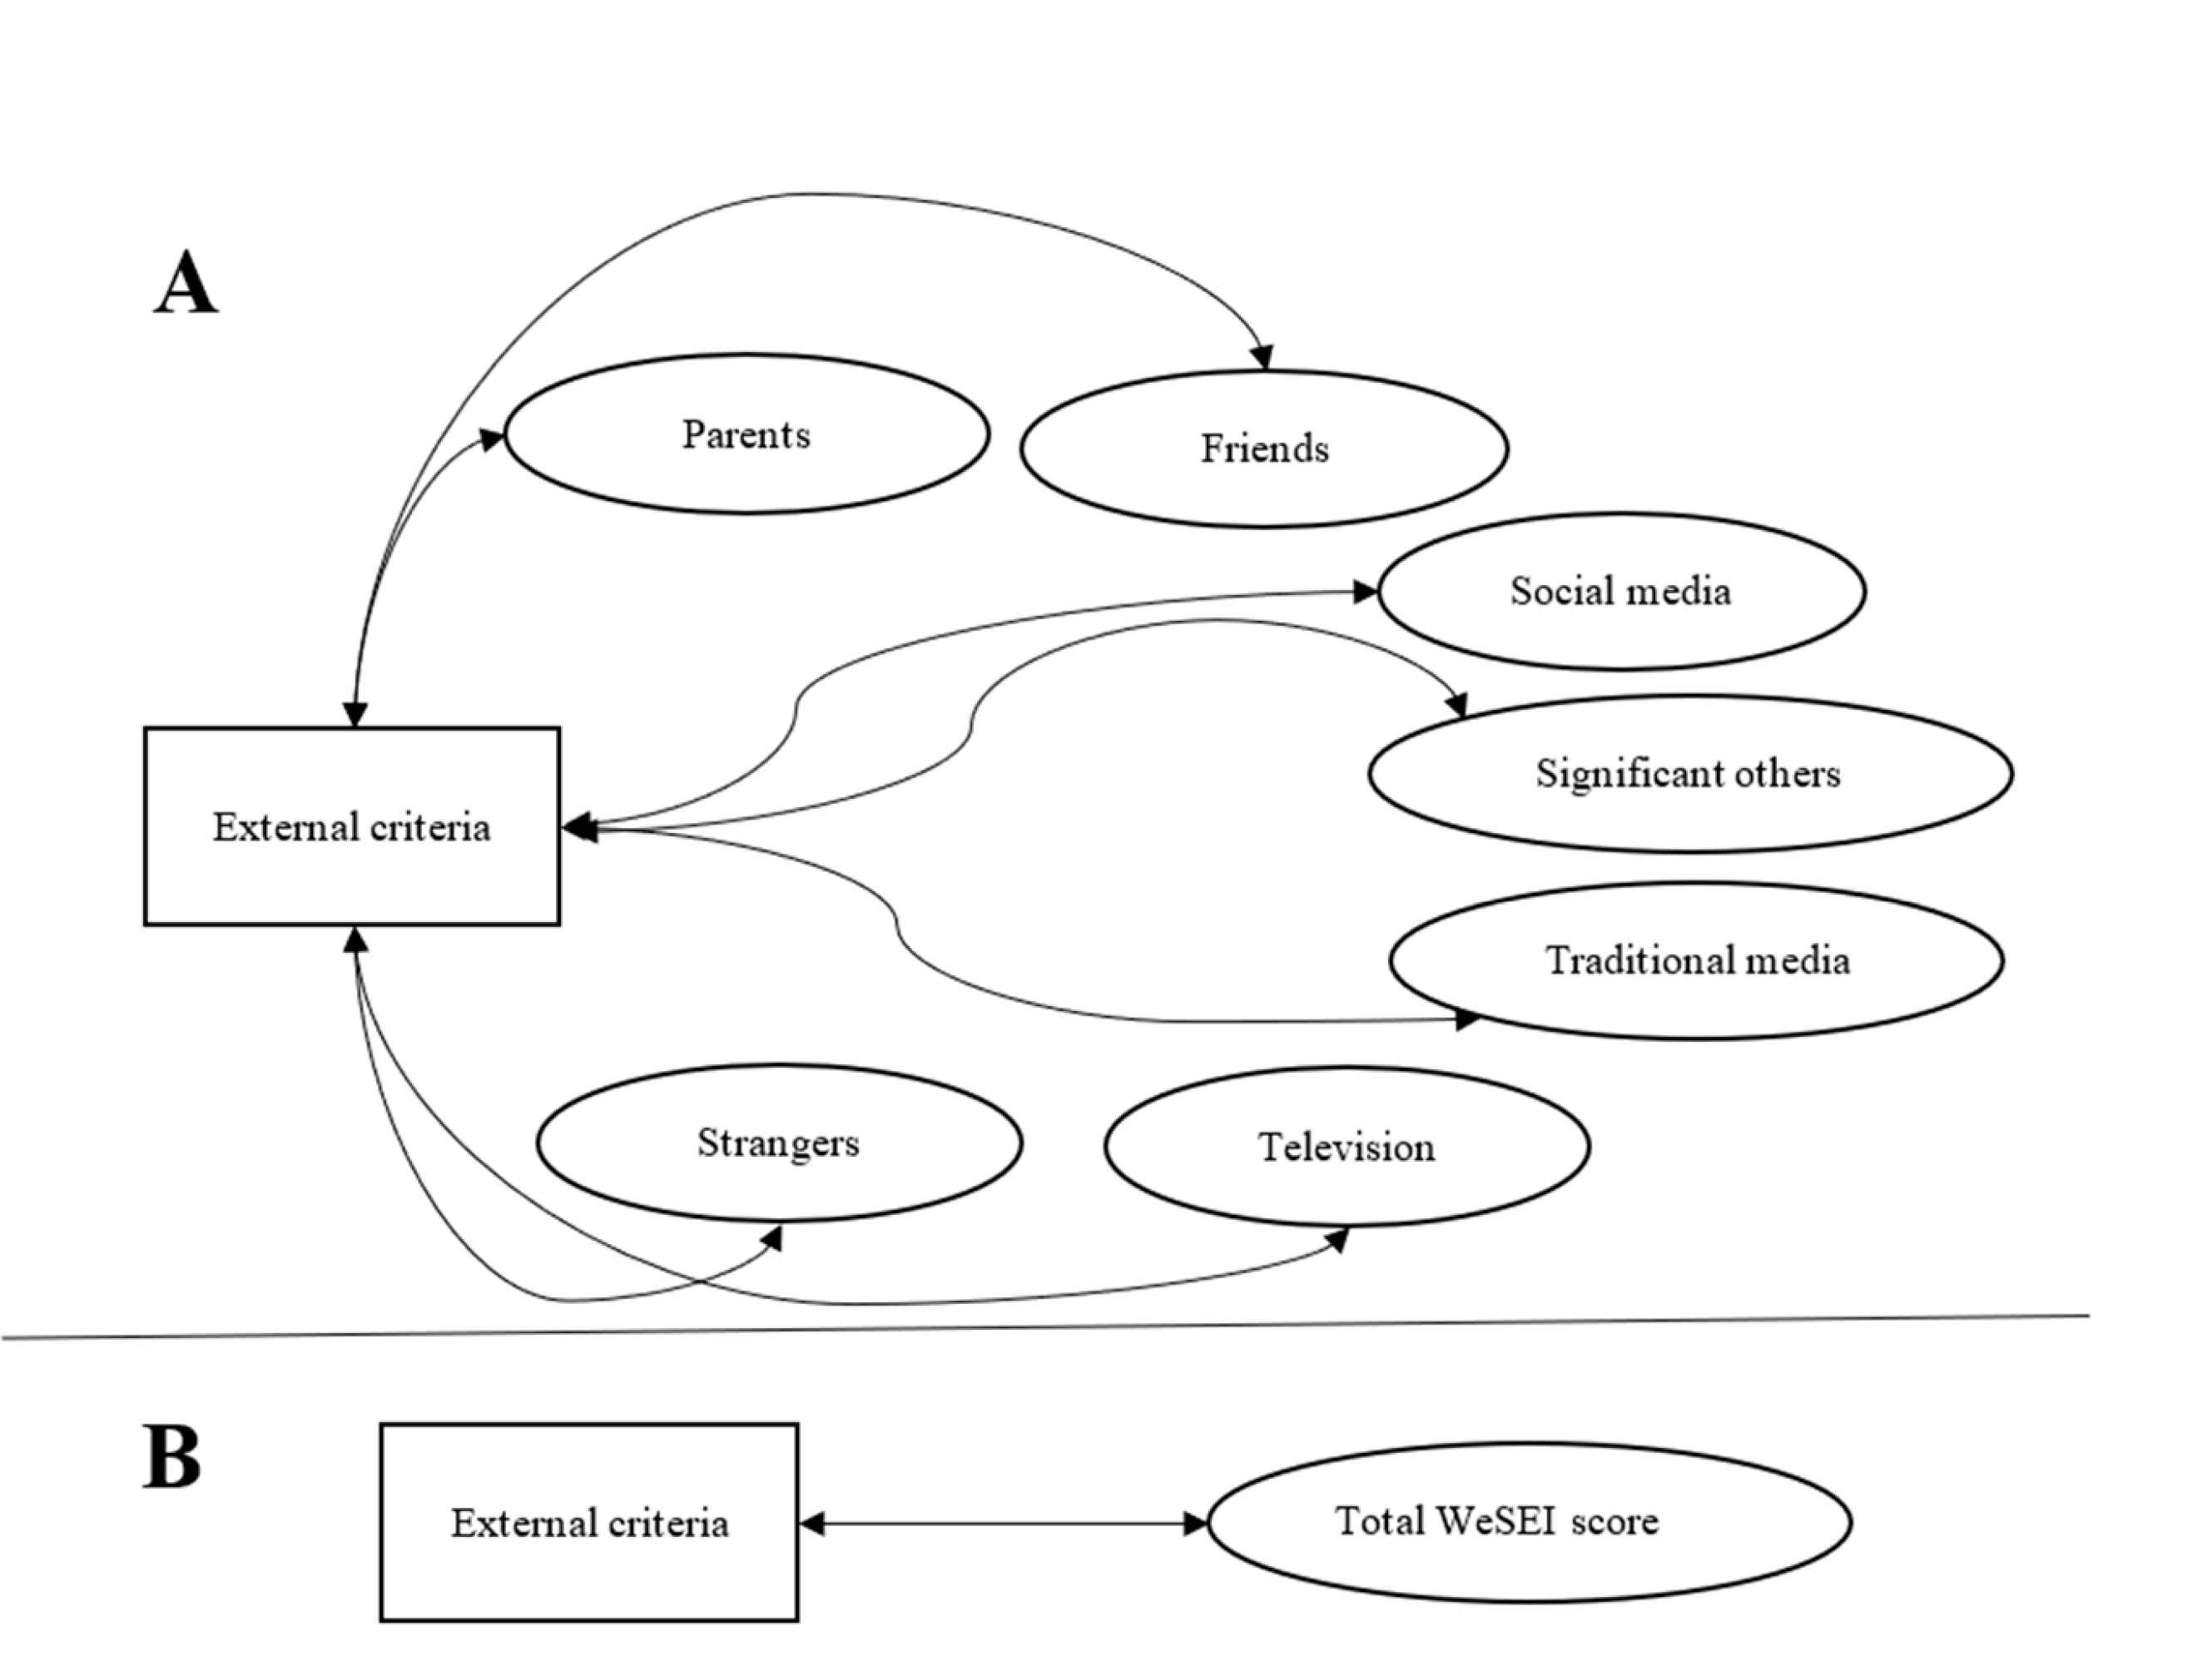
Figure 1: The SEM structures to explore the correlations of the WeSEI (A) domain and (B) total scores with external criterion measures (i.e., BMI, total and subscale scores of DASS21, total score of WSSQ, and PWSS). Covariances among the WeSEI subfactors were allowed. Note: WeSEI, Weight Stigma Exposure Inventory; double-arrow lines indicate correlations between the two variables.
Participants had a mean age of 23.0 years (SD = 3.8) and a mean BMI of 22.8 kg/m2 (SD = 3.4) (Table 1). Most participants were male (62.1%) and single (98.3%), with an undergraduate degree (94.8%). A small proportion of participants (4.3%) had a condition or disease (e.g., cold, mental illness). A total of 43.5% and 18.6% of participants were identified as higher weight based on Thai and Western standards, respectively. Among all participants, 2.5% participants had a BMI higher than 30.0 (categorized as obese by BMI standards).
Table 1: Participants’ demographics.
| Characteristic | All Sample (n = 517) |
|---|---|
| Age, Mean (SD) | 23.0 (3.8) |
| BMI, Mean (SD) | 22.8 (3.4) |
| BMI, n (%) | |
| BMI < 23.0 | 292 (56.5%) |
| BMI 23–25 | 129 (25.0%) |
| BMI 25–30 | 83 (16.1%) |
| BMI ≥ 30 | 13 (2.5%) |
| Sex, n (%) | |
| Male | 321 (62.1%) |
| Female | 196 (37.9%) |
| Educational level, n (%) | |
| Undergraduate degree | 490 (94.8%) |
| Graduate degree | 27 (5.2%) |
| Marital status, n (%) | |
| Single | 508 (98.3%) |
| Married | 6 (1.2%) |
| Divorced | 3 (0.6%) |
| Acute or chronic disease, n (%) | |
| No | 495 (95.7%) |
| Yes | 22 (4.3%) |
3.1 Factor Structure and Measurement Invariance
The distribution of item scores of WeSEI is demonstrated in Table 2. CFA results demonstrate a good construct validity (i.e., all factor loadings of items and the item-total correlations were >0.40), and Cronbach’s α and McDonald’s ω coefficients show good internal consistency for the overall scale and subscales (α, ω > 0.70).
Table 2: Factor structure and final retained items for the Weight Stigma Exposure Inventory (WeSEI).
| Items | Mean (SD) | Item-Rest Correlation | Factor Loadinga |
|---|---|---|---|
| Total score (Cronbach’s α = 0.972; McDonald’s ω = 0.972) | 85.4 (31.3) | ||
| Social media source (Cronbach’s α = 0.828; McDonald’s ω = 0.825) | 12.7 (4.6) | ||
| Item 1 | 2.1 (1.1) | 0.593 | 0.623 |
| Item 2 | 2.8 (1.3) | 0.500 | 0.582 |
| Item 3 | 2.7 (1.2) | 0.684 | 0.678 |
| Item 4 | 2.6 (1.2) | 0.628 | 0.766 |
| Item 5 | 2.5 (1.2) | 0.722 | 0.877 |
| Traditional media source (Cronbach’s α = 0.869; McDonald’s ω = 0.870) | 13.3 (5.0) | ||
| Item 6 | 2.3 (1.1) | 0.713 | 0.811 |
| Item 7 | 2.9 (1.4) | 0.596 | 0.752 |
| Item 8 | 3.0 (1.3) | 0.716 | 0.675 |
| Item 9 | 2.6 (1.3) | 0.677 | 0.682 |
| Item 10 | 2.5 (1.3) | 0.756 | 0.840 |
| Television source (Cronbach’s α = 0.930; McDonald’s ω = 0.931) | 13.6 (5.8) | ||
| Item 11 | 2.4 (1.2) | 0.824 | 0.869 |
| Item 12 | 3.0 (1.4) | 0.812 | 0.816 |
| Item 13 | 2.7 (1.2) | 0.752 | 0.869 |
| Item 14 | 2.8 (1.4) | 0.842 | 0.853 |
| Item 15 | 2.7 (1.4) | 0.853 | 0.870 |
| Parents source (Cronbach’s α = 0.907; McDonald’s ω = 0.909) | 12.1 (5.6) | ||
| Item 16 | 2.3 (1.2) | 0.780 | 0.755 |
| Item 17 | 2.9 (1.4) | 0.675 | 0.824 |
| Item 18 | 2.4 (1.4) | 0.757 | 0.773 |
| Item 19 | 2.4 (1.3) | 0.871 | 0.877 |
| Item 20 | 2.1 (1.3) | 0.748 | 0.823 |
| Friends source (Cronbach’s α = 0.907; McDonald’s ω = 0.908) | 11.6 (5.4) | ||
| Item 21 | 2.1 (1.2) | 0.772 | 0.779 |
| Item 22 | 2.7 (1.3) | 0.627 | 0.695 |
| Item 23 | 2.4 (1.3) | 0.765 | 0.864 |
| Item 24 | 2.2 (1.3) | 0.850 | 0.868 |
| Item 25 | 2.2 (1.3) | 0.817 | 0.858 |
| Significant others source (Cronbach’s α = 0.944; McDonald’s ω = 0.944) | 10.4 (5.5) | ||
| Item 26 | 1.9 (1.1) | 0.817 | 0.982 |
| Item 27 | 2.3 (1.2) | 0.824 | 0.839 |
| Item 28 | 2.2 (1.3) | 0.892 | 0.888 |
| Item 29 | 2.0 (1.2) | 0.850 | 0.823 |
| Item 30 | 2.0 (1.2) | 0.852 | 0.830 |
| Strangers source (Cronbach’s α = 0.908; McDonald’s ω = 0.909) | 11.6 (5.3) | ||
| Item 31 | 2.1 (1.2) | 0.811 | 0.791 |
| Item 32 | 2.6 (1.4) | 0.747 | 0.755 |
| Item 33 | 2.5 (1.3) | 0.703 | 0.823 |
| Item 34 | 2.2 (1.1) | 0.822 | 0.879 |
| Item 35 | 2.2 (1.1) | 0.753 | 0.816 |
Table 3 presents the acceptable model fit in CFA, which supports the 7-factor structure of the WeSEI: χ2 (539) = 1994.201, CFI = 0.978, TLI = 0.976, RMSEA = 0.072 (0.069–0.076), and SRMR = 0.086. It also summarizes the comparison of the nested models to test measurement invariance across sex (male vs. female) and weight status (Thai standard). The acceptable changes in fit indices (ΔCFI, ΔRMSEA, and ΔSRMR) supported metric invariance, scalar invariance, and residual invariance across sex and weight status. It indicated that WeSEI could be used to measure the latent concept of observed weight stigma consistently and for valid comparisons across groups, different sexes, or weight status.
Table 3: Confirmatory factor analysis and tests of invariance on the Weight Stigma Exposure Inventory (WeSEI).
| Model | DWLS χ2 | df | CFI | TLI | RMSEA (90% C.I.) | SRMR | Comp. | Δdf | ΔCFI | ΔTLI | ΔRMSEA | ΔSRMR |
|---|---|---|---|---|---|---|---|---|---|---|---|---|
| All sample | 1994.201 | 539 | 0.978 | 0.976 | 0.072 (0.069–0.076) | 0.086 | — | — | — | — | — | — |
| Male | 843.133 | 539 | 0.994 | 0.993 | 0.042 (0.036–0.047) | 0.071 | — | — | — | — | — | — |
| Female | 1341.447 | 539 | 0.961 | 0.957 | 0.088 (0.082–0.093) | 0.113 | — | — | — | — | — | — |
| Normal weight | 1426.203 | 539 | 0.974 | 0.972 | 0.075 (0.071–0.080) | 0.094 | — | — | — | — | — | — |
| Overweight | 874.841 | 539 | 0.990 | 0.989 | 0.053 (0.046–0.059) | 0.087 | — | — | — | — | — | — |
| Measurement invariance on sex | ||||||||||||
| M1. Configural | 2184.580 | 1078 | 0.984 | 0.982 | 0.063 (0.059–0.067) | 0.084 | — | — | — | — | — | — |
| M2. Metric | 2455.189 | 1106 | 0.981 | 0.979 | 0.069 (0.065–0.073) | 0.089 | M2-M1 | 28 | −0.003 | −0.003 | 0.006 | 0.005 |
| M3. Scalar | 2508.924 | 1134 | 0.980 | 0.979 | 0.069 (0.065–0.072) | 0.090 | M3-M2 | 28 | −0.001 | 0.000 | 0.000 | 0.001 |
| M4. Residual | 2581.556 | 1169 | 0.980 | 0.979 | 0.069 (0.065–0.072) | 0.091 | M4-M3 | 35 | 0.000 | 0.000 | 0.000 | 0.001 |
| Measurement invariance on weight | ||||||||||||
| M1. Configural | 2301.044 | 1078 | 0.982 | 0.980 | 0.066 (0.063–0.070) | 0.089 | — | — | — | — | — | — |
| M2. Metric | 2411.830 | 1106 | 0.981 | 0.980 | 0.068 (0.064–0.071) | 0.091 | M2-M1 | 28 | −0.001 | 0.000 | 0.002 | 0.002 |
| M3. Scalar | 2422.589 | 1134 | 0.981 | 0.980 | 0.066 (0.063–0.070) | 0.091 | M3-M2 | 28 | 0.000 | 0.000 | −0.002 | 0.000 |
| M4. Residual | 2449.781 | 116 | 0.981 | 0.981 | 0.065 (0.062–0.069) | 0.091 | M4-M3 | 35 | 0.000 | 0.001 | −0.001 | 0.000 |
3.2 Convergent, Discriminant Validity, and Internal Consistency
The convergent and discriminant validity (Table 4) showed good internal consistency (CR values for all factors were greater than 0.80) and convergent validity (AVE values for all factors were above 0.50). The HTMT ratios are shown in the upper triangular matrix to confirm the discriminant validity. Analysis found that traditional media sources may not be discriminant from television sources (HTMT = 0.954), and friends’ source may not be discriminant from parents’ source (HTMT = 0.911), according to the HTMT threshold (0.9). More rigorously (using HTMT 0.85 as a cutoff), it is possible that social media could not be discriminated from a traditional media source (HTMT = 0.893) and a television source (HTMT = 0.868).
Table 4: Convergent and discriminant validity for the Weight Stigma Exposure Inventory (WeSEI).
| Factors | CR | AVE | Social Media | Traditional Media | Television | Parents | Friends | Significant Others | Strangers |
|---|---|---|---|---|---|---|---|---|---|
| Social media | 0.841 | 0.509 | (0.713) | 0.893 | 0.868 | 0.797 | 0.767 | 0.590 | 0.690 |
| Traditional media | 0.860 | 0.564 | 0.928*** | (0.751) | 0.954 | 0.672 | 0.669 | 0.468 | 0.763 |
| Television | 0.932 | 0.730 | 0.885*** | 0.951*** | (0.854) | 0.804 | 0.738 | 0.454 | 0.830 |
| Parents | 0.904 | 0.661 | 0.763*** | 0.699*** | 0.812*** | (0.813) | 0.911 | 0.693 | 0.673 |
| Friends | 0.908 | 0.666 | 0.737*** | 0.685*** | 0.732*** | 0.911*** | (0.816) | 0.705 | 0.688 |
| Significant others | 0.825 | 0.754 | 0.592*** | 0.510*** | 0.472*** | 0.707*** | 0.748*** | (0.868) | 0.577 |
| Strangers | 0.899 | 0.652 | 0.760*** | 0.765*** | 0.831*** | 0.708*** | 0.695*** | 0.597*** | (0.807) |
There were low and non-significant correlations between WeSEI factors and BMI (Table 5). The total and subscale scores of DASS-21 demonstrated statistically significant (p < 0.001) small to moderate levels of SEM correlations with all the factors and the total score of WeSEI. For the concurrent validity of the WeSEI, the entire WeSEI and most WeSEI subscales were significantly correlated with WSSQ and PWSS. Specifically, small to moderate levels of correlations were found between the WeSEI and WSSQ; all correlations except for the traditional media source in WeSEI with WSSQ were significant. Correlations were found between the WeSEI and PWSS. All SEM correlations except for the traditional media source and television source in WeSEI with PWSS were significant. Moreover, the fitness of the SEM is presented in Appendix A Table A1.
Table 5: Correlations between the Weight Stigma Exposure Inventory (WeSEI) and other characteristics.
| External Criteria | Social Media | Traditional Media | Television | Parents | Friends | Significant Others | Strangers | Total Score |
|---|---|---|---|---|---|---|---|---|
| SEM | ||||||||
| BMI | 0.055* | 0.004 | 0.046* | 0.059* | 0.021 | 0.035 | 0.087** | 0.049 |
| Total score of DASS21 | 0.207*** | 0.156*** | 0.145*** | 0.161*** | 0.186*** | 0.284*** | 0.235*** | 0.220*** |
| Stress | 0.184*** | 0.129*** | 0.132*** | 0.134*** | 0.156*** | 0.246*** | 0.206*** | 0.191*** |
| Anxiety | 0.226*** | 0.166*** | 0.152*** | 0.187*** | 0.205*** | 0.289*** | 0.236*** | 0.234*** |
| Depression | 0.192*** | 0.159*** | 0.136*** | 0.147*** | 0.181*** | 0.288*** | 0.239*** | 0.214*** |
| Total score of WSSQ | 0.115*** | 0.048 | 0.051* | 0.090*** | 0.116*** | 0.242*** | 0.137*** | 0.127** |
| Total score of PWSS | 0.053* | 0.014 | 0.025 | 0.050* | 0.093*** | 0.169*** | 0.124*** | 0.081* |
| Pearson correlations | ||||||||
| BMI | 0.052 | <0.001 | 0.044 | 0.055 | 0.020 | 0.034 | 0.081 | 0.049 |
| Total score of DASS21 | 0.193*** | 0.152*** | 0.141** | 0.162*** | 0.179*** | 0.277*** | 0.222*** | 0.225*** |
| Stress | 0.174*** | 0.126** | 0.129** | 0.134** | 0.150*** | 0.239*** | 0.195*** | 0.194*** |
| Anxiety | 0.210*** | 0.162*** | 0.148*** | 0.189*** | 0.197*** | 0.285*** | 0.223*** | 0.239*** |
| Depression | 0.179*** | 0.153*** | 0.133** | 0.148*** | 0.175*** | 0.281*** | 0.227*** | 0.219*** |
| Total score of WSSQ | 0.105* | 0.051 | 0.049 | 0.090* | 0.110* | 0.237*** | 0.129** | 0.131** |
| Total score of PWSS | 0.050 | 0.016 | 0.023 | 0.053 | 0.091* | 0.169*** | 0.119** | 0.089* |
Table 6 demonstrates the known groups validity by comparing the WeSEI scores between weight groups with different BMI cutoff values. Among individuals with a BMI <23.0, non-interpersonal sources (social media, traditional media, and television) had higher mean scores than others. Apart from the mean score for the significant others source, individuals with obesity had the highest mean WeSEI total and other source scores among weight groups. Individuals with a BMI between 23.0 and 25.0 (Cohen’s d ranging from 0.010 to 0.149, very low to low effect sizes) and between 25.0 and 30.0 (Cohen’s d ranging from 0.007 to 0.144, very low to low effect sizes) did not greatly differ from those with a BMI <23.0. However, individuals with BMI >30 had large but not significant differences from the other weight groups in both the WeSEI total score and the scores for each source. Effect sizes ranged from low to moderate (0.107 to 0.592), especially in television, parents, and strangers.
Table 6: Comparing the Weight Stigma Exposure Inventory (WeSEI) scores between weight groups by body mass index (BMI).
| WeSEI Score | 1. BMI < 23 (n = 292) | 2. BMI 23–25 (n = 129) | 3. BMI 25–30 (n = 83) | 4. BMI > 30 (n = 13) | F (p-Value)a | P for Trend | Effect Size |
|---|---|---|---|---|---|---|---|
| Total score | 84.2 (29.7) | 86.8 (34.6) | 85.5 (33.0) | 95.5 (18.8) | 1.42 (0.247) | 0.231 | 1 vs. 2/3/4 = 0.083/0.041/0.359 2 vs. 3/4 = 0.042/0.276 3 vs. 4 = 0.318 |
| Social media | 12.5 (4.4) | 12.9 (5.2) | 13.1 (4.8) | 13.6 (2.4) | 1.22 (0.311) | 0.357 | 1 vs. 2/3/4 = 0.103/0.144/0.251 2 vs. 3/4 = 0.041/0.148 3 vs. 4 = 0.107 |
| Traditional media | 13.2 (5.0) | 13.4 (5.2) | 13.1 (5.1) | 13.9 (4.2) | 0.18 (0.911) | 0.683 | 1 vs. 2/3/4 = 0.045/0.018/0.139 2 vs. 3/4 = 0.063/0.094 3 vs. 4 = 0.157 |
| Television | 13.5 (5.6) | 13.6 (6.1) | 13.5 (6.1) | 16.8 (4.3) | 2.26 (0.09) | 0.054 | 1 vs. 2/3/4 = 0.010/0.007/0.561 2 vs. 3/4 = 0.016/0.551 3 vs. 4 = 0.567 |
| Parents | 11.8 (5.4) | 12.6 (6.2) | 12.1 (5.6) | 14.5 (4.4) | 1.77 (0.163) | 0.115 | 1 vs. 2/3/4 = 0.131/0.051/0.481 2 vs. 3/4 = 0.081/0.350 3 vs. 4 = 0.430 |
| Friends | 11.5 (5.1) | 12.0 (6.2) | 11.3 (5.2) | 12.8 (4.5) | 0.63 (0.598) | 0.474 | 1 vs. 2/3/4 = 0.088/0.046/0.250 2 vs. 3/4 = 0.133/0.163 3 vs. 4 = 0.296 |
| Significant others | 10.2 (5.2) | 11.0 (6.0) | 10.5 (5.6) | 9.4 (4.4) | 0.82 (0.487) | 0.519 | 1 vs. 2/3/4 = 0.149/0.051/0.152 2 vs. 3/4 = 0.098/0.302 3 vs. 4 = 0.203 |
| Strangers | 11.5 (5.1) | 11.3 (5.4) | 11.9 (5.7) | 14.4 (5.3) | 1.46 (0.237) | 0.039 | 1 vs. 2/3/4 = 0.035/0.079/0.557 2 vs. 3/4 = 0.114/0.592 3 vs. 4 = 0.477 |
The study shows that the Thai version of the WeSEI has good psychometric properties, including its construct validity (7-factor structure), internal consistency, convergent and discriminant validity, measurement invariance across sex and weight status groups, and known groups validity. Moreover, we also explored the correlation between WeSEI and BMI, depression, anxiety, stress symptoms, WSSQ, and PWSS among the Thai population. The WeSEI demonstrated low and non-significant correlations with BMI. However, significantly small to moderate positive correlations were found between the WeSEI factors and the scores of DASS-21, WSSQ, and PWSS.
The findings of this study supported Hypothesis 1 and previous psychometric testing of the WeSEI in various countries [33,34,35,36,37]. Specifically, this study confirmed the same seven-factor structure identified in previous psychometric evaluations, indicating that social media, traditional media, television, parents, friends, significant others, and strangers are seven distinct sources contributing to weight stigma among Thai young adults. The seven-factor structure demonstrated measurement invariance across sex and weight status groups, suggesting that the WeSEI is suitable for assessing weight stigma across these demographics. Supporting previous studies, the Thai adaptation of WeSEI showed good internal consistency (Cronbach’s α = 0.972; McDonald’s ω = 0.972). Consistent with findings from Malaysia [34], non-interpersonal sources (social media, traditional media, and television) were identified as the primary sources of weight stigma, reflecting the significant role of digital platforms and media in shaping perceptions of weight stigma in Thailand. Similar to other Asian countries, Thai media often promotes a slim ideal body shape through influencers, idols, and celebrities [53]. The pervasive exposure of a slim ideal, particularly among young people who frequently engage with digital media, may heighten vulnerability to weight stigma. Similar to findings from studies of young people in Taiwan and China, but contrasting with results from Malaysia (34), our findings show a problem of distinguishing between television and traditional media, as well as between parents and friends (with HTMT values exceeding 0.9) among Thai young adults.
The higher scores from non-interpersonal sources (social media, traditional media, and television) among individuals with a BMI <23.0 may be related to ideal body shapes perpetuated by the media. Results of known groups validity showed that identifying observed weight stigma among those with a greater BMI was limited in the WeSEI. However, considering that the effect size was not significant, the ability of WeSEI to identify observed weight stigma needs to be interpreted with caution. This finding could be explained by the following reasons. First, those with higher weight but not extremely high overweight may not consider themselves as higher weight; thus, they may not be sensitive to weight stigma exposure [54]. Second, Thai culture nurtures Thai people not to be outwardly judgmental of other people (e.g., using indirect communication to express their criticisms) [55]. In this regard, Thai individuals may not be aware of others’ criticisms of their weight because of indirect communications. Nevertheless, this finding potentially indicates that if individuals reach obesity (BMI > 30), weight stigma exposure is likely to be greater. Therefore, further research on weight stigma among young people in Thailand is warranted. Our findings partially support Hypothesis 2; non-significant correlations between certain factors of the WeSEI and WSSQ may show relatively weak concurrent validity for the WeSEI. Although the concurrent validity of WeSEI was supported by a significant association between the total score of the WeSEI and the WSSQ, the correlation was weak (r = 0.127). Moreover, when scrutinizing each WeSEI factor, there are different sources contributing to observed weight stigma. Because not all sources are important to the weight-related self-stigma (i.e., WSSQ score), it is reasonable that some WeSEI factor scores did not associate with the WSSQ score significantly. In terms of known-group validity analysis, the WeSEI seems to lack sensitivity for the Thai population across BMI levels, with scores consistently higher than those reported in previous studies for each BMI group [33,34,35]. The unsatisfactory concurrent validity and known-group validity for the WeSEI may be due to the similar educational levels of the present sample. Therefore, future studies are encouraged to include participants with diverse educational levels to re-examine the two psychometric properties of WeSEI among Thai populations.
The Thai version of the WeSEI can support understanding weight stigma experiences across sexes and weight status and in developing targeted interventions to address different sources of weight stigma. For instance, promoting positive weight-related content for television to reduce weight discrimination from television sources. Additionally, it can serve as a screening tool to tackle the increasing prevalence of mental health issues associated with weight stigma. It can also be utilized alongside qualitative interviews to investigate media-driven stigma. In summary, WeSEI has the potential to strengthen clinical practice, inform public health strategies, and provide valuable insights for reducing weight stigma and improving overall health.
The present study used a cross-sectional survey design, with participants recruited through online convenience sampling. This approach may introduce sampling bias stemming from the potential homogeneity, particularly in educational background among participants, making the study population less representative of the broader population. Participants who encountered research information on platforms (Facebook, Twitter/X, or university forums) and chose to participate may differ significantly from those who opted not to participate. Furthermore, the sample was biased towards males, which may limit the generalizability of the findings to females. Females are more susceptible to weight stigma, so the findings of this study may not fully reflect the totality of weight stigma for females. Also, the small sample size in the group with obesity (n = 13) may limit the results to individuals with obesity in Thailand. Further, the test-retest reliability of the WeSEI and some of the potential contexts (e.g., sexual or gender minority groups) was not evaluated, which could limit accuracy in measuring sources of weight stigma exposure. Therefore, future studies are encouraged to explore weight stigma in relation to sexual or gender identity. Finally, relying on self-reported data may lead to recall bias and self-report bias related to social desirability.
The WeSEI was translated into the Thai language to assess weight stigma sources in young Thai people. The Thai version of the WeSEI was found to be psychometrically robust in assessing weight stigma in the present sample. The Thai adaptation of WeSEI can evaluate various exposure sources that may contribute to weight stigma and identify individuals who experience high levels of weight stigma. Furthermore, the scale may provide preliminary evidence for developing targeted interventions aimed at reducing weight stigma, helping to mitigate its harmful effects (e.g., poorer mental health).
Acknowledgement:
Funding Statement: The study is supported (in part) by the National Science and Technology Council, Taiwan (NSTC 112–2410-H-006–089-SS2) and Hualien Tzu-Chi Hospital of the Buddhist Tzu Chi Medical Foundation.
Author Contributions: The authors confirm contribution to the paper as follows: Conceptualization: Yen-Chun Wang, Kamolthip Ruckwongpatr, Amornthep Jankaew, Apiradee Pimsen, Chirawat Paratthakonkun, I-Hua Chen, Jung-Sheng Chen, Hsin-Chi Tsai, Nadia Bevan, Chung-Ying Lin; data curation: Amornthep Jankaew, Apiradee Pimsen, Chirawat Paratthakonkun; formal analysis: Yen-Chun Wang, Chung-Ying Lin; funding acquisition: Chung-Ying Lin; investigation: Wan Ying Gan, Hsin-Chi Tsai, Chung-Ying Lin; methodology: Yen-Chun Wang, Nadia Bevan, Chung-Ying Lin; project administration: Yen-Chun Wang, Chung-Ying Lin; resources: Yen-Chun Wang, Chung-Ying Lin; software: Yen-Chun Wang, Chung-Ying Lin; supervision: Chung-Ying Lin; validation: Nadia Bevan; visualization: Yen-Chun Wang, Chung-Ying Lin; writing—original draft: Yen-Chun Wang, Chung-Ying Lin; writing—editing & review: Kamolthip Ruckwongpatr, Amornthep Jankaew, Apiradee Pimsen, Chirawat Paratthakonkun, I-Hua Chen, Jung-Sheng Chen, Hsin-Chi Tsai, Nadia Bevan, Chung-Ying Lin. All authors reviewed the results and approved the final version of the manuscript.
Availability of Data and Materials: The data and code underlying the current findings can be obtained from Chung-Ying Lin upon a reasonable request.
Ethics Approval: The study protocol was approved by the Human Research Ethics Committee of National Cheng Kung University (NCKU HREC-E-110-486-2) and was subsequently endorsed by the ethics committee at Mahidol University prior to the data collection of the study. The survey provided to information sheet and an informed consent form on the first page of the survey. Participants must agree to the study before proceeding to complete the survey.
Conflicts of Interest: The authors declare no conflicts of interest to report regarding the present study.
Table A1: The fitness of the models testing correlations between Weight Stigma Exposure Inventory (WeSEI) and other characteristics via structural equation modeling.
| External Criteria | Subfactors Model | Total Model | ||
|---|---|---|---|---|
| CFI | RMSEA | CFI | RMSEA | |
| BMI | 0.979 | 0.070 | 0.962 | 0.092 |
| Total score of DASS21 | 0.978 | 0.071 | 0.961 | 0.093 |
| Stress | 0.978 | 0.071 | 0.962 | 0.093 |
| Anxiety | 0.978 | 0.071 | 0.962 | 0.093 |
| Depression | 0.978 | 0.071 | 0.961 | 0.093 |
| Total score of WSSQ | 0.978 | 0.071 | 0.961 | 0.093 |
| Total score of PWSS | 0.978 | 0.071 | 0.961 | 0.093 |
References
1. Alomari MA , Khabour OF , Bani-Ahmed AA . The adverse impact of waterpipe dependence on emotions: the obesity factor. Asian J Soc Health Behav. 2024; 7( 3): 103– 8. doi:10.4103/shb.shb_112_24. [Google Scholar] [CrossRef]
2. Ng M , Fleming T , Robinson M , Thomson B , Graetz N , Margono C , et al. Global, regional, and national prevalence of overweight and obesity in children and adults during 1980–2013: a systematic analysis for the Global Burden of Disease Study 2013. Lancet. 2014; 384( 9945): 766– 81. doi:10.1016/S0140-6736(14)60460-8. [Google Scholar] [CrossRef]
3. Hruby A , Hu FB . The epidemiology of obesity: a big picture. Pharmacoeconomics. 2015; 33( 7): 673– 89. doi:10.1007/s40273-014-0243-x. [Google Scholar] [CrossRef]
4. Sakboonyarat B , Pornpongsawad C , Sangkool T , Phanmanas C , Kesonphaet N , Tangthongtawi N , et al. Trends, prevalence and associated factors of obesity among adults in a rural community in Thailand: serial cross-sectional surveys, 2012 and 2018. BMC Public Health. 2020; 20( 1): 850. doi:10.1186/s12889-020-09004-w. [Google Scholar] [CrossRef]
5. Rongmuang D , Corte C , McCreary LL , Park CG , Miller A , Gallo A . Salience of physical appearance characteristics among young women in Thailand. Body Image. 2011; 8( 4): 396– 403. doi:10.1016/j.bodyim.2011.05.004. [Google Scholar] [CrossRef]
6. Fulton M , Dadana S , Srinivasan VN . Obesity, stigma, and discrimination [Internet]. Treasure Island, FL, USA: StatPearls Publishing; 2025 [cited 2025 Jul 1]. Available from: https://www.ncbi.nlm.nih.gov/books/NBK554571/. [Google Scholar]
7. Puhl RM , Heuer CA . Obesity stigma: important considerations for public health. Am J Public Health. 2010; 100( 6): 1019– 28. doi:10.2105/AJPH.2009.159491. [Google Scholar] [CrossRef]
8. Sánchez-Carracedo D . Obesity stigma and its impact on health: a narrative review. Endocrinol Diabetes Nutr. 2022; 69( 10): 868– 77. doi:10.1016/j.endinu.2021.12.002. [Google Scholar] [CrossRef]
9. Sonneville KR , Thurston IB , Gordon AR , Richmond TK , Weeks HM , Lipson SK . Weight stigma associated with mental health concerns among college students. Am J Prev Med. 2024; 66( 2): 260– 8. doi:10.1016/j.amepre.2023.09.021. [Google Scholar] [CrossRef]
10. Alimoradi Z , Golboni F , Griffiths MD , Broström A , Lin CY , Pakpour AH . Weight-related stigma and psychological distress: a systematic review and meta-analysis. Clin Nutr. 2020; 39( 7): 2001– 13. doi:10.1016/j.clnu.2019.10.016. [Google Scholar] [CrossRef]
11. Stevens SD , Herbozo S , Morrell HE , Schaefer LM , Thompson JK . Adult and childhood weight influence body image and depression through weight stigmatization. J Health Psychol. 2017; 22( 8): 1084– 93. doi:10.1177/1359105315624749. [Google Scholar] [CrossRef]
12. Westbury S , Oyebode O , van Rens T , Barber TM . Obesity stigma: causes, consequences, and potential solutions. Curr Obes Rep. 2023; 12( 1): 10– 23. doi:10.1007/s13679-023-00495-3. [Google Scholar] [CrossRef]
13. Leget DL , LaCaille LJ , Hooker SA , LaCaille RA , Lauritsen MW . Applying self-determination theory to internalized weight stigma and mental health correlates among young and middle adult women: a structural equation model. J Health Psychol. 2025; 30( 2): 253– 67. doi:10.1177/13591053241248283. [Google Scholar] [CrossRef]
14. Brewis A , SturtzSreetharan C , Wutich A . Obesity stigma as a globalizing health challenge. Global Health. 2018; 14( 1): 20. doi:10.1186/s12992-018-0337-x. [Google Scholar] [CrossRef]
15. Flint SW , Vázquez-Velázquez V , Le Brocq S , Brown A . The real-life experiences of people living with overweight and obesity: a psychosocial perspective. Diabetes Obes Metab. 2025; 27( Suppl 2): 35– 47. doi:10.1111/dom.16255. [Google Scholar] [CrossRef]
16. Ryan L , Coyne R , Heary C , Birney S , Crotty M , Dunne R , et al. Weight stigma experienced by patients with obesity in healthcare settings: a qualitative evidence synthesis. Obes Rev. 2023; 24( 10): e13606. doi:10.1111/obr.13606. [Google Scholar] [CrossRef]
17. Makara-Studzińska M , Podstawka D , Goclon K . Factors influencing self-perception of overweight people. Pol Merkur Lekarski. 2013; 35( 209): 313– 5. [Google Scholar]
18. Wott CB , Carels RA . Overt weight stigma, psychological distress and weight loss treatment outcomes. J Health Psychol. 2010; 15( 4): 608– 14. doi:10.1177/1359105309355339. [Google Scholar] [CrossRef]
19. Brown A , Flint SW , Batterham RL . Pervasiveness, impact and implications of weight stigma. eClinicalMedicine. 2022; 47: 101408. doi:10.1016/j.eclinm.2022.101408. [Google Scholar] [CrossRef]
20. Son E , Kwon KH . The impact of excessive dieting on eating disorders in adolescent women: a literature review. Nutr Food Sci. 2024; 54( 2): 366– 76. doi:10.1108/nfs-06-2023-0127. [Google Scholar] [CrossRef]
21. Kite J , Huang BH , Laird Y , Grunseit A , McGill B , Williams K , et al. Influence and effects of weight stigmatisation in media: a systematic. eClinicalMedicine. 2022; 48: 101464. doi:10.1016/j.eclinm.2022.101464. [Google Scholar] [CrossRef]
22. Puhl RM , Lessard LM . Weight stigma in youth: prevalence, consequences, and considerations for clinical practice. Curr Obes Rep. 2020; 9( 4): 402– 11. doi:10.1007/s13679-020-00408-8. [Google Scholar] [CrossRef]
23. BPS Obesity Task and Finish Group . Weight bias, stigma and discrimination. In: Psychological perspectives on obesity: addressing policy, practice and research priorities. Leicester, UK: The British Psychological Society; 2019. p. 20– 6. doi:10.53841/bpsrep.2019.rep130.5. [Google Scholar] [CrossRef]
24. Lacroix E , Alberga A , Russell-Mathew S , McLaren L , von Ranson K . Weight bias: a systematic review of characteristics and psychometric properties of self-report questionnaires. Obes Facts. 2017; 10( 3): 223– 37. doi:10.1159/000475716. [Google Scholar] [CrossRef]
25. Ruggs EN , King EB , Hebl M , Fitzsimmons M . Assessment of weight stigma. Obes Facts. 2010; 3( 1): 60– 9. doi:10.1159/000273208. [Google Scholar] [CrossRef]
26. Myers A , Rosen JC . Obesity stigmatization and coping: relation to mental health symptoms, body image, and self-esteem. Int J Obes Relat Metab Disord. 1999; 23( 3): 221– 30. doi:10.1038/sj.ijo.0800765. [Google Scholar] [CrossRef]
27. Durso LE , Latner JD . Understanding self-directed stigma: development of the weight bias internalization scale. Obesity. 2008; 16( Suppl 2): S80– 6. doi:10.1038/oby.2008.448. [Google Scholar] [CrossRef]
28. Thompson JK , Fabian LJ , Moulton DO , Dunn ME , Altabe MN . Development and validation of the physical appearance related teasing scale. J Pers Assess. 1991; 56( 3): 513– 21. doi:10.1207/s15327752jpa5603_12. [Google Scholar] [CrossRef]
29. Lillis J , Luoma JB , Levin ME , Hayes SC . Measuring weight self-stigma: the weight self-stigma questionnaire. Obesity. 2010; 18( 5): 971– 6. doi:10.1038/oby.2009.353. [Google Scholar] [CrossRef]
30. Lin CY , Strong C , Latner JD , Lin YC , Tsai MC , Cheung P . Mediated effects of eating disturbances in the association of perceived weight stigma and emotional distress. Eat Weight Disord. 2020; 25( 2): 509– 18. doi:10.1007/s40519-019-00641-8. [Google Scholar] [CrossRef]
31. Chen C , Gonzales L . Understanding weight stigma in eating disorder treatment: development and initial validation of a treatment-based stigma scale. J Health Psychol. 2022; 27( 13): 3028– 45. doi:10.1177/13591053221079177. [Google Scholar] [CrossRef]
32. Lindloff MR , Meadows A , Calogero RM . Living while fat: development and validation of the fat microaggressions scale. J Pers Soc Psychol. 2024; 127( 2): 335– 62. doi:10.1037/pspi0000450. [Google Scholar] [CrossRef]
33. Ruckwongpatr K , Chen IH , Pramukti I , Huang PC , Latner JD , O’Brien KS , et al. Assessing exposure to weight stigma: development and initial validation of the weight stigma exposure inventory (WeSEI). J Eat Disord. 2025; 13( 1): 2. doi:10.1186/s40337-024-01168-9. [Google Scholar] [CrossRef]
34. Wan YG , Chen IH , Tung SEH , Huang RY , Poon WC , Siaw YL , et al. Psychometric evaluation of the Malay version of weight stigma exposure inventory (WeSEI) among Malaysian young adults. Inquiry. 2025; 62: 00469580251339395. doi:10.1177/00469580251339395. [Google Scholar] [CrossRef]
35. Çarkıt C , Gan WY , Koç H , Bevan N , Avcı E , Lin YC . Weight stigma exposure inventory (WeSEI): adaptation to Turkish culture, validity and reliability study. J Soc Media Res. 2025; 2( 1): 24– 34. doi:10.29329/jsomer.27. [Google Scholar] [CrossRef]
36. Ruckwongpatr K , Su JA , Chen IH , Bevan N , Nurmala I , Muthmainnah M , et al. Bahasa Indonesia version of weight stigma exposure inventory (WeSEI): translation and validation among young adults. Acta Psychol. 2025; 261: 105748. doi:10.1016/j.actpsy.2025.105748. [Google Scholar] [CrossRef]
37. Chen JK , Rhodes O , Fan CW , O’Brien KM , Gökalp A , Değirmenci N , et al. Weight stigma exposure inventory (WeSEI): validity and reliability study of the Chinese version in Hong Kong. J Soc Media Res. 2025; 2( 3): 155– 63. doi:10.29329/jsomer.47. [Google Scholar] [CrossRef]
38. Jitnarin N , Kosulwat V , Rojroongwasinkul N , Boonpraderm A , Haddock CK , Poston WSC . Prevalence of overweight and obesity in Thai population: results of the national Thai food consumption survey. Eat Weight Disord. 2011; 16( 4): e242– 9. doi:10.1007/BF03327467. [Google Scholar] [CrossRef]
39. Beaton DE , Bombardier C , Guillemin F , Ferraz MB . Guidelines for the process of cross-cultural adaptation of self-report measures. Spine. 2000; 25( 24): 3186– 91. doi:10.1097/00007632-200012150-00014. [Google Scholar] [CrossRef]
40. Antony MM , Bieling PJ , Cox BJ , Enns MW , Swinson RP . Psychometric properties of the 42-item and 21-item versions of the depression anxiety stress scales in clinical groups and a community sample. Psychol Assess. 1998; 10( 2): 176– 81. doi:10.1037/1040-3590.10.2.176. [Google Scholar] [CrossRef]
41. Oei TPS , Sawang S , Goh YW , Mukhtar F . Using the depression anxiety stress scale 21 (DASS-21) across cultures. Int J Psychol. 2013; 48( 6): 1018– 29. doi:10.1080/00207594.2012.755535. [Google Scholar] [CrossRef]
42. Lovibond SH , Lovibond PF . Psychology Foundation of A. Manual for the depression anxiety stress scales. 2nd ed. Sydney, NSW, Australia: Psychology Foundation of Australia; 1995. doi:10.1037/t01004-000. [Google Scholar] [CrossRef]
43. Pensuksan WC , Lertmaharit S , Lohsoonthorn V , Rattananupong T , Sonkprasert T , Gelaye B , et al. Relationship between poor sleep quality and psychological problems among undergraduate students in the southern Thailand. Walailak J Sci Technol. 2016; 13( 4): 235– 42. [Google Scholar]
44. Chirawat P , Kamolthip R , Rattaprach R , Nadhiroh SR , Tung SEH , Gan WY , et al. Weight stigma among young adults in Thailand: reliability, validation, and measurement invariance of the Thai-translated weight self stigma questionnaire and perceived weight stigma scale. Int J Environ Res Public Health. 2022; 19( 23): 15868. doi:10.3390/ijerph192315868. [Google Scholar] [CrossRef]
45. Mîndrilă D . Maximum likelihood (ML) and diagonally weighted least squares (DWLS) estimation procedures: a comparison of estimation bias with ordinal and multivariate non-normal data. Int J Digit Soc. 2010; 1( 1): 60– 6. doi:10.20533/ijds.2040.2570.2010.0010. [Google Scholar] [CrossRef]
46. Stevens J . Applied multivariate statistics for the social sciences. New York, NY, USA: Routledge; 2009. doi:10.4324/9780203843130. [Google Scholar] [CrossRef]
47. Schermelleh-Engel K , Moosbrugger H , Müller H . Evaluating the fit of structural equation models: tests of significance and descriptive goodness-of-fit measures. Methods Psychol Res. 2003; 8( 2): 23– 74. [Google Scholar]
48. Finch WH . Using fit statistic differences to determine the optimal number of factors to retain in an exploratory factor analysis. Educ Psychol Meas. 2020; 80( 2): 217– 41. doi:10.1177/0013164419865769. [Google Scholar] [CrossRef]
49. Kalkbrenner MT . Alpha, omega, and H internal consistency reliability estimates: reviewing these options and when to use them. Couns Outcome Res Eval. 2023; 14( 1): 77– 88. doi:10.1080/21501378.2021.1940118. [Google Scholar] [CrossRef]
50. Chen FF . Sensitivity of goodness of fit indexes to lack of measurement invariance. Struct Equ Model A Multidiscip J. 2007; 14( 3): 464– 504. doi:10.1080/10705510701301834. [Google Scholar] [CrossRef]
51. Cheung GW , Cooper-Thomas HD , Lau RS , Wang LC . Reporting reliability, convergent and discriminant validity with structural equation modeling: a review and best-practice recommendations. Asia Pac J Manag. 2024; 41( 2): 745– 83. doi:10.1007/s10490-023-09871-y. [Google Scholar] [CrossRef]
52. Lovakov A , Agadullina ER . Empirically derived guidelines for effect size interpretation in social psychology. Eur J Soc Psychol. 2021; 51( 3): 485– 504. doi:10.1002/ejsp.2752. [Google Scholar] [CrossRef]
53. Mathialagan S , Lau PL . Weightism in Asia: a narrative review and implications for practice. J Obes Metab Syndr. 2024; 33( 4): 314– 25. doi:10.7570/jomes24033. [Google Scholar] [CrossRef]
54. Robinson E , Haynes A , Sutin A , Daly M . Self-perception of overweight and obesity: a review of mental and physical health outcomes. Obes Sci Pract. 2020; 6( 5): 552– 61. doi:10.1002/osp4.424. [Google Scholar] [CrossRef]
55. Commisceo Global Consulting . Guide to Thai Culture, Etiquette and Business Practices: Commisceo Global [Internet]. 2016 [cited 2025 Jul 1]. Available from: http://www.commisceo-global.com/country-guides/thailand-guide. [Google Scholar]
Cite This Article
 Copyright © 2025 The Author(s). Published by Tech Science Press.
This work is licensed under a Creative Commons Attribution 4.0 International License , which permits unrestricted use, distribution, and reproduction in any medium, provided the original work is properly cited.
 Downloads
 Citation Tools