
 Submit a Paper
 Propose a Special lssue
 Open Access
ARTICLE

Two Eras of Despair: A Long-Term Trend Analysis of Deaths of Despair in Central and Eastern Europe and Central Asia
1 Program in Public Health, Graduate School, Korea University, Seoul, 02841, Republic of Korea
2 Transdisciplinary Major in Learning Health Systems, Graduate School, Korea University, Seoul, 02841, Republic of Korea
3 Department of Preventive Medicine, Korea University College of Medicine, Seoul, 02841, Republic of Korea
4 Institute for Future Public Health, Graduate School of Public Health, Korea University, Seoul, 02841, Republic of Korea
5 Douglas Mental Health University Institute & Department of Psychiatry, McGill University, Montreal, QC H4H 1R3, Canada
6 Institute for Health and Social Affairs on Korean Peninsula, Korea University, Seoul, 02841, Republic of Korea
7 Program in Korean Unification Studies, Graduate School, Yonsei University, Seoul, 03722, Republic of Korea
8 Graduate School of Social Welfare, Yonsei University, Seoul, 03722, Republic of Korea
* Corresponding Author: Yo Han Lee. Email:
International Journal of Mental Health Promotion 2026, 28(1), 4 https://doi.org/10.32604/ijmhp.2025.073735
Received 24 September 2025; Accepted 24 November 2025; Issue published 28 January 2026
 View Full Text
 Download PDF
Abstract
Background: That Central and Eastern Europe and Central Asia (CEECA) experienced a major mortality crisis in the 1990s is a well-established finding, with most analyses focusing on singular causes like alcohol-related deaths. However, the utility of the integrated “deaths of despair” framework, which views alcohol, drug, and suicide deaths as a unified socio-economic phenomenon, remains under-explored in this context. Crucially, the long-term evolution of the composition of despair within the region remains a largely unexplored area of inquiry. Therefore, this study aims to analyze the long-term trends, changing composition, and regional heterogeneity of deaths from despair in the CEECA region from 1980 to 2021. Methods: Using 2021 Global Burden of Disease (GBD) data (1980–2021), we analyzed deaths of despair mortality trends in 29 CEECA countries. We employed Joinpoint regression to identify significant trend changes and conducted stratified analyses by cause, gender, and age group. Results: The CEECA deaths of despair crisis began as an alcohol and suicide driven phenomenon concentrated in middle-aged men (50–74 years) during the 1990s, with mortality rates for alcohol use disorders and self-harm surging annually by 30.35% (p = 0.002) and 13.44% (p = 0.001), respectively, between 1991 and 1994. It has since evolved, marked by a contrasting and emerging threat in the 21st century: a rising proportion of drug-related deaths among the younger (15–49 years) male cohort, where the share of drug use disorders increased from 6.9% in 2000 to 11.8% in 2008. Conclusion: The deaths of despair crisis in the CEECA region is not a past event but an ongoing, evolving phenomenon. Its changing nature demands a shift in public health focus from solely historical drivers to new, generation-specific threats, particularly the rise of drug-related despair among youth.Keywords
In the 21st century, life expectancy in the United States began to decline for the first time since World War II [1,2]. A leading hypothesis suggests this trend was primarily driven by mortality from suicide, drug overdose, and alcohol-related diseases, concentrated among the working class [3,4]. Economists Anne Case and Angus Deaton coined the phrase “deaths of despair” to describe this accelerating health crisis at the bottom of the American class structure [5]. This phenomenon, however, is not unique to the United States or the 21st century. Recent analyses highlight persistent global concerns regarding mortality associated with despair, despite significant regional variations and gender disparities [6].
In the 1990s, post-socialist countries in Europe were struck by a mortality crisis of a much greater magnitude, claiming millions of lives [7,8,9]. The nature of this crisis, however, was not uniform across all countries in the Central and Eastern Europe and Central Asia (CEECA) region. The member states of the former Soviet Union were the most severely affected [10]; in Russia, male life expectancy at birth fell by 6.6 years between 1989 and 1994, with neighboring countries such as Estonia, Latvia, and Lithuania experiencing similar declines of approximately 4 years on average during the same period. In contrast, countries such as the Czech Republic, Poland, Hungary, and Slovenia saw a continuous increase in life expectancy after their economic reforms began [11,12].
The study of deaths of despair in the CEECA region offers a valuable opportunity to examine the health impacts of rapid socio-political change [13]; potentially through mechanisms related to employment change, social integration, economic or psychological distress, and these factors are increasingly recognized as key drivers of this phenomenon [14]. However, much of the research has examined only limited aspects of the crisis. Some research focused on a single country (often Russia) or analyzed certain aspects of the overall issue, such as the effects of rapid privatization on alcohol consumption and suicide rates [15,16]. Furthermore, in contrast to the United States, where drug-related mortality was the primary concern, alcohol-related deaths were a central cause of mortality in post-socialist countries, with drug-related deaths having a comparatively minor impact [17,18]. Because the constituent elements of despair were different, mortality from each cause (alcohol, drugs, and suicide) tended to be studied as separate issues rather than as an interconnected phenomenon.
Despite this focus, the majority of research on the CEECA mortality crisis has focused on the acute phase of the 1990s. The long-term evolution of this crisis has not been well illuminated. Specifically, there has been a lack of comprehensive analysis on the diversification of the primary causes and most vulnerable groups since the 2000s, and how the common shock of the Soviet collapse led, in different countries, to crises with different patterns over time [19,20]. Therefore, it is worth investigating the long-term trends of deaths of despair in the CEECA region to discern which causes and age groups better explain the mortality patterns of different historical periods.
The objectives of this study are: (1) to analyze the long-term trends and joinpoints of deaths of despair in the CEECA region from 1980 to 2021 by cause and gender; (2) to compare the 1990s crisis with the post-2000s period to identify how the main causes and vulnerable age groups have changed; and (3) to analyze how trends in deaths of despair show different patterns among CEECA countries since the 2000s.
This study utilized data from the 2021 Global Burden of Disease (GBD) study provided by the University of Washington’s Institute for Health Metrics and Evaluation (IHME) [21]. The data examined spanned 42 years, from 1980 to 2021, and all data were extracted via the GBD Results Tool (https://vizhub.healthdata.org/gbd-results, accessed on 17 January 2025). Multiple analyses were conducted. First, to identify the characteristics of the CEECA region as compared to other regions, all seven GBD super regions were comparatively analyzed. Subsequently, an in-depth analysis focusing on the main analytical unit of this study, the CEECA super region, was conducted. Finally, to examine intra-regional heterogeneity, data from the 29 individual countries within CEECA were also utilized.
Unlike the classifications of the United Nations or the World Bank, which are mainly based on geographical location or economic status, the GBD study’s Super Regions classification system divides regions based on two criteria: epidemiological homogeneity and geographical contiguity [22]. In addition, while international organizations such as the UN or the World Bank do not typically provide detailed mortality data on specific causes and age groups, the GBD estimates mortality rates for 371 diseases and injuries by detailed age groups and applies consistent estimation methods across all countries, ensuring data comparability [21].
2.2 Definition of “Deaths of Despair” and Variables
This study is based on the conceptual definition of “deaths of despair” proposed by Case et al. [5]. Originally, this concept primarily included deaths from suicide, drug overdose, and alcohol-related liver disease. However, in this study, considering the availability and comparability of the GBD 2021 data’s cause hierarchy, we operationally defined “deaths of despair” using the three conceptually closest high-level categories: (1) alcohol use disorders (AUD), (2) drug use disorders (DUD), and (3) self-harm.
The primary analytic metric was the age-standardized mortality rate per 100,000 population. Age-specific mortality rate was also used for trend analysis by age group. All data were stratified by gender (male, female), the 29 CEECA countries, and three age groups (15–49 years, 50–74 years, and 75+ years) for analysis.
This study, under the premise that a long-term 42-year mortality trend would be unlikely to show a single linear pattern, focused on analyzing dynamic changes over time. To this end, Joinpoint regression analysis was adopted as the core analytical method. Joinpoint regression analysis is a statistical method used to identify specific points in time (joinpoints) where significant changes occur in the trend (slope) of time-series data. It is the most suitable for objectively identifying the specific points in time (joinpoints) where a trend’s direction changes significantly and for quantifying the rate of change within each segment [23,24]. This methodology allowed for the data-driven discrimination of historically distinct periods, such as the 1990s crisis and the post-2000s stabilization, and for the statistical comparison of mortality change rates across these periods.
The analysis was performed using the Joinpoint Regression Program (Version 5.4.0.0, April 2025; Statistical Research and Applications Branch, National Cancer Institute). As this study includes 42 annual data points, the maximum number of joinpoints the model could identify was set to 7, in accordance with the program’s recommendation. The Grid Search method was employed, and the optimal number of joinpoints within the range of 0 to 7 was selected using the Weighted Bayesian Information Criterion (WBIC) as the model selection criterion. A statistically significant joinpoint indicates the point at which a trend changes in a statistically meaningful way. Specifically, this means that statistical testing has confirmed the rate of change (slope) before and after the joinpoint. This determination was made by statistically testing the assumption that the rates of change before and after the given point were identical and finding strong evidence (p < 0.05) that they were not. The joinpoint model divided the entire period into several segments based on statistically significant joinpoints. The trend for each segment was presented as the annual percent change (APC) and its 95% confidence interval (CI), and the average trend for the entire period was summarized by the average annual percent change (AAPC) and its 95% CI.
Additionally, descriptive statistical analysis was performed to calculate temporal changes in the cause-specific composition ratio (%) within age groups and to comparatively analyze the trends and gaps in mortality rates between gender and age groups. The results were visualized with graphs. A heatmap was generated to enable visual comparison and analysis of the heterogeneity of cause-specific mortality patterns among the 29 CEECA countries.
During the entire analysis period (1980–2021), mortality rates from AUD and self-harm in the CEECA region showed statistically significant decreasing trends overall. The rates for both AUD and self-harm significantly reduced by an average of 1.24% annually (AAPC: −1.24, 95% CI: −1.50 to −0.98, p < 0.001; and AAPC: −1.24, 95% CI: −1.31 to −1.16, p < 0.001, respectively). In contrast, the overall trend for DUD mortality was not statistically significant, showing a slight average annual increase (AAPC: 0.24, 95% CI: −0.04 to 0.49, p = 0.072) (Table 1). Although the overall trend (AAPC) for DUD mortality was not significant, a period-specific analysis using joinpoint regression revealed an essential shift in the latter part of the period. Before 2006, the DUD mortality trend fluctuated without a statistically significant direction. However, the trend shifted significantly downward starting in 2006. The rate decreased significantly by 9.11% annually between 2006 and 2011 (APC: −9.11, 95% CI: −11.22 to −1.45, p = 0.018), and this significant decreasing trend continued in the subsequent 2011–2021 period, with an annual decrease of 3.03% (APC: −3.03, 95% CI: −6.31 to −1.30, p = 0.026). Despite the long-term decreasing trend for AUD and self-harm, both causes experienced their most dramatic increases during the early 1990s, coinciding with the period of acute crisis. Specifically, in the 1991–1994 period, the AUD mortality rate surged by 30.35% annually (APC: 30.35, 95% CI: 26.48 to 33.47, p = 0.002), and self-harm mortality also increased sharply by 13.44% annually during the same period (APC: 13.44, 95% CI: 11.70 to 14.54, p = 0.001). Following this peak, both causes exhibited significant volatility, characterized by sharp decreases followed by periods of increase (Table 1). However, these trends gradually stabilized from the early 2000s; the self-harm mortality rate entered a consistent, significant long-term decline from 2001 onward (APC: −3.30, p < 0.001), and the AUD mortality rate began a sustained period of substantial decrease starting from 2004 (2004–2012 APC: −8.75, p < 0.001; 2012–2021 APC: −1.95, p = 0.022).
Table 1: CEECA regions ‘deaths of despair’ Trends Analysis of Mortality and Causes, Joinpoint Regression, 1980–2021.
| Cause | Time Period | AAPC/APC (95% CI) | p-Value |
|---|---|---|---|
| Alcohol use disorders | Overall (1980–2021) | −1.24*** (−1.50, −0.98) | <0.001 |
| 1980–1983 | −1.00 (−4.15, 5.58) | 0.602 | |
| 1983–1987 | −14.22** (−19.02, −11.27) | 0.002 | |
| 1987–1991 | 9.88** (5.95, 13.49) | 0.001 | |
| 1991–1994 | 30.35** (26.48, 33.47) | 0.002 | |
| 1994–1998 | −10.35** (−11.94, −8.19) | 0.002 | |
| 1998–2004 | 5.23** (4.24, 6.32) | 0.001 | |
| 2004–2012 | −8.75*** (−9.50, −8.17) | <0.001 | |
| 2012–2021 | −1.95* (−3.37, −0.32) | 0.022 | |
| Drug use disorders | Overall (1980–2021) | 0.24 (−0.04, 0.49) | 0.072 |
| 1980–1989 | −2.38 (−4.98, 0.40) | 0.058 | |
| 1989–1994 | 13.05 (−5.78, 19.26) | 0.124 | |
| 1994–1997 | −2.03 (−4.14, 14.89) | 0.481 | |
| 1997–2003 | 4.02 (−0.21, 11.15) | 0.056 | |
| 2003–2006 | 10.93 (−9.73, 13.05) | 0.208 | |
| 2006–2011 | −9.11** (−11.22, −1.45) | 0.018 | |
| 2011–2021 | −3.03* (−6.31, −1.30) | 0.026 | |
| Self-harm | Overall (1980–2021) | −1.24*** (−1.31, −1.16) | <0.001 |
| 1980–1984 | −0.53 (−1.41, 0.96) | 0.357 | |
| 1984–1987 | −6.93** (−8.24, −4.28) | 0.001 | |
| 1987–1991 | 2.84** (1.73, 4.32) | 0.003 | |
| 1991–1994 | 13.44** (11.70, 14.54) | 0.001 | |
| 1994–1997 | −3.05*** (−4.02, −1.26) | <0.001 | |
| 1997–2001 | 0.00 (−2.93, 1.09) | 0.878 | |
| 2001–2021 | −3.30*** (−3.45, −3.21) | <0.001 |
An analysis of the overall deaths of despair mortality trend in the CEECA region by gender revealed that the explosive surge in mortality in the early 1990s was primarily driven by the male population (Fig. 1). During this period, the male mortality rate peaked at 91.8 per 100,000 population, while the female mortality rate remained relatively low and stable. As a result, the gender gap in deaths of despair widened significantly during the 1990s compared to the preceding period. To determine if this male-concentrated surge in mortality originated from a specific age group, we analyzed trends by age-specific mortality rate, dividing males into three age groups (Fig. 2). The analysis clearly showed that the 1990s crisis was explosively concentrated among middle-aged men (50–74 years). This group’s mortality rate peaked in 1994 at 172.2 per 100,000, overwhelming all other age groups. However, the crisis was also very severe for young adults. The mortality rate of the young adult group (15–49 years) also exploded, more than doubling from 55.8 in 1987 to 115.4 in 1994, showing an increase rate comparable to that of the middle-aged group. In contrast, the mortality rate of the older adult group (75+ years) remained relatively stable during this period, showing a clear contrast. Finally, the cause-of-death composition was analyzed to identify the core cause of the 1990s crisis among middle-aged men (50–74 years; Fig. 3b). The largest single cause of deaths of despair among the middle-aged was not AUD but self-harm, which consistently exceeded 50% throughout the entire period. The 1990s mortality surge was driven by the addition of AUD mortality on top of the high baseline of self-harm mortality, with its proportion surging from about 32% in 1987 to about 43% in 1994. The fact that the relative proportion of self-harm decreased at the peak of the crisis highlights the rapid increase in the number of alcohol-related deaths. The 1990s crisis can be understood as a complex crisis where an acute shock from AUD was added to the chronic problem of self-harm among middle-aged men.
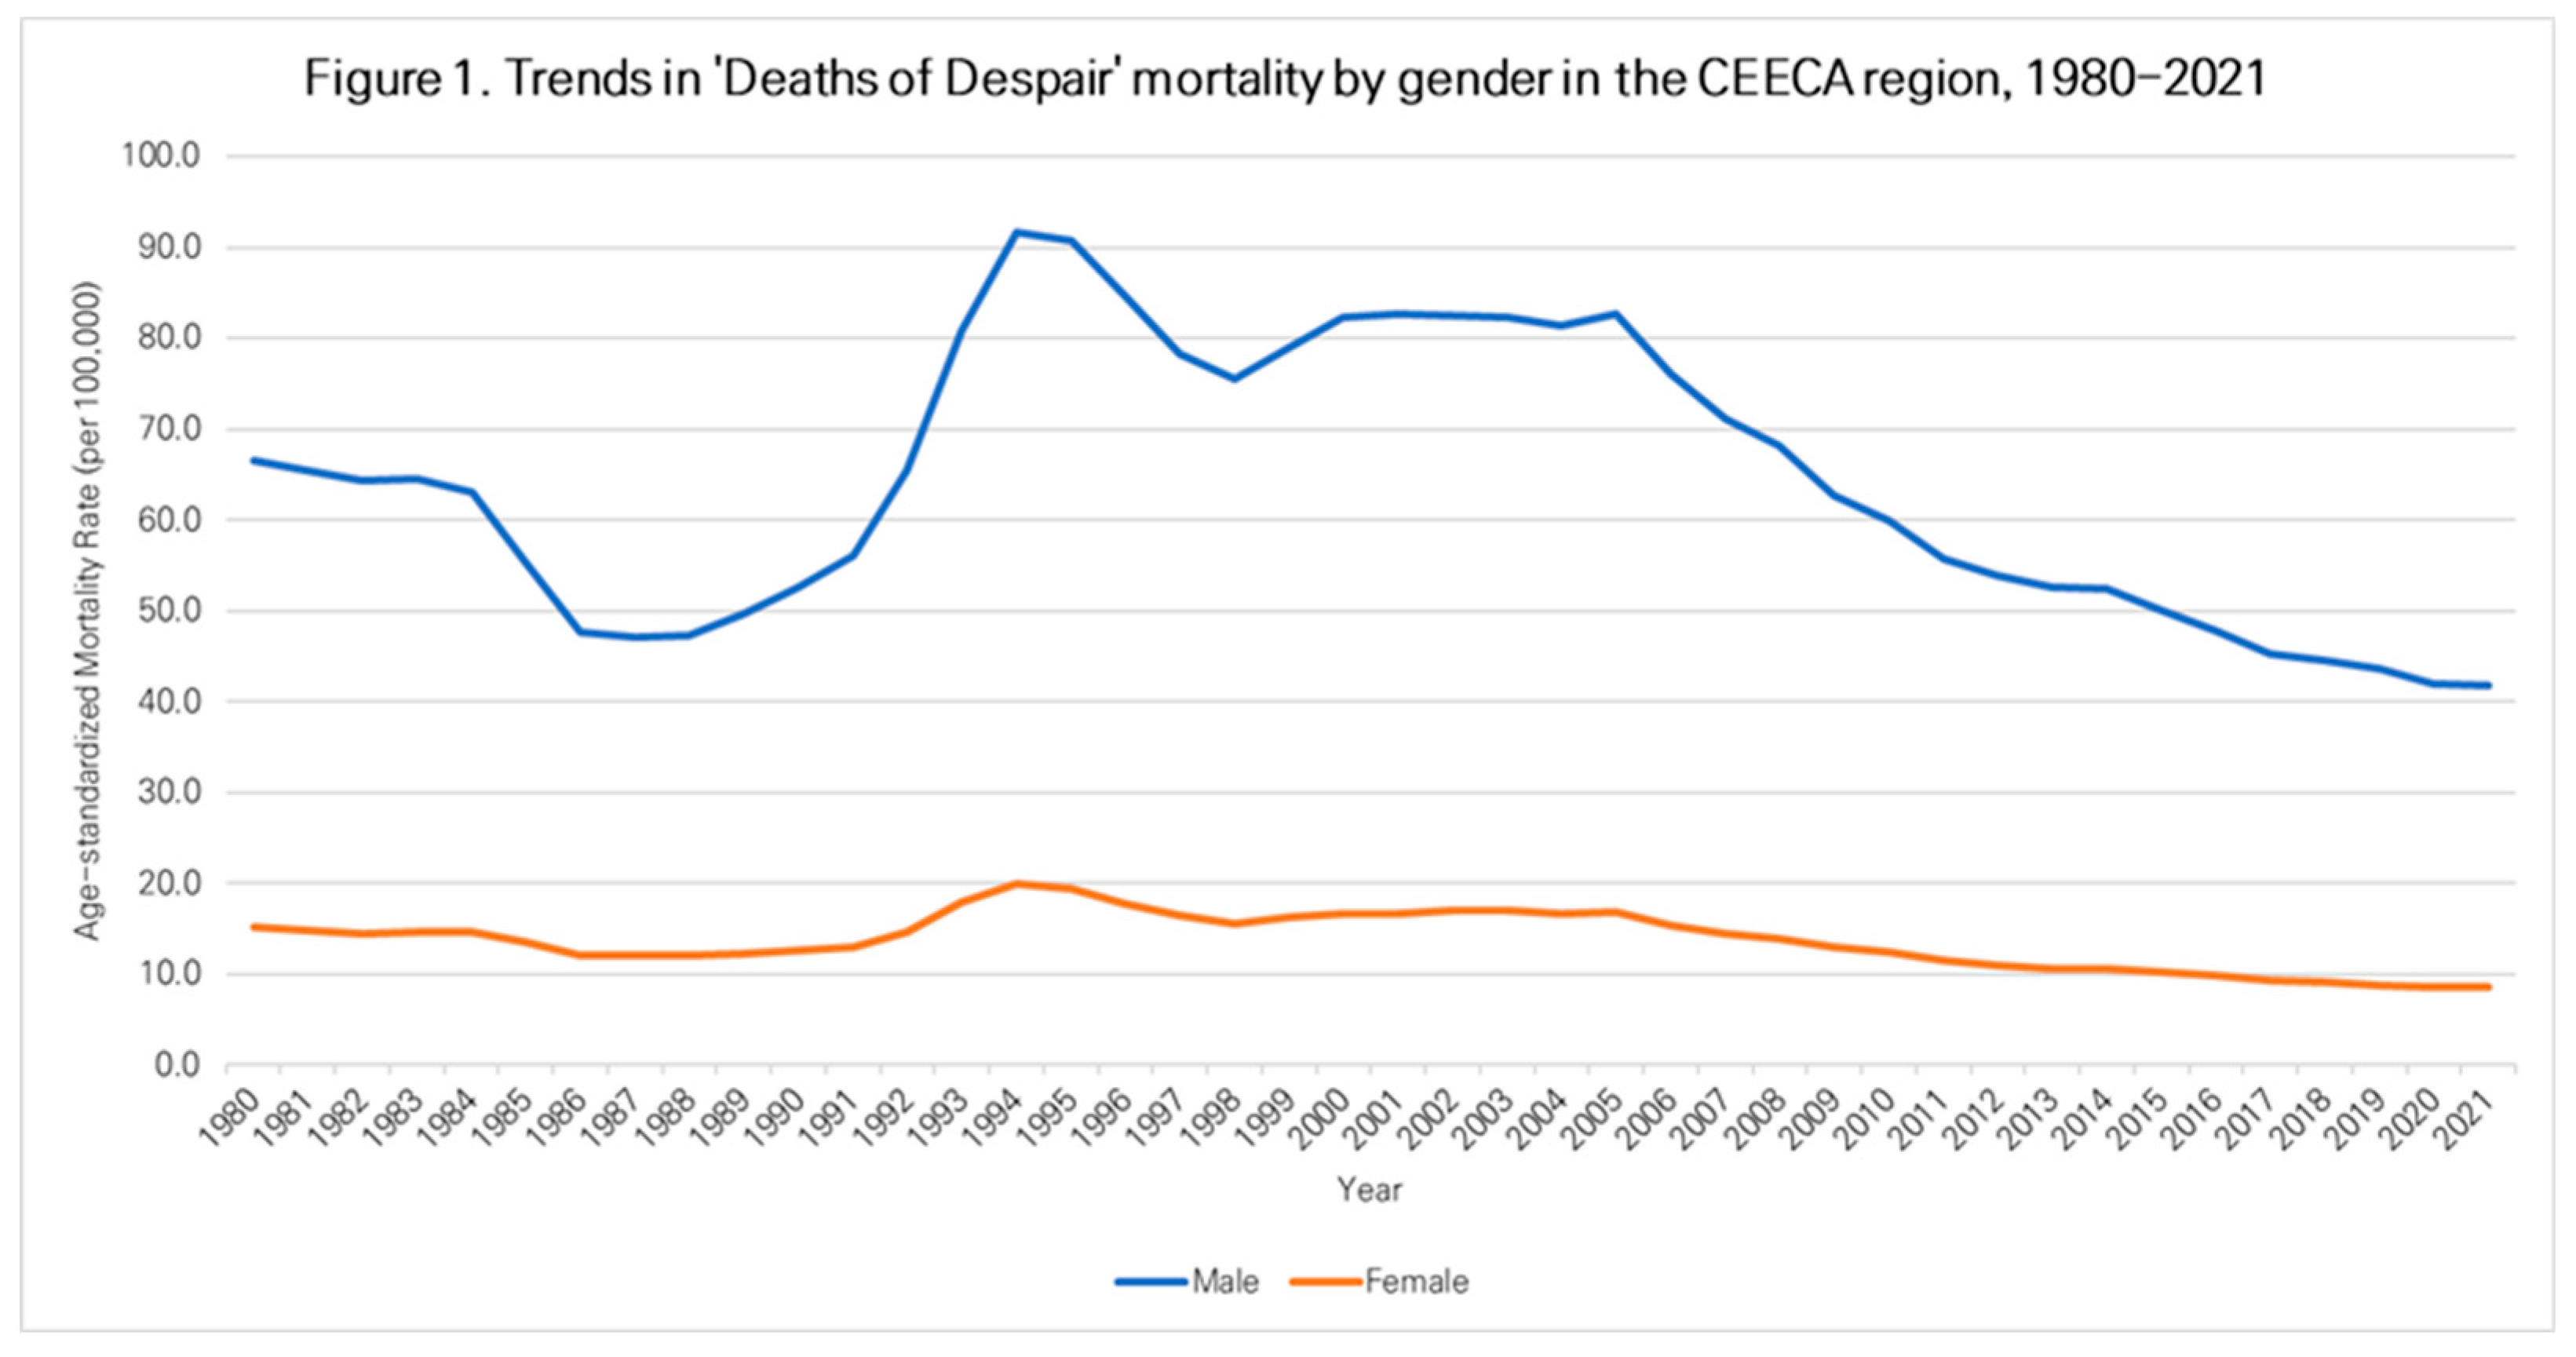
Figure 1: Trends in ‘Deaths of Despair’ mortality by gender in the CEECA region, 1980–2021.
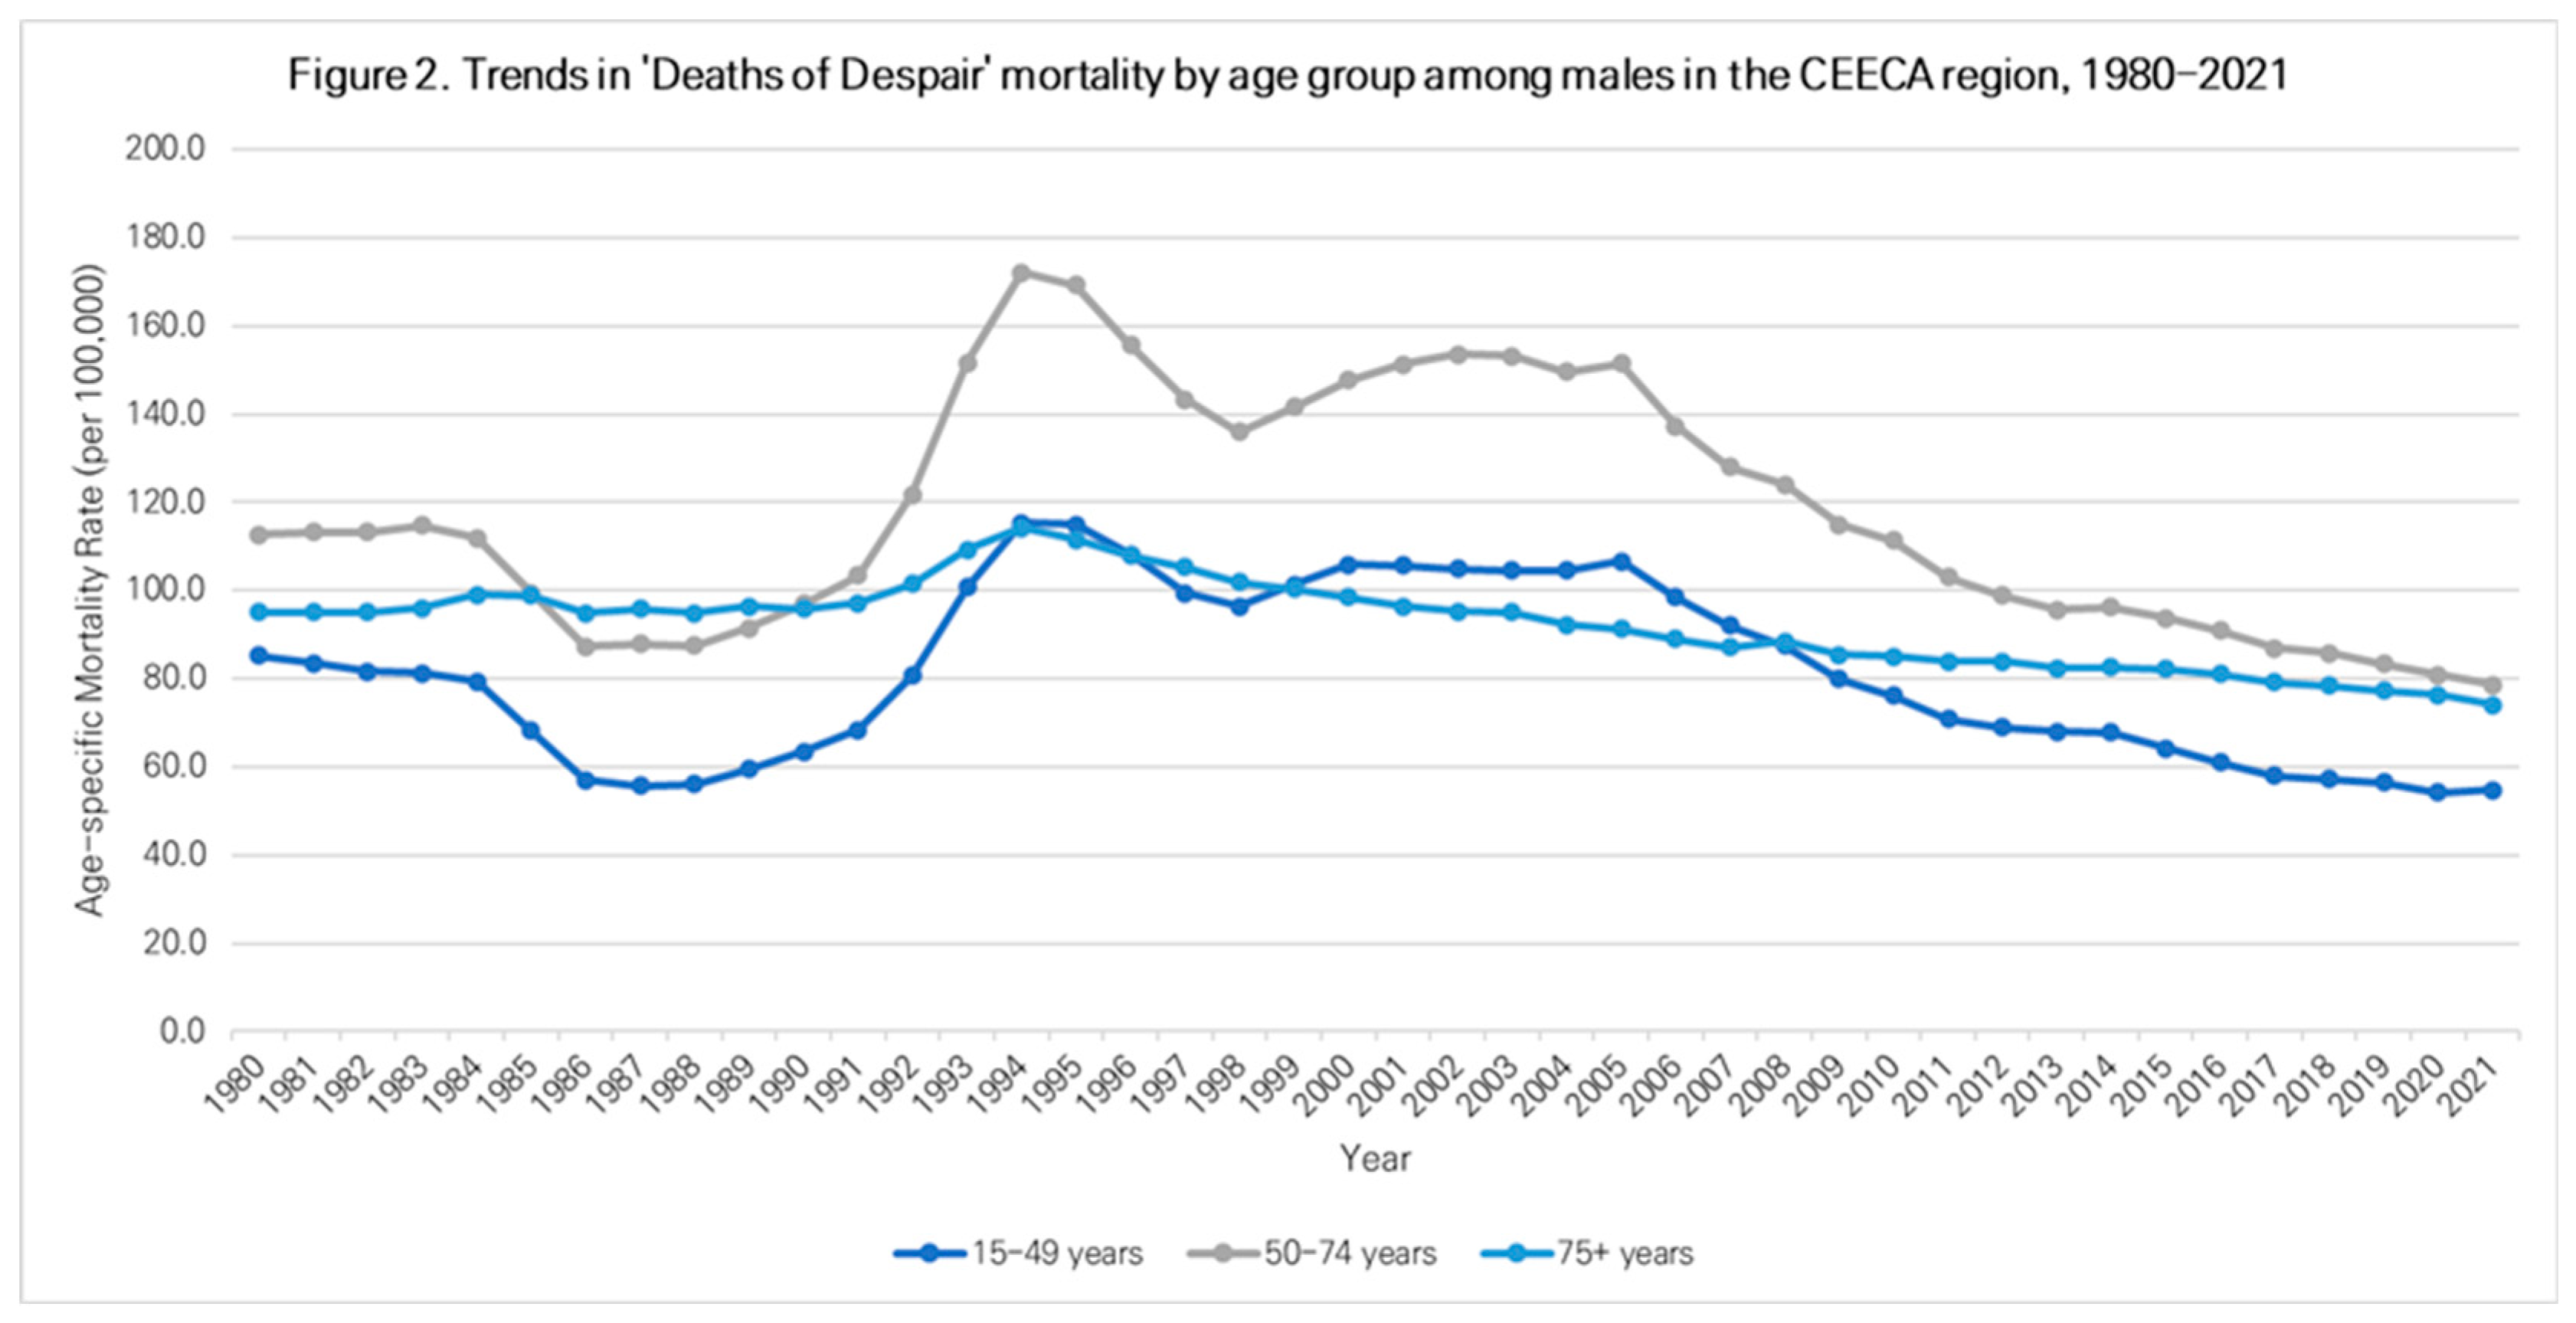
Figure 2: Trends in ‘Deaths of Despair’ mortality by age group among males in the CEECA region, 1980–2021.
The overall trend for deaths of despair in the CEECA region showed a decline in the 2000s. However, a detailed analysis of the trend by age group revealed distinct differences in the patterns of mortality change and the composition of major drivers of this overall decline. The most significant change in cause composition was observed in the young adult group (15–49 years). The proportion of DUD showed an especially clear increasing trend among this age group in the 2000s (Fig. 3a). The proportion of DUD, which was 6.9% in 2000, peaked at 11.8% in 2008 and subsequently remained over 10%. This indicates that the contribution of DUD as a major cause of death for young adults has grown, alongside AUD and self-harm. In the age-group mortality trends, a notable change in the gap between the young adult (15–49 years) and middle-aged (50–74 years) groups was observed (Fig. 2). The mortality rate gap between the two groups, which reached 56.8 per 100,000 at the crisis peak in 1994 (172.2 for middle-aged vs. 115.4 for young adults), steadily narrowed as the mortality rate of the middle-aged group declined more steeply than that of the young adults after the mid-2000s. By 2021, the gap had significantly decreased to 24.0 (78.7 for middle-aged vs. 54.7 for young adults). This suggests that the relative burden of mortality on the young adult group increased in recent years.
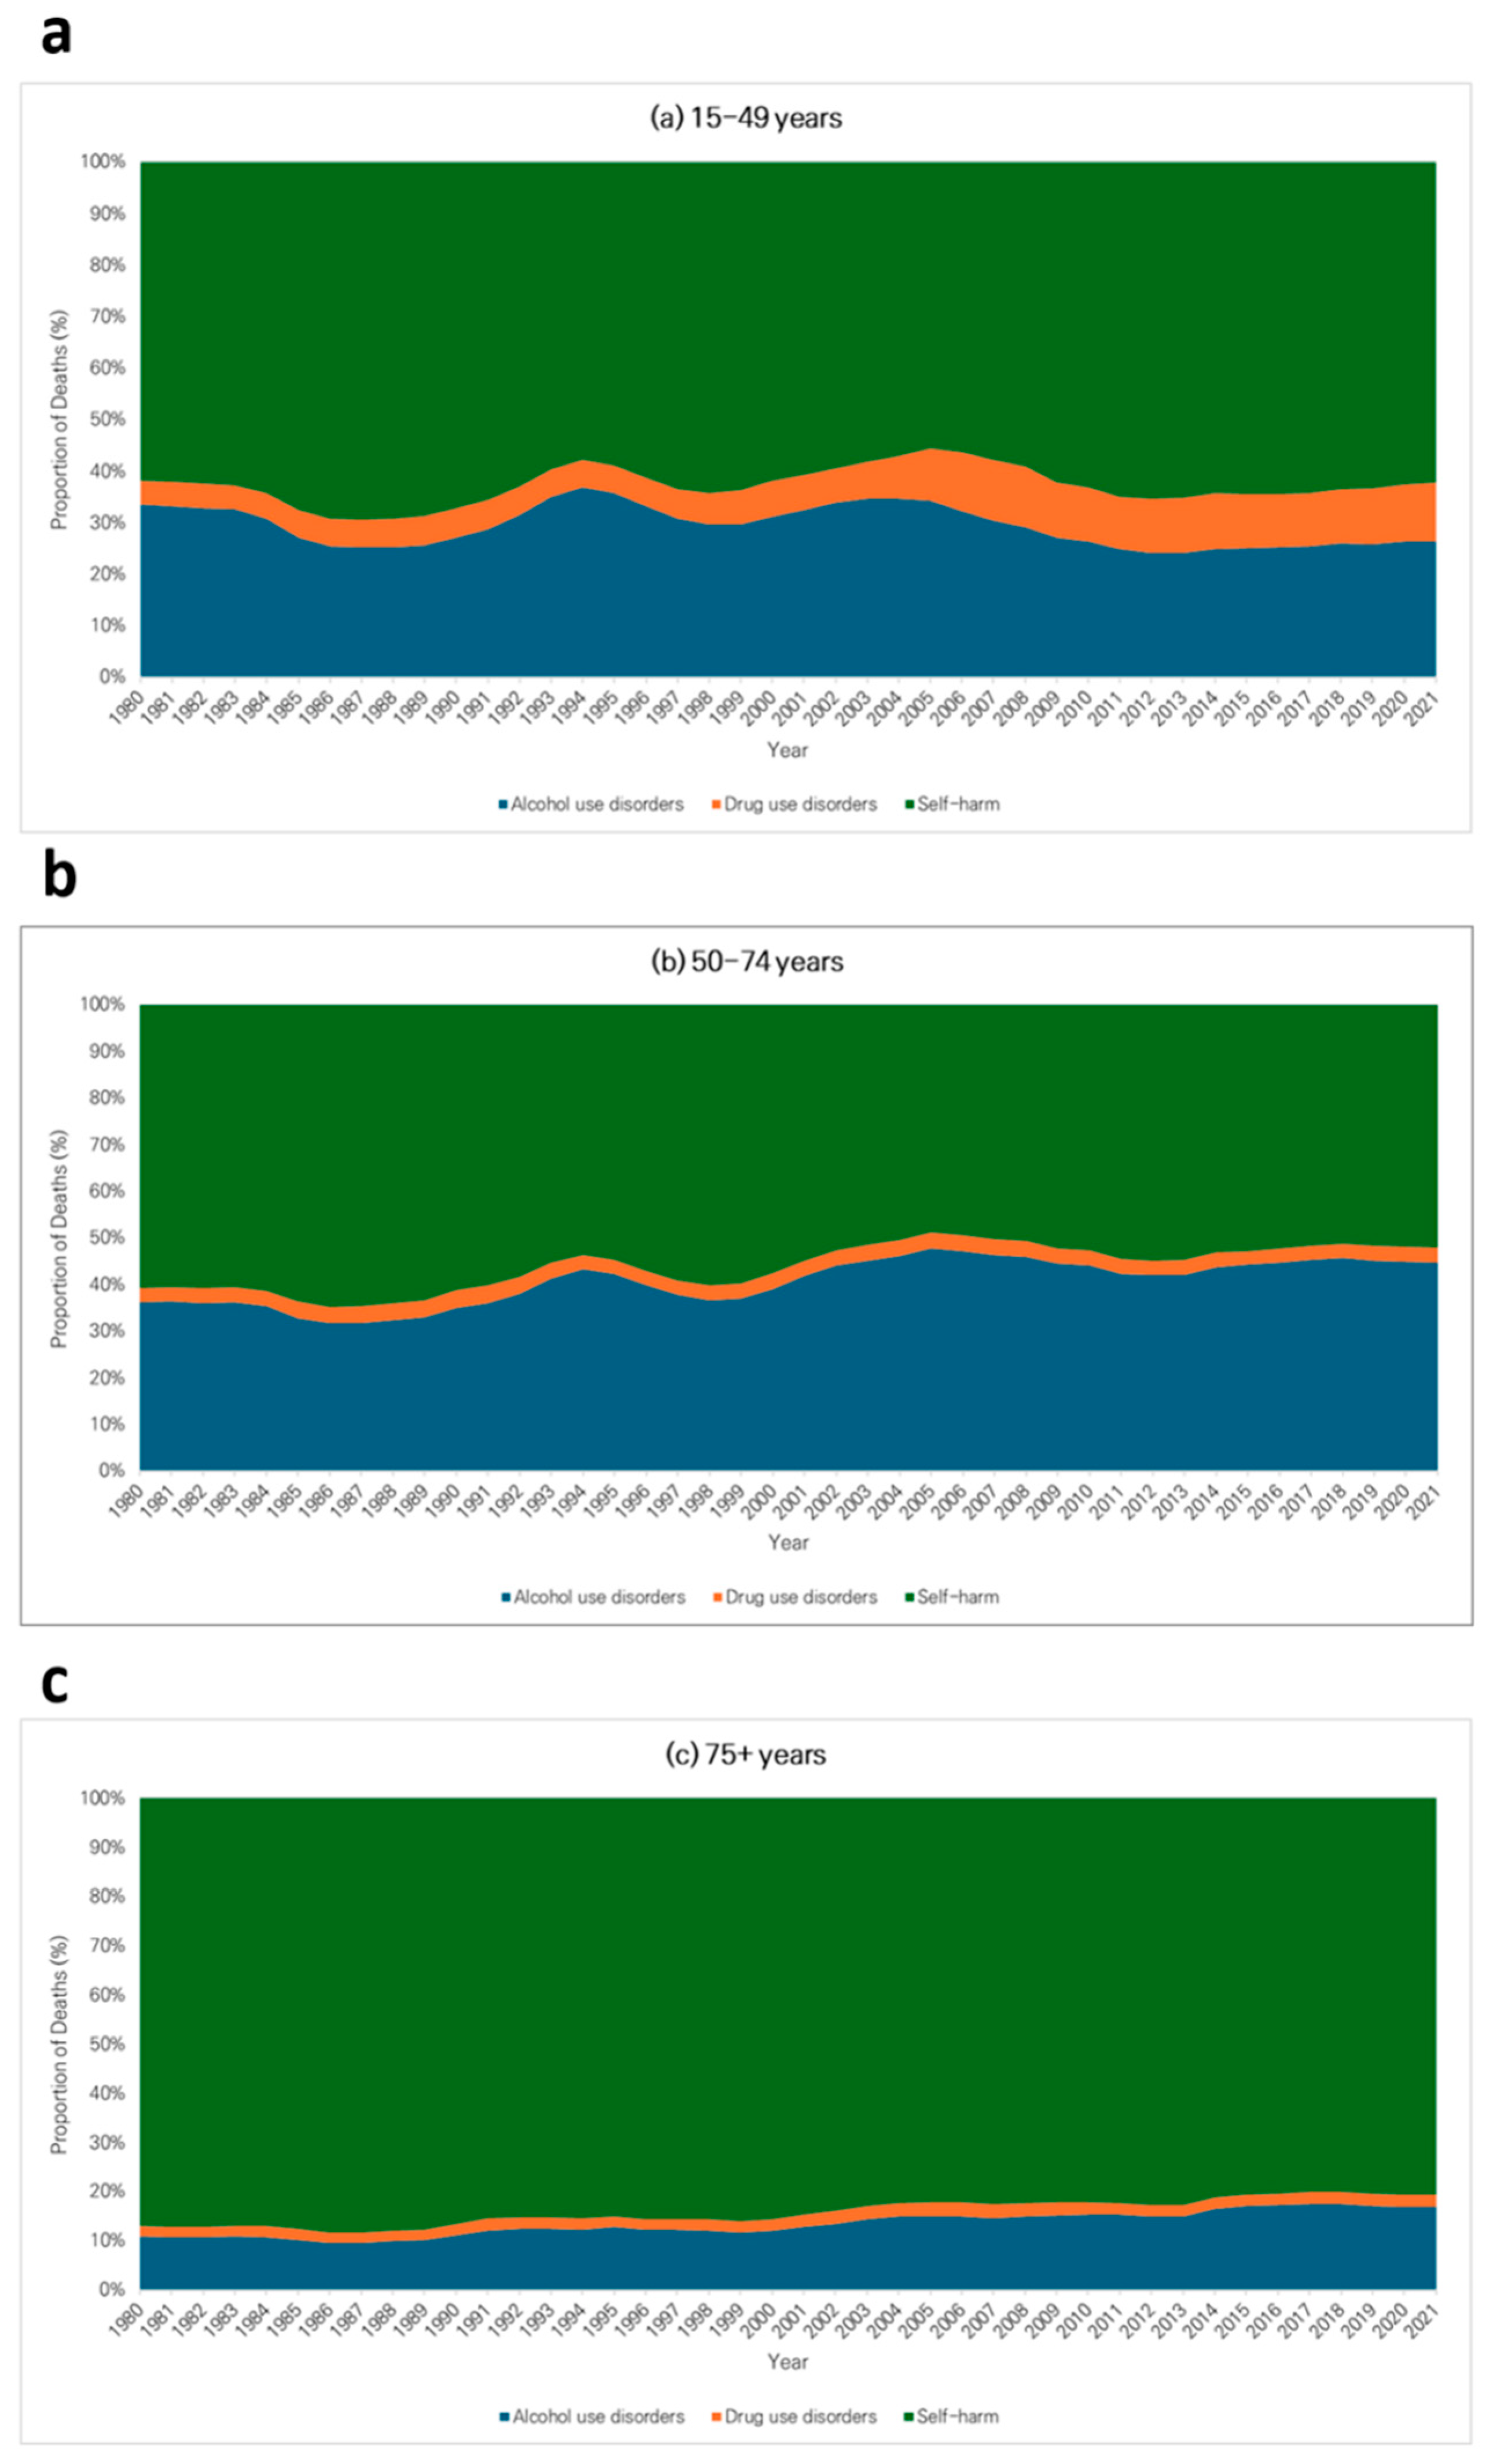
Figure 3: Trends in the cause composition of ‘Deaths of Despair’ among males in the CEECA region by age group, 1980–2021. (a) 15–49 years; (b) 50–74 years; (c) 75+ years.
Finally, the heatmap analysis in Fig. 4 clearly demonstrates that the pattern of deaths of despair within the CEECA region since the 2000s exhibits significant heterogeneity and fragmentation across countries. Particularly since the 2010s, at least three distinct nation group patterns have been observed. First, a group of countries with high or increasing DUD burdens was identified. Estonia, a Baltic state, recorded the region’s highest DUD mortality rate in 2021 at 4.35 per 100,000 population, while the Russian Federation also showed a high burden at 4.07. In Turkmenistan, Central Asia, the DUD mortality rate showed a clear upward trend, rising from 1.20 per 100,000 population in 2010 to 1.92 in 2021. Second, a group of countries persisted with AUD as a core entrenched problem. Notably, the Russian Federation (11.03 deaths) and Belarus (18.55 deaths) maintained overwhelmingly high AUD mortality rates in 2021 compared to other countries. Third, a group of countries with a persistent burden of self-harm mortality was also identified. Lithuania (20.65 per 100,000), the Russian Federation (19.86 per 100,000), and Kazakhstan (17.96 per 100,000), despite the overall regional decline in self-harm mortality, still recorded high mortality rates exceeding 17 per 100,000 population as of 2021. This heterogeneity among country groups indicates that, unlike the macro-level shocks of the 1990s, which had similar impacts across the region, the drivers of despair-related deaths since the 2000s have unfolded differently according to each country’s specific context.
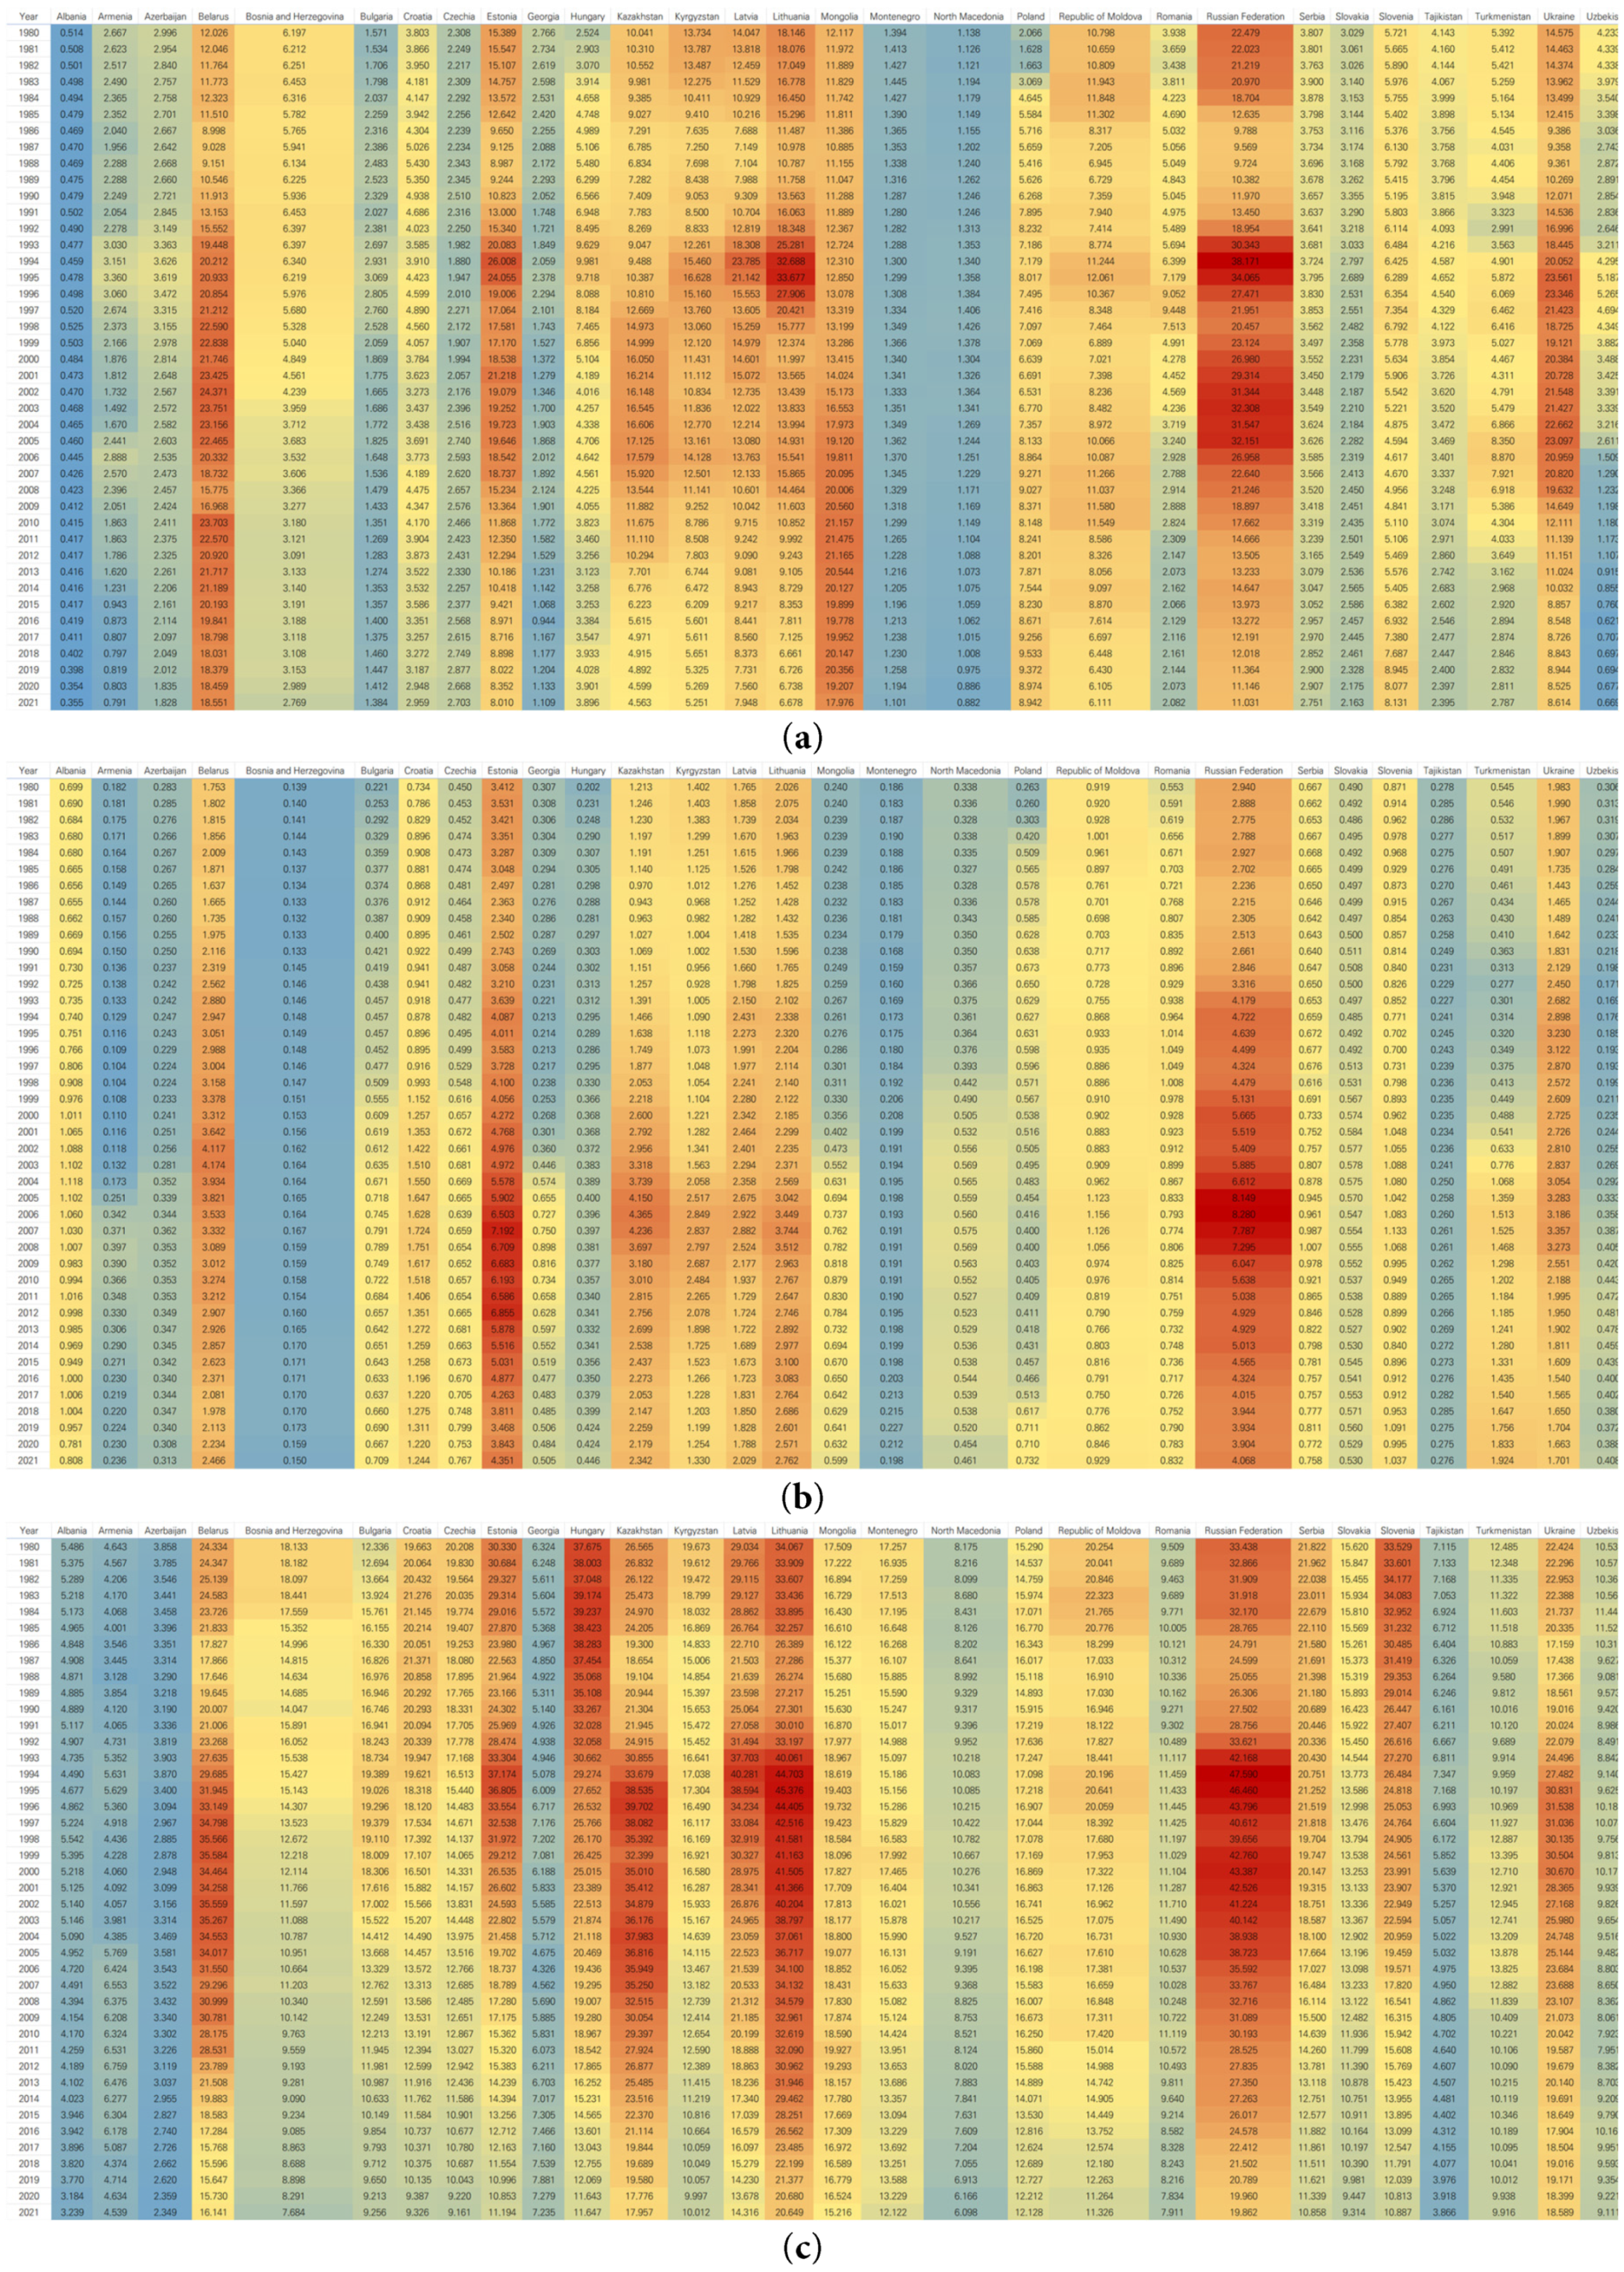
Figure 4: Heatmaps of ‘Deaths of Despair’ mortality rates by cause in CEECA countries, 1980–2021. (a) Alcohol use disorders; (b) Drug use disorders; (c) Self-harm.
This study empirically demonstrates that from 1980 to 2021, deaths of despair in the CEECA region did not present as a monolithic phenomenon but as a complex crisis, the nature and targets of which evolved dynamically over time. The core finding is that the macro-level turmoil of the 1990s, centered on middle-aged men and driven by a surge in AUD deaths on top of a high baseline of self-harm mortality, evolved in the post-2000s period into a diversified crisis, characterized by the rise of DUD problems among the youth and fragmentation by country.
This study’s finding of a surge in mortality among middle-aged men in the 1990s can be interpreted as a symptom of the deep scar left by the rapid systemic transition in Eastern Europe. During this period, individual identity shifted sharply from group-centered ascription to individual-centered achievement. While an individual’s status had previously been relatively stable, granted by their origin or background under the former socialist system [25], the new capitalist system evaluated individuals based on personal ability and achievement [26]. This identity transition produced considerable psychological effects. Particularly impactful was the loss of guaranteed, stable employment due to the rapid privatization under “shock therapy” and the resulting mass unemployment, poverty, and social polarization [27,28]. In this process, individuals experienced both psychological and economic pressure, leading to health inequalities and an increase—especially among vulnerable populations—in deaths of despair [29]. Furthermore, the sharp increase in AUD mortality observed during this period is likely linked not only to chronic conditions such as cirrhosis but also to acute alcohol poisoning itself. This may be related to the rise in surrogate alcohol consumption reported in a previous study [8], reflecting the extreme coping mechanisms employed during the crisis.
The weakening of the social safety net suggests a path to worsening health indicators and deaths of despair. The theory of cumulative disadvantage, which originates in Merton’s “Matthew effect” [28], describes a vicious cycle in which disadvantages are amplified over time, leading to even greater disadvantages [30,31]. During the systemic transition, rising unemployment, identity crises, and income inequality were shown to be significant factors in the deterioration of health indicators [6,31], with adverse effects particularly pronounced among groups with limited socioeconomic resources, such as middle-aged men and low-skilled workers [32]. Thus, the structural transition involving large-scale privatization in the post-socialist system, combined with pre-existing disadvantages, exacerbated health inequalities and led to increased mortality. In this context, deaths of despair can be seen not as discrete events but as the result of cumulative inequality. Therefore, the deaths of despair that appeared in these transition countries can be understood as a complex social phenomenon resulting from the interaction of individual psychological vulnerability and structural inequality.
The diversification of the crisis observed since the 2000s, particularly the rise in DUD problems and the stagnation in youth mortality rates, may be linked to the intergenerational transmission of disadvantage. The economic instability experienced by the adult generation in the 1990s may have led to unequal opportunities for their children’s generation, making them more vulnerable to new risks [33]. The intensified individualism and competitive environment may have served as a new stressor. Moreover, external factors such as the diversification of drug trafficking routes in Eurasia and the spread of new psychoactive substances likely contributed to the worsening DUD problem among young adults [34].
Another key finding of this study is the fragmentation of the crisis since the 2000s, reflecting countries’ different development paths following the systemic transition. Whereas the 1990s crisis was driven by the massive, uniform shock of the Soviet collapse, the post-2000s crisis exhibits path dependency, in which the economic models, levels of social safety nets, and health policies chosen by each country produced different health outcomes [35]. In particular, this fragmentation was evident in the leading causes of death in the 2010s. For example, Russia and Belarus continued to struggle with exceptionally high AUD mortality, while Estonia and the Russian Federation itself saw DUD emerge as a significant or primary cause. At the same time, central European countries such as the Czech Republic and Poland remained relatively stable and had low rates for all causes, in stark contrast to the consistently high burden of self-harm in countries such as Lithuania and Kazakhstan. For example, the institutional stability following the EU accession of the Baltic and Central European countries likely contributed to the patterns of deaths of despair in ways different from the political and economic instability experienced by Russia or some Central Asian nations. This highlights the limitations of the CEECA region as a single analytical unit and the importance of considering country-specific context.
What is interesting is that there was no significant spike in mortality rates during the 2007–2009 global financial crisis, in stark contrast to the dramatic impact of the economic shocks of the 1990s. This difference can be attributed to several factors. The 1990s crisis caused not just a simple recession but a total systemic collapse, leading to more severe social and psychological turmoil. By the late 2000s, many CEECA countries, especially those that joined the EU, had established stronger social safety nets than during the early transition period, helping mitigate the health impacts of economic downturns.
The primary strength of this study is its multidimensional analysis of trends in deaths of despair over 42 years using 2021 GBD data [21], which allowed for a detailed assessment of the long-term evolution of the crisis. Nevertheless, the study has several limitations. First, a fundamental limitation of this study is the risk of ecological fallacy inherent in analyses using aggregated national-level data. While distinct trends were identified across specific age and gender groups, these group-level associations cannot be directly interpreted as individual-level risks or causal relationships [36]. Therefore, conclusions regarding specific subpopulations should be drawn with caution. Second, the GBD data include statistical estimates, not just measured values, so caution is required when interpreting the results for some data-poor countries [21].
The core findings of this study—in particular, the diversification and fragmentation of the crisis—demand a fundamental shift in the policy approach to deaths of despair in the CEECA region. The uniform policies of the 1990s are no longer appropriate. First, for young adults, the adoption of proactive harm reduction policies for DUD problems and preventative mental health services should be considered [34]. Second, for middle-aged and older adults, it is necessary to continue strengthening social support networks to decrease the still-high incidence of self-harm and to reinforce alcohol control policies [37]. Finally, the fragmentation of the crisis revealed by this study highlights an urgent need for country-specific, tailored policy design, requiring each government to diagnose its most pressing problems accurately and to adopt a strategic approach to allocating resources accordingly.
In conclusion, this study revealed that the deaths of despair in the CEECA region are not a single phenomenon. In the 1990s, the AUD and self-harm-centered crisis of middle-aged and elderly people evolved into three distinct patterns in the 21st century: (1) the rise of the DUD problem of young people, (2) the shift of the mortality burden between ages, and (3) the segmentation of crisis causes by country. These findings suggest that uniform policies based on the 1990s framework are no longer valid, and that a targeted approach to each country’s new crisis patterns is urgent.
Acknowledgement:
Funding Statement: Yo Han Lee was supported by grants from the National Research Foundation of Korea (NRF) under the Ministry of Science and Information and Communication Technology (grant number: RS-2023-00249082), Korea University (grant number: K2225791).
Author Contributions: The authors confirm contribution to the paper as follows: study conception and design: Eun Hae Lee and Yo Han Lee; data collection: Eun Hae Lee; analysis and interpretation of results: Eun Hae Lee, Yo Han Lee, Minjae Choi, Hanul Park, Joon Hee Han, Sujeong Yu, Joshua Kirabo Sempungu and Inbae Sohn; draft manuscript preparation: Eun Hae Lee and Yo Han Lee. All authors reviewed the results and approved the final version of the manuscript.
Availability of Data and Materials: The data used in this study are publicly available from the 2021 Global Burden of Disease (GBD) study, provided by the University of Washington’s Institute for Health Metrics and Evaluation (IHME). The data can be accessed through the GBD Results Tool (https://vizhub.healthdata.org/gbd-results, accessed on 17 January 2025).
Ethics Approval: Not applicable.
Conflicts of Interest: The authors declare no conflicts of interest to report regarding the present study.
References
1. Woolf SH , Schoomaker H . Life expectancy and mortality rates in the United States, 1959–2017. JAMA. 2019; 322( 20): 1996– 2016. doi:10.1001/jama.2019.16932. [Google Scholar] [CrossRef]
2. Woolf SH . Falling behind: the growing gap in life expectancy between the United States and other countries, 1933–2021. Am J Public Health. 2023; 113( 9): 970– 80. doi:10.2105/AJPH.2023.307310. [Google Scholar] [CrossRef]
3. Case A , Deaton A . Rising morbidity and mortality in midlife among white non-Hispanic Americans in the 21st century. Proc Natl Acad Sci U S A. 2015; 112( 49): 15078– 83. doi:10.1073/pnas.1518393112. [Google Scholar] [CrossRef]
4. Case A , Deaton A . Mortality and morbidity in the 21st century. Brookings Pap Econ Act. 2017; 2017: 397– 476. doi:10.1353/eca.2017.0005. [Google Scholar] [CrossRef]
5. Case A , Deaton A . Deaths of despair and the future of capitalism. Princeton, NJ, USA: Princeton University Press; 2021. doi:10.2307/j.ctv161f3f8. [Google Scholar] [CrossRef]
6. Shirzad M , Yenokyan G , Marcell AV , Kaufman MR . Deaths of despair-associated mortality rates globally: a 2000–2019 sex-specific disparities analysis. Public Health. 2024; 236: 35– 42. doi:10.1016/j.puhe.2024.07.015. [Google Scholar] [CrossRef]
7. Stuckler D , King L , McKee M . Mass privatisation and the post-communist mortality crisis: a cross-national analysis. Lancet. 2009; 373( 9661): 399– 407. doi:10.1016/S0140-6736(09)60005-2. [Google Scholar] [CrossRef]
8. Leon DA , Chenet L , Shkolnikov VM , Zakharov S , Shapiro J , Rakhmanova G , et al. Huge variation in Russian mortality rates 1984–94: artefact, alcohol, or what? Lancet. 1997; 350( 9075): 383– 8. doi:10.1016/S0140-6736(97)03360-6. [Google Scholar] [CrossRef]
9. National Center for Health Statistics . Vital and health statistics: Russian federation and United States, selected years 1985–2000 with an overview of Russian mortality in the 1990s. Hyattsville, MD, USA: National Center for Health Statistics; 2003. [Google Scholar]
10. Billingsley S . Exploring the conditions for a mortality crisis: bringing context back into the debate. Popul Space Place. 2011; 17( 3): 267– 89. doi:10.1002/psp.660. [Google Scholar] [CrossRef]
11. Brainerd E , Cutler DM . Autopsy on an empire: understanding mortality in Russia and the former soviet union. J Econ Perspect. 2005; 19( 1): 107– 30. doi:10.1257/0895330053147921. [Google Scholar] [CrossRef]
12. Fihel A , Pechholdová M . Between ‘pioneers’ of the cardiovascular revolution and its ‘late followers’: mortality changes in the Czech Republic and Poland since 1968. Eur J Popul. 2017; 33( 5): 651– 78. doi:10.1007/s10680-017-9456-y. [Google Scholar] [CrossRef]
13. King L , Scheiring G , Nosrati E . Deaths of despair in comparative perspective. Annu Rev Sociol. 2022; 48: 299– 317. doi:10.1146/annurev-soc-030320-031757. [Google Scholar] [CrossRef]
14. Glei DA , Lee C , Brown CL , Weinstein M . Are employment and social integration more strongly associated with deaths of despair than psychological or economic distress? Soc Sci Med. 2024; 357: 117197. doi:10.1016/j.socscimed.2024.117197. [Google Scholar] [CrossRef]
15. King L , Hamm P , Stuckler D . Rapid large-scale privatization and death rates in ex-communist countries: an analysis of stress-related and health system mechanisms. Int J Health Serv. 2009; 39( 3): 461– 89. doi:10.2190/HS.39.3.c. [Google Scholar] [CrossRef]
16. Penina O . Alcohol-related causes of death and drinking patterns in Moldova as compared to Russia and Ukraine. Eur J Popul. 2017; 33( 5): 679– 700. doi:10.1007/s10680-017-9450-4. [Google Scholar] [CrossRef]
17. Grogan L . Alcoholism, tobacco, and drug use in the countries of Central and Eastern Europe and the former Soviet Union. Subst Use Misuse. 2006; 41( 4): 567– 71. doi:10.1080/10826080500521664. [Google Scholar] [CrossRef]
18. Jasilionis D , Leon DA , Pechholdová M . Impact of alcohol on mortality in Eastern Europe: trends and policy responses. Drug Alcohol Rev. 2020; 39( 7): 785– 9. doi:10.1111/dar.13167. [Google Scholar] [CrossRef]
19. Semenova Y , Lim L , Salpynov Z , Gaipov A , Jakovljevic M . Historical evolution of healthcare systems of post-soviet Russia, Belarus, Kazakhstan, Kyrgyzstan, Tajikistan, Turkmenistan, Uzbekistan, Armenia, and Azerbaijan: a scoping review. Heliyon. 2024; 10( 8): e29550. doi:10.1016/j.heliyon.2024.e29550. [Google Scholar] [CrossRef]
20. Timofeyev Y , Kaneva M , Jakovljevic M . Editorial: current questions and challenges in healthcare of the post-socialist countries. Front Public Health. 2023; 11: 1254898. doi:10.3389/fpubh.2023.1254898. [Google Scholar] [CrossRef]
21. Ward ZJ , Goldie SJ . Global burden of disease study 2021 estimates: implications for health policy and research. Lancet. 2024; 403( 10440): 1958– 9. doi:10.1016/S0140-6736(24)00812-2. [Google Scholar] [CrossRef]
22. Murray CJL , Ezzati M , Flaxman AD , Lim S , Lozano R , Michaud C , et al. GBD 2010: design, definitions, and metrics. Lancet. 2012; 380( 9859): 2063– 6. doi:10.1016/S0140-6736(12)61899-6. [Google Scholar] [CrossRef]
23. Kim HJ , Fay MP , Feuer EJ , Midthune DN . Permutation tests for joinpoint regression with applications to cancer rates. Stat Med. 2000; 19( 3): 335– 51. doi:10.1002/(sici)1097-0258(20000215)19:3<335::aid-sim336>3.0.co;2-z. [Google Scholar] [CrossRef]
24. Kim HJ , Chen HS , Byrne J , Wheeler B , Feuer EJ . Twenty years since Joinpoint 1.0: two major enhancements, their justification, and impact. Stat Med. 2022; 41( 16): 3102– 30. doi:10.1002/sim.9407. [Google Scholar] [CrossRef]
25. Kemper TD . On the nature and purpose of ascription. Am Sociol Rev. 1974; 39( 6): 844. doi:10.2307/2094157. [Google Scholar] [CrossRef]
26. Parsons T . The social system. New York, NY, USA: Free Press; 1951. [Google Scholar]
27. Cornelius PK . Unemployment during transition: the experience in the Baltic countries. Communist Econ Econ Transform. 1995; 7( 4): 445– 64. doi:10.1080/14631379508427835. [Google Scholar] [CrossRef]
28. Simai M , United N . Poverty and inequality in Eastern Europe and the CIS transition economies. New York, NY, USA: United Nations; 2006. [Google Scholar]
29. Scheiring G , Azarova A , Irdam D , Doniec K , McKee M , Stuckler D , et al. Deindustrialisation and the post-socialist mortality crisis. Camb J Econ. 2023; 47( 2): 341– 72. doi:10.1093/cje/beac072. [Google Scholar] [CrossRef]
30. Bask M , Bask M . Cumulative (dis)advantage and the Matthew effect in life-course analysis. PLoS One. 2015; 10( 11): e0142447. doi:10.1371/journal.pone.0142447. [Google Scholar] [CrossRef]
31. Crystal S , Shea D . Cumulative advantage, cumulative disadvantage, and inequality among elderly people. Gerontologist. 1990; 30( 4): 437– 43. doi:10.1093/geront/30.4.437. [Google Scholar] [CrossRef]
32. Woolf SH , Johnson RE , Phillips RL Jr , Philipsen M . Giving everyone the health of the educated: an examination of whether social change would save more lives than medical advances. Am J Public Health. 2007; 97( 4): 679– 83. doi:10.2105/AJPH.2005.084848. [Google Scholar] [CrossRef]
33. Dasgupta N , Beletsky L , Ciccarone D . Opioid crisis: no easy fix to its social and economic determinants. Am J Public Health. 2018; 108( 2): 182– 6. doi:10.2105/AJPH.2017.304187. [Google Scholar] [CrossRef]
34. European Union Drugs Agency . European drug report 2024: trends and developments. Lisbon, Portugal: European Union Drugs Agency; 2024. Report No.: TD-AT-24-001-EN-Q. [Google Scholar]
35. Bohle D , Greskovits B . Capitalist diversity on Europe’s periphery. Ithaca, NY, USA: Cornell University Press; 2012. [Google Scholar]
36. Robinson WS . Ecological correlations and the behavior of individuals. Am Sociol Rev. 1950; 15( 3): 351. doi:10.2307/2087176. [Google Scholar] [CrossRef]
37. Babor TF , Caetano R , Casswell S , Edwards G , Giesbrecht N , Graham K , et al. Alcohol: no ordinary commodity: research and public policy. Oxford, UK: Oxford University Press; 2010. doi:10.1093/acprof:oso/9780199551149.003.002. [Google Scholar] [CrossRef]
Cite This Article
 Copyright © 2026 The Author(s). Published by Tech Science Press.
This work is licensed under a Creative Commons Attribution 4.0 International License , which permits unrestricted use, distribution, and reproduction in any medium, provided the original work is properly cited.
 Downloads
 Citation Tools