
 Submit a Paper
 Propose a Special lssue
 Open Access
ARTICLE

A Comparative Performance Analysis of Machine Learning Models for Intrusion Detection Classification
1 School of Electronics and Control Engineering, Chang’an University, Xi’an, 710000, China
2 School of Information Engineering, Chang’an University, Xi’an, 710000, China
* Corresponding Author: Amna Khatoon. Email:
Journal of Cyber Security 2024, 6, 1-23. https://doi.org/10.32604/jcs.2023.046915
Received 19 October 2023; Accepted 21 November 2023; Issue published 03 January 2024
 View Full Text
 Download PDF
Abstract
The importance of cybersecurity in contemporary society cannot be inflated, given the substantial impact of networks on various aspects of daily life. Traditional cybersecurity measures, such as anti-virus software and firewalls, safeguard networks against potential threats. In network security, using Intrusion Detection Systems (IDSs) is vital for effectively monitoring the various software and hardware components inside a given network. However, they may encounter difficulties when it comes to detecting solitary attacks. Machine Learning (ML) models are implemented in intrusion detection widely because of the high accuracy. The present work aims to assess the performance of machine learning algorithms in the context of intrusion detection, providing valuable insights into their efficacy and potential for enhancing cybersecurity measures. The main objective is to compare the performance of the well-known ML models using the UNSW-NB15 dataset. The performance of the models is discussed in detail with a comparison using evaluation metrics and computational performance.Keywords
Cybersecurity is an essential area of study due to the expanding influence of networks on modern life. Cybersecurity approaches primarily utilize anti-virus software, firewalls, and intrusion detection systems (IDSs). These strategies serve to safeguard networks against both internal and external threats. One of the integral components in safeguarding cyber security is an IDS, which assumes a critical function in monitoring the operational status of software and hardware within a network. In recent years, IDS has been implemented with the primary goal of examining network traffic and promptly detecting any instances of malicious activities or potential threats [1]. An IDS, like a firewall, is designed to safeguard the principles of confidentiality, integrity, and availability, which are the primary objectives that potential attackers want to compromise [2]. To assess the efficacy of an IDS, specific criteria have been established to define the desirable attributes that a proficient IDS should exhibit. It includes precision, limited additional costs, satisfactory efficiency, and comprehensiveness, as mentioned above.
IDS encompass two primary ways of detecting attacks: anomaly-based detection and signature-based (or misuse detection) detection. The former method is employed to assess and contrast the alterations in the system’s behaviour to identify any irregularities in the actions or activities of the system. As an illustration, the system will generate an alarm for anomaly detection in the event of an excessive number of user queries to the database compared to the historical data. It also presents a drawback, as it is imperative to acknowledge that not all users should be seen as identical. Furthermore, it should be noted that each day is characterized by its unique circumstances. As a result, implementing a dynamic query restriction would prove to be more advantageous in this context [3]. Another drawback is implementing anomaly detection in a dynamic context, wherein user requirements evolve and may not align with past data [2]. Therefore, it can be concluded that anomaly detection is prone to generating false positive results [3]. In the subsequent approach of IDS, data referred to as fingerprints or signatures about prior instances of successful assaults are retained, and regulations are formulated within the IDS. The rules are then juxtaposed with incoming packets introduced into the network [2]. One primary drawback of this methodology is its inherent limitation to pre-existing knowledge, rendering it inefficient in identifying novel attacks. Furthermore, ensuring that the IDS remains current with the latest information on emerging attack techniques [4–6].
An additional aspect that should be acknowledged in this context is the categorization of IDS into two types: Host-based IDS (HIDS) and Network-based IDS (NIDS). The HIDS is responsible for monitoring the activities of a specific device within a network, specifically focusing on user actions such as log file analysis and software installations [2,7]. HIDS have demonstrated high efficacy in detecting attacks and facilitating the surveillance of individual user behaviour. However, previous research has demonstrated that it is ineffective in countering significant isolated attacks [2]. In contrast, the NIDS is strategically positioned near the firewall to effectively oversee the entirety of the network and its interconnected devices, therefore scrutinizing the ingress and egress traffic [7]. The contents of each packet are subjected to analysis to identify protocols that may indicate the presence of malicious activity. One of the primary benefits of NIDS is their ability to provide faster response times, enabling more efficient mitigation of potential threats.
Furthermore, NIDS are commonly implemented as independent entities that do not exert any influence on the power consumption of the network devices, unlike HIDS. Nevertheless, one notable limitation of NIDS is their handling of encrypted data. The inability of the IDS to analyze the data contained within an encrypted packet hinders its ability to identify potential attack risks [2] accurately.
In the security realm, ML is already employed in various domains to safeguard people and networks from potential security breaches. A prevalent domain in which many consumers engage with machine learning, often without awareness, is the utilization of spam detection filters in e-mail systems. This instance is sometimes used as an illustration of pattern recognition, owing to the extensive array of features or attributes that can be linked to spam [3]. For many users, spam is perceived as an annoyance rather than anything else. However, regrettably, it can have a somewhat more malevolent connotation, such as the act of perpetrating identity theft, achieved through the manipulation of a user’s behaviour to induce them into engaging with a hyperlink. The problem of spam e-mails has persisted for a considerable duration, and implementing ML in spam detection has significantly diminished the volume of spam messages received by users. It phenomenon is observable in the context of Gmail [8]. In 2015, Google stated that they successfully prevented 99.9% of spam e-mails by implementing ANN into their spam filtering system. Subsequently, they reported blocking over 100 million spam e-mails daily after implementing their open-source machine learning framework, TensorFlow [9].
The study evaluates existing ML algorithms and assesses how well they perform compared to many performance measures using the UNSW-NB15 dataset. The algorithms have undergone training and testing procedures for binary and multiclass categorization to understand better. To have a deeper understanding of the optimal performance of each algorithm, the present study focuses on the training and testing of the algorithms. The findings derived from research will provide a more comprehensive understanding of the suitability of these existing algorithms, including performance results, training, and prediction time in a particular context to attain the most effective outcomes. Furthermore, this study establishes a solid foundation for future investigations on integrating ML techniques with intrusion detection systems.
This paper is organized as follows: Section 2 contains the Machine Learning models used for this study’s performance analysis. Section 3 contains the methodology, dataset, and feature extraction process. Section 4 contains the performance metrics, and Section 5 contains the results of the machine learning models, including performance metrics and confusion matrix for each model. Section 6 is the discussion section, which contains the comparison and analysis of the models. Section 7 concludes the study.
In recent years, Machine Learning (ML) has been a prominent technology that is also effective for designing new anomaly-based intrusion detection systems [10–14]. Most of the experiments carried out in IDS have used one or more benchmark datasets [15]. KDD99, NSL-KDD, UNSW-NB 15, CIDDS-001, CICIDS2017, CSE-CIC-IDS2018, and several other datasets are examples of well-known IDS collections. Every single one of those databases includes both typical and malicious traffic in equal measure. To generate the characteristics, data relating to network packets were preprocessed, and each entry was either categorized as a typical activity or as a specific kind of attack on the network. On such datasets, various machine learning methods were utilized to differentiate between normal and malicious traffic (a task known as binary classification problems) or identify specific attack types (a task known as multiclass classification issues). Authors in [16] thoroughly examined the fundamentals of intrusion detection systems, supervised machine learning techniques, cyber-security assaults, and datasets.
Many studies in this field investigate the degree of accuracy achieved by various machine learning algorithms when applied to benchmark datasets. Authors in [17] evaluated the accuracy of the IDS classification results generated utilizing the NSL-KDD dataset using three different machine learning approaches, including Random Forest (RF), Support Vector Machine (SVM), and K-Nearest Neighbours (KNN). Authors in [18] presented a thorough experimental evaluation of various ML techniques such as Logistic Regression (LR), Decision Tree (DT), Random Forest (RF), and Artificial Neural Network (ANN) on a recently published benchmark dataset known as UNSW-NB15, taking into account both binary and multi-class classification. Tuan et al. [19] investigated the performance of SVM, ANN, NB, Decision Tree, and unsupervised ML. They only looked at Distributed Denial of Service (DDoS) assaults. They found unsupervised machine learning did the greatest job telling the difference between DDoS attacks and normal network traffic. However, the specific unsupervised ML techniques that were utilized were not revealed. Several articles test a single machine learning method on one or more benchmark datasets, such as a variety of neural network types [13,20–23], RF [24], SVM [25], K-means [26], etc. [13,20–23], RF [24], SVM [25], and K-means [26], etc.
Existing research mostly compares machine learning algorithms by measuring their performance using accuracy and confusion matrix. The study compares ML algorithms using various performance criteria, including accuracy, precision, recall, and F1 score, coupled with the confusion matrix. In addition, the models’ computational performance is examined by considering the training time, prediction time, and total time. The next part provides a brief explanation of the algorithms that were utilized in this work.
Machine Learning (ML) is a subfield of Artificial Intelligence (AI) distinguished by its ability to gain knowledge or adjust its behaviour based on experience or exposure to new contexts. It lets software applications find and acquire knowledge about patterns inherent in datasets. This study analyses a spectrum of methodologies, usually referred to as ML methods, which contain the power to acquire knowledge from data and subsequently provide predictions. Machine learning approaches normally function by using features that capture the distinguishing qualities of the item under investigation.
AI technology has proven effective in addressing a wide range of applications. These encompass various applications such as face recognition, which allows individuals to identify and distribute images of their acquaintances on social media platforms, along with Optical Character Recognition (OCR), recommendation engines, autonomous vehicles, image recognition, speech recognition, medical diagnosis, virtual personal assistants, e-mail spam and malware filtering, and online fraud detection, among other examples. ML can be classified into three primary sub-domains: supervised learning, unsupervised learning, and reinforcement learning, as shown in Fig. 1 below.

Figure 1: Machine learning methods for intrusion detection systems
This study uses both supervised and unsupervised learning techniques. Supervised learning is predicated on utilizing valuable information included within labelled data. The goal of classification is widely recognized as the predominant objective in supervised learning, and it is also extensively employed in IDS. Nonetheless, manually assigning labels to data is known to be both costly and time-intensive. Therefore, the primary limitation of supervised learning is the insufficiency of properly tagged data. On the other hand, unsupervised learning can extract significant feature information from unlabeled data, simplifying training data acquisition. Nevertheless, it is commonly observed that unsupervised learning approaches tend to exhibit lower detection performance compared to their supervised learning counterparts.
Logistic Regression, an essential technique in machine learning, is a highly adaptable tool utilised for binary classification problems, such as detecting intrusions in computer networks. The model quantifies the likelihood of network events being categorised as either normal or intrusive, producing an output that falls within the range of 0 to 1. In intrusion detection, it is possible to train a Logistic Regression model using network traffic data. The features of this model represent different aspects of network packets or system activities, while the labels indicate whether an event is classified as benign (0) or an intrusion (1). For instance, it can be utilised to examine attributes of network packets, including packet size, source, destination, and protocol, and forecast whether a specific packet signifies a security risk. It enables network administrators to receive immediate notifications when potentially harmful activities are identified, bolstering network security and diminishing the time to respond to cyber threats.
2.1.2 K-Nearest Neighbors (KNN)
The K-Nearest Neighbours (KNN) algorithm is a widely employed and efficient machine learning technique frequently utilised in computer network intrusion detection. The operational procedure involves identifying the ‘k’ nearest data points to a certain observation within a feature space. Subsequently, the classification of such observation is determined by the majority class among its neighbouring data points. In identifying intrusion detection and network security, the KNN algorithm can play a significant role in identifying significantly identifying possibly malicious network packets. By comparing a given packet with its closest neighbouring packets and detecting similarities with known intrusive patterns, KNN can promptly flag suspicious packets, contributing to intrusion detection systems’ overall effectiveness and efficiency-enhancing network security.
The Decision Tree technique is widely utilised in machine learning for classification and regression tasks. It holds special relevance in the domain of computer network intrusion detection. Decision Trees construct a hierarchical structure resembling a tree through iterative data partitioning into subsets, utilising the attributes that provide the highest informational value. In intrusion detection, a Decision Tree is possible for training on network traffic data. These data features correspond to different qualities associated with network packets or system activities. Additionally, the labels assigned to the data would identify whether a certain event is benign or suggestive of an intrusion. A Decision Tree can be utilised by examining packet size, source-destination information, and protocol type. This analytical approach enables the efficient classification of network events, hence facilitating the identification of unauthorised access or cyberattacks.
2.1.4 Extremely Randomized Tree (Extra Trees)
Extra Trees or Extremely Randomised Trees are a robust ensemble learning algorithm utilised in computer network intrusion detection. The operational methodology involves creating a collection of decision trees characterised by a distinctive approach. At every node, a random subset of features is selected to determine the optimal split, introducing an additional element of randomness into the decision-making procedure. In the intrusion detection domain, the application of Extremely Randomised Trees is feasible for examining network traffic data. The features correspond to the characteristics of network packets or system events, while the labels indicate whether an event is considered benign or qualifies as an intrusion. One illustrative instance involves utilising Extremely Randomised Trees to differentiate between typical network operations and potentially malicious behaviour by examining network packet attributes such as source-destination information, protocol, and packet size.
Random Forest is an effective ensemble learning method for detecting intrusions in computer networks. The Random Forest technique better classifies network traffic and system events as normal or potentially malicious. It is achieved by constructing an ensemble of decision trees and aggregating their predictions. In the field of intrusion detection, the utilization of this methodology entails the examination of network data. The analysis is undertaken by considering several properties that represent network packets or system operations. Furthermore, designations are allocated to determine if a specific occurrence is characterized as harmless or characterized as an unauthorized intrusion. The Random Forest algorithm demonstrates proficiency in identifying abnormalities and security breaches by analyzing several network packet attributes, such as source-destination information, packet size, and protocol.
2.1.6 Gradient Boosting Classifier
Gradient Boosting Classifier is an efficient ensemble learning method that is very important for finding network intrusions. Integrating many decision trees, this system distinguishes between normal network traffic and potentially malicious activities. Within intrusion detection, Gradient Boosting can be used to analyze network traffic data. The features represent attributes of network packets or system events, while the labels indicate whether an event is categorized as benign or a security violation. This classifier thoroughly analyses network packet properties, such as source-destination information, protocol, and packet size. This methodology produces a notably accurate assessment of network security, with a focus on precision and recall.
2.1.7 Multi-Layer Perception (MLP) Neural Network
The Multi-layer Perceptron (MLP) Neural Network, an advanced deep learning architecture, exhibits considerable potential in computer network intrusion detection. MLPs demonstrate exceptional proficiency in capturing intricate associations in network traffic and system logs by effectively utilising interconnected layers of artificial neurons. In the intrusion detection domain, MLPs can be utilised to analyse data with many dimensions. These dimensions correspond to the qualities of network packets, while the labels associated with the data indicate whether an event is considered normal or suggestive of an intrusion. For instance, by analysing complex patterns in network packet properties such as packet size, protocol, source-destination information, and timestamps, MLPs provide a precise and adaptable method for detecting anomalies and potential security breaches.
2.1.8 Multi-Layer Perception (MLP) Based Neural Network Using Keras
Using the Keras framework to build a Multi-layer Perceptron (MLP) Neural Network is a great way to find people trying to break into computer networks. By utilizing the deep learning capabilities of Keras, this model demonstrates exceptional proficiency in collecting complex patterns within network data of high dimensions, rendering it a highly suitable tool for real-time security assessments. In intrusion detection, a Keras-based MLP is applicable for analyzing network traffic datasets. In this context, the dataset’s features correspond to network packet properties, while the labels indicate whether an event is classified as benign or invasive. By analyzing intricate network packet parameters such as source-destination information, protocol, packet size, and timestamps, the Keras MLP network presents an advanced methodology for accurately detecting network intrusions, exhibiting notable precision and recall.
A Gated Recurrent Unit (GRU) model built with Keras is a powerful deep-learning method for finding intrusions in computer networks. GRUs employ the recurrent neural network (RNN) architecture to capture and represent sequential data patterns in network traffic and system logs. This characteristic renders them highly suitable for doing real-time security analysis. In the realm of intrusion detection, the utilization of a Keras-based GRU is applicable for the analysis of time-series network data. In this scenario, the features within the dataset represent sequential occurrences, while the labels indicate whether an event is deemed normal or suggestive of an intrusion. The GRU model provides a dependable way for identifying intrusions and irregularities with high accuracy by evaluating network events such as login attempts, system commands, and data transfers.
2.1.10 Long Short-Term Memory (LSTM)
The Long Short-Term Memory (LSTM) model is a very effective architecture for deep learning that demonstrates noteworthy suitability for detecting intrusions in computer networks. It is one of the many applications for which this model may be used. The recurrent neural network architecture that LSTMs have enables them to deliver a high level of efficacy in successfully modelling and capturing substantial relationships that occur within sequential network data. It is a significant advantage over other types of neural networks. Because of this, they present themselves as an extremely useful device for conducting real-time security analysis. When it comes to the field of intrusion detection, the use of LSTM models can be used for the examination of time-series network datasets. In this scenario, the features within the dataset represent sequential network events, while the labels signify the classification of each event as benign or constituting an intrusion. One illustrative instance uses the LSTM model to examine the progression of network activity, encompassing login attempts, data transfers, and system commands. This advanced methodology exhibits a remarkable capability in accurately detecting intrusions and anomalies.
This research uses supervised and unsupervised machine learning models for intrusion detection using the UNSW-NB15 dataset. The models are trained and tested using the dataset. The dataset is split into train and test sets used for the model’s training and testing. The steps for the model evaluation are shown in Fig. 2. Once the model is trained using the training set, the test set is used for the performance evaluation, and the performance of the model is highlighted in terms of accuracy, precision, recall, F1 score, along with the Confusion Matrix. For the Neural Network MLP, GRU and LSTM models, the dataset is split into training and test sets for 0.8 and 0.2, respectively, and the models are trained using 200 epochs for each model. The performance of all the models, including performance evaluation and runtime evaluation, includes the training, prediction, and total time. The methodology is shown in Fig. 2, where the dataset is split, having the labelled and unlabeled data, which is then split into training and test sets. The training set is used to train the machine learning models, which are then used for the test set prediction. Finally, the model’s performance is evaluated along with accuracy, recall, precision, and F1 score, along with the confusion matrix. The computational time of the models is also evaluated.

Figure 2: Methodology
The UNSW-NB15 [27] dataset was compiled by the University of South Wales, where researchers utilized the Bro tool to extract 49-dimensional features from network traffic using three virtual servers. The UNSW-NB 15 dataset is selected as it encompasses a broader range of attack types than the KDD99 dataset and exhibits greater characteristics. The data categories encompass standard data and a collection of nine distinct types of intrusion. The features include flow features, fundamental features, content features, temporal features, supplementary features, and annotated features. The UNSW-NB15 dataset is a novel IDS dataset utilized in several contemporary research investigations. While the impact of UNSW-NB15 is presently deemed less significant than that of KDD99, it is imperative to create novel datasets to advance the development of new IDS that rely on machine learning techniques.
The TCPdump utility can capture a substantial amount of raw network traffic, namely 100 gigabytes, often stored in Pcap file format. The dataset consists of nine distinct categories of attacks: Fuzzers, Analysis, Backdoors, Denial of Service (DoS), Exploits, Generic, Reconnaissance, Shellcode, and Worms. The use of the Argus and Bro-IDS tools is observed, alongside the development of twelve algorithms to generate a comprehensive set of 49 features accompanied by a class label.
Truly Positive (TN), False Negative (FN), True Positive (TP), and False Positive (FP) are the primary components of the evaluation metrics that are employed to assess the performance of ML algorithms. To assess the efficacy of the models, this study employs the confusion matrix, which offers a comprehensive perspective on the algorithm’s performance. The evaluation metrics are shown in Fig. 3.

Figure 3: Evaluation metrics
When analyzing the performance of ML algorithms, it is one of the most widely used assessment measures. It can be attributed partly to its simplicity and ease of implementation [19]. Accuracy can be conceptualized as quantifying the extent to which test data points have been correctly classified, typically represented as a percentage. Nevertheless, it is advisable to refrain from measuring accuracy solely on the training data due to the potential for overfitting. This is because the accuracy rate may frequently appear greater than its true value, leading to an incorrect outcome. Mathematical correctness can be quantified as follows:
One significant limitation of accuracy is its inability to distinguish between false positives (FP) and false negatives (FN) [19]. Consequently, it becomes challenging to identify the areas where the algorithm makes errors, potentially resulting in more severe issues depending on the context in which the method is applied.
Precision and recall are frequently considered in tandem due to their inherent correlation. Precision is a metric that quantifies the proportion of positive predictions that accurately belong to the positive class. Recall refers to the ratio of correctly predicted positive cases to the total number of positive instances. The mathematical formulas for precision and recall are presented in Eqs. (2) and (3).
Precision and recall, like accuracy, are frequently employed in several domains because of their ease of implementation and comprehensibility, which is their primary advantage. One of the primary limitations associated with precision and memory is the omission of true negatives (TN). It implies that the correctly categorised negatives do not influence the overall score of either criterion. Hence, the omission of true negative (TN) ratings in evaluating algorithm performance can result in an overall skewed perspective, and it is imperative to use TN scores only when their relevance is deemed necessary.
The F1 score, sometimes called the F-Measure [28], is a composite metric that combines accuracy and recall through a weighted average. It metric yields a singular comprehensive score for evaluating the performance of a classification model. The F1 score can be formally described in mathematical terms as shown in Eq. (4):
Since an algorithm may have great precision but low recall, or vice versa, it is regarded as a common statistic since it can provide an overall picture of both precision and recall. The F1 score, a commonly employed evaluation statistic that aims to provide a more equitable assessment of precision and recall, should be utilised judiciously [21]. This phenomenon can be attributed to the metric’s calculation method, which involves computing the weighted average of precision and recall. According to the source, the weighted value is subject to variation between different calculations, as the specific weights assigned are contingent upon the nature of the evaluation. According to the authors in reference [21], it is recommended to establish a uniform weight that is applied to all metric computations to address its concern.
In this section, the performance of each model, including the evaluation metrics and confusion matrix, is discussed, along with the computational time.
The logistic regression model demonstrates good performance across several measures, with an accuracy, recall, and F1 score of 92.80%, proving its ability to categorize instances and detect positive situations effectively. The model’s accuracy is 92.83%, indicating a high proportion of genuine positives among its positive predictions. Moreover, the model is computationally efficient, with a short training time of 1.68 s and a minimal prediction time of 0.01 s, resulting in a total time of 1.69 s. These results imply that the logistic regression model is accurate, precise, and quick in its predictions, making it well-suited for the task. The performance of Logistic Regression is shown in Table 1, followed by the confusion matrix, shown in Fig. 4 below.

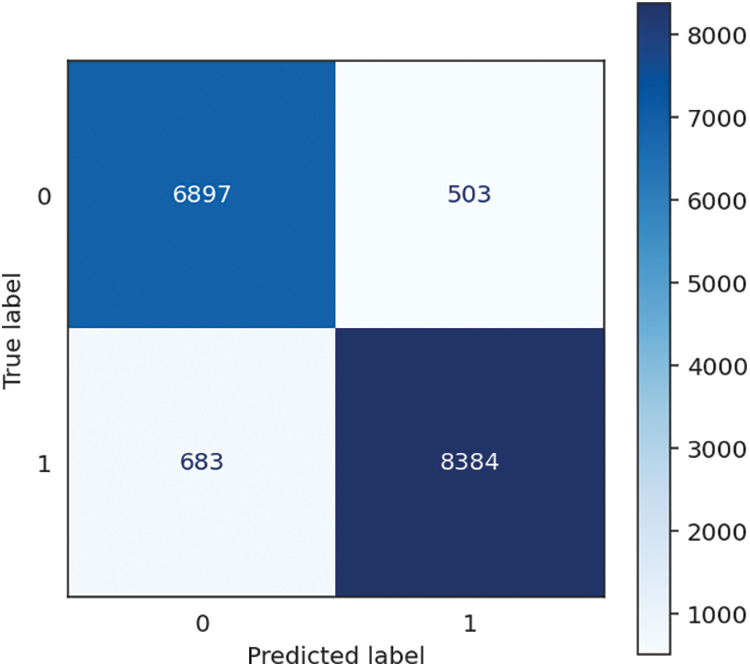
Figure 4: Logistic regression confusion matrix
The K-Nearest Neighbours (KNN) algorithm achieves a high level of accuracy, recall, and F1 score at 95.04%. It highlights its effectiveness in effectively categorizing instances and correctly detecting positive situations. The accuracy rate of 95.09% indicates its proficiency in generating accurate optimistic forecasts. It is worth mentioning that the KNN algorithm demonstrates rapid training, with a training time of only 0.01 s. Nevertheless, the estimated prediction time of 20.04 s, leading to a cumulative duration of 20.05 s, suggests that the processing demands during the prediction stage could be substantial. However, the noteworthy accuracy, recall, and precision metrics indicate that the KNN algorithm exhibits a high level of efficacy in its predictive capabilities, particularly when real-time forecasts are not of utmost importance. The performance of KNN is shown in Table 2, followed by the confusion matrix, shown in Fig. 5 below.


Figure 5: KNN confusion matrix
The Decision Tree method has outstanding performance, achieving remarkable accuracy, recall, precision, and F1 score, reaching an amazing value of 96.38%. The metrics presented demonstrate the model’s proficiency in accurately classifying instances and detecting positive examples, rendering it a resilient option for various classification tasks. The model efficiently constructs its structure from the training data, as evidenced by a training time of 1.38 s. Additionally, it showcases exceptional performance in generating real-time predictions, with a minimal prediction time of 0.01 s. Accordingly, the total time spent is 1.39 s. The Decision Tree technique not only demonstrates efficient efficiency in the processes of training and prediction, but it also has impressively high levels of accuracy and precision. The performance of KNN is shown in Table 3, followed by the confusion matrix, shown in Fig. 6 below.


Figure 6: Decision tree confusion matrix
The Extremely Randomized Trees or Extra Trees method has extraordinary performance and amazing consistency, as indicated by the extraordinarily high 97.53% F1 score accuracy, recall, and precision performance metrics. It is evidenced by the algorithm’s name coming from the phrase “extremely randomized trees.” This data lends credence to the hypothesis that the system had an extraordinary capacity to categorize occurrences and locate positive examples with exceptional speed. The training time for the model is 3.67 s, which is slightly longer than average. It allows the model to generate an ensemble of highly randomized trees. The speedy prediction time of 0.21 s more than makes up for this drawback, resulting in an overall processing time of 3.88 s. The trade-off between training and prediction time renders Extremely Randomized Trees a favourable option for applications prioritizing rapid and accurate real-time forecasts while upholding high levels of accuracy and precision. It is particularly relevant in crucial decision-making systems. The performance of Extra Trees is shown in Table 4, followed by the confusion matrix, shown in Fig. 7 below.


Figure 7: Extra trees confusion matrix
The Random Forest algorithm achieves outstanding and consistent performance, obtaining excellent accuracy, recall, and F1 score, all at 97.68%. It is a testament to the algorithm’s design and implementation. It illustrates the powerful capability of accurately classifying scenarios and effectively locating affirmative cases. Additionally, the high level of precision, which is 97.69%, displays the capacity to generate optimistic projections accurately. The model requires a comparatively longer duration of 5.47 s for training to create an ensemble of decision trees. However, it effectively offsets this by achieving a fast prediction time of 0.21 s, resulting in a combined processing time of 5.68 s. The Random Forest algorithm is well-suited for various applications that require accurate and efficient real-time predictions, such as data analysis, classification, and predictive modelling. Its suitability stems from its ability to balance training and prediction timeframes, making it an ideal choice. The performance of Random Forest is shown in Table 5, followed by the confusion matrix, shown in Fig. 8 below.


Figure 8: Random forests confusion matrix
5.6 Gradient Boosting Classifier
The Gradient Boosting Classifier has robust and consistent performance, achieving a remarkable accuracy, recall, and F1 score of 95.85%. It demonstrates its ability to precisely categorize occurrences and efficiently detect affirmative cases, rendering it a resilient option for diverse classification jobs. The precision score of 95.86% signifies the model’s capacity to generate positive predictions with a high degree of precision. It is noteworthy that the present model necessitates a considerable duration of 46.92 s for training, owing to the intricate characteristics inherent in gradient boosting. Nevertheless, it effectively offsets this drawback by exhibiting an exceptionally rapid prediction time of merely 0.04 s, culminating in an aggregate processing duration of 46.95 s. It is particularly well-suited for scenarios that do not require real-time predictions as the primary objective, such as offline or batch-processing situations. The performance of Gradient Boosting Classifier is shown in Table 6, followed by the confusion matrix, shown in Fig. 9 below.


Figure 9: Gradient booster classifier confusion matrix
5.7 Multi-Layer Perception (MLP) Neural Network
The Multi-Layer Perceptron (MLP) Neural Network (MLP-NN) exhibits strong performance characterized by high accuracy, recall, precision, and F1 score, achieving a notable 96.25% value. It demonstrates the capacity of the system to categorize instances and efficiently detect positive examples precisely, rendering it a robust option for diverse classification endeavours. The model dedicates considerable time, specifically 43.92 s, to training. This duration is commonly observed in neural networks, as their intricate architecture and training procedure necessitate an extended period for learning intricate patterns from the provided data. However, it demonstrates exceptional proficiency in generating prompt forecasts, boasting a remarkably low prediction time of merely 0.02 s, culminating in an overall processing duration of 43.94 s. It suggests that the MLP Neural Network is highly suitable for jobs requiring high accuracy and precision, with real-time predictions of secondary importance. Examples of such applications include image recognition and natural language processing. The performance of MLP-NN is shown in Table 7, followed by the confusion matrix, shown in Fig. 10 below.


Figure 10: MLP-NN confusion matrix
5.8 Multi-Layer Perception (MLP) Neural Network Using Keras
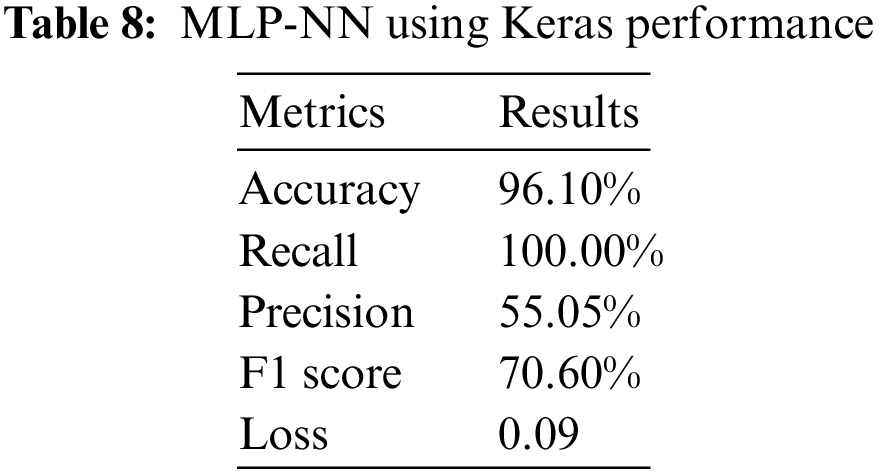
Implementing the Multi-Layer Perceptron (MLP) Neural Network using Keras has significant performance, with an accuracy rate of 96.10%. The model’s perfect recall rate of 100.00% demonstrates its capacity to detect all positive occurrences within the dataset accurately. This attribute is particularly significant when omitting a positive example, such as medical diagnostics, is strongly unwanted. Nonetheless, the precision rate of 55.05% indicates that the model’s accuracy in correctly predicting positive instances is slightly above half, implying a potential increase in false positives. The F1 score, a metric that balances precision and recall, is calculated to be 70.60%. Its value indicates a moderate level of compromise between precision and memory. Moreover, the model’s low loss value of 0.09 suggests that the training procedure has successfully minimized the discrepancy between the predicted and actual values. Depending on the application, this model possesses potential value due to its high recall rate. However, it may be necessary to make further efforts to enhance precision for specific use cases. The performance of MLP-NN using Keras is shown in Table 8.
5.9 Gated Recurrent Unit (GRU) Using Keras
Implementing the Gated Recurrent Unit (GRU) using the Keras framework exhibits robust performance, with an accuracy rate of 96.33%. The level of accuracy demonstrated by the model indicates its proficiency in generating accurate predictions, rendering it a desirable option for a range of sequential data processing tasks. The observed low loss value of 0.0891 suggests that the training procedure of the model successfully reduces the discrepancy between predicted and actual values. This observation implies that the GRU network effectively captures intricate temporal relationships within the dataset. The GRU model demonstrates favourable characteristics for jobs that include analyzing sequential data, such as natural language processing, time series forecasting, and other scenarios where identifying sequential patterns is critical for precise predictions and informed decision-making. Its notable attributes include a high level of accuracy and minimal loss. The performance of GRU is shown in Table 9.

5.10 Long Short-Term Memory (LSTM) Using Keras
With an accuracy of 96.48%, the performance of the LSTM model implemented using Keras was found to be quite strong. The model’s high accuracy reveals its ability to create precise predictions, making it highly advantageous for various tasks, particularly those connected to sequential data processing. It makes it ideal for use in a variety of contexts. As seen by the model’s low loss value of 0.0891, the model is adept at minimizing the gap during training between the predicted values and those observed. Because they can inherently capture long-range dependencies within sequences successfully, LSTM models are extremely useful for various applications. Some examples of these applications include sequential data analysis, natural language processing, and time series forecasting. The LSTM model is a highly accurate and low-loss alternative well-suited for applications that need interpreting and recording complicated temporal patterns to make exact predictions and judgments based on reliable information. The performance of LSTM is shown in Table 10.

In our performance comparison of various machine learning and neural network models, we categorized them based on their effectiveness in terms of accuracy, recall, precision, and F1 score.
Compared to other models, the ensemble methods of Extremely Randomized Trees and Random Forest demonstrate superior performance, obtaining a remarkable accuracy of 97.53% and 97.68%, respectively. In addition, both approaches demonstrated positive results regarding memory, precision, and F1 score, establishing them as extremely advantageous solutions for various tasks. The decision Tree algorithm exhibited robust performance, achieving an accuracy rate of 96.38% and demonstrating balanced recall, precision, and F1 score. Consequently, it may be considered a dependable choice for addressing diverse classification tasks.
6.1.2 Moderate-Performance Models
The LSTM model demonstrated a noteworthy accuracy rate of 96.48%. Regrettably, the absence of more precise measurements, such as recall and precision, was noted. The KNN algorithm showed strong performance, achieving an accuracy of 95.04%. It also exhibited balanced recall, precision, and F1 score, indicating its suitability for tasks that prioritize a trade-off between accuracy and efficiency. The GRU model demonstrated a high level of accuracy, specifically 96.33%. However, the specific recall and precision metrics were not included in the presented information.
6.1.3 Models with Room for Improvement
The logistic regression model demonstrated a well-balanced collection of measures, with an accuracy rate of 92.80%. However, its performance was comparatively lower than the other models, particularly in precision. The Gradient Boosting Classifier exhibited a commendable accuracy rate of 95.85%. However, its precision was marginally lower, necessitating a significantly longer training duration, rendering it more appropriate for applications that do not require real-time processing.
6.1.4 Models with Room for Improvement
The Multi-layer Perceptron (MLP) Neural Network exhibited a recall rate of 100.00%, indicating its ability to identify all relevant instances correctly. However, this high recall was accompanied by a lower accuracy rate of 55.05%, indicating a larger number of false positives. Consequently, the F1 score, a measure of the model’s overall performance, was calculated to be 70.60%. It is suggested that further refinement of this model through fine-tuning could enhance its ability to achieve a more optimal balance between precision and recall.
The performance comparison of all the models considering the performance metrics, including accuracy, precision, recall and F1 score, is compared in Table 11.

In conclusion, the optimal model selection is contingent upon the task’s specific demands. Models such as Extremely Randomized Trees and Random Forest demonstrate exceptional performance across multiple evaluation metrics, rendering them highly appropriate for various applications. Nevertheless, models like KNN, Decision Trees, and LSTM exhibit commendable performance and possess prospective benefits in interpretability and resource utilization. Moreover, although the MLP Neural Network demonstrated flawless recall, there is room for enhancing its precision to achieve a more equitable performance. The context and specific priorities of the task should guide the model selection process.
Regarding computational efficiency, the models included in our comparison demonstrate varying performance levels concerning training and prediction durations, as shown in Table 12. KNN and Logistic Regression are notable for their computational efficiency, as seen by KNN’s training time of 0.01 s and its substantially faster prediction time of 20.04 s. In contrast, Logistic Regression achieves a trade-off by exhibiting a relatively short training time of 1.68 s and an exceptionally rapid prediction time of merely 0.01 s. Ensemble approaches such as Random Forests and Extremely Randomized Trees provide notable efficiency in training timeframes. Specifically, Random Forest exhibits a training time of 5.47 s, whereas its prediction time amounts to 0.21 s. When comparing the two methods, it is observed that the training time for Extremely randomized Trees is 3.67 s, whereas the prediction time remains consistent at 0.21 s.

The Gradient Boosting Classifier exhibits commendable performance but necessitates a considerable training period of 46.92 s. However, it demonstrates exceptional efficiency once trained with a prediction time of under 0.04 s. In terms of neural networks, the MLP Neural Network necessitates a training duration of 43.92 s, a very extended period that remains feasible for numerous applications. However, it boasts a noteworthy prediction time of 0.02 s. The computational efficiency of the LSTM and GRU models is a challenge because of their extended training and prediction timeframes.
If real-time or near-real-time processing is a priority, models like Logistic Regression or KNN might be preferred. However, if computational efficiency can be traded off for stronger predictive performance, ensemble methods or neural networks like MLP may be the way to go. The context and objectives of your project will play a significant role in determining the most suitable model.
The research focuses on applying machine learning and neural network models for intrusion detection, employing the UNSW-NB15 dataset. The dataset provided by the University of South Wales is a comprehensive compilation of information. It encompasses many attack types and extracts 49-dimensional features from network traffic. As a result, this dataset holds significant value for current research in intrusion detection. The UNSW-NB15 dataset is critical in enhancing intrusion detection systems relying on machine learning techniques. The study encompassed meticulous data preparation and feature selection techniques to optimize the dataset for model training and evaluation. The process included in this study encompassed several techniques for data preprocessing, such as removing irrelevant or redundant features, using clamping to limit extreme values, applying a logarithmic function to address skewed data, and reducing the number of labels in categorical features. Implementing preprocessing processes is crucial in enhancing the model’s performance by refining input data. The study utilized a complete range of evaluation criteria, encompassing accuracy, precision, recall, F1 score, and specificity, to assess the effectiveness of the machine learning and neural network models. These metrics provide a comprehensive viewpoint on the performance of the models across several facets of classification. The study examined multiple models, classifying their performance according to accuracy, efficiency, and a trade-off between them. Several models exhibited exceptional performance, including Extremely Randomized Trees and Random Forest ensemble techniques, which revealed incredible accuracy and precision.
The performance of models such as KNN and Decision Trees was moderate, demonstrating a balanced compromise between accuracy and efficiency. The models that exhibited potential for enhancement encompassed Logistic Regression and the Gradient Boosting Classifier; both demonstrated commendable performance, albeit necessitating lengthier training durations. The MLP neural network exhibited flawless recall; nevertheless, there was scope for enhancement in terms of precision. The selection of the most appropriate model is contingent upon the objectives of the intrusion detection system. Logistic Regression and KNN models have demonstrated their suitability for real-time processing and great efficiency. Ensemble approaches and neural networks, including LSTM and GRU, exhibit robust predicting capabilities but potentially necessitate extended training durations. The determination ought to be influenced by contextual factors and project priorities. Finally, the consideration of computational efficiency plays a crucial role in the process of selecting a model. Certain models, such as Logistic Regression and KNN, exhibit notable efficiency and are well-suited for real-time processing. Alternative approaches, such as ensemble methods and neural networks, have longer training durations, although they exhibit robust predictive skills. The optimization of performance and efficiency must be congruent with the requirements and limitations of the project.
Acknowledgement: None.
Funding Statement: The authors received no specific funding for this study.
Author Contributions: The authors confirm contribution to the paper as follows: models’ implementation: Adil Hussain. Ayesha Aslam; data collection: Tariq; analysis and interpretation of results: Adil Hussain, Amna Khatoon, Tariq; draft manuscript preparation: Adil Hussain, Muhammad Asif Khosa. All authors reviewed the results and approved the final version of the manuscript.
Availability of Data and Materials: The data will be provided on request.
Conflicts of Interest: The authors declare that they have no conflicts of interest to report regarding the present study.
References
1. D. E. Denning, “An intrusion-detection model,” IEEE Transactions on Software Engineering, vol. 13, no. 2, pp. 222–232, 1987. [Google Scholar]
2. G. G. Liu, “Intrusion detection systems,” in Applied Mechanics and Materials, vol. 596. Switzerland: Trans Tech Publications Ltd., pp. 852–855, 2014. https://doi.org/10.4028/www.scientific.net/AMM.596.852 [Google Scholar] [CrossRef]
3. C. Chio and D. Freeman, Machine Learning and Security: Protecting Systems with Data and Algorithms. O’Reilly Media, Inc., 2018. [Online]. Available: https://www.oreilly.com/library/view/machine-learningand/9781491979891/ (accessed on 13/11/2023) [Google Scholar]
4. A. Ali, S. Shaukat, M. Tayyab, M. A. Khan, J. S. Khan et al., “Network intrusion detection leveraging machine learning and feature selection,” in Proc. of IEEE ICAIS, New Jersey, USA, pp. 49–53, 2020. [Google Scholar]
5. S. Shaukat, A. Ali, A. Batool, F. Alqahtani, J. S. Khan et al., “Intrusion detection and attack classification leveraging machine learning technique,” in Proc. of IEEE IIT, Al Ain, UAE, pp. 198–202, 2020. [Google Scholar]
6. L. N. Tidjon, M. Frappier and A. Mammar, “Intrusion detection systems: A cross-domain overview,” IEEE Communications Surveys & Tutorials, vol. 21, no. 4, pp. 3639–3681, 2019. [Google Scholar]
7. M. Rege and R. B. K. Mbah, “Machine learning for cyber defense and attack,” in Int. Conf. on Data Analytics, Athens, Greece, pp. 83, 2018. [Google Scholar]
8. The Verge. [Online]. Available: https://www.theverge.com/2019/2/6/18213453/gmail-tensorflow-machine-learning-spam-100-million (accessed on 13/11/2023). [Google Scholar]
9. N. Japkowicz, “Why question machine learning evaluation methods,” in Proc. of AAAl, Massachusetts, USA, pp. 6–11, 2006. [Google Scholar]
10. S. A. Raza, S. Shamim, A. H. Khan and A. Anwar, “Intrusion detection using decision tree classifier with feature reduction technique,” Mehran University Research Journal of Engineering & Technology, vol. 42, no. 2, pp. 30–37, 2023. [Google Scholar]
11. P. Dixit and S. Sanjay, “Analysis of state-of-art attack detection methods using recurrent neural network,” in Proc. of PCCDS, Springer Singapore, pp. 795–804, 2022. [Google Scholar]
12. A. Devarakonda, S. Nilesh, S. Prita and S. Ramya, “Network intrusion detection: A comparative study of four classifiers using the NSL-KDD and KDD’99 datasets,” Journal of Physics: Conference Series, vol. 2161, no. 1, pp. 012043, 2022. [Google Scholar]
13. S. P. Thirimanne, L. Jayawardana, L. Yasakethu, P. Liyanaarachchi and C. Hewage, “Deep neural network based real-time intrusion detection system,” SN Computer Science, vol. 3, no. 2, pp. 145, 2022. [Google Scholar]
14. S. Wang, J. F. Balarezo, S. Kandeepan, A. Al-Hourani, K. G. Chavez et al., “Machine learning in network anomaly detection: A survey,” IEEE Access, vol. 9, pp. 152379–152396, 2021. [Google Scholar]
15. M. Ghurab, G. Gaphari, F. Alshami, R. Alshamy and S. Othman, “A detailed analysis of benchmark datasets for network intrusion detection system,” Asian Journal of Research in Computer Science, vol. 7, no. 4, pp. 14–33, 2021. [Google Scholar]
16. E. E. Abdallah and A. F. Otoom, “Intrusion detection systems using supervised machine learning techniques: A survey,” Procedia Computer Science, vol. 201, pp. 205–212, 2022. [Google Scholar]
17. Y. A. Al-Khassawneh, “An investigation of the intrusion detection system for the NSL-KDD dataset using machine-learning algorithms,” in Proc. of IEEE eIT, Romeoville, USA, pp. 518–523, 2023. [Google Scholar]
18. A. R. Bahlali and A. Bachir, “Machine learning anomaly-based network intrusion detection: Experimental evaluation,” in Proc. of AINA, Juiz de Fora, Brazil, pp. 392–403, 2023. [Google Scholar]
19. T. A. Tuan, H. V. Long, L. H. Son, R. Kumar, I. Priyadarshini et al., “Performance evaluation of Botnet DDoS attack detection using machine learning,” Evolutionary Intelligence, vol. 13, no. 2, pp. 283–294, 2020. [Google Scholar]
20. C. Yin, Y. Zhu, J. Fei and X. He, “A deep learning approach for intrusion detection using recurrent neural networks,” IEEE Access, vol. 5, pp. 21954–21961, 2017. [Google Scholar]
21. B. Ingre and A. Yadav, “Performance analysis of NSL-KDD dataset using ANN,” in Proc. of IEEE SPACES, Guntur, India, pp. 92–96, 2015. [Google Scholar]
22. J. Kim, J. Kim, H. Kim, M. Shim and E. Choi, “CNN-based network intrusion detection against denial-of-service attacks,” Electronics, vol. 9, no. 6, pp. 916, 2020. [Google Scholar]
23. B. Roy and H. Cheung, “A deep learning approach for intrusion detection in Internet of Things using bi-directional long short-term memory recurrent neural network,” in Proc. of ITNAC, Sydney, Australia, pp. 1–6, 2018. [Google Scholar]
24. N. Farnaaz and M. Jabbar, “Random forest modeling for network intrusion detection system,” Procedia Computer Science, vol. 89, pp. 213–217, 2016. [Google Scholar]
25. M. S. Pervez and D. M. Farid, “Feature selection and intrusion classification in NSL-KDD cup 99 dataset employing SVMs,” in Proc. of IEEE SKIMA, Dhaka, Bangladesh, pp. 1–6, 2014. [Google Scholar]
26. V. Kumar, H. Chauhan and D. Panwar, “K-means clustering approach to analyze NSL-KDD intrusion detection dataset,” International Journal of Soft Computing and Engineering, vol. 4, pp. 2231–2307, 2013. [Google Scholar]
27. M. Nour and J. Slay, “UNSW-NB15: A comprehensive data set for network intrusion detection systems (UNSW-NB15 network data set),” in Proc. of MilCIS, Canberra, Australia, pp. 1–6, 2015. [Google Scholar]
28. D. Hand and P. Christen, “A note on using the f-measure for evaluating record linkage algorithms,” Statistics and Computing, vol. 28, no. 3, pp. 539–547, 2018. [Google Scholar]
Cite This Article
 Copyright © 2024 The Author(s). Published by Tech Science Press.
This work is licensed under a Creative Commons Attribution 4.0 International License , which permits unrestricted use, distribution, and reproduction in any medium, provided the original work is properly cited.
 Downloads
 Citation Tools