
 Submit a Paper
 Propose a Special lssue
 Open Access
ARTICLE

Assessment of Particle Matter Pollution during Post-Earthquake Debris Removal in Adiyaman City
Kahta Vocational High School, Adiyaman University, Adiyaman, 01100, Turkey
* Corresponding Author: Ercan Vural. Email:
(This article belongs to the Special Issue: Applications of Artificial Intelligence in Geomatics for Environmental Monitoring)
Revue Internationale de Géomatique 2024, 33, 37-50. https://doi.org/10.32604/rig.2024.047908
Received 22 November 2023; Accepted 06 February 2024; Issue published 29 March 2024
 View Full Text
 Download PDF
Abstract
Severe earthquakes in the world and in Turkey can cause great loss of life and property, environmental problems and health problems. In addition to the loss of life and property, earthquakes are closely related to ecosystems, air, water, and soil pollution. Particularly in post-earthquake debris removal, very large amounts of particulate matter are released and may have negative effects on the health of the local population. This study aimed to detect two types of particle matter pollution during debris removal in 25 different locations in Adiyaman City using a CEM DT 9880 particle matter measuring device in May and August 2023. PM2.5 and PM10 measurements, which have a significant impact on human health, were conducted in the field. The obtained data were analyzed using the Inverse Distance Weighting (IDW) method in ArcGIS 10.7 software. Results showed that the highest particle matter pollution was identified in neighborhoods with extensive demolition. The highest PM2.5 pollution values were recorded in Barbaros Hayrettin, Hoca Omer, Yesilyurt, and Varlik neighborhoods, while the lowest was observed in Altinsehir and Yunus Emre neighborhoods with minimal demolition. As for PM10 pollution, the highest levels were observed in Alitasi, Barbaros Hayrettin, Sumerevler, and Hoca Omer neighborhoods, while the lowest was detected in Yunus Emre and Yesilyurt neighborhoods. Green areas and their surroundings in the field exhibited lower levels of PM pollution compared to other areas.Keywords
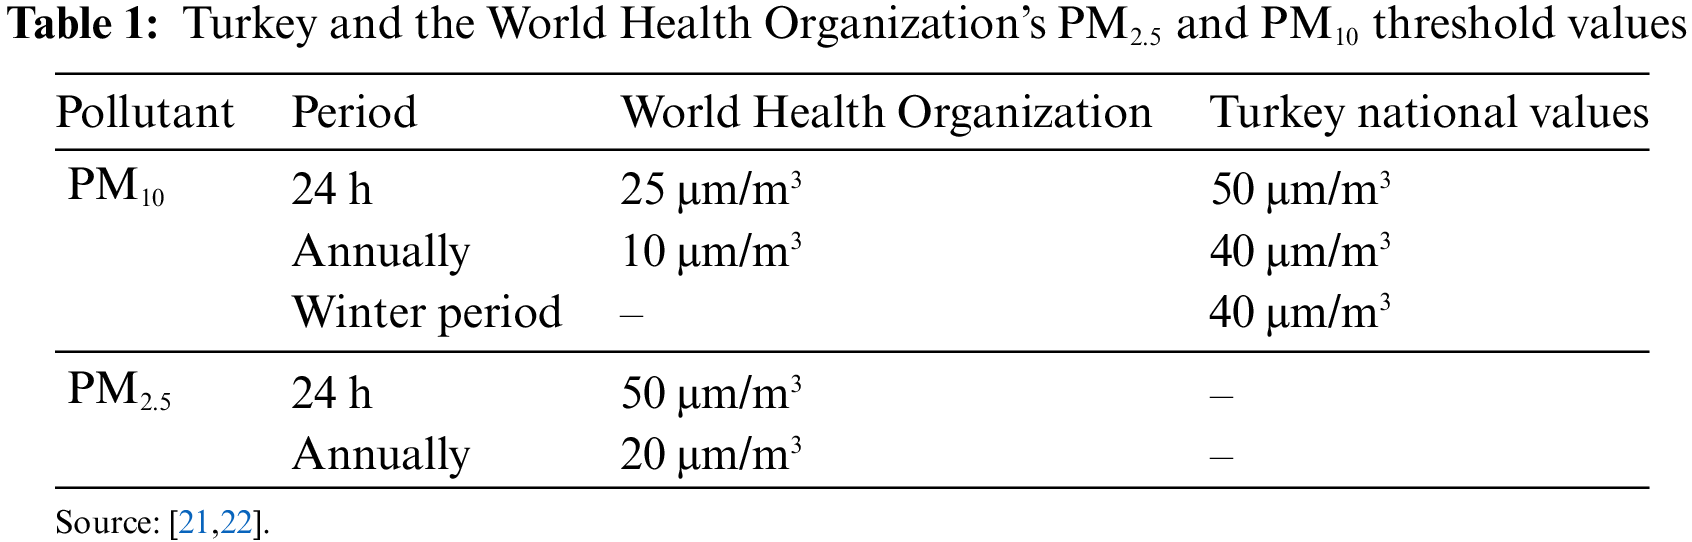
Air pollution is urbanization, energy consumption, increase in transportation and combustion engines [1]. Apart from these causes, air pollution can also occur as a result of natural disasters. Earthquakes of large scale are one of them. Earthquakes lead to significant loss of life and property damage in Turkey, as well as all over the world. Earthquakes besides the loss of life and property, also lead to serious environmental problems. Each of these consequences of severe disasters leads to the degradation of ecological service functions, creating a vicious cycle [2]. Its dense effects on the ecosystem are especially seen in water, soil and air [3,4]. Earthquakes, which are defined as disasters in relation to their intensity, are an important factor in the emergence of contagious, non-contagious diseases and health problems [5]. For this reason, earthquakes constitute complicated problems in areas that are affected by them. It is one of the most important problems in atmospheric conditions. Particulate matter is not a single pollutant, but rather a heterogeneous mixture of particles differing in size, origin, and chemical composition [6]. The health effects of air pollution, observed from both indoor and outdoor environments, have been of great concern due to the high exposure risk even at relatively low concentrations of air pollutants [7]. For this reason, air pollution that occurs in urban areas is one of the most vital problems [8–11]. During the earthquake, particulate matter is released in the demolition of collapsed buildings and damaged buildings, although their components differ, and these particulate matters are effective at local and regional scales. As a result of earthquakes, a significant amount of particulate matter is released, especially to the immediate environment, during the collapse of buildings, debris removal and construction activities. They exhibit significant variations in size, shape and pollen. Prolonged exposure to such particles can exacerbate preexisting lung conditions, cause respiratory disorders and elevate the risk of respiratory infections [12]. Particulate matter presents considerable hazards to human health, the vitality of plants and the well-being of animals [13]. Particulate matter can remain in the atmosphere for a long or short time in the near or far neighborhood depending on its size. In general, the smaller and lighter a particle is, the longer it will stay in the air. Larger particles tend to settle to the ground by gravity in a matter of hours whereas the smallest particles can stay in the atmosphere for weeks and are mostly removed by precipitation [14] these substances are known to be adsorbed onto the surface cavities of the PM and can be released into the lung alveoli and deposited in the lung parenchyma [15]. Particulate matter deposition may be harsher and devastating, with stressed ecosystems recuperating less readily and often undergoing further degradation [16]. Particle substances in the environment are important pollutants (PM2.5 and PM10) and cause roughly 4.5 million deaths around the world annually (WHO, 2020). For this reason, it is estimated that all dimensions of particulate matter are the 5th most important factor in terms of death risks worldwide [17,18]. The most important reason for the health effects of particulate matter is its size. As the size of particulate matter decreases, the areas of retention in the human body also change. Particulate matter, including lung bronchi, is also mixed into the blood, causing various diseases to occur [19,20]. Threshold values have been determined at international and national levels to prevent or minimize diseases, especially lung diseases caused by particulate matter (Table 1). If these threshold values are exceeded for a long time, it causes permanent or temporary damage to human health.
There are two types of pollution occurring during and after an earthquake. While the first type of pollution is the pollution caused by the occurrence of debris after the earthquake, secondary pollution is the pollution that occurs during debris removal. Primary pollution refers to environmental and health problems that occur during earthquakes. The second type of pollution occurs during the removal process of the existing debris. Either in the debris clusters or during the removal process, high levels of dust concentrations form a dust cloud around its environment [23]. The 11 provinces (Adana, Adiyaman, Diyarbakir, Elazig, Gaziantep, Hatay, Kahramanmaras, Kilis, Malatya, Osmaniye and Sanliurfa) that were affected by the 6th of February 2023 earthquakes that had its epicenter in Kahramanmaras have a total of 2,618,697 building that consists of dwellings, public areas, workplaces and other areas. From this total, 2,332,841 are dwellings, 161,187 are workplaces, 74,079 are public or governmental buildings, and 50,590 are buildings in other areas. 90% of the buildings are dwellings, 6% are workplaces and 2.9% are public or governmental buildings. The damage assessments have been made to 65% of these buildings. As a result of the assessments, 50% is undamaged, 25% is slightly damaged, 10% is heavily damaged and 2.3% is moderately damaged 3% of the buildings are considered to be either demolished or in need of urgent demolishment. In Adiyaman province, 107,242 dwellings, 5,765 workplaces, 4,370 public and governmental buildings and 3,119 other buildings were affected by the earthquake. Search and rescue operations in Adiyaman were officially terminated on 13 February 2023 [24]. After this stage, the process of debris removal was entered quickly. It was observed that a significant amount of particulate matter was released during the intensive debris removal. In this context, measurements were carried out in the study area with mobile measuring instruments during post-earthquake debris removal.
In this context, the impact of the earthquake in Adıyaman province was felt both materially and morally. While the province’s population is 635,169, the Adiyaman City’s population is 273,241 [25]. Adiyaman province consists of Besni, Celikhan, Gerger, Golbasi, Kahta, Samsat, Sincik, Tut districts and the central district. This study aims to reveal the level of particulate matter pollution, one of the environmental problems that arose during the removal process of debris after the Kahramanmaras earthquake that occurred on February 06, 2023, in the City of Adiyaman. It also offers solutions to minimize the resulting pollution.
Adiyaman province is located in the Middle Euphrates Part of the Southeast Anatolian Region. Adiyaman province is located at 37° 45′ 50″ North latitude, 38° 16′ 40″ East longitude. The study was carried out in the urban area of Adiyaman’s central district. There are 33 neighborhoods in Adiyaman City as of 2023. The study area is bordered by the Altinsehir neighborhood in the west, the Varlik neighborhood in the south, the Yunus Emre neighborhood in the east, and the Cumhuriyet neighborhood in the north (Fig. 1).
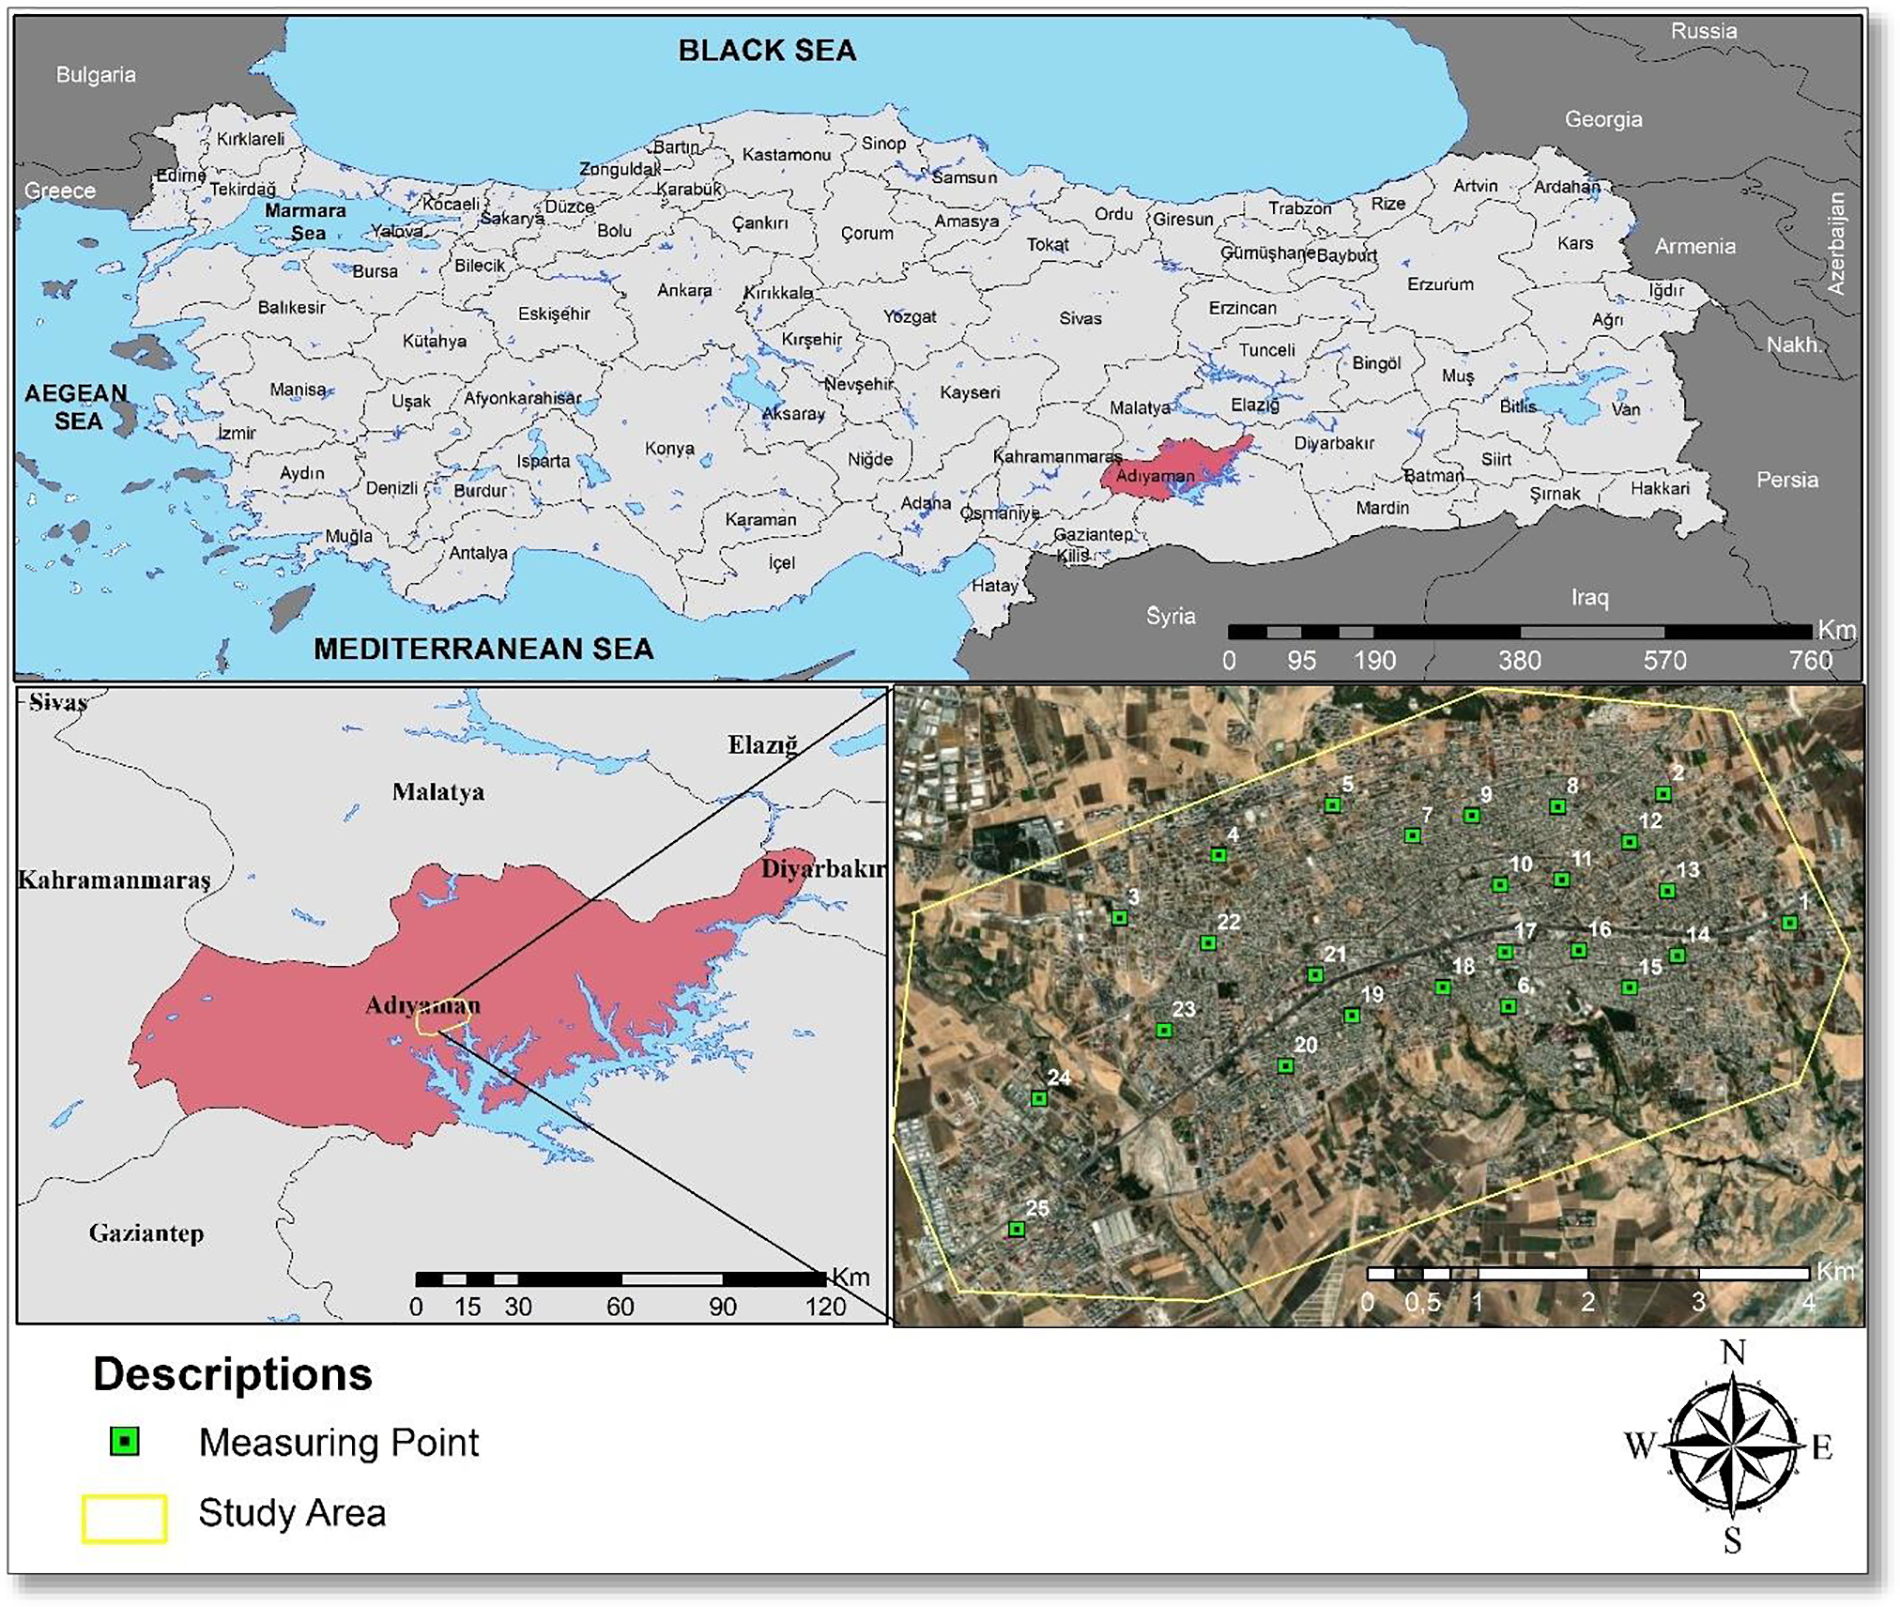
Figure 1: Location of study area
The size of particulate matter varies according to the source of origin. Particulate matter ranges in size from 0.1 to 100 µm. Particulate matter smaller than 2 µm in size is generally of anthropogenic origins such as sulphur, sulphur dioxide and dust, smoke, etc., from vehicle exhausts. Particles larger than 2 µm are mostly of natural origin (marine aerosols, windblown soil, etc.) [26]. In this study, PM10 and PM2.5 pollution and concentration were analyzed. PM10 or coarse particulate matter refers to dust particles 10 mm in diameter and larger, while PM2.5, or fine particulate matter refers to dust particles 2.5 mm in diameter and smaller [27].
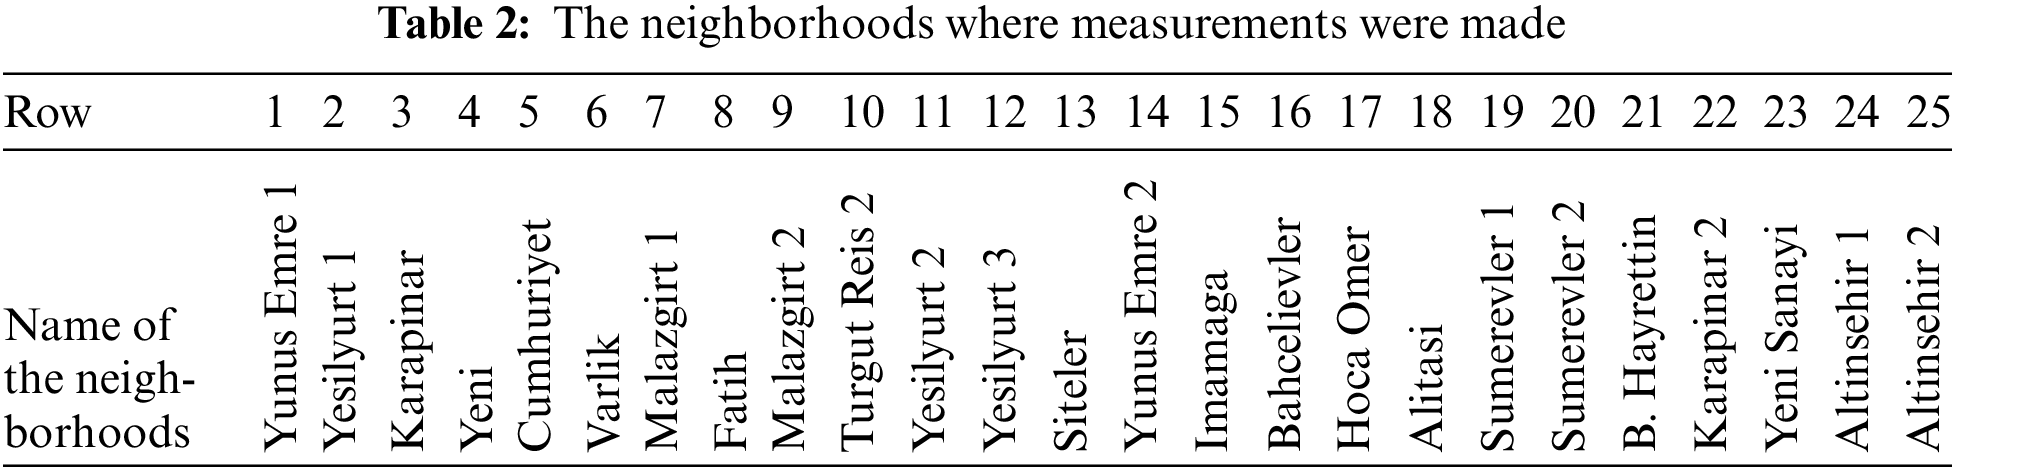
The main purpose of the study is to the spatial distribution of particulate matter 2.5 and 10 pollution in Adiyaman City during the debris removal after the Kahramanmaras earthquake that occurred on 06 February 2023 and the solution proposals for this pollution. Particulate matter 2.5 (PM2.5) and particulate matter 10 (PM10) measurements were carried out at 25 points in different areas of Adiyaman City in May and August. The locations where measurements were made are classified according to the degree of destruction of the buildings. Particulate matter measurements were carried out in the areas where the buildings collapsed and were heavily damaged during the earthquake and in areas with little or no collapse (Table 2). In addition, the measurements were carried out in areas with little and dense debris removal after the earthquake and in areas with little and dense green areas.
Particulate matter measurements were carried out with a CEM DT 9880 brand and model particulate matter meter. CEM DT 9880 particulate matter meter device momentarily absorbs and counts particulate matter in indoor and outdoor environments. Analysis and mapping of particulate matter that was obtained in the field, was done with ArcGIS 10.7 program. To analyze the data the IDW (Inverse Distance Weighting) method, which was included in the ArcGIS software, was preferred. With this method, numerical values are assigned by correlation between points to the areas that cannot be measured. IDW is based on the concept of Tobler’s first law (the first law of geography) from 1970. It was defined as everything is related to everything else, but near things are more related than distant things. The IDW was developed by the U.S. National Weather Service in 1972 and is classified as a deterministic method [28]. The IDW method is also for multivariate interpolation. Its general idea is based on the assumption that the attribute value of an unsampled point is the weighted average of known values within the neighborhood [29].
On the 6th of February earthquake epicentered Kahramanmaras, many buildings in the city of Adiyaman were damaged and many more were destroyed. During the destruction of collapsed buildings, buildings that are heavily damaged and buildings that need to be demolished urgently, particulate matter of significantly different sizes is released into the environment. Pollution levels observed are at high levels in the neighborhoods located in the city center. The pollution in Adiyaman city varied between 98.4–395.9 µm/m3 in May 2023 and 63–349.9 µm/m3 in August. The PM10 pollution varies between 19.6–141.9 µm/m3 in May and 10–105.9 µm/m3 in August. When the spatial distribution of PM2.5 pollution in the study area was examined, the highest PM2.5 level was measured at 396 µm/m3, in Barbaros Hayrettin neighborhood in May. In the measurements made in the neighborhood in August, the pollution level was measured as 350 µm/m3. After Barbaros Hayrettin neighborhood, the Hocaomer neighborhood is one of the neighborhoods with high pollution levels. While the pollution in the Hocaomer neighborhood was measured as 359 µm/m3 in May, when it was measured again in August the value was 327. At the 2nd measurement point in the Yesilyurt neighborhood, the PM2.5 pollution level was 358 µm/m3 in May and 317 µm/m3 in August. At the measurement point in the Varlik neighborhood, PM2.5 pollution was 355 µm/m3 in May and 329 µm/m3 in August. In the Alitasi neighborhood, PM2.5 pollution, which was 340 µm/m3 in May, decreased to 302 µm/m3 in August. The amount of PM2.5 pollution in the Turgut Reis Neighborhood was 309 µm/m3 in May and 263 again in August. The pollution amount in the Imamaga Neighborhood was 301 µ µm/m3 in May, and in August it was measured at 264. In Adiyaman, the highest PM2.5 pollution level was measured in the Barbaros Hayrettin neighborhood during debris removal. In Barbaros Hayrettin neighborhood, 396 µm/m3 was measured in May and 350 µm/m3 in August. In the Hocaomer neighborhood, which is one of the areas where building demolitions are high, PM2.5 pollution was measured as 359 µm/m3 in May and 327 in August. At the 2nd measurement point of the Yesilyurt neighborhood, 358 µm/m3 was measured in May and 317 µm/m3 in August. In the Varlik neighborhood, 355 µm/m3 was measured in May and 329 µm/m3 in August. In the Alitasi neighborhood, 340 µm/m3 was measured in May and 302 µm/m3 in August. These areas are the areas where debris pavement is quite dense (Table 3 & Fig. 2).
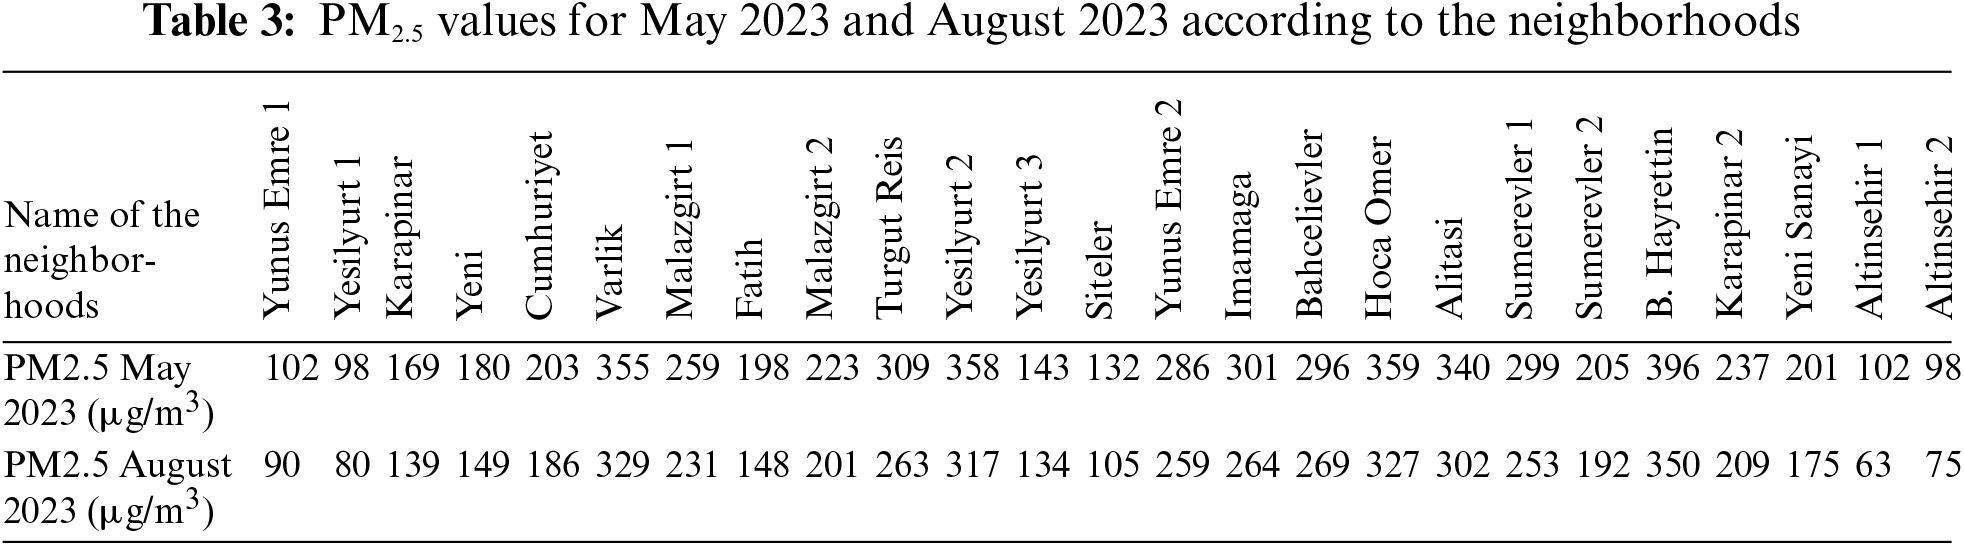
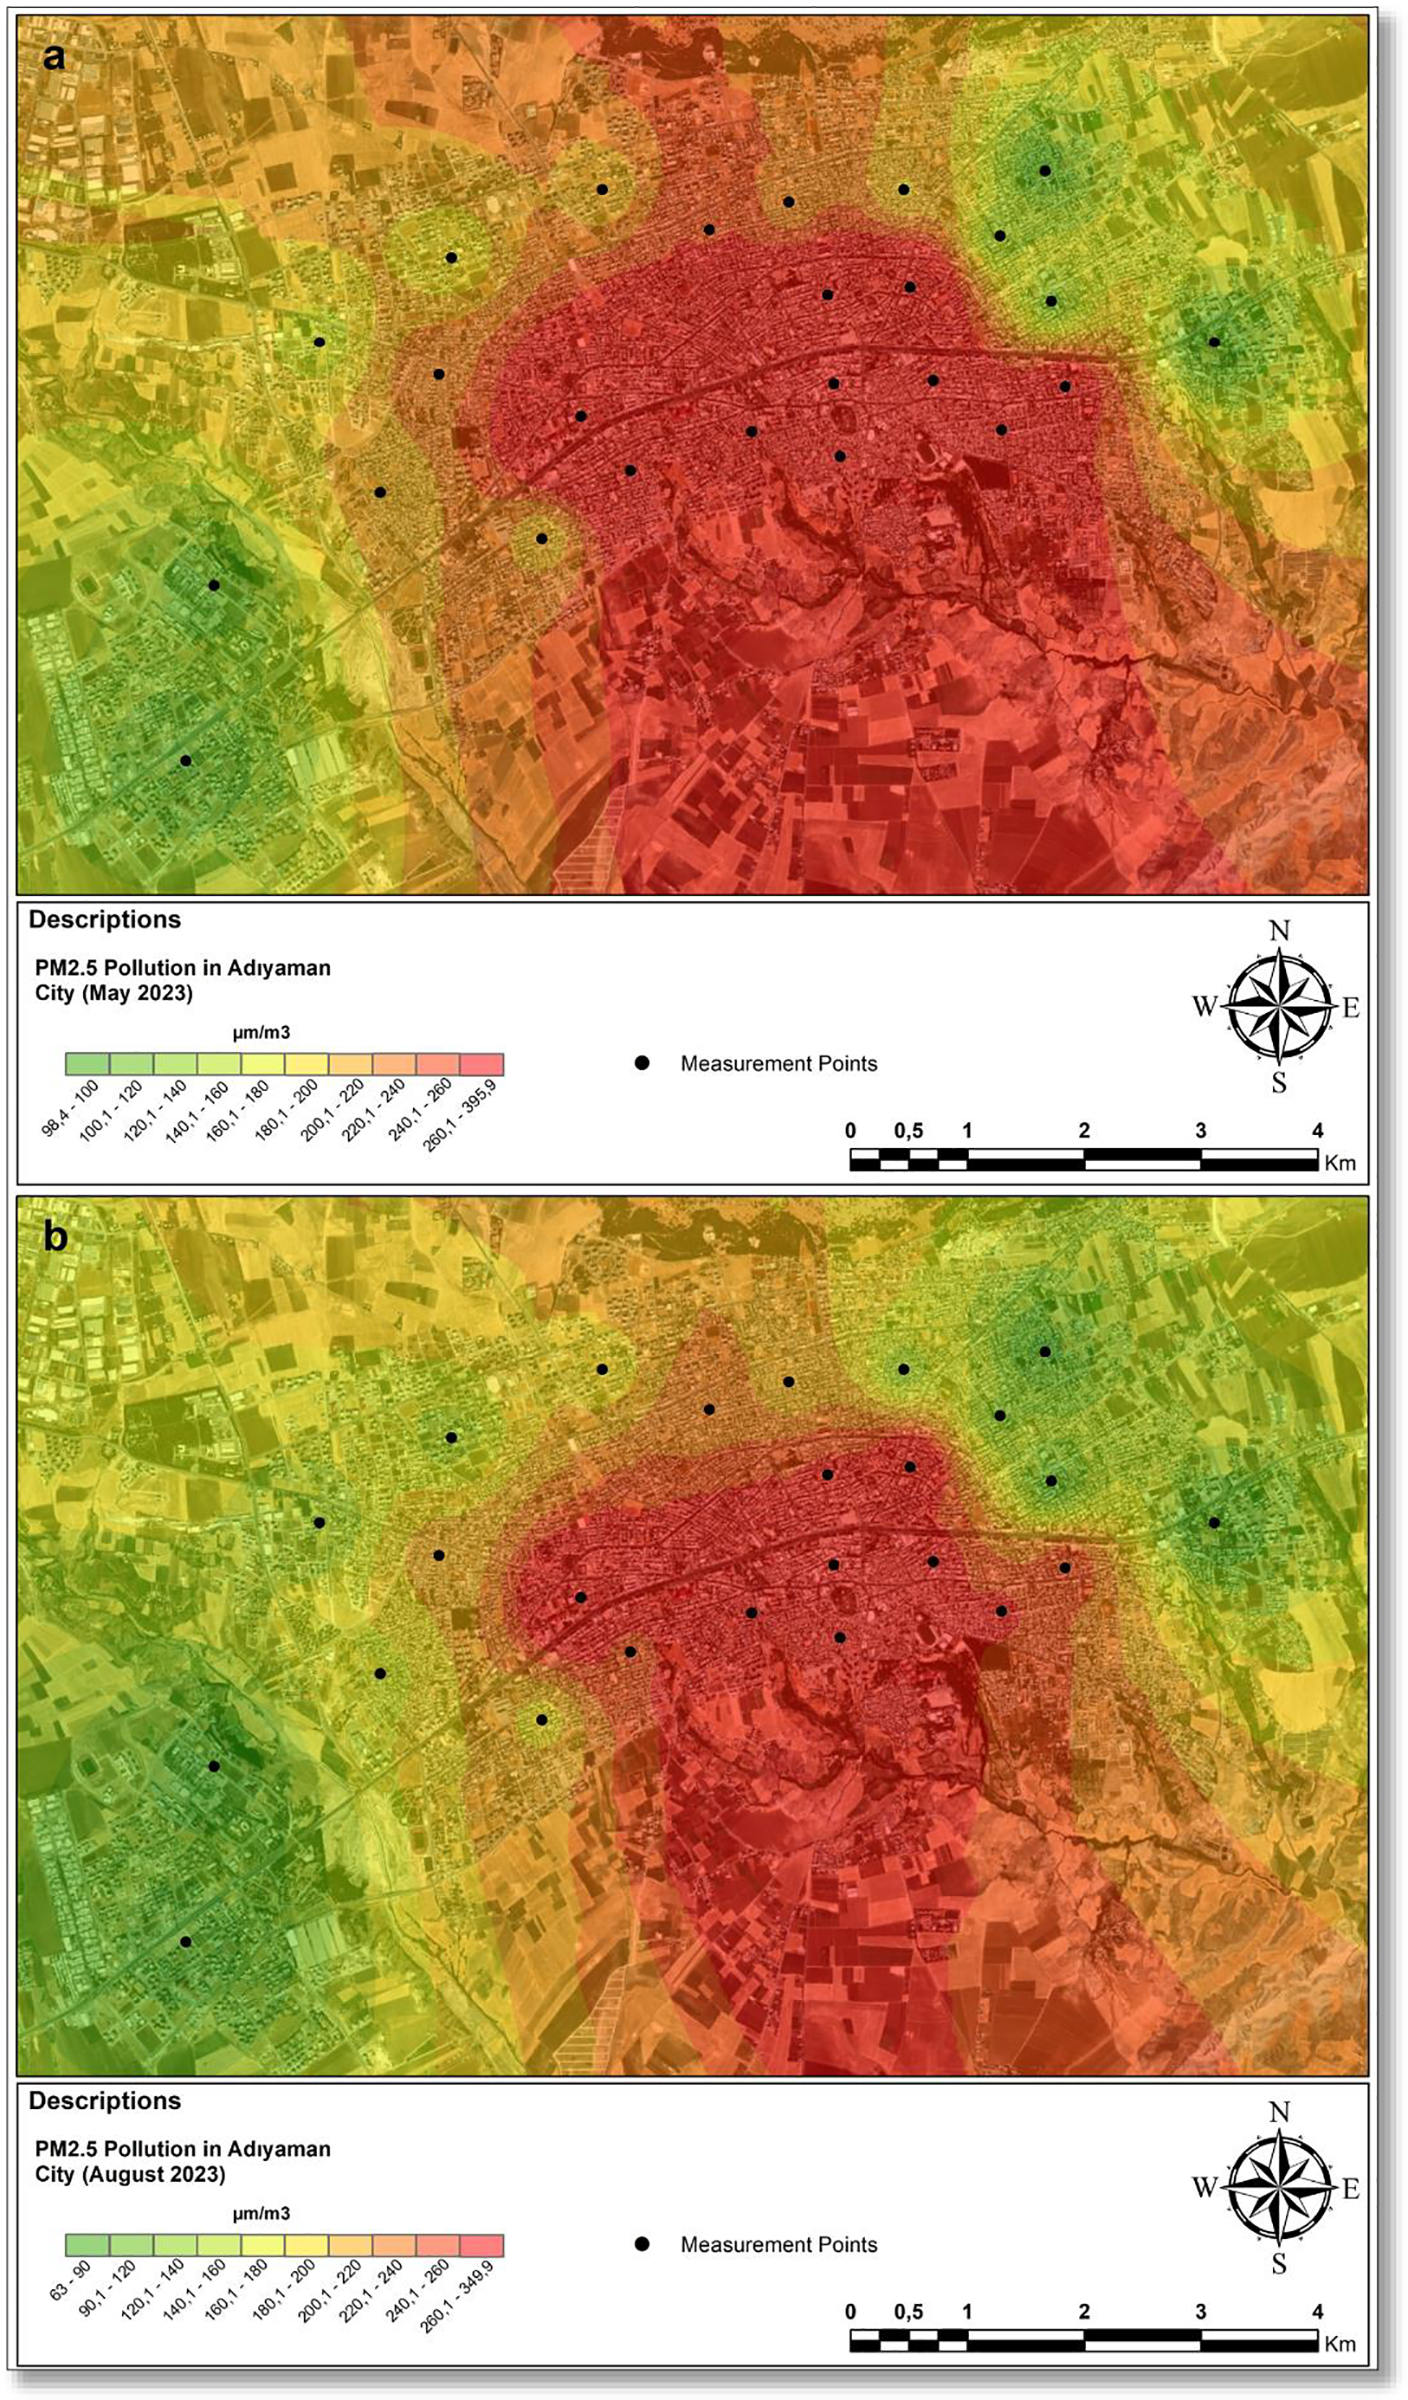
Figure 2: Distribution of the PM2.5 pollution that emerged after the earthquake in Adiyaman City (a) May 2023 (b) August 2023
The lowest PM2.5 pollution was measured as 98 µm/m3 in May and 80 µm/m3 in August at the 1st measurement point of the Yesilyurt neighborhood. At the 2nd measurement point of the Altinsehir neighborhood, it was measured as 98 µm/m3 in May and 80 µm/m3 in August. At the 1st measurement point of the Altinsehir neighborhood, 102 µm/m3 was measured in May and 63 µm/m3 in August. At the 1st measurement point of the Yunus Emre neighborhood, which is in areas with low debris removal, 102 µm/m3 was measured in May and 90 µm/m3 in August. In the Siteler neighborhood, 132 µm/m3 was measured in May and 105 µm/m3 in August (Table 3 & Fig. 2).
PM2.5 level in the study area is concentrated in the city center where debris removal is especially dense. There is a significant decrease in PM2.5 levels from the city center to the periphery. Especially in the Barbaros Hayrettin neighborhood, the PM2.5 level is the highest at 396 µm/m3 and in the Altinsehir neighborhood, the PM2.5 level is the lowest with 98 µm/m3 due to the low debris removal. In the study area, it is observed that green absorbs particulate matter pollution in areas where building demolitions and debris removal are high.
When the spatial distribution of PM10 pollution in the study area was examined, the areas with the highest PM10 pollution due to debris removal in the study area were measured as 142 µm/m3 in May and 100 µm/m3 in August in Alitasi neighborhood. At the 1st measurement point of the Sumerevler neighborhood, it was determined as 129 µm/m3 in May and 98 µm/m3 in August. In Barbaros Hayrettin district, it was measured as 125 µm/m3 in May and 106 µm/m3 in August. Debris removal was also carried out quite intensively in the Hocaomer neighborhood. It was determined as 121 µm/m3 in May and 92 µm/m3 in August. At the second measurement point of the Yesilyurt district, it was determined as 104 µm/m3 in May and 82 µm/m3 in August (Table 4, Figs. 3 and 4).
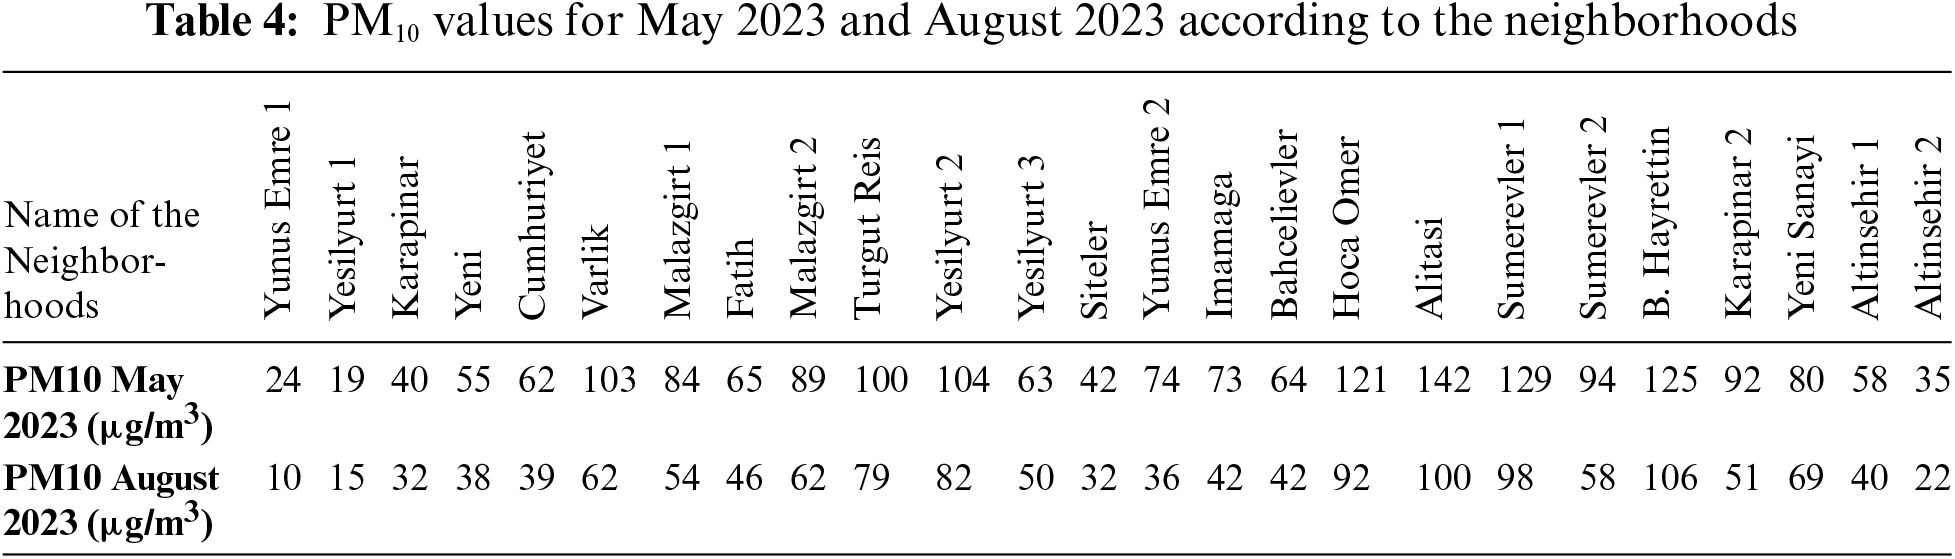
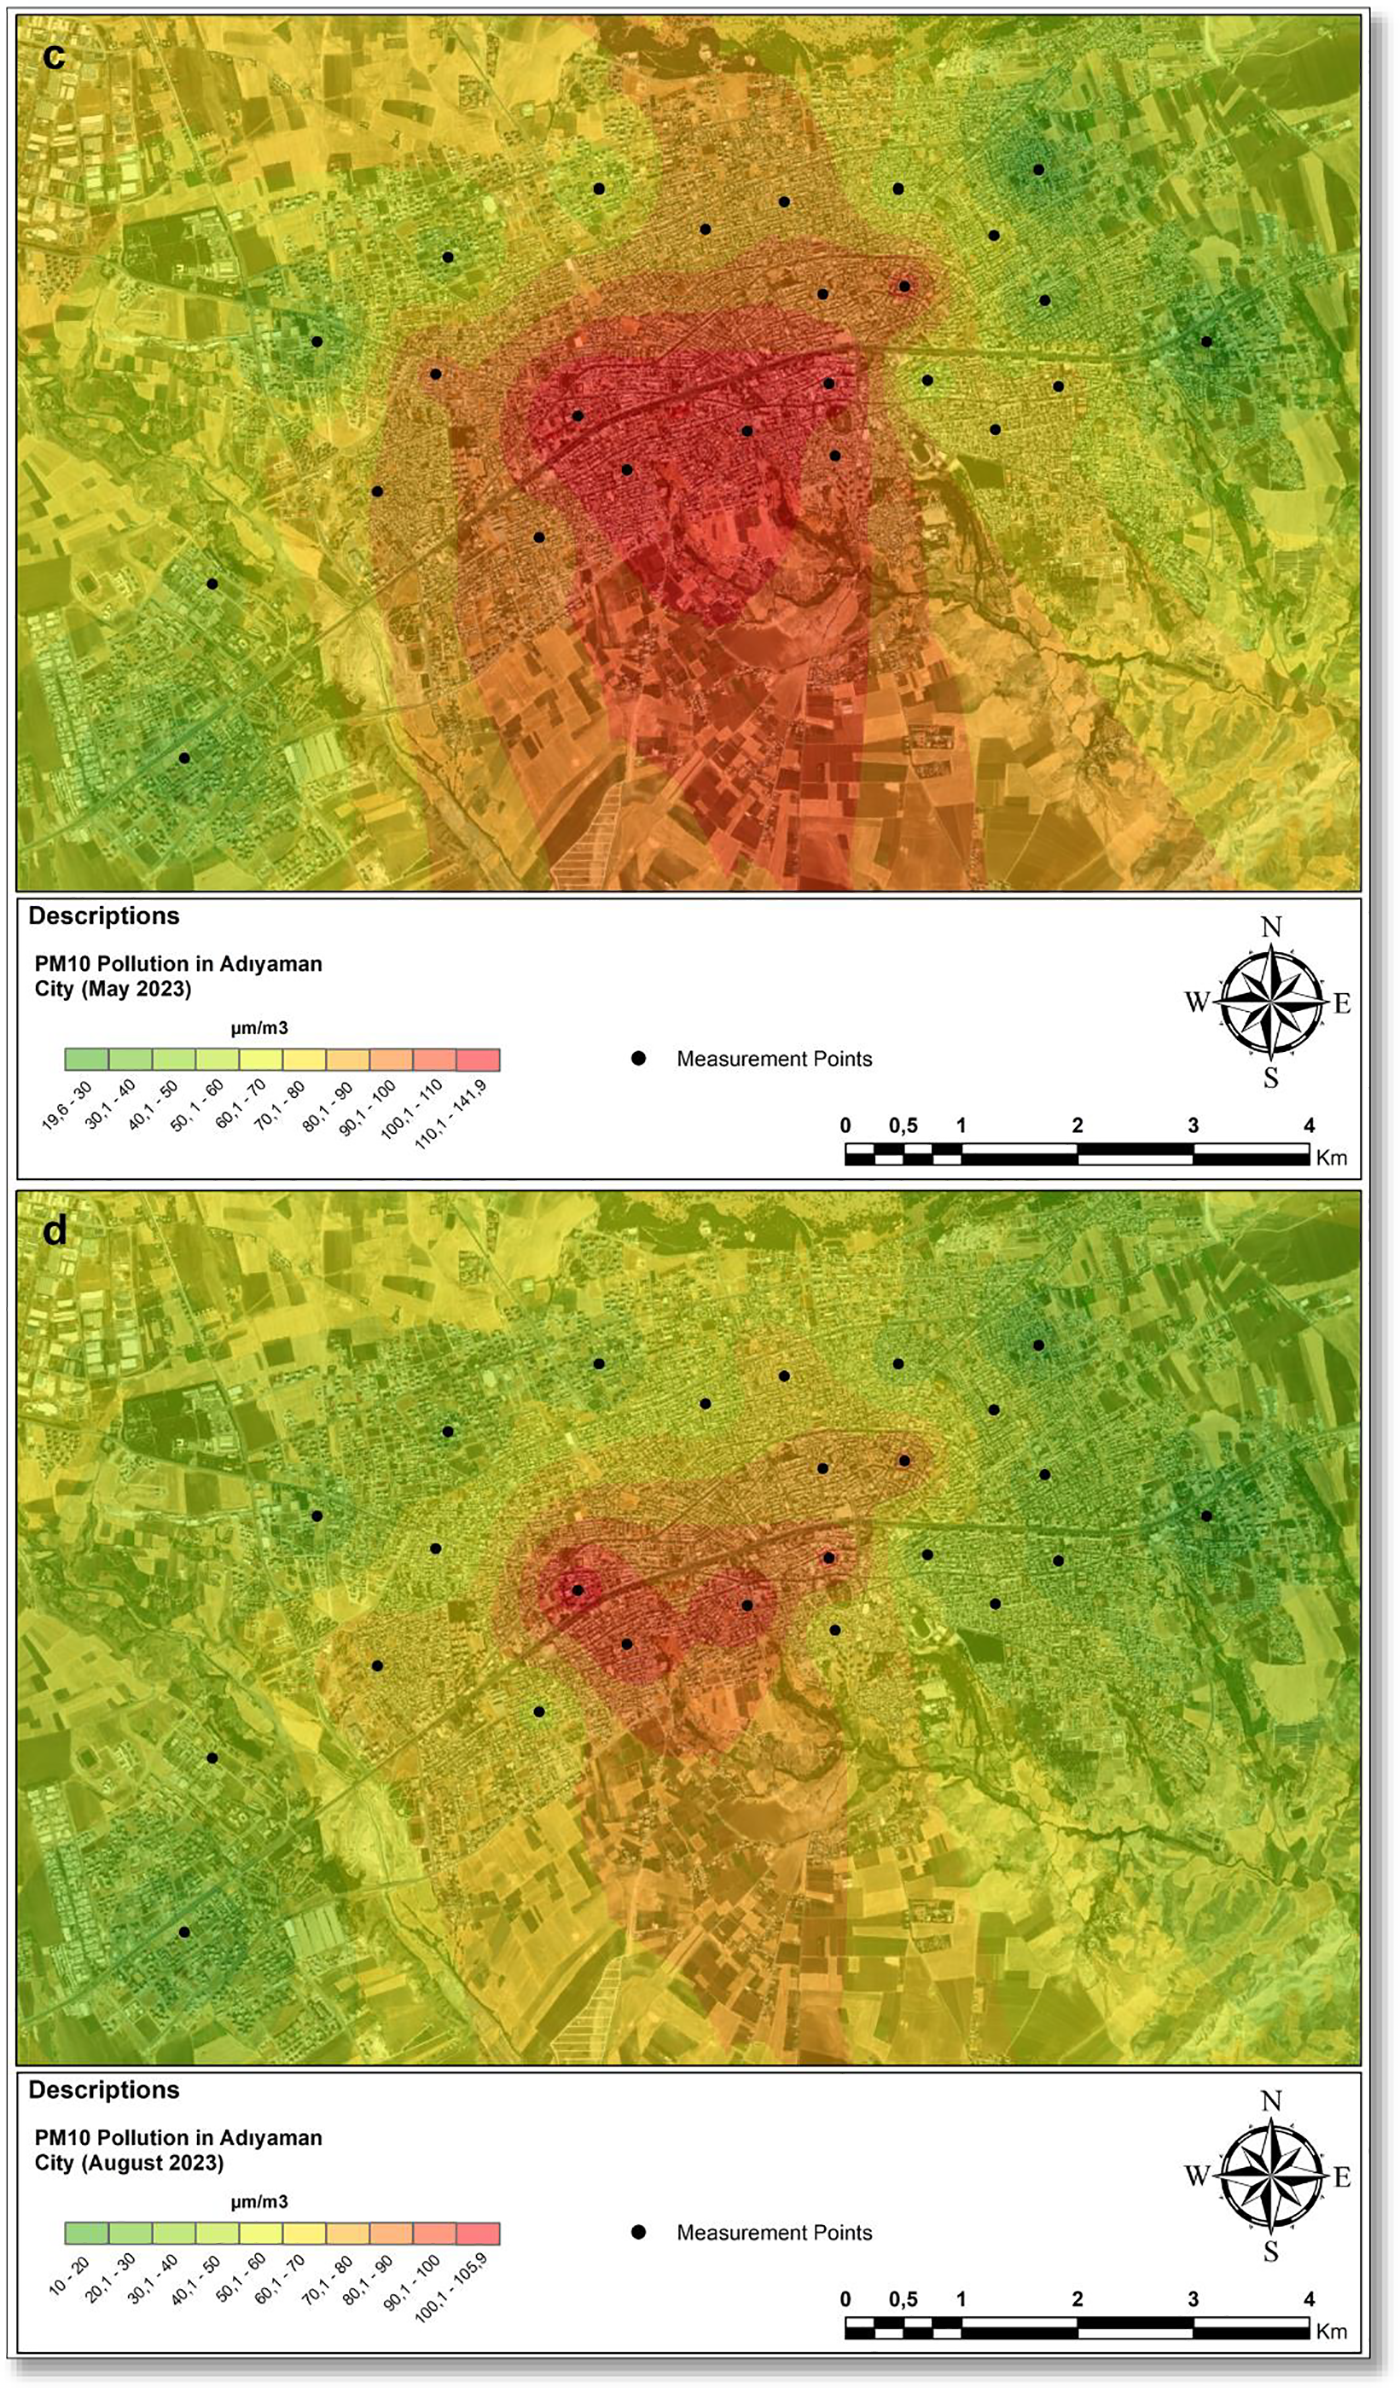
Figure 3: Spatial distribution of the PM10 pollution after the earthquake in Adiyaman City (c) May 2023 (d) August 2023
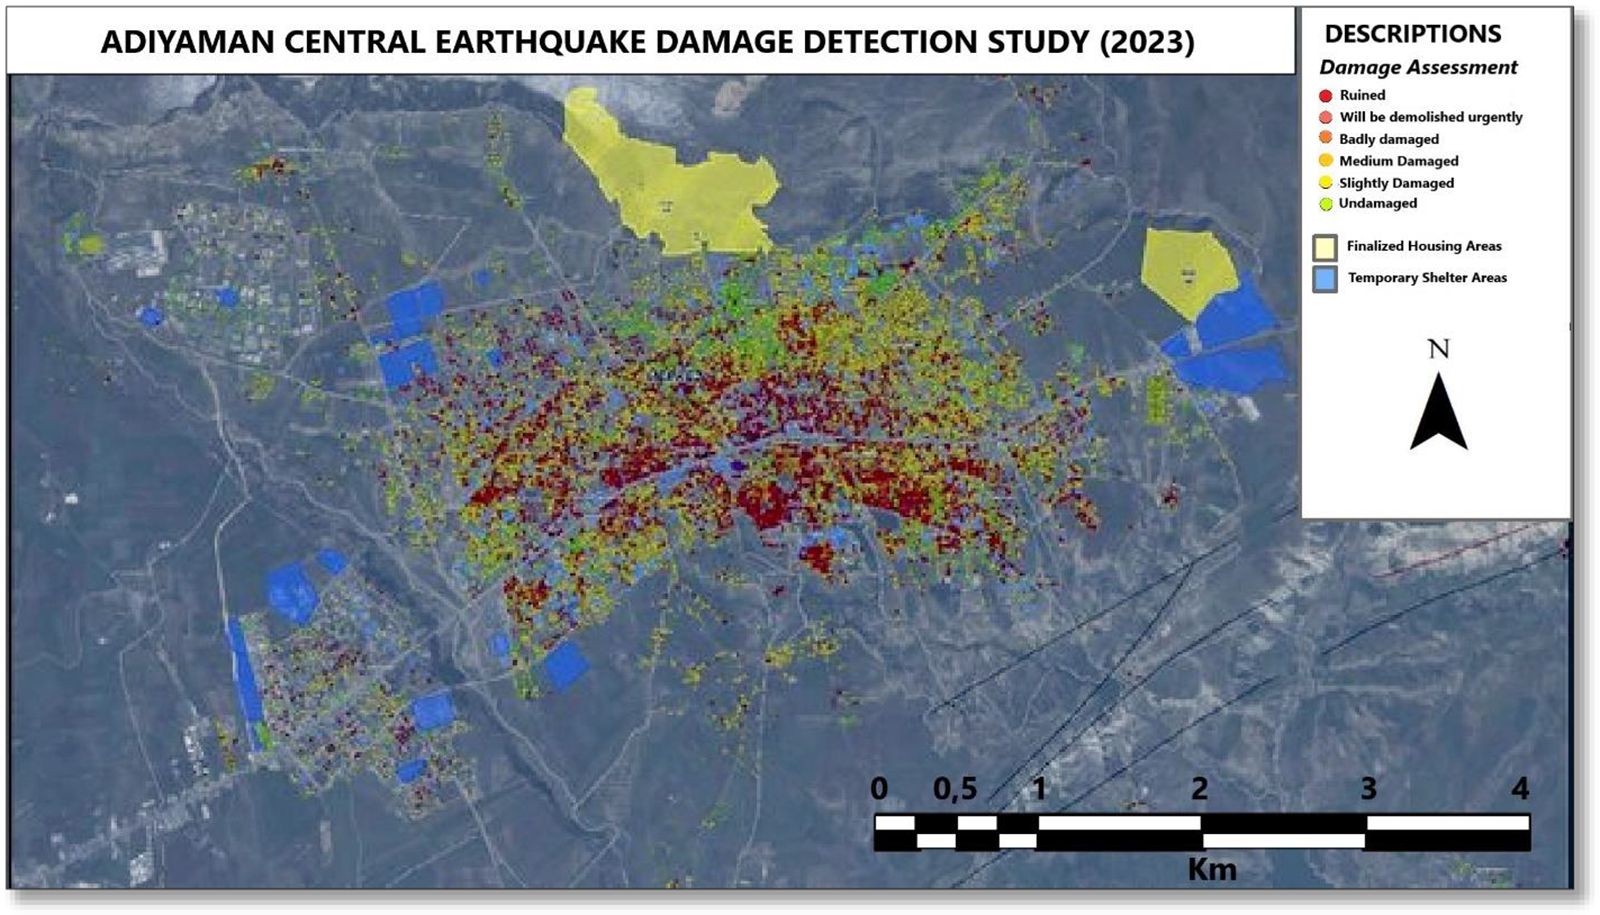
Figure 4: Adiyaman centre earthquake damage assessment map. Source: [24]
In the study area, PM10 pollution was measured as 19 µm/m3 in May and 15 µm/m3 in August at the 1st measurement point of the Yesilyurt neighborhood. At the 1st measurement point of the Yunus Emre neighborhood, it was determined as 24 µm/m3 in May and 10 µm/m3 in August. At the first measurement point of the Altinsehir neighborhood, it was measured as 35 µm/m3 in May and 22 µm/m3 in August. In Karapinar neighborhood, it was measured as 40 µm/m3 in May and32 µm/m3 in August, while in Siteler neighborhood, it was measured as 42 µm/m3 in May and32 µm/m3 in August.
It can be seen that the PM10 levels are distributed similarly to PM2.5 ones in the study area. PM10 pollution was especially concentrated in the city center where debris removal was intense. PM10, which tends to decrease from the city center to the periphery, had the highest levels in the Alitasi Neighborhood and the Barbaros Hayrettin Neighborhood. While the Lowest levels were in the Yunus Emre Neighborhood and the Yesilyurt Neighborhood (Figs. 3 and 4).
Per the result of the findings in the majority of the city, it was observed that the particulate matter level that emerged during the removal of debris from the 6th of February Earthquake was well above the limits of both the World Health Organization and Turkey’s National Values. According to the findings, particular matter pollution has had significant effects on the health of people living in the region.
When the studies on particulate matter-induced air pollution during post-earthquake debris removal are examined, it is seen that the studies support each other. For example, after the Duzce earthquakes on the 7th of August and the 12th of November, it was determined that critical problems emerged in the ecosystems on the environmental scale and the structural context after the earthquake [30]. In this study, it was emphasized that after the Kahramanmaras Earthquake, there was a significant level of particulate matter released into the environment that could cause serious health problems in the ecosystem and human health, especially in Adiyaman proper both during the earthquakes and after the earthquakes. After the 17th of August 1999 earthquake that recently occurred in Turkey, it was determined that with the destruction, heavy metal pollution that occurred after the earthquake was dispersed into the environment in the form of fine elements and precipitated on the streets and avenues [23]. It has been emphasized that with the destructions experienced after the earthquakes, a large amount of particulate matter and heavy metals or pollutants are spread out and may cause permanent or temporary health problems on human health and environmental scale. It was determined that after the Great Hanshin Earthquake, both debris removal processes and construction dispersed a large amount of concrete dust into the environment [31]. It has been stated by other studies that demolition and construction are of primary importance to human health and to the environment.
Considering the similar findings of parallel studies, the effects of earthquakes on the environment and human health are discussed, and the relationship between earthquakes and air pollution based on particulate matter is emphasized. With such studies made, the effects of earthquakes on the ecosystem and the impact level of post-earthquake destruction and construction processes on human health can be amendable (Figs. 4 and 5).
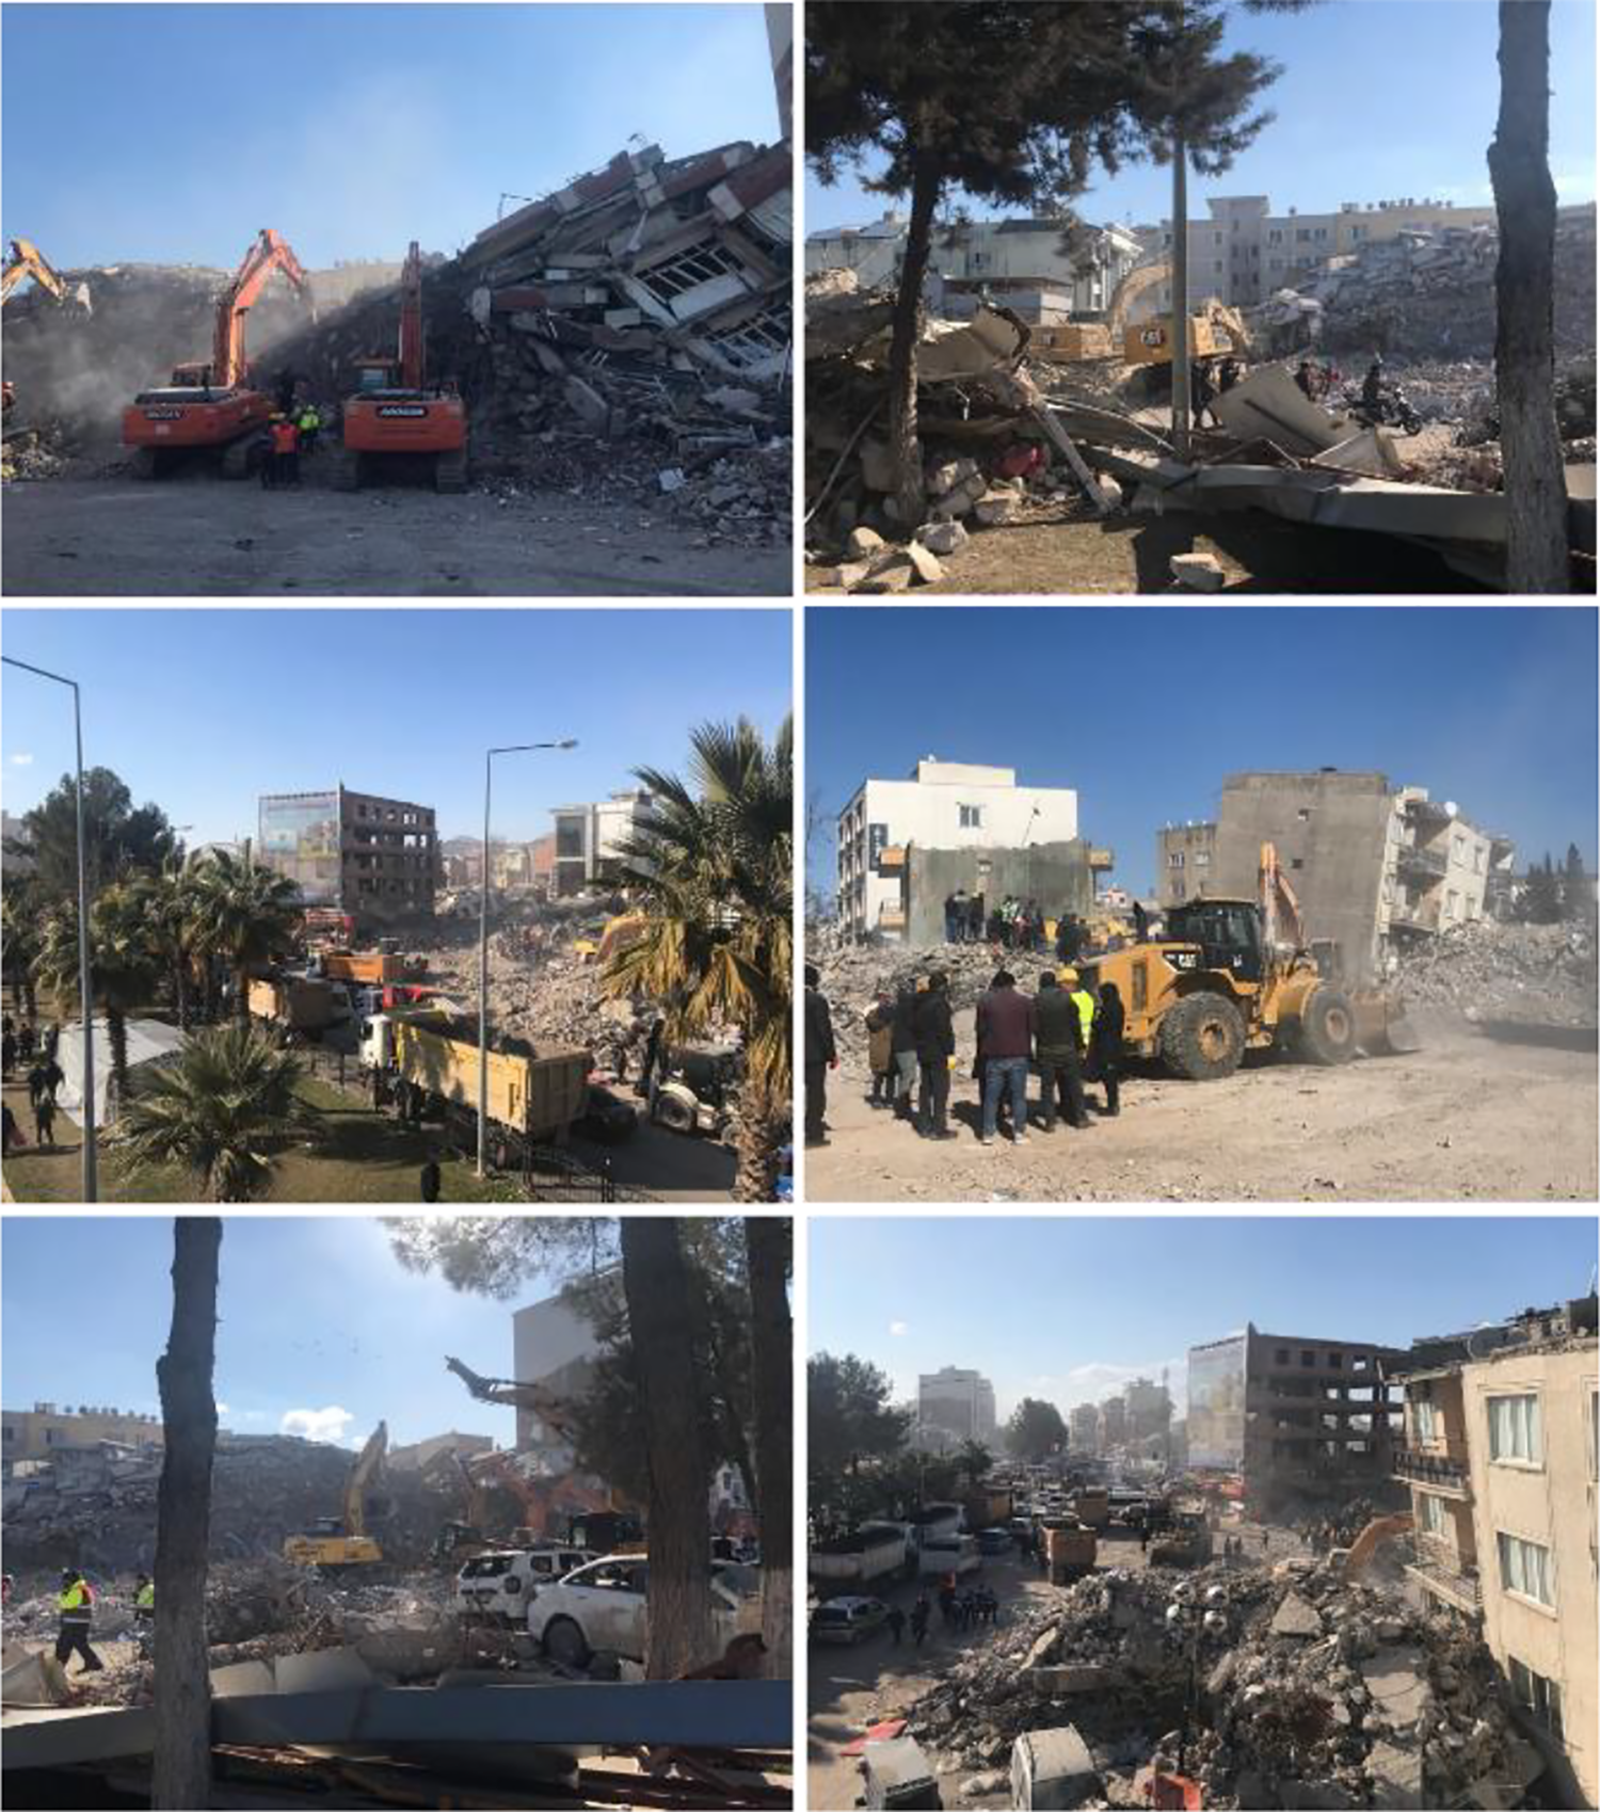
Figure 5: Debris removal after the earthquake in the Adiyaman City
5 Conclusion and Recommendation
This study aimed to determine the level of particulate matter experienced during debris removal processes after the earthquake in Adiyaman City proper. For this purpose, at 25 different points, measurements were carried out in May and August and the levels of two main pollutants PM2.5 and PM10, were evaluated. In the study area, PM2.5 values were found to be highest in May with 396 µm/m3 and in August with 350 µm/m3. PM2.5 values were found to be lowest in May at 98 µm/m3 and in August at 63 µm/m3. As for PM10 pollutants, the highest level was at 142 µm/m3 in May and 106 µm/m3 in August, while the lowest level was at 19 and 10 µm/m3 in August.
When evaluated on the scale of neighborhoods, it can be seen that particulate matter pollution is at its higher levels in Barbaros Hayrettin, Hoca Omer, Varlik, Yesilyurt, Alitasi and Sumerevler neighborhoods. Pollution levels remain high in the city proper and southern parts of the city. The pollution level decreases from the city proper to its periphery. In the measurements made in the green areas and their surroundings in the study area, it can be seen that the pollution level is relatively lower than in other areas. When the limits of the World Health Organization and Turkey’s national values are evaluated, serious health problems might arise for the people living in the region as a result of being exposed to particulate matter pollution, even for a shorter period. For this very reason, the level of particulate matter released during the debris removal processes should be minimized. For people to protect themselves from particulate matter released into the environment during debris removal processes, they primarily must be made aware and they must be ensured to take the necessary protective measures (Such as masks, education, etc.). To prevent dust particles from spreading too much into the environment during debris removal processes, water should be pulverized to ensure that they precipitate in the area where they are originally located. In addition to this, the release of particulate matter into the environment should be minimized by surrounding the debris with plastic covers during debris removal processes. After the mentioned earthquake, a lot of data got lost at the air quality measurement station located in Adiyaman City proper. To minimize the data loss, mobile air quality measurement stations need to be established to determine the exposure of the local populace to pollutants, primarily particulate matter. The level of particulate matter pollution during debris removal may also occur during the recycling of demolished buildings. Therefore, measures should be taken to prevent the spread of particulate matter into the environment both during debris removal and on-site recycling.
Acknowledgement: The author would like to thank the editors and reviewers for their review and recommendations.
Funding Statement: The author received no specific funding for this study.
Author Contributions: The author confirms the contribution to the paper as follows: Literature review, field research, modelling and analysis, layout and article writing were done by E.V.
Availability of Data and Materials: The author confirms that the data supporting the findings of this study are available within the article and supplementary material.
Conflicts of Interest: The author declares that they have no conflicts of interest to report regarding the present study.
References
1. Kaplan G, Avdan ZY. Space-borne air pollution observation from sentinel-5p tropomi: relationship between pollutants, geographical and demographic data. Int J Eng Geosci. 2020;5(3):130–7. [Google Scholar]
2. Duan Y, Di B, Ustin SL, Xu C, Xie Q, Wu S, et al. Changes in ecosystem services in a montane landscape impacted by major earthquakes: a case study in Wenchuan Earthquake-affected area, China. Ecol Indic. 2021;126(5):107683. [Google Scholar]
3. Vural E. Investigation of experienced air pollution on selected pollutants scale in Kırıkkale City (2018–2019). Kastamonu Univ J Eng Sci. 2020;6(1):41–50. [Google Scholar]
4. Vural E. Air quality change related to particulate matter in some selected green areas in Şanlıurfa. Kastamonu Univ J Eng Sci. 2021;7(1):19–26. [Google Scholar]
5. Murakami A, Sasaki H, Pascapurnama DN, Egawa S. Noncommunicable diseases after the Great East Japan earthquake: systematic review 2011–2016. Disaster Med Public Health Preparedness. 2018;12(3):396–407. [Google Scholar]
6. Grantz DA, Garner JHB, Johnson DW. Ecological effects of particulate matter. Environ Int. 2003;29:213–39. [Google Scholar] [PubMed]
7. Kim KH, Kabir E, Kabir S. A review on the human health impact of airbone particulate matter. Environ Int. 2015;74:136–43. [Google Scholar] [PubMed]
8. Abualqumboz MS, Mohammed NI, Malakahmad A, Nazif AN. Investigating indoor concentrations of pm 10 in an underground loading dock in Malaysia. Air Qual Atmos Health. 2017;10(2):147–59. doi: 10.1007/s11869-016-0413-4. [Google Scholar] [CrossRef]
9. Begum BA, Biswas SK, Hopke PK. Assessment of trends and present ambient concentrations of PM2.5 and PM10 in Dhaka, Bangladesh. Air Qual Atmos Health. 2008;1(3):125–33. doi: 10.1007/s11869-008-0018-7. [Google Scholar] [CrossRef]
10. Deary ME, Bainbridge SJ, Kerr A, McAllister A, Shrimpton T. Practicalities of mapping PM10 and PM2.5 concentrations on city-wide scales using a portable particulate monitor. Air Qual Atmos Health. 2016;9(8):923–30. doi: 10.1007/s11869-016-0394-3. [Google Scholar] [PubMed] [CrossRef]
11. Sevik H, Özel HB, Çetin M, Özel HU, Erdem T. Determination of changes in heavy metal accumulation depending on plant species, plant organism, and traffic density in some landscape plants. Air Qual Atmos Health. 2019;12(2):189–95. doi: 10.1007/s11869-018-0641-x. [Google Scholar] [CrossRef]
12. Bayram H, Rastgeldi Doğan T, Şahin Ü.A, Akdis CA. Environmental and health hazards by massive earthquakes. Allerg. 2023;78:2081–4. [Google Scholar]
13. Sarı N., Adıguzel F. Determining temporal and spatial changes in air quality in the City of Nevşehir. Adv GIS. 2023;3(2):68–76. [Google Scholar]
14. Mohapatra K, Biswal SK. Effect of particulate matter (PM) on plants, climate, ecosystem and human health. Int J Adv Technol Eng Sci. 2014;2(4):118–29. [Google Scholar]
15. Valanvanidis A, Fiotakis K, Vlachogianni T. Airbone particulate matter and human health: toxicological assessment and importance of size and composition of particles for oxidative damage and carcinogenic mechanisms. J Environ Sci Health C. 2008;26(4):339–62. [Google Scholar]
16. Odum EP. The strategy of ecosystem development: an understanding of ecological succession provides a basis for resolving man’s conflict with nature. Sci. 1969;164:262–70. [Google Scholar]
17. Cohen AJ, Brauer M, Burnett R, Anderson HR, Frostad J, Estep K, et al. Estimates and 25-year trends of the global burden of disease attributable to ambient air pollution: an analysis of data from the global burden of diseases study 2015. Lancet. 2017;389(10082):1907–18. doi: 10.1016/S0140-6736(17)30505-6. [Google Scholar] [PubMed] [CrossRef]
18. Nielsen OR, Antonsen S, Agerbo E, Hvidtfeldt UA, Geels C, Frohn LM, et al. PM2.5 air pollution components and mortality in Denmark. Environ Int. 2023;171(6):107685. doi: 10.1016/j.envint.2022.107685. [Google Scholar] [PubMed] [CrossRef]
19. Elsunousi AA, Şevik H, Çetin M, Özel HB, Özel HU. Periodical and regional change of particulate matter and CO2 concentration in Misurata. Environ Monit Assess. 2021;193:1–15. [Google Scholar]
20. Grzędzicka E. Is the existing urban greenery enough to cope with current concentrations of PM2.5, PM10 and CO2. Atmos Pollut Res. 2019;10(1):219–33. [Google Scholar]
21. WHO. National air quality standards. Available from: https://whoairquality.shinyapps.io/AirQualityStandards/. [Accessed 2023]. [Google Scholar]
22. Ministry of Environment. Urbanization and climate change, permanent monitoring center. CMC Data Bank. E.T. 10-08-2023. Available from: https://sim.csb.gov.tr/intro/uhkia. [Accessed 2023]. [Google Scholar]
23. Dündar MŞ., Pala MF. 17 Ağustos 1999 depremi sonrası Adapazarı cadde tozlarında ağır metal kirliliği. Sakarya Univ J Sci. 2002;6(3):63–8 (In Turkish). [Google Scholar]
24. Presidency of the Republic of Turkey. 2023 Kahramanmaraş and Hatay earthquakes report. Available from: https://www.sbb.gov.tr/wp-content/uploads/2023/03/2023-Kahramanmaras-and-Hatay-Earthquakes-Report.pdf. [Accessed 2023]. [Google Scholar]
25. Turkstat. 2021 Census report. Available from: https://biruni.tuik.gov.tr/medas/?kn=130&locale=tr. [Accessed 2023]. [Google Scholar]
26. Harrison RM, Perry R. Handbook of air pollution analysis. 2nd ed. USA: Springer Netherlands; 1986. [Google Scholar]
27. Zhang R, Liu C, Zhou G, Sun J, Liu N, Hsu P, et al. Morphology and property investigation of primary particulate matter particles from different sources. Nano Res. 2018;11(6):3182–92. [Google Scholar]
28. Chen FW, Liu CW. Estimation of the spatial rainfall distribution using inverse distance weighting (IDW) in the middle of Taiwan. Paddy Water Environ. 2012;10(3):209–22. doi: 10.1007/s10333-012-0319-1. [Google Scholar] [CrossRef]
29. Lu GY, Wong DW. An adaptive inverse-distance weighting spatial interpolation technique. Comput Geosci. 2008;34(9):1044–55. [Google Scholar]
30. Taş M, Taş N, Payan F, Elmacı A. Take charge of the building and environmental damages to appear in earthquakes of the August 17, İzmit and the November 12, Düzce. Uludağ Univ J Faculty Eng. 2000;6(1):83–8 (In Turkish). [Google Scholar]
31. Gotoh T, Nishimura T, Nakata M, Nakaguchi Y, Hiraki K. Air pollution by concrete dust from the Great Hanshin Earthquake. J Environ Qual. 2002;31(3):718–23. [Google Scholar] [PubMed]
Cite This Article
 Copyright © 2024 The Author(s). Published by Tech Science Press.
This work is licensed under a Creative Commons Attribution 4.0 International License , which permits unrestricted use, distribution, and reproduction in any medium, provided the original work is properly cited.
 Downloads
 Citation Tools