
 Submit a Paper
 Propose a Special lssue
 Open Access
ARTICLE

Analysis of Color Landscape Characteristics in “Beautiful Village” of China Based on 3D Real Scene Models
1 Reading College, Nanjing University of Information Science and Technology, Nanjing, 210044, China
2 Waterways Department, Changjiang Wuhu Waterway Bureau, Wuhu, 241000, China
3 School of Geographical Sciences, Nanjing University of Information Science and Technology, Nanjing, 210044, China
4 Geographical Information and Tourism Collage, Chuzhou University, Chuzhou, 239000, China
* Corresponding Author: Wen Dai. Email:
(This article belongs to the Special Issue: Progress, Challenges, and Opportunities in GIS 3D Modeling and UAV Remote Sensing)
Revue Internationale de Géomatique 2024, 33, 93-109. https://doi.org/10.32604/rig.2024.050273
Received 01 February 2024; Accepted 12 March 2024; Issue published 22 April 2024
 View Full Text
 Download PDF
Abstract
Color, as a significant element of village landscapes, serves various functions such as enhancing aesthetic appeal and attractiveness, conveying emotions and cultural values. To explore the three-dimensional spatial characteristics of color landscapes in beautiful villages, this study conducted a comparative experiment involving eight provincial-level beautiful villages and eight ordinary villages in Jinzhai County. Landscape pattern indices were used to analyze the color landscape patterns on the facades of these villages, complemented by a quantitative analysis of color attributes using the Munsell color system. The results indicate that (1) Natural landscape colors in beautiful villages are primarily concentrated in the yellow-red to green-yellow interval, while those in ordinary villages are widely distributed in the red to blue-green interval. Artificial landscape colors in beautiful villages are mainly characterized by medium value, with chroma concentrated in the low chroma range. (2) The proportion of color areas for forests, grasslands, and building walls in beautiful villages is higher by 14.76%, 2.17%, and 5.16%, respectively, compared to ordinary villages. However, the proportion of yellow exposed areas in ordinary villages is more than twice that of beautiful villages. (3) The Landscape Shape Index for forests, grasslands, and buildings in beautiful villages is 5.23, 8.01, and 8.19, respectively, indicating a higher irregularity in color patches. (4) Ordinary villages exhibit a higher Shannon’s diversity index, indicating a more complex distribution of colors, whereas beautiful villages demonstrate a higher number of connected dominant patches. This study can provide a scientific basis for village color planning and layout.Keywords
Rural beautification is a key component of the rural revitalization strategy, and the quality of the rural landscape serves as a tangible outcome of rural beautification efforts. Among the various elements of village landscapes, color represents one of the most influential sensory components and a critical criterion for assessing the quality of village landscapes [1]. At present, research on village colors can be broadly classified into two distinct levels: macro and micro. At the macro level, the focus is on studying the village as a whole and investigating the characteristics of colors in both the village itself and its surrounding natural environment. It mainly aims to propose measures for optimizing [2], updating, and preserving the colors of the village [3]. From a micro perspective, the focus is on the study of the color characteristics of structures within the villages. Considering disciplines such as color theory and color geography, the color preferences in the selection of building materials [4] within different natural environments [5], historical contexts [6], and regional architectural traditions were analyzed. In the past few decades, with the advancement of technologies such as 3S (remote sensing, geographic information systems (GIS), and global positioning systems), the analysis based on two-dimensional landscape patterns has significantly improved, leveraging data sources such as aerial photogrammetry [7] and high-resolution satellite remote sensing [8]. For instance, the study of color landscape patterns in villages and campuses has been enhanced through the utilization of unmanned aerial vehicles (UVA) to capture a top-down perspective, also known as the fifth facade [9]. For village color landscapes, despite the increased depth and breadth of research, most studies have predominantly focused on studying color characteristics from a two-dimensional perspective. However, in the real world, the spatial form and organizational relationships of landscapes inevitably evolve towards three-dimensional structures due to the influence of terrain and human factors [10]. Furthermore, when appreciating and evaluating the village landscapes, people also often consider them from a three-dimensional elevation viewpoint. Therefore, to fully understand the structure and function of village color landscapes, it is necessary to enhance the analysis of vertical elevations within landscape patterns. It allows for a more effective study of the structural characteristics of village color landscapes and their corresponding village elements.
3D real scene model refers to a three-dimensional model based on real-world scenes. It accurately replicates the appearance and structure of the actual environment by utilizing computer-generated images or scanning and modeling objects from the real world. Oblique aerial photography technology provides an efficient, objective, and large-scale approach to express the real three-dimensional world [11]. By equipping multiple sensors on the same UVA, it can capture multiple tilted images of the same object from different angles at the same exposure point, thus realistically reflecting the objective conditions of the Earth’s surface. Furthermore, the advanced POS (Position and Orientation System) system carried on the UAV empowers the 3D model with precise geospatial information [12]. Consequently, the 3D models constructed using oblique aerial photography technology possess not only the characteristic of reconstructing ground elements comprehensively but also ensure more accurate model positioning relationships [13]. In the context of village landscapes, the establishment of 3D real scene models not only provides a visual and comprehensive representation of the color landscape of the villages but also establishes connections between villages and their surrounding environments. Therefore, this study extracts the color information of the villages’ façade based on the 3D real scene models. By studying the spatial patterns of village color landscapes from a three-dimensional façade perspective, the characteristics of the color structure and functionality of beautiful villages were analyzed. This study aims to provide suggestions and references for the planning and transformation of villages in order to contribute to the development of rural beautification.
Jinzhai County, a part of Lu’an City in Anhui Province, is located on the western border and in the heart of the Dabie Mountains (Fig. 1). Jinzhai County has diverse natural landscapes, numerous residential areas, and rich village scenery. In recent years, in response to the national call for “improving the living quality of rural residents and narrowing the urban-rural gap,” Jinzhai County has actively promoted village beautification and improved the rural ecological environment. Through measures such as large-scale rectification and ecological restoration, by early 2022, a total of 192 villages in Jinzhai County had been awarded the title of “Beautiful Rural Center Village” by the municipal government. This study focuses on a comparative experiment between eight villages in Jinzhai County that have received the provincial-level “Beautiful Rural Center Village” title (referred to as “beautiful villages”) and eight ordinary villages (without any title) as the research subjects. The research primarily focuses on comparing the differences between the two types of villages in terms of color patterns and attributes.

Figure 1: Geographical location of Jinzhai County
The data collection for these 16 villages was conducted using the DJI Phantom 4 RTK drone, which is equipped with oblique aerial photography capabilities. The UAV flights were conducted at around 10:00 am to minimize the influence of other natural factors such as lighting conditions. The collected data was processed using Bentley Context Capture modelling software to generate three-dimensional models in OSGB format with an accuracy of better than 4 cm.
3.1 Landscape Color Photo Extract
Traditional research on regional facade colors often relies on camera photography to collect village color information. However, this method is easily limited by the viewpoint position and real-world space, making it challenging to extract color information from arbitrary positions and angles. 3D real scene models of villages can overcome these limitations by providing comprehensive color photographs that accurately capture the spatial relationships of colors. By utilizing the 3D real scene models and adhering to the principles of landscape integrity, along with considering principles of human visual perception, color photographs were extracted along the main village trunk road. The scale of the model was set at 1:200. As the viewpoint height and angle within the model can affect the results of the photo extraction, in order to adhere to the principles stated earlier and control variables, the viewpoint height was set at 50 m.
In theory, higher viewpoint heights and smaller model tilt angles would result in more comprehensive color information retrieval. However, there is a limiting factor in viewpoint adjustment-the presence of flat roofs. When people explore and appreciate villages, changes in viewpoint position and angle do not allow for the observation of the roofs of flat houses. Therefore, this limitation has to be taken into account when adjusting the model height for color photo extraction. Fig. 2 illustrates the contrasting village color landscapes from different perspectives.

Figure 2: Comparison of village landscapes from different perspectives
3.2 Color Attribute Analysis Method
A color system is used to describe each color scientifically and accurately. In this study, the Munsell color system was primarily chosen, which describes colors based on three dimensions: value (V), hue (H), and chroma (C) [14]. Hue in the Munsell color system consists of ten colors formed by the harmonization of five primary colors: red (R), yellow-red (YR), yellow (Y), green-yellow (GY), green (G), green-blue (BG), blue (B), blue-violet (BP), purple (P), purple-red (RP). The value ranges from absolute black (N0) to pure white (N10) and includes eleven levels. Chroma theoretically has no specific upper limit, but the upper limit is around 10 in practice, with higher values indicating higher purity [15]. In this study, a chroma upper limit of 12 was chosen based on the actual color extraction situation. The color attribute values were extracted separately from the beautiful villages and ordinary villages. Then, the H-V and H-C color coordinate systems were established, and the extracted colors were classified based on natural landscape and artificial landscape.
3.3 Color Landscape Pattern Analysis Method
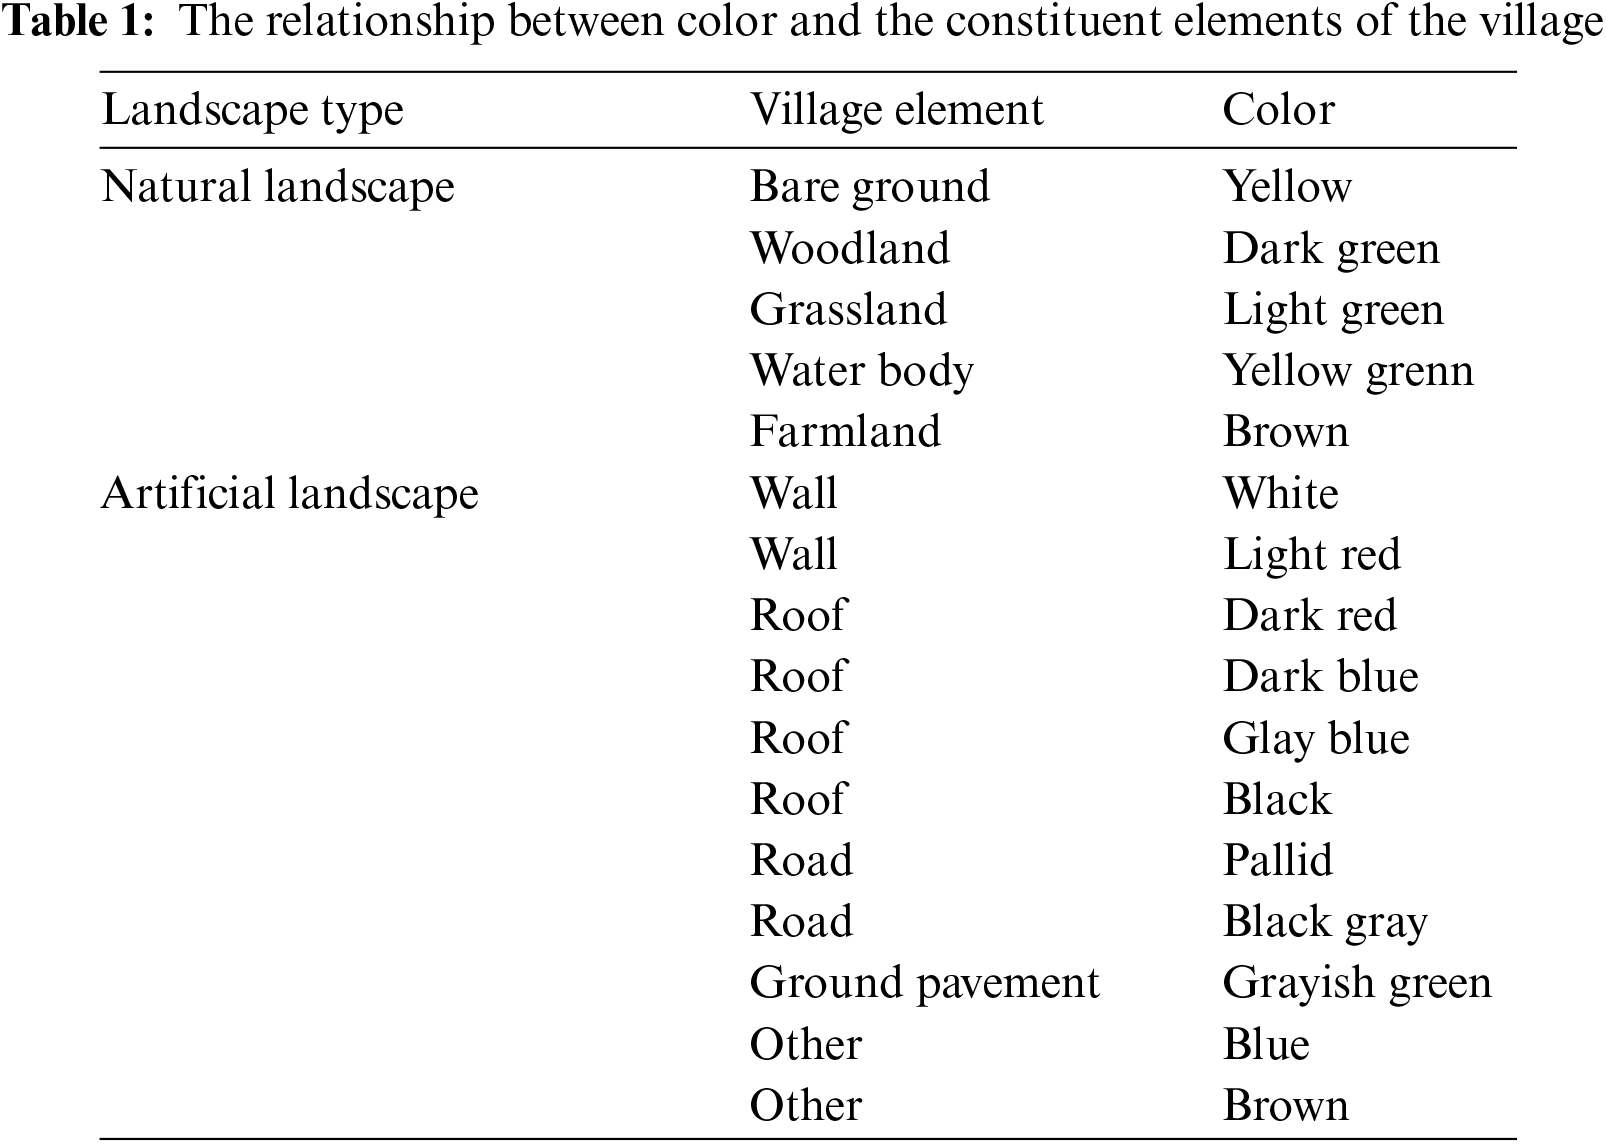
Various colors not only constitute the components of a village but also represent the architectural and landscape elements that make up the village. Different colors have a certain corresponding relationship with rural elements. By selecting easily distinguishable color categories from the 3D real scene model and determining the correspondence between colors and rural components, the results are shown in Table 1.
The photos extracted from the 3D real scene models were preprocessed using PhotoShop and Colorimpact. Color categories with pixel areas smaller than 0.1% were ignored. The color information of village landscape photos was vectorized using ArcGIS 10.2 software (Fig. 3) to obtain color patches. The division of patch types was based on color categories and could be corresponded to the components of the village.

Figure 3: Jinzhai County Wufan Village color extraction results
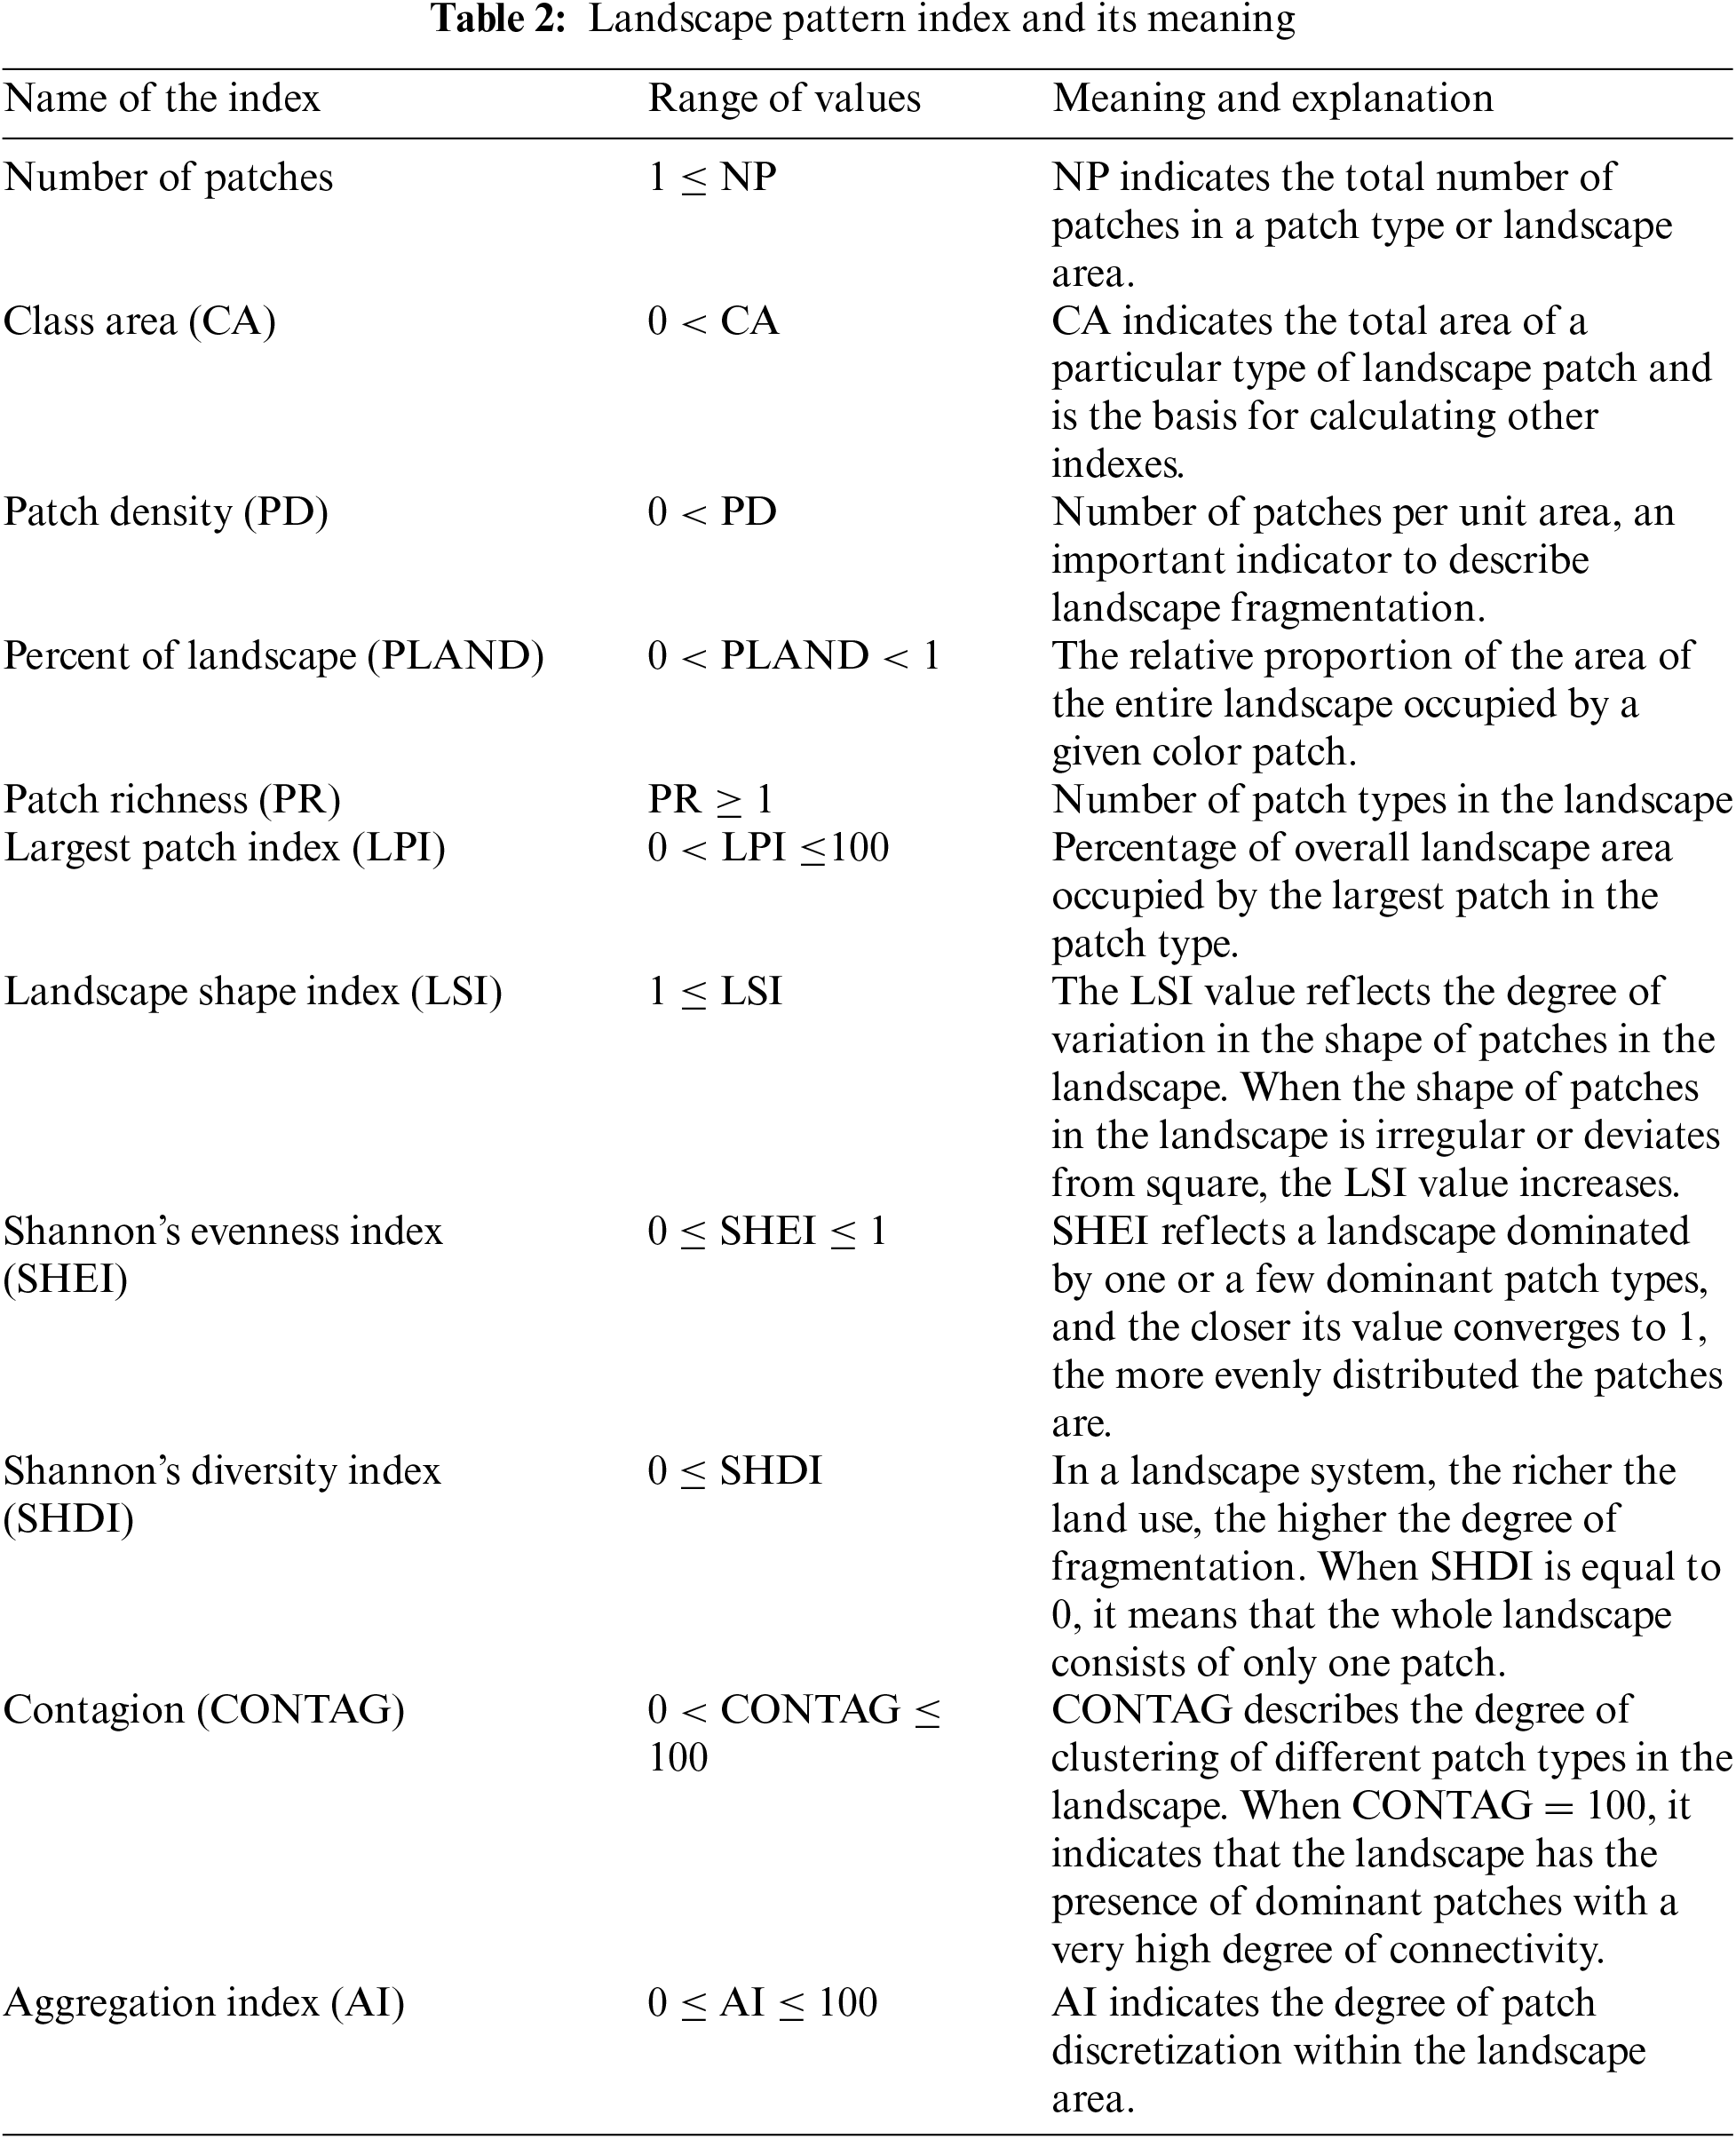
The Fragstats software was employed to calculate the landscape pattern indices of color patches. Based on the village landscape characteristics and previous research findings [16–19], this study selected some landscape indices for analysis, including number of patches (NP), patch density (PD), largest patch index (LPI), landscape shape index (LSI), contagion index (CONTAG), split index (SPLIT), Shannon’s diversity index (SHDI), Shannon’s evenness index (SHEI), patch richness(PR), interspersion and juxtaposition index (IJI), and aggregation index (AI). Table 2 gives the specific meaning of each landscape index. By comprehensively analyzing these landscape pattern indices, insights can be gained into the characteristics of color distribution in village landscapes, such as their spatial structure, connectivity, dispersion, diversity, and uniformity. Additionally, through the correspondence between colors and structural elements within the villages, information regarding the spatial structure, morphological features, boundary complexity, and landscape fragmentation can be obtained. This information is of significant importance for evaluating landscape quality and ecological functionality. I can also provide decision support for landscape planning, ecological restoration, and sustainable development.
4.1 Village Color Attribute Analysis
Quantitative analysis of the two landscape types in villages, namely natural landscape colors and artificial landscape colors, is conducted from the perspective of color attributes. Natural landscape colors include the colors of greenery, agricultural fields, land and water within the village. Artificial landscape colors include the colors of building facades, roofs, ground pavement and roads. The environmental colors of the two village types are statistically compiled, and based on the characteristics of color distribution, the differences in color attributes between beautiful villages and ordinary villages are analyzed at both the natural landscape and artificial landscape levels.
4.1.1 Analysis of Color Attributes in Natural Landscapes
As shown in Fig. 4, in the natural landscape, beautiful villages primarily exhibit color distribution within the YR-GY range, encompassing the yellow-red to yellow-green color spectrums, with a relatively concentrated color distribution. Greenery and water colors are mainly concentrated within the yellow-green range, and soil and agricultural field colors are concentrated within the yellow-red range. On the other hand, ordinary villages are mainly distributed in the R (Red)-BG (Blue-Green) range, with a more dispersed overall distribution. This disparity shows the fact that in beautiful villages, the greenery of the villages is unified and planned, with most of the vegetation consisting of locally adapted green plants. In contrast, in ordinary villages, greenery often lacks unified planning and management, resulting in a variety of naturally grown vegetation types and color variations. Regarding the chroma (C) attribute (Fig. 5), beautiful villages predominantly exhibit medium to low chroma. Ordinary villages are dominated by low chroma with occasional instances of medium chroma. In terms of value (V), beautiful villages primarily feature medium to low value, with high value as a secondary characteristic. The presence of green colors (medium value) in beautiful villages has a positive effect on perception and mood, enhancing the overall comfort of living. The ordinary villages are dominated by medium and high value, and low value is the secondary feature.

Figure 4: Comparison of color hue and value between the two types of villages (Left: Ordinary villages; Right: Beautiful villages)

Figure 5: Comparison of hue and chroma between the two types of villages (Left: Ordinary villages; Right: Beautiful villages)
4.1.2 Analysis of Color Attributes in Artificial Landscapes
In the artificial landscape, beautiful villages show a concentration of color in two distinct areas: B (blue) to P (purple) and R (red) to YR (yellow-red). In contrast, ordinary villages do not display this zoning characteristic. Based on the analysis of the 3D real scene model, beautiful villages in Jinzhai County can be classified into two different types (Fig. 6): “later-built” villages with a predominant white wall and gray tile architectural style, and “previously-built” villages composed of white walls and red tiles, resulting in a noticeable zoning feature. On the other hand, ordinary villages have no obvious zoning characteristics, and the color distribution is mainly concentrated in the range of B (blue) to RP (red-purple). The color distribution within the villages is relatively disorderly, with some villages exhibiting chaotic color transitions in their spatial arrangement, and significant color contrasts between different buildings (Fig. 7). The vibrant and contrasting colors can lead to visual fatigue and discomfort.

Figure 6: Two types of beautiful villages in the model

Figure 7: Examples of ordinary villages
Regarding the chroma (C) of the artificial landscape, beautiful villages predominantly exhibit values near 2. In ordinary villages, the chroma distribution is more dispersed, encompassing a range of high, medium, and low chroma values with no clear clustering patterns. In terms of value (V), the artificial landscape in beautiful villages demonstrates a concentrated distribution, primarily around a value of 6. It is characterized by a predominance of medium value with some variations in high and low value. Conversely, in ordinary villages, the value distribution is more dispersed, with a predominance of medium to high value.
4.2 Analysis of Village Color Pattern
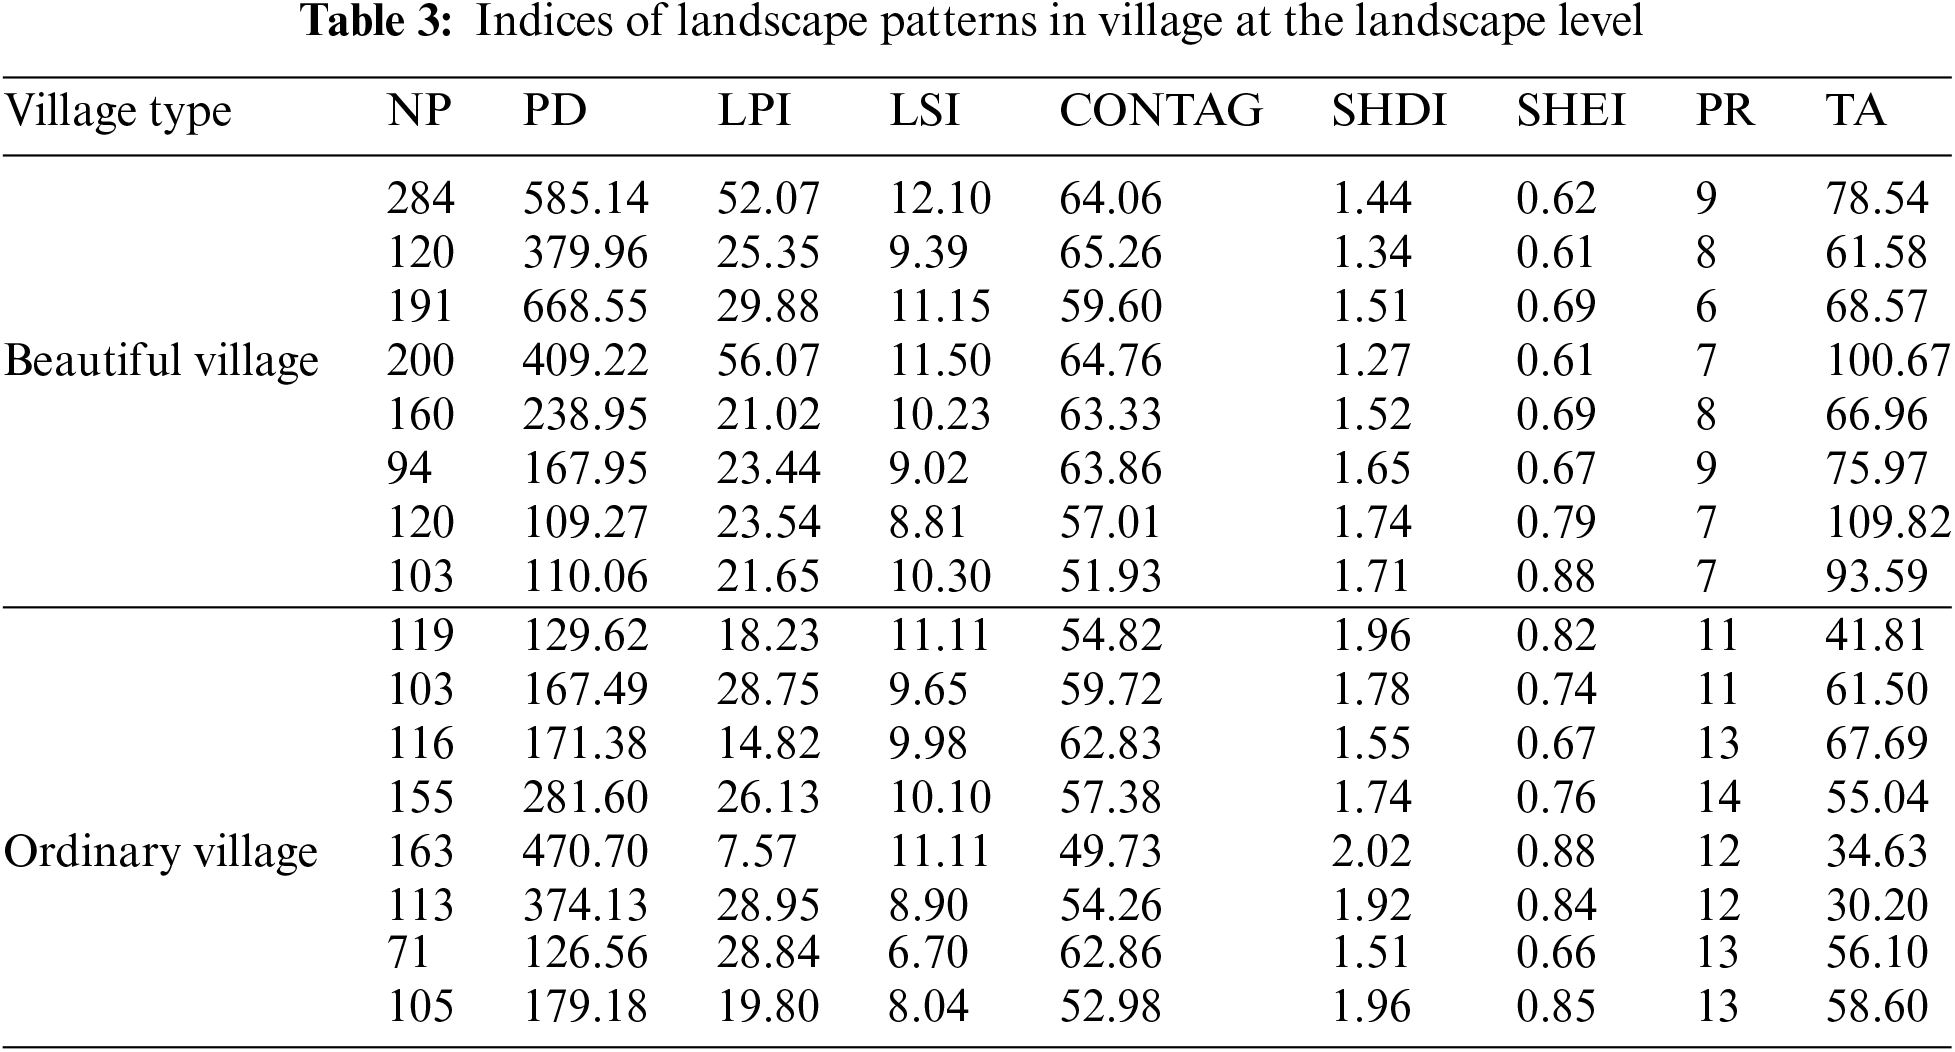
The analysis of village color landscape patterns primarily involves two levels: patch type and landscape. The landscape pattern index serves as a direct indicator of the landscape pattern conditions for different color patches at the patch type level. On the other hand, the landscape level pattern index can comprehensively analyze the spatial landscape pattern of the study area from a global perspective. By examining the color landscape pattern indexes at both levels in beautiful villages and ordinary villages, the driving factors behind the formation of color landscape patterns can be investigated. In this study, the average patch and landscape pattern indices were calculated for eight beautiful villages and eight ordinary villages, respectively. The results are shown in Tables 3 and 4. The dominant colors with the highest proportion of color area, namely dark green, light green, yellow, and white, were selected as representative patch types for the study of color patterns.
4.2.1 Number and Size Analysis of Colors
The number and size of patches reflect the degree of human interference and environmental variations [20]. As shown in Table 5, in this study area, the colors associated with a higher number of patches are light green, white, dark green, and yellow. The number of light green and dark green patches in beautiful villages is approximately twice that of ordinary villages, indicating a greater distribution of grassland and forest areas in beautiful villages. Conversely, ordinary villages have a higher number of yellow patches than beautiful villages, suggesting a more widespread distribution of bare land patches in ordinary villages.
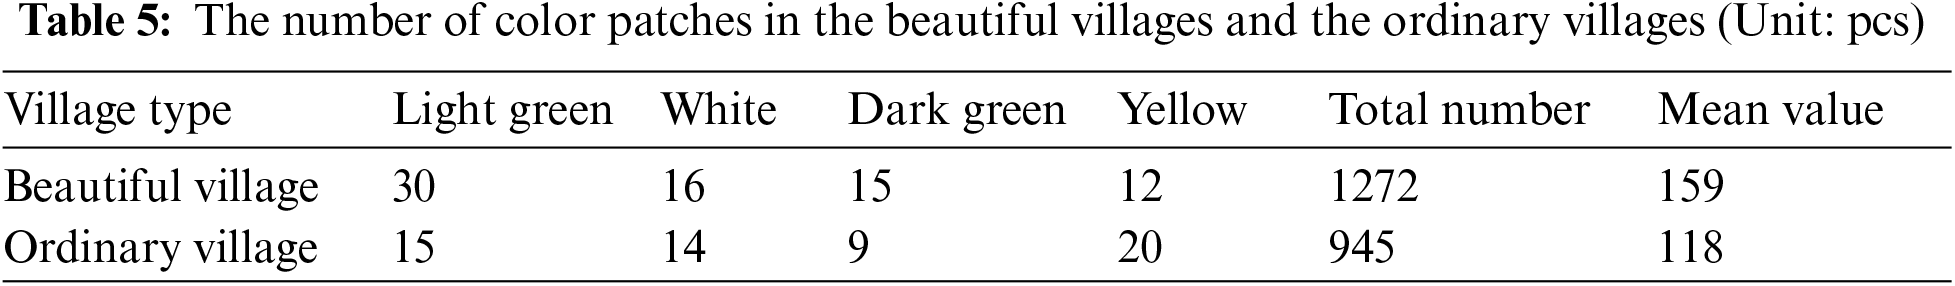
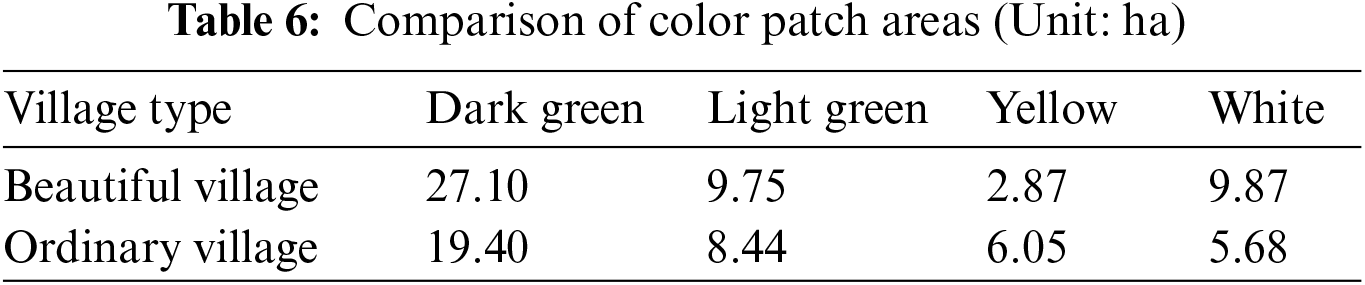
The average number and size of color patches in beautiful villages are significantly larger than those in ordinary villages (Table 6), reflecting the overall larger scale of beautiful villages compared to ordinary villages. This can be attributed to the fact that during the construction process, many beautiful villages undergo relocation and reconstruction, transforming small-scale villages into larger-scale communities with a higher population. By contrast, ordinary villages develop from ecologically native villages with the limited influx of outsiders, resulting in smaller overall village sizes.
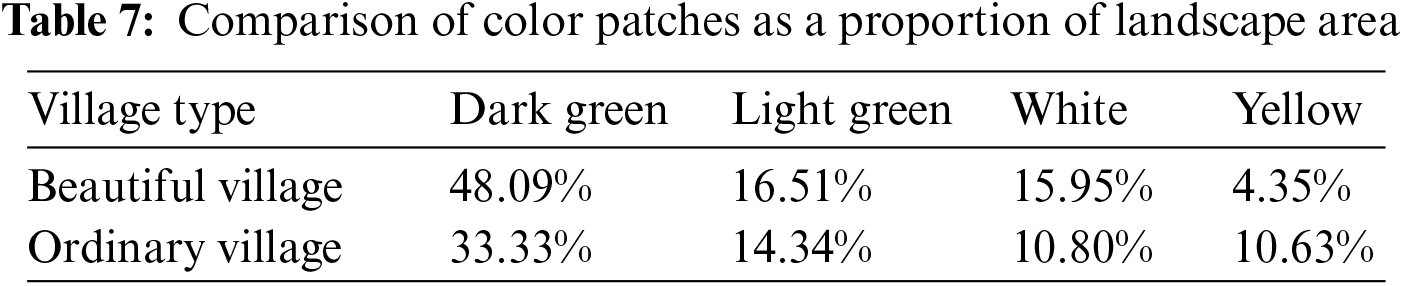
A comparative analysis of the proportion of color patches to the landscape area in beautiful villages and ordinary villages shows that the area proportion of dark green, light green, and white color patches in beautiful villages are 48.09%, 16.51%, and 15.95%, respectively, exceeding those in ordinary villages, which are 33.33%, 14.34%, and 10.79% (Table 7). However, the proportion of yellow bare land patches in ordinary villages is more than double that of beautiful villages, reaching 10.63%. This can be attributed to the planning decisions made during the construction process of beautiful villages, resulting in a gradual saturation of both the villages and the surrounding areas and a higher land utilization rate. Furthermore, the combined proportion of dark green forest patches and light green grassland patches in beautiful villages accounts for 64.6%. Considering the observation from the model, it indicates that natural landscape types still dominate the color landscape in beautiful villages.
From the perspective of village color perception, increasing the proportion of primary color elements in villages can enhance visitors’ understanding of the composition of the villages’ main colors, thereby aiding their comprehension of the village’s structure. Moreover, in terms of improving human emotions, large areas of green patches have positive and significant value in terms of visual and perceptual psychology [21].
Among the largest patches of different colors, the dark green patches representing forest landscapes are the largest landscape patches in both beautiful and ordinary villages. However, according to Table 8, there is a significant difference in the values of the dark green Largest Patch Index (LPI) between the two types of villages. The average LPI for dark green patches is 31.63 in beautiful villages and 21.55 in ordinary villages. In addition, the forest size in beautiful villages is much larger than that in ordinary villages when viewing from a vertical perspective, thus maintaining the stability of the color landscape in beautiful villages. The LPI values for the light green grassland patches are similar for both village types at 5.73 and 5.29, indicating that their grassland landscapes are similar in size and scale. However, the number of light green patches representing grassland colors in beautiful villages is almost twice as many as in ordinary villages (30 vs. 15), indicating a higher grassland coverage in beautiful villages.

White wall patches, representing the color of building facades, are one of the most typical artificial landscape colors. The LPI value for white patches is 5.84 in beautiful villages and 2.96 in ordinary villages. This suggests that beautiful villages have larger-scale and more clustered distribution of buildings, creating a visually pleasing and orderly effect. From the perspective of color contrast and harmony, the contrast between the dark green forest patches and various colors in the villages, such as red roof patches and road pavements, creates a contrasting relationship. When the difference in size between contrasting areas is small, it creates a sense of opposition. However, when there is a significant difference in size, one color will dominate, resulting in a weakening of the opposition effect and a harmonious color relationship. Therefore, this extensive forest color landscape to a certain extent promotes the overall color harmony in the villages [22].
4.2.2 Shape Analysis of Colors
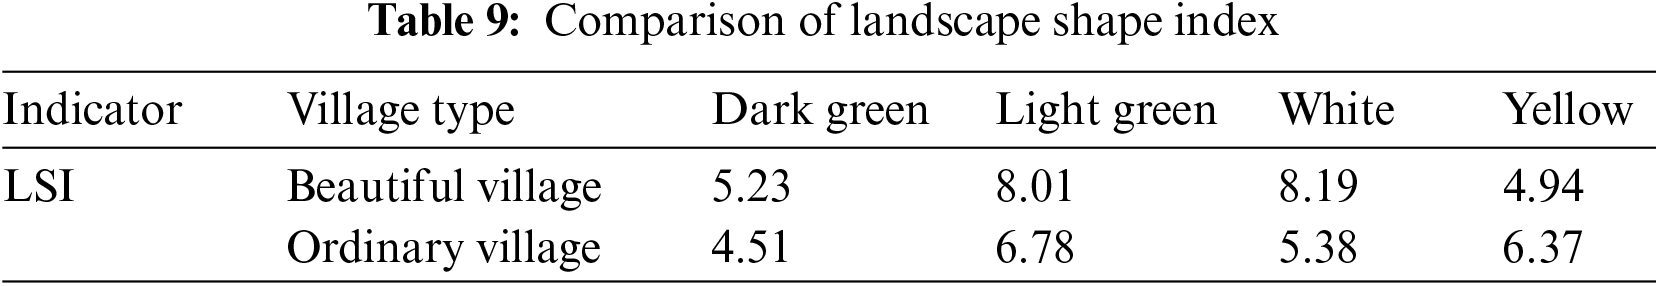
The shape characteristics of landscape types can be reflected by shape indices [23]. The Landscape Shape Index (LSI) represents the variation in patch shapes within a landscape, with higher LSI values indicating increased irregularity of patches. According to the result of Table 9, the LSI values for dark green, light green, and white patches in beautiful villages are 5.23, 8.01, and 8.19, respectively, which are higher than the LSI values of 4.51, 6.78, and 5.38 in ordinary villages. This indicates that the irregularity of forest, grassland, and building patches in beautiful villages is more pronounced, reflecting the greater extent of human intervention in shaping these landscape patterns.
In terms of visual effects, more complete shapes exhibit stronger color contrasts, while fragmented shapes have weaker effects in color contrast. In beautiful villages, there are contrasting relationships between certain village elements. However, human intervention in the modification of village elements increases the irregularity of the edge shapes of color patches, reducing the contrast relationship and creating a more harmonious color relationship within the villages.
4.2.3 Color Aggregation and Fragmentation Analysis
In both beautiful villages and ordinary villages, the AI values of the main color landscape patches are all above 90 (Table 10), indicating a relatively high level of aggregation and compact structure among patches of different color types [24]. Furthermore, there is a small difference in AI values between different color patches in both village types. The Contagion Index (CONTAG) describes the degree of aggregation of different patch types within a landscape, where higher values indicate that the landscape is composed of a few aggregated and large patches, while lower values indicate a composition of numerous dispersed small patches [25].
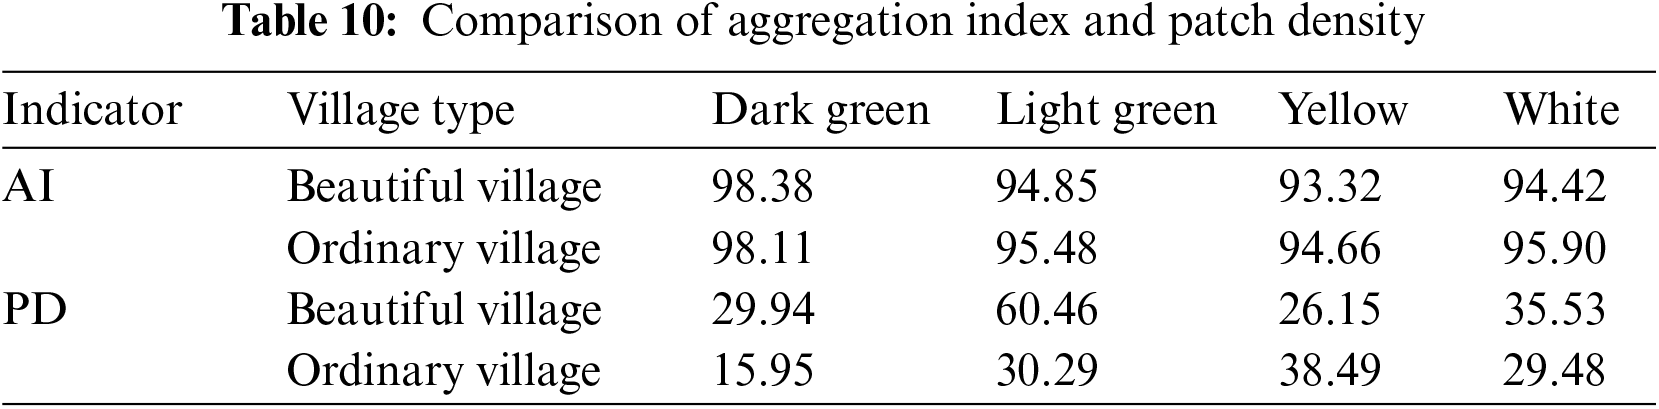
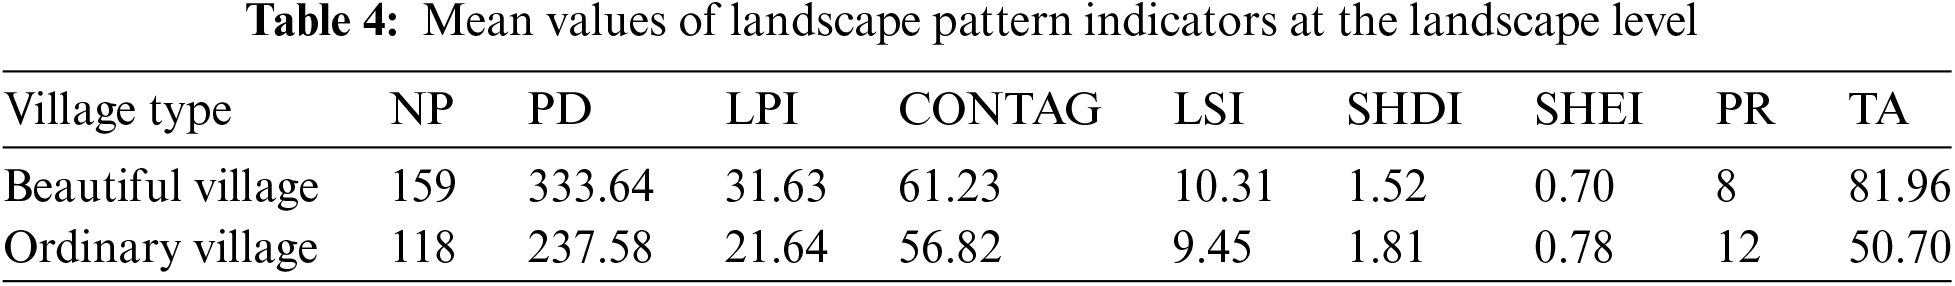
In the study area, the beautiful villages have a CONTAG value of 61.23, which is relatively higher than the value of 56.82 for ordinary villages. This suggests that beautiful villages have the presence of more connected dominant patches. According to the Patch Richness (PR) index, the average number of color categories in beautiful villages is 8, while in ordinary villages, it is 12. Compared to ordinary villages, beautiful villages have a larger number of color patches but a smaller variety of color categories. This landscape color characteristic provides viewers with a visually simple and orderly experience.
The color patch types chosen for both types of villages were roofs, walls, woodland, bare ground, water bodies, grassland and roads. These patch types occupy a certain area in both village categories. However, the richness of color patch types, their proportional representation, and distribution patterns differ, resulting in variations in landscape diversity between the two villages. As shown in Table 4, the SHDI of beautiful villages has an average value of 1.52, which is lower than the value of 1.81 for ordinary villages. This indicates that the latter has a greater diversity of landscape colors and greater landscape heterogeneity. This diversity in colors also leads to a fragmented color system. SHEI describes the balance of landscape type distribution and whether one or a few patch types dominate the entire landscape. From the results of the SHEI analysis, the average SHEI value for the color landscape in beautiful villages is 0.70, indicating a relatively balanced distribution of landscape types. No single patch type dominates the entire landscape. The color aggregation and balanced distribution of the landscape in beautiful villages promote the equilibrium of the facade landscape, enhancing its overall integrity and showing orderly variations. As a result, a better visual effect is achieved in the facade landscape.
This study utilized the 3D real scene model to extract color data of the facade landscape in beautiful villages of Jinzhai County. It aimed to analyze the characteristics of color landscape patterns and the distribution of village composition elements corresponding to the colors. The conclusions are as follows: (1) In beautiful villages, the color distribution is more concentrated and shows an interval distribution pattern. The natural landscape colors in beautiful villages are mainly concentrated in the YR-GY interval, while in ordinary villages, the natural landscape colors are widely distributed in the R-BG interval. The artificial landscape in beautiful villages is mainly characterized by medium value, with chroma concentrated in the low chroma range, whereas in ordinary villages, the distribution of chroma and value are more dispersed. (2) The average proportions of forest, grassland, and building wall colors area are 14.76%, 2.17%, and 5.16% higher, respectively, in beautiful villages than in ordinary villages. However, the proportion of yellow bare land patches in ordinary villages is more than twice that of beautiful villages, leading to a lack of harmony in the overall visual effect of color in ordinary villages. (3) The LSI for forest, grassland, and buildings in beautiful villages are 5.23, 8.01, and 8.19, respectively, indicating a more pronounced irregularity in color patches. As the largest color patch shared by both village types, the size of forest patches in beautiful villages is much larger than in ordinary villages, which maintains the stability of the color landscape to a greater extent. (4) Compared to beautiful villages, ordinary villages exhibit higher values in both the Shannon diversity index and Shannon evenness index. This indicates that in ordinary villages, there is a greater complexity in color patterns, and the distribution of different colors is relatively balanced. As a result, the overall landscape in these ordinary villages evokes a sense of contrast in terms of colors. In addition, beautiful villages have lower color heterogeneity and exhibit the advantage of having more connected dominant patches, which is a feature of color aggregation.
This study aims to provide decision-making guidance for transforming ordinary villages into beautiful villages by summarizing the differences in color attributes and color pattern distribution between ordinary villages and beautiful villages. Based on the research findings, the following recommendations are proposed for the transformation and improvement of ordinary villages:
1. Color Selection: Beautiful villages have a greater number of color patches but fewer color varieties. This characteristic provides viewers with a simple and orderly visual experience. When transforming ordinary villages, emphasis should be placed on color selection and layout to create a clean and organized appearance. Reduce color diversity and fragmentation, and enhance the overall consistency and visual effects of the village. Additionally, attention should be paid to overall harmony and comfort, avoiding excessively bright or highly contrasting color combinations. Choose colors with moderate brightness and chroma to provide a pleasant living environment and enjoyable visual experience.
2. Ecological Construction and Management: The research results indicate that ordinary villages suffer from excessive bare ground coverage and lack of greenery and forest cover. Therefore, when transforming villages, it is important to focus on increasing greenery and forest cover. Measures such as afforestation and beautification can be implemented to enhance the ecological environment and landscape quality of the village. Additionally, choose locally adapted plants that suit the local climate and soil conditions, with a focus on arranging vegetation in the yellow-green color range to enhance landscape consistency and visual appeal. Furthermore, as forests are the largest landscape fragments in villages, efforts should be made to maintain their large scale and stable distribution to enhance the color and landscape quality of the village.
3. Color Layout and Planning: Beautiful villages exhibit stronger connectivity among dominant color patches. Therefore, when renovating ordinary villages, it is necessary to adjust the distribution and clustering of different color patches, increase their connectivity, and create a more cohesive landscape structure. Harmony among colors should also be considered. During the transformation process, artificial interventions can be employed to alter the shape of village elements, increase irregularity in the edges of color patches, weaken contrast relationships, and create harmonious color combinations.
4. Building Layout and Material Selection: Improving and unifying the architectural style and materials is crucial. Traditional architectural styles, such as white walls with gray or red tiles, can be considered to create a sense of local character and aesthetic appeal. Emphasis should be placed on architectural consistency and integrity, avoiding colors that are overly prominent or contrasting. Furthermore, white buildings, as a typical color in artificial landscapes, are characterized by large-scale and concentrated distribution in beautiful villages. When reshaping ordinary villages, attention should be given to the planning and layout of white buildings, which can complement natural landscapes such as forests and grasslands, resulting in an aesthetically pleasing and orderly effect.
The result of this study shows that studying the three-dimensional spatial patterns of village facade colors can reveal the differences between beautiful and ordinary villages, thus improving our understanding of complex village color schemes. Research on the spatial patterns of village color can contribute to optimizing land development and spatial resource allocation in rural areas, as well as promoting the construction, renovation, and revitalization of villages. Existing studies on village colors have mainly focused on two-dimensional color features, overlooking the interdependent relationships among the overall spatial patterns of colors. By using 3D real scene models to investigate the three-dimensional facade color landscape patterns, this study represents a transitional research approach in exploring landscape pattern variations. The establishment of 3D real scene models in the future will greatly advance the study of three-dimensional village landscapes. For example, incorporating environmental data such as solar radiation, wind patterns, and ecological sensitivity into the process of color design and planning through 3D real scene models enables the analysis and simulation of these factors to determine the most suitable color schemes. This approach maximizes energy conservation, optimizes natural lighting, and promotes sustainable ecological development. It ensures that color design and planning decisions align with environmental factors, contributing to the overall sustainable development of villages.
This study represents an application attempt of GIS technology in optimizing village color design and planning. In the future, further integration of GIS technology’s data-driven advantages and village color planning needs can generate more user-friendly and practical decision-making recommendations. For instance, GIS can facilitate public participation by incorporating questionnaire surveys into the design and planning process. Through the use of GIS-based tools such as online mapping platforms, community members can provide input on color preferences, identify areas they believe require color improvements, and share their local knowledge. This participatory approach ensures that the color design and planning process reflects the needs and desires of the community. Additionally, future research should also consider exploring smaller-scale village elements, such as the colors of doors and windows. By incorporating these details into the analysis through techniques like data fusion, a more comprehensive understanding of the characteristics of village facade color landscapes can be achieved. This will help to develop more accurate and targeted color design and planning strategies.
Acknowledgement: The authors extend sincere gratitude to the editors and reviewers for their meticulous review and valuable recommendations.
Funding Statement: We are grateful for the financial support provided by the National Natural Science Foundation of China (Grant Number 42301478), Natural Science Foundation of Anhui Province (No. 2208085QD108), and the Major Project of Natural Science Research of Anhui Provincial Department of Education (Grant Number KJ2021ZD0130).
Author Contributions: The authors confirm contribution to the paper as follows: study conception and design: Wenzheng Jia, Chun Wang, Yiyi Cen; data collection: Wenzheng Jia; analysis and interpretation of results: Yiyi Cen, Wen Dai; draft manuscript preparation: Yiyi Cen, Wen Dai, Wenzheng Jia, He Wu. All authors reviewed the results and approved the final version of the manuscript.
Availability of Data and Materials: The data that support the findings of this research are available from the author upon reasonable request.
Conflicts of Interest: The authors declare that they have no conflicts of interest to report regarding the present study.
References
1. Jose LC. Research on color in architecture and environmental design: brief history, current developments, and possible future. Color Res Appl. 2006;33(4):350–63. [Google Scholar]
2. Zhu XY, Zhang HR, Lan SR, Huang QT. Research on traditional village color landscape optimization based on quantitative analysis and public perception: taking Xunpu Village in Southern Fujian as an example. J Cent China Norm Univ Nat Sci. 2020;54(1):50–9. [Google Scholar]
3. Bian WJ, Huang D. Research on color features and preservation and renovation of traditional villages in North Jiangxi: a case study of Luotian village in Jiangxi. Mod Urban Res. 2021;2021(11):8–15. [Google Scholar]
4. Shen S. A research on traditional vernacular dwellings of pingshan village in Anhui (Master Thesis). Xi’an University of Architecture and Technology: China; 2018. [Google Scholar]
5. Luo GX. Research on the architectural color of traditional villages in mountain area in South of Hebei (Master Thesis). Hebei University of Engineering: China; 2017. [Google Scholar]
6. Liu RY, Zhang JH. The analysis of the color of Huizhou traditional civil residence. Ind Constr. 2010;40(4):147–50. [Google Scholar]
7. Xian LH, Wu NY, Chen HY, Liang WY, Huang ZH. Evaluation of campus plant landscape by UAV aerial photography—taking South China Agricultural University as an example. Subtrop Plant Sci. 2019;48(3):285–90. [Google Scholar]
8. Habib M, Okayli M. An overview of modern cartographic trends aligned with the ICA’s perspective. Revue Internationale de Geomatique. 2023;32(1):1–16. [Google Scholar]
9. Gao LC, Chen DQ, Liu KW. Study on color landscape area from the perspective of the fifth façade—a case study on Chang’an campus of Northwest University. J Cent China Norm Univ Nat Sci. 2016;50(5):770–6. [Google Scholar]
10. Gong JP, Hu YM, Liu M, Chang Y, Bu RC. Review on three-dimensional expansion and its atmosphere environmental effects of urban landscape. Chin J Ecol. 2015;34(2):562–70 (In Chinese). [Google Scholar]
11. Zhu C, Chen LW, Lu W, Xiao QC. 3D real-scene model of oblique photography based on retinex. In: Proceedings of the International Symposium on Computer Technology and Information Science, 2021; Guilin, China. [Google Scholar]
12. Gordon P. Systematic oblique aerial photography using multiple digital frame cameras. Photogramm Eng Rem S. 2009;75(2):102–7. [Google Scholar]
13. Wang QD. Research on application of oblique aerial photography and 3ds max plug-in development in city modeling (Master Thesis). Lanzhou Jiaotong University: China; 2013. [Google Scholar]
14. Li W, Feng B. The color system generation of urban buildings in the tibetan-inhabited area based on the protection of color system concerning religion: a case study of the old urban area in Xiahe County, Gansu Province. Mod Urban Res. 2015;30(3):93–7. [Google Scholar]
15. Liu WQ, Feng R, Zhou FK. The relation between Munsell color system and visual perception brightness. Opt Precis Eng. 1998;3:32–6. [Google Scholar]
16. Lin L, Bian ZX, Wang SM. Analysis of rural landscape patterns around large and medium cities—taking Shenyang City as an example. Chinese J Agric Resour Reg Plan. 2020;41(5):223–30 (In Chinese). [Google Scholar]
17. Deng Q, Ou CR, Deng ZH, Zheng MF, Shun SX. Changes of landscape pattern and driving factors in Menghai. J Southwest For Univ Nat Sci. 2019;39(5):118–26 (In Chinese). [Google Scholar]
18. Zhu DG, Xie BG, Xiong P. Spatial-temporal evolution of land-use pattern changes in Zhangjiajie City based on three-dimensional landscape pattern indices. Econ Geogr. 2017;37(8):168–75. [Google Scholar]
19. Yi HJ, Zhang L, Luo W, Wang Y, Yang J. Spatial grain size effect on land use pattern changes within the Yanghe watershed in 1990–2013. Chinese Agric Sci Bull. 2018;34(19):83–95 (In Chinese). [Google Scholar]
20. Zhang S, Xu J, Yang P, Dan X, Wang RL. Analysis of spatial characteristics of agricultural landscape in plateau mountain areas based on GIS. North Hort. 2020;11:63–9. [Google Scholar]
21. Xing ZJ, Kang YX, Li MD. Physiological and psychological influences of the landscape plant forms on human. J Northwest For Univ. 2015;30(2):283–6 (In Chinese). [Google Scholar]
22. Wang YY. Analysis of the application of color in landscape design. Contemp Hortic. 2022;45(3):146–8. [Google Scholar]
23. Jiang CH, Wang H, Wang ZT, He ST, Zheng L. A comparative study on the landscape spatial structure of the dong minority villages in Southeast Guizhou. J Chongqing Norm Univ Nat Sci. 2016;33(4):187–93+230 (In Chinese). [Google Scholar]
24. Yuan JW, Wu C, Du B, Zhang LP, Wang SG. Analysis of landscape pattern on urban land use based on GF-5 hyperspectral data. J Remote Sens. 2020;24(4):465–78. [Google Scholar]
25. Zhang LQ, Jian Q, Yan XN, Zhang JM. Study on spatio-temporal change and driving force of landscape pattern of national key ecological functional areas in northwestern Hebei—taking Huailai County of Hebei Province as an example. Jiangsu Agric Sci. 2019;47(6):231–8 (In Chinese). [Google Scholar]
Cite This Article
 Copyright © 2024 The Author(s). Published by Tech Science Press.
This work is licensed under a Creative Commons Attribution 4.0 International License , which permits unrestricted use, distribution, and reproduction in any medium, provided the original work is properly cited.
 Downloads
 Citation Tools