
 Submit a Paper
 Propose a Special lssue
 Open Access
ARTICLE

Comparative Flood Hazard Assessment in Assam’s Belsiri River Basin Using AHP and MaxEnt Models
1 Department of Geography, Nowgong Girls’ College, Nagaon, 782001, India
2 Department of Geography, Gauhati University, Guwahati, 781014, India
3 Department of Geography, Pandu College, Guwahati, 781012, India
* Corresponding Authors: Nilotpal Kalita. Email: ; Manash Jyoti Nath. Email:
Revue Internationale de Géomatique 2025, 34, 37-51. https://doi.org/10.32604/rig.2024.058265
Received 08 September 2024; Accepted 13 December 2024; Issue published 13 January 2025
 View Full Text
 Download PDF
Abstract
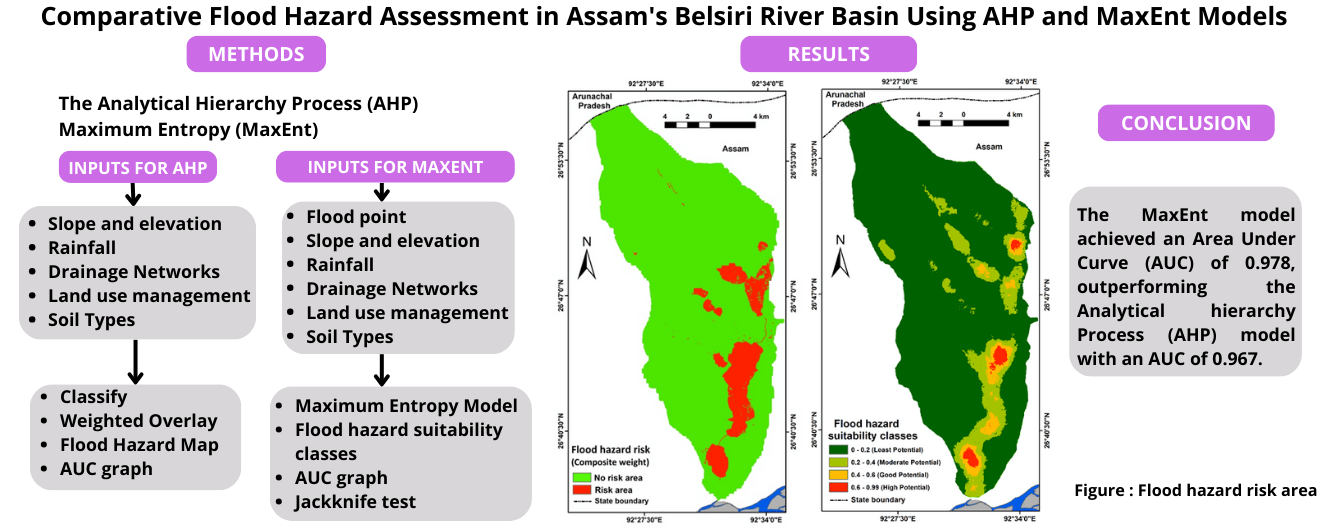
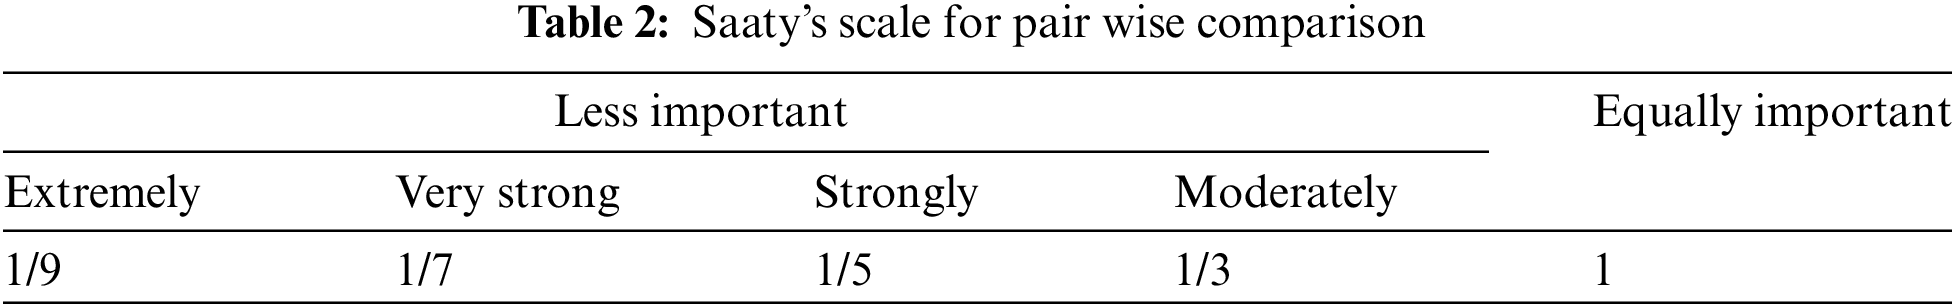
Flooding is a natural event often associated with floodplain areas, characterised by large, sudden and significant rises in river water levels that drastically alters the surrounding landscape. The research employs ArcGIS tools, multi-criteria evaluation techniques and the Maximum Entropy (MaxEnt) model to assess flood hazard zones. The key physical elements of slope, elevation, rainfall, drainage density, land use, and soil types have been integrated to identify areas vulnerable to flooding. Overlay analysis has been used to construct zones specifically designated for flood hazards. Additionally, pairwise comparison using Saaty’s scale was employed to calculate the Eigenvector weights for each physical factor. A comparison of AUC values is estimated to find the most effective method for delineating flood hazard zones. The MaxEnt model achieved an Area Under Curve (AUC) of 0.978, outperforming the Analytical hierarchy Process (AHP) model with an AUC of 0.967. The higher AUC indicates that the MaxEnt model is better at distinguishing between positive and negative occurrences. This could lead to more reliable predictions of the flood hazard zones. Overall, the higher AUC of the MaxEnt model suggests greater reliability and robustness.Graphic Abstract
Keywords
Floods are a common natural disaster that can cause extensive damage and loss to various landscapes. They can lead to serious issues such as excessive sediment deposition and degradation of ecosystems. In recent years, the frequency and intensity of floods have increased, which is destructive, driven by factors such as irregular rainfall, river overflow, deforestation, urbanization, and the development of unplanned settlements near coasts and rivers [1,2].
A hazard is a potentially harmful physical event or phenomenon that has the potential to inflict property damage, environmental degradation, social unrest, and injury or death [3]. Among various hazards, floods have been identified and recognised as the most frequent and destructive in tropical areas. Many authors have made numerous attempts to evaluate flood-hazard regions across the globe [4–6]. Flooding is a natural disaster that causes extensive damage to human communities and the environment. Floods are common in areas near rivers. When rivers overflow their banks, they flood nearby low-lying areas, causing environmental and economic problems for local people [7]. It is important to create flood hazard maps and to monitor flood plains for sustainable development in river areas. The rise in floods worldwide shows the need for better flood risk mapping and flood susceptibility zoning (FSZ). Satellite remote sensing and GIS techniques are powerful tools for managing floods. They help with flood prevention, warning, preparedness, and relief efforts [8].
This study aims to develop a flood hazard zonation for the Belsiri River basin in Assam, India, using a multi-criteria evaluation technique and the Maximum Entropy (MaxEnt) model within a Geographic Information System (GIS). GIS is frequently used to create flood hazard maps because of its ability to integrate data from various sources, such as maps and digital models. By consolidating diverse datasets, GIS facilitates the efficient surveying, mapping, storage, analysis, and presentation of geographical and related information. Its speed, clarity, and accuracy make GIS an invaluable tool for decision-making. The data provided by GIS can be used to assess flood impacts and support planning and management efforts before policy implementation. Additionally, GIS is particularly valuable for mapping flood hazard zones, as it organizes information geographically and presents it visually, aiding in emergency evacuation. Real-time geographic data further enhances resource allocation and response efforts during flood events [9].
The Maxent model, developed by Steven J. Phillips and his team at the American Museum of Natural History with AT&T-Research, was first introduced in 2004 [10]. This machine learning model is primarily used to predict species distribution based on environmental factors and has gained popularity among scientists for its effectiveness in this area. Although originally the model was used for species distribution modelling, the MaxEnt model can also be applied to flood hazard susceptibility mapping [11,12]. The justification for using Maxent lies in its versatility. While primarily designed for species distribution modelling, MaxEnt’s predictive capabilities extend effectively to flood hazard mapping. The model’s strength lies in its ability to predict spatial distributions based on environmental variables, making it suitable for identifying flood-prone areas. Its strength lies in handling complex interactions between variables, providing a nuanced understanding of flood hazards. The rationale for parameter selection and weighting is that key parameters such as elevation, slope, land use, and rainfall were selected due to their significant influence on flood dynamics. Elevation and slope influence water flow, while land use affects runoff and infiltration rates. Rainfall intensity is directly linked to flood potential. The Analytical Hierarchy Process (AHP) was employed to assign systematic weights to these parameters. AHP facilitates pairwise comparisons and integrates expert judgment, ensuring that the parameter weights accurately reflect their relative importance in flood hazard assessment. However, the accuracy of the results depends highly on the quality and resolution of the input data. Poor quality or low-resolution data can mess up the model’s predictions. Both AHP and MaxEnt make inherent assumptions that may not fully encapsulate the complexity of real-world flood dynamics. For instance, MaxEnt assumes that the presence data accurately represents the distribution of flood events, which may not always hold true. Moreover, the model’s output is sensitive to the selection of parameters and their assigned weights. Even minor changes in these inputs can lead to varying predictions, which highlights the need for careful selection and validation of parameters. The integration of AHP and MaxEnt models offers valuable insights into flood hazard mapping, understanding the methodological rationale and being aware of their limitations. This approach ensures reliable and informed decision-making in flood hazard assessment. Maxent is capable of handling incomplete or sparse data, which is often the case in flood hazard mapping. Flood events may not be uniformly recorded across a region, but MaxEnt can still generate reliable predictions by making the best use of the available data [11]. Studies have shown that MaxEnt performs well in flood susceptibility mapping. For instance, in a study conducted in Afghanistan, MaxEnt achieved a success rate of 97% in predicting flood-prone areas [13]. This high level of accuracy establishes it as a reliable tool for hazard mapping. The study by Cabrera et al. [14] indicates that both the AHP and Maxent models are reliable for flood hazard and risk assessments, with the Maxent model showing a higher accuracy of 95.6% compared to 81% for the AHP. Apart from these, Maxent automates the modelling process and reduces subjectivity.
Similar findings have been reported from various rivers and in different districts in India and the world, including the Yamuna [9], Subarnarekha [15], Pol-e Dokhtar watershed [16], Brahmaputra River Basin [17], Jia Bharali [18], Rapti River [19], Krishna River Basin [20] and Ganga River [21].
Sneha et al. [9] emphasize the need for improved planning and the adoption of scientific strategies to reduce flood vulnerability, highlighting the crucial role of GIS for emergency planning and decision-making. Das [2], in a study on flood hazard mapping and road vulnerability mapping in the Kamrup Metropolitan district of Assam, found the AHP technique to be effective, and it creates scope for further investigation by emphasizing the importance of integrating geospatial methods for disaster risk reduction and policy-making. In their study on flood risk susceptibility in the Jia Bharali River basin in the Eastern Himalayas, Debnath et al. [18] emphasizes the AHP model in accurately identifying flood-prone zones within the surveyed area. The research provides valuable insights for policymakers and contributes to efforts in climate change adaptation and disaster risk reduction. By using an optimized AHP model, the study offers a cost-effective and time-efficient solution for flood management in the basin. Parsian et al. [16], in their study on the Pol-e Dokhtar watershed, found the efficiency of remote sensing and GIS to generate a reliable flood hazard map. Debnath et al. [17] on flood susceptibility in the Brahmaputra River Basin used machine learning and multi-criteria decision-making techniques to assess flood risks and found that one-third of the region is moderate to highly flood-prone. Vashist et al. [20] focus on flood hazard mapping for the Krishna River basin using a GIS-based AHP approach. They integrated various environmental parameters such as Digital Elevation Models (DEMs), land use and land cover, soil type, rainfall, slope, and distance to rivers to identify flood hazard areas.
These studies primarily focus on flood risks in river basins characterised by varying landscapes and consistent rainfall, utilizing AHP techniques to create flood hazard maps. Similarly, the current study employs both AHP and MaxEnt modelling to identify potential flood zones, yielding comparable results for the Belsiri River basin, which features predominantly flat terrain and significant annual rainfall (about 210 cm). In this study, we build upon previous research by incorporating AHP and MaxEnt methods to enhance our analysis. Unlike previous works, our approach integrates these methodologies to provide a more comprehensive assessment of the river basin. This study not only confirms findings from earlier research but also introduces novel insights by combining AHP and MaxEnt, offering a fresh perspective on river basin analysis.
Study area
The Belsiri River (Fig. 1) is a minor tributary of the Brahmaputra River. It is situated between latitudes 26°36′ N and 27°05′ N and longitudes 92°20′ E and 92°40′ E. The river flows through the western part of the Kameng district in Arunachal Pradesh and the western part of the Sonitpur district of Assam [22]. The total basin area is 496 km2 with 31% located in Arunachal Pradesh and 69% in Assam. The basin’s perimeter is 158 km, with a maximum length of 57 km and a width of 15 km [22].
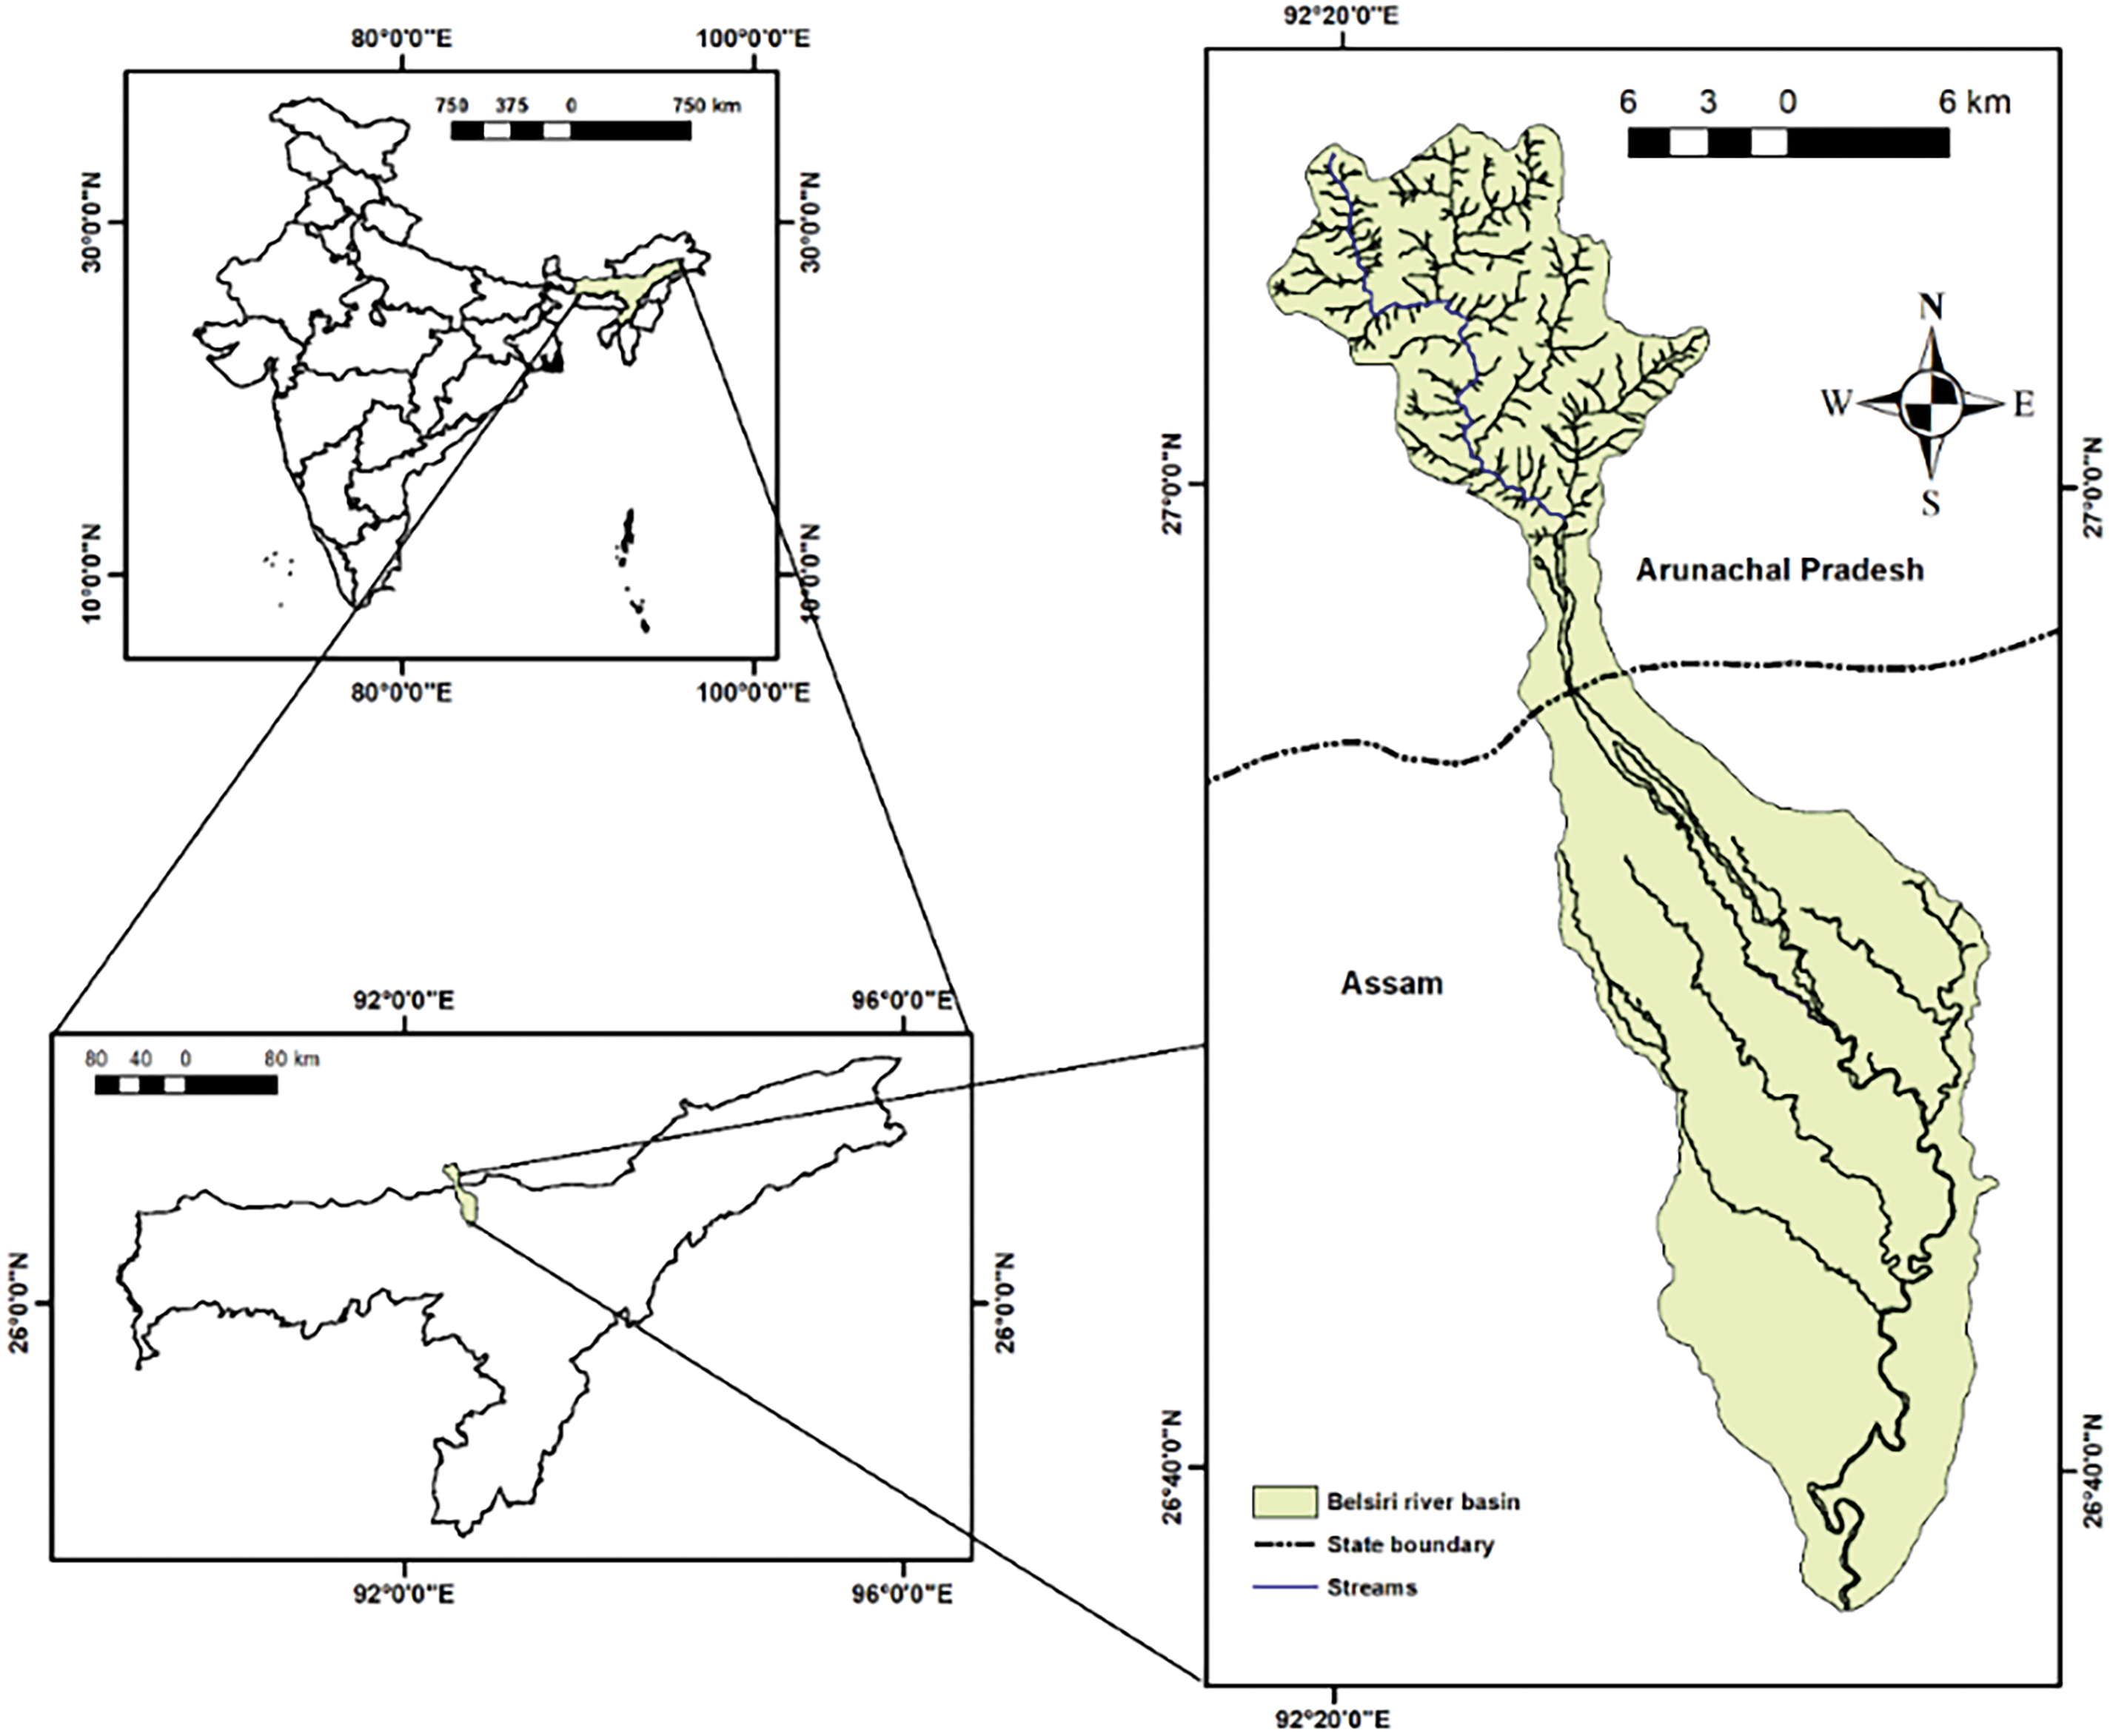
Figure 1: Study area
In the Assam portion of the Belsiri River basin, there were 95 villages as of 2011. These data for the Belsiri River basin are extracted from the District Census Handbook of Assam, India. The total population increased from 53,807 in 1971 to 112,003 in 2011, marking an increase of 58,196 people over 40 years. In 2011, the male population was 56,363 and the female population was 54,635, compared to 28,199 males and 25,608 females in 1971. This significant population growth has placed considerable pressure on natural resources such as land, water, and forests. Development activities like housing construction, road building, expansion of agricultural land, and intensive farming have disrupted river processes, leading to increased flooding and erosion. Additional human actions, like the removal of vegetation along riverbanks and sand mining, have exacerbated bank erosion driven by the rising population pressure in recent years [23].
This study utilizes GISbased methods, employing Landsat satellite imagery with a spatial resolution of 30 m (Landsat 8 OLI 2014, 2015, and 2023) and topographical maps from the Survey of India as spatial databases. Atmospheric corrections are applied to the satellite images to ensure the quality of the data used. The hydrology tools in the ArcGIS Spatial Analyst extension were used to automatically extract the stream networks. Fundamental physical characteristics, such as slope, elevation, drainage density, rainfall, land use, and soil types, were considered in defining flood hazard zones. The drainage density, elevation, and slope for the research area were derived using the Cartosat v3 DEM, which was downloaded from NRSC Bhuvan’s website. The Digital Elevation Model (DEM) was processed to fill in sinks, ensuring no depressions remained in the elevation raster. A depression in a DEM is defined as a cell or cells in an elevation raster that is surrounded by higher elevation values, indicating an area of internal drainage [24]. After filling the sinks, the flow direction for the area of interest was estimated in ArcGIS 10 using basic Spatial Analyst operations. Flow direction indicates the direction water will flow out of each cell in the filled DEM. Based on the flow direction raster, a flow accumulation raster was then created, which counts the number of cells flowing into each cell [24]. The DEM and a pour point are fundamental criteria for extracting the drainage network in the study. A pour point is a user-defined point placed at the cells with the highest flow accumulation, which directs the flow network extraction process [25].
2.1 Analytical Hierarchy Process
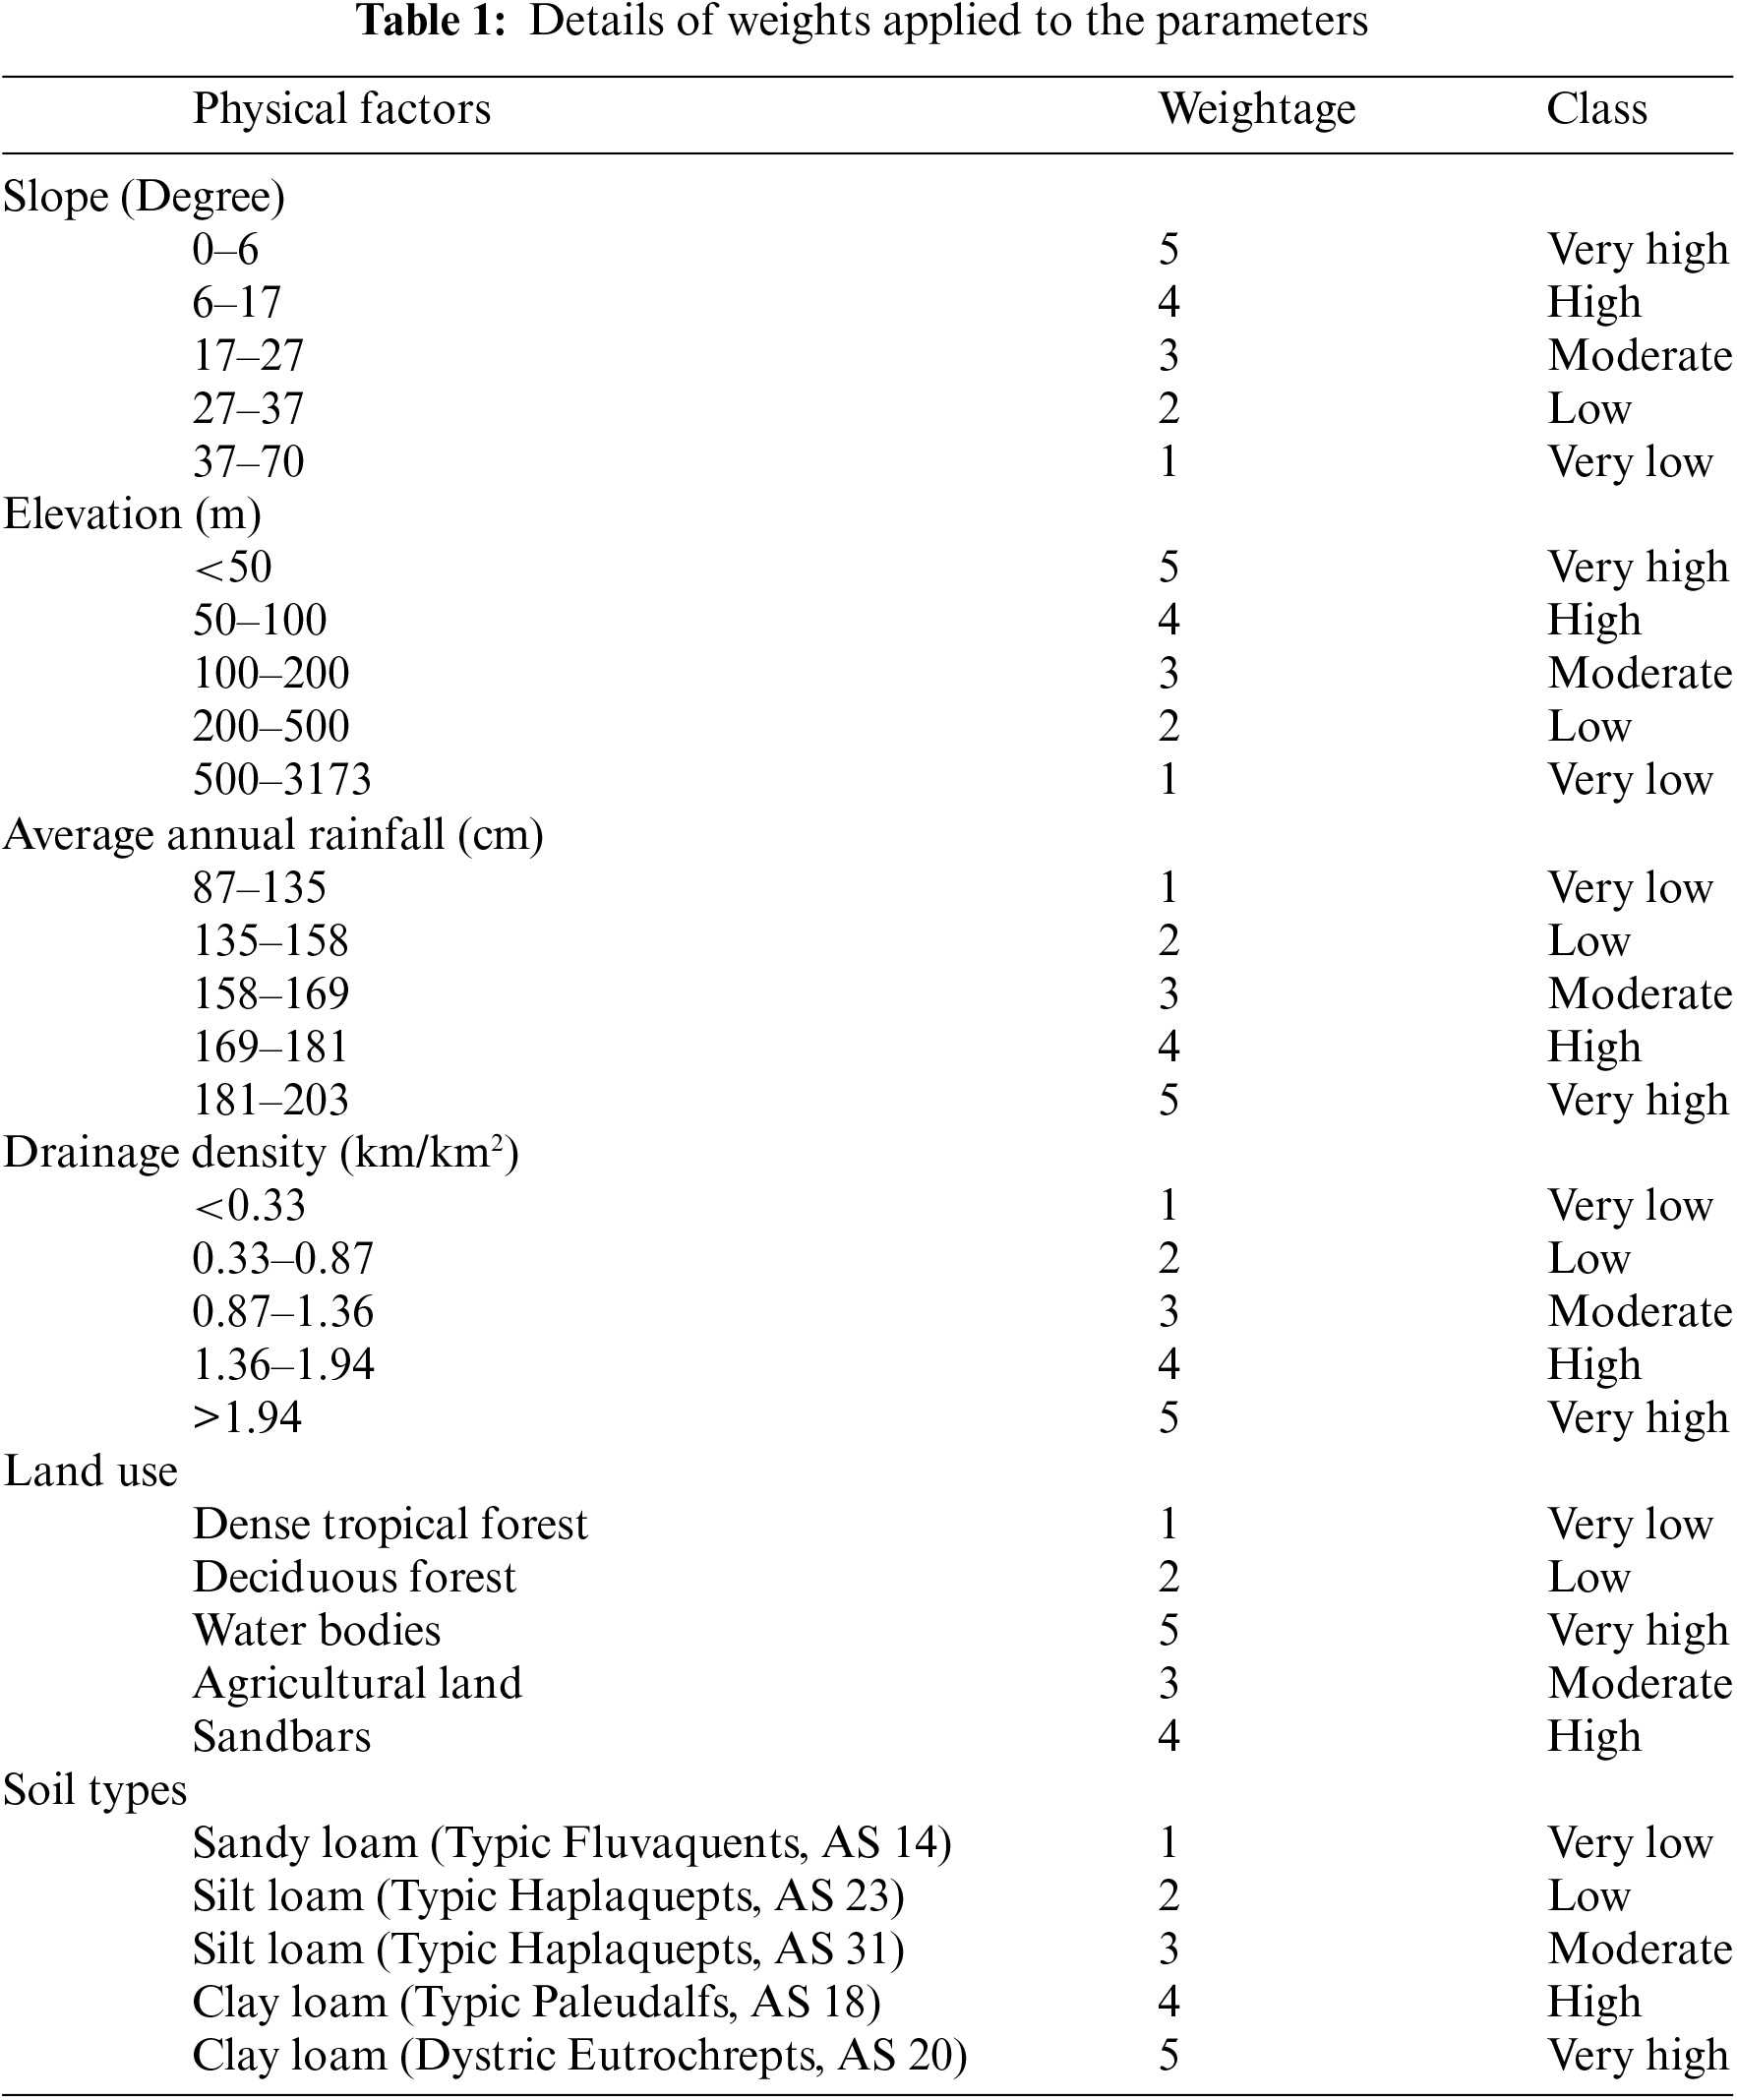
The AHP [26,27] is utilized to prepare the hazard map using the weighted overlay method [23,26,28–30]. Rainfall data from eight gauging stations are used to create the rainfall map. Land use and land cover (LULC) maps are generated using QGIS 2.8.2, while the soil map is sourced from the Agriculture and Water Resources Departments of the Government of Assam. The weighted overlay method, based on Saaty’s AHP is then applied to produce the final hazard map. Six key parameters are used for the flood hazard mapping. The weights assigned to these parameters are determined through expert judgment, literature review, and statistical methods to reflect their relative importance in the context of the study. The selection and weighting of parameters can be subjective and may introduce bias. Therefore, it requires expert knowledge and thorough validation to ensure accuracy. The weightage for the Belsiri River basin is assigned based on field observation by the researcher (Table 1).
MaxEnt modelling is based on entropy theory, which measures uncertainty in random processes and reflects how things change over time and space. This model is widely applied in fields such as ecology, urban geography, archaeology, rainfall modelling, and the design of water monitoring systems [31]. MaxEnt is a statistical model that helps predict unknown events by making the least biased estimates from available data. It estimates probability distributions and transforms raw environmental data into usable features. The model can automatically select the best features to improve accuracy. The formula for maximum entropy used in MaxEnt is:
In this equation, z represents a vector of environmental variables at location xi, and λ is a vector of regression coefficients. The MaxEnt model [10] uses maximum entropy machine learning to estimate species distribution based on environmental data and is widely used in species distribution modelling.
To apply multi-criteria evaluation techniques, all relevant parameters have been analysed and the necessary files were prepared. A detailed discussion of each parameter is presented below.
Slope and Elevation
The terrain’s slope affects flood risk, with flatter areas having lower slope values and steeper areas having higher values [3]. Flood likelihood is inversely correlated with slope; thus, lower slope classes are assigned higher rankings and weights. The slope of the terrain significantly influences flood risk. Flatter areas are characterized by lower slope values and tend to have slower water runoff, which can lead to prolonged flooding and waterlogging. In contrast, steeper areas with higher slope values facilitate faster water runoff, reducing the duration of flooding but potentially increasing the risk of flash floods and erosion. Therefore, understanding the slope dynamics is crucial for effective flood risk management and mitigation strategies. Local opinions and field observations also influence these rankings. A similar approach is applied to elevation. The weighted slope raster (Fig. 2) shows that most of the study area has a low slope (6–17 degrees), indicating a significant weightage. This suggests that the region’s gentle slope increases flood risk. Although not prominently visible on the map, areas near the channel with extremely low to low slopes, which have high slope weightage, also indicate a higher potential for recurrent flooding.
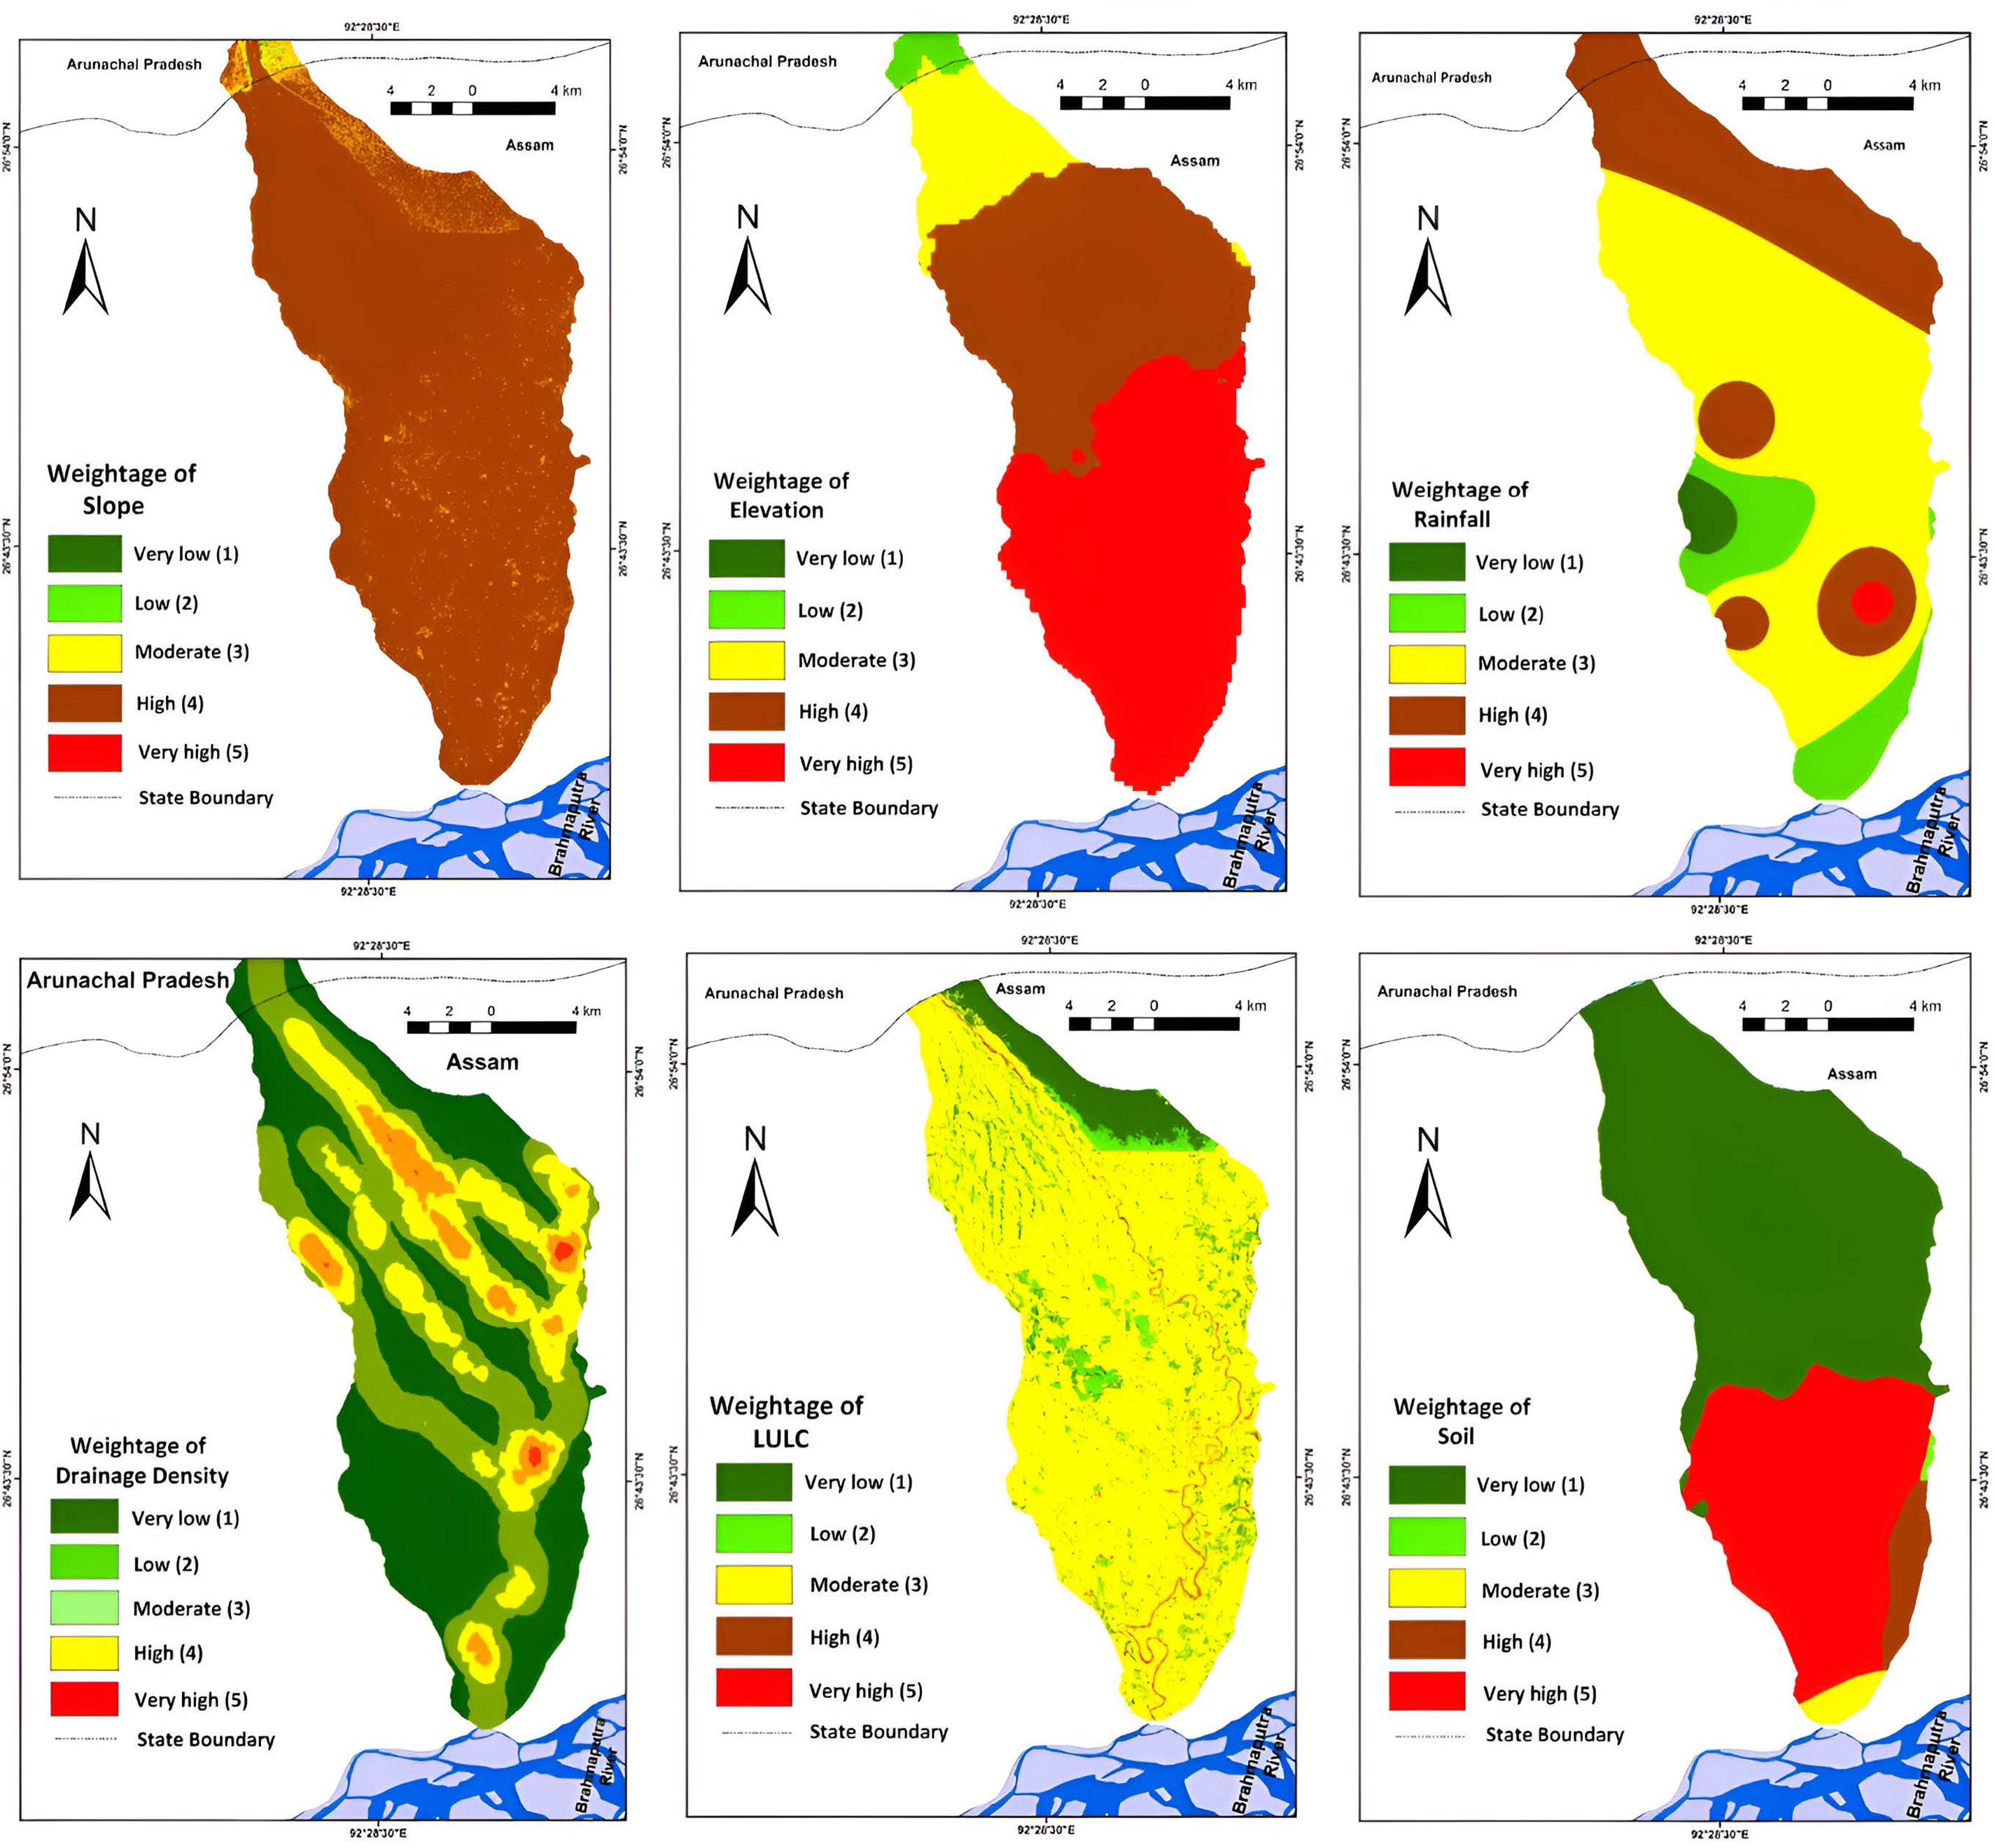
Figure 2: Parameters used in multi-criteria evaluation techniques
Rainfall
Floods are often linked to heavy precipitation, with flood risk increasing proportionally with higher rainfall amounts. Therefore, the rainfall class with the highest value is assigned the maximum weight in the rainfall raster. A weighted rainfall raster is created using the Inverse Distance Weighting (IDW) method of spatial interpolation within an ArcGIS environment, as illustrated in Fig. 2. The choice of IDW interpolation is based on the observation that rainfall tends to vary with distance from monitoring stations. The consistently high rainfall recorded at monitoring stations necessitates the use of IDW to capture spatial variability.
Drainage Networks
The drainage networks were generated using the Hydrology tool from the Spatial Analyst extension of ArcGIS 10.2.1. The drainage density was computed from these networks using the ArcGIS Density tool and the DEM, resulting in a drainage density map. The line density module calculates the density by determining the magnitude per unit area from polyline features within a specified radius around each cell [3]. Table 1 lists the weights assigned to the five classes derived from the drainage density raster, with higher weights assigned to high-density classes due to their greater vulnerability to flooding. Fig. 2 illustrates the raster map of drainage density weightage.
Land Use Management
Land use management is crucial aspect of flood hazard assessment as it reflects both current land utilization and its significance relative to the population and ongoing development [6]. The land use pattern for the Assam portion of the basin is classified into five categories, as shown in Table 1. Supervised classification using the maximum likelihood classification method in ArcGIS 10.2.1 was employed for this analysis. Vegetative areas, which receive a low weight in the classification, are located in relatively high land areas with minimal flooding risk. The land use/land cover weightage raster map is displayed in Fig. 2.
Soil Types
The study area is classified into five main soil types. Soil weight details and the corresponding weightage raster map are presented in Table 1 and Fig. 2, respectively. The soil raster (Fig. 2) indicates that Sandy Loam (Typic Fluvaquents, AS 14) and Clay Loam (Dystric Eutrochrepts, AS 20) are the predominant soil types in the area. These soil types are associated with regions that have a higher probability of flooding, as they are found in areas formed by the deposition of recent alluvium from the Belsiri River network.
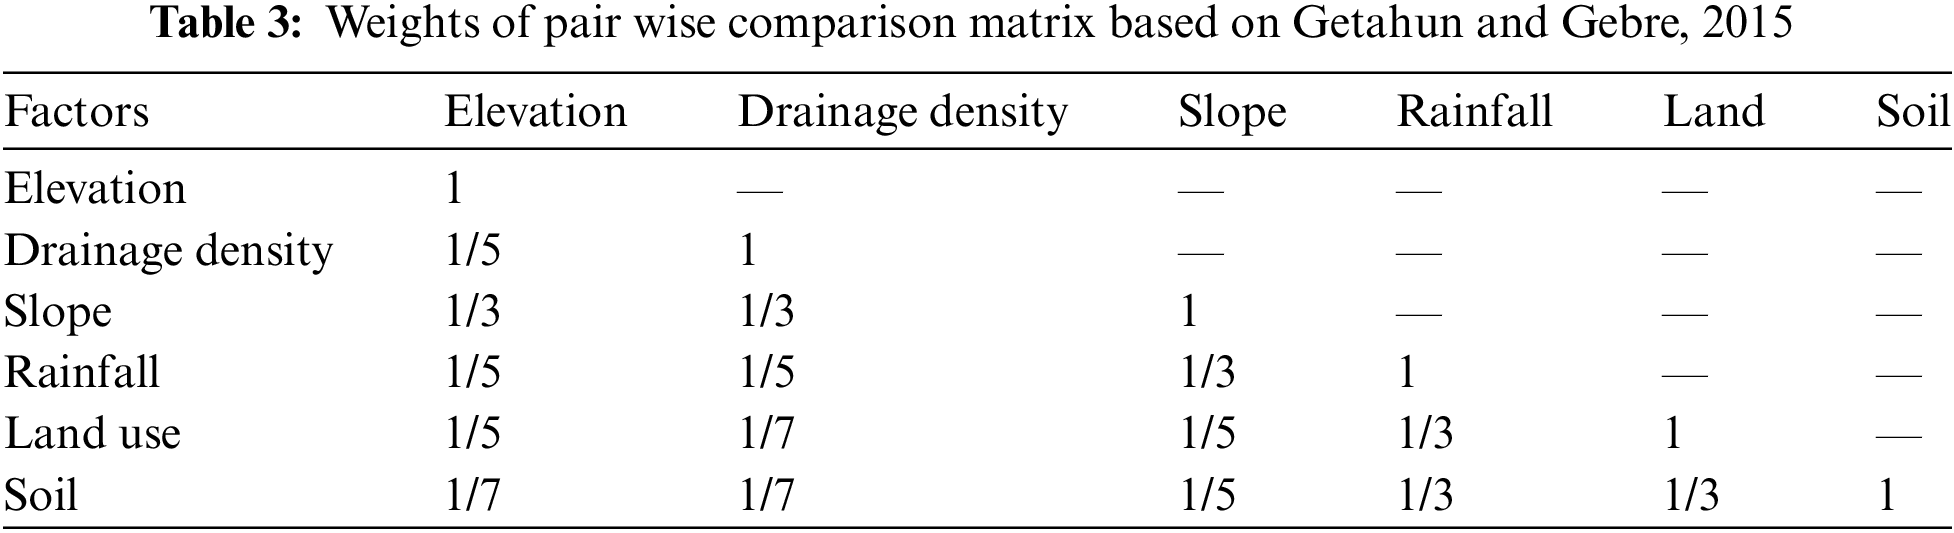
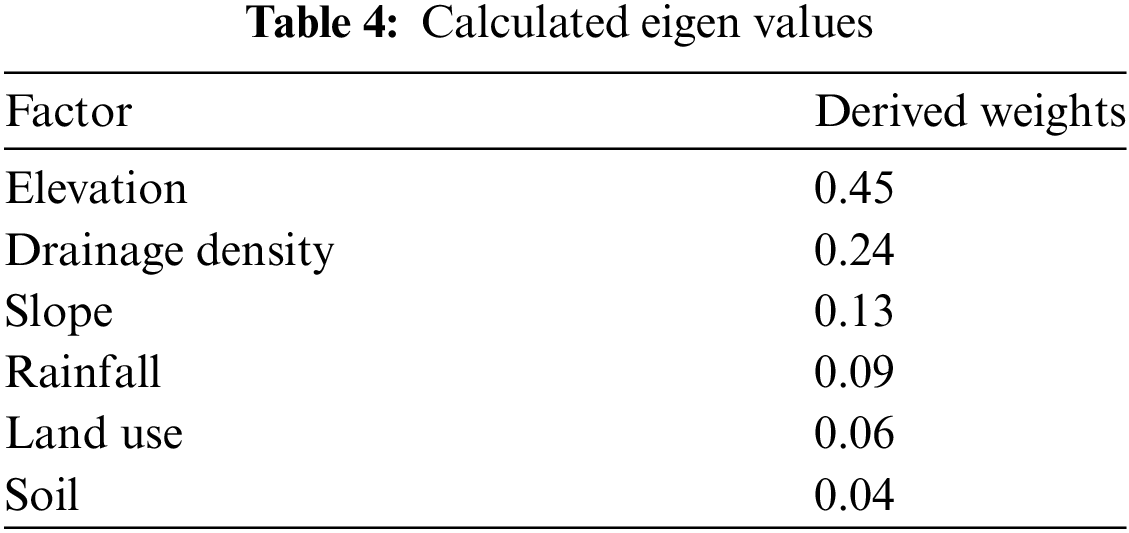
The weighted overlay (Table 2) technique is performed using the raster calculator in ArcGIS. The flood hazard risk map is created by assigning weights to each element, as indicated in Table 3, and conducting a pairwise comparison using Saaty’s scale. These weights (Table 4) were determined based on the researcher’s field observations and data gathered from other relevant studies.
MaxEnt Model Calibration and Validation
It is necessary to compare the AHP and MaxEnt for flood hazard mapping because each method offers distinct advantages. AHP uses the expert judgment of researchers to evaluate flood-creating factors, making it useful for incorporating subjective assessments and prioritizing based on importance. On the other hand, MaxEnt is a machine learning algorithm that predicts flood-prone areas based on presence-only data and handles complex interactions between variables, relying more on empirical evidence. While AHP is valuable in regions with limited data by integrating expert knowledge, MaxEnt excels in identifying patterns and predicting hazards based on available data. The areas categorised under different flood hazard zones are detailed in Tables 5 and 6. As shown in Tables 5 and 6, hazard risk areas are predominantly located near the river channel.
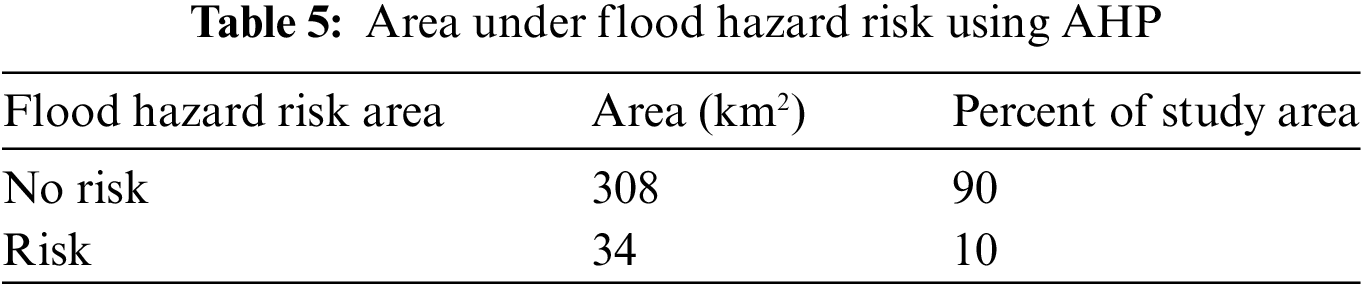
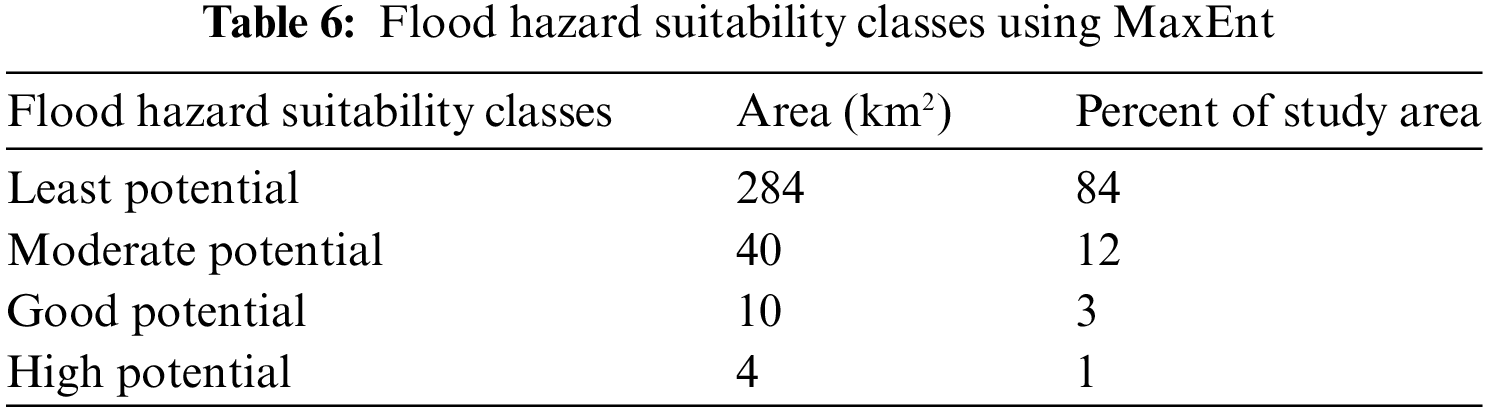
An extensive field survey was conducted from the year 2013 to 2023, during which flood point data were collected using handheld GPS devices. The model uses eight presence records and three for testing, alongside 10,000 background points to regulate the probable distribution of floods. Model validation was performed using AUC values (Fig. 3) with a jackknife test (Fig. 4), with a training AUC of 0.978 and a test AUC of 0.983. Additionally, the model was rigorously tested through various replicated run types, such as cross-validate, boot-strap and sub-sampling, each replicated 15 times to ensure robust results. The resulting flood hazard map (Fig. 5) indicates that areas at risk of flooding categorised as moderate, good, and high-risk areas comprise 16% of the total area, which is 6% more than what the AHP method in GIS indicated. A comparison of the AUC values revealed that the AHP method yielded an AUC of 0.967, while the MaxEnt method produced an AUC of 0.978, with a marginal difference of just 0.01. Ultimately, the final model for visualization was refined and validated through field investigations. The MaxEnt model outperformed AHP for flood hazard mapping due to several reasons. MaxEnt is designed to handle presence-only data, which is often more readily available and reliable in flood hazard studies. AHP, on the other hand, requires both presence and absence data, which can be harder to obtain and less accurate [11]. MaxEnt uses a machine learning approach that can model complex relationships between variables more effectively than the simpler, linear approach of AHP. This allows MaxEnt to capture the nuances of flood dynamics better. MaxEnt can incorporate a wide range of environmental variables and their interactions, making it more adaptable to different geographical and climatic conditions. AHP, while useful, is more rigid in its structure and less capable of handling complex variable interactions [11]. In practical scenarios, the AHP model excels in situations requiring a multi-criteria decision-making process, making it highly suitable for local governance and planning. This model can integrate various factors, such as topography, rainfall patterns, and land use, to provide a comprehensive flood hazard assessment.
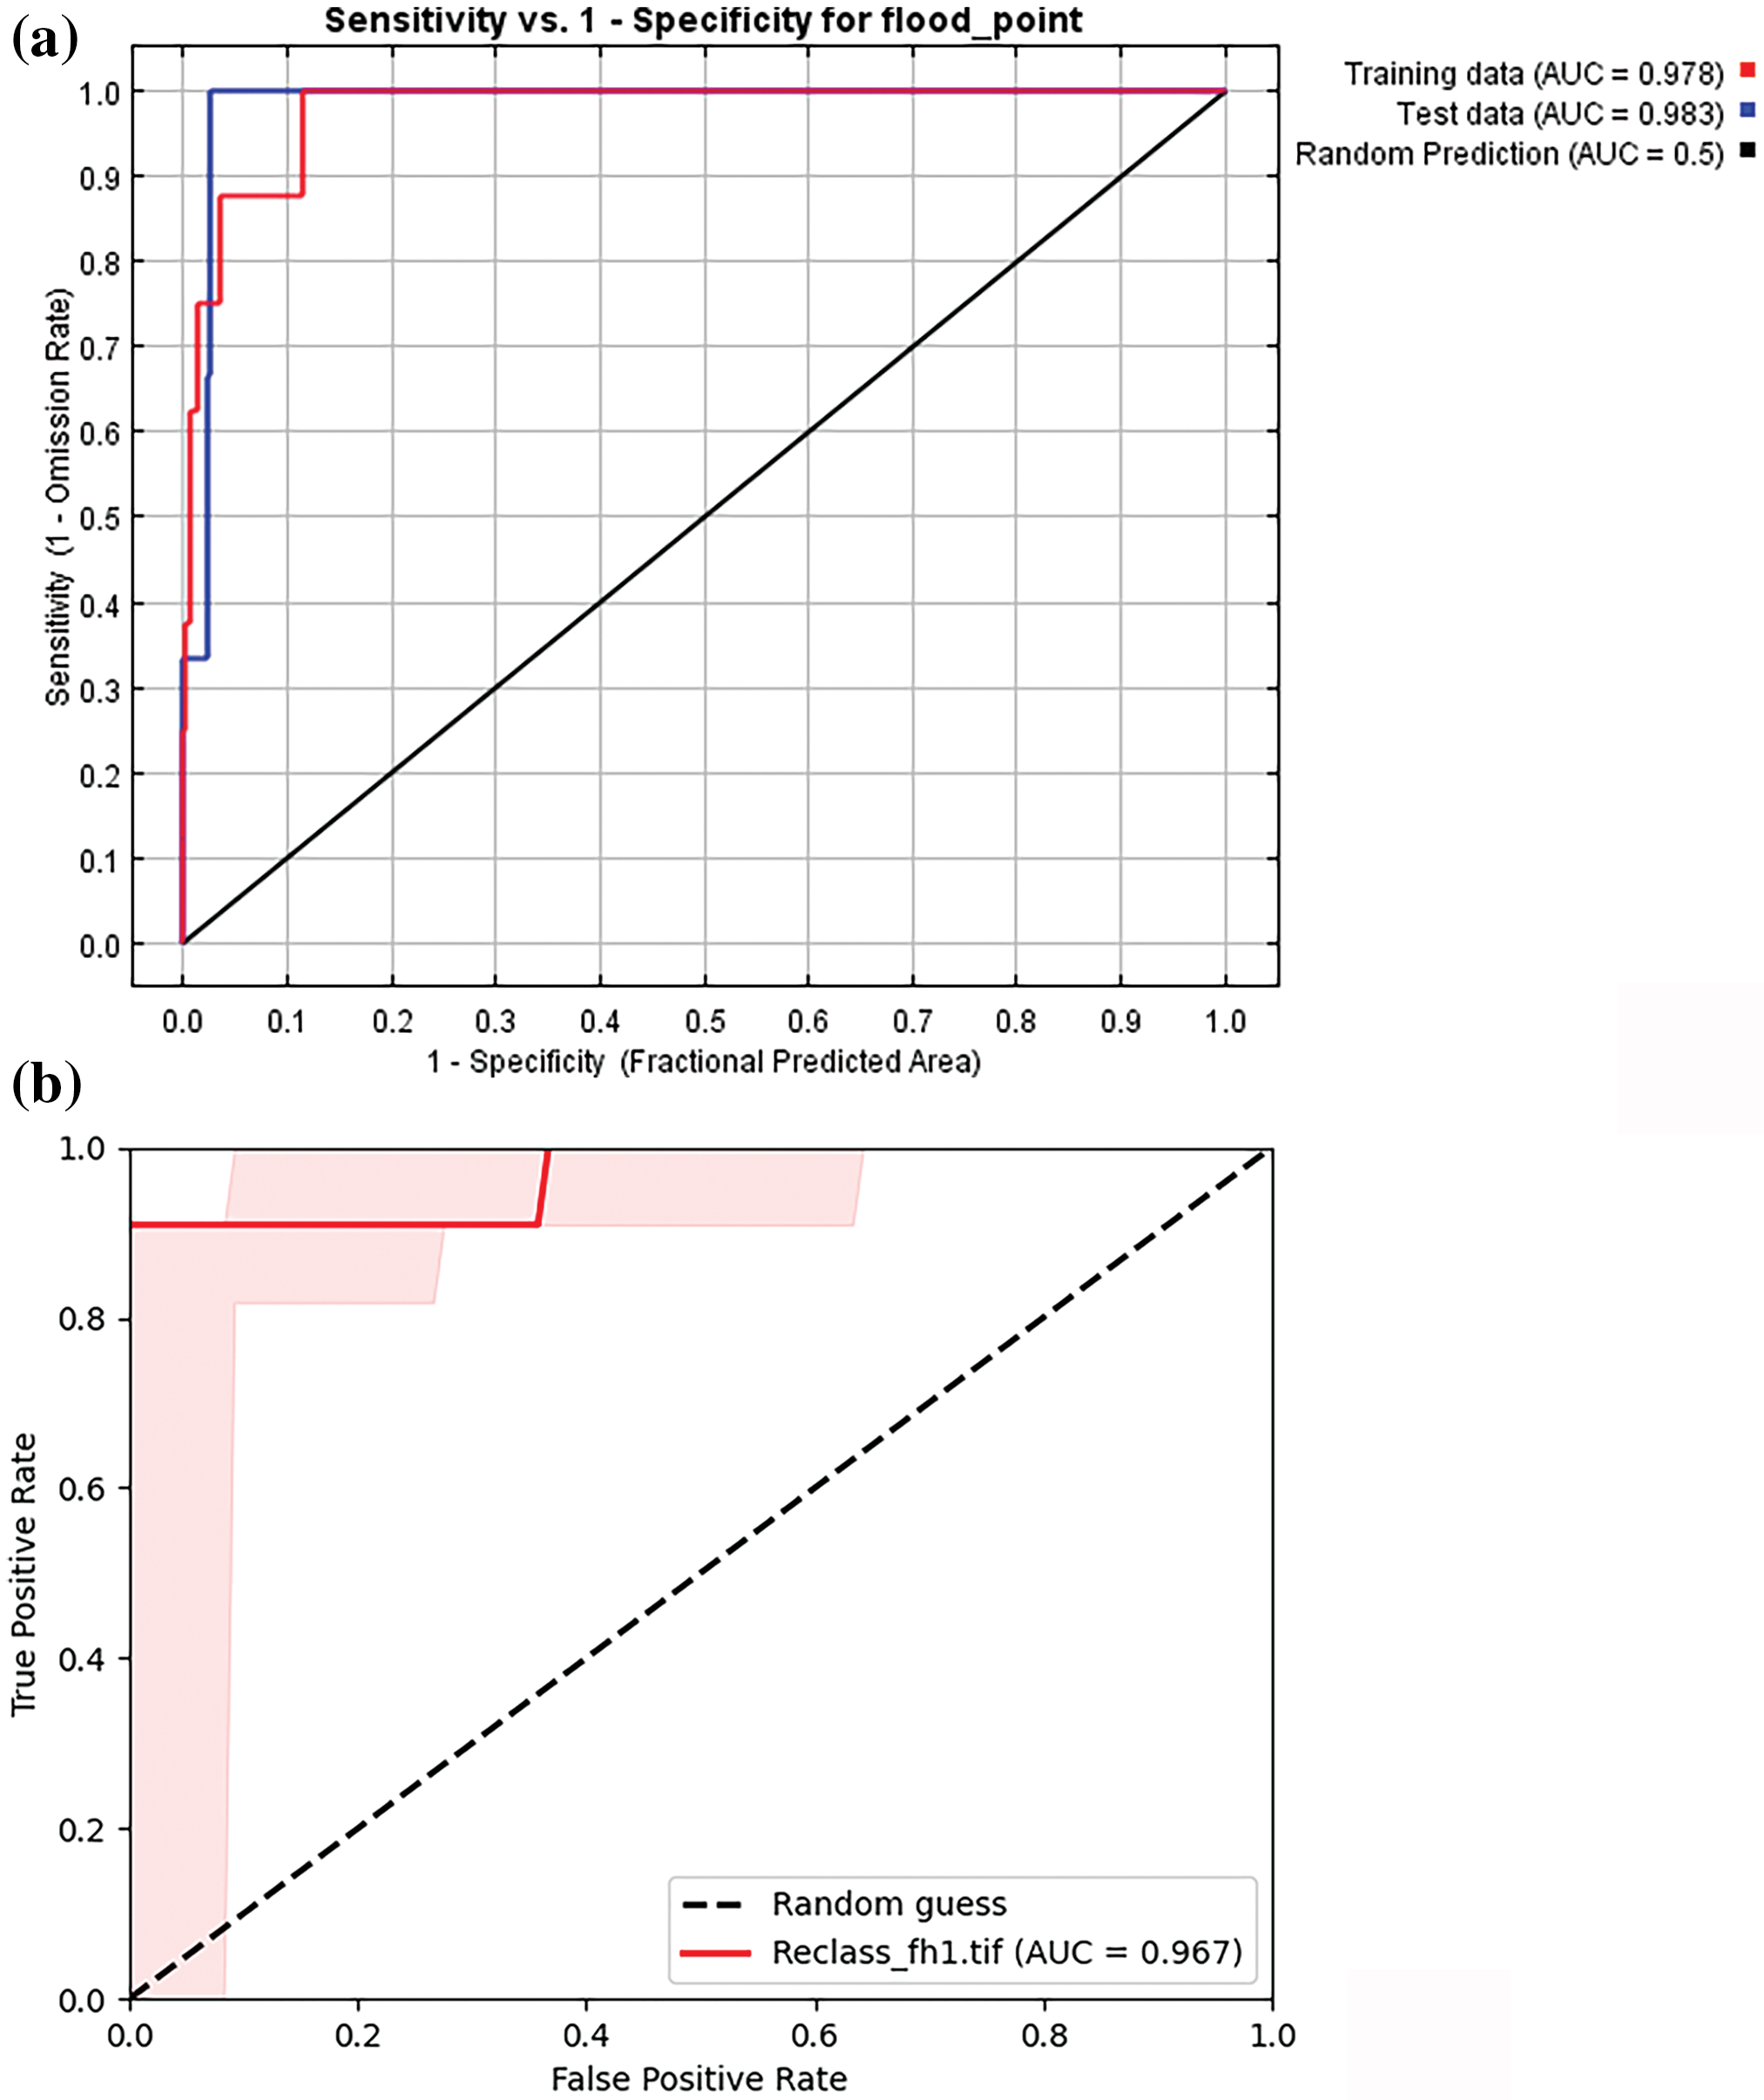
Figure 3: (a) AUC graph of MaxEnt model (b) AUC graph of AHP method
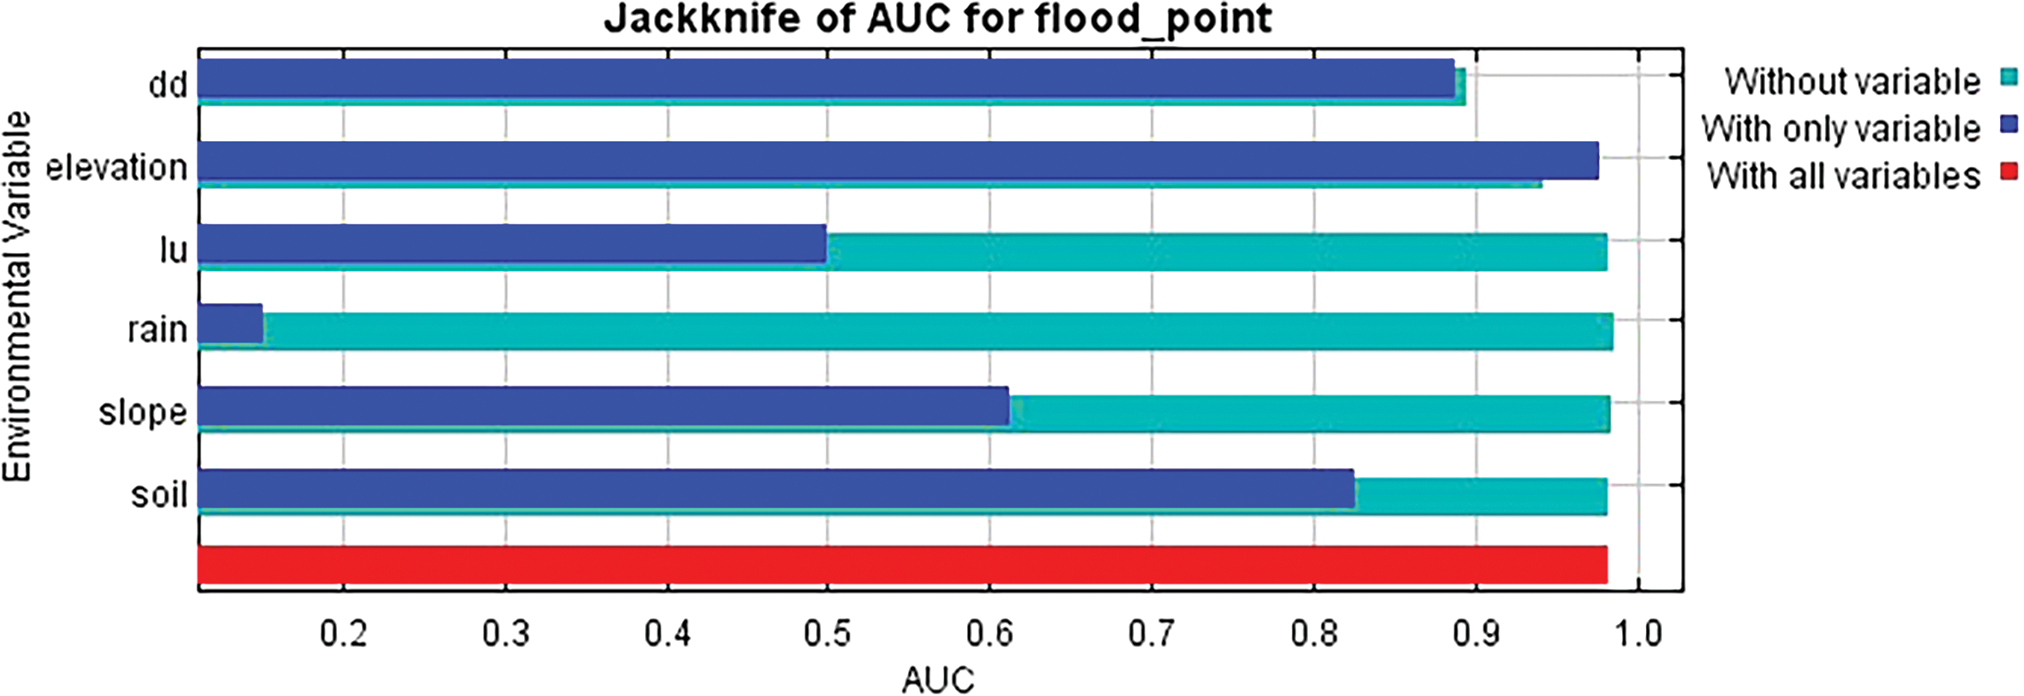
Figure 4: Jackknife test for evaluating relative importance of environmental variables
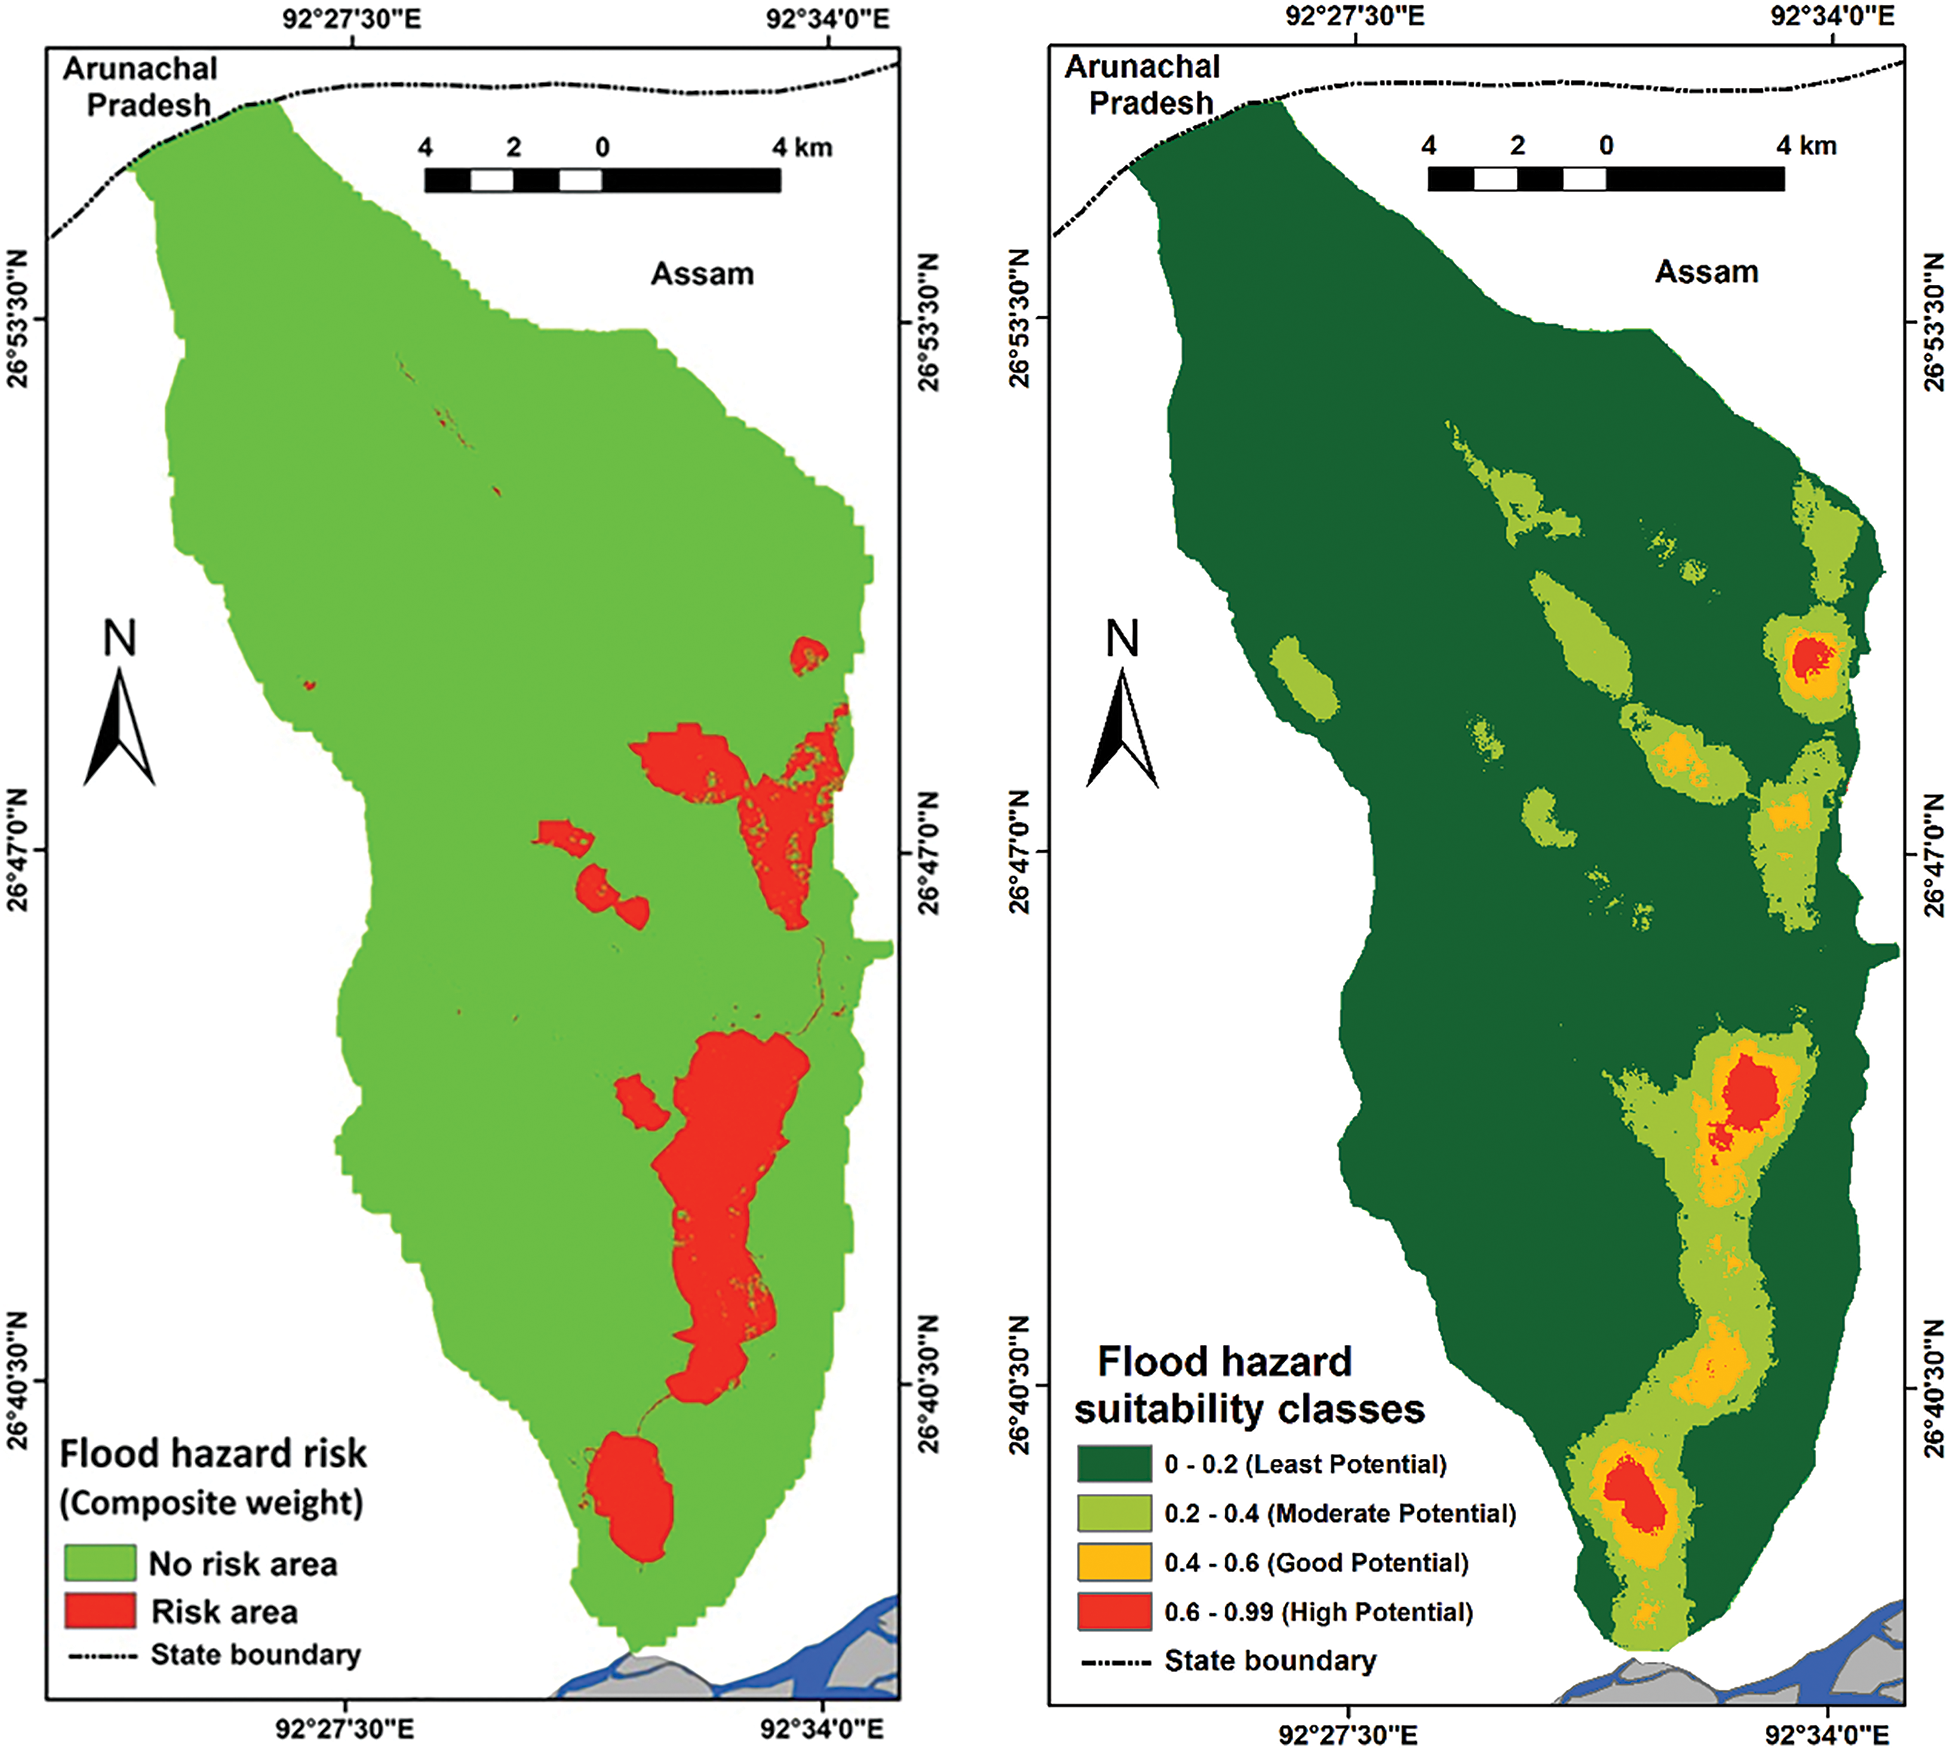
Figure 5: Flood hazard risk area
Conversely, the MaxEnt model, known for its capacity to predict species distribution and environmental suitability, can be particularly beneficial in scenarios with detailed environmental data. The MaxEnt model is great at making accurate hazard predictions. This is important for specific flood management strategies and emergency response.
The current study shows how useful the AHP and MaxEnt models are in flood hazard management. They help policymakers and stakeholders make better decisions for sustainable development and disaster prevention.
To apply multi-criteria evaluation techniques, all relevant parameters were analysed and necessary files were prepared. The hazard map clearly illustrates that the lower portion of the basin is highly susceptible to flooding, primarily due to the area’s favorable topographic structure. Consequently, elevation and slope are identified as the key factors contributing to this high-hazard condition.
In contrast, the uppermost part of the basin is not prone to flooding, largely due to its elevation and land cover characteristics. This study reveals that land use and land cover patterns are the root causes of flooding in the lower part of the basin. The current land use and land cover practices could lead to long-term unsustainability in the floodplain. Therefore, it is crucial to scientifically regulate the land-use practices in these flood-prone areas. Flooding in the study area plays a significant role in shaping fluvial features and landforms, highlighting its importance in the region’s geomorphological development. This study, which compares AHP and MaxEnt models, provides valuable insights into river basin analysis. Future research could focus on integrating additional variables or exploring the temporal dynamics of the models. Moreover, the practical applications of these models in local governance and community planning are significant. Implementing these methodologies can aid in resource management, disaster preparedness, and sustainable development initiatives within the river basin.
Acknowledgement: The authors express their gratitude to DST-FIST for its support in establishing the laboratory at the Department of Geography, Gauhati University.
Funding Statement: Lab facilities are supported by DST-FIST. The DST-FIST program, under the Department of Science and Technology, Government of India, provides financial assistance through the ‘Fund for Improvement of S&T Infrastructure in Universities and Higher Educational Institutions’ (FIST) scheme.
Author Contributions: Study conception and design: Nilotpal Kalita; data collection: Nilotpal Kalita; analysis and interpretation of results: Nilotpal Kalita, Ashok Kumar Bora, Rana Sarmah, Dhrubajyoti Sahariah, Manash Jyoti Nath; draft manuscript preparation: Nilotpal Kalita, Ashok Kumar Bora, Rana Sarmah, Dhrubajyoti Sahariah, Manash Jyoti Nath. All authors reviewed the results and approved the final version of the manuscript.
Availability of Data and Materials: The data that support the findings of this study are available from the corresponding author, NK and MJN, upon reasonable request.
Ethics Approval: Not applicable.
Conflicts of Interest: The authors declare no conflicts of interest to report regarding the present study.
References
1. Armenakis C, Du EX, Natesan S, Persad RA, Zhang Y. Flood risk assessment in urban areas based on spatial analytics and social factors. Geosciences. 2017;7(4):123. doi:10.3390/geosciences7040123. [Google Scholar] [CrossRef]
2. Das B. Flood hazard mapping and road network vulnerability analysis of Kamrup and Kamrup Metropolitan Districts: case study of Assam flood 2019. Int J Sci Res. 2022;11(5):314–24. doi:10.21275/SR22501092926. [Google Scholar] [CrossRef]
3. Getahun YS, Gebre SL. Flood hazard assessment and mapping of flood inundation area of the Awash River Basin in Ethiopia using GIS and HEC-GeoRAS/HEC-RAS model. J Civil Environ Eng. 2015;5(4):1000178. doi:10.4172/2165-784X.1000179. [Google Scholar] [CrossRef]
4. Sikka DR. Norms and criteria for initiating scientific assessment of flood damage in non-uniform conditions in Madhya Pradesh. In: Proceedings of International Association of Hydraulics Research Symposium on River Mechanics, 1973; Bangkok, Thailand. [Google Scholar]
5. Sinha R, Bapalu GV, Singh LK, Rath B. Flood risk analysis in the Kosi river basin, north Bihar using multi-parametric approach of analytical hierarchy process (AHP). J Indian Soc Remote Sens. 2008;36(4):335–49. doi:10.1007/s12524-008-0034-y. [Google Scholar] [CrossRef]
6. Ajin RS, Krishnamurthy RR, Jayaprakash M, Vinod PG. Flood hazard assessment of Vamanapuram River Basin, Kerala, India: an approach using Remote Sensing & GIS techniques. Adv Appl Sci Res. 2013;4(3):263–74. [Google Scholar]
7. Itodo I, Duadu J. A study of soil properties relevant to the design of yam harvesters in the Benue flood plain of Nigeria. Agric Mechaniz Asia Afr Latin Am. 2003;34(4):30–4. [Google Scholar]
8. Yahaya S, Ahmad N, Abdalla RF. Multicriteria analysis for flood vulnerable areas in Hadejia-Jama’are River Basin. Nigeria Eur J Sci Res. 2010;42:71–83. [Google Scholar]
9. Sneha MS, Nagar V, Moral S, Teli B. Preparation of flood model and hazard estimation on Yamuna River (using GIS and remote sensing). Int Res J Eng Technol. 2018;5(3):3591–7. [Google Scholar]
10. Phillips SJ, Dudík M. Modeling of species distributions with Maxent: new extensions and a comprehensive evaluation. Ecography. 2008;31(2):161–75. doi:10.1111/j.0906-7590.2008.5203.x. [Google Scholar] [CrossRef]
11. Harshasimha AC, Bhatt CM. Flood vulnerability mapping using MaxEnt machine learning and analytical hierarchy process (AHP) of Kamrup Metropolitan District, Assam. Environ Sci Proc. 2023;25(1):73. doi:10.3390/ECWS-7-14301. [Google Scholar] [CrossRef]
12. Javidan N, Kavian A, Pourghasemi HR, Conoscenti C, Jafarian Z, Rodrigo-Comino J. Evaluation of multi-hazard map produced using MaxEnt machine learning technique. Sci Rep. 2021;11(1):6496. doi:10.1038/s41598-021-85862-7. [Google Scholar] [PubMed] [CrossRef]
13. Qasimi AB, Isazade V, Berndtsson R. Flood susceptibility prediction using MaxEnt and frequency ratio modeling for Kokcha River in Afghanistan. Nat Hazards. 2024;120(2):1367–94. doi:10.1007/s11069-023-06232-2. [Google Scholar] [CrossRef]
14. Cabrera JS, Lee HS. Flood risk assessment for Davao Oriental in the Philippines using geographic information system-based multi-criteria analysis and the maximum entropy model. J Flood Risk Manag. 2020;13(2):e12607. doi:10.1111/jfr3.12607. [Google Scholar] [CrossRef]
15. Das S, Gupta A. Multi-criteria decision based geospatial mapping of flood susceptibility and temporal hydro-geomorphic changes in the Subarnarekha basin, India. Geosci Front. 2021;12(5):101206. doi:10.1016/j.gsf.2021.101206. [Google Scholar] [CrossRef]
16. Parsian S, Amani M, Moghimi A, Ghorbanian A, Mahdavi S. Flood hazard mapping using fuzzy logic, analytical hierarchy process, and multi-source geospatial datasets. Remote Sens. 2021;13(23):4761. doi:10.3390/rs13234761. [Google Scholar] [CrossRef]
17. Debnath J, Sahariah D, Mazumdar M, Lahon D, Meraj G, Hashimoto S, et al. Evaluating flood susceptibility in the Brahmaputra River Basin: an insight into Asia’s Eastern Himalayan floodplains using machine learning and multi-criteria decision-making. Earth Syst Environ. 2023;7(4):733–60. doi:10.1007/s41748-023-00358-w. [Google Scholar] [CrossRef]
18. Debnath J, Sahariah D, Nath N, Saikia A, Lahon D, Islam MN, et al. Modelling on assessment of flood risk susceptibility at the Jia Bharali River basin in Eastern Himalayas by integrating multicollinearity tests and geospatial techniques. Model Earth Syst Environ. 2024;10(2):2393–419. doi:10.1007/s40808-023-01912-1. [Google Scholar] [CrossRef]
19. Khan R, Anwar J, Said S, Ansari S, Pathan AI, Sidek LM. GIS based flood hazard and risk assessment using multi-criteria decision making approach in Rapti River watershed, India. In: International Conference on Intelligent Computing & Optimization, 2023 Apr; p. 95–103. doi:10.1007/978-3-031-50158-6_10. [Google Scholar] [CrossRef]
20. Vashist K, Singh KK. Flood hazard mapping using GIS–based AHP approach for Krishna River basin. Hydrol Process. 2024;38(6):e15212. doi:10.1002/hyp.15212. [Google Scholar] [CrossRef]
21. Yaseen ZM. Flood hazards and susceptibility detection for Ganga River, Bihar state, India: employment of remote sensing and statistical approaches. Results Eng. 2024;21:101665. doi:10.1016/j.rineng.2023.101665. [Google Scholar] [CrossRef]
22. Kalita N, Bora AK. Flood inundation mapping in Belsiri River Basin linking HEC-RAS and HEC-GeoRAS model and flood frequency analysis. Int J Lakes Rivers. 2024;17(1):47–55. doi:10.37622/IJLR/17.1.2024.47-55. [Google Scholar] [CrossRef]
23. Kalita N. Flood, erosion and bed aggradation in the Belsiri River of Assam, India (Ph.D Thesis). Gauhati University; Guwahati, India; 2017. [Google Scholar]
24. Chang KT. Introduction to geographic information systems. Boston: McGraw-Hill; 2008. vol. 4. [Google Scholar]
25. Magesh NS, Jitheshlal KV, Chandrasekar N, Jini KV. Geographical information system-based morphometric analysis of Bharathapuzha river basin, Kerala. India Appl Water Sci. 2013;3:467–77. doi:10.1007/s13201-013-0095-0. [Google Scholar] [CrossRef]
26. Saaty TL. The analytic hierarchy process (AHP). J Oper Res Soc. 1980;41(11):1073–6. [Google Scholar]
27. Bapalu GV, Sinha R. GIS in flood hazard mapping: a case study of Kosi River Basin. India GIS Dev Wkly. 2005;1(13):1–3. doi:10.13140/RG.2.1.1492.2720. [Google Scholar] [CrossRef]
28. Bajpai MP, Mishra ML. The 1938 floods in the eastern United Provinces. Calcutta Geogr Rev. 1939;2(2). [Google Scholar]
29. Goudie A. Alphabetical glossary of geomorphology, version 1.0. International Association of Geomorphologists; 2014. p. 1–84. [Google Scholar]
30. Nicholls N, Wong KK. Dependence of rainfall variability on mean rainfall, latitude, and the Southern Oscillation. J Clim. 1990;3(1):163–70. doi:2.0.CO;2}{\color{black}10.1175/1520-0442(1990)0032.0.CO;2}?>. [Google Scholar]
31. Norallahi M, Kaboli HS. Urban flood hazard mapping using machine learning models: GARP, RF, MaxEnt and NB. Nat Hazards. 2021;106:119–37. doi:10.1007/s11069-020-04453-3. [Google Scholar] [CrossRef]
Cite This Article
 Copyright © 2025 The Author(s). Published by Tech Science Press.
This work is licensed under a Creative Commons Attribution 4.0 International License , which permits unrestricted use, distribution, and reproduction in any medium, provided the original work is properly cited.
 Downloads
 Citation Tools