
 Submit a Paper
 Propose a Special lssue
 Open Access
ARTICLE
Spatial Variability Assessment on Staple Crop Yields in Hisar District of Haryana, India Using GIS and Remote Sensing
1 Centre for Climate Change & Water Research, Suresh Gyan Vihar University, Jaipur, 302017, India
2 Haryana Space Applications Centre (HARSAC), Hisar, 125004, India
3 Department of Geography, SakaryaUniversity, Sakarya, 08390, Turkey
4 Department of Geography, School of Environment and Earth Sciences, Central University of Punjab, Bathinda, 151401, India
* Corresponding Author: Suraj Kumar Singh. Email:
(This article belongs to the Special Issue: Geospatial Data Quality: Unraveling the Essentials)
Revue Internationale de Géomatique 2025, 34, 71-88. https://doi.org/10.32604/rig.2025.057963
Received 01 September 2024; Accepted 10 January 2025; Issue published 24 February 2025
 View Full Text
 Download PDF
Abstract
Agriculture is a primary activity in many countries, with wheat being a major cereal crop in India. Accurate pre-harvest forecasts of crop acreage and production are critical for policymakers to address supply-demand dynamics, pricing, and trade. This study focuses on estimating wheat acreage and yield in Barwala block, Hisar district, Haryana, for the 2019–2020 Rabi season using remote sensing techniques. Multi-temporal satellite data capturing phenological stages of wheat (Seedling to Ripening) were processed using supervised classification with a maximum likelihood classifier in ERDAS Imagine. Wheat crop acreage was determined by overlaying ground truth points on the classified data. The estimated acreage showed a relative deviation of −1.07% compared to statistics from the Department of Agriculture (DoA), Haryana. Yield assessment employed a Semi-Physical model based on the Modified Monteith Model. Key parameters included Photosynthetically Active Radiation (PAR), fraction of PAR absorbed by wheat (fAPAR), light use efficiency, and water stress derived from the Land Surface Water Index (LSWI) using Sentinel-2 NIR and SWIR-1 bands. Net Primary Productivity (NPP) was computed for the wheat growth period, and grain yield was estimated using a harvest index obtained from literature. The estimated yield had a relative deviation of 9.3% from DoA data. The study demonstrates the potential of multi-temporal satellite imagery for accurate block-level wheat acreage and yield estimation, providing a valuable tool for agricultural planning and policy-making.Keywords
Nomenclature
| PAR | Photosynthetically Active Radiation |
| fAPAR | Fraction of Absorbed Photosynthetically Active Radiation |
| LSWI | Land Surface Water Index |
| NPP | Net Primary Productivity |
| DoA | Department of Agriculture |
| SWIR | Shortwave Infrared |
Agriculture is the most important tool or asset that has been regarded by human civilization for their survival, which has evolved alongside the development of human society [1]. The ongoing changes in human civilization have led to the advancement of more tools and techniques aimed at adapting to these changes and increasing crop production yields, such as crop rotation and various other methods [2,3].
Global development has impacted societal changes that have emerged in the context of industrial development, computerization, and the use of satellite data, leading to a revolution in crop production [4]. The increase in agricultural technology helps utilize agricultural land effectively, ensuring that not a single inch is wasted through proper management. The implementation of large-scale equipment and heavy machinery has not only increased production but also accelerated the use of fertilizers and technology, resulting in a production boom [5–7]. This high production and crop rotation lead to the gathering of more crops and different types of crops from the same land within a year. In India, the system for collecting crop statistics was initiated in 1884 [8]. Crop statistics are required by various agencies, such as the Ministry of Agriculture and Farmers Welfare and the Ministry of Textiles, for planning purposes. It is necessary to know the production forecast of crops, which significantly aids planners and policymakers. The Indian economy is based on agriculture, with about 70% of the total population dependent on this sector. India is the second-largest producer of wheat, with Haryana, Punjab, Uttar Pradesh, Uttarakhand, Madhya Pradesh, Delhi, Bihar, Rajasthan, and Chhattisgarh being the leading contributing states. The production, yield, and total area of crops inform policy decisions regarding storage, transportation, marketing, distribution, and several other subjects [9].
Despite recent industrial development, Haryana remains primarily an agrarian state. Almost 70%–80% of the workforce is employed in agriculture. Haryana is self-sufficient in food products and is the second-largest contributor to India’s central pool of grains, producing wheat and rice as the main crops, along with cotton, mustard, oilseeds, sugarcane, gram, barley, corn, and millets as other crops. Wheat (Triticum spp.) is one of the most important and strategic food crops for many countries and populations worldwide, serving as the staple food for about 35% of the global population and accounting for 20% of the food calories consumed globally [10]. Wheat is sown from November to December and harvested from March to April. Haryana has a wide irrigation infrastructure and a main system supported by proper canal systems and tube wells, which play an important role in wheat production.
The production of crops relies on soil quality, and in this context, the alluvial soils along riverbanks are particularly suitable, yielding a high quantity of food grains. India is a vast country with numerous rivers and plains conducive to agriculture. In the central part of the country, the Haryana region stands out as flat and has extensive agricultural areas, allowing for significant production using heavy machinery. Therefore, this paper will examine the agricultural products and various techniques employed across different seasons, as well as calculate the production of these agricultural products in the region.
Yield assessment is a crucial aspect of agricultural production aimed at maximizing crop yield while minimizing costs at both national and regional levels [11]. Several methods exist for yield estimation, including empirical models, crop-cutting methods, and crop growth models [12–14]. These conventional models tend to be time-consuming and costly [15]. Estimates are derived post-harvest through crop-cutting experiments, which are applicable for determining yield across an area. The crop-cutting experiment is designed using stratified multi-random sampling: 1) district or tehsil, 2) revenue, 3) survey number, 4) fields, and 5) experimental plots of specified size and shape. With the advent of satellite imagery, researchers have gained significant insights into crops, as remote sensing and GIS are effective for crop classification, acreage estimation, monitoring crop health, and yield estimation due to their accuracy and reduced time requirements [16–18]. Crop discrimination and classification using time series satellite data can also yield valuable information regarding crop rotation records, crop management, food security, and causes of crop stress, all of which are vital for formulating agricultural policies. While early estimation of acreage, production, and yield is essential, remote sensing and GIS facilitate crop assessment and discrimination, as explored by space applications in India [19].
During the national-level project titled “Crop Acreage and Production Estimate (CAPE)” in 1988, the proposal for crop acreage and production forecasting using satellite data aimed to generate extensive spatial and non-spatial databases. Previous studies focused on creating statistical data for crop acreage [20–23] and developing yield models through the integration of agro-climatic and spectral data [24]. This innovation and its application benefited crops such as wheat, rice, mustard, groundnut, and sorghum by facilitating large-area crop inventory and yield modeling. The project’s user feedback and limitations led to a new initiative called Forecasting Agricultural Output Using Space, Agro-meteorology, and Land-based Observations (FASAL) [25]. The wheat crop yield at the district level is estimated using various models and procedures: 1) Semi-Physical Model, 2) Empirical Model, 3) Agro-meteorological Model, and 4) Crop Simulation Model (e.g., CERES-Wheat model [26], WOFOST model). The agro-meteorological regression model and crop simulation model have been piloted by IMD in collaboration with several agricultural universities [27].
Agriculture can be regarded as the science, art, and practice of cultivating the soil, growing crops, and raising livestock. Human civilization, most customs, and cultures in the world revolve around agriculture. The monitoring of agriculture has greater importance in the global challenges concerning climate variations, increased demand for food, and increase in population rise [28].
In the present study, yield estimation at block level is proposed using multi-temporal satellite data. The discrimination and classification of wheat crops from other associated Rabi season crops were performed through a supervised classification approach in which the Maximum Likelihood Method (MLM) classifier was selected followed by ground truth points. The Modified Monteith Model was used at the block level for the yield estimation as the modified model is based on the concept of biomass, which is a function of the total photo-synthetically active radiation and the ability of the plant to absorb and to convert this radiation to dry matter [29].
Barwala block is the study area located in the Hisar district of Haryana. The location map of the study area is shown in Fig. 1. The Barwala block has a latitudinal and longitudinal extent of 25.3642° N to 75.0957° E, covering a total area of 476.82 km2. Hisar is one of the important districts in Haryana and is recognized as the highest producer of steel due to the presence of Jindal Stainless Steel Factories. Hisar has a total population of 1,742,815 and ranks second in terms of population within the state of Haryana [30]. It is a landlocked district that shares its boundaries with Fatehabad to the north, Jind and Rohtak to the east, Bhiwani to the south, and Rajasthan to the west. The district’s agriculture is supported by two major canal systems: the Bhakra Canal System and the Western Yamuna Canal System. It features a plain topography with a gentle slope and an elevation of 234 m above mean sea level. Haryana is the fourth-largest producer of wheat, contributing 12% of the total wheat production. The state has 86% of its area classified as arable, of which 96% is cultivated. It also ranks second in fish productivity per hectare and has been declared a Fish Disease Free State by the Indian Council of Agricultural Research. The climate of Haryana is subtropical, semi-arid to sub-humid, continental, and monsoon type, with mean annual rainfall ranging from 500 to 1000 mm, over 75% of which occurs between June and September [31,32]. Maximum temperatures in the area exceed 40°C in May and June, and hot dry winds are commonly observed. The major parts of the region are covered with Sierozem soil, which has low organic content, less humus, and characteristics typical of desert-type soil.

Figure 1: The map representing location of Hisar district (a) and, Barwala block (b)
2.2 Data Collection and Methodology
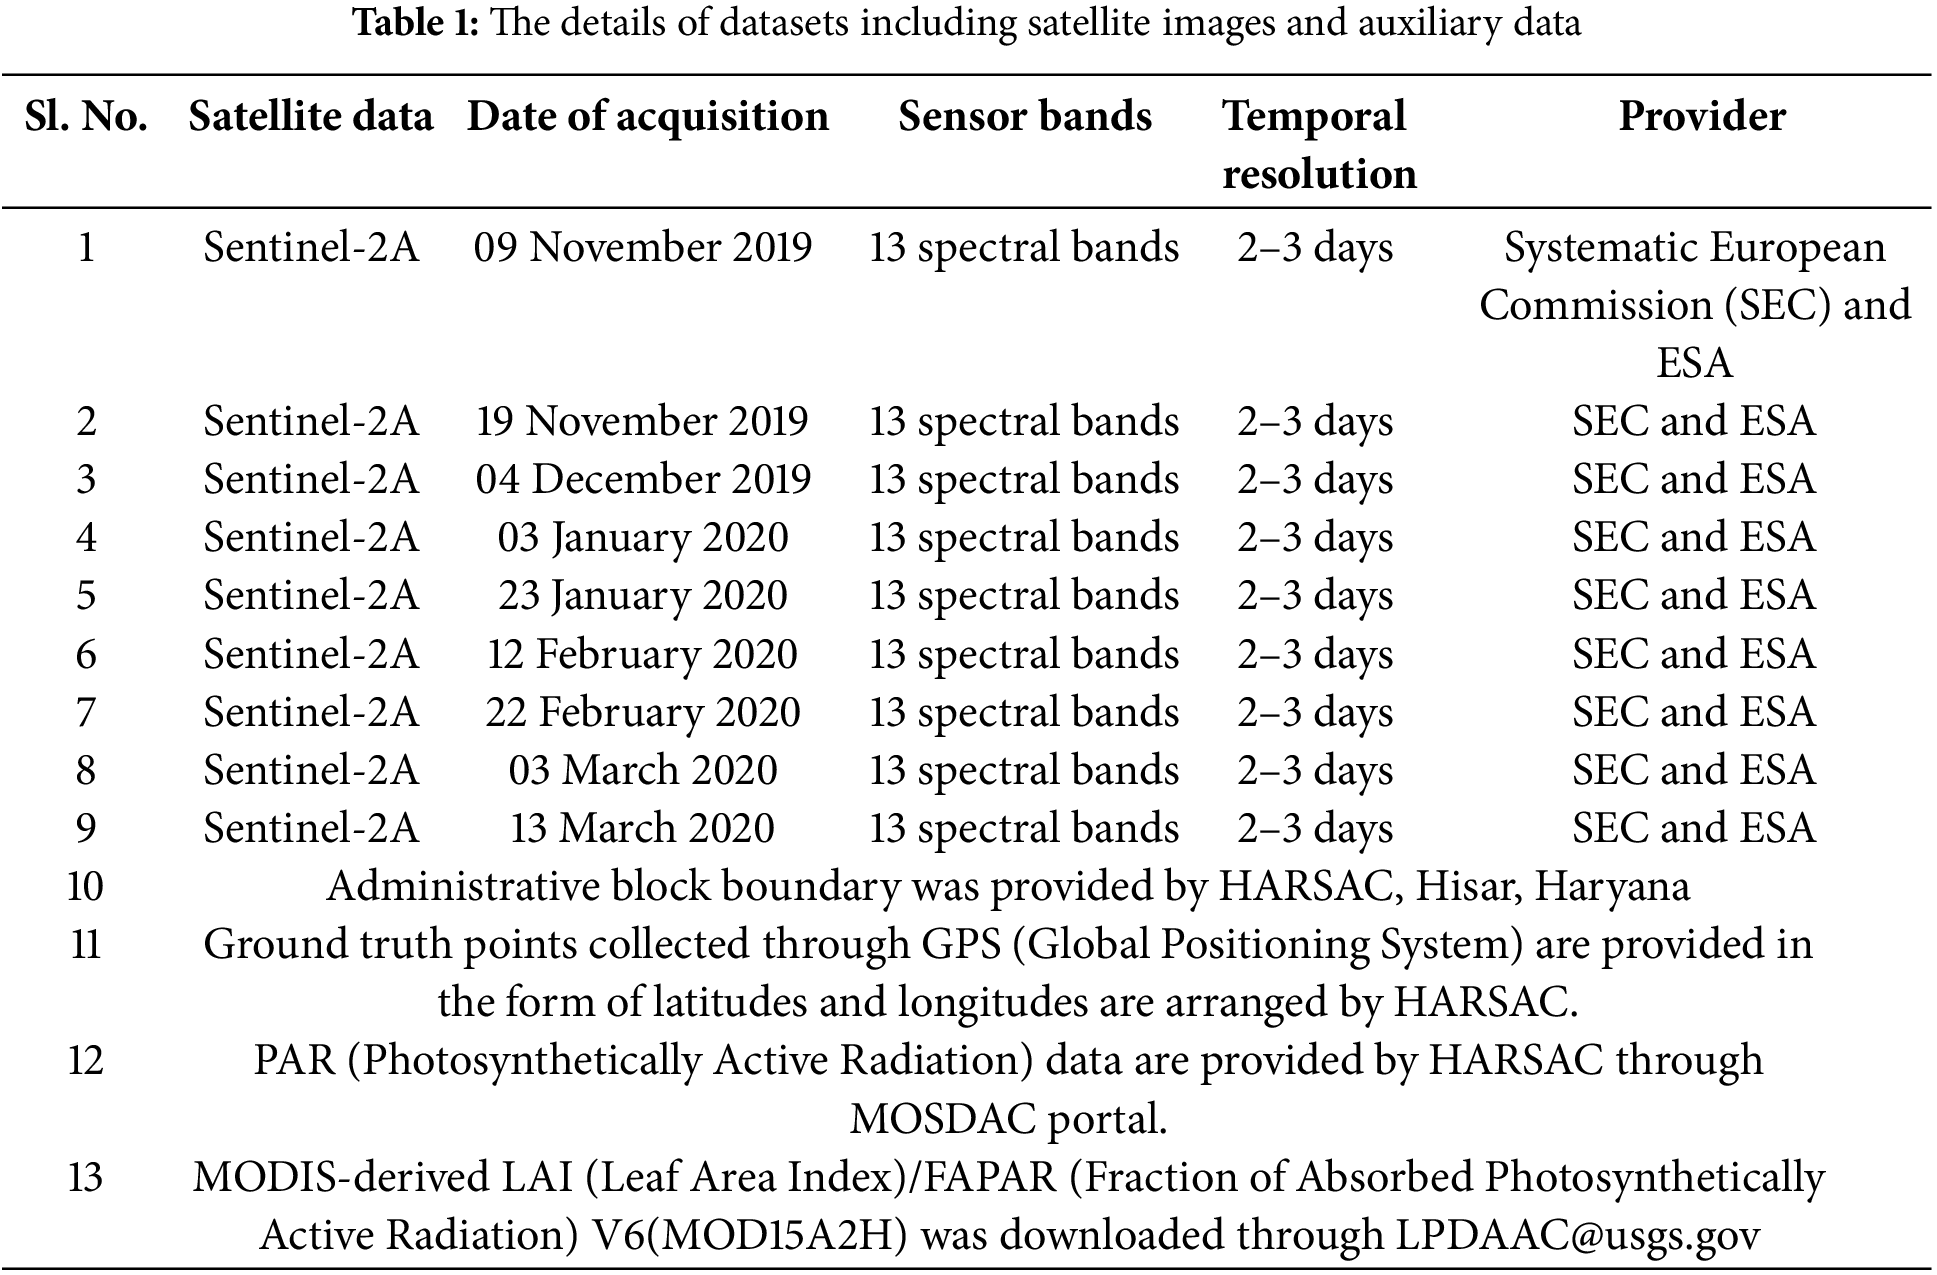
This study was conducted in the Barwala block of Hisar district in the Haryana state of India to differentiate the wheat crop from other associated Rabi crops and to estimate the acreage and forecast the yield of wheat using satellite images. High-resolution Sentinel 2 satellite images were downloaded from the Copernicus data hub (https://scihub.copernicus.eu/) (accessed on 09 January 2025), and pre-processing was carried out for the datasets (Table 1). The pre-processing steps included resampling, layer stacking, and subsetting of satellite images. Subsequently, supervised classification was performed using a maximum likelihood algorithm to identify the respective crops. The Maximum Likelihood Classifier is a well-known parametric statistical classifier used for pattern classification [33,34]. The supervised classification was executed using Erdas Imagine version 11 software, and five classes—wheat, mustard, other crops; settlement, and waterbody—were established. Additionally, recoding was conducted for the misclassified areas in the images using field visit data and Google Earth images, resulting in the generation of a wheat mask to calculate the area of wheat.
For calculating the yield Modified Monteith model was applied for which different indices of crop like NDVI (Normalized Difference Index), LSWI (Land Surface Water Index), and Water Stress were generated through the specific models in the wheat mask for estimation of wheat yield. The harvest index and light use efficiency are taken by a literature review of the crops Fig. 2. As agriculture plays an important role in the economy so there is a need for crop area estimation or crop production forecast before pre-harvest and estimation of yield per hectare at local as well as regional levels are important for various policy makers for exporting, importing, pricing and government agencies, etc. With the help of ground truth points and using Erdas Imagine by running certain classification algorithms we have discriminated wheat from other crops and made a mask of it and the area is calculated Fig. 3.

Figure 2: Representing the flow chart of Methodology adopted yield estimation

Figure 3: Representing the flow chart of Methodology adopted for acreage estimation
Further, the Modified Monteith model has been used for forecasting wheat yield, this model is based on the idea that biomass composed by a crop is a function of the amount of PAR absorbed depending upon the incoming radiation and the crop PAR interception [35]. The mechanism based on the incident PAR is transformed into dry matter can be represented as
where,
NPP = Net Primary Productivity or dry matter accumulation in the plant over some time (gm −2 d −1)
PAR = photosynthetically active radiation (MJm−2d −1)
fAPAR = Fraction of incident PAR which is intercepted and absorbed by the canopy
ε = Light use efficiency of absorbed photosynthetically active radiation (gMJ−1)
PAR, fAPAR, and the stress factors were computed over the wheat season from December to April and then integrated. The Monteith efficiency equation has been extended to include water stress (W stress) in photosynthesis and the equation becomes
The final economic yield of wheat is the product of harvest index HI and Net Primary Productivity (NPP) is shown below:
The various procedures considered for the processes included the Land Surface Water Index (LSWI), which is derived from the NIR and SWIR portions of the electromagnetic spectrum for water stress assessment [36]. LSWI is effective for delineating vegetation and is positively correlated with leaf water content [37]. LSWI measures the liquid water molecules that interact with solar radiation. Water stress is assessed using the Land Surface Water Index. PAR is a crucial element in plant physiology applications, biomass production, and natural illumination in greenhouse gases. The PAR value defines the total amount of radiation available for photosynthesis, assuming leaves intercept all radiation. A fraction of PAR is absorbed by plants, referred to as APAR. PAR varies seasonally and changes with latitude and time of day; at night, the PAR value is zero. The fraction of PAR absorbed (FAPAR) is an important tool for estimating crop yield and biomass production, useful for crop cultivation, and depends on factors such as the crop’s canopy structure, atmospheric conditions, and angular configuration. Plant traits and environmental factors are responsible for the efficient conversion of radiation into dry matter. RUE was computed through grain yield and cumulative intercepted radiation [38].
The harvest index in agriculture quantifies the yield of crop species with the total amount of biomass produced [39]. Whereas NDVI is generated from Sentinel satellite images using band 8 (NIR) and band 4 (RED). The fAPAR (Fraction absorbed by photo synthetically active radiation) was computed through the NDVI (Normalized Difference Water Index) value and Factor. Further, the Land Surface Water Index (LSWI) has been calculated using band 8 (NIR) and band 1 (SWIR) to evaluate from the sowing to harvesting stage of the wheat crop. NPP has been calculated for a period of sowing to harvesting stage (December to April) with an intervalof10 days or more due non-availability of satellite images. After the calculation of the NPP of each month, summation of the NPP was done by multiplying with the harvest index (0.4 for wheat crop), and the average yield was calculated for the block given in Table 1. The methodology flow chart adopted for Net Primary Productivity Fig. 4.

Figure 4: Flow chart representing the computation NPP of wheat
This study analyzes the understanding of wheat production, which is sown during the winter months of November and December and harvested in March and April [40]. Additionally, it focuses on crop discrimination, area estimation, and yield assessment, along with an accuracy evaluation for the Barwala block of Hisar district, Haryana, India.
3.1 Crop Discrimination and Classification
The crop discrimination and identification of each crop depends upon its unique reflectance pattern of the electromagnetic spectrum known as the spectral signature. The varying reflectance of the crop is affected by factors like the structure and composition of leaves, canopy structure, stage of the crop, health condition of the crop, ground coverage, etc.
Various crops exhibit different phenological stages, which facilitates the classification and identification of plants through remotely sensed data. Some crops share the same spectral signature in specific data collected at a given time; for these crops, multi-date or temporal satellite images are necessary. Generally, healthy crops or plants with higher chlorophyll content and denser canopy structures reflect more radiation in the Near-Infrared region of the electromagnetic spectrum. In the electromagnetic spectrum, the visible portion, specifically the red (0.6 µm) and blue (0.45 µm) wavelength regions, is absorbed by green plants, while reflectivity is greater in the green regions due to the presence of chlorophyll. Increased photosynthetic activity leads to greater reflectance in the infrared portion and reduced reflectance in the red regions [41].
Through the analysis of time series satellite data for the Barwala block of Hisar, it was observed that wheat and mustard are the major crops cultivated during the Rabi season, identified using multi-date Sentinel 2 satellite data (Fig. 5). The wheat crop was evenly distributed throughout the block. Wheat is sown in the last week of November and harvested in April. The peak vegetative stage of the wheat crop is reached in the first fortnight of March. Therefore, to distinguish the wheat crop from other associated Rabi season crops, the satellite image from March was utilized.

Figure 5: Map showing satellite image (3rd March 2020) and classified wheat mask
Fig. 6 illustrates the spectral profile of wheat, mustard, fallow land, water bodies, and built-up areas for imagery captured on 03 March 2020, coinciding with the peak vegetative stage of the wheat crop. In the graph, the x-axis represents the different wavelength bands (red, green, blue, NIR, SWIR), while the y-axis depicts the mean reflectance. The wheat crop exhibits higher reflectance in the NIR band due to its peak vegetative stage. In contrast, the mustard crop shows lower reflectance in NIR due to a lack of chlorophyll content, as it is in the harvesting stage. Water bodies display lower reflectance across the bands. Both fallow land and built-up areas exhibit reduced reflectance in most bands.

Figure 6: Graph showing spectral profile of 03 March 2020
The graph illustrates the mean value of the Normalized Difference Vegetation Index (NDVI) Fig. 7. The x-axis represents the date of the satellite image, while the y-axis displays the mean value of NDVI. The mean value of NDVI reaches its peak on 3rd March (0.271), because NDVI correlates positively with the chlorophyll content in plants. Notably, 3rd March 2020 marks the peak vegetative stage of wheat, resulting in greater reflectance.

Figure 7: Graph depicting the mean value Normalized Difference Vegetation Index (NDVI)
3.2 Production Forecast for Wheat crop in Barwala Block of Hisar district
Crop area estimation and yield assessment are the two major components for the production forecast of the crops. In this study, crop production forecast for the wheat crop has been performed.
Crop area estimation is essential for various policymakers and planners involved in agricultural development and decision-making regarding exports, imports, procurement, price fixation, storage, buffer stock, public distribution, agro-based industries, and other related issues. For area estimation, crop classification was performed using a supervised classification approach, followed by a maximum likelihood classifier utilizing ground truth points. After generating the wheat crop mask, the area of the wheat was calculated by multiplying the number of pixels in the wheat crop mask by the area of each pixel. The total area of the wheat crop was 30,803 hectares for the Barwala block. Fig. 8 illustrates the classified wheat mask overlaying the ground truth (GT) points.

Figure 8: Classified image of Sentinel-2 on 3rd March 2020 representing Wheat Mask
The relative deviation is calculated from the formulae as below:
where,
RS = Remote Sensing,
DoA = Department of Agriculture, Government of Haryana (India).
The classified image was utilized to calculate the area, which was then compared with the area statistics obtained from the DoA, GoH, maintained by the department after the crop harvest. Table 2 illustrates the area comparison in hectares, revealing a relative deviation of only −1.071%, indicating that the area computed through remote sensing and GIS-based technology closely aligns with reality. Fig. 9 presents a zoomed-in view of the classified wheat crop compared with the Sentinel 2 FCC satellite data from 03 March, 2020, of Barwala. The Ground Truth (GT) point is overlaid on the satellite image, which displays high reflectance, indicating the good quality of the agricultural area. From the optical data, it can be visually interpreted that the bright red patches represent the wheat crops that have been masked. Fig. 10 offers a closer view of the mustard crop compared with the wheat mask. In Fig. 10, the FCC satellite image depicting the mustard crop corresponding to the classified wheat mask is absent. Thus, the mustard crop is distinguished from the wheat area in the present study.
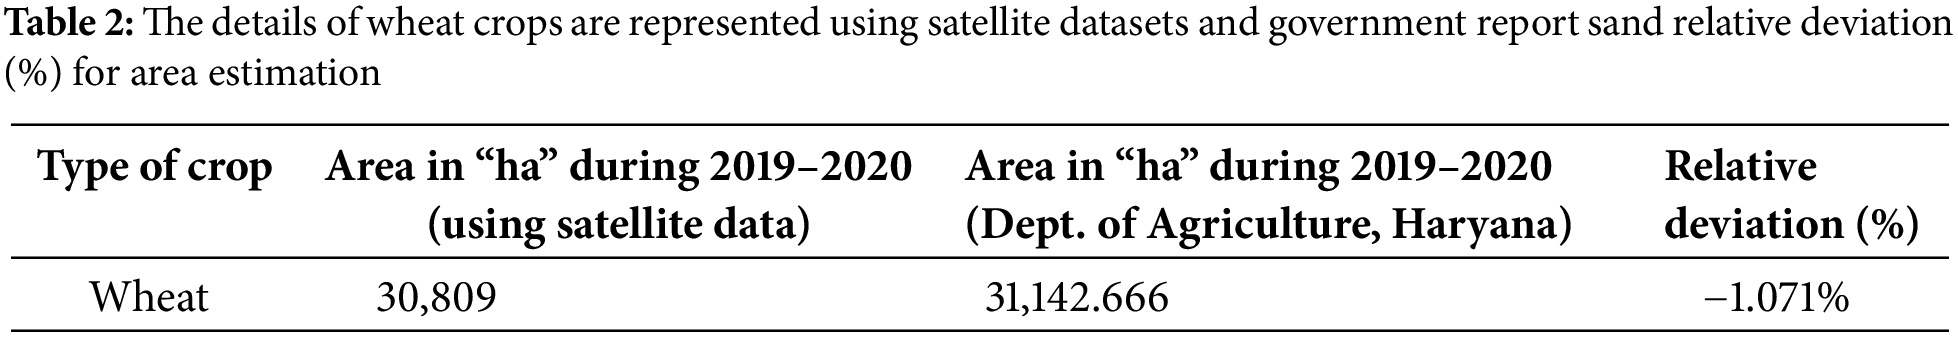

Figure 9: The close view of the Sentinel 2 FCC image and classified image during 3rd March 2020 representing optical data and classified wheat mask (a), Mustard crop in a close view and wheat mask (b), Fallow land in a close view and wheat mask (c)

Figure 10: Representation of settlement Sentinel 2 FCC image and classified Wheat mask
At the national or regional scale, crop yield prediction is essential for making production forecasts, which are very helpful for decision-makers in rapid decision-making. In the present study, the yield assessment of the wheat crop was evaluated using multi-date satellite data and PAR. The yield assessment for wheat in the Barwala block was conducted using the Modified Monteith Model, which leverages several key parameters to ensure accuracy. The model incorporated photosynthetically active radiation (PAR), the fraction of absorbed photosynthetically active radiation (fAPAR), light use efficiency, and water stress factors. These parameters were calculated at 10-day intervals, covering the wheat’s growth cycle from sowing in December 2019 to harvesting in April 2020. Net Primary Productivity (NPP) was computed by integrating these factors, serving as the basis for yield estimation. To translate NPP into actual crop yield, the harvest index (HI), a conversion factor obtained from established literature (0.4 for wheat), was applied. This enabled a comprehensive yield assessment at the block level. The results revealed that the average wheat yield in the Barwala block, as derived from the Modified Monteith Model, was 5451.65 quintals per hectare Table 3.
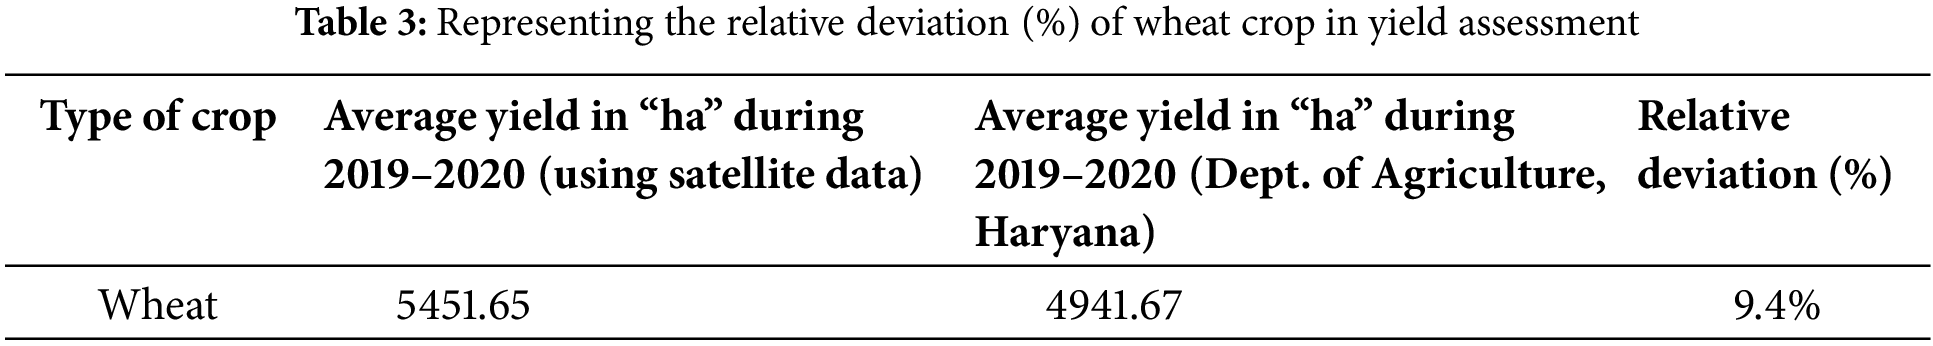
Fig. 11 displays the wheat yield map of Barwala. The yield was classified into four categories: (1) less than 30 q/ha, (2) 30–40 q/ha, (3) 40–50 q/ha, and (4) more than 50 q/ha. A significant portion of the yield falls between 40 to 50 q/ha and exceeds 50 q/ha. Most of the yield values are concentrated near the canal system, indicating a high fertility rate for crops in Barwala. Conversely, the low yield values are located near the built-up area. The no-crop area in Fig. 12’s wheat yield map includes other crops, water bodies, built-up land, and fallow land. The average yield obtained from the model was compared with the DoA, GoH, showing a deviation of 9.3%.

Figure 11: Wheat yield map of Barwala, Hisar, Haryana, India

Figure 12: Zoom in view of the wheat crop yield
The yield of the wheat computed through satellite-based data and the Monteith Model) were compared with the area statistics obtained from the DoA, and GoH. Generally, crop statistics are generated by the agriculture department after crop harvesting. Table 3 depicts the comparison of yield in quintals per hectare showing a relative deviation of 9.4%, showing that yield computed through remote sensing and GIS-based technology is close to reality.
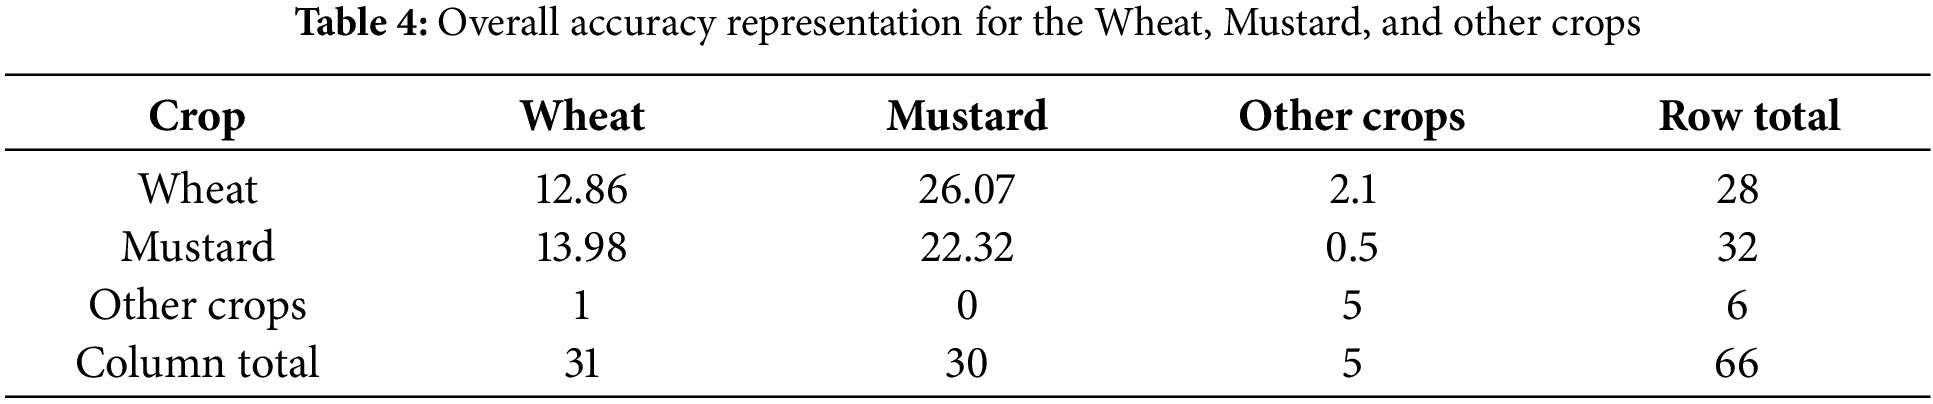
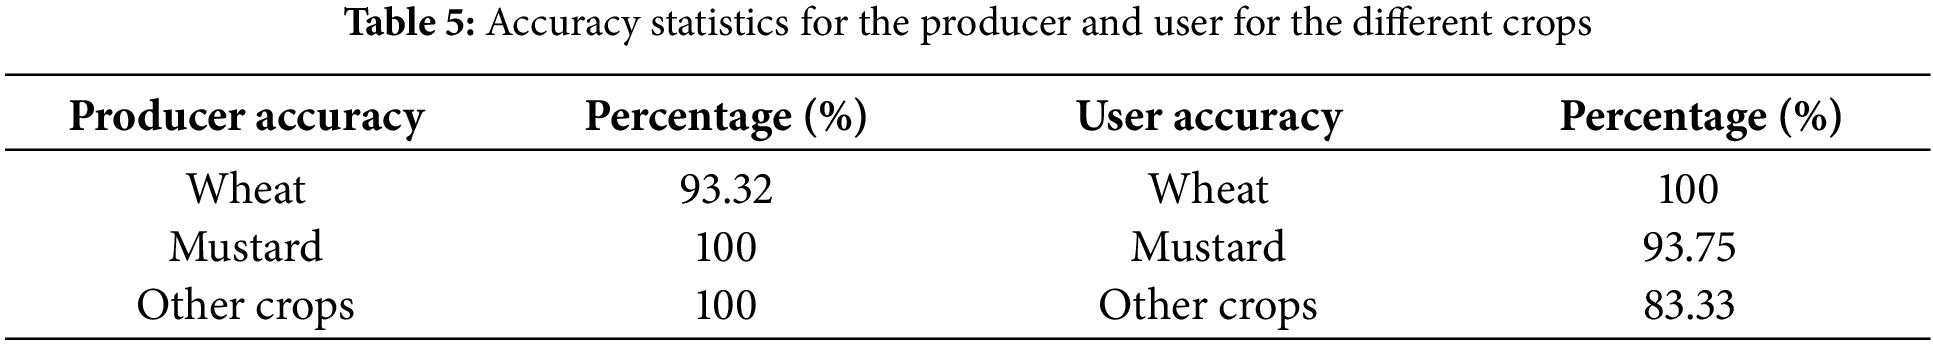
Accuracy assessment is a crucial component of the remote sensing mapping project. This assessment relies on the formulas for producer accuracy, user accuracy, and overall accuracy, as outlined below [41]. It represents the final analytical step in remote sensing and Geographic Information Systems (GIS), determining the quality of remotely sensed data (Table 4). The classified wheat mask was validated against ground truth data using ArcGIS software. The table presents various components of the accuracy assessment, including User Accuracy (UA), Producer Accuracy (PA), and Overall Accuracy. The producer accuracy for wheat, mustard, and other crops is 93.32%, 100%, and 100%, respectively. The User Accuracy for wheat, mustard, and other crops is 100%, 93.75%, and 83.33%, respectively. Table 5 displays the accuracy statistics.
The study highlights the effective use of Sentinel-2 satellite imagery for analyzing wheat yield in the Barwala block of Hisar district, demonstrating the benefits of high-resolution, multi-temporal data for accurately classifying crop areas and distinguishing them from other land uses. Multi-temporal satellite images covering all phenological stages of the wheat crop during the Rabi season 2019–20 enabled precise classification, which was validated against Department of Agriculture (DoA) statistics, revealing a relative deviation of −1.07% for crop area estimation. A semi-physical model integrating parameters such as photosynthetically active radiation (PAR), the fraction of absorbed PAR (fAPAR), water stress scalar, and maximum radiation use efficiency was used to estimate biomass and yield, resulting in a relative deviation of 9.3% compared with DoA data. These results illustrate the potential of high-resolution remote sensing for generating reliable crop yield estimates at finer scales, supporting agricultural planning and decision-making. However, the approach is not without limitations. The accuracy of yield estimation depends heavily on the quality and availability of ancillary data, including weather and soil parameters, which can introduce uncertainties. Additionally, the generalized application of radiation use efficiency and water stress scalar values across different microclimatic zones may reduce model precision. Future research should explore dynamic local calibration and incorporate real-time meteorological data to enhance model robustness. Despite these constraints, the methodology aligns well with initiatives like the FASAL program, offering valuable insights for improved agricultural monitoring and management in partnership with regional and national remote sensing agencies.
Acknowledgement: We sincerely acknowledge the invaluable support of the Haryana Space Applications Centre (HARSAC), Hisar, India, for providing essential data, state-of-the-art infrastructure, and expert supervision. Their resources and guidance have been pivotal in successfully executing our research.
Funding Statement: The authors received no specific funding for this study.
Author Contributions: Conceptualization: Sanghati Banerjee, Shruti Kanga and Tauseef Ahmad; methodology: Om Pal, Shruti Kanga, Suraj Kumar Singh, Sanghati Banerjee and Tauseef Ahmad; software: Om Pal and Tauseef Ahmad; validation: Om Pal, Shruti Kanga, Suraj Kumar Singh, Sanghati Banerjee and Bhartendu Sajan; writing—original draft preparation: Sanghati Banerjee, Shruti Kanga and Tauseef Ahmad; writing—review and editing: Sanghati Banerjee, Shruti Kanga, Suraj Kumar Singh, Om Pal, Tauseef Ahmad and Bhartendu Sajan. All authors reviewed the results and approved the final version of the manuscript.
Availability of Data and Materials: Most of the data is available within the article and remaining would be provided on request.
Ethics Approval: Not applicable.
Conflicts of Interest: The authors declare no conflicts of interest to report regarding the present study.
References
1. Kanter DR, Musumba M, Wood SLR, Palm C, Antle J, Balvanera P, et al. Evaluating agricultural trade-offs in the age of sustainable development. Agric Syst. 2018;163(3):73–88. doi:10.1016/j.agsy.2016.09.010. [Google Scholar] [CrossRef]
2. Bowles TM, Mooshammer M, Socolar Y, Calderón F, Cavigelli MA, Culman SW, et al. Long-term evidence shows that crop-rotation diversification increases agricultural resilience to adverse growing conditions in North America. One Earth. 2020;2(3):284–93. doi:10.1016/j.oneear.2020.02.007. [Google Scholar] [CrossRef]
3. Li J, Huang L, Zhang J, Coulter JA, Li L, Gan Y. Diversifying crop rotation improves system robustness. Agron Sustain Dev. 2019;39(4):38. doi:10.1007/s13593-019-0584-0. [Google Scholar] [CrossRef]
4. Goel RK, Yadav CS, Vishnoi S, Rastogi R. Smart agriculture-urgent need of the day in developing countries. Sustain Comput Inform Syst. 2021;30(3):100512. doi:10.1016/j.suscom.2021.100512. [Google Scholar] [CrossRef]
5. Wu Y, Li S, Li L, Li M, Li M, Arvanitis KG, et al. Smart sensors from ground to cloud and web intelligence. IFAC-PapersOnLine. 2018;51(17):31–8. doi:10.1016/j.ifacol.2018.08.057. [Google Scholar] [CrossRef]
6. Symeonaki E, Arvanitis K, Piromalis D. A context-aware middleware cloud approach for integrating precision farming facilities into the IoT toward Agriculture 4.0. Appl Sci. 2020;10(3):813. doi:10.3390/app10030813. [Google Scholar] [CrossRef]
7. King T, Cole M, Farber JM, Eisenbrand G, Zabaras D, Fox EM, et al. Food safety for food security: relationship between global megatrends and developments in food safety. Trends Food Sci Technol. 2017;68(8):160–75. doi:10.1016/j.tifs.2017.08.014. [Google Scholar] [CrossRef]
8. Dwivedi M, Saxena S, Neetu, Ray SS. Assessment of rice biomass production and yield using semi-physical approach and remotely sensed data. Int Arch Photogramm Remote Sens Spatial Inf Sci. 2019;XLII-3/W6:217–22. doi:10.5194/isprs-archives-XLII-3-W6-217-2019. [Google Scholar] [CrossRef]
9. Johnson LK, Bloom JD, Dunning RD, Gunter CC, Boyette MD, Creamer NG. Farmer harvest decisions and vegetable loss in primary production. Agric Syst. 2019;176(4):102672. doi:10.1016/j.agsy.2019.102672. [Google Scholar] [CrossRef]
10. Tadesse W, Sanchez-Garcia M, Assefa SG, Amri A, Bishaw Z, Ogbonnaya FC, et al. Genetic gains in wheat breeding and its role in feeding the world. Crop Breed Genet Genom. 2019;1:e190005. [Google Scholar]
11. van Ittersum MK, Cassman KG, Grassini P, Wolf J, Tittonell P, Hochman Z. Yield gap analysis with local to global relevance—a review. Field Crops Res. 2013;143:4–17. doi:10.1016/j.fcr.2012.09.009. [Google Scholar] [CrossRef]
12. Beyene AN, Zeng H, Wu B, Zhu L, Gebremicael TG, Zhang M, et al. Coupling remote sensing and crop growth model to estimate national wheat yield in Ethiopia. Big Earth Data. 2022;6(1):18–35. doi:10.1080/20964471.2020.1837529. [Google Scholar] [CrossRef]
13. Htun AM, Shamsuzzoha M, Ahamed T. Rice yield prediction model using normalized vegetation and water indices from Sentinel-2A satellite imagery datasets. Asia Pac J Reg Sci. 2023;7(2):491–519. doi:10.1007/s41685-023-00299-2. [Google Scholar] [CrossRef]
14. Shamsuzzoha M, Noguchi R, Ahamed T. Rice yield loss area assessment from satellite-derived NDVI after extreme climatic events using a fuzzy approach. Agric Inf Res. 2022;31(1):32–46. doi:10.3173/air.31.32. [Google Scholar] [CrossRef]
15. Chandra Paul G, Saha S, Hembram TK. Application of phenology-based algorithm and linear regression model for estimating rice cultivated areas and yield using remote sensing data in Bansloi River Basin, Eastern India. Remote Sens Appl Soc Environ. 2020;19(7):100367. doi:10.1016/j.rsase.2020.100367. [Google Scholar] [CrossRef]
16. Ahmad T, Pandey AC, Kumar A. Flood hazard vulnerability assessment in Kashmir Valley, India using geospatial approach. Phys Chem Earth Parts A/B/C. 2018;105(2):59–71. doi:10.1016/j.pce.2018.02.003. [Google Scholar] [CrossRef]
17. Karimli N, Selbesoğlu MO. Remote sensing-based yield estimation of winter wheat using vegetation and soil indices in jalilabad. Azerbaijan ISPRS Int J Geo Inf. 2023;12(3):124. doi:10.3390/ijgi12030124. [Google Scholar] [CrossRef]
18. Benami E, Jin Z, Carter MR, Ghosh A, Hijmans RJ, Hobbs A, et al. Uniting remote sensing, crop modelling and economics for agricultural risk management. Nat Rev Earth Environ. 2021;2(2):140–59. doi:10.1038/s43017-020-00122-y. [Google Scholar] [CrossRef]
19. Ahlawat A, Bhat A, Gupta V, Sharma M, Sharma S, Rai SK, et al. Market share and promotional approaches of pesticide companies for vegetable crops in jammu district. Int J Soc Sci. 2021;10(2):115–21. doi:10.46852/2249-6637.02.2021.4. [Google Scholar] [CrossRef]
20. Gumma MK, Kadiyala MDM, Panjala P, Ray SS, Akuraju VR, Dubey S, et al. Assimilation of remote sensing data into crop growth model for yield estimation: a case study from India. J Indian Soc Remote Sens. 2022;50(2):257–70. doi:10.1007/s12524-021-01341-6. [Google Scholar] [CrossRef]
21. Akinseye FM, Birhanu BZ, Ajeigbe HA, Diancoumba M, Sanogo K, Tabo R. Impacts of fertilization management strategies on improved sorghums varieties in smallholder farming systems in Mali: productivity and profitability differences. Heliyon. 2023;9(3):e14497. doi:10.1016/j.heliyon.2023.e14497. [Google Scholar] [PubMed] [CrossRef]
22. Yin H, Brandão A, Buchner J, Helmers D, Iuliano BG, Kimambo NE, et al. Monitoring cropland abandonment with Landsat time series. Remote Sens Environ. 2020;246(5):111873. doi:10.1016/j.rse.2020.111873. [Google Scholar] [CrossRef]
23. Wu L, Feng L, Zhang Y, Gao J, Wang J. Comparison of five wheat models simulating phenology under different sowing dates and varieties. Agron J. 2017;109(4):1280–93. doi:10.2134/agronj2016.10.0619. [Google Scholar] [CrossRef]
24. Heupel K, Spengler D, Itzerott S. A progressive crop-type classification using multitemporal remote sensing data and phenological information. PFG–J Photogrammet, Remote Sensing Geoinformati Sci. 2018;86(2):53–69. doi:10.1007/s41064-018-0050-7. [Google Scholar] [CrossRef]
25. Bairagi G, Chaudhari K, Patidar M, Tripathy R, Sharma R, Bhattacharya B. Wheat yield simulation using modified Monteith model and geospatial data: a case study. J Agrometeorol. 2018;20(1):69–75. [Google Scholar]
26. Wei Y, Ru H, Leng X, He Z, Ayantobo OO, Javed T, et al. Better performance of the modified CERES-wheat model in simulating evapotranspiration and wheat growth under water stress conditions. Agriculture. 2022;12(11):1902. doi:10.3390/agriculture12111902. [Google Scholar] [CrossRef]
27. Abhilash, Rani A, Kumari A, Kumar J. Water resource and use efficiency under changing climate. In: Kumar S, Meena RS, Jhariya MK, editors. Resources use efficiency in agriculture. Singapore: Springer Singapore; 2020. p. 519–76. doi:10.1007/978-981-15-6953-1_15 [Google Scholar] [CrossRef]
28. Abhilash SC. Growth and radiation use efficiency of basmati rice (Oryza sativa L.) Varieties under different transplanting environments [M.S. thesis]. Hisar, India: CCS Haryana Agricultural University; 2016. [Google Scholar]
29. Htitiou A, Boudhar A, Chehbouni A, Benabdelouahab T. National-scale cropland mapping based on phenological metrics, environmental covariates, and machine learning on google earth engine. Remote Sens. 2021;13(21):4378. doi:10.3390/rs13214378. [Google Scholar] [CrossRef]
30. Anand V, Oinam B, Wieprecht S. Assessment and comparison of DEM generated using cartosat-1 stereo pair data for hydrological applications. J Indian Soc Remote Sens. 2023;51(3):483–96. doi:10.1007/s12524-022-501639-z. [Google Scholar] [CrossRef]
31. Saini R, Ghosh SK. Crop classification on single date sentinel-2 imagery using random forest and suppor vector machine. Int Arch Photogramm Remote Sens Spatial Inf Sci. 2018;XLII-5:683–8. doi:10.5194/isprs-archives-xlii-5-683-2018. [Google Scholar] [CrossRef]
32. Kaur S, Singh SP, Kingra PK, Dhaliwal LK. Evaluating radiation use efficiency, growth and yield relationships of wheat under different management practices. J Agric Phys. 2020;20(2):243–50. [Google Scholar]
33. Chaurasiya A, Singh D, Dutta SK, Chowdhury AR, Dubey SK. Growth and yield enhancement of wheat through foliar spray of Osmoprotectants under high-temperature stress condition. J Pharmacogn Phytochem. 2018;7(3):2819–25. [Google Scholar]
34. Dhillon A, Verma GK. Convolutional neural network: a review of models, methodologies and applications to object detection. Prog Artif Intell. 2020;9(2):85–112. doi:10.1007/s13748-019-00203-0. [Google Scholar] [CrossRef]
35. Zhuo W, Fang S, Gao X, Wang L, Wu D, Fu S, et al. Crop yield prediction using MODIS LAI, TIGGE weather forecasts and WOFOST model: a case study for winter wheat in Hebei, China during 2009–2013. Int J Appl Earth Obs Geoinf. 2022;106(8):102668. doi:10.1016/j.jag.2021.102668. [Google Scholar] [CrossRef]
36. Jain R, Chand P, Rao SC, Agarwal P. Crop and soil suitability analysis using multi-criteria decision making in drought-prone semi-arid tropics in India. J Soi Wat Conser. 2020;19(3):271. doi:10.5958/2455-7145.2020.00036.3. [Google Scholar] [CrossRef]
37. Gumma MK, Nukala RM, Panjala P, Bellam PK, Gajjala S, Dubey SK, et al. Optimizing crop yield estimation through geospatial technology: a comparative analysis of a semi-physical model, crop simulation, and machine learning algorithms. AgriEngineering. 2024;6(1):786–802. doi:10.3390/agriengineering6010045. [Google Scholar] [CrossRef]
38. van Klompenburg T, Kassahun A, Catal C. Crop yield prediction using machine learning: a systematic literature review. Comput Electron Agric. 2020;177(10):105709. doi:10.1016/j.compag.2020.105709. [Google Scholar] [CrossRef]
39. Ma Y, Fang S, Peng Y, Gong Y, Wang D. Remote estimation of biomass in winter oilseed rape (Brassica napus L.) using canopy hyperspectral data at different growth stages. Appl Sci. 2019;9(3):545. doi:10.3390/app9030545. [Google Scholar] [CrossRef]
40. Wu S, Yang P, Chen Z, Ren J, Li H, Sun L. Estimating winter wheat yield by assimilation of remote sensing data with a four-dimensional variation algorithm considering anisotropic background error and time window. Agric For Meteor. 2021;301(1):108345. doi:10.1016/j.agrformet.2021.108345. [Google Scholar] [CrossRef]
41. Pazhanivelan S, Geethalakshmi V, Tamilmounika R, Sudarmanian NS, Kaliaperumal R, Ramalingam K, et al. Spatial rice yield estimation using multiple linear regression analysis, semi-physical approach and assimilating SAR satellite derived products with DSSAT crop simulation model. Agronomy. 2022;12(9):2008. doi:10.3390/agronomy12092008. [Google Scholar] [CrossRef]
Cite This Article
 Copyright © 2025 The Author(s). Published by Tech Science Press.
This work is licensed under a Creative Commons Attribution 4.0 International License , which permits unrestricted use, distribution, and reproduction in any medium, provided the original work is properly cited.
 Downloads
 Citation Tools