
 Submit a Paper
 Propose a Special lssue
 Open Access
ARTICLE
Assessing and Modeling the Vegetation Cover in the W and Pendjari National Parks and Their Peripheries from 1985 to 2030, Using Landsat Imagery and Climatic Data in Benin, West Africa
1 Horticultural Research and Management of Green Spaces Unit, Laboratory of Plant, Horticultural and Forest Sciences, School of Horticulture and Management of Green Spaces, National University of Agriculture, Kétou, P.O. Box 43, Benin
2 Faculty of Agronomic Sciences, Laboratory of Applied Ecology, University of Abomey-Calavi, Godomey, P.O. Box 1974, Benin
3 Research Unit in Tropical Mycology and Soil-Plants-Fungi Interactions, Laboratory of Ecology, Botany and Plant Biology, University of Parakou, Parakou, P.O. Box 123, Benin
4 Department of Botany, Islamia College Peshawar, Peshawar, 25120, Pakistan
* Corresponding Author: Hubert Olivier Dossou-Yovo. Email:
Revue Internationale de Géomatique 2025, 34, 209-234. https://doi.org/10.32604/rig.2025.061448
Received 25 November 2024; Accepted 13 March 2025; Issue published 14 April 2025
 View Full Text
 Download PDF
Abstract
Today, environmental studies based on satellite imagery are known as making valuable contributions to the dynamics and spatial prediction of sensitive or complex ecosystems such as wide protected areas and represent sustainable decision tools. The Pendjari and W Transboundary Reserves which constitute biodiversity reservoirs, habitats for wildlife conservation lack substantial investigations on the vegetation dynamics. Despite the protection measures they benefit from, these reserves remain dependent on climatic hazards that can influence their stability. The present study is innovative since it applied remote sensing techniques combined with climate records from the last thirty years to analyze the past dynamics of land use and climate changes to predict the future trends of the vegetation cover of the two national parks in Benin, as well as their peripheries. The methodology used remote sensing and Geographic Information System (GIS) techniques that allowed the supervised classification of Landsat images from 1985, 2000 and 2015. Climatic data were combined in R software to identify the break periods for climatic parameters. Finally, the predictive vegetation cover for the year 2030 was made by combining vegetation and climatic data in the “Land Change Modeler” extension. Results show ten land use and land cover classes which are the agglomerations, mosaics of fields and fallows, water bodies, dense forests, gallery forests, clear forests and wooded savannahs, swamp forests and shrubby wooded savannahs, saxicolous savannahs and bare ground. The natural vegetation decreased from 90.85% in 1985 to 83.54% in 2000 then to 79.56% in 2015, representing a decline of 11.39% over a study period of 30 years. The analysis of the climatic curves revealed the presence of a break, meaning drought frequencies. The predictive modeling showed that land use units projected up to the year 2030 are consistent with past trends, but with the continued expansion of fields and fallows (2%) instead of the natural vegetation. This study not only provides good insights useful in the sustainable management of the Biosphere Reserves but will also motivate many other researches towards such ecosystems.Keywords
Remote sensing has become an important decision tool in recent times for various fields of interest, including vegetation science and biodiversity assessment [1]. It serves to assess the dynamics of the vegetation cover and land use of various ecosystems worldwide. Studies undertaken on vegetation using remote sensing would not be possible using only manual surveys. The management and ecological monitoring of protected areas require great financial investment [2]. There is a need to assess the vegetation cover of natural areas like national parks. Moreover, in order to help people adapt to the effects of a warming planet and to protect biodiversity, vegetation cover needs to be monitored (www.panda.org). Many habitats are and will be altered by the global warming. It was recently concluded at the COP15 held in 2022 that regarding the alarming loss of nature, the World needs a strong agreement to restore species, the places and spaces representing their homes (www.panda.org). National parks play a key role in biodiversity conservation, and monitoring their vegetation cover is a valuable tool to assess conservation efforts. Furthermore, assessing the land use surrounding large national parks and nature reserves will provide information on what kind of occupations are undertaken by human populations in areas adjacent to these parks. Given the extent, status and importance of these protected areas for communities, emphasis should be placed on spatial tools and technologies capable of reconstructing the past state of their ecosystems for better conservation planning.
This craze has given rise to a great deal of research into spatial dynamics based on remote sensing. In fact, reference [3] applied remote sensing to demonstrate that dense forests and light forests decreased while cultivated areas increased in the Niger River delta of Nigeria. By comparing remote methods such as Dynamic World, World Cover and Esri Land Cover, reference [4] found water to be the most accurately identified class, followed by the built environment and tree cover. Elsewhere, reference [1] recorded a 16% loss of vegetation cover in the Ouémé river delta in Benin over a period of 30 years through analysis of Landsat imagery. These authors also predicted the vegetation cover of this humid ecosystem in 2035. In Saudi Arabia, reference [5] reported a loss of rangeland, forest and shrubland based on Landsat imagery analysis. Such studies show the importance of remote sensing in the assessment of vegetation cover and land use.
Concerning the Pendjari National Park and the W Park, the two most important protected areas in Benin and among the most important in West Africa, research undertaken ten years ago [6] in the Sudanian zone of North Benin revealed a significant decrease in forest, from 25.3% in 1972 to 8.8% in 2006 with loss of savannah areas. However, agricultural land showed an increase to 28.4% over the same period and human population growth was mentioned as the main cause of these changes. From 1972 to 2008, forest areas decreased from 22.7% to 17.0% in the W National Park, while the mosaic of fields and fallows exhibited an increase from 1.38% to 13.97% in the vicinity of the park due to population growth [7]. Although these investigations in the present study area were undertaken several years ago, they provide relevant information confirming pressure on the two National Parks in recent decades [8,9]. Recently, significant changes in land use and land cover around ecotourism hotspots in the Pendjari National Park have been reported, and other drivers of such changes should be better researched [10]. The vegetation found on termitaria in the Pendjari National Park differs from that recorded on hotspots in farm and fallow areas surrounding the park [11]. More scientific activities to determine the change in vegetation cover and land use for a relatively long period of years are crucial. Moreover, Dossou-Yovo et al. [12] reported important medicinal uses of plant species collected in fields and fallows surrounding the Pendjari National Park. Both herbaceous and woody plants are collected from the wild for medicinal purposes in Benin [13,14]. Most of this literature focuses on the dynamics of vegetation cover. But very few studies have combined remote sensing and climate data to assess the impact of climate on the health of forest ecosystems in these protected areas. However, the availability of satellite images and climatic data already suggests that research on the mutual influences of these two parameters is of great interest. The present study on the vegetation cover of Pendjari and W National Parks and the change in land use surrounding them for a period of 30 years (1985 to 2015) will provide relevant scientific insight into the conservation efforts towards these protected areas and will help predict vegetation states in and around the two parks, and point out the impact of human activities on these vegetation dynamics. Moreover, the predictive analysis performed in this paper is also expected to serve as a sustainable decision tool that political leaders and other stakeholders can use to better management of parks in Benin and elsewhere. Methods applied in this paper were recently used [1] to assess the vegetation cover and land use change and predict the trends. Likewise, many other studies have already used this method with satisfactory results in assessing the vegetation dynamics from satellite imagery [15,16]. This existing literature on the topic shows the innovative characteristic of the research as well as the importance of such investigations in environmental and conservation sciences. In addition, the climatic data in this paper serve to correlate the changes in vegetation over the period covered with the variations in such drivers, a novelty leading to predictive analysis considering climate change [17–19]. In fact, it was assessed the sensitivity of vegetation cover to climate change in a river basin by using remote sensing methods [20]. Similarly, reference [21] reported vegetation modeling as a tool in studying response to climate changes. Most of the studies conducted on the two Biosphere Reserves focused on one of these protected areas [8,22,11], even though they are very close and linked by hunting areas that serve as corridors for various biological flows and exchanges. It is therefore necessary to undertake a comprehensive study on the spatial configuration of the vegetation cover of these two ecosystems together to understand the connectivity between them and their peripheries. In addition, the two reserves are part of the largest network of protected areas in West Africa, with a double status of protection as Biosphere Reserves, and UNESCO World Heritage sites. Elsewhere, the integrated management of such a complex requires an understanding of the response of the vegetation cover to climate change. This is a major challenge for environmental conservation [23,24]. It is important to highlight that no study has yet addressed such research aspects on the protected areas of northern Benin, particularly using remote sensing tools.
It was to fill this gap and to provide a technical basis that could be used to well manage these parks that this study was initiated. Its aim is to assess and model the vegetation cover in the W and Pendjari National Parks and their peripheries, using Landsat imagery and climatic data. It can thus serve as the scientific basis for both policy-writers and decision-makers at various levels, in particular those involved in the biosphere reserve management and the development of ecotourism. The paper is organized around the introduction, materials and methods, results, discussion and conclusion. Especially in the results, this study highlighted the Land use dynamics of the vegetation cover, the analysis of land use conversions, the analysis of climatic parameters and their prediction of the W and Pendjari parks and their peripheries between 1985 and 2030.
The study area is the entire complex of protected areas (Pendjari and W-Benin Bio-sphere Reserves), their hunting areas as well as their periphery. The peripheries, approximately 25 km wide, made up of village territories, were considered. In fact, these territories benefit from special protection measures within the framework of a vast program of integrated management of transboundary protected areas in northern Benin. Table 1 shows the different zones and their respective surface areas.

This space extends between latitudes 10°40′ N and 12°30′ N and between longitudes 0°50′ E and 3°22′ E (Fig. 1). With an area of approximately 22,555 km2, the study area crosses the districts of Tanguiéta, Toucoutouna, Kouandé and Kérou in the department of Atacora and the districts of Banikoara, Kandi and Malanville in the department of Alibori [25]. The climate of the region is Sudanian, characterized by an average annual rainfall between 694 and 1145 mm, with a rainy season and a dry season [12,11]. The same authors mentioned that the rainy season covers the period from April to October, and the dry season covers the period from November to March. As for the temperature, the annual average is 26 ± 4°C (Fig. 2). The relief of this region is uneven in places with altitudes varying between 106 and 591 m. The main soils are mineral soils, hydromorphic, vertisols and ferruginous soils [26]. The main plant formations are savannahs and open forests [22]. However, there are also gallery forests, swamp forests and agro ecosystems, especially outside of the parks. Agriculture is the main income generation activity for the surrounding populations of the W-Pendjari complex in northern Benin. The main crops grown around the complex are food crops such as sorghum, millet, maize, cowpea, yams, cassava yams, cassava, and cash crops (cotton), which occupy a great deal of agricultural land [11]. In recent years, cashew nut agroforestry has increasingly been developed in the southern part of the W Biosphere Reserve. Animal husbandry remains the second most important activity practiced by the local populations. In addition to the traditional agricultural activities, the local people collect numerous non-timber forest products (NTFPs) such as shea, baobab, tamarind and many other products that generate significant income for local populations in the periphery of the reserve [25,27].
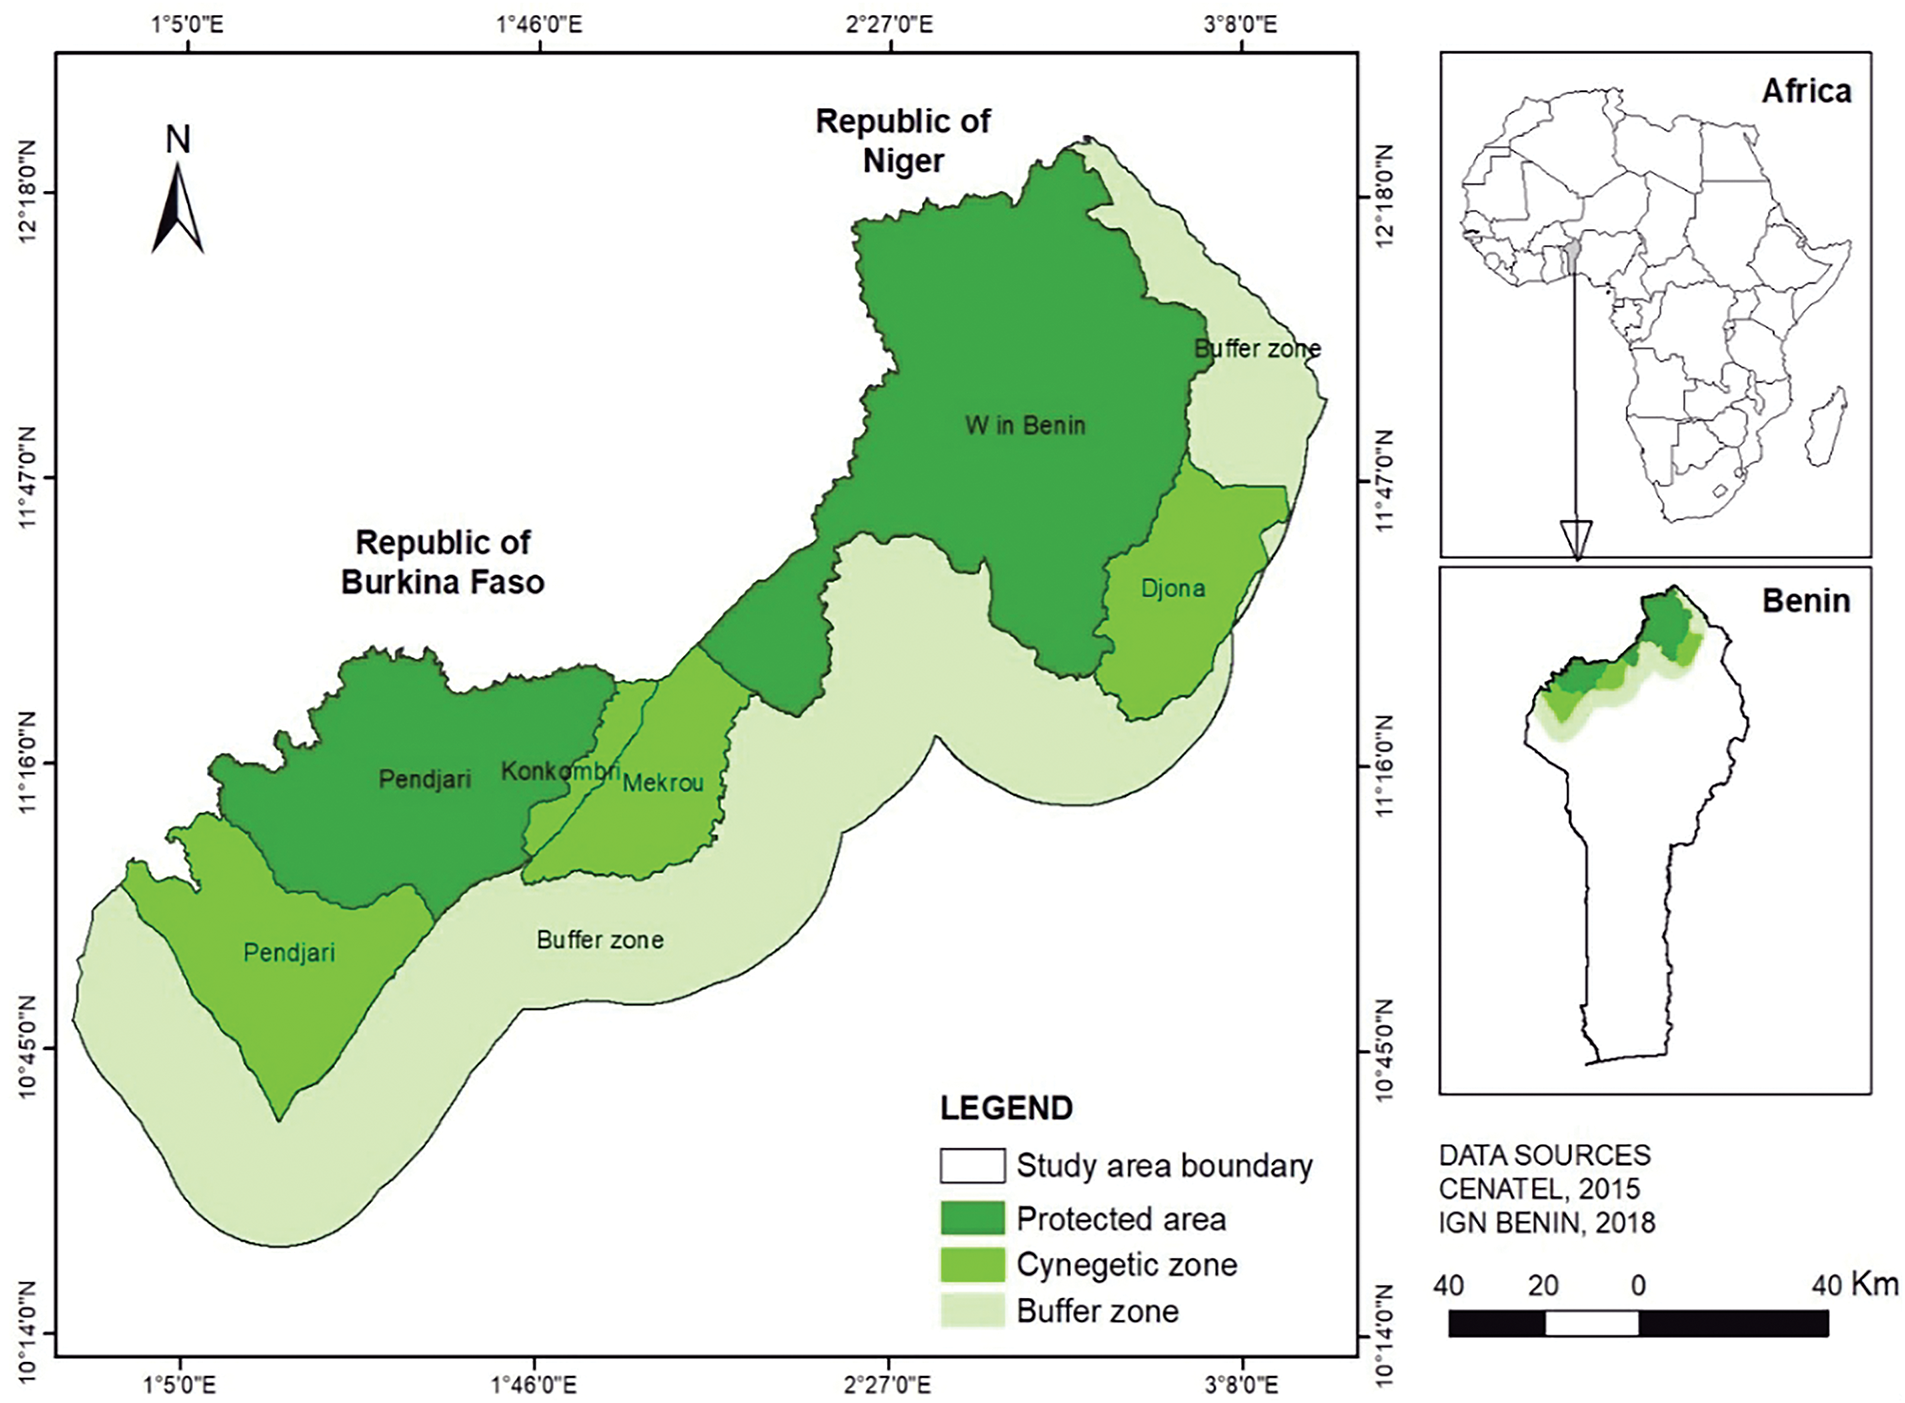
Figure 1: Geographical location of the study area. It shows the connectivity between the two reserves through hunting zones
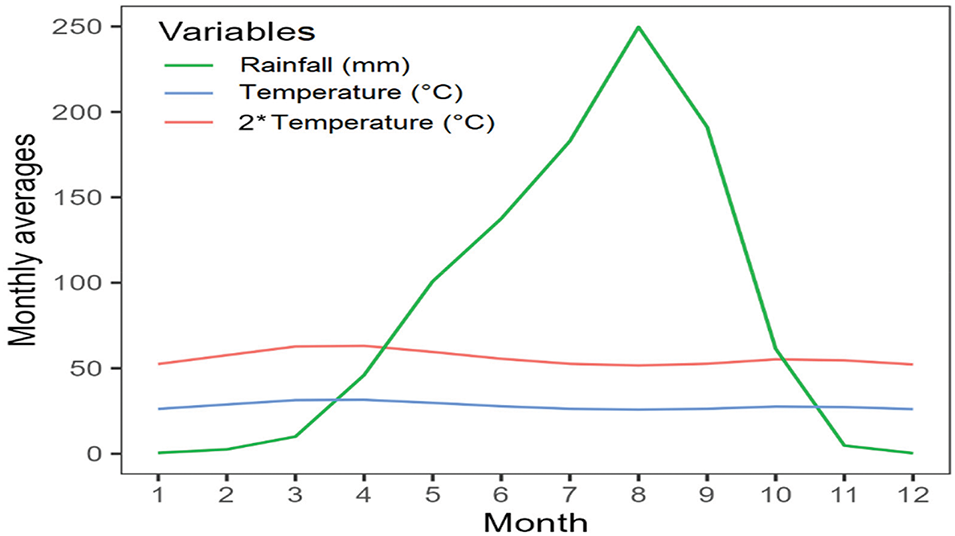
Figure 2: Ombrothermic diagram from 1985 to 2015 for W-Pendjari Biosphere Reserve. It shows the highest values of rainfall from July to September and very slight variations in the temperature
• Dynamics of land use in the Pendjari and W protected areas in northern Benin
Prior to the image processing, the topographic sheets of northern Benin at 1:200,000 were used to geo-locate the reference frame and analyze the environmental components of the study area. Then, Landsat satellite images available on the USGS (United States Geological Studies) website (https://earthexplorer.usgs.gov/) (accessed on 12 March 2025) were downloaded. A preview of such images allowed the selection of scenes 192-52, 193-52 and 193-53 for three years: 1985 (Landsat TM), 2000 (Landsat ETM+) and 2015 (Landsat OLI). The choice of these years is motivated by the aim to investigate the vegetation cover until 2015, a period before the designation of the complex of transboundary protected areas between three countries (Benin, Burkina Faso and Niger) in the UNESCO World Heritage [25]. Since the study focuses on forest ecosystems benefiting from in situ conservation measures, dry season images were chosen in order to reduce phenological contrasts as much as possible [28,29]. In addition, field surveys were conducted in December 2022, through georeferencing of 20 points per land use unit to guide the definition of training plots on images. The survey was conducted towards the reserve dwellers based on a semi structured questionnaire. Information collected during these surveys was on the management types of the reserve. For the analysis of satellite images, the scenes covering the study area were grouped in the form of a mosaic using the ENVI 5.3 software. Then, an enhancement was performed to increase the contrast between colors and to establish uniform illumination conditions on the assembled scenes [30]. For the interpretation of the images, false color compositions were performed in order to distinguish land cover units, including vegetation, from a grid of identification and interpretation of colors through spatial remote sensing. The combined bands for the false color composition are 5,4,3 for Landsat TM and ETM images and 6,5,4 for Landsat 8 images. During the processing, ten (10) land use units were identified, with reference to the nomenclature of the Cartographic Atlas of Land Use Dynamics in Benin [31]. There were agglomeration (AG), dense forests (DF), gallery forests (GF), swamp forest (SF), field and fallow mosaics (FF), water bodies (W), open forests and wooded savannahs (OF), wooded and shrubby savannahs (SS), bare soil (BS) and saxicolous savanna (SxS). In addition to the photo-interpretation guidance points, the proximity of water bodies was used to identify gallery forests. Similarly, the digital terrain model was used to identify saxicolous savannahs. As for the difference between open forests and wooded savannahs, then tree and shrub savannahs, biomass density and the proximity of fields and fallow land were used to discriminate between them. The images were then submitted to a supervised classification using the Maximum Likelihood algorithm, which calculates the probability of a pixel belonging to a given unit or not. To validate this operation, the results of the classifications were compared with the data obtained from direct examination of the images for 300 georeferenced sectors inserted in digital layers (30 sectors per land-use unit in 2015).
The Pontius matrix was used for the validation of the classification. This method quantifies the inconvenience and allocation errors associated with image processing [32]. The choice of the Pontius matrix is related to its level of efficiency in post-classification decision making compared to the Kappa index [33]. Indeed, although the Kappa index is widely used, it is increasingly questioned for its effectiveness, whereas in recent years the Pontius matrix has been suggested to be in line with current research. Thus, the Pontius Matrix 4.2.Xlsx version was used to evaluate the accuracy of classifications based on quantification and allocation of annoyances. Finally, the data from the digital processing was vectorized and exported to ArcMap for integration into the GIS, from which the vegetation cover and other land use units were extracted with their areas.
• Analysis of land use dynamics between 1985 and 2015
The changes in land use status between 1985 and 2015 were described by comparing the areas of each unit over the periods 1985, 2000 and 2015. The changes observed over these periods were highlighted by the transition matrix, which reflects the forms of conversion that the land use units underwent between two dates. It consists of x rows and y columns. The number x of rows in the matrix indicates the number of classes present at date t1, while the number y of columns in the matrix indicates the number of converted classes at date t2. The diagonal indicates the areas of classes that have remained unchanged over time [32,33]. In this matrix, the transformations are made from rows to columns. The different matrices were obtained by crossing the 1985–2000, 2000–2015 and 1985–2015 maps.
• Analysis of correlations between climate and vegetation
The effect of climate change on forest ecosystems has been the subject of much reflection in recent years, given the changes observed in forest areas around the world. It is, therefore, necessary to highlight the contribution of climate to future changes in vegetation cover, particularly in the Pendjari and W transboundary Biosphere Reserves in northern Benin.
Thus, based on climatological data provided by the Benin meteorological observation network, records from the rainfall stations of Karimama, Alfakoara, Banikoara, Tanguiéta and Matéri were used. Similarly, the agro-climatic stations of Guéné, Kérou, Dassari and Porga were used to extract climate parameters such as rainfall, relative humidity, temperature and wind speed.
Meteorological data on the study sites were obtained from the Benin Agency of Meteorology (Météo Bénin). There were monthly records of temperature, rainfall, humidity and wind speed from 1980 to 2022. Such data were processed and analyzed within the Integrated Development Environment of Rstudio [34] by using the software R v4.1.2 [35]. The missing observations in the chronological series of each climatic variable were filled by predicted values through linear interpolation under the forecast R package [36,37]. In order to get a unique rainfall series per site (Biosphere Reserves), the monthly mean rainfall per site was computed considering the observations of all townships covered by the Biosphere Reserve. The total rainfall was calculated per year for both Biosphere Reserves, considering the mean rainfall of each month. Monthly mean temperatures, humidity and wind speed were computed per year for both Pendjari and W Biosphere Reserves.
In order to assess the temporal distribution of rainfall over the period of the study, each series was converted into a times series (ts) object under the R package stats [35] and 5 years centered moving averages were calculated using the forecast R package. The real trends with moving averages were plotted using the ggplot2 R package [38,39] for each variable per Biosphere Reserve. Breakpoints analysis was then performed to check for structure change in values of each climatic variable from 1985 to 2015. Thus, several segmentations were performed on each sery using the strucchange R package [40,41] and the corresponding Residual Sum of Squares and Bayesian Information Criterion (BIC, hereafter) were computed to find out the optimal numbers of breakpoints to be considered. Vertical red lines were plotted at each breakdate of the optimal segmentation on each series. The optimal segmentation is the one that recorded the lowest BIC. Further, the annual standardized precipitation index (SPI) was computed and the ombrothermic diagram was plotted for each of the two Biosphere Reserves for finding out dry and rainy times throughout the study period. In fact, the SPI was applied, three decades ago, by Mckee et al. (1993) [42] to assess the relationship between drought frequency and time scale. Its formula [43] is known as:
Where P is the annual precipitation of a given year, Pm represents the mean annual precipitation over the period 1985–2015, and meaning the standard deviation of annual precipitations over the same period.
A spatial interpolation was made on two of these parameters, which were associated with the land cover in Land Change Modeler (LCM), available on IDRISI LCM in order to predict the vegetation cover at the horizon 2030. This model is widely employed in studies on land cover or land use changes [1,44,45], based on cellular automata. The two parameters considered are rainfall and humidity, given their strong influence on vegetation. In fact, scientists reported vegetation as a response to water availability, including rainfall and humidity [46–48]. Moreover, evaluated the impact of rainfall and moisture dynamics in a foggy desert, concluding that these two parameters are the most important in determining vegetation dynamics.
Although the peripheries of the two parks were included in the present study, the climatic variations were correlated to the land use and land cover in these areas because of the diverse environmental impacts of climate [47]. In other words, the choice of land use by indigenous people living around the national parks is highly driven by the variation in climate especially rainfall and moisture. Furthermore, the variation in land use by indigenous people in tropical countries was reported as a climate change adaptation [49], meaning that land use changes are in relation to the climatic variations. As a result, local communities can use the information provided by this study to develop adaptive capacities to avoid reducing ecosystem services. In addition, decision-makers will use findings to define resilience strategies against future changes in climate and vegetation cover in this region.
3.1 Mapping of the Vegetation Cover of W and Pendjari Parks and Their Peripheries between 1985 and 2015
In total, ten land use units were clearly identified and used for the analysis of land cover dynamics. The reliability of the processing, shown in Fig. 3, indicates the low inconvenience and allocation errors associated with image processing. This allows validation of the satellite image classification.
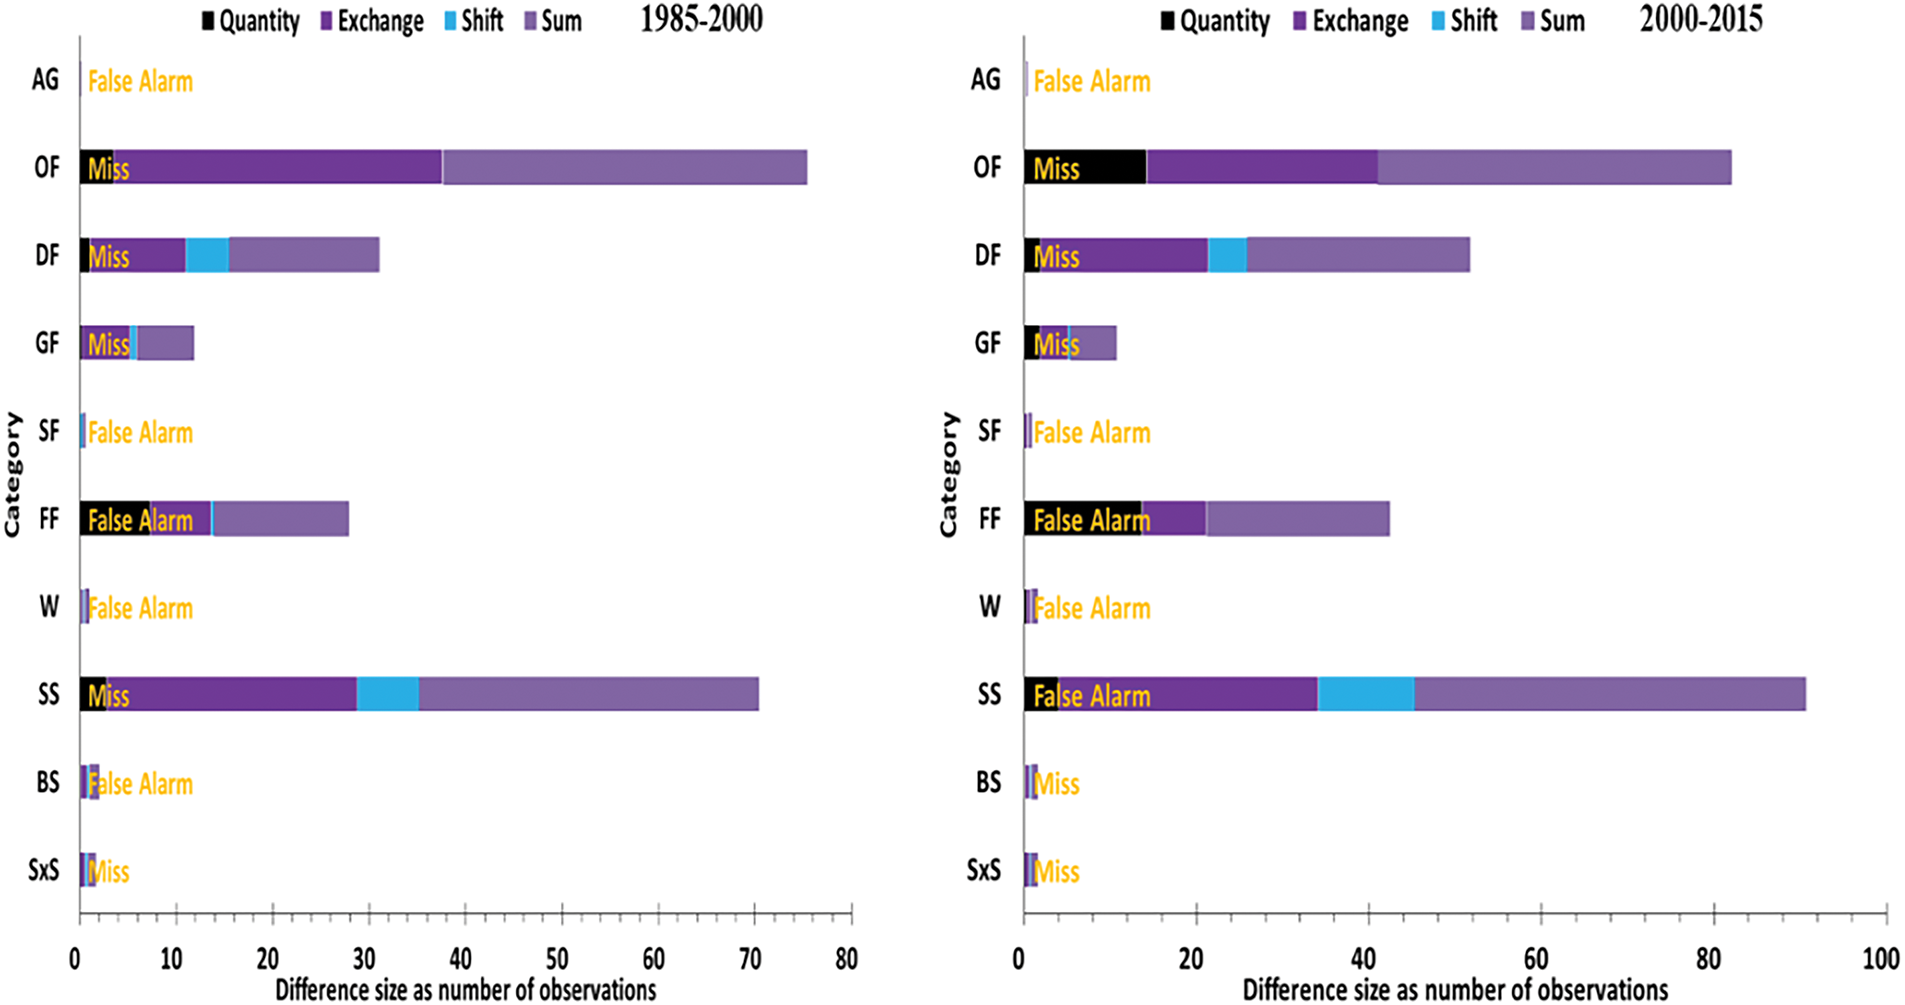
Figure 3: Size of the difference in the number of observations of land use units in W and Pendjari parks and their peripheries between 1985 and 2015
The different land use units, which are presented in Fig. 4, can be grouped into two categories:
-Natural vegetation formations consisting of dense forests, open forests and tree savannas, gallery forests, swamp forests, tree and shrub savannas and saxicolous savannas.
-Other land use units such as bare soil and water bodies scattered throughout the study area, followed by settlements, fields and fallow land mostly located outside the two protected areas and their hunting zones.
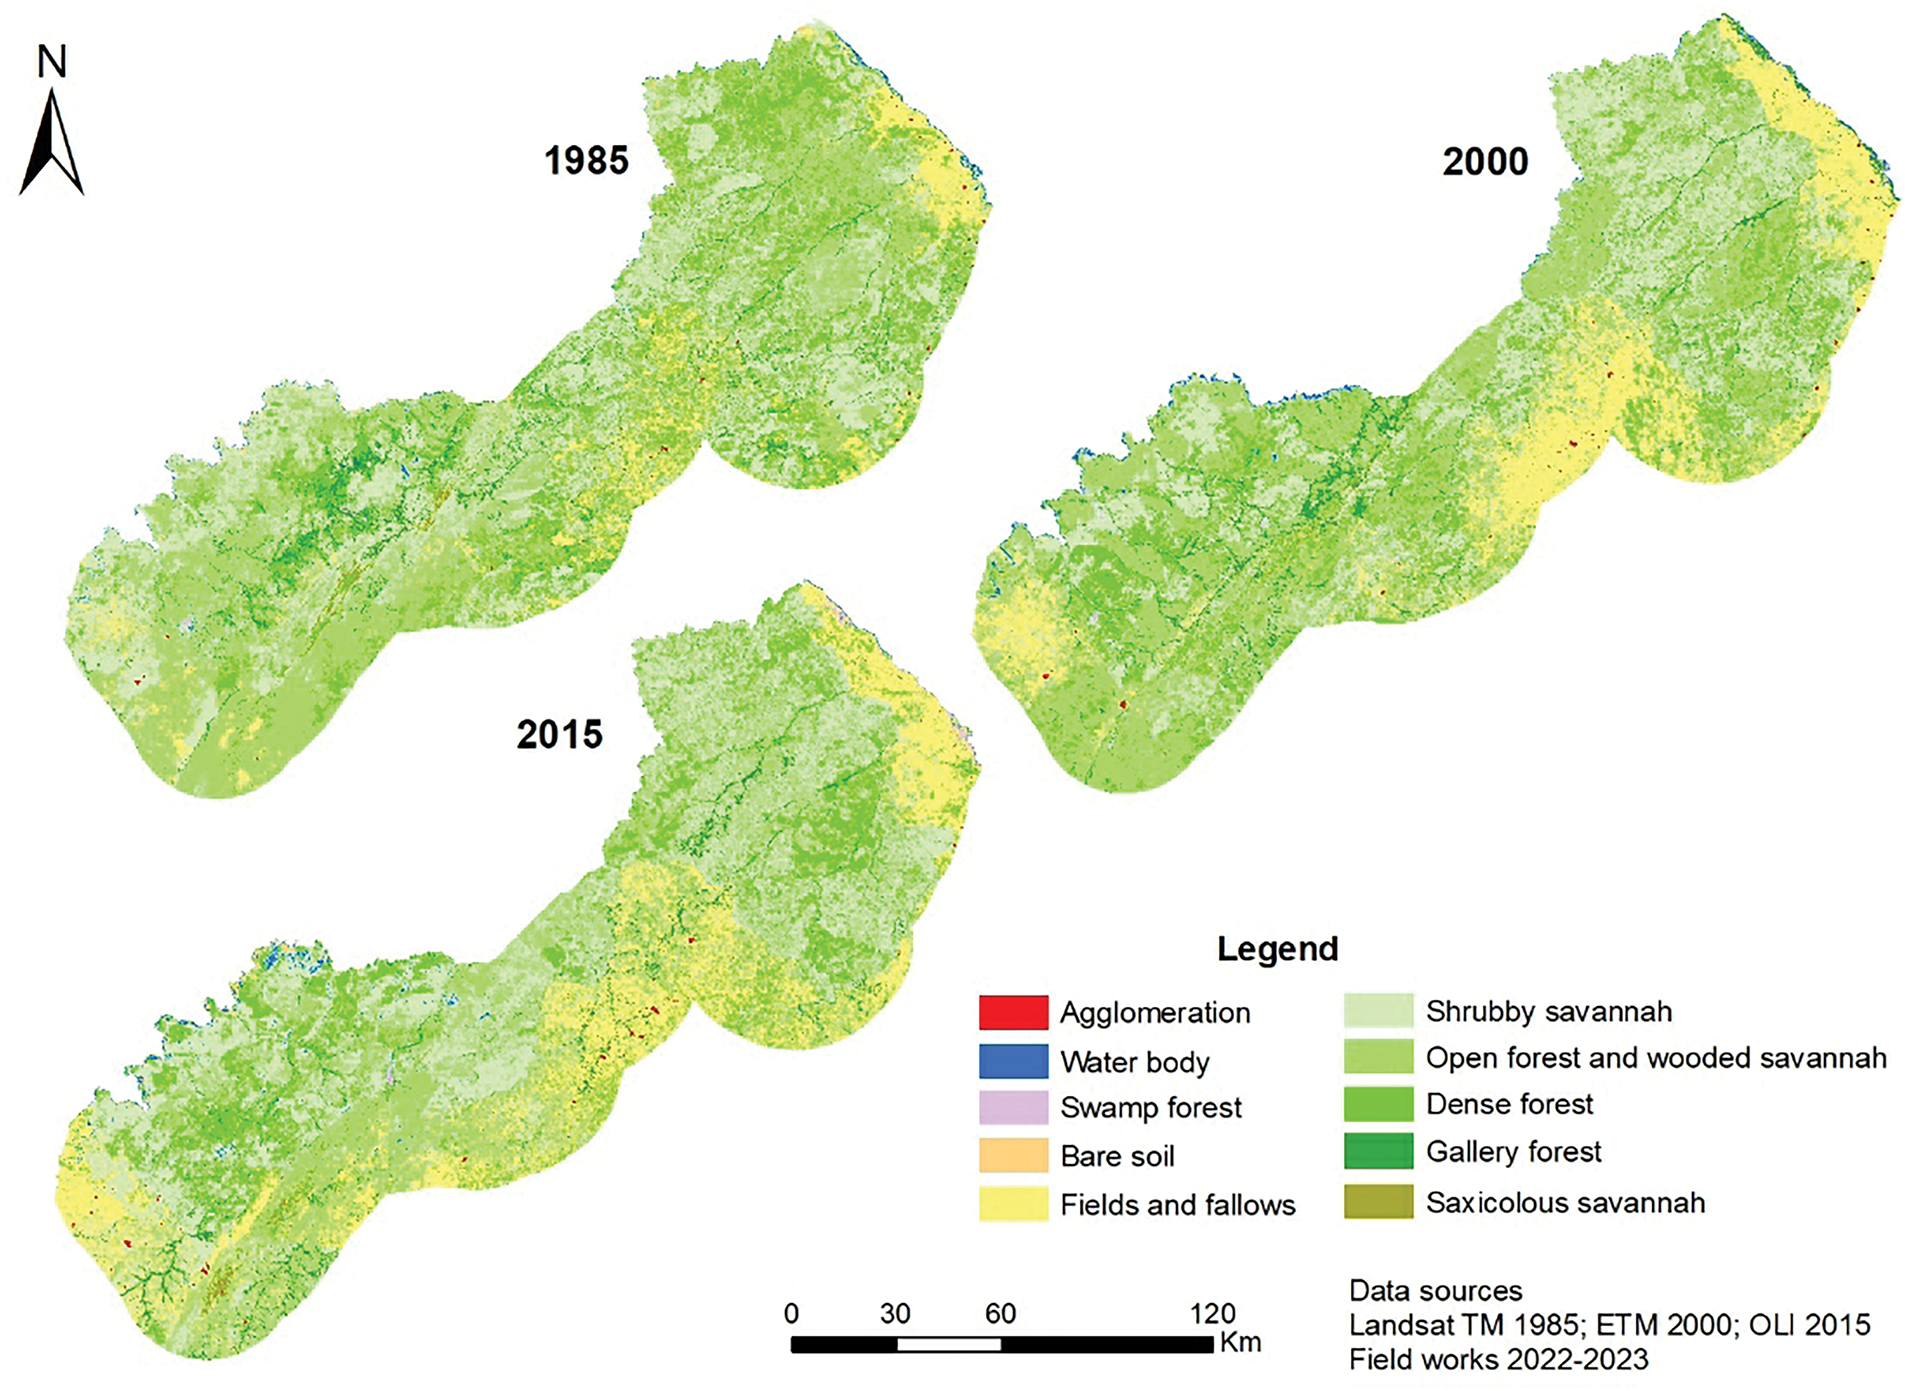
Figure 4: Reconstitution of land use units in W and Pendjari parks and their peripheries between 1985 and 2015
-Land use dynamics of the W and Pendjari parks and their peripheries between 1985 and 2015
Overall, natural formations decreased from 90.85% in 1985 to 83.54% in 2000 and 79.56% in 2015 (Fig. 5). This indicates a decline in vegetation cover of 11.39% over the study period (1985–2015). However, it is during the first observation period (1985–2000) that the loss of vegetation cover was greatest, 7.41% compared with 3.98% in the second period (2000–2015). On closer inspection, the clear forests and wooded savannahs have lost the most area. The latter decreased from 33.89% in 1985 to 30.92% in 2000 and 25.29% in 2015. A similar trend was observed for gallery forests, which fell from 4.38% to 3.97% and then to 3.10%. Saxicolous savannah showed insignificant losses. As for dense forests, they fell from 16.52% to 15.40%, before experiencing a slight increase of 0.09% in 2015. The same trend was observed in tree and shrub savannahs (35.39%, 32.56% and 35.01%). Meanwhile, swamp forests remained constant between 2000 and 2015 after increasing by 0.03% in the previous period.

Figure 5: Evolution of the areas of the land use units of the W and Pendjari parks and their peripheries between 1985 and 2015. Agglomeration (AG), Dense Forests (DF), Gallery Forests (GF), Swamp Forest (SF), Field and Fallow mosaics (FF), Water Bodies (W), Open Forests and Wooded Savannahs (OF), Wooded and Shrubby Savannahs (SS), Bare Soil (BS), Saxicolous Savanna (SxS)
In contrast, the other land use units of settlements, fields, fallow land and bare soil have expanded over the entire observation period. Indeed, settlements, which occupied 0.11% of the total area of the study area, increased to 0.14% in 2000 and then to 0.17% in 2015. Fields and fallow land have seen the greatest increase in area, rising from 8.10% in 1985 to 15.24% in 2000 and 18.93% in 2015, an increase of 10.83% in 30 years. The increase in the area of bare soil was very small (0.07%) between 1985 and 2000, but remarkable between 2000 and 2015 with a value of 0.28% of the total area of the study area. Over the whole study period, the area of water bodies, which was estimated at 0.43% in 1985, remained almost unchanged (0.5% for 2000 and 2015).
3.2 Analysis of Land Use Conversions from 1985 to 2015
Between 1985 and 2000, 10.19% and 5.09% of the total area of the study sites were transformed into open forest, wooded savannah and field as well as fallow mosaics respectively (Table 2). It was also noted that fields and fallows recorded the highest gain, estimated at 7.34% in absolute value, equivalent to 90.51% in relative value. Meanwhile, open forest and wooded savannahs as well as tree and shrub savannahs suffered the greatest losses (respectively −3.5% and −2.78% of the total area in absolute value, equivalent to −10.21% and −7.88% in relative value).

In the period from 2000 to 2015, the changes in land use were more rapid, with no conversion exceeding 9.3% of the study area (Table 3). This maximum value (9.3%) represents a gain of tree and shrub savannahs over the other land-use units, the majority of which (8.53%) comes from open forests and wooded savannahs. In sum, in relative terms, tree and shrub savannahs have lost 17.91% of their area. Gallery forests lost 24.38% and saxicolous savannahs 4.55%. Settlements and fields and fallow land continued to expand, with increases of 21.43% and 27.27%, respectively. The increase in the area of bare land was remarkable over this observation period, with a gain of 61.02% in absolute terms. The analysis of mutations over the whole study period shows that no conversion exceeds 8.64% in the form of loss in open forests and wooded savannahs (Table 4). In contrast, the maximum gain was recorded in tree and shrub savannahs (13.29%). The highest conversion rates, expressing area gains, were recorded in fields and fallows (131.98%) followed by bare soils (82.69%). Meanwhile, open forests and wooded savannahs, followed by gallery forests, saw their area decrease by 26.29% and 29.60%, respectively.


These observations showed that similar land use dynamics was noticed between 1985 and 2000 then 2000 and 2015 (Table 5). In other words, from 1985 to 2000, all conversions concerned 55.5% of the total area, of which 27% was lost. Land use remained almost unchanged during the following fifteen years when conversions were estimated at 54.76%, of which 24.13% was lost. The stable areas were almost equal (44.5% and 45.24% respectively) over the two observation periods. However, this trend in stable areas changed slightly when considering the whole period from 1985 to 2015, where the stable areas were 35.83% and almost equal to the areas gained (35.59%). The losses were, therefore, around 28.58% and are thus very slightly higher than in the sub-period observations.

-Analysis of climatic parameters of the W and Pendjari parks and their peripheries between 1985 and 2015
• Rainfall
The annual mean precipitation had a high variability (coefficient of variation CV = 11.63%) during this study. The five-year centered moving averages show an increasing trend during 1985–1996 and 2000–2010 but a decreasing trend during 1996–1999 and 2010–2015 (Fig. 6a). The lowest annual average precipitation (802.9 mm) was received in 2000 and the highest (1218.9 mm) occurred in 2003. However, the BIC criterion suggests that there was not enough evidence to accept a break in the annual mean precipitation series over the period 1985–2015. The standardized precipitation index (SPI) fluctuates between −1.60 and 2.01 over the study period. This means that there was a succession of droughts (rainfall deficit) and heavy rains (rainfall excess) during this period. The drought periods were 1985–1990, 1992–1993, 1995, 1997, 2000–2001, 2006, 2011 and 2013–2015 respectively with low (−1 < IPS < 0) and moderate (−1 ≥ SPI > −1.5) intensity. Severe drought (−1.5 ≥ SPI > −2) was particularly noticed in 2000. Heavy precipitation of moderate intensity (1 < IPS ≤ 1.5) was recorded during the years 2009 and 2011 but heavy precipitation of extreme intensity was recorded during the years 1991, 1994, 1998, and 2003 (Fig. 7). Considering the entire period of this study (1985–2015), the ombrothermic diagram (Fig. 3) of the W-Pendjari Biosphere Reserve exhibited an unimodal rainfall regime with a rainy season and a dry season (Rainfall > 2 temperature). The rainy season usually begins in mid-April and ends in early October, while the dry season begins in early October and ends in mid-April (rainfall < 2* temperature).

Figure 6: Global trend of climate parameters from 1985 to 2015 for W-Pendjari Biosphere Reserve with change points in the moving averages (MA). (a) Trend of annual mean rainfall; (b) Trend of monthly mean temperature; (c) Trend of monthly mean humidity; (d) Trend of monthly mean wind speed
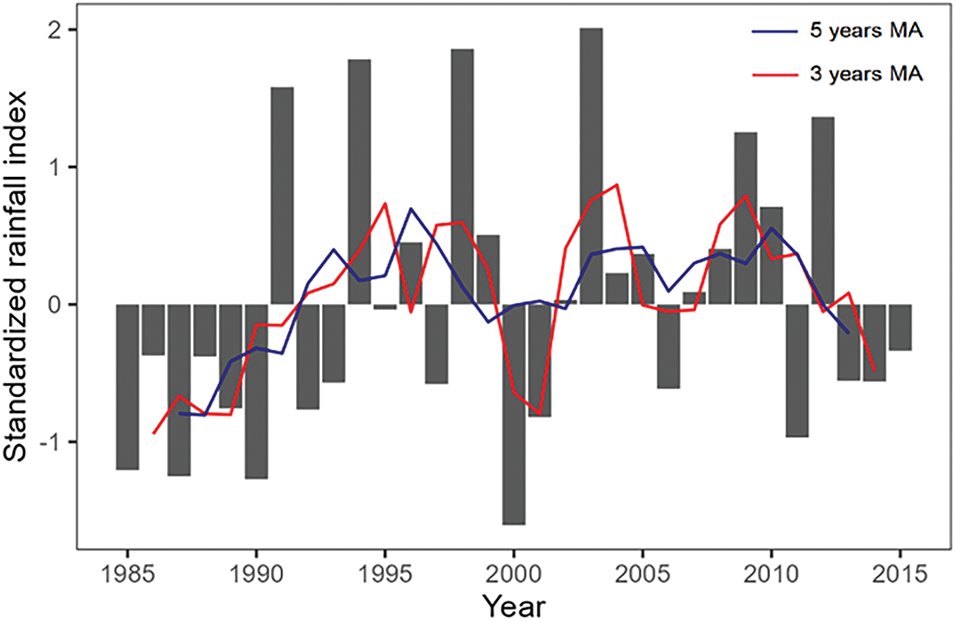
Figure 7: The trend in Standardized Precipitation Index (SPI) from 1985 to 2015 for W-Pendjari Biosphere Reserves with 3 and 5 years moving centered averages (MA)
• Monthly average temperature
Monthly mean temperature showed very little variability (coefficient of variation CV = 1.20%) during this study. The five years centered moving averages showed an increasing trend for the period 1985–2010 (with a high rate from 2001 to 2005), but a decreasing trend from 2010 to 2015 (Fig. 6b). The lowest monthly average temperature (27.16°C) was recorded in 1989 and the highest (28.48°C) in 2010. The BIC criterion for the breakpoint test identifies a breakpoint date and then suggests two segments as the optimal number of segments to model this series. The corresponding break date was the year 2002 (Fig. 6). The average difference in monthly mean temperature between the two periods was 0.44°C, representing an increase.
• Monthly mean humidity
For the present study, there was only slight variability in the monthly average humidity (coefficient of variation CV = 4.99%). The five years centered moving averages revealed an increasing trend during 1985–1994 and 2001–2015, with a steep rate from 2001 to 2015, but a very gradual decreasing trend during 1995–2000 (Fig. 6c). The lowest monthly average humidity of 53.21% occurred in 1987, while the highest (63.33%) occurred in 2014. Based on the BIC criterion for the breakpoint test, a breakpoint date was identified, and two segments were recommended as the optimal number of segments to model this series. The corresponding break date was noticed in 2003. The average difference in monthly mean moisture between the two periods was 4.54%, indicating an increase.
• Monthly average wind speed
The monthly mean wind speed showed a large variability during this study (coefficient of variation CV = 31.76%). The five years centered moving averages show an increasing trend during 1985–1989, 1991–1993 and 2009–2015 with the highest rate during 1991–1993, but a very slow decreasing trend during 1989–1991 and 1993–2009 (Fig. 6d). The lowest monthly average wind speed (0.925 ms−1) was recorded in 1987 whereas the highest (3.29 ms−1) occurred in 2014. The BIC criterion for the breakpoint test identifies a breakpoint date and then suggests two segments as the optimal number of segments to model this series. It was noticed that rainfall in the study areas had no structure break. However, the mean temperature and mean humidity in the study areas exhibited a break in the years 2002 and 2003 (vertical red line), while the mean wind of the areas showed two break years (1992 and 1998). The average difference between periods in the monthly mean wind was −0.89 ms−1 for period 1 and period 2, which represents an increase; −1.01 ms−1 for period 2 and period 3, which represents a decrease; −0.12 ms−1 for period 1 and period 3, being a decrease.
-Predictive modeling of the vegetation cover of the W and Pendjari parks and their peripheries by 2030
• Distribution of climatic factors around the W and Pendjari parks
Precipitation and humidity were the two parameters used for model calibration. Their distribution in the study area indicated that precipitation ranges from 15 to 110 mm of rainfall, and humidity ranged from 51.13% to 55.25% (Fig. 8). While humidity was almost constant over the entire observation period, rainfall varied considerably, with a spatio-temporal shift in maximum rainfall intensities.

Figure 8: Spatial distribution of rainfall and humidity over the periods 1985, 2000 and 2015 in the Pendjari and W protected areas and their peripheries in Benin
Indeed, the greatest rainfall amplitude was observed in 2000, while the lowest was noticed in 1985. Furthermore, in 1985, the maximum rainfall intensity was around 92 mm, whereas in 2000, it increased to 94 mm before rising to 110 mm in 2015. This is an increasing trend in rainfall, with a shift in heavy rainfall from the central region of both parks in 1985 to the southwest in 2000, confirmed in 2015. In other words, the Pendjari Park, the Komkombri and Mekrou hunting zones, and their peripheries were the areas that received the most rain in 1985. In 2000, this front of maximum rainfall intensity shifted completely to the Pendjari and its southern hunting zone only, confirmed in 2015. With these shifts in the rainfall front, it is highly likely that low intensities will be recorded over the two protected areas towards the end of the current decade. This would represent a future threat to the vegetation cover of the study area.
Prior to predicting the vegetation cover in the Pendjari and W parks and their periphery in Benin by 2030, a test was carried out on the model using data from 1985 and 2000 to predict vegetation cover in 2015, which is already known through satellite image processing. As an assumption, the modeling considers that the previously observed evolutions will continue under the control of the protection measures already applied. Thus, the comparison of the 2015 reference map with the simulated map for the same year (Fig. 9), indicated a good representation of the land use units in the study area. However, in the Komkombri and Mekrou hunting zones, the model overestimated the dense forests and the mosaics of fields and fallows in the periphery of the W park. These differences in surface condition were to be expected based on the high presence of these land use units in these compartments between 1985 and 2000, whereas they were less represented in 2015. However, the simulated areas are quite close to those determined from the satellite image (Table 6). The largest absolute differences are for open forests and wooded savannahs, which increased by 4%, while dense forests and tree and shrub savannahs decreased by just over 2% in the simulation. These small differences do not prevent the method from being used for the 2030 prediction.

Figure 9: Comparative mapping of classification and simulation for 2015

• Prediction of the vegetation cover by 2030
The results obtained on the basis of the application of the method to the period 2015–2030 indicated the maintenance of the same land use units (Fig. 10). The most dominant entities remain tree and shrub savannahs (35%), open forest and wooded savannahs (25%), fields and fallows (19%) and dense forests (16%) (Fig. 11). It is also noted that the projected land use units are related to past developments based on the climatic parameters (rainfall and humidity) used. Thus, the prediction informs of a further reduction of natural formations, but in lesser proportions than over the periods 1985–2000 and 2000–2015 (Table 7). However, the extension of tree and shrub savannahs is expected to continue in a lower proportion (0.40%). Similarly, fields and fallow land will continue to increase at the expense of vegetation cover (2%).

Figure 10: Predictive mapping of the vegetation cover of the Pendjari and W parks and their peripheries in Benin by 2030

Figure 11: Proportion of land use units predicted in 2030 for Pendjari and W protected areas and their peripheries in Benin. Agglomeration (AG), Dense Forests (DF), Gallery Forests (GF), Swamp Forest (SF), Field and Fallow mosaics (FF), Water Bodies (W), Open Forests and Wooded Savannahs (OF), Wooded and Shrubby Savannahs (SS), Bare Soil (BS), Saxicolous Savanna (SxS)

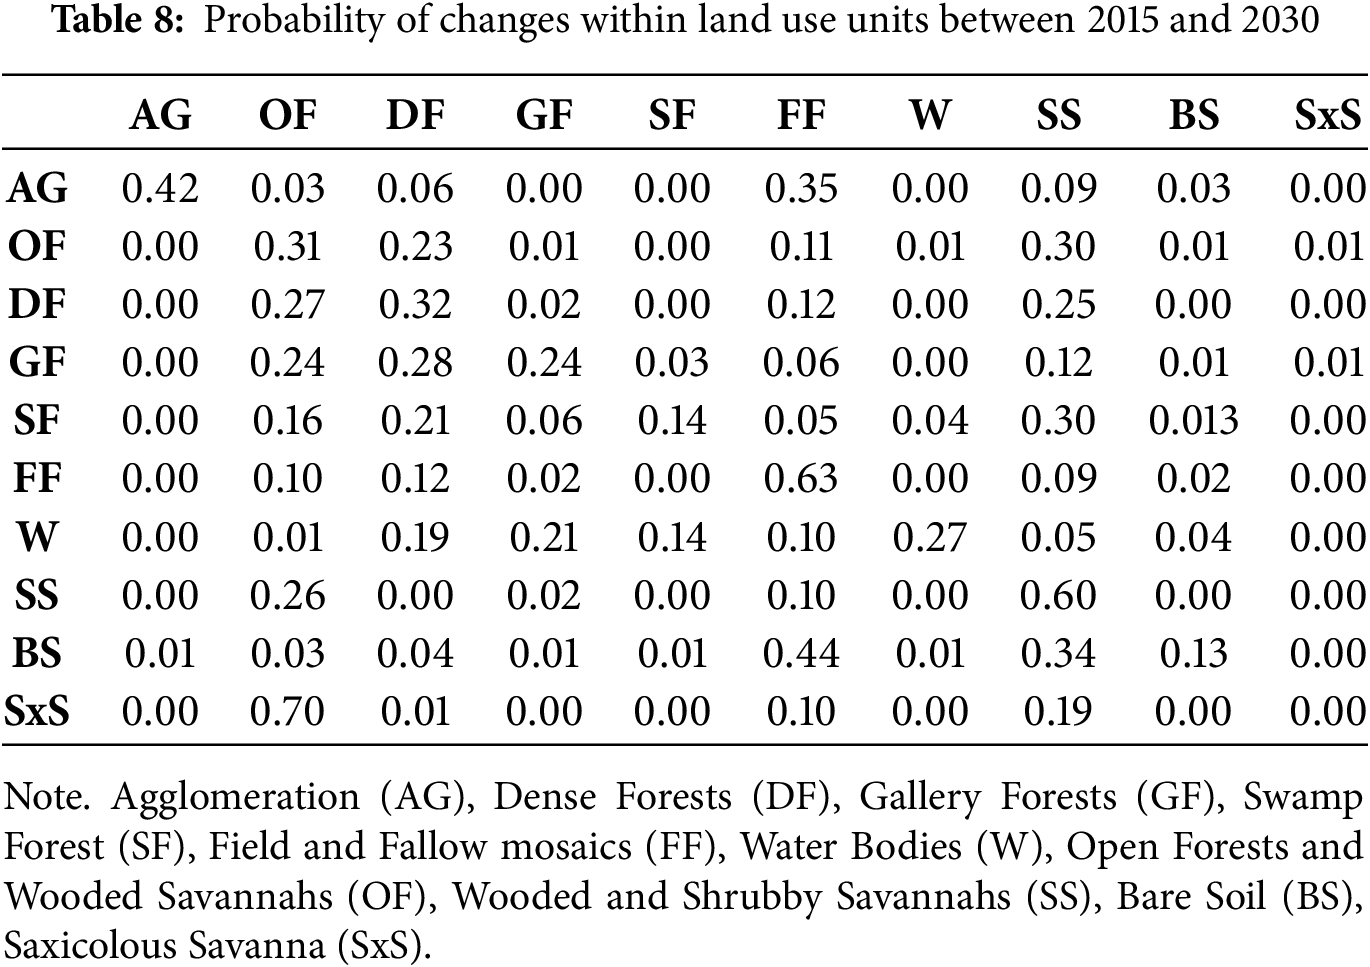
Regarding the speed of future changes, the probabilities calculated by the model indicate that within the vegetation cover, tree and shrub savannas should be more stable (p = 0.60). They will be followed by dense forests (p = 0.32), open forests and wooded savannahs (p = 0.31), and forest galleries (p = 0.24). The greatest stability will be observed in fields and fallows (p = 0.63), which will be maintained and even expand further (Table 8).
4.1 The Importance of Remote Sensing in Analyzing the Change of Land Use in Pendjari and W Parks and Their Peripheries in Benin
The vegetation formations within the parks have changed over the observation period (1985 to 2015). These changes mainly affect dense forests, gallery forests, open forests and wooded savannas, as well as tree and shrub savannas. The same observation was made by Avakoudjo et al. (2014) [7], who analyzed the changes in the vegetation formations of Park W between 1978 and 2008. This confirms the strength of the use of remote sensing for occupancy mapping and its applications in the analysis of forest landscape dynamics [50,51]. Although these images are of medium resolution, they have enabled us to develop our first knowledge of the study area’s past, on the understanding that archives provide no reliable data on the evolution of ecosystems. In the present study, the most remarkable gains were in fields and fallows, which both expanded in the area to meet the agricultural land needs of the surrounding populations at the expense of open forests and wooded savannas and shrub and tree savannas. The accessibility of these vegetation formations, especially during the dry season, is said to be the reason for this situation [8]. However, it should be recognized that most of the fields and fallows are outside the parks and their hunting zones. Thus, the strong degradation of the vegetation cover observed is localized in the village lands surrounding the parks [52]. However, some incursions of fields and fallows have been observed on the southern periphery of the Pendjari and in the northern W. This is certainly due to farmers’ lack of awareness of park boundaries [53]. According to Akpona et al. [54], this is a recurrent anthropogenic disturbance that results from the reluctance of surrounding populations who think they are taking advantage of the weakness of the management systems that have succeeded each other over the past decades [55]. However, with the management of the two parks entrusted to private operators since 2017, this trend of anthropisation of the peripheries seems to be under control [8]. A strong propensity of the surface area of settlements and fields and fallows to increase was observed over this period from 1985 to 2015. Given that these land-use units are mostly located outside protected areas, this indicates the extent of anthropisation in the peripheries of the parks [6]. This constitutes a threat to vegetation cover, to wildlife in situ, and reserve-dwelling communities [56]. Indeed, on the one hand, the degradation of the peripheries of protected areas gives rise to conflict situations [57], with the possibility of animals escaping to village lands, where they are slaughtered by communities, especially hunters [56]. On the other hand, escaping wildlife confuses people in their concessions, sometimes resulting in the loss of human life [58]. The result is a mutual psychosis between animals and humans, which can lead to some species becoming completely isolated from their habitats, sometimes creating the flight or total disappearance of some heritage species from these protected areas [59]. This is the case of the cheetah (Acinonyx jubatus), which is the flagship animal and the emblem of the Pendjari and which has remained without any sign of presence for several years in the whole region [60]. Its fearful, extremely sensitive and vulnerable nature has certainly not facilitated its adaptation to psychosis and environmental changes. In view of these considerations, for good conservation of vegetation cover within protected areas, particular attention should be paid to their peripheries, in order to ensure good cohabitation of humans and wildlife [61].
4.2 Influence of Climate on Vegetation Cover in the Two Parks and Their Surroundings
The climatic parameters studied, i.e., rainfall, temperature, relative humidity and wind speed, made it possible to highlight the evolution of the climate around the two biosphere reserves between 1985 and 2015. The analysis of the curves obtained shows the presence of break periods indicating drought years in the study area over the 30-year period. This makes it possible to draw valid conclusions on climate variability at the scale of the Pendjari and W biosphere reserves [23], and to deduce its implications on the behavior of the vegetation cover in the Sudanian zone [24]. Numerous studies linking climate and vegetation have highlighted that low rainfall and humidity are constraints to the sustainability of forest ecosystems [62]. The climate of the region being of Sudanian type, it presents a uni-modal rainfall regime, leaving the plant cover under water stress for about six (06) months in a year (November to March). This fact, which is already unfavorable to the stability of plant formations, is aggravated by the periods of disruption observed between 1985 and 2015 in terms of climatic parameters, which were analyzed in this study. Indeed, although the rainfall analysis does not show a break between 1985 and 2015, there was a considerable drop in rainfall in 2000, confirmed by the average displayed in Fig. 4a. As a result, during this period, there was a strong drought marked by the partitioning of the vegetation cover of the Sudanian zones of West Africa, resulting in the migration of fauna in search of water and forage [63]. The analysis of the vegetation cover dynamics of the W and Pendjari Biosphere Reserves between 1985 and 2015 confirms this observation through a continuous decrease in gallery forests, open forests and wooded savannahs from the year 2000 to 2015. Similarly, dense forests, swamp forests and saxicolous savannahs experienced this decrease in surface area from 2000, before stabilizing between 2000 and 2015. Only tree and shrub savannahs saw their surface areas increase in 2015 after having fallen between 1985 and 2000. These changes show that, even if it is not asserted as the main factor, the behavior of the Sudanian climate contributes to changes in vegetation cover [24], particularly in the W and Pendjari biosphere reserves between 1985 and 2015. Similar findings were reported by [19], who established a link between forest evolution and climate in the south-eastern regions of Benin, more precisely in the classified forest of Dogo-Kétou. The same hypotheses have been verified by Seguin (2012) in other regions of the world [18]. Apart from rainfall, temperature and relative humidity showed a clear break around 2002 and 2003, respectively, while wind showed two breaks, the first in 1992 and the second in 1998. However, it has been shown that low humidity induces poor vegetation performance in Sudanian environments [24,64]. Thus, the loss in area reported for certain plant formations, including gallery forests, dense forests, swamp forests, saxicolous savannahs, open forests and wooded savannahs from 2000 to 2015 is indicative of a probable correlation with the drop in relative humidity observed during the same period in these two reserves. This confirms the response of the vegetation cover to the influence of climate in the study area [65]. The future of the vegetation cover of the W and Pendjari Biosphere Reserves in the context of climate change. The distribution and evolution of climatic parameters over the first study period (1985–2000) show that in those 15 years, climatic change had already begun, with a change in the state of the vegetation cover of the protected areas in northern Benin. This change was confirmed by the test carried out on the LCM model in which rainfall and humidity were integrated as explanatory variables to simulate land cover in 2015. The results obtained indicate that the simulated vegetation landscape configuration is close to that obtained by reconstruction based on satellite images. Such simulations were carried out by Wang et al. (2022) and Leta et al. (2021) on protected forest entities with conclusive results. In the case of the present study, even if some differences are noted statistically, the differences in area do not exceed 4%, and this is in open forest and wooded savannah. This implies a good response of the model in establishing the link between climate and vegetation cover [20,66]. On this basis, the projected simulation of vegetation cover in the W and Pendjari biosphere reserves for 2030, based on current climate conditions, indicates that the loss of vegetation cover will continue, particularly of open forests and wooded savannahs, tree and shrub savannahs and dense forests, but at a slightly slower rate than in the past. This indicates a probable stability of natural formations, which could be controlled if future climate projections are favorable [67]. Osseni et al. [68] applied the same scientific approach to assess the vegetation dynamics and simulate its future trend in the Ouémé Biosphere Reserve in southern Benin. All this shows that it is worth investigating the vegetation dynamics of large ecosystems in the context of climate change
Alternatively, the study could have first predicted rainfall and relative humidity in 2030 and used these results for the simulation of projected vegetation cover. This option would give quite different results from those currently obtained. However, as the area is protected, changes will not lead to the disappearance of one or more land cover units, as the climatic gradient remains the same [23].
The model helped highlight the climate-vegetation interrelationship in the two large protected areas of Benin, as described in the Sudanian zone [62]. However, taking into account other anthropogenic factors influencing the dynamics of the vegetation cover for future studies is essential to better predict the spatialization of the land cover and to better translate the acceleration of changes by 2030, leading to results that are perhaps more realistic than those currently obtained [69]. To ensure sustainable services including medicinal utilizations [14] that people get from vegetation with regards to the global warming, there is a huge need to frequently monitor dynamics in vegetation types in these two reserves.
This study served to reconstruct the vegetation cover of the W and Pendjari Biosphere Reserves and to predict future changes in the context of climate change in the Sudanian zone of northern Benin. It was possible to use remote sensing and GIS techniques to combine satellite and climate images from 1985 to 2015 to produce quantitative and qualitative information on the vegetation landscape of the study area. It was found that the vegetation cover of the study area is made up of dense forests, gallery forests, open forests and tree savannahs, swamp forests, tree and shrub savannahs, and saxicolous savannahs. Within the protected areas, these ecosystems have undergone changes by mutations, especially between open forests and wooded savannas and tree and shrub savannas. Outside the protected areas, the fields and fallow land have been cutting into the other land-use units to the point of threatening the periphery of the protected areas. The region’s climate is Sudanian and has a uni-modal regime, putting vegetation under water stress for half the year. Spatial modeling based on these data shows a future trend similar to that observed between 1985 and 2015 in terms of vegetation cover evolution. This future trend remains a simulation and will only be realistic if natural resource conservation efforts are made by stakeholders. This study, which is the first to link vegetation and climate in the study area, provides a baseline and a framework for stimulating further research. Based on these considerations, the following recommendations are made:
- The boundaries of these two protected areas need to be re-defined and clearly demarcated to prevent the development of agricultural encroachment within them;
- Participatory management measures need to be strengthened outside these protected areas to support existing socio-economic development without encouraging the destruction of the remaining pockets of vegetation in these areas;
- Future research could combine man-made factors with climatic parameters, in order to investigate scenarios to be compared with the reality on the ground in 2030.
Acknowledgement: Authors are grateful to Phil Harris, a retired Professor from Coventry University (UK) who edited the first draft of this article. We are deeply thankful to him for his kindness over several years.
Funding Statement: This study received no external funding.
Author Contributions: Abdel Aziz Osseni, Hubert Olivier Dossou-Yovo, Apollon D.M.T. Hegbe and Muhammad Nauman Khan wrote the proposal, collected data and analyzed them, wrote the article and provided its corrections. Brice Sinsin supervised this work, edited and approved its final version before submission. All authors reviewed the results and approved the final version of the manuscript.
Availability of Data and Materials: Data supporting this paper are shown throughout tables and figures. They are still available with the corresponding author upon request.
Ethics Approval: Not applicable.
Conflicts of Interest: The authors declare no conflicts of interest to report regarding the present study.
References
1. Osseni AA, Dossou-Yovo HO, Gbesso GHF, Lougbegnon TO, Sinsin B. Spatial dynamics and predictive analysis of vegetation cover in the ouémé river delta in Benin (West Africa). Remote Sens. 2022;14(23):6165. doi:10.3390/rs14236165. [Google Scholar] [CrossRef]
2. Lindenmayer DB, Lavery T, Scheele BC. Why we need to invest in large-scale, long-term monitoring programs in landscape ecology and conservation biology. Curr Landsc Ecol Rep. 2022;7(4):137–46. doi:10.1007/s40823-022-00079-2. [Google Scholar] [CrossRef]
3. Uchegbulam O, Ameloko AA, Omo-Irabor OO. Effect of cloud cover on land use land cover dynamics using remotely sensed data of western Niger delta, Nigeria. J Appl Sci Environ Manage. 2021;25(5):799–804. doi:10.4314/jasem.v25i5.17. [Google Scholar] [CrossRef]
4. Venter ZS, Barton DN, Chakraborty T, Simensen T, Singh G. Global 10 m land use land cover datasets: a comparison of dynamic world, world cover and Esri land cover. Remote Sens. 2022;14(16):4101. doi:10.3390/rs14164101. [Google Scholar] [CrossRef]
5. Alsharif M, Ali Alzandi A, Shrahily R, Mobarak B. Land use land cover change analysis for urban growth prediction using landsat satellite data and Markov chain model for Al baha Region Saudi Arabia. Forests. 2022;13(10):1530. doi:10.3390/f13101530. [Google Scholar] [CrossRef]
6. Mama A, Sinsin B, Cannière CD, Bogaert J. Anthropisation et dynamique des paysages en zone soudanienne au nord du Bénin. Tropicultura. 1998;31:78–88. [Google Scholar]
7. Avakoudjo J, Mama A, Toko I, Kindomihou V, Sinsin B. Dynamique de l’occupation du Sol dans le Parc National du W et sa périphérie au nord-ouest du Bénin. Int J Bio Chem Sci. 2015;8(6):2608–25. doi:10.4314/ijbcs.v8i6.22. [Google Scholar] [CrossRef]
8. Gado BOK, Imorou IT, Arouna O, Oumorou M. Caractérisation des parcours de transhumance à la périphérie de la réserve de biosphère transfrontalière du W au Bénin. Int J Bio Chem Sci. 2020;14(2):333–52. doi:10.4314/ijbcs.v14i2.3. [Google Scholar] [CrossRef]
9. Vodouhe FG, Dossou-Yovo HO, Chadaré FJ, Gélinas N, Assogbadjo AE, Coulibaly O. Valuing the potential of non-timber forest products in financial valuation of savannah formation in sudanian region. Univ J Agr Res. 2016;4(5):183–97. doi:10.13189/ujar.2016.040504. [Google Scholar] [CrossRef]
10. Olaniyi OM, Akpu B, Iguisi EO. Comparative analysis of Markov chain and cellular automated Markov models for forecasting forest depletion in afaka forest reserve, kaduna state, Nigeria. E3 J Environ Res Manag. 2018;9(1):11–9. [Google Scholar]
11. Dossou-Yovo HO, Assogbadjo AE, Sinsin B. The contribution of Termitaria to plant species conservation in the pendjari biosphere reserve in Benin. Eer. 2016;4(4):200–6. doi:10.13189/eer.2016.040403. [Google Scholar] [CrossRef]
12. Dossou-Yovo HO, Vodouhe FG, Sinsin B. Assessment of the medicinal uses of plant species found on Termitaria in the Pendjari biosphere reserve in Benin. J Med Plants Res. 2014;8(8):368–77. doi:10.5897/jmpr10.124. [Google Scholar] [CrossRef]
13. Dossou-Yovo HO, Vodouhè FG, Kindomihou V, Sinsin B. Investigating the use profile of Kigelia africana (lam.) Benth. through market survey in Benin. Conservation. 2022;2(2):275–85. doi:10.3390/conservation2020019. [Google Scholar] [CrossRef]
14. Dossou-Yovo HO, Vodouhè FG, Kaplan A, Sinsin B. Application of ethnobotanical indices in the utilization of five medicinal herbaceous plant species in Benin, west Africa. Diversity. 2022;14(8):612. doi:10.3390/d14080612. [Google Scholar] [CrossRef]
15. Leta MK, Demissie TA, Tränckner J. Modeling and prediction of land use land cover change dynamics based on land change modeler (LCM) in Nashe watershed, upper blue Nile basin, Ethiopia. Sustainability. 2021;13(7):3740. doi:10.3390/su13073740. [Google Scholar] [CrossRef]
16. Wang J, Zhang J, Xiong N, Liang B, Wang Z, Cressey E. Spatial and temporal variation, simulation and prediction of land use in ecological conservation area of western Beijing. Remote Sens. 2022;14(6):1452. doi:10.3390/rs14061452. [Google Scholar] [CrossRef]
17. Zhan C, Liang C, Zhao L, Jiang S, Niu K, Zhang Y, et al. Vegetation dynamics and its response to climate change in the Yellow River Basin. China Front Environ Sci. 2022;10:892747. doi:10.3389/fenvs.2022.892747. [Google Scholar] [CrossRef]
18. Seguin B. Le changement climatique: conséquences pour les végétaux. Quaderni. 2010;71:27–40. (In French). doi:10.4000/quaderni.525. [Google Scholar] [CrossRef]
19. Kingbo A, Teka O, Aoudji AKN, Ahohuendo B, Ganglo JC. Climate change in southeast Benin and its influences on the spatio-temporal dynamic of forests, Benin, west Africa. Forests. 2022;13(5):698. doi:10.3390/f13050698. [Google Scholar] [CrossRef]
20. Cui L, Pang B, Zhao G, Ban C, Ren M, Peng D, et al. Assessing the sensitivity of vegetation cover to climate change in the Yarlung Zangbo river basin using machine learning algorithms. Remote Sens. 2022;14(7):1556. doi:10.3390/rs14071556. [Google Scholar] [CrossRef]
21. Chi K, Pang B, Cui L, Peng D, Zhu Z, Zhao G, et al. Modelling the vegetation response to climate changes in the Yarlung Zangbo river basin using random forest. Water. 2020;12(5):1433. doi:10.3390/w12051433. [Google Scholar] [CrossRef]
22. Tehou CA, Lougbegnon TO, Houessou LG, Mensanh GA, Sinsin B. Influence de la proximité des points d’eau sur l’intensité des dégâts des populations d’éléphants et sur les peuplements de Adansonia digitata L. et Acacia sieberiana DC. dans la Réserve de Biosphère de la Pendjari. Int J Bio Chem Sci. 2019;13(1):110. doi:10.4314/ijbcs.v13i1.10. [Google Scholar] [CrossRef]
23. Idrissou Y, Seidou Mama Sambo Y, Assani Seidou A, Sanni Worogo HS, Assogba GC, Alkoiret Traoré I, et al. Influence of grazing and climatic gradient on the flora diversity and productivity of rangelands in Benin. Revue D’Elevage Et De Médecine Vétérinaire Des Pays Tropicaux. 2020;73(3):161–7. doi:10.19182/remvt.31894. [Google Scholar] [CrossRef]
24. Soufiyanou K, Ismaïla TI, Ousséni A. Impact de la Variabilité Climatique sur la Niche Ecologique de Diospyros mespiliformis Hochst. ex A.De. dans la Région Soudanienne au Bénin (Afrique de l’Ouest). Eur Sci J ESJ. 2019;15(36):1–19. doi:10.19044/esj.2019.v15n36p1. [Google Scholar] [CrossRef]
25. Houessou LG. Etude Sur La Caractérisation de l’occupation Des Terres et La Réalisation d’une Base de Données Sur Leur Usage Par Les Populations Riveraines Dans La Périphérie Des Réserves de Biosphère Du W et Pendjari Au Bénin. GIZ Bénin. République du Bénin; 2019. 42 p. (In French). [Google Scholar]
26. Faure P. Notice Explicative No. 66 (4Carte Pédologique de Reconnaissance de La République Du Bénin à 1: 200.000, Feuille de Djougou. Paris, France: ORSTOM; 1977. (In French). [Google Scholar]
27. Gnanglè PC, Yabi JA, Yegbemey NR, Kakai RG, Sopkon N. Rentabilité Economique Des Systèmes de Production Des Parcs à Karité Dans Le Contexte de l’adaptation Au Changement Climatique Du Nord-Benin. Afr Crop Sci J. 2012;20:589–602. doi:10.4314/acsj.v20i2. [Google Scholar] [CrossRef]
28. Justice CO, Townshend JRG, Holben BN, Tucker CJ. Analysis of the phenology of global vegetation using meteorological satellite data. Int J Remote Sens. 1985;6(8):1271–318. doi:10.1080/01431168508948281. [Google Scholar] [CrossRef]
29. Simonetti E, Simonetti D, Preatoni D. Phenology-based land cover classification using landsat 8 time series. Ispra, Italy: European Commission Joint Research Center; 2014. [Google Scholar]
30. Leboeuf A, Samson MP, Paquet A. Guide d’interprétation Des Mosaïques d’images Satellite Landsat. In: Ministère des forêts, de la faune et des parcs, Secteur des forêts; 2015. 16 p. (In French). [Google Scholar]
31. Ahononga FC, Awessou BK, Kouton MD, Plagbeto HA, Oréka OV, Toko Imorou I, et al. Atlas Cartographique de La Dynamique de l’occupation Du Sol au Bénin entre 2005 et 2015, Bibliothèque Nationale du Bénin. Dépôt Legal; 2021. 338 p. (In French). [Google Scholar]
32. Pontius RG Jr. Metrics that make a difference. How to analyze change and error. In: Advances in geographic information science. Berlin/Heidelberg, Germany: Springer; 2022. [Google Scholar]
33. Pontius RG Jr, Millones M. Death to Kappa: birth of quantity disagreement and allocation disagreement for accuracy assessment. Int J Remote Sens. 2011;32(15):4407–29. doi:10.1080/01431161.2011.552923. [Google Scholar] [CrossRef]
34. Rstudio Core Team. RStudio: integrated development environment for R. Boston, MA, USA: RStudio; 2022. [Google Scholar]
35. Rstudio Core Team. R: a language and environment for statistical computing. Boston, MA, USA: RStudio; 2021. [Google Scholar]
36. Hyndman RJ, Athanasopoulos G, Bergmeir C, Caceres G, Chhay L, O’Hara-Wild M, et al. Package ‘Forecast.’ [Online]. [cited 2025 Mar 12]. Available from: https://cran.r-project.org/web/packages/forecast/forecast.pdf2020. [Google Scholar]
Hyndman RJ, Khandakar Y. Automatic time series forecasting: the forecast Package for R. J Stat Soft. 2008;27(3):1–22. doi:10.18637/jss.v027.i03. [Google Scholar] [CrossRef]
38. Wickham H. Ggplot2: elegant graphics for data analysis. Berlin/Heidelberg, Germany: Springer; 2016. [Google Scholar]
39. Wickham H, Chang W, Henry L, Pedersen TL, Takahashi K, Wilke C, et al. Ggplot2 : create Elegant Data Visualisations Using the Grammar of Graphics (3.4.2); 2023 [cited 2025 Mar 12]. Available from: https://cran.r-project.org/web/packages/ggplot2/index.html. [Google Scholar]
40. Zeileis A, Leisch F, Hornik K, Kleiber C. Strucchange: an R package for testing for structural change in linear regression models. J Stat Soft. 2002;7(2):1–38. doi:10.18637/jss.v007.i02. [Google Scholar] [CrossRef]
41. Zeileis A, Kleiber C, Krämer W, Hornik K. Testing and dating of structural changes in practice. Comput Stat Data Anal. 2003;44(1–2):109–23. doi:10.1016/S0167-9473(03)00030-6. [Google Scholar] [CrossRef]
42. McKee T, Doesken N, Kleist J. The relationship of drought frequency and duration to time scales. In: Proceedings of the Proceedings of the 8th Conference on Applied Climatology; 1993 Jan 17–22; Anaheim, CA, USA; 1993. p. 179–83. [Google Scholar]
43. Tsesmelis DE, Leveidioti I, Karavitis CA, Kalogeropoulos K, Vasilakou CG, Tsatsaris A, et al. Spatiotemporal application of the standardized precipitation index (SPI) in the eastern Mediterranean. Climate. 2023;11(5):95. doi:10.3390/cli11050095. [Google Scholar] [CrossRef]
44. Mas JF, Pérez-Vega A, Clarke KC. Assessing simulated land use/cover maps using similarity and fragmentation indices. Ecol Complex. 2012;11(4):38–45. doi:10.1016/j.ecocom.2012.01.004. [Google Scholar] [CrossRef]
45. Mas JF, Kolb M, Paegelow M, Camacho Olmedo MT, Houet T. Inductive pattern-based land use/cover change models: a comparison of four software packages. Environ Model Softw. 2014;51(19):94–111. doi:10.1016/j.envsoft.2013.09.010. [Google Scholar] [CrossRef]
46. Dralle DN, Jesse Hahm W, Rempe DM, Karst N, Anderegg LDL, Thompson SE, et al. Plants as sensors: vegetation response to rainfall predicts root-zone water storage capacity in Mediterranean-type climates. Environ Res Lett. 2020;15(10):104074. doi:10.1088/1748-9326/abb10b. [Google Scholar] [CrossRef]
47. Girma A, Yan D, Wang K, Birara H, Gedefaw M, Batsuren D, et al. Climate change, land use, and vegetation evolution in the upper Huai river basin. Atmos. 2023;14(3):512. doi:10.3390/atmos14030512. [Google Scholar] [CrossRef]
48. Chen Z, Wang W, Fu J. Vegetation response to precipitation anomalies under different climatic and biogeographical conditions in China. Sci Rep. 2020;10(1):830. doi:10.1038/s41598-020-57910-1. [Google Scholar] [PubMed] [CrossRef]
49. McLean KG. Land use, climate change adaptation and indigenous peoples. Knowl Bull, Trop Issues Ser. 2012;1–7. [Google Scholar]
50. Diédhiou I, Mering C, Sy O, Sané T. Cartographier par télédétection l’occupation du Sol et ses changements. EchoGéo. 2020;54:1–41. (In French). doi:10.4000/echogeo.20510. [Google Scholar] [CrossRef]
51. Nedd R, Light K, Owens M, James N, Johnson E, Anandhi A. A synthesis of land use/land cover studies: definitions, classification systems, meta-studies, challenges and knowledge gaps on a global landscape. Land. 2021;10(9):994. doi:10.3390/land10090994. [Google Scholar] [CrossRef]
52. Akodéwou A, Oszwald J, Saïdi S, Gazull L, Akpavi S, Akpagana K, et al. Land use and land cover dynamics analysis of the togodo protected area and its surroundings in southeastern Togo, west Africa. Sustainability. 2020;12(13):5439. doi:10.3390/su12135439. [Google Scholar] [CrossRef]
53. Biga I, Amani A, Soumana I, Bachir M, Mahamane A. Dynamique spatio-temporelle de l’occupation des sols des communes de Torodi, Gothèye et Tagazar de la région de Tillabéry au Niger. Int J Bio Chem Sci. 2020;14(3):949–65. doi:10.4314/ijbcs.v14i3.24. [Google Scholar] [CrossRef]
54. Akpona TJD, Akpona HA, Djossa BA, Savi MK, Daïnou K, Ayihouenou B, et al. Impact of land use practices on traits and production of shea butter tree (Vitellaria paradoxa C.F. Gaertn.) in Pendjari Biosphere Reserve in Benin. Agrofor Syst. 2016;90(4):607–15. doi:10.1007/s10457-015-9847-1. [Google Scholar] [CrossRef]
55. Thierry A, Martin P, Ismaïla TI, Brice T. Modelisation des changements D’occupation des terres en region soudanienne Au nord-ouest du Benin. Eur Sci J ESJ. 2018;14(12):248. doi:10.19044/esj.2018.v14n12p248. [Google Scholar] [CrossRef]
56. Boukari S, Tahi S, Arouna O, Imorou IT, Tente B, Sinsin AB. Perception des Populations sur les Facteurs de Dégradation et les Mesures de Protection de la Réserve de Biosphère Transfrontalière du W au Bénin. Int J Prog Sci Technol. 2020;20:327–39. doi:10.52155/ijpsat.v20.2.1838. [Google Scholar] [CrossRef]
57. Gansaonré RN. Dynamique du couvert végétal et implications socio-environnementales à la périphérie du parc W/Burkina Faso. VertigO - la revue électronique en sciences de l’environnement. 2018;18(1). doi:10.4000/vertigo.20249. [Google Scholar] [CrossRef]
58. Hema EM, Ouattara Y, Karama M, Petrozzi F, Di Vittorio M, Guenda W, et al. Population dynamics of medium and large mammals in a West African gallery forest area and the potential effects of poaching. J Threat Taxa. 2017;9(5):10151. doi:10.11609/jott.3212.9.5.10151-10157. [Google Scholar] [CrossRef]
59. Sinsin B, Tehou AC, Daouda I, Saidou A. Abundance and species richness of larger mammals in Pendjari National Park in Benin. mamm. 2002;66(3):369–80. doi:10.1515/mamm.2002.66.3.369. [Google Scholar] [CrossRef]
60. PNP Plan d’Aménagement Participatif et de Gestion de La Réserve de Biosphère de La Pendjari : 2004–2013. Benin: Parc National de la Pendjari; 2003. 124 p. [Google Scholar]
61. Skidmore AK, Coops NC, Neinavaz E, Ali A, Schaepman ME, Paganini M, et al. Priority list of biodiversity metrics to observe from space. Nat Ecol Evol. 2021;5(7):896–906. doi:10.1038/s41559-021-01451-x. [Google Scholar] [PubMed] [CrossRef]
62. Belle EMS, Burgess ND, Misrachi M, Arnell A, Masumbuko B, Somda J et al. Impacts Du Changement Climatique Sur La Biodiversité et Les Aires Protégées En Afrique de l’Ouest, Résumé Des Résultats Du Projet PARCC, Aires Protégées Résilientes Au Changement Climatique En Afrique de l’Ouest. Cambridge, UK: UNEP-WCMC; 2016. [Google Scholar]
63. Hema EM, Barnes RFW, Guenda W. Distribution of savannah elephants (Loxodonta Africana Africana Blumenbach 1797) within Nazinga game ranch, Southern Burkina Faso. Afr J Ecol. 2011;49(2):141–9. doi:10.1111/j.1365-2028.2010.01239.x. [Google Scholar] [CrossRef]
64. Manetsa V. Etude multi-échelles des précipitations et du couvert végétal au Cameroun : Analyses spatiales, tendances temporelles, facteurs climatiques et anthropiques de variabilité du NDVI [Université de Bourgogne]; 2011 [cited 2025 Mar 12]. Available from: https://oa.mg/work/600170617. [Google Scholar]
65. Bougouma K, Jaquet S, Bonometti, Derenoncourt E, Schiek, Ghosh A, et al. PAM Initiative Interne Primordiale : Analyse de la Réponse pour l’Adaptation Climatique Haiti. L’Alliance de Bioversity International et le Centre International de l’Agriculture Tropicale; Programme Alimentaire Mondial; 2021. [Google Scholar]
66. Deng G, Gao J, Jiang H, Li D, Wang X, Wen Y, et al. Response of vegetation variation to climate change and human activities in semi-arid swamps. Front Plant Sci. 2022;13:990592. doi:10.3389/fpls.2022.990592. [Google Scholar] [PubMed] [CrossRef]
67. Hussain S, Qin S, Nasim W, Bukhari MA, Mubeen M, Fahad S, et al. Monitoring the dynamic changes in vegetation cover using spatio-temporal remote sensing data from 1984 to 2020. Atmosphere. 2022;13(10):1609. doi:10.3390/atmos13101609. [Google Scholar] [CrossRef]
68. Osseni AA, Gbesso GHF, Idakou GN, Fandohan AB, Toko I, Tente ABH, et al. Reconstitution spatiale et simulation des changements futurs de l’occupation du sol dans la Réserve de Biosphère de la basse vallée de l’Ouémé (RB-BVO) au Bénin. Physio-Géo. 2023;19:1–28. (In French). doi:10.4000/physio-geo.15014. [Google Scholar] [CrossRef]
69. Adjei E, Li W, Narine L, Zhang Y. What drives land use change in the southern U.S.? A case study of Alabama. Forests. 2023;14(2):171. doi:10.3390/f14020171. [Google Scholar] [CrossRef]
Cite This Article
 Copyright © 2025 The Author(s). Published by Tech Science Press.
This work is licensed under a Creative Commons Attribution 4.0 International License , which permits unrestricted use, distribution, and reproduction in any medium, provided the original work is properly cited.
 Downloads
 Citation Tools