
 Submit a Paper
 Propose a Special lssue
 Open Access
ARTICLE
Spatio-Temporal Evolution of Urban Tree Landscapes and the Determinants of Their Transformation in Kétou, Benin
Unité de Recherche Horticole et d’Aménagement des Espaces Verts, Laboratoire des Sciences Végétales, Horticoles et Forestières, École d’Horticulture et d’Aménagement des Espaces Verts, Université Nationale d’Agriculture, Kétou, 229, Benin
* Corresponding Author: Gbodja Houéhanou François Gbesso. Email:
Revue Internationale de Géomatique 2025, 34, 259-275. https://doi.org/10.32604/rig.2025.064032
Received 02 February 2025; Accepted 27 April 2025; Issue published 23 May 2025
 View Full Text
 Download PDF
Abstract
Sustainable urban development nowadays requires the consideration of vegetation, particularly green spaces, for the well-being of the population and the quality of life. It is with this purpose a study was conducted in the city of Kétou, Benin, to analyze the spatio-temporal dynamics of the wooded landscape and its influencing factors, with a view to sustainable urban planning. Using remote sensing and Geographic Information Systems, Landsat TM, ETM, and OLI/TIRS satellite images were processed using the Maximum Likelihood Algorithm in Environment for Visualizing Images (ENVI) 5.0 to assess land use changes from 2003 to 2023. A socio-economic survey was also carried out on a sample of seventy 70 residents to identify the causes of vegetation changes, their economic impacts, and residents’ perceptions. The results reveal six (06) types of land uses which are clear forests, wooded and shrub savannas, mosaics of culture and fallow, land under palm trees, watercourses and built-up areas. These uses have changed between 2003 and 2023, to the detriment of built-up areas, which saw a significant increase in their area, rising from 384 ha in 2003 to 1462 ha in 2013 and from 1462 to 2056 ha in 2023, an increase of (+1672 ha). This shows that the study area has been heavily urbanized. This dynamic is influenced by two (02) direct factors, namely: wood exploitation in various forms (80%) and urbanization (75.7%), and four indirect factors, namely: agriculture (44%), the collection of non-timber forest products (NTFPs), the commercialization of NTFPs and wood (timber and fuelwood) (12.85%), and crafts (11.42%). Despite the residents’ awareness of the environmental impact of vegetation destruction, they continue their actions. This highlights the need for the implementation of new sustainable management strategies, such as reasonable urbanization policies and agricultural methods adapted to the environment. This information remains a contribution to science, which policymakers should consider for the sustainable management of urban tree landscapes for the well-being of residents.Keywords
Several cities today have developed with a trend where priority is given to housing and infrastructure due to growing land demand, often at the expense of vegetation [1,2]. This phenomenon is particularly noticeable in cities of developing countries [3]. It is the result of demographic pressure leading to the expansion of housing and the widening of arable land to meet the needs of the population [4,5]. This has led to the destruction of natural vegetation formations in these cities and consequently the loss of biodiversity [3,6]. Likewise, vegetation is traditionally used in semi-arid West Africa by the population for food services, pharmacopoeia, firewood, and forage [7,8]. This results in the destruction, or even loss, of the natural environment [6,9]. There is also the issue of the little importance given to vegetation by the urban population [10,11]. However, the preservation of biodiversity remains a pillar of society, the economy, and sustainable development [6].
Moreover, many scientists and political actors today are particularly interested in these urban green networks around the world, since beyond the aesthetics and attractiveness they offer to cities, they also provide ecosystem goods and services (EGS) for the well-being of city dwellers [12,13]. They appear as one of the nature-based solutions that promote sustainable urban development, adaptation and mitigation of the effects of climate change [14,15]. Urban trees actively participate in the annual sequestration of 100 g of particles with a diameter of less than 10 μm, such as ozone (O3), sulfur dioxide (SO2), and carbon (CO2) [16–18]. This makes the living environment clean and viable for city dwellers and their presence gives cities a certain attractiveness [6,19].
Furthermore, several studies have also demonstrated a significant reduction in vegetation cover in African’s cities [20,21]. Similarly, the existence of a high correlation (99%) between the evolution of land occupations and the population growth, with a destruction of natural vegetation of approximately 40.63% for an agricultural land exploitation of 34.60% of surface area [3,22,23]. In Benin, for example, in the city of Kétou, the population increased from 25,102 inhabitants in 2002 to 39,626 inhabitants in 2013, and is expected to reach 64,592 inhabitants in 2026 and potentially 101,406 inhabitants in 2038 [24]. This population growth is impacting vegetation, which has decreased from 739 to 562 km2, representing a reduction of 7.97% in just ten (10) years [24]. This leads to a series of adverse socio-economic and environmental impacts where green space developments fail to keep pace with the city’s spatial expansion [25]. Demonstrating the inadequacy of strategic initiatives for land management, urban dwellers, and financial resources for landscaping and proper city development [26].
Though, Kétou is a town with secondary status taken into account by the government action program (PAG) with the aim of making it a lever for the tourism sector and which concentrates important infrastructures and equipment including the National University of Agriculture (UNA) [24]. Knowing the Kétou city land uses would allow us to know the current state of land use for the implementation of predictive initiatives to maintain biodiversity, increase tree canopy cover, and consequently increase ecosystem services in urban areas, such as in the city of Cotonou [15,27]. Indeed, studying the Kétou city will help to initiate landscaping strategies and plans adapted to the city for effective plant management taking into account potential mechanical damage and the ecological requirements of the urban environment [17] with choices of urban trees guided by criteria of diversity, sustainability, good growth and aesthetic value [17]. It is necessary to model the city of Kétou in order to assess the effects of these changes on the general state of the landscape and the vegetation dynamics depending on the urbanization degree [28]. Studies in the same vein have modeled the dynamics of land use in the wetlands of the Allada commune [29], the transhumance routes in the Ouémé valley [30], and land use in the Lower Ouémé Valley Biosphere Reserve [5]. However, no study has focused on other country’s regions, specifically the city of Kétou.
Besides, urban vegetation remains under competitive pressure due to land use for various human activities [6,31]. These include deforestation, early bushfires, and informal habitat settlements, among others [7,24]. In this case, it is important to identify the direct or indirect factors influencing the vegetation of the Kétou city. For sustainable management of degraded land uses, a good understanding of the causes and a proper representation of their extension are essential [2].
This work aims to characterize the spatio-temporal dynamics of tree vegetation and analyze the factors influencing the spatio-temporal dynamics of tree vegetation in the city of Kétou for the development of sustainable management strategies for urban vegetation.
The city of Kétou is one of the six (06) districts of the Kétou commune, located in the southeastern part of Benin, at the extreme north of the Plateau department, between latitudes 7°10′ and 7°41′17″ North and longitudes 2°24′24″ and 2°47′40″ East (Fig. 1). It is the urban area of the commune considered a secondary-status city, with a tropical climate featuring a bimodal rainfall pattern and an average annual temperature of around 25°C. The vegetation consists of wooded savanna, fruit, and forest plantations with tropical ferruginous and ferrallitic soils that are minimally disturbed. The urban population is approximately 57,704 inhabitants in 2023, accounting for 26.14% of the total population of the commune. It is primarily composed of Yoruba and related ethnic groups (77.7% of the population), Fon and related groups (19.6%), and Fulani (0.8%). The activities carried out are mainly agriculture (50%), trade (30%), crafts, livestock, and forestry (20%) [24,32,33].
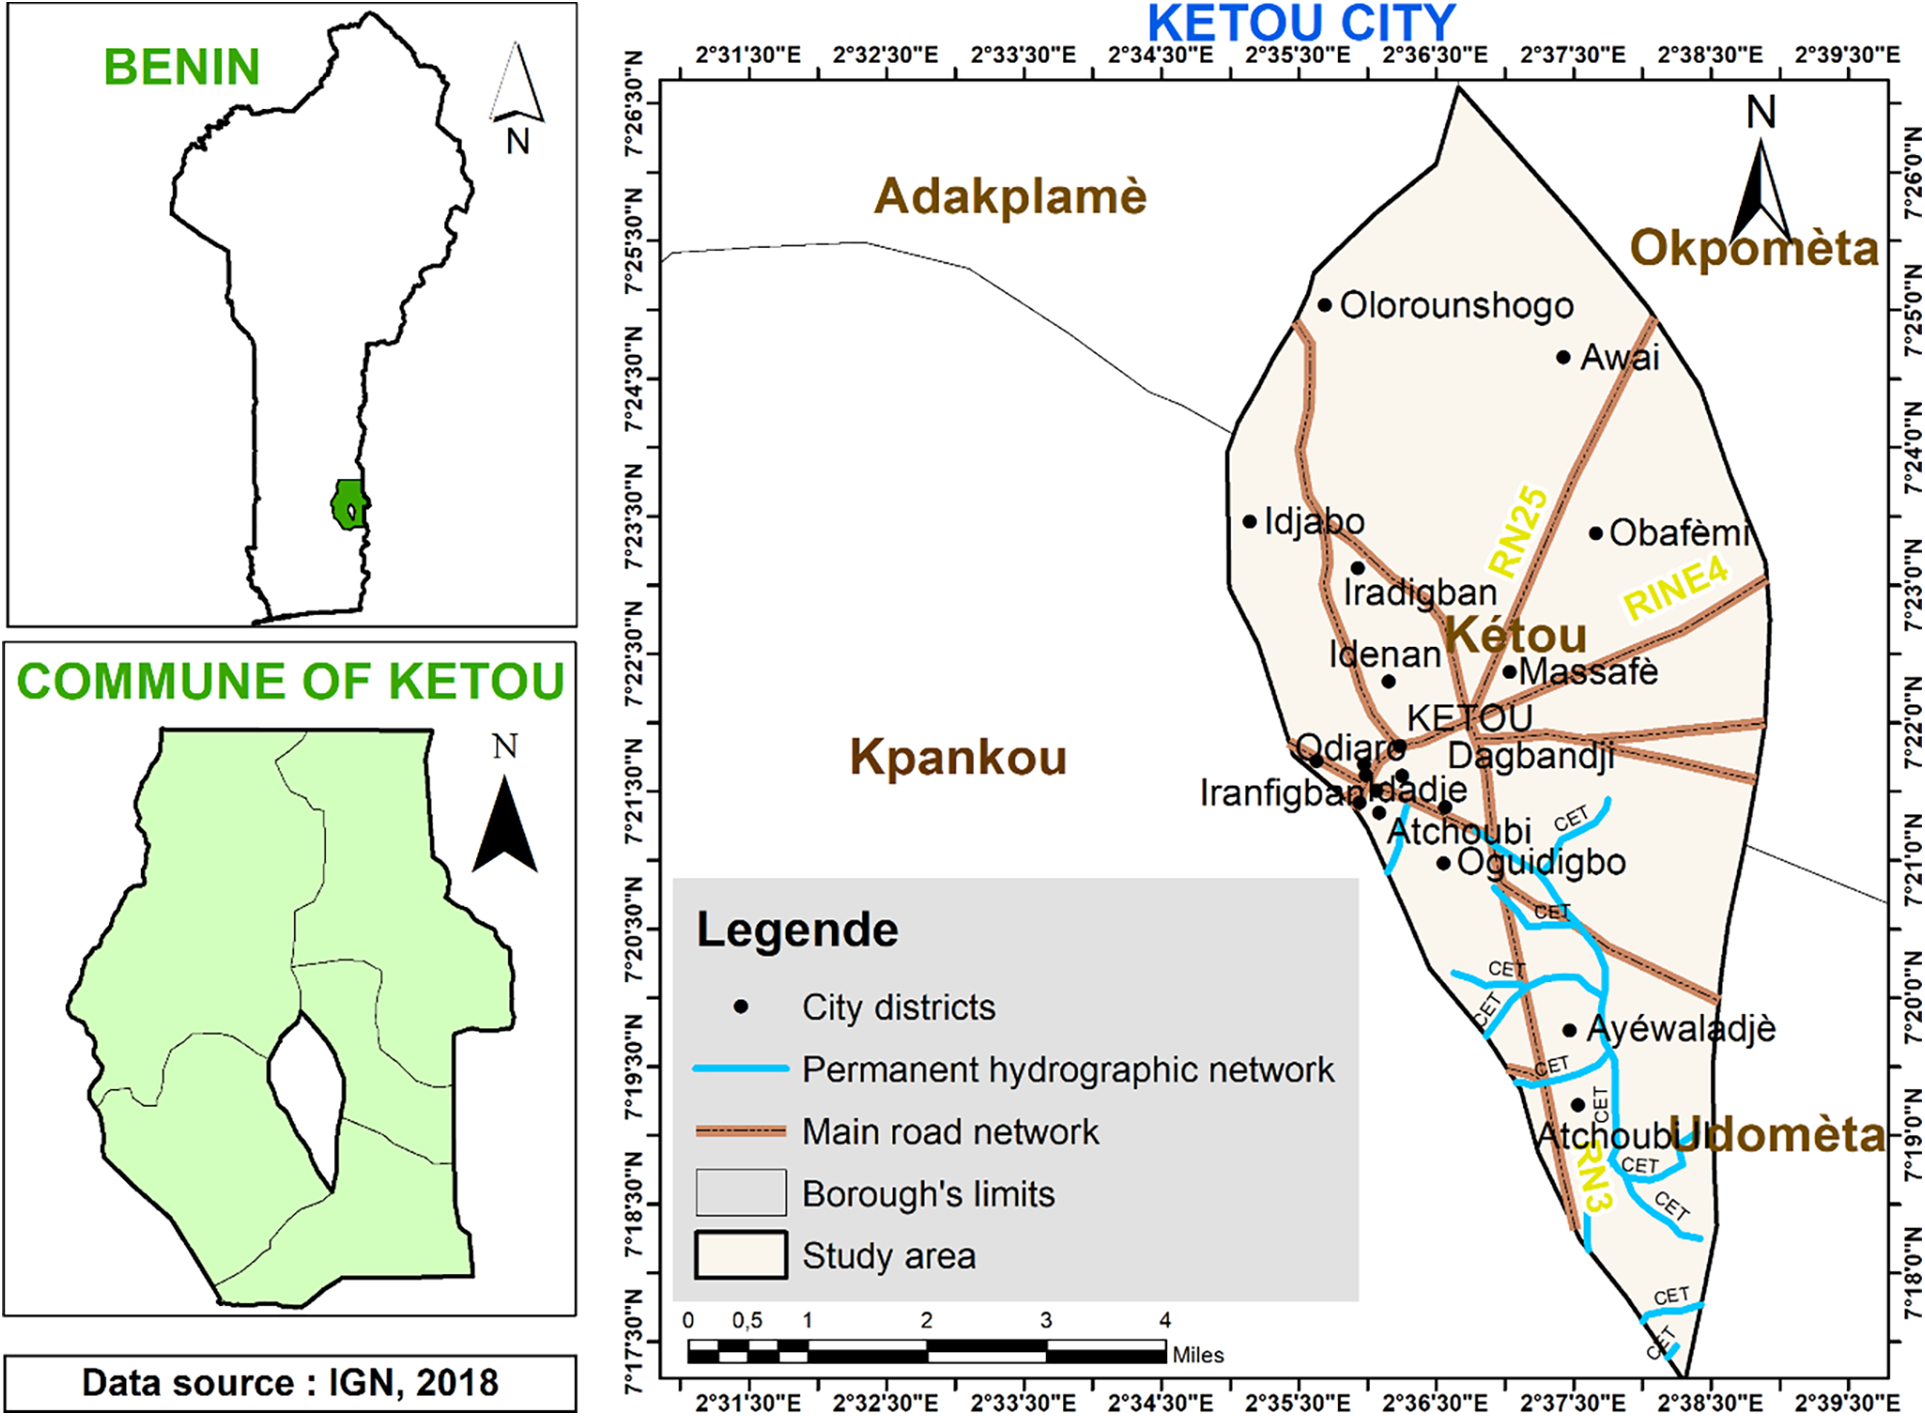
Figure 1: Map of study area location
2.2.1 Spatio-Temporal Dynamics Data Collection
For our study, Landsat TM, ETM, and OLI/TIRS satellite images were used, which are freely downloadable from the Google Earth Explorer platform (https://earthexplorer.usgs.gov/) (accessed on 2025 April 26) on the United States Geological Studies (USGS) site. The images were collected over two time intervals of 10 years: from 2003 to 2013 and from 2013 to 2023, to assess land use in the city of Kétou over time.
2.2.2 Data Collection on Factors Influencing Dynamics
⮚ Preliminary Surveys and Sampling
As part of the study, a preliminary survey was conducted using a semi-structured questionnaire among thirty (30) people randomly selected from the city of Kétou. In order to determine the proportion P of city dwellers with knowledge about urban landscape change. However, 27/30 have knowledge about vegetation either (P = 90%) and using the normal approximation of the binomial distribution of [34] as follows:
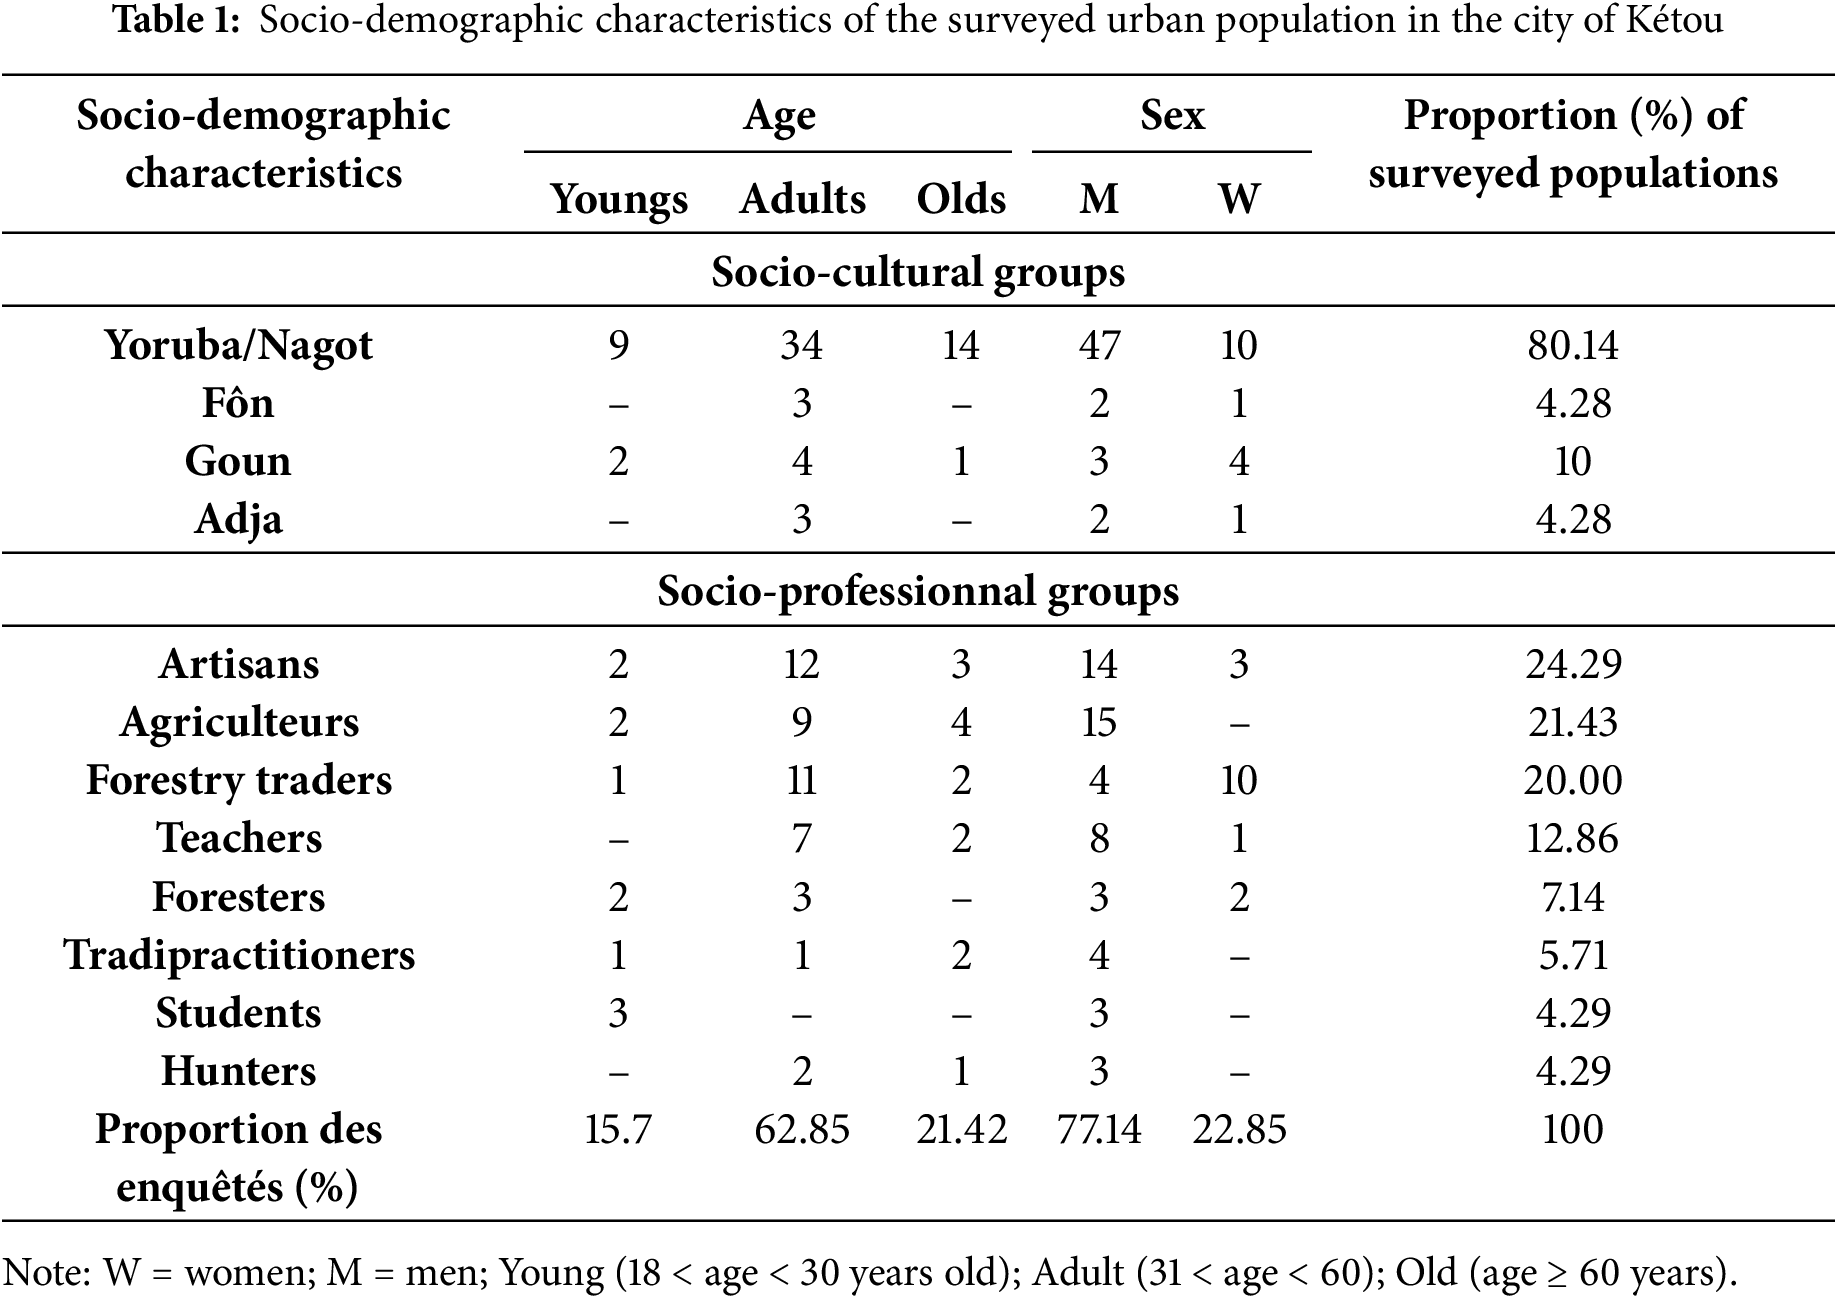
n: is the total number of surveyed individuals; U1-α/2 ≈ 1.96: is the value of the normal random variable for a given probability; for α = 0.05, U21-α/2 ≈ 4; p: is the proportion of people who are aware of the changes in the urban landscape; d: is the allowed margin of error, which is 8% in this study. A sample of fifty-seven (57) people was determined for the survey, including 13 local elected officials, for a total of 70 people, 80.14% of whom were predominantly Yoruba/Nagot (Table 1).
⮚ Socioeconomic Surveys
The survey was conducted individually using a semi-structured questionnaire among local elected officials, foresters, therapists, and all target individuals in the city of Kétou (Table 1). The survey was conducted to gain insight into socioeconomic activities, biodiversity, and the use of wood resources. The surveys sought to understand demographic characteristics, the population’s main activities, the contribution of these activities to household income, the state of the vegetation, and the causes of vegetation change. Direct observations were also made during our field surveys to better understand certain phenomena.
2.3 Data Processing and Analysis
2.3.1 Analysis of the Spatio-Temporal Dynamics of the Urban Wooded Landscape
To better understand the dynamics of urban flora, the study took into account the land use of the city. Thus, the methodology adopted was based on supervised classification, which allowed us to instruct the system by designating areas of the image as representative samples of the classes to be extracted.
Stacking
This is the operation that served to group together in a single multi-band block containing the information contained in each band of the satellite image. It was a question of putting together bands 1, 2, 3, 4, 5, 6, 7, 8, and 9 of the Landsat sensor in order to better facilitate the manipulation of the image during the operations of colored composition and the classification itself.
Extraction of the study area
This operation consists of loading the Landsat satellite image Stacking into the ENVI 5.3 software and exporting the image with the chip view to ArcMap tool. The shapefile of the study area is loaded onto the Landsat image and finally the extraction of the study area was done using the Extract by marsk tool.
Color composition
This is a technique that consists of qualitatively combining three spectral bands of an image. The display plan here is based on three colors composed of red, green, and blue. But the false color composition was carried out, and takes into account bands 4, 3, 2.
Contrast enhancement
The contrast enhancement allows for a clear image that will facilitate visual interpretation. The result of the contrast enhancement using the Optimized Linear 5% algorithm was used.
Visual interpretation
This is the identification and recognition of the details of the elements contained in the satellite image, with the naked eye, from an interpretation key indicating the correspondence between each object and a spectral color. The results of this visual interpretation will be used for the classification of the image. In addition, for increased precision, it was necessary to carry out a recognition of the land use units present in the study area.
Assisted classification
Assisted (supervised) classification was used taking into account knowledge of the terrain. It consisted of visually identifying beforehand a certain number of natural or artificial elements or objects that can be punctual, linear or surface on the image. The said classification under the ENVI 5.0 image processing software takes place in five essential phases which are:
- the definition of the legend or the information of the ROI (Regions Of Interest),
- the selection of the training plot samples (or Regions),
- the description and information of the different classes,
- the choice of the classification algorithm.
The definition of the legend or ROI, in ENVI 5.0 is done using the ROI tool function of the Region of interest tool. In addition, the Maximum Likelihood algorithm of the supervised classification tool was chosen for the classification. The principle of this algorithm is based on Bayes’ rule and makes it possible to calculate for each pixel its probability of belonging to one class rather than another. The pixel is assigned to the class whose probability of belonging is the highest. However, if this probability does not reach the expected threshold, the pixel is classified as unknown.
Post classification operations
The post classification step consists of: three filtering operations applied to the classified image, validation by the confusion matrix and vectorization. The filtering operations are: Sieve classes (to eliminate isolated pixels); Clump classes (to homogenize the classes) and Majority/minority/analysis (to smooth the classes after the clump classes operation). The classification evaluation is based on a two-dimensional table called the confusion matrix. Thus in ENVI 5.0, the procedure consists of: Classification/Post Classification Confusion Matrix Using Ground Truth ROIs. Vectorization is the passage from a raster image (where the information is contained in pixels) to a vector image (the information is contained in point/line/polygon type entities). It is done in Envi by the classification to vector procedure, followed by Export to shapefile.
Analysis of the structural dynamics of landscape units between 2003 and 2023
The changes observed in the vegetation cover of the city of Kétou between 2003 and 2023 were described by comparing the areas of each landscape unit over the periods of 2003, 2013 and 2023. The rates of change of the landscape units are obtained by the formula used by [5]:
With S1, the area of a landscape unit at time t1; S2, the area of the same landscape unit at time t2, and Tg the global rate of evolution.
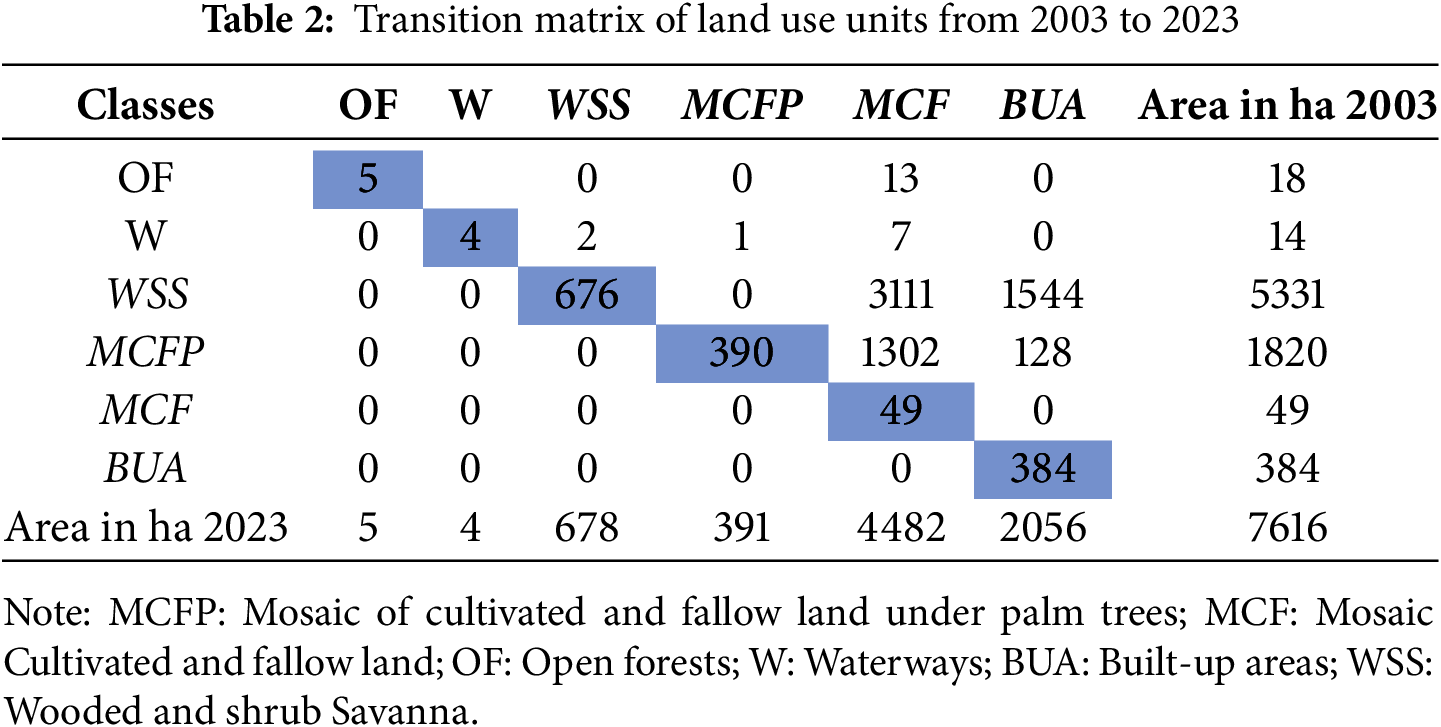
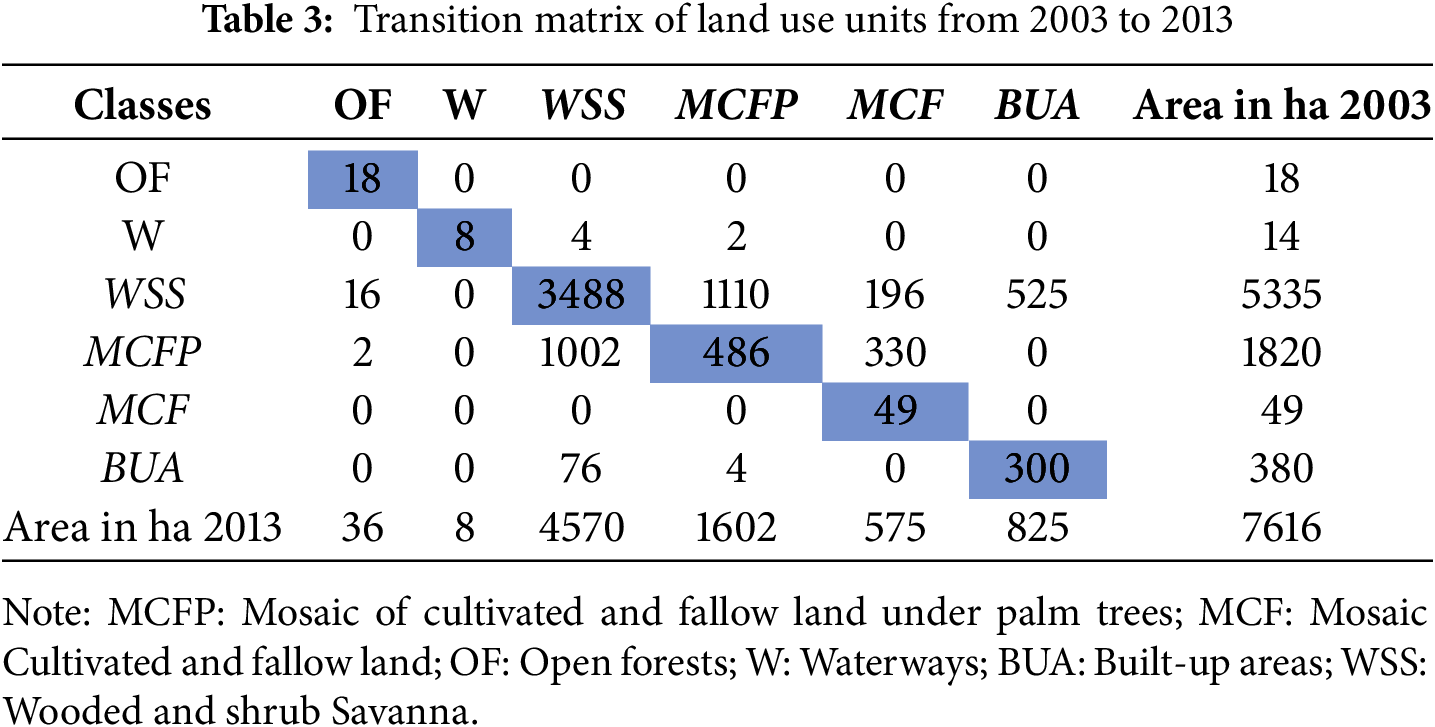
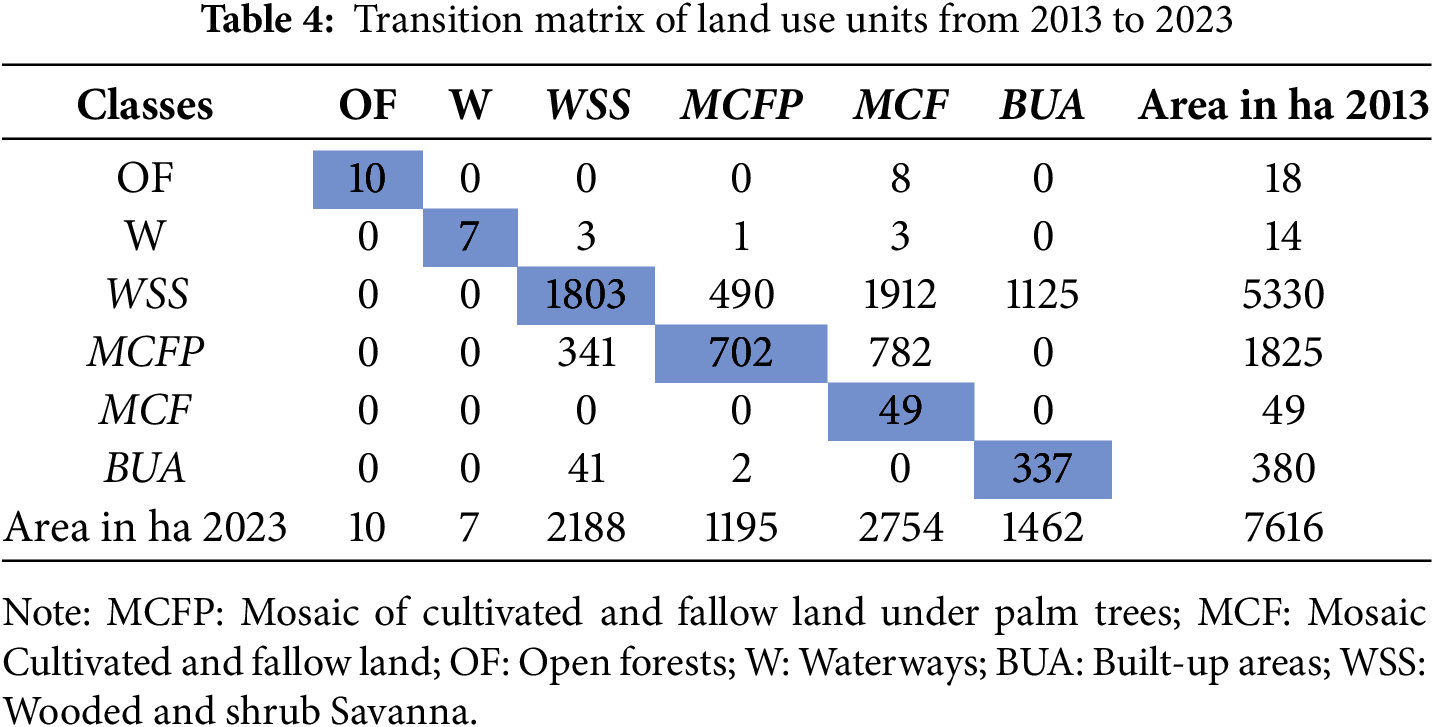
The changes observed in the landscape units were highlighted by the transition matrix, which shows the forms of conversion that the landscape units underwent between two dates. It consists of x rows and y columns. The number x of rows in the matrix indicates the number of landscape units present at time t1, while the number y of columns indicates the number of landscape units converted at time t2. The diagonal shows the areas of landscape units that remained unchanged over time. In this matrix, the transformations occur from rows to columns. The different matrices were obtained by crossing the maps from 2003 to 2013; from 2013 to 2023; and from 2003 to 2023.
2.3.2 Analysis of the Influencing Factors of the Spatio-Temporal Dynamics of Urban Tree Landscapes
The data extracted from KoboCollect were pre-processed before being imported into the R software in Csv format. Thus, the proportions of surveyed individuals and the main activities conducted in the city of Kétou were determined. Additionally, the frequencies of the various factors affecting the urban landscape either directly or indirectly were calculated using the formula:
FRC = relative frequency of citation, Np is the number of people who provided a response regarding a given factor; and Nt is the total number of people interviewed.
Then, the consensual value at the sociocultural and socioprofessional group level of the residents surveyed was calculated. This measures the degree of agreement among the respondents regarding the various answers provided [35,36]. It is expressed by:
Vc = consensual value; where Ni is the number of people who cited a given factor or species, and Nt is the total number of interviewees. Theoretically, it ranges between [−1 and 1]. If Ni = 0, then Vc = −1, and if Ni = N, then Vc = 1. The degree of consensus among respondents is low if Vc < 0.5, medium if Vc = 0.5, and high if Vc > 0.5 for different factors or species cited.
3.1 Spatio-Temporal Dynamics of Urban Tree Landscapes
The land use mapping of the landscape in the city of Kétou is presented in Fig. 2a–c for the years 2003, 2013, and 2023, respectively. The analysis of these figures shows that there are six (06) land use units in the city, namely: open forests, wooded and shrub savannas, mosaics of cultivated and fallow land under palm trees, mosaics of cultivated and fallow land, waterways, and built-up areas. Indeed, according to the observed changes in the figures, the built-up areas are concentrated in the city center, particularly in the neighborhoods of Atchoubi, Idjabo, Irradigban, Idéna, and Massafè. It is observed that the area of built-up areas and the area of mosaics of cultivated and fallow land have increased from 2003 to 2013 and from 2013 to 2023. In contrast, the areas of land use units such as open forests, wooded and shrub savannas, and mosaics of cultivated and fallow land under palm trees have progressively decreased. Similarly, the reduction in the area of waterways is observed, likely obstructed by agricultural encroachment and overgrazing. The statistics from the observations of the land use units are presented in Fig. 3.
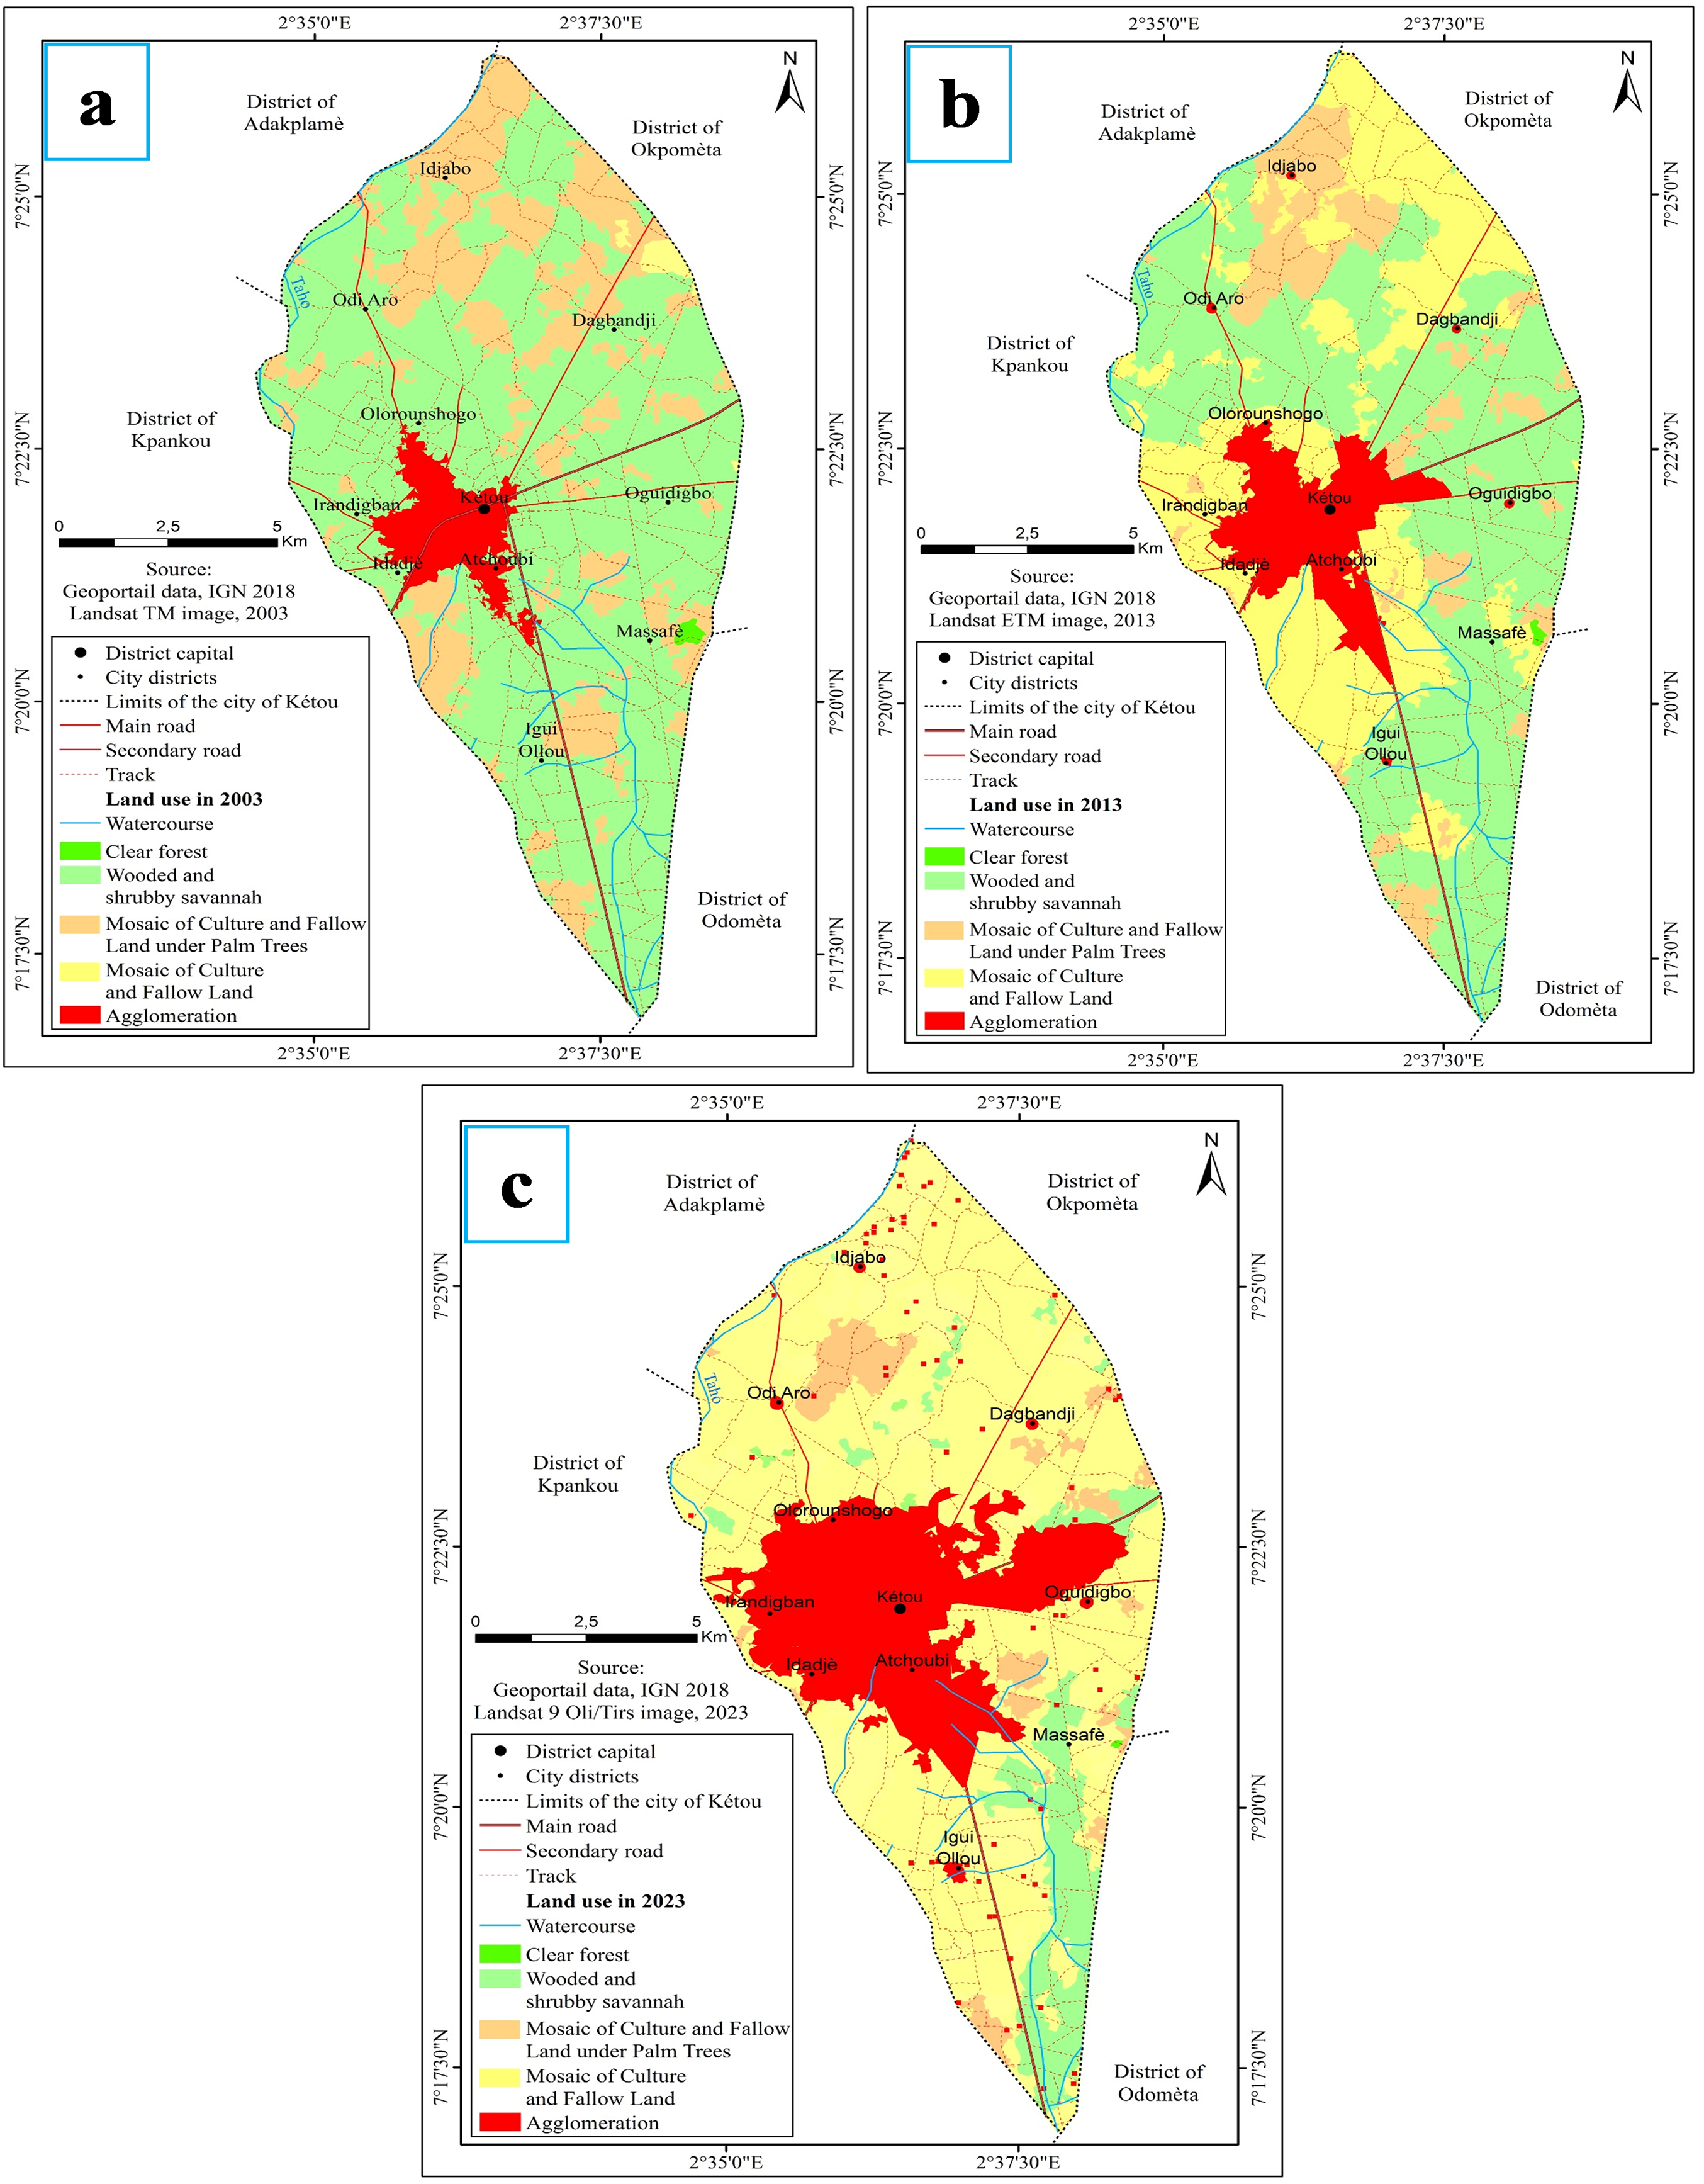
Figure 2: Land use in the city of Kétou in 2003 (a), 2013 (b), and 2023 (c)
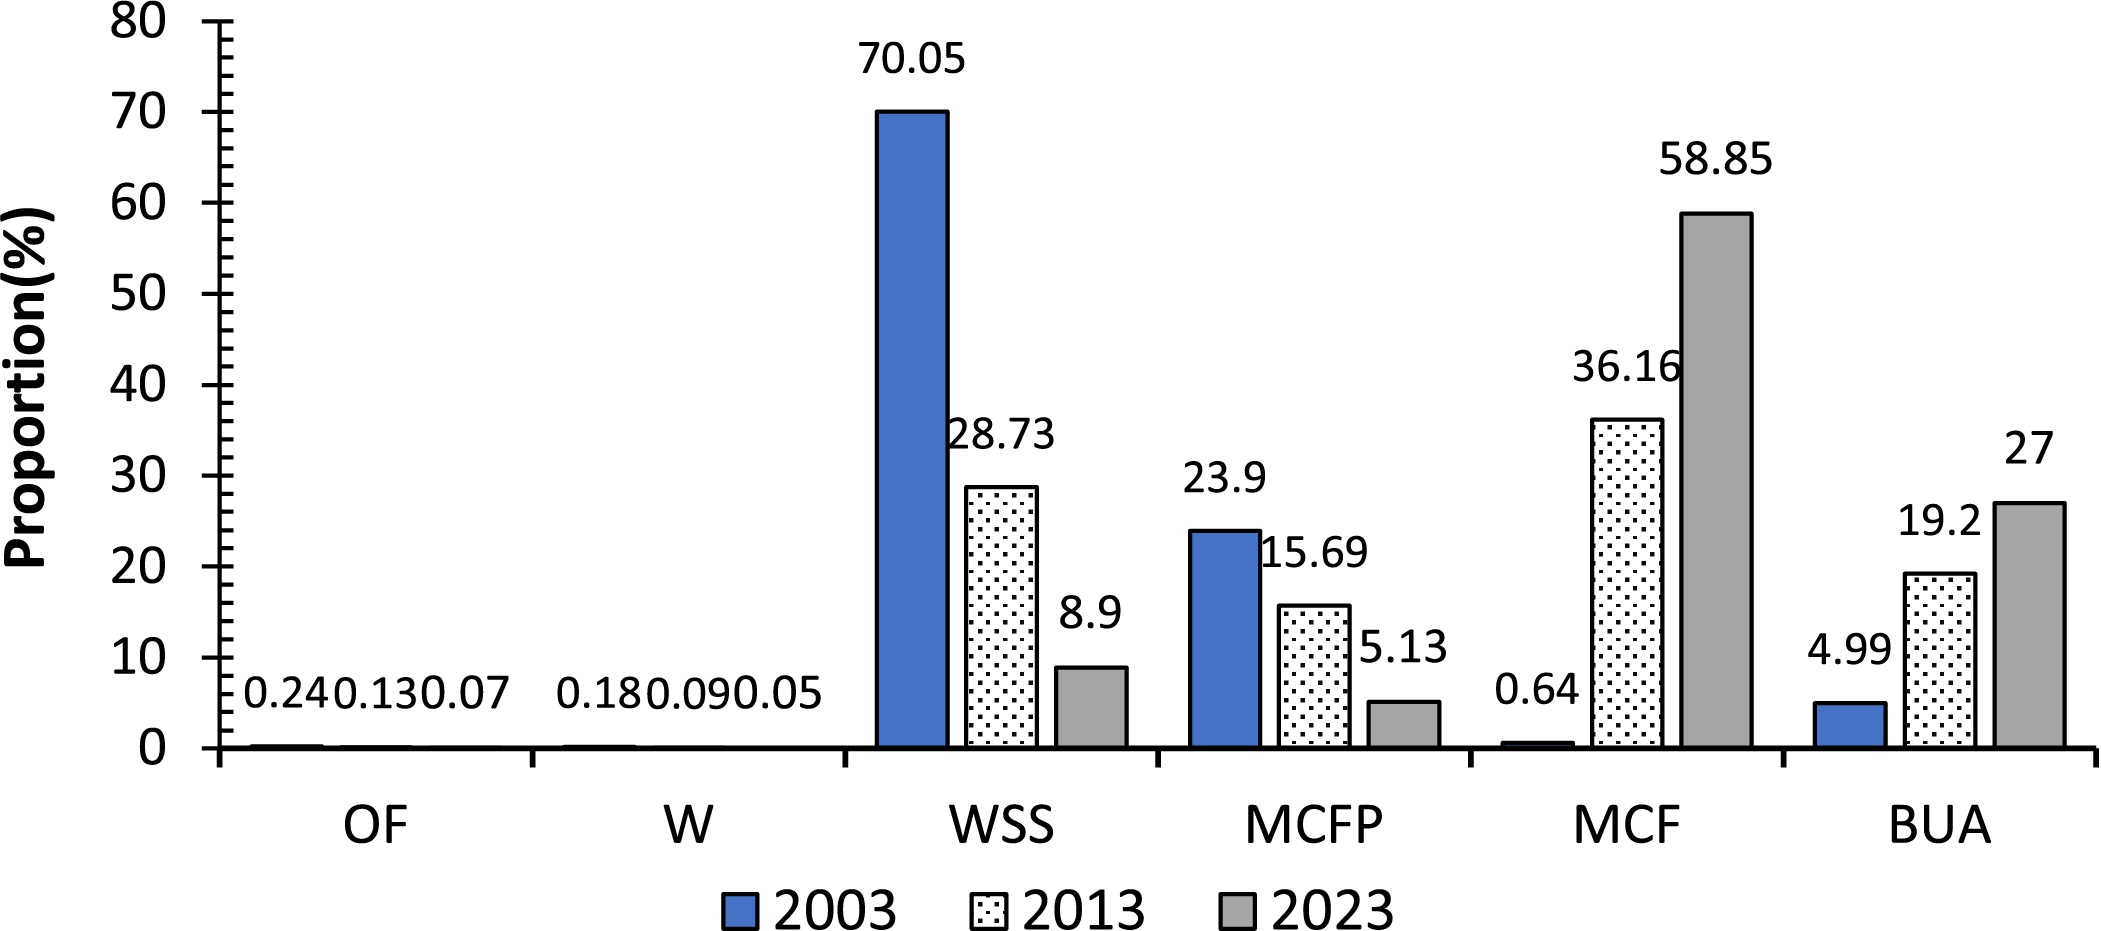
Figure 3: Land use units in the Kétou District from 2003 to 2013 and from 2013 to 2023. MCFP: Mosaic of cultivated and fallow land under palm trees; Mosaic MCF: Cultivated and fallow land; OF: Open forests; W: Waterways; BUA: Built-up areas; WSS: Wooded and Shrub Savanna
The analysis of Fig. 3 shows that from 2003 to 2013 and from 2013 to 2023, the land use units in the Kétou district have undergone significant changes. A large vegetation cover has almost disappeared over time. Open forests have significantly decreased, from 0.24% in 2003 to 0.13% in 2013, and then from 0.13% to 0.07% in 2023 (−0.17%). Similarly, the wooded and shrub savannas have greatly regressed, from 70.05% in 2003 to 28.73% in 2013, and then from 28.73% to 8.99% in 2023 (−61.06%), and the mosaics of cultivated and fallow land under palm trees decreased from 23.9% in 2003 to 15.69% in 2013, and then from 15.69% to 5.13% in 2023 (−18.77%). There is also a reduction in the area of waterways, from 0.18% in 2003 to 0.09% in 2013, and then from 0.09% to 0.05% in 2023 (−0.13%). In contrast, the mosaics of cultivated and fallow land increased significantly, from 0.64% in 2003 to 36.16% in 2013, and then from 36.16% to 58.85% in 2023 (+58.21%). The built-up areas also expanded, from 4.99% in 2003 to 19.2% in 2013, and then from 19.2% to 27% in 2023 (+22.01%). The tables present the transition matrices for land use units from 2003 to 2013, from 2013 to 2023, and from 2003 to 2023.
The analysis of Tables 2–4 shows that the mapped area consists of six (06) land use classes: open forests, wooded and shrub savanna, mosaic of cultivated and fallow land under palm trees, mosaic of cultivated and fallow land, waterways, and built-up areas. The diagonal cells correspond to units that remained stable from 2003 to 2013 and from 2013 to 2023. It is observed that over the 20 years (2003–2023), the land use units such as open forests, wooded and shrub savanna, waterways, and mosaic of cultivated and fallow land under palm trees have experienced a decline, with open forests decreasing from 18 ha in 2003 to 10 ha in 2013 and to 5 ha in 2023, a decrease of (−13 ha); waterways decreasing from 14 ha in 2003 to 7 ha in 2013 and to 4 ha in 2023, a decrease of (−10 ha); wooded and shrub savannas decreasing from 5331 ha in 2003 to 2188 ha in 2013 and to 678 ha in 2023, a decrease of (−4653 ha); and mosaic of cultivated and fallow land under palm trees decreasing from 1820 ha in 2003 to 1195 ha in 2013 and to 391 ha in 2023, a decrease of (−1429 ha). In contrast, the mosaic of cultivated and fallow land and the built-up areas experienced a significant increase in their areas, with the mosaic of cultivated and fallow land increasing from 49 ha in 2003 to 2754 ha in 2013 and to 4482 ha in 2023, an increase of (+4433 ha), and built-up areas increasing from 384 ha in 2003 to 1462 ha in 2013 and to 2056 ha in 2023, an increase of (+1672 ha). This indicates that the study area has become heavily urbanized over time.
3.2 Factors Influencing Spatio-Temporal Dynamics
According to the residents, urban vegetation has completely regressed (57% of respondents), and almost no trees are left (33% of respondents) in the city of Kétou (Fig. 4). This phenomenon is attributed to several factors that directly and indirectly influence the vegetation.
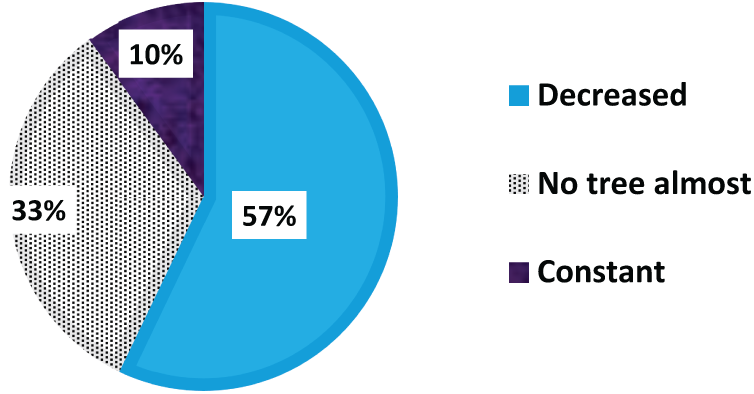
Figure 4: Proportion (%) of the urban residents’ opinions on the state of vegetation in the city
3.2.1 Direct Factors Influencing Vegetation
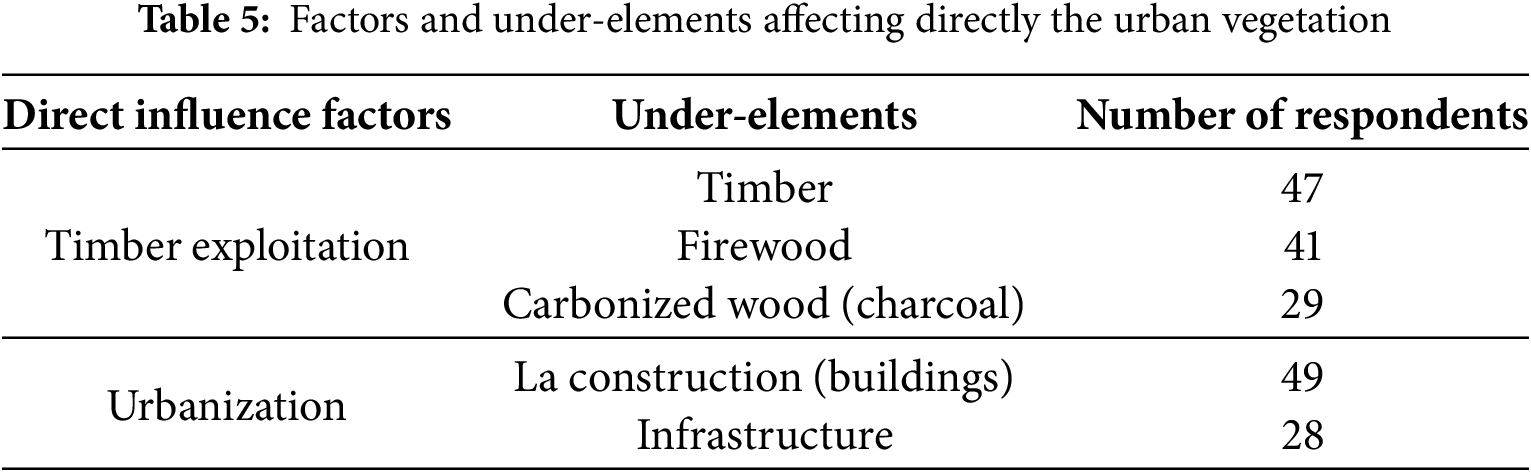
The factors directly affecting vegetation are mainly two (02): wood exploitation in its various forms (80%) and urbanization (75.7%) (Fig. 5). Wood exploitation in the city of Kétou occurs in three (03) forms, ranked by importance: timber (67.14%), firewood (58.57%), and charcoal (41.43%) (Table 5). On the other hand, urbanization occurs in two (02) forms: the construction of buildings (70%) and the installation of infrastructure (40%) in the city (Table 5).
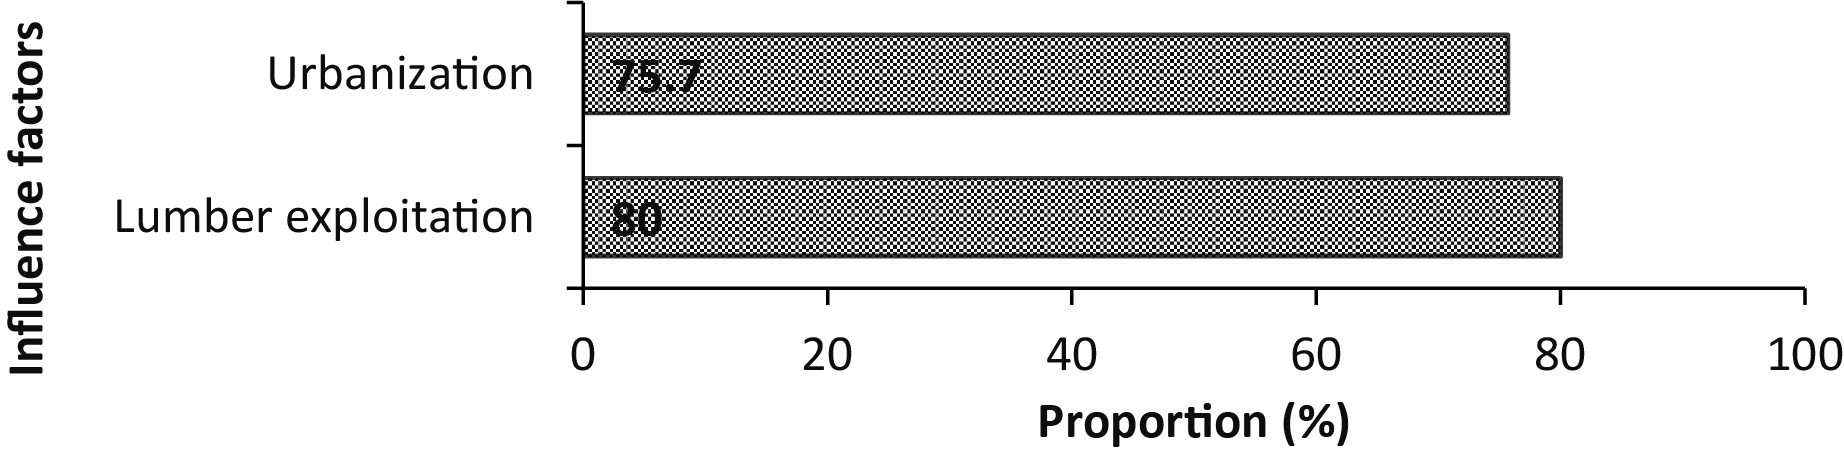
Figure 5: Proportion (%) of the factors threatening vegetation in the city
However, according to the cultural groups surveyed, the Yoruba/Nagot, the dominant indigenous people of the city, agree on the construction of buildings (Vc = 0.4), timber (Vc = 0.36), and firewood (Vc = 0.36). Similarly, the Goun and Adja groups strongly agree on the construction of buildings (Vc = 1) and timber (Vc = 1) (Table 6).
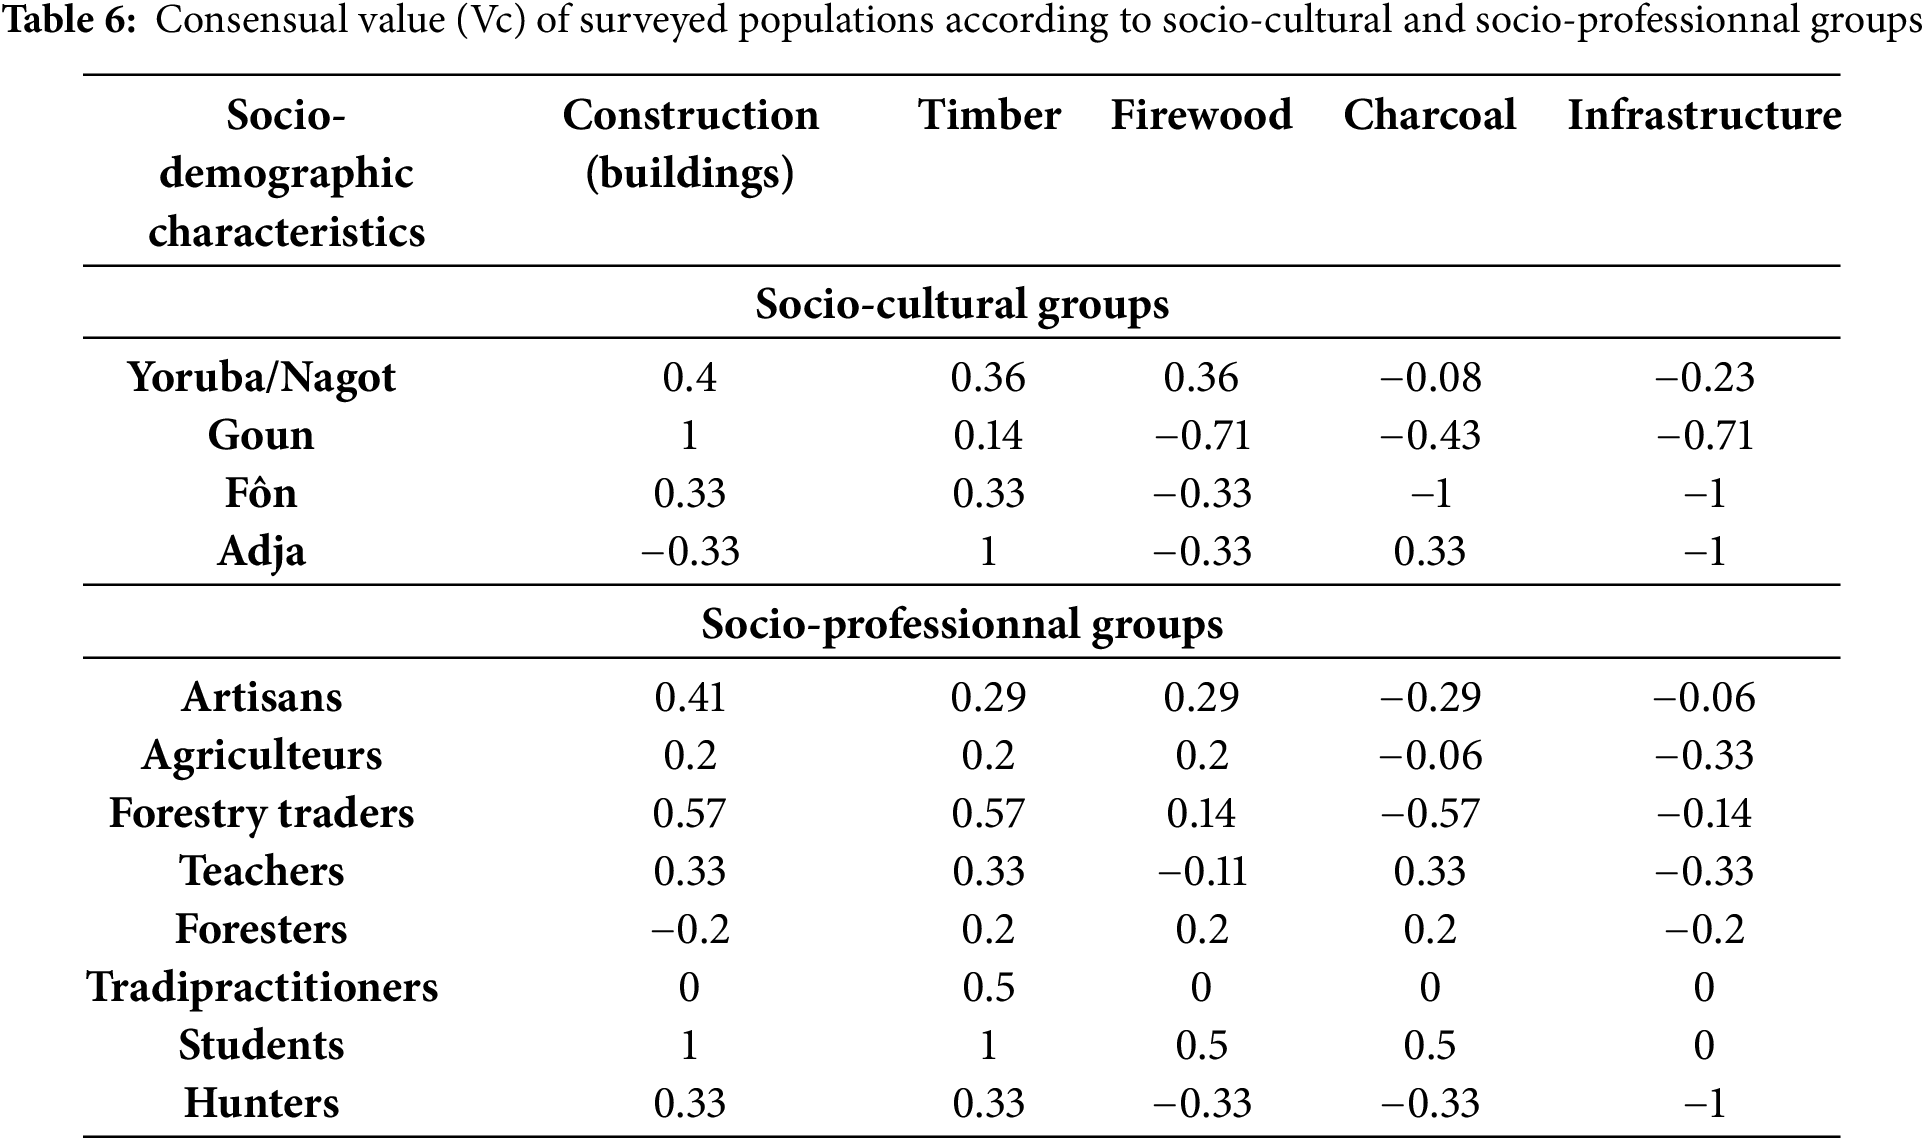
Furthermore, according to the socio-professional groups in the city, artisans and farmers also agree on the construction of buildings (Vc = 0.41; 0.2), timber (Vc = 0.29; 0.2), and firewood (Vc = 0.29; 0.2). Similarly, merchants of NTFPs and students strongly agree on the construction of buildings (Vc = 0.57; 1), timber(Vc = 0.57; 1), and firewood (Vc = 0.14; 0.5). Regarding charcoal (carbonized timber), only the Adja group (Vc = 0.33) agrees, as well as the socio-cultural groups and students (Vc = 0.5), teachers (Vc = 0.33), and foresters (Vc = 0.2) among the professional groups. However, no group agrees on the issue of infrastructure (Table 6).
3.2.2 Indirect Factors Influencing Vegetation
The factors that indirectly influence vegetation are four (04) in number and are anthropogenic activities carried out by the urban population (Fig. 6). According to the population, these include primarily agriculture (44%), which leads to the destruction of vegetation for crop installation, followed by the collection of non-timber forest products (NTFPs) (12.85%) for various uses by the population, the commercialization of NTFPs and wood (timber and firewood) (12.85%), which continuously drives actors to harvest NTFPs and cut down trees for firewood and/or timber to meet the growing demand (Fig. 6). Similarly, crafts (11.42%), which use wood for various services, are also an indirect factor threatening urban vegetation. According to urban residents, these activities contribute on average 25% to 50% of household expenses, with an average monthly income of 85,000 CFA/month.
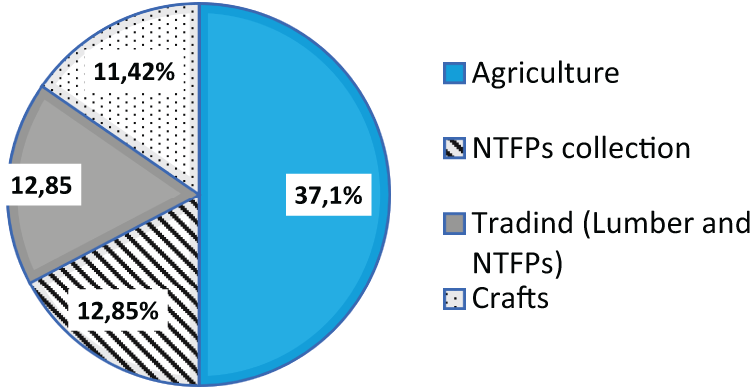
Figure 6: Proportion (%) of activities threatening vegetation in Kétou city
4.1 Spatio-Temporal Dynamics of Urban Tree Landscapes
The result of the supervised classification of satellite images from 2000 to 2023, shows six (06) land use units namely open forests, wooded and shrub savannah, mosaic of cultivation and fallow land under palm trees, mosaic of cultivation and fallow land, watercourse and agglomerations. This number of land use units is lower than the number (07 land use units) obtained by [37] in the city of Kinshasa in Congo and remains higher than the number (04 land use units) obtained by [38] in the city of Douala in Cameroon. However, these land use units in the city of Kétou such as: open forests from 0.24% to 0.07% (−017%), wooded and shrub savannah from 70.05% to 8.99% (−61.06%), mosaic of crops and fallow land under palm trees from 23.9% to 5.13% (−18.77%), watercourses from 0.18% to 0.05% (−0.13%) have experienced a sharp decline while mosaics of crops and fallow land from 0.64% to 58.85% (+58.21%) and agglomerations from 4.99% to 27% (+22.01%) have experienced a sharp increase. In this case, the city is subject to demographic pressure leading to the destruction of spontaneous vegetation in favor of habitats. But also the extension of arable land to meet the needs of residents. This leads to the destruction of urban vegetation. These results are similar to the results obtained by [39] in the cities of Niamey and Maradi in Niger, who found that over time urban vegetation is destroyed in favor of buildings. Similarly, these results corroborate those of [2] in the city of Yagoua in Cameroon, who found degraded vegetation giving way to bare land. This observation was also noted by [3] in Mali in the cotton-growing region, where significant changes have occurred in natural vegetation, transforming it into fields/fallow land and plantations. It is essential to implement integrated management measures and agricultural practices that conserve local biodiversity. Over 23 years (2000–2023), land use units such as open forests, wooded and shrub savannas, and mosaics of cultivated and fallow land under palm trees have decreased from 18 to 5 ha (−13 ha) for open forests, from 5331 to 678 ha (−4653 ha) for wooded and shrub savannas, from 1820 to 391 ha (−1429 ha) for mosaics of cultivated and fallow land under palm trees, and from 14 to 4 ha in 2023 (−10 ha) for waterways. Conversely, mosaics of cultivated and fallow land and built-up areas have seen a significant increase in their areas, from 49 to 4482 ha (+4433 ha) and from 384 to 2056 ha (+1672 ha), respectively. This implies that the study area has become heavily urbanized leading to a constant reduction in vegetation. For instance, the intensification of agriculture mainly cassava monoculture to the detriment of fallow land and palm trees, asphalt roads which have modified the habitats of natural vegetation, a massive influx of population which has led to the artificialization of soils for habitats. These changes have not only been due to human activities but also to urbanization and the effects of climate change, thus creating serious ecological problems, including air and soil pollution [40]. These results corroborate those of [3], who found that these changes are partly due to climate change and partly due to human practices, such as bushfires and the use of wood for energy. It is crucial for a local policy on the landscaping of urban vegetation in the city of Kétou to be established to safeguard local biodiversity. The same is true for [21], who found a continuous regression of urban vegetation cover. These changes must be controlled through reasonable urbanization policies and landscaping proportional to the pace of urbanization, with a reasonable urbanization policy and development proportional to the urbanization rate [39]. For example, the city’s parks, gardens, sidewalks, streets, public squares, roundabouts must be developed for some and redeveloped for others, with local emblematic or cultural species that are adapted, attractive and have a high potential for carbon sequestration. In addition, Kétou city ground is almost flat with a low slope, which are criteria for good conditions for the installation of green spaces as reported by [26]. Furthermore, recommendations should favor agricultural methods adapted to the environment in the city of Kétou, contributing to the mitigation of climate change effects, as highlighted by [2]. For this, it is necessary to prohibit the cutting of wood, limit as much as possible the use of highly toxic phytosanitary products, and encourage the association of crops (agroecology).
4.2 Factors Influencing Spatio-Temporal Dynamics
The urban vegetation of Kétou has experienced a remarkable decline, according to the residents. This phenomenon was also observed by [7] in Niamey, Niger, and by [8] in Kinshasa, Congo. This regression of tree cover is a concern for the residents and is primarily due to two (02) direct factors and four (04) indirect factors. These include wood exploitation in the city in the form of timber, firewood, and charcoal (charred wood). On the other hand, urbanization manifests itself through the construction of buildings and the installation of infrastructure in the city. These two factors directly threaten urban tree vegetation. These results align with those of [8], who found that green spaces in Kinshasa are destroyed to meet the demand for energy wood and make way for construction. Likewise, [7] found that tree species in Niamey are cut down for commercial purposes (timber) and for firewood. Indeed, in this study, it is the rapid population growth that increasingly drives residents in Kétou to demand more housing, furniture (timber), energy (charcoal, firewood), and infrastructure, leading to the destruction of trees to achieve these needs. According to the FAO, 10 m2 of space is needed per inhabitant [41]. A policy must be established ruling and enforcing this FAO recommendation, on the construction of social housing in urban areas with a proportional proportion of surface area allocated to green space. Political decision-makers must prohibit the cutting of trees without authorization and make plantations for exploitation purposes. Moreover, the indirect factors affecting vegetation are anthropogenic activities such as agriculture, which leads to the destruction of vegetation for crop installation. The collection of non-timber forest products (NTFPs) for various uses by the population, the commercialization of NTFPs and wood (timber and firewood), which continuously drives actors to harvest NTFPs and cut down trees for firewood and/or timber to meet growing demand. Similarly, crafts require timber for sculpture, carpentry, masonry, etc. This is confirmed by [42], who found that certain species are being destroyed due to anthropogenic activities. These factors and activities not only cause a regression in vegetation but also the loss of phytodiversity, as noted by [27]. Similarly, climate upheavals at the local and international levels with seasonal shifts and, consequently, pockets of aridity and low crop yields over time. Despite the residents’ awareness of the environmental dangers caused by the destruction of these trees, they persist in their actions, as reported by [8]. This is because these activities generate an average income of 85,000 CFA/month and contribute 25%–50% to household expenses. Though, the scarcity of public green spaces shows a lack of prioritization by policymakers [26]. This calls for the implementation of new sustainable management strategies for urban vegetation in Kétou, as recommended by [27] in Cotonou. These strategies must consist of the proposal of landscaping plans and their implementation of the city with local species highlighting the cultural and religious identity of the environment. Participatory management includes political decision-makers, populations, and planners. This will help preserve not only biodiversity but also the African plant heritage.
This study on the city of Kétou has shown that the land is occupied by open forests, wooded and shrub savannas, cultivated and fallow land under palm trees, cultivated and fallow land, and built-up areas. The urban vegetation landscape has experienced a dynamic and expansion of certain land uses from 2020 to 2023. The agglomerations and cultivation/fallow land took place to the detriment of wooded savannahs, increasing respectively from 4.99% to 27% (+22.01%) and from 0.64% to 58.85% (+58.21%). This shows that the study area has been highly urbanized. However, this dynamic is influenced by two (02) direct factors and four (04) indirect factors. Indeed, it is the galloping population growth, which increasingly leads residents to a greater need for housing, furniture (timber), energy (coal, firewood), infrastructure etc., and by extension to the destruction of trees to achieve this.
Despite the residents noticing the regression of vegetation and understanding the environmental impact of vegetation destruction, they continue their activities. This is a lack of prioritization on the part of political decision-makers calling for the implementation of new strategies for the sustainable management of urban vegetation in the city. Such as the establishment of a law establishing and enforcing the FAO recommendation that 10 m2 of green space/inhabitant on the construction of social housing in urban areas with a proportional proportion of area allocated to green space. Proposals for landscaping plans and their implementation of the city with local species highlighting the cultural and religious identity of the environment. Participatory management involving policy makers, local communities, and planners, and a ban on tree cutting, limiting the use of highly toxic plant protection products as much as possible, and encouraging crop associations (agroecology).
These results contribute to the science of sustainable management of urban forests for the well-being of city residents and a contribution to the mitigation of climatic effects.
Acknowledgement: The authors would like to thank the City Hall and the population of Kétou, particularly the municipal agents, directors of various private and public agencies, and the data collection assistants, who facilitated the contact and data collection process.
Funding Statement: None.
Author Contributions: Conceptualization, data collection, data analysis, article writing and its correction, Gildas N’tibouti Idakou, Abdel Aziz Osseni, Etienne Romaric Adéwalé Godonou and Gbodja Houéhanou François Gbesso; Supervision, editing and validation before submission, Abdel Aziz Osseni and Gbodja Houéhanou François Gbesso. All authors reviewed the results and approved the final version of the manuscript.
Availability of Data and Materials: Data supporting the writing of this article are shown throughout tables and figures and are also available from the authors.
Ethics Approval: Not applicable.
Conflicts of Interest: The authors declare no conflicts of interest to report regarding the present study.
References
1. Gomgnimbou PKA, Wendsom OO, Abdramane S, Madjelia K, Daniel I, Hassan BN. Potentiel de séquestration du carbone par les espaces verts aménagés urbains de la ville de Bobo-Dioulasso au Burkina Faso. J Appl Biosci. 2019;144:14739–46. doi:10.35759/JABs.144.2. [Google Scholar] [CrossRef]
2. Tiki D, Bitom-Mamdem L, Danala S, Amina A, Ibrahim AB, Alim YY, et al. Etude et cartographie de la dynamique de l’occupation et de la dégradation des sols de Yagoua (Mayo-Danay, Extrême-Nord Cameroun). AJ-Al Awamia. 2024;(144):29–44. doi:10.34874/IMIST.PRSM/afrimed-i144.43947. [Google Scholar] [CrossRef]
3. Sidibé MM, Aoudji AKN, Moumouni YI, Sacko I, Saliou I, Koné B. Dynamiques spatio-temporelles de l’occupation des terres dans les zones de production cotonnière et céréalière au mali. Revue Internationale de Geomatique. 2024;33(1):51–76. doi:10.32604/rig.2024.045505. [Google Scholar] [CrossRef]
4. Thonfeld F, Steinbach S, Muro J, Hentre K, Games I, Näschen K, et al. The impact of anthropogenic land use change on the protected areas of the Kilombero catchment Tanzania. ISPRS J Photogramm Remote Sens. 2020;168(2):4155. doi:10.1016/j.isprsjprs.2020.07.019. [Google Scholar] [CrossRef]
5. Osseni AA, Gbesso GHF, Idakou NG, Fandohan AB, Toko T, Tente ABH, et al. Reconstitution spatiale et simulation des changements futurs de l’occupation du sol dans la Réserve de Biosphère de la basse vallée de l’Ouémé (RB-BVO) au Bénin. Physio-Géo [En ligne]. 2023;19:29. [cited 2025 Mar 10]. Available from: http://journals.openedition.org/physio-geo/15014. [Google Scholar]
6. Kouagou MML, Yeo K, Koné M, Ouattara K, Kouagou KA, Delsinne T, et al. Espaces verts comme une alternative de conservation de la biodiversité en villes: le cas des fourmis (Hyménoptère: formicidae) dans Abidjan Côte d’Ivoire. J Appl Biosci. 2018;131(1):13358–81. doi:10.4314/jab.v131i1.10. [Google Scholar] [CrossRef]
7. Banon F, Danvidé B, Baye AY. Problématique de la gestion des espaces verts en milieu urbain: projet de conservation et de valorisation de la ceinture verte de Niamey au Niger. Rev Écosystèmes Et Paysages. 2022;1(1):85–93. doi:10.59384/recopays.tg1107. [Google Scholar] [CrossRef]
8. Luzolo JTT, Ngembo EN, Masivi CL, Landu EL, Kibwila MN, Sinsi RL. Pression exercée par les entreprises pâtissières artisanales et nganda ntaba sur la végétation arborée urbaine et périurbaine à Kinshasa en République Démocratique du Congo. Int J Innov Sci Res. 2022;62(1):25–39. [Google Scholar]
9. Alberti M. Maintaining ecological integrity and sustaining ecosystem function in urban areas. Curr Opin Environ Sustain. 2010;2(3):178–84. doi:10.1016/j.cosust.2010.07.002. [Google Scholar] [CrossRef]
10. Gbesso GHF. Floristic diversity and use of street trees species in the city of lokossa in south-western benin (West AfricaAnnales de l’Université de Parakou Série. Lettres Arts et Sci Hum. 2021;4(2):13–21. [Google Scholar]
11. Sehoun CL, Osseni AA, Orounladji M, Lougbegnon OT, Codjia TCJ. Diversité floristique des formations végétales urbaines au Bénin. Rev Mar Sci Agron Vét. 2021;9(2):266–73. [Google Scholar]
12. Grunewald K, Richter B, Meinel G, Herold H, Syrbe R. Proposal of indicators regarding the provision and accessibility of green spaces for assessing the ecosystem service recreation in the city in Germany. Int J Biodivers Sci. 2017;13(2):26–39. [Google Scholar]
13. Kouadio YJC, Vroh BTA, Gone Bi ZB, Adou Yao CY, N’Guessan KE. Evaluation de la diversité et estimation de la biomasse des arbres d’alignement des communes du Plateau et de Cocody (Abidjan-Côte d’Ivoire). J Appl Biosci. 2016;2016(97):9141–51. doi:10.4314/jab.v97i1.1. [Google Scholar] [CrossRef]
14. WWF. Des solutions fondées sur la nature en milieu urbain. Les villes montrent la voie 2021. Washington, DC, USA: WWF; 2022. [Google Scholar]
15. Valjarević A, Morar C, Brasanac-Bosanac L, Cirkovic-Mitrovic T, Djekic T, Mihajlović M, et al. Sustainable land use in Moldova: GIS and remote sensing of forests ands crops. Land Use Policy. 2025;152(11):107515. doi:10.1016/j.landusepol.2025.107515. [Google Scholar] [CrossRef]
16. Kono LD, Essono MD, Ambombo ME, Bindzi MA, Biye EH. Influence des facteurs biotopiques sur les stocks de carbone des marécages à herbacées de la ville de Yaoundé (Cameroun) et ses environs. Afrique Sci. 2020;16(6):1–13. [Google Scholar]
17. Marinsek A, Bindewald A, Kraxner F, La Porta N, Meisel P, Stojnic S, et al. Gestion des espèces d’arbres non indigènes dans les zones urbaines de l’espace alpin. Vienna, Austria: BFW; 2022. [Google Scholar]
18. Me-Mba MB, Pennober G, Revillion C, Rouet P, David G. Estimations, à partir de séries d’images LANDSAT, des évolutions de stocks de carbone de différentes formations en milieu équatorial côtier-cas de Libreville au Gabon. Afrique Sci. 2019;15(2):70–9. [Google Scholar]
19. Sandrine M. Impacts psycho-sociaux des espaces verts dans les espaces urbains. Développement Durable Et Territoires [En Ligne]. 2014;3(3). doi:10.4000/developpementdurable.9389. [Google Scholar] [CrossRef]
20. Dovonou TF, Mama VJ, Chabiadimi OS. Analyse géo-spatiale de la dynamique de l’occupation du sol de la commune d’Abomey-Calavi, Bénin. Afrique Sci. 2017;13(6):97–113. [Google Scholar]
21. Asempah M, Sahwan W, Schütt B. Assessment of land cover dynamics and drivers of urban expansion using geospatial and logistic regression approach in wa municipality. Ghana Land. 2021;10(11):1251. doi:10.3390/land10111251. [Google Scholar] [CrossRef]
22. Ballo A, Traore SS, Coulibaly B, Diakité CH, Diawara M, Traore A, et al. Pressions anthropiques et dynamique d’occupation des terres dans le terroir de ziguéna, zone cotonnière du Mali. Eur Sci J. 2016;12(5):90–9. doi:10.19044/esj.2016.v12n5p90. [Google Scholar] [CrossRef]
23. Dembele S, Soumaré M, Diakite CH, Gaillard D. Dynamiques des paysages régionaux en zone cotonnière du Mali. Tropicultura. 2018;36(2):232–42. [Google Scholar]
24. SDAC Kétou. Schema directeur d’amenagement de la commune de ketou (sdac) 2024–2038. Consort Energie Consult Silicon Sarl. 2024. 240 p. [Google Scholar]
25. Kabanyegeye H, Ndayishimiye J, Hakizimana P, Masharabu T, Malaisse F, Bogaert J. Diversité floristique et statut de conservation des espaces verts de la ville de Bujumbura (Burundi). Geo Eco Trop. 2022;46(1):15–28. [Google Scholar]
26. Osséni AA, Gbesso GHF, Yevide SIA, Godonou ERA. Suitability evaluation for Urban Green Space Areas in Sèmè-Podji District (Southern Beninusing GIS and AHP methods. Revue Int De Géomatique. 2024;33(1):201–20. doi:10.32604/rig.2024.053500. [Google Scholar] [CrossRef]
27. Osseni AA. Diversité floristique et facteurs d’influence de la survie des jeunes arbres d’accompagnement de rue dans la ville de Cotonou. J Rech Sci Univ Lomé. 2022;24(1–2):77–91. [Google Scholar]
28. Osseni AA, Gbesso GHF, Nansi KM, Tente ABH. Phytodiversité et services écosystémiques associés aux plantations d’alignement des rues aménagées de la ville de Grand-Popo au Bénin. Bois Et Forêts Des Tropiques. 2020;345:85–97. doi:10.19182/bft2020.345.a31808. [Google Scholar] [CrossRef]
29. Brun LE, Djego JG, Gibigaye M, Tente B. Dynamique de l’occupation du sol dans les zones humides de la commune d’Allada au SudBénin (Sites Ramsar 1017 et 1018). Eur Sci J. 2018;14(12):5977. [Google Scholar]
30. Honvo SHS, Aboh AB, Teka O, Sewade C, Gandonou BC, Oumorou M, et al. Modélisation de la dynamique de l’occupation du sol des parcours de transhumants dans la basse et moyenne vallée de l’Ouémé (Bénin). Sci Technol Sustain Agric. 2022;2(1):1829. [Google Scholar]
31. Abdourahamane IS, Amadou OA, Abdou L, Mahamane A, Saadou M. Urban Biodiversity: perception, preference, general awareness, and threats in two cities (Niamey and Maradi) of Niger. Urban Studies Research. 2016. 12 p. [Google Scholar]
32. INSAE. Effectifs de la population des villages et quartiers de ville du bénin (RGPH-4, 2013). Cotonou, Benin: Institut national de la statistique et de l'analyse economique (INSAE); 2016. [Google Scholar]
33. MECPD. Spatialisation des cibles prioritaires des ODD au Bénin: monographie des communes des départements de l’Ouémé et du Plateau, Note synthèse sur l’actualisation du diagnostic et la priorisation des cibles des communes. In: Direction générale de la coordination et du suivi des objectifs de développement durable (DGCS-ODD). New York City, NY, USA: The United Nations; 2019. [Google Scholar]
34. Dagnelie P. Statistique théorique et appliquée. Paris et Bruxelle: De Boeck et Larcier; 1998. Vol. 2, p. 508–659. [Google Scholar]
35. Thomas E, Vandebroek I, Sanca S, Van Damme P. Cultural significance of medicinal plant families and species among Quechua farmers in Apillapampa, Bolivia. J Ethnopharmacol. 2009;122:60–7. doi:10.1016/j.jep.2008.11.021. [Google Scholar] [PubMed] [CrossRef]
36. Monteiro JM, Albuquerque UP, Linsneto EMF, Araujo EL, Amorim ELC. Use patterns and knowledge of medicinal species among two rural communities in Brazil’s semi-arid northeastern region. J Ethnopharmacol. 2006;105(1–2):173–86. doi:10.1016/j.jep.2005.10.016. [Google Scholar] [PubMed] [CrossRef]
37. Mavunda AC, Kanda M, Folega F, Egbelou V, Bosela BF, Drazo AN, et al. Dynamique spatio-temporelle des changements d’occupation du sol sous incidence anthropique dans la ville de Kinshasa (RDC) de 2001 à 2021. Geo Eco Trop. 2022;46(1):137–48. [Google Scholar]
38. Nganmo IS, Priso RJ. Impacts de l’urbanisation sur quelques écosystèmes forestiers de la ville de Douala. Cameroon Int J Biol Chem Sci. 2022;16(1):400–17. doi:10.4314/ijbcs.v16i1.34. [Google Scholar] [CrossRef]
39. Sambieni RK. Dynamique du paysage de la ville province de Kinshasa sous la pression de la périurbanisation: l’infrastructure verte comme moteur d’aménagement [thèse de doctorat]. Liege: Faculté d’Architecture, Universite De Liege; 2020. [Google Scholar]
40. Chen J, Zhang L, Xu B. Assessing spatial-temporal dynamics of urban expansion, vegetation greenness and photosynthesis in megacity Shanghai, China during 2000–2016. Remote Sens Environ. 2019;223:111374. doi:10.1016/j.rse.2019.111374. [Google Scholar] [CrossRef]
41. Bouge F. Caractérisation des espaces verts publics en fonction de leur place dans le gradient urbain—rural. Cas d’étude: la trame verte de l’Agglomération Tourangelle. Projet de Fin d’Etude. Tour: Université François-Rabelais; 2009. 86 p. [Google Scholar]
42. Lougbegnon OT, Nassi KM, Gbesso GHF. Ethnobotanique quantitative de l’usage de Chrysophyllum albidum G. Don par les populations locales au Bénin. J Appl Biosci. 2015;95(1):9028–38. doi:10.4314/jab.v95i1.12. [Google Scholar] [CrossRef]
Cite This Article
 Copyright © 2025 The Author(s). Published by Tech Science Press.
This work is licensed under a Creative Commons Attribution 4.0 International License , which permits unrestricted use, distribution, and reproduction in any medium, provided the original work is properly cited.
 Downloads
 Citation Tools