
 Submit a Paper
 Propose a Special lssue
 Open Access
ARTICLE
Public Health Implications of Road Construction and Traffic Congestion in a Hydrocarbon-Polluted Environment: An Assessment of Air and Noise Pollution
1 Department of Microbiology, Federal University of Technology, Ikot Abasi, 533101, Nigeria
2 Department of Physics, University of Uyo, Uyo, 520001, Nigeria
3 Okna Geophysical Services, Eket, 524101, Nigeria
4 Department of Biochemistry, Federal University of Technology, Ikot Abasi, 533101, Nigeria
5 Department of Geography and Natural Resources Management, University of Uyo, Uyo, 520001, Nigeria
6 Department of Agricultural Economics, University of Calabar, Calabar, 540001, Nigeria
* Corresponding Author: Okechukwu Ebuka Agbasi. Email:
(This article belongs to the Special Issue: Remote Sensing Advances for Atmospheric Monitoring)
Revue Internationale de Géomatique 2025, 34, 335-350. https://doi.org/10.32604/rig.2025.064552
Received 19 February 2025; Accepted 22 May 2025; Issue published 13 June 2025
 View Full Text
 Download PDF
Abstract
Road construction and traffic congestion are increasingly recognized as major contributors to environmental and public health challenges in urban Nigeria, particularly in Rivers State. Despite growing urbanization, a gap remains in localized data on the combined effects of air and noise pollution in hydrocarbon-polluted environments. This study addresses that gap by conducting a preliminary environmental health assessment focused on the Port Harcourt Ring Road project. Air quality and noise levels were monitored in situ at 20 strategically selected locations, with five control points included for baseline comparison. Digital portable meters were used to measure concentrations of pollutants including NO2, SO2, CO, PM10, PM2.5, CH4, Total Volatile Organic Compounds (TVOCs), and H2S, while ArcGIS software was employed for spatial interpolation using the Inverse Distance Weighted (IDW) method. Pearson’s correlation analysis was used to examine relationships among pollutants. Results revealed significantly high concentrations of NO2, SO2, and PM10—exceeding the Federal Ministry of Environment’s permissible limits. Strong positive correlations were observed among key pollutants (e.g., NO2-SO2: r = 0.79; CO-NO2: r = 0.71; CH2O-CO2: r = 0.84), indicating familiar sources such as vehicular emissions and construction activities. Noise levels at several junctions exceeded World Health Organizsation (WHO) and Federal Ministry of Environment (FME) thresholds, posing risks of hearing loss and stress-related disorders. These findings underscore the need for stricter regulatory oversight, improved urban planning, and follow-up studies to explore the health impacts in high-risk zones further.Keywords
Rivers State, Nigeria, is a rapidly developing region with a growing population and increasing urbanisation. This growth has led to increased demand for transportation infrastructure, resulting in extensive road construction activities and rising traffic congestion [1]. While these developments contribute to economic growth and connectivity, they also pose significant public health risks [2]. Exposure to air pollutants is of particular concern in urban areas due to the dense populations at risk and the diversity of emission sources with complex chemical compositions [3].
Road construction and traffic congestion are significant sources of air pollution in Rivers State. Vehicles emit a range of air pollutants, including particulate matter (PM), nitrogen oxides (NOx), Sulphur dioxide (SO2), and carbon monoxide (CO). Construction activities, particularly excavation and earthwork, generate dust and release volatile organic compounds (VOCs). These pollutants can have detrimental effects on respiratory health, leading to conditions such as asthma and bronchitis, as well as other respiratory illnesses [4]. Exposure to air pollution has also been linked to cardiovascular diseases, cancer, and premature death. Vehicular traffic is a significant source of air pollution in urban areas [5]. It has become the dominant source of air pollutants, including CO, CO2, VOCs, HCs, NOx, and particulate matter (PM). Air pollution is associated with adverse health impacts, such as chronic obstructive pulmonary disease (COPD) [6].
The incessant honking of vehicles, engine noise, and the operation of construction equipment contribute significantly to noise pollution in Rivers State. Noise is one of the most significant factors contributing to the deterioration of both the well-being and quality of life of people in urban areas [7]. Noise pollution disrupts sleep patterns, increases stress levels, and can lead to hearing loss. It also interferes with communication, reduces productivity, and has a negative impact on mental health. Lu et al. (2019) reported noise pollution as one of the environmental stressors that can affect lives. Half of the roads in Port Harcourt city areas exceed the national standard permissible limit of 90 dB(A) [8]. Constant high-pitch noise can have a profound impact on the auditory, non-auditory, and nervous systems of city dwellers [9]. Traffic noise pollution has the potential to create a great annoyance for the exposed population [10]. In addition, various studies have been conducted on road traffic noise pollution, which causes severe health problems both physically and psychologically, including irritation, impaired human performance and actions, hypertension, heart problems, fatigue, headaches, and sore throats [11–15]. Bhattacharya and Pal [16] reported that noise pollution affects most people living along the expressways. Heavy-duty trucks are found to constitute significant sources of noise annoyance, particularly during the evening.
Multiple modeling technologies have emerged recently to determine and forecast noise pollution concentrations in cities with high transportation flows. The Common Noise Assessment Methods in Europe (CNOSSOS-EU) and the Federal Highway Administration (FHWA) models remain widely used. At the same time, traffic flow, vehicle type, and road surface characteristics serve as their entry variables [17]. Noise modeling systems utilize Geographic Information Systems (GIS) and machine learning algorithms to design spatial calculations that predict sound propagation in addition to identifying exposed zones [18]. Noise exposure hotspot analysis through these models provides essential support to urban planning activities. Multiple scientific studies have documented the various health consequences of enduring noise pollution, which include cardiovascular problems, high blood pressure, sleep disturbances, cognitive deficits, and deterioration of mental well-being [19]. The research of Barceló et al. [14] revealed that prolonged exposure to Barcelona vehicle noise produced mortality risks. Developing countries, such as Nigeria, along with most other nations, lack established systems for routine noise monitoring or policy implementation [20]. Traffic congestion and poor road infrastructure contribute to road accidents, a significant cause of morbidity and mortality in Rivers State. Road accidents often result in severe injuries, disabilities, and death, placing a strain on healthcare systems and causing economic losses [21]. Road construction and traffic congestion are significant contributors to public health issues in Rivers State, Nigeria. Vehicle emissions, dust from construction sites, and noise pollution all have a negative impact on residents’ health. The research fills this knowledge gap by conducting field-based noise mapping and area identification to determine high-risk noise zones in Port Harcourt.
This study has found that road construction and traffic have a significant impact on public health in Rivers State, Nigeria. The study recommends several measures to mitigate the public health impacts of road construction and traffic. This study formed part of an independent environmental health assessment conducted by researchers from the Federal University of Technology, Ikot Abasi, the University of Uyo, and the University of Calabar. Prompted by growing concern over the health impacts of the Port Harcourt Ring Road construction, the study aims to generate scientific evidence to inform urban planning, support public health decisions, and contribute to the discourse on pollution in hydrocarbon-polluted environments. The primary objective of this study is to evaluate the environmental health implications of air and noise pollution stemming from road construction and traffic congestion in a hydrocarbon-polluted environment. Specifically, it investigates pollutant concentrations, spatial dispersion patterns, and their potential risks to public health in Rivers State, Nigeria.
2.1 Geographic Information of the Study Area
The study area is located in Rivers State, Nigeria, and lies within latitudes 4°05′29″ N and 4°56′15″ N and longitudes 6°52′28″ E and 7°07′00″ E of the Greenwich Meridian (GM). The metropolis and environs of Port Harcourt City extend to the fringes of the Igbo-Etche, Okirika, Obio-Akpor, Eleme, and Oyibo Local Government Areas, respectively. The area is located within the Niger Delta coastal zone made up of the sedimentary formation. As a coastal city, the equatorial monsoon climate influences its atmospheric characteristics due to its nearness to the Atlantic Ocean. Both the maritime and continental air masses control the rainfall and temperature patterns of the city [22].
Concentrations of air pollutants were measured in situ at 20 locations with 5 Control stations (Fig. 1). Highly sensitive digital portable meters were used to measure NO2, SO2, H2S, HCN, CH4, NH3, Cl2, CO, CO2, TVOC, CH2O, PM2.5, and PM10. The portable meters used to measure gaseous pollutants were Crowcon Gasman and air quality detectors. All measuring instruments, including the Crowcon Gasman and air quality detectors, were calibrated according to the manufacturers’ specifications before deployment. Calibration was conducted using standard gas mixtures for key pollutants to ensure accuracy and reliability. Quality control procedures included duplicate measurements at selected stations and cross-validation of readings with control locations to assess data consistency and instrument performance. For noise level measurement, the NM 102 Auto-ranging Sound Meter was used.

Figure 1: Elevation map showing the sampling points of the proposed ring road project
2.2 Field Measurement and Data Analysis
Air quality and noise pollution assessments were conducted in situ at 20 selected locations within the study area, with an additional five control stations used for baseline comparisons. Measurements were taken at various points along the proposed Ring Road project in Port Harcourt, Rivers State, Nigeria, with a focus on major road junctions, commercial hubs, and areas with high vehicular and pedestrian activity. The selection of these locations was based on their potential exposure to air pollutants and noise pollution from traffic congestion and construction activities. Although 40 sampling stations were used for preliminary mapping and observation, 20 were selected for detailed analysis based on proximity to active construction zones, high vehicular activity, and representative coverage of both northern and eastern sections of the Ring Road. This selection ensured a focused assessment of pollution hotspots.
To monitor air quality, digital portable meters, including Crowcon Gasman and air quality detectors, were used to measure concentrations of NO2, SO2, CO, H2S, CH4, NH3, Cl2, HCN, TVOC, CH2O, PM2.5, PM10, and CO2. These pollutants were selected based on their known adverse effects on human health and environmental quality. All measurements were conducted on 23 June 2024, between 7:00 a.m. and 7:00 p.m. A portable weather station was deployed to capture concurrent meteorological data, which recorded an ambient temperature ranging from 29°C to 33°C, relative humidity between 75% and 85%, wind speeds from 2.0 to 4.0 m/s, and atmospheric pressure between 1008 and 1012 hPa. Measurements were conducted at each location and subsequently analyzed to determine compliance with the Federal Ministry of Environment (FME) regulatory limits. By comparing the recorded concentrations with permissible exposure levels, the study aimed to assess the extent of air pollution and its potential impact on public health.
Noise pollution levels were measured using an NM 102 Auto-ranging Sound Meter, with readings taken at different times of the day to capture variations between peak and off-peak hours. Seasonal variations were not explicitly addressed in this study. Future studies may benefit from conducting measurements across different seasons to account for environmental changes, such as wind direction, temperature fluctuations, and rainfall patterns, which can significantly influence pollutant dispersion. Noise measurements were also performed on 23 June 2024 between 7:00 a.m. and 7:00 p.m., and were accompanied by the same meteorological recordings (ambient temperature 29°C to 33°C, relative humidity 75% to 85%, wind speeds 2.0 to 4.0 m/s, and atmospheric pressure 1008 to 1012 hPa) to account for environmental factors influencing sound propagation. These meteorological parameters are known to influence the transport and dilution of pollutants, with wind speed playing a crucial role in pollutant dispersion. Additionally, temperature and humidity can impact chemical transformations and the formation of particulate matter. The noise levels were later compared with the FME standard threshold of 90 dB(A) for an 8-h exposure period, allowing for an assessment of noise-related health risks.
For data analysis and interpretation, ArcGIS software was used to map spatial variations in air and noise pollution, enabling a clear visualisation of pollutant dispersion patterns across the study area. Recognising that not all data were collected simultaneously, a rigorous standardisation protocol was implemented. Each dataset was normalised using its corresponding time-stamped meteorological data to ensure comparability across different sampling points and to mitigate temporal variations in pollutant concentrations. Statistical techniques, including correlation analysis, were employed to examine the relationships among different pollutants and their combined effects on air quality and public health. The integration of GIS-based mapping and statistical analysis provided a comprehensive approach to understanding the dynamics of environmental pollution in the study area. Pearson’s two-tailed correlation analysis was used to examine the relationships among measured pollutants and noise levels, with significance thresholds set at p < 0.05 and p < 0.01. Data analysis was performed using Microsoft Excel 2019. No regression models were employed; instead, correlation coefficients provided insights into pollutant interactions and co-occurrence. The underlying hypothesis was that pollutants typically emitted from vehicles and construction activities—such as NO2, CO, and PM10—would show strong positive correlations with each other and with noise levels, reflecting shared sources of emission and compounded health risks in high-traffic areas.
The spatial distribution maps were generated using ArcGIS 10.8 software. Pollutant and noise level data were interpolated using the Inverse Distance Weighted (IDW) method. Classification of concentration levels was performed using the natural breaks (Jenks) method to optimise visual interpretation of dispersion patterns. A grid size of 250 m × 250 m was selected for interpolation. This was slightly larger than the average spacing between sampling points, which was approximately 100–200 m in the high-activity areas. This choice balanced spatial resolution with data reliability, minimising artifacts that could arise from overly fine grids.
This methodology enabled a preliminary spatial assessment of air quality and noise pollution, providing baseline data for environmental health evaluation and laying the foundation for future, more detailed studies. While not exhaustive, the findings highlight areas of concern that warrant regulatory attention and further scientific investigation. By leveraging advanced analytical tools and incorporating detailed temporal and meteorological data, the research provided valuable insights into the spatial distribution of pollutants, highlighting critical areas where mitigation measures should be implemented. The study did not compute Air Quality Index (AQI) values due to variability in available breakpoint data; however, comparisons with WHO and FME standards provided a reliable benchmark for assessing potential health risks.
Fig. 2 illustrates the streamlined workflow for assessing air quality and noise pollution in Port Harcourt, Nigeria. The process begins with site selection, followed by the collection of data on air pollutants, noise levels, and meteorological conditions. The collected data undergoes analysis, including GIS mapping and statistical assessments, before being compared against regulatory standards. Ultimately, the findings inform health impact assessments and mitigation strategies, ensuring compliance with environmental regulations and promoting effective public health interventions.

Figure 2: Simplified technical workflow for air quality and noise pollution assessment
3.1 Air Quality Assessment: Pollutant Concentrations and Regulatory Compliance
The results of air quality (Table 1) revealed that the NO2 values at all sampling points exceeded the FME regulatory limits of 0.04–0.06 ppm. The recorded mean value of SO2 was higher than the permissible limits of FME (0.01–0.1 ppm). CO was within the regulatory limits of 10.0–20.0 ppm. The mean PM10 concentration was above the FME limit of 250 µg/m3, while the PM2.5 concentration was within the limit. Other gaseous pollutants, such as H2S, CO2, CH4, TVOC, CH2O, NH3, Cl2, HCN, et cetera, were detected but were not assigned permissible limits by the FME. The comparison of these limits with the study findings reveals that PM10 concentrations in Rivers State (165–325 µg/m3) significantly exceed both the WHO (45 µg/m³) and USEPA (150 µg/m3) guidelines, indicating substantial air quality concerns. Similarly, SO2 and NO2 levels in some locations also surpass World Health Organization (WHO) and United States Environmental Protection Agency (USEPA) limits, reinforcing the need for stringent emission control measures.
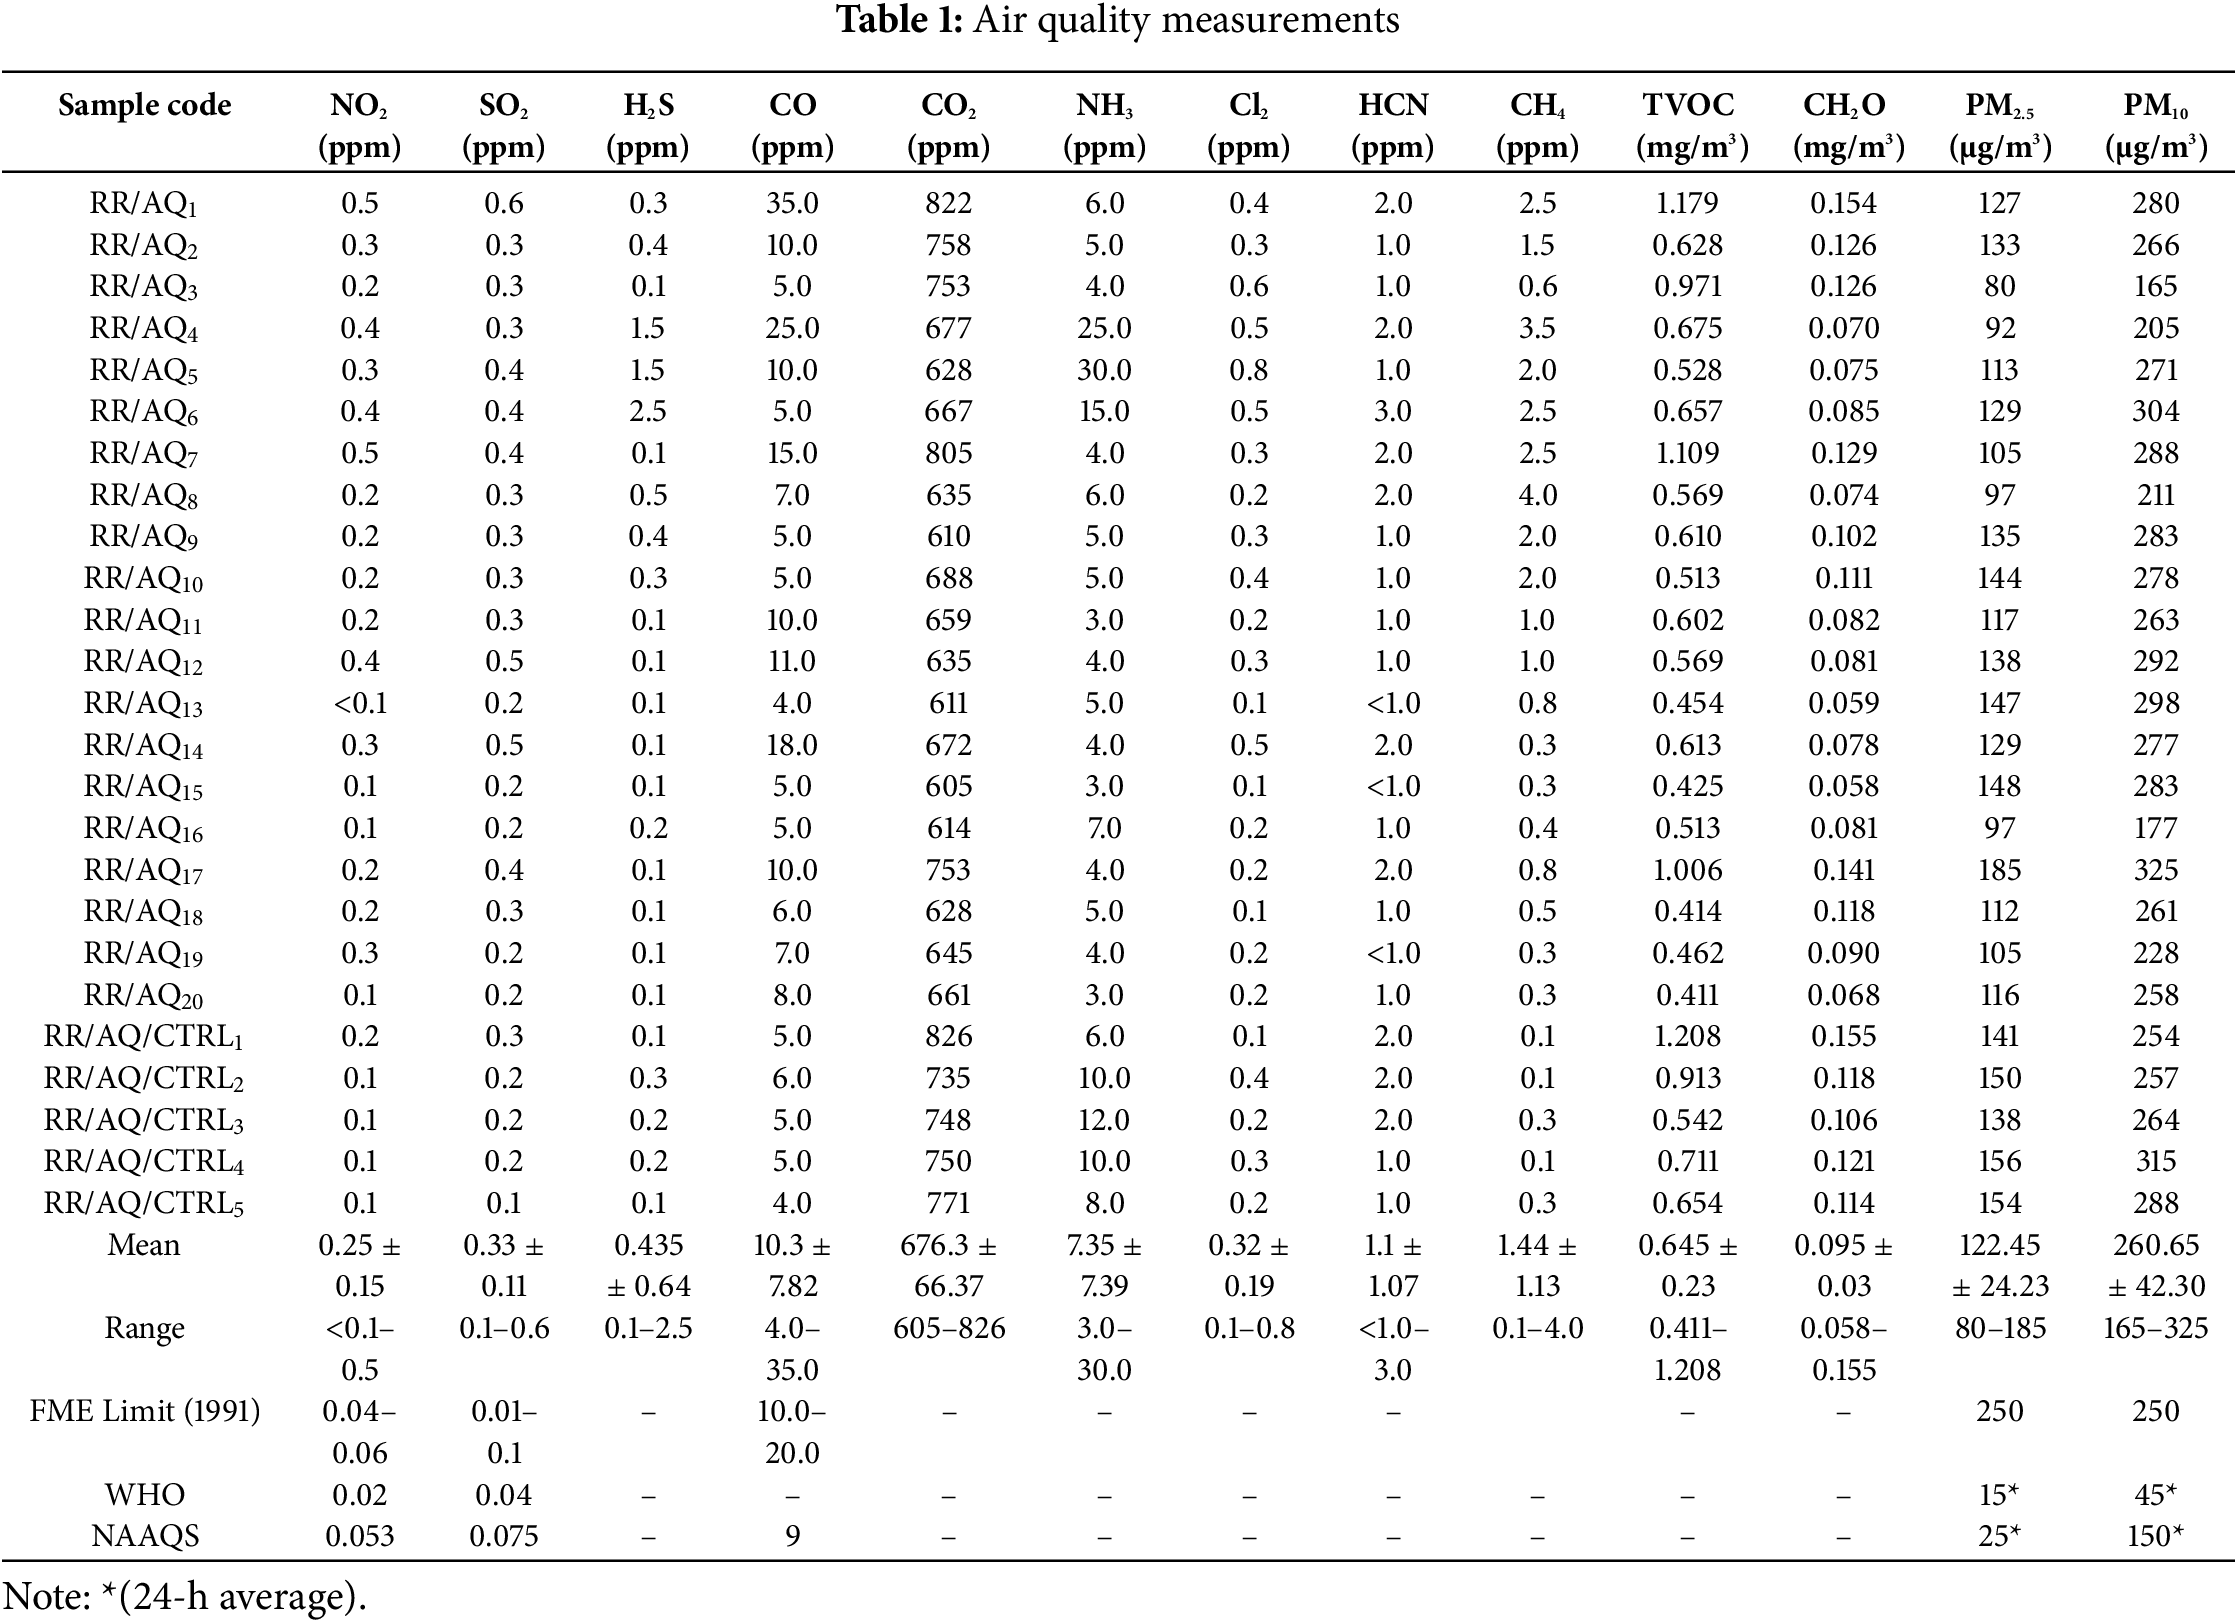
The lowest concentration of NO2, as observed in Fig. 3, was recorded around the northern loop of the proposed Ring Road, especially around Aluu Junction off Airport Road, Eneka Junction, the commercial area of Rumukpokwa and Refinery Junction, ranging between 0.092 and 0.220 ppm. The peak level was captured across the southern loop, which covered Port Harcourt City and the area West of Obio/Akpo, ranging between 0.410 and 0.499 ppm. As observed in Fig. 3, the areas around the northern loop and the Control points recorded the lowest concentration of SO2, ranging from 0.101 to 0.265 ppm. The highest concentration was captured around the southern loop, ranging between 0.431 and 0.594 ppm. The recorded levels of SO2 were above the FME regulatory limits of 0.01–0.1 ppm for a daily average of 8-hourly values in Nigeria. Almost every activity in the project area had the potential to generate considerable amounts of Sulphur dioxide.
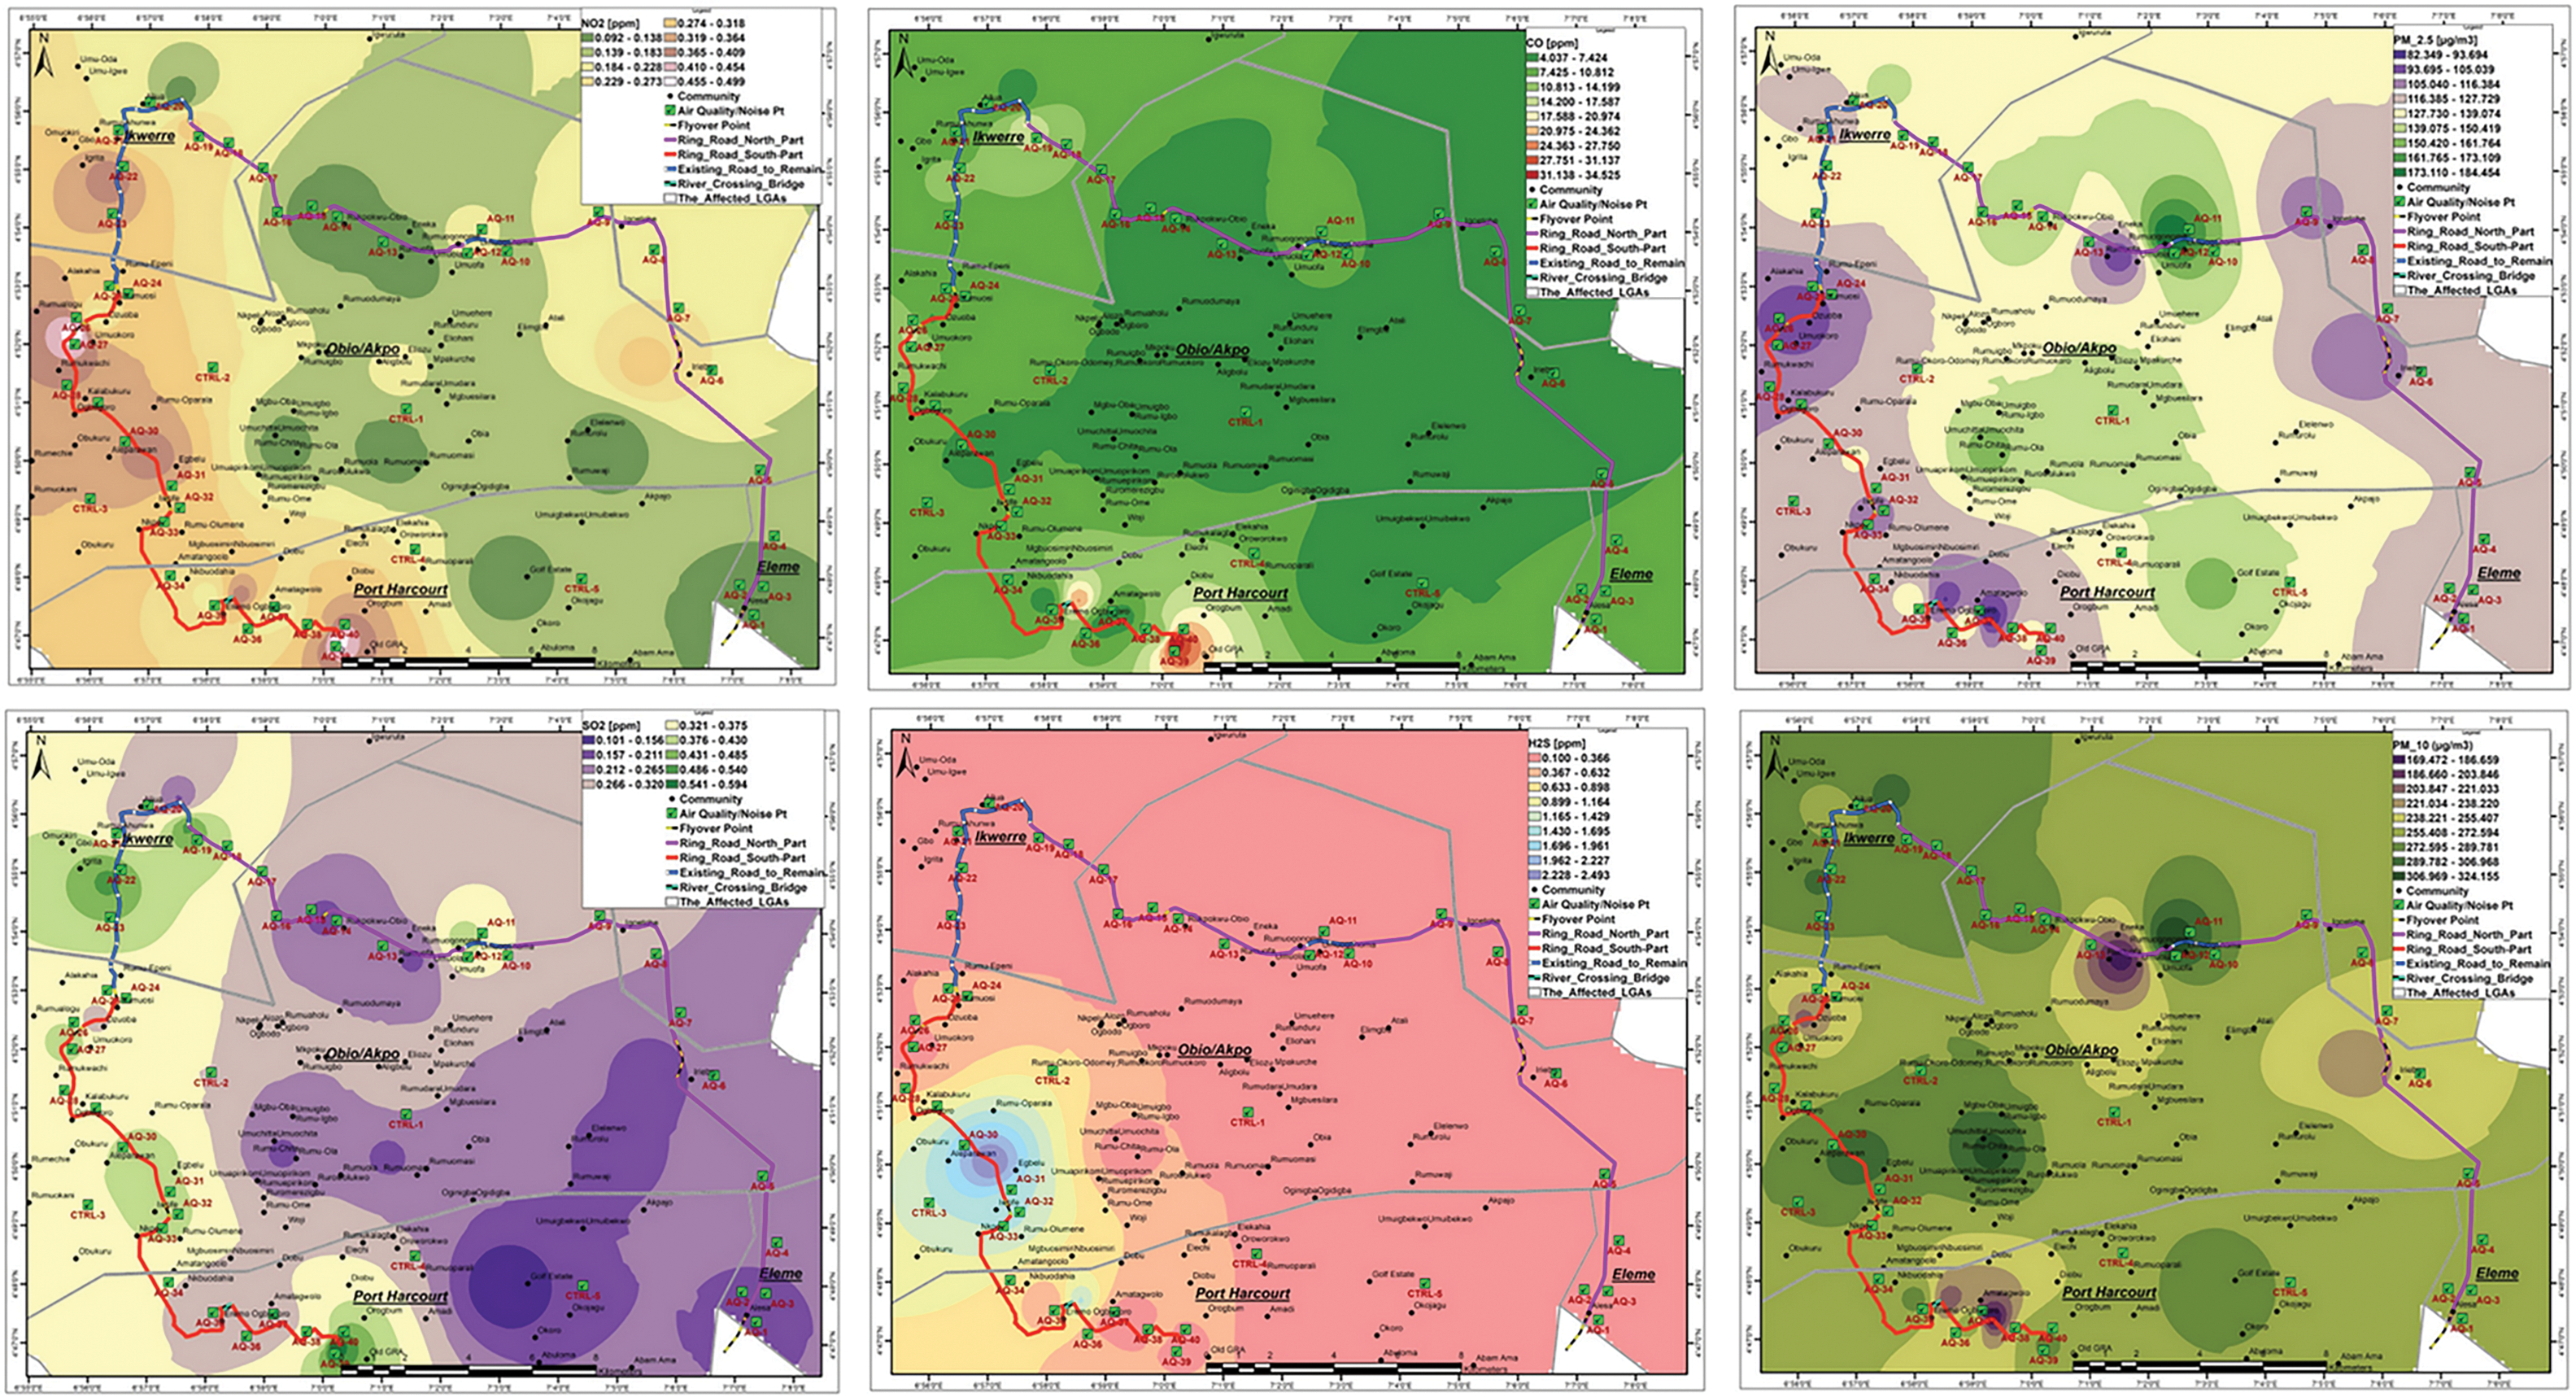
Figure 3: Map showing spatial dispersion of NO2, SO2, CO, H2S, PM2.5 and PM10
In Fig. 3, only the starting point of the proposed Ring Road at the UTC junction in the southern loop recorded the peak concentration of CO ranging between 31.137 and 34.525 ppm. Other parts of the proposed Ring Road recorded lower CO, ranging between 4.037 and 14.199 ppm. However, CO was within the FME limit of 10.0–20.0 ppm. Not less than 75% of the study area recorded the lowest H2S level, ranging from 0.100 to 0.898 ppm, which covered all sections of the northern loop. In contrast, the highest level was recorded only around the Mgbuodohia River in the southern loop and its environs, ranging from 1.962 to 2.493 ppm. FME has given no permissible value for H2S. A lower concentration of PM2.5 ranging between 82.349 and 116.384 µg/m3 was recorded across both the northern and southern loops around Aluu Junction Off Airport Road, Eneka Junction, and the Control point (Omoku Town), which recorded a significant increase in its concentration ranging between 150.420 and 184.454 µg/m3 (Fig. 3). The highest concentration of PM10 was recorded in both sections of the northern and southern loop, ranging between 272.595 and 324.155 µg/m3. The least concentration was observed specifically towards the Iloabuchi community by Timber Junction; Abattoir located by Iloabuchi River; Egbelu Abattoir; Commercial area of Rumukpokwu; Pamo University by Old Toll Gate, East-West Road ranging between 169.472 and 221.033 µg/m3 (Fig. 3).
The air quality results in Rivers State revealed that pollutants such as NO2, SO2, and PM10 exceeded the permissible limits set by the FME, indicating potential public health risks. A comparison with other Nigerian cities highlights similar air pollution trends in urban and industrial areas. In Lagos, a study by Ogunseye et al. [2] found that NO2 and SO2 concentrations frequently exceeded national standards, mainly due to vehicle emissions and industrial activities. Similarly, a study in Abuja by Pona et al. [23] reported that traffic-related pollutants were above safe limits, posing significant respiratory risks to urban populations. Additionally, air quality assessments in Onitsha and Kano have revealed alarming concentrations of particulate matter (PM10 and PM2.5), exacerbated by heavy traffic congestion and poor road infrastructure [6].
On a global scale, Rivers State’s air pollution levels are comparable to those of major industrial cities. In Beijing, China, Tao et al. [24] reported that NO2 levels reached 0.45 ppm, closely aligning with the peak values recorded in the present study. Similarly, in New Delhi, India, Reche et al. [5] observed that PM10 concentrations often exceeded 300 µg/m3, which is consistent with the values recorded in parts of Rivers State. The presence of TVOCs, CH2O, and H2S in the study area is also comparable to findings from Doha, Qatar, where Javed and Guo [25] identified similar pollutants in high-traffic regions. Moreover, research conducted in New York City, USA, by Manisalidis et al. [26] found that elevated CO and NO2 levels were strongly linked to increased hospital admissions for respiratory diseases, further reinforcing the public health concerns observed in Rivers State.
Compared to global standards set by the WHO, Nigeria’s regulatory limits appear to be more lenient, allowing for slightly higher permissible concentrations of pollutants. For example, WHO’s recommended threshold for PM2.5 is 15 µg/m3, whereas the recorded values in Rivers State often exceeded 100 µg/m3, demonstrating a severe deviation from international safety standards [27]. The study area exhibits air pollution levels consistent with other high-traffic, industrialised, and rapidly urbanising cities, necessitating urgent air quality control measures to mitigate health impacts.
3.2 Noise Pollution Assessment along the Proposed Ring Road
The study area was very rowdy at some notable junctions, such as UTC, St. John’s Catholic Junction, and Iwafe, due to human and vehicular traffic and relatively calm due to less traffic and commercial activities experienced at Igbo-Etche axis of the study area (Table 2). The mean prevailing noise level was 71.1 dB(A), falling below the FME limit of 90 dB(A). The mean noise level in Rivers State was recorded at 71.1 dB(A), with peak values reaching 92.5 dB(A) in high-traffic zones, surpassing the WHO-recommended daytime limit of 55 dB(A) and the nighttime limit of 40 dB(A). The highest noise levels were also above the USEPA’s 70 dB(A) threshold for prolonged exposure, highlighting significant risks of hearing impairment, stress, and cardiovascular issues. The findings suggest that urban traffic and construction activities contribute to excessive noise pollution, underscoring the need for improved urban planning and noise control measures. The highest noise level was recorded at significant junctions within the proposed Ring Road project, including the starting point of the road at the UTC junction, with levels ranging from 82.903 to 92.528 dB(A) (Fig. 4). It was also observed that the noise level reduced towards the Control area and other parts of the proposed Ring Road, ranging from 49.208 to 58.835 dB(A). Nevertheless, the primary source of noise in the project area was traffic noise. Motor vehicles generate various types of noise, including engine acceleration, tyre/road contact, braking, horns, vehicle theft alarms and open markets at street corners and junctions. Heavy vehicles can cause vibration and infrasound, a type of low-frequency noise. However, the noise values recorded were lower than the threshold limits of the FMENV standard, which is 90 dB(A) for eight hourly exposures.


Figure 4: Map indicating spatial dispersion of noise level
The assessment of noise pollution in Rivers State revealed peak noise levels ranging from 82.9 to 92.5 dB(A), surpassing the FME regulatory limit of 90 dB(A) for an 8-h exposure. Similar noise pollution concerns have been reported in major Nigerian cities. In Lagos, Lu et al. [28] found that noise levels at traffic hotspots often exceeded 95 dB(A), with the highest levels recorded near commercial hubs and road intersections. A study in Onitsha by Udoinyang [1] also reported average noise levels above 85 dB(A), primarily due to vehicular congestion, market activities, and industrial operations. Additionally, noise pollution studies in Kano and Ibadan have highlighted peak noise levels exceeding 100 dB(A) in highly trafficked areas, which increases the risk of hearing impairment and stress-related illnesses [16].
Globally, the noise pollution levels recorded in Rivers State are comparable to other urban centres struggling with traffic-related environmental noise. In Mumbai, India, Chandio et al. [9] reported that peak traffic noise levels ranged from 85 to 105 dB(A), a finding consistent with the present study. Likewise, Beijing, China, experiences average noise pollution levels above 90 dB(A), particularly at significant road junctions [24]. In London, UK, studies have shown that residential areas near highways and major roads experience sustained noise exposure above 80 dB(A), increasing the risk of cardiovascular diseases and sleep disturbances [29].
In contrast, cities with effective noise regulation policies, such as Stockholm, Sweden, and Tokyo, Japan, have significantly lower average noise levels, typically below 70 dB(A), due to strict traffic management strategies and the implementation of noise barriers [10]. The absence of such mitigation measures in Rivers State and other Nigerian cities contributes to unregulated noise exposure, which can lead to long-term public health consequences. Research by Ahmad et al. [7] highlights that noise pollution in developing nations is often underreported and poorly managed, leading to increased risks of noise-induced hearing loss, hypertension, and reduced productivity.
Rivers State’s noise pollution levels align with those of global traffic-dense regions, particularly developing countries where rapid urbanisation and weak regulatory enforcement exacerbate environmental noise issues. To address these challenges, urban noise mapping, stricter traffic regulations, and public awareness campaigns are necessary to reduce health risks and improve overall environmental quality.
The integrated heatmap (Fig. 5) provides a comprehensive visualisation of air pollutant concentrations alongside noise levels, enabling a multi-dimensional environmental assessment of the study area. The spatial distribution highlights distinct patterns where high concentrations of NO2, SO2, CO, PM2.5, and PM10 correspond with elevated noise levels, particularly in locations with heavy traffic and commercial activities. This alignment suggests that traffic congestion and industrial emissions are primary contributors to both air and noise pollution in the region.

Figure 5: Integrated heatmap of air pollutants and noise levels across sampling points
Notably, RR/AQ3 recorded the highest noise level at 94.0 dB(A), significantly exceeding the FME regulatory limit of 90 dB(A) for an 8-h exposure period. This location also exhibited relatively high NO2 and CO concentrations, reinforcing the correlation between vehicular emissions and noise pollution. Similarly, RR/AQ12 and RR/AQ14 also had high noise levels (above 80 dB(A)), aligning with elevated concentrations of particulate matter (PM2.5 and PM10). The presence of high TVOC and CO2 concentrations in these locations further supports the role of fossil fuel combustion and industrial activities as key pollution sources.
Conversely, control stations such as RR/AQ/CTRL2 and RR/AQ/CTRL3 exhibited lower pollutant levels and noise intensities, demonstrating improved environmental quality in less urbanised areas. The findings suggest that urbanisation, road traffic density, and industrial operations have a significant impact on air quality and noise pollution.
The heatmap facilitates pattern recognition, allowing for comparative analysis across different regions of the study area. The identification of hotspot areas for both air pollution and noise levels underscores the urgent need for mitigation strategies, including traffic flow optimisation, emission control measures, and urban noise management policies. By integrating multiple environmental indicators, Fig. 5 enhances the clarity of discussions and conclusions, aligning with recommendations for a more intuitive and holistic assessment of environmental impacts.
3.3 Correlation between Air Quality and Noise Parameters in the Study Area
Table 3 shows the level of correlation among the air quality parameters in the study area. NO2 and SO2 recorded a significant positive correlation of 0.79, likewise CO with NO2 and SO2 with 0.710 and 0.686, respectively. NH3 and H2S were also observed to be significant, likewise CL2 with H2S and NH3 with correlation coefficients of 0.587 and 0.637, respectively. Similarly, CH4 recorded significance with NO2 and H2S with 0.605 and 0.565, respectively. TVOC recorded a significant correlation with CO2 with 0.831. On the other hand, CH2O recorded a significant correlation with CO2 and TVOC with 0.847 and 0.786, respectively, while PM2.5 was observed to be significant with PM2.5 with a coefficient of 0.806, all at 0.01 level of significance. At 0.05 level of significance, it was observed that moderate and weak correlation was recorded among some parameters. This result implies that the gases, when combined, have a high negative impact on man. For instance, the concentration of gases like NO2, SO2 and PM10 were above the permissible limits of FME, and in this analysis, the gases are strongly correlated. This implies the health implications arising from exposure to these pollutants within the study area.

Road construction and traffic congestion are significant contributors to public health issues in Rivers State, Nigeria. The emission of air pollutants from vehicles and construction equipment, coupled with dust generation from construction activities, poses a serious risk to respiratory health, cardiovascular function, and plant ecology. Noise pollution from traffic and construction disrupts sleep patterns, increases stress levels, and contributes to long-term auditory impairments. WHO has reported that prolonged exposure to noise levels exceeding 70 dB(A) can lead to increased blood pressure, cognitive impairment in children, and heightened risks of cardiovascular diseases [30].
The criteria pollutants measured at the study area showed that NO2, SO2, and PM10 concentrations exceeded the permissible limits set by the Federal Ministry of Environment (FME). At the same time, CO and PM2.5 remained within regulatory thresholds. Recent epidemiological studies indicate that long-term exposure to NO2 and SO2 increases the risk of chronic bronchitis, lung infections, and premature mortality [23]. The effects of NO2 and SO2 as primary pollutants contribute to acid rain formation, which not only damages infrastructure but also exacerbates soil acidification, leading to declining agricultural productivity [31].
There are growing environmental health concerns in Rivers State, including climate change-induced extreme weather events, air pollution, and emerging patterns of infectious diseases. Studies have shown that air pollution contributes to approximately 25% of stroke deaths and 29% of lung cancer deaths globally [30]. Nigeria is ranked among the top five countries globally with the highest levels of premature deaths linked to air pollution [32]. The strong correlation between noise levels and air pollution is also concerning, as high-traffic zones such as UTC and St. John’s Catholic Junction recorded noise levels exceeding the FME standard of 90 dB(A), posing risks of hearing impairments, stress-related illnesses, and cardiovascular dysfunction [29].
Exposure to elevated NO2 and SO2 levels is strongly linked to increased hospital admissions for asthma, chronic obstructive pulmonary disease (COPD), and other respiratory illnesses [33]. A 2020 study in Lagos reported that air pollution contributed to a 30% rise in emergency visits due to respiratory distress [25]. Similarly, particulate matter (PM2.5 and PM10) has been associated with higher incidences of lung infections, reduced lung function, and increased rates of ischemic heart disease. Airborne particulate matter, including PM2.5 and PM10, represents a complex mixture of organic and inorganic substances. The small size of PM2.5 allows it to penetrate deep into lung tissues, leading to inflammation and worsening of pre-existing conditions like asthma and bronchitis [30]—long-term exposure to high PM2.5 concentrations have been linked to an increased risk of lung cancer and cardiovascular diseases.
Outdoor air pollutants such as CO, NO2, and TVOC have also been linked to increased blood pressure and higher risks of stroke. Epidemiological research in Nigerian urban centers has found a direct relationship between high PM10 exposure and an increase in cases of ischemic heart disease [27]. According to the WHO Global Burden of Disease (GBD) ranking, air pollution is among the top risk factors for premature death worldwide. Prolonged exposure to noise levels above 85 dB(A) has been shown to cause permanent hearing loss and cognitive impairments. Studies have also linked high urban noise pollution to increased production of stress hormones, which may lead to long-term cardiovascular conditions [30]. Noise disturbances from traffic congestion, engine acceleration, and construction activities have severe psychological effects, including increased anxiety, sleep disturbances, and reduced cognitive performance in children.
Recent studies show that children exposed to high noise levels perform worse in cognitive tests and experience delays in language and memory development [28]. Adults working or living near high-noise environments also report higher incidences of stress-related illnesses and lower overall productivity levels. Multiple epidemiological studies have established the link between noise pollution and hypertension, with prolonged exposure contributing to long-term cardiovascular damage [30]. When compared to other high-density urban centers, Rivers State exhibits air pollution levels similar to Beijing, New Delhi, and Lagos, where traffic emissions and industrial activities significantly contribute to health risks [24]. A study in Onitsha, Nigeria, revealed PM10 levels exceeding WHO limits by 200%, correlating with high rates of respiratory infections among residents [23]. The WHO reports that cities with high traffic congestion and poor urban planning tend to have significantly higher rates of illnesses induced by air pollution.
Road construction and traffic in Rivers State, Nigeria, present a complex interplay of development and public health challenges. While infrastructure development is essential for economic growth, the associated environmental and health impacts cannot be ignored. This study has demonstrated that both the construction and operational phases of road development pose significant public health risks, primarily through air pollution, noise pollution, and occupational hazards for workers and residents. Air quality analysis revealed alarming levels of NO2 and SO2, significantly exceeding the permissible limits set by the FME. PM10 concentrations also surpassed regulatory thresholds, increasing the risk of chronic respiratory diseases, lung infections, and cardiovascular conditions. Health data from WHO (2018) suggests that outdoor air pollution is responsible for 24% of stroke-related deaths and 43% of COPD cases worldwide, underscoring the severity of the situation. The strong correlation between noise pollution and air pollutant levels highlights the need for urban noise management strategies. Major junctions, such as UTC and St. John’s Catholic Junction, recorded peak noise levels exceeding 90 dB(A), surpassing the WHO-recommended limit of 70 dB(A). This exposure is linked to increased risks of hypertension, cardiovascular diseases, and hearing impairments. To mitigate these adverse effects, a multi-sectoral approach is required. Key recommendations include strengthening air quality and noise regulations to ensure compliance with WHO and FME standards, and expanding health surveillance programs to monitor and track pollution-related diseases. Investment in clean transportation alternatives—such as electric public transit and emission reduction policies—is essential. Additionally, establishing noise barriers and implementing effective traffic management strategies can help reduce environmental noise exposure. Ultimately, enhancing community awareness programs on pollution-related health risks and mitigation strategies is crucial for achieving long-term improvements in public health. By integrating robust environmental policies with health-focused interventions, it is possible to balance infrastructure development with sustainable public health goals. The findings of this study highlight the urgent need for targeted action to protect the health of residents in Rivers State from health risks associated with air and noise pollution. One limitation of this study is that the spatial interpolation extended to areas with fewer monitoring points, which may have introduced artefacts. Future studies should employ spatial masking to restrict interpolation to well-sampled areas. While this study relied on basic spatial interpolation and Pearson correlation, future analyses could employ Geographically Weighted Regression (GWR) to investigate how the relationships between pollutants and noise vary across space.
Acknowledgement: The authors would like to thank the editors and reviewers for their reviews and suggestions.
Funding Statement: The authors received no specific funding for this study.
Author Contributions: The authors confirm contribution to the paper as follows: study conception and design: Idongesit Sunday. Ambrose, Sunday Edet Etuk; data collection: Idongesit Sunday. Ambrose, Okechukwu Ebuka Agbasi; analysis and interpretation of results: Ijah Ioryue Silas, Unyime Udoette Saturday; draft manuscript preparation: Ijah Ioryue Silas, Eyo Edet Orok; GIS mapping and visualization: Okechukwu Ebuka Agbasi; manuscript finalization: Sunday Edet Etuk. All authors reviewed the results and approved the final version of the manuscript.
Availability of Data and Materials: The data for this research can be made available upon request.
Ethics Approval: Not applicable.
Conflicts of Interest: The authors declare no conflicts of interest to report regarding the present study.
References
1. Udoinyang NN. The economic impact of poor road system on agricultural value chain in Rivers State, Nigeria. Int J Integr Sci Technol. 2024;2(4):231–48. doi:10.59890/ijist.v2i4.1664. [Google Scholar] [CrossRef]
2. Ogunseye NO, Oyejola OE, Salisu UO, Momodu SO, Fasina SO. Socio-economic impacts of road infrastructure development during- and post-construction in a fast-growing city in Nigeria. Transp Commun. 2020;8(1):25–35. doi:10.26552/tac.c.2020.1.5. [Google Scholar] [CrossRef]
3. Yu H, Stuart AL. Exposure and inequality for select urban air pollutants in the Tampa Bay area. Sci Total Environ. 2016;551–552(5):474–83. doi:10.1016/j.scitotenv.2016.01.157. [Google Scholar] [PubMed] [CrossRef]
4. Maung TZ, Bishop JE, Holt E, Turner AM, Pfrang C. Indoor air pollution and the health of vulnerable groups: a systematic review focused on particulate matter (PMvolatile organic compounds (VOCs) and their effects on children and people with pre-existing lung disease. Int J Environ Res Public Health. 2022;19(14):8752. doi:10.3390/ijerph19148752. [Google Scholar] [PubMed] [CrossRef]
5. Reche C, Tobias A, Viana M. Vehicular traffic in urban areas: health burden and influence of sustainable urban planning and mobility. Atmosphere. 2022;13(4):598. doi:10.3390/atmos13040598. [Google Scholar] [CrossRef]
6. Mak HWL, Ng DCY. Spatial and socio-classification of traffic pollutant emissions and associated mortality rates in high-density Hong Kong via improved data analytic approaches. Int J Environ Res Public Health. 2021;18(12):6532. doi:10.3390/ijerph18126532. [Google Scholar] [PubMed] [CrossRef]
7. Ahmad SA, Sarkar PK, Dhungana HN. A study of noise and development of traffic noise annoyance models. J Transp Technol. 2015;5(4):185–90. doi:10.4236/jtts.2015.54017. [Google Scholar] [CrossRef]
8. Federal Ministry of Environment. Interim guidelines and standards for industrial effluent, gaseous emissions and noise limitations. Lagos, Nigeria: FME; 1991. 72 p. [Google Scholar]
9. Chandio IA, Brohi KM, Memon MA. Managing road traffic noise pollution through a sustainable planning approach. Int J Chem Environ Eng. 2010;1(2):115–21. [Google Scholar]
10. Murthy VK, Khanal SN. Assessment of traffic noise pollution in Banepa, a semi-urban town of Nepal. Kathmandu Univ J Sci Eng Technol. 2007;1(2):1–9. doi:10.3126/kuset.v3i2.2891. [Google Scholar] [CrossRef]
11. Fyhri A, Klæboe R. Road traffic noise, sensitivity, annoyance and self-reported health: a structural equation model exercise. Environ Int. 2009;35(1):91–7. doi:10.1016/j.envint.2008.08.006. [Google Scholar] [PubMed] [CrossRef]
12. Singh D, Kumari N, Sharma P. A review of adverse effects of road traffic noise on human health. Fluct Noise Lett. 2017;17(1):1830001. doi:10.1142/s021947751830001x. [Google Scholar] [CrossRef]
13. Recio A, Linares C, Banegas JR, Díaz J. Road traffic noise effects on cardiovascular, respiratory, and metabolic health: an integrative model of biological mechanisms. Environ Res. 2016;146(2):359–70. doi:10.1016/j.envres.2015.12.036. [Google Scholar] [PubMed] [CrossRef]
14. Barceló MA, Varga D, Tobias A, Diaz J, Linares C, Saez M. Long term effects of traffic noise on mortality in the city of Barcelona, 2004–2007. Environ Res. 2016;147(44):193–206. doi:10.1016/j.envres.2016.02.010. [Google Scholar] [PubMed] [CrossRef]
15. Amoatey P, Omidvarbona H, Baawain MS, Al-Mayahi A, Al-Mamun A, Al-Harthy I. Exposure assessment to road traffic noise levels and health effects in an arid urban area. Environ Sci Pollut Res. 2020;27(28):35051–64. doi:10.1007/s11356-020-09785-y. [Google Scholar] [PubMed] [CrossRef]
16. Bhattacharya D, Pal D. A study of road traffic noise annoyance on daily life in Agartala city using fuzzy expert system and multiple regression analysis. Int J Sci Res Publ. 2012;2(5):1–7. doi:10.1155/2012/828593. [Google Scholar] [CrossRef]
17. Navarro JM, Martínez-España R, Bueno-Crespo A, Martínez R, Cecilia JM. Sound levels forecasting in an acoustic sensor network using a deep neural network. Sensors. 2020;20(3):903. doi:10.3390/s20030903. [Google Scholar] [PubMed] [CrossRef]
18. Adulaimi AAA, Pradhan B, Chakraborty S, Alamri A. Traffic noise modelling using land use regression model based on machine learning, statistical regression and GIS. Energies. 2021;14(16):5095. doi:10.3390/en14165095. [Google Scholar] [CrossRef]
19. Zhang X, Zhou S. Building a city with low noise pollution: exploring the mental health effect thresholds of spatiotemporal environmental noise exposure and urban planning solution. Int J Environ Res Public Health. 2023;20(5):4222. doi:10.3390/ijerph20054222. [Google Scholar] [PubMed] [CrossRef]
20. Kpang NMBT, Dollah NOC. Monitoring noise level in cities: a step towards urban environmental quality management in Nigeria. World J Adv Res Rev. 2021;10(3):348–57. doi:10.30574/wjarr.2021.10.3.0194. [Google Scholar] [CrossRef]
21. Afrin T, Yodo N. A survey of road traffic congestion measures towards a sustainable and resilient transportation system. Sustainability. 2020;12(11):4660. doi:10.3390/su12114660. [Google Scholar] [CrossRef]
22. Chiadikobi KC, Omoboriowo AO, Chiaghanam OI, Opatola AO, Oyebanji O. Flood risk assessment of Port Harcourt, Rivers State, Nigeria. Adv Appl Sci Res. 2011;2(6):287–98. [Google Scholar]
23. Pona HT, Xiaoli D, Ayantobo OO, Tetteh ND. Environmental health situation in Nigeria: current status and future needs. Heliyon. 2021;7(3):e06330. doi:10.1016/j.heliyon.2021.e06330. [Google Scholar] [PubMed] [CrossRef]
24. Tao Y, Kou L, Chai Y, Kwan M. Associations of co-exposures to air pollution and noise with psychological stress in space and time: a case study in Beijing. China Environ Res. 2020;196(9925):110399. doi:10.1016/j.envres.2020.110399. [Google Scholar] [PubMed] [CrossRef]
25. Javed W, Guo B. Chemical characterization and source apportionment of fine and coarse atmospheric particulate matter in Doha, Qatar. Atmos Pollut Res. 2020;12(2):122–36. doi:10.1016/j.apr.2020.10.015. [Google Scholar] [CrossRef]
26. Manisalidis I, Stavropoulou E, Stavropoulou A, Bezirtzoglou E. Environmental and health impacts of air pollution: a review. Front Public Health. 2020;8:20. doi:10.3389/fpubh.2020.00014. [Google Scholar] [PubMed] [CrossRef]
27. Aliyu YA, Botai JO. Reviewing the local and global implications of air pollution trends in Zaria, northern Nigeria. Urban Clim. 2018;26(1):51–9. doi:10.1016/j.uclim.2018.08.008. [Google Scholar] [CrossRef]
28. Lu X, Kang J, Zhu P, Cai J, Guo F, Zhang Y. Influence of urban road characteristics on traffic noise. Transp Res D Transp Environ. 2019;75:136–55. doi:10.1016/j.trd.2019.08.026. [Google Scholar] [CrossRef]
29. Paunović K, Jakovljević B, Belojević G. Predictors of noise annoyance in noisy and quiet urban streets. Sci Total Environ. 2009;407(12):3707–11. doi:10.1016/j.scitotenv.2009.02.033. [Google Scholar] [PubMed] [CrossRef]
30. World Health Organization. Sustainable cities: health at the heart of urban development [Internet]. Geneva, Switzerland: WHO; 2018 [cited 2025 May 21]. Available from: http://www.who.int/mediacentre/factsheets. [Google Scholar]
31. Fatma K, Ahmet Ö. Negative effects of acid rains on agricultural areas. Ann Environ Sci Toxicol. 2023;7(1):013–6. doi:10.17352/aest.000065. [Google Scholar] [CrossRef]
32. Bae S, Hong YC. Health effects of particulate matter. J Korean Med Assoc. 2018;61(12):749–55. doi:10.5124/jkma.2018.61.12.749. [Google Scholar] [CrossRef]
33. Mabahwi NAB, Leh OLH, Omar D. Human health and wellbeing: human health effect of air pollution. Procedia Soc Behav Sci. 2014;153(24):221–9. doi:10.1016/j.sbspro.2014.10.056. [Google Scholar] [CrossRef]
Cite This Article
 Copyright © 2025 The Author(s). Published by Tech Science Press.
This work is licensed under a Creative Commons Attribution 4.0 International License , which permits unrestricted use, distribution, and reproduction in any medium, provided the original work is properly cited.
 Downloads
 Citation Tools