
 Submit a Paper
 Propose a Special lssue
 Open Access
ARTICLE
Vegetation Cover Change and Its Driving Factors in the Chengdu-Chongqing Urban Agglomeration in the Past 20 Years
1 College of Resources and Environment, Chengdu University of Information Technology, Chengdu, 610000, China
2 College of Sciences, Shihezi University, Shihezi, 832003, China
* Corresponding Author: Linlin Cui. Email:
Revue Internationale de Géomatique 2025, 34, 363-377. https://doi.org/10.32604/rig.2025.065708
Received 20 March 2025; Accepted 17 June 2025; Issue published 14 July 2025
 View Full Text
 Download PDF
Abstract
Exploring the spatiotemporal changes in Fractional Vegetation Coverage (FVC) helps to more accurately understand the quality of the ecological environment, which is of great significance for regional ecological protection and sustainable economic development. The study takes the Chengdu-Chongqing urban agglomeration as the research area, analyzes the characteristics and trends of vegetation cover changes from 2000 to 2020 using the Google Earth Engine cloud platform, and explores its driving factors based on the enhanced regression tree model. The results show that: (1) From 2000 to 2020, the annual FVC of the Chengdu-Chongqing urban agglomeration showed a fluctuating upward trend, with a stable phase from 2000 to 2003 and an upward phase from 2003 to 2020. (2) During the research period, most areas within the agglomeration exhibited negligible changes in FVC. In contrast, other areas showed a complex pattern of both vegetation degradation and improvement. The areas with improved FVC were sporadically distributed, accounting for 15.08% of the total area, whereas areas with substantial vegetation degradation constituted 11.60%. (3) The FVC in the Chengdu-Chongqing urban agglomeration is predominantly influenced by four key factors: population dynamics, forestry management practices, annual sunshine duration, and annual precipitation. Collectively, these factors account for 99.31% of the variation in FVC, with anthropogenic factors (population dynamics and forestry management) exerting the most significant influence.Keywords
As an important part of the ecosystem [1,2], vegetation serves as an indispensable component in the human living environment and key ecosystem functions [3,4]. Changes in vegetation cover at regional scales can reflect the effects of natural evolution and human activities on the ecological environment [5,6]. China possesses an extensive vegetation coverage area and abundant agricultural and forestry resources. The scientific and precise acquisition of vegetation coverage information and the rational coordination between regional development and the ecological environment are key challenges in China’s regional development. Consequently, the exploration of scientific research methodologies to obtain long-term, large-scale vegetation cover data and elucidate its driving forces carries profound significance.
Fractional Vegetation Coverage (FVC) is usually defined as the percentage of the vertical projection area of vegetation (including leaves, stems, and branches) on the ground to the total area of the statistical area. It is an important parameter for describing surface vegetation cover [7–9]. The Google Earth Engine (GEE) cloud platform integrates functions such as data acquisition, image processing, computational analysis, and visualization, enabling efficient processing of long-term high-resolution images. Previous studies have explored vegetation cover changes and their driving factors in various regions. For instance, Yang et al. [10] utilized 500 m MODIS vegetation index product data as the data source and coupled it with a geographic detector model to investigate the spatiotemporal changes and driving factors of vegetation cover in the Xinjiang from 2000 to 2024. Xiao et al. [11] analyzed the spatiotemporal variation of vegetation cover in key karst areas based on the MODIS vegetation index product and explored its driving factors. Chen et al. [12] examined the temporal and spatial changes of vegetation cover and its response to climate in the Qinba Mountains from 1982 to 2017 using multi-source NDVI, and discussed the response relationship between vegetation cover and topography as well as climatic factors in key areas.
In recent years, many scholars have studied the dynamic changes of vegetation cover in southwest China. However, there are relatively few studies on the dynamic changes of vegetation in the Chengdu-Chongqing urban agglomeration, which is an important fulcrum for the development of western China and holds an irreplaceable strategic position in China’s economic development [13]. The region has a relatively developed social economy and a high level of urbanization, but the natural habitat conditions are significantly impacted by human activities. Therefore, this study took vegetation coverage as the research object. Based on the long-term MOD13A1 Normalized Difference Vegetation Index (NDVI) image data of the Chengdu-Chongqing Economic Circle, we utilized Google’s newly developed GEE cloud platform to study the vegetation coverage of the Chengdu-Chongqing urban agglomeration. Considering the complex interactions between natural and human factors in the region, we selected three natural climatic factors, including annual precipitation, annual sunshine time and annual average temperature, as well as six human activity factors (added value of primary, secondary, and tertiary industries; total output value of agriculture, forestry, animal husbandry, and fishery; total forestry output value; and total population) for Boosted Regression Trees (BRT) analysis. The aim of this study is to provide a scientific reference for promoting the ecological environment construction of Chengdu-Chongqing urban agglomeration and realizing regional harmonious and sustainable development.
2 Research Area and Research Methods
The Chengdu-Chongqing urban agglomeration is located in the southwest of China, with a geographical range between 27°39′~33°02′ N and 101°56′~110°12′ E, and an elevation ranging from 16 to 5360 m. It is located in the core area of the Sichuan Basin. The climate is mainly subtropical monsoon, with distinct four seasons, abundant water and heat conditions. The average annual temperature is 16 to 18°C, and an average annual precipitation is more than 1200 mm [14]. The Chengdu-Chongqing urban agglomeration has a high urbanization rate, a large population base, and a complete transportation system. It is an important platform for the development of the western region of China and a strategic support for the Yangtze River Economic Belt. The urban agglomeration includes 17 cities and counties in Sichuan Province such as Chengdu, Deyang, Mianyang, and Ziyang, as well [15] (Fig. 1).
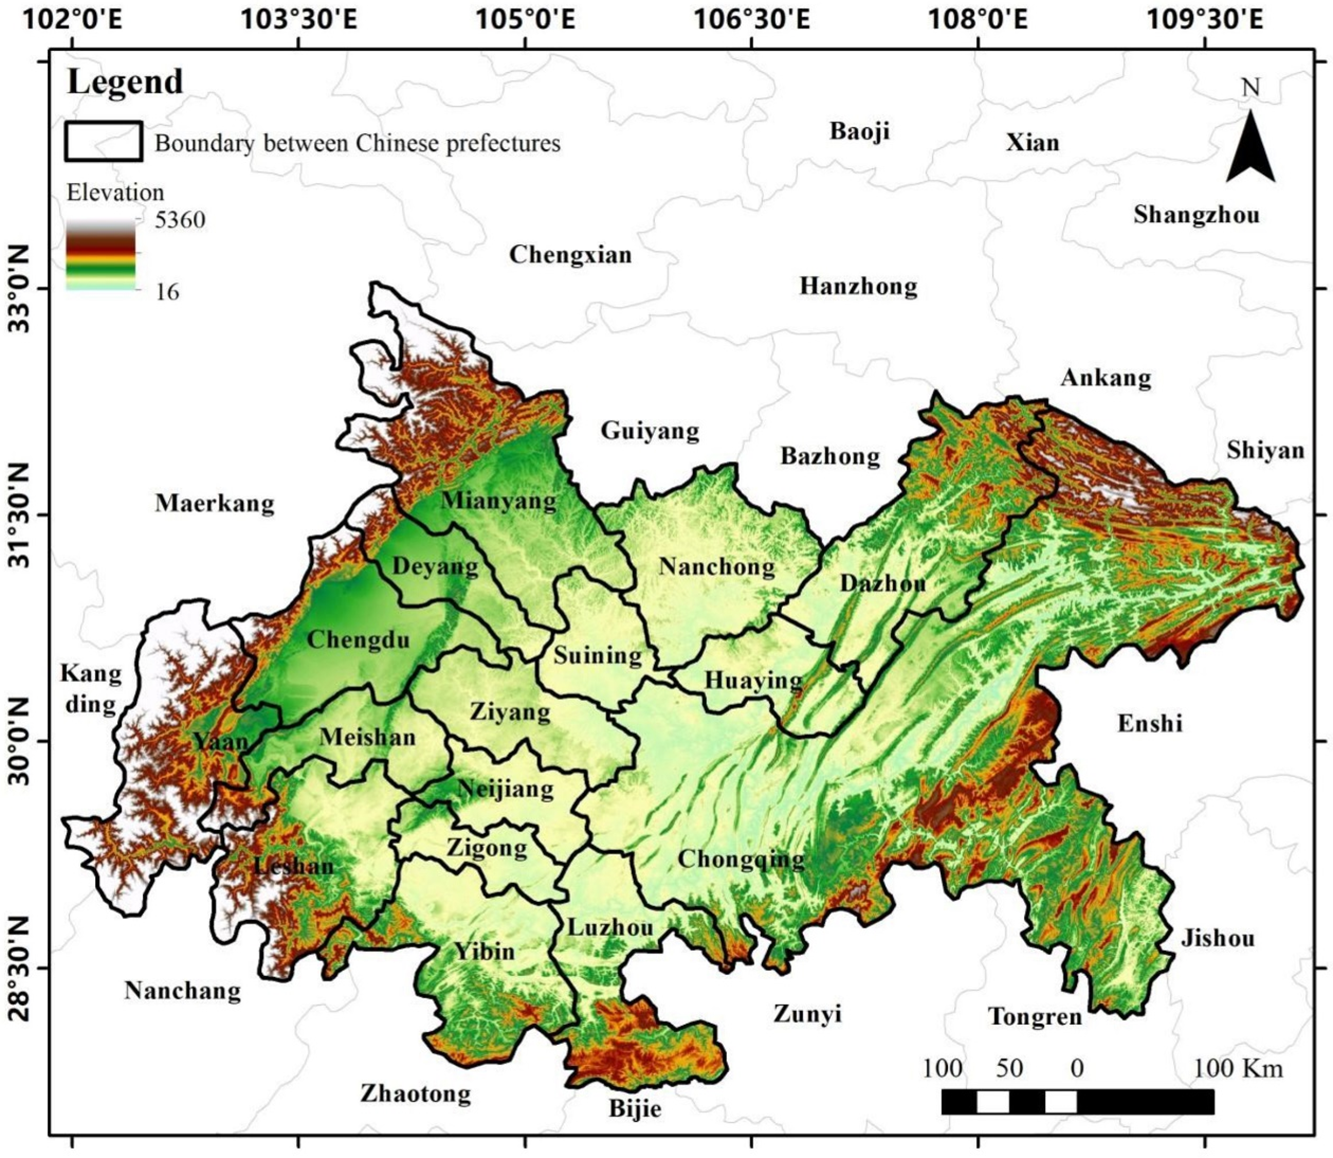
Figure 1: Location map of the research area
(1) NDVI data: In this paper, MOD13A1 (16-day composite) NDVI product data from the United States Geological Survey (USGS) was selected. The data has a time span from January 2000 to December 2020 and a spatial resolution of 500 m. This product has undergone geometric correction, atmospheric correction, and other preprocessing, and was spliced and clipped using the GEE platform.
(2) Digital Elevation Model (DEM) data: In this paper, the SRTM DEM UTM 90M resolution digital elevation data product was selected. The preprocessing such as projection, splicing and masking was completed in ArcGIS 10.7 software.
(3) Statistical data: The meteorological data and socio-economic data in this paper are derived from the “Sichuan Statistical Yearbook” (http://tjj.sc.gov.cn/scstjj/c105855/nj.shtml, accessed on 15 June 2025) and the “Chongqing Statistical Yearbook” (http://tjj.cq.gov.cn/zwgk_233/tjnj/index.html, accessed on 15 June 2025) from 2000 to 2020. The data includes three natural climate factors such as annual precipitation, annual sunshine duration and annual average temperature, and six human activity factors such as the added value of the primary, secondary and tertiary industries, the total output value of agriculture, forestry, animal husbandry and fishery, the total output value of forestry and the total population.
2.3.1 Vegetation Coverage Calculation Based on GEE
GEE is a PB level system that enables scientific analysis and visualization of geographic spatial datasets. The specific calculation process is as follows:
(1) Build a long-term time series database. This article uses MODIS NDVI products from the GEE platform.
(2) Compute the annual FVC value. Using NDVI image datasets, we derive annual FVC composite values for individual pixels and export the FVC image dataset to Google Drive. This study employs a pixel binary model [16,17], which assumes that a pixel consists of vegetation-covered and non-vegetation-covered areas, to estimate FVC. The spectral information represents a linear mixture of these two components, with the proportion of each component within the pixel serving as its weight. The proportion of the vegetation area corresponds to the pixel’s FVC. The FVC calculation formula is as follows:
In the formula: FVC is vegetation coverage; NDVI is the vegetation index value within the mixed pixels;
(3) Analysis of Regional FVC Change Trends. Using FVC image collection data, calculate the annual composite FVC values of urban agglomerations and Chengdu Chongqing over the years, and use univariate linear regression to analyze the trend of vegetation coverage changes.
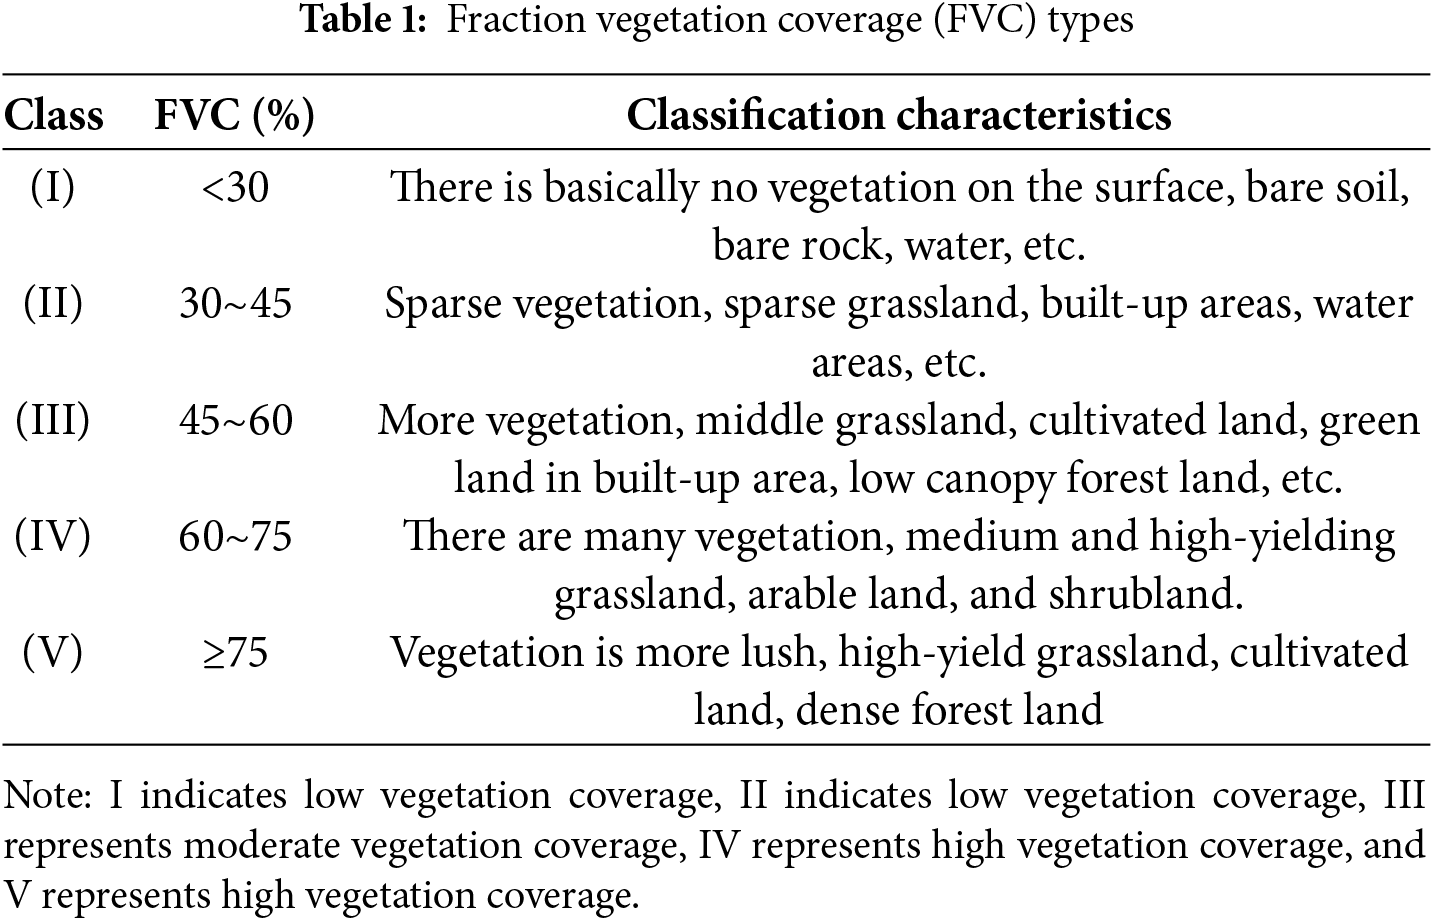
(4) Statistically analyze changes in FVC. Download the FV image collection data and FVC change image data from Google Drive to the local area, and use ArcGIS software to divide FVC into 5 levels and visualize them (Table 1).
2.3.2 Time Series Analysis Method
This article averages the preprocessed dataset of the maximum monthly FVC values in the Chengdu Chongqing urban agglomeration over a period of 12 months to obtain the FVC annual value dataset from 2000 to 2020. The annual variation of vegetation cover in the Chengdu Chongqing urban agglomeration from 2000 to 2020 is analyzed, and each pixel in the FVC annual value dataset has a 21 year time series value. The linear fitting slope of these values can reveal the evolution trend of the pixel in the spatiotemporal sequence. If the slope is greater than 0, it indicates that vegetation cover is developing positively, otherwise, vegetation cover tends to deteriorate. Whether the linear evolution relationship is significant is determined by the correlation coefficient, and the calculation formula is [18]:
In the formula, slop is the linear fitting slope; xi is the annual FVC mean of the i-th year; ti is the year; n is the total number of years, which is 21.
2.3.3 Boosted Regression Trees (BRT)
Boosted Regression Trees (BRT) is a machine learning algorithm based on classification regression trees. This algorithm randomly selects a certain amount of data multiple times during the operation process, analyzes the degree of influence of the independent variable on the dependent variable, and uses the remaining data for result verification [19,20]. The generated multiple regression trees are averaged and output. This allows for the calculation of the relationship between a certain independent variable and the dependent variable, assuming that other independent variables take the mean or remain constant, in order to determine the magnitude of the influence of the independent variable on the dependent variable. BRT can improve the stability and accuracy of calculation results. It exhibits great flexibility in handling various data formats, such as continuous, categorical, and binary data, leading to more intuitive output results. Meanwhile, it measures the relative importance of ecological factors by reducing the sum of squared deviations of response variables. Therefore, it is suitable for quantitatively analyzing the complex relationship between microbial biomass and its influencing factors.
This research employs the BRT model to quantify the relative contributions of nine ecological factors to FVC variations. These factors include annual sunshine duration, mean annual precipitation, mean annual temperature, total agro-forestry-animal husbandry-fishery output value, forestry output value, primary-secondary-tertiary industry added values, and total population. The BRT model was executed using the Dismo package in R (version 4.3.2). The learning rate was set to 0.1 and tree complexity was set to 3. In each iteration, 80% of the dataset was sampled for analysis, accompanied by 10 rounds of cross-validation. The BRT model measures the importance of factors by reducing the sum of squared deviations of response variables in the classification regression tree based on the predictor variables, and normalizes the results to make the sum of the relative importance of all predictor factors 1.0, representing the relative importance of a single predictor as a percentage. The model performance is evaluated using both the total variance of response variables and the residual variance of the model, as well as indicators such as root mean square error (RMSE), mean absolute error (MAE), and coefficient of determination (R2) between observed data and BRT prediction data.
3.1 Fractional Vegetation Cover Change Characteristics over Time
From 2000 to 2020, the FVC of the Chengdu-Chongqing urban agglomeration showed a fluctuating upward trend, with an average FVC of 0.51 and an average annual change rate of 0.58%. In 2019, the FVC was the highest at 0.57, and in 2001, it was the lowest at 0.46. The FVC value in 2020 increased by 0.10 compared to 2000. The average annual change rate was the largest from 2011 to 2012, with a value of 0.06.
During the research period, the annual FVC change trend in the Sichuan region and the Chongqing region was roughly the same. Among them, the average annual FVC in the Chongqing region was the highest at 0.51, followed by the Sichuan region at 0.50; the average interannual change rate in the Sichuan region was 0.64%, and in the Chongqing region it was 0.44%. From 2000 to 2020, the FVC in the Chongqing region increased by 0.07, with a fluctuating downward trend from 2000 to 2003 and a gradual upward trend from 2003 to 2020. In 2003–2004, the average interannual change rate in the Chongqing region reached the highest at 0.0983. From 2000 to 2020, the FVC in the Sichuan region increased by 0.12, with a fluctuating upward trend from 2009 to 2020. In 2013–2014, the average interannual change rate in the Sichuan region reached the highest at 0.08. Overall, the vegetation coverage in both the Chongqing and Sichuan regions showed an upward trend, with a greater fluctuation in the Chongqing region (Fig. 2).
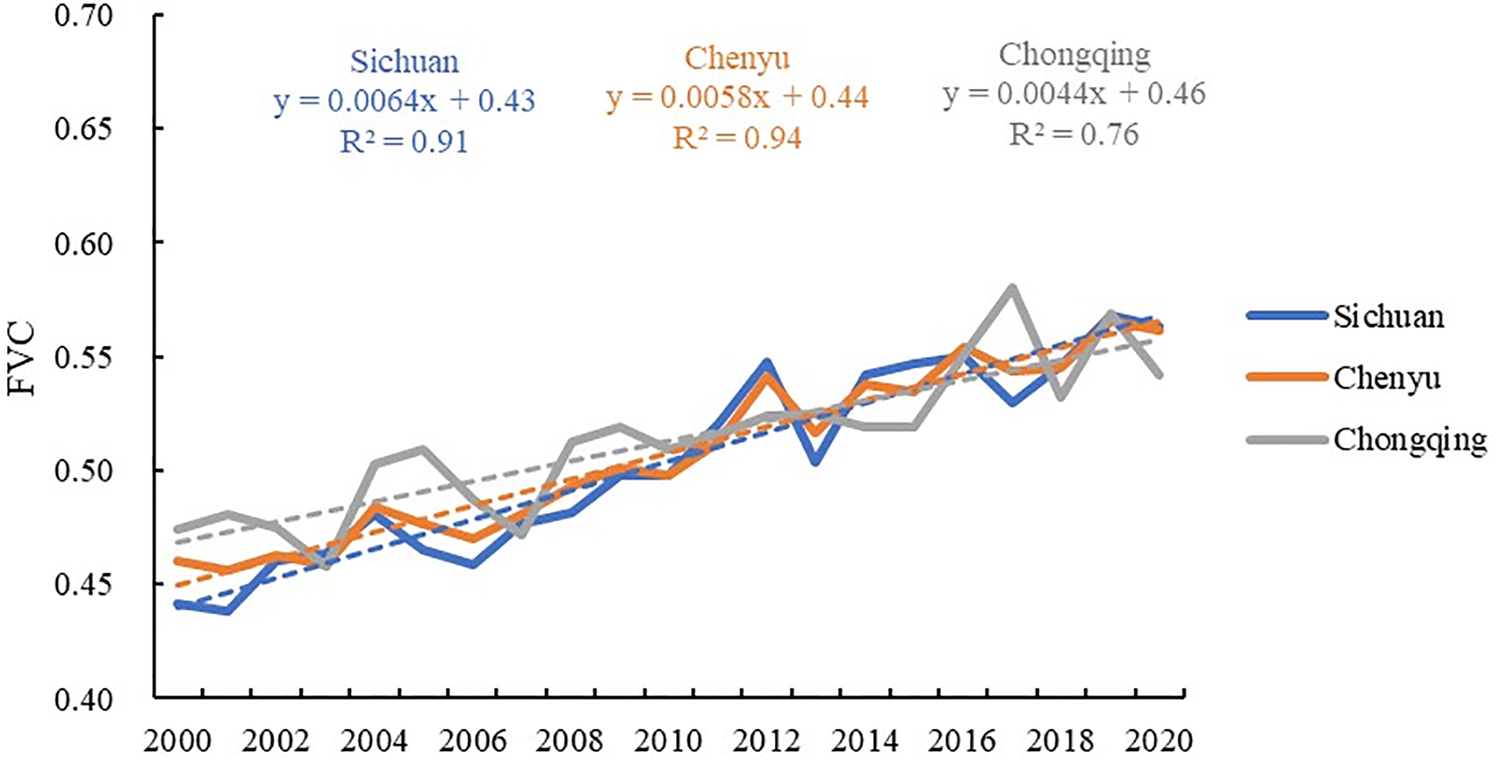
Figure 2: Annual average FVC change trends in Chengdu Chongqing urban agglomeration, Sichuan Region, and Chongqing Region
3.2 Spatial Characteristics of Fractional Vegetation Cover Change
Between 2000 and 2020, the average FVC spatial pattern of the Chengdu-Chongqing urban agglomeration had two Lower Fractional Vegetation Cover areas: the southwest of Dazhou-Guang’an-Southwest Chongqing-Nanjing-Zigong-Luzhou region, and the central-southwest of Mianyang-Deyang-Chengdu-Meishan region; and three Higher Fractional Vegetation Cover areas, namely the northern part of Mianyang City, the southern part of Ya’an-Leshan, the northwestern part of Dazhou City, and the northeastern part at the intersection with Chongqing (Fig. 3).
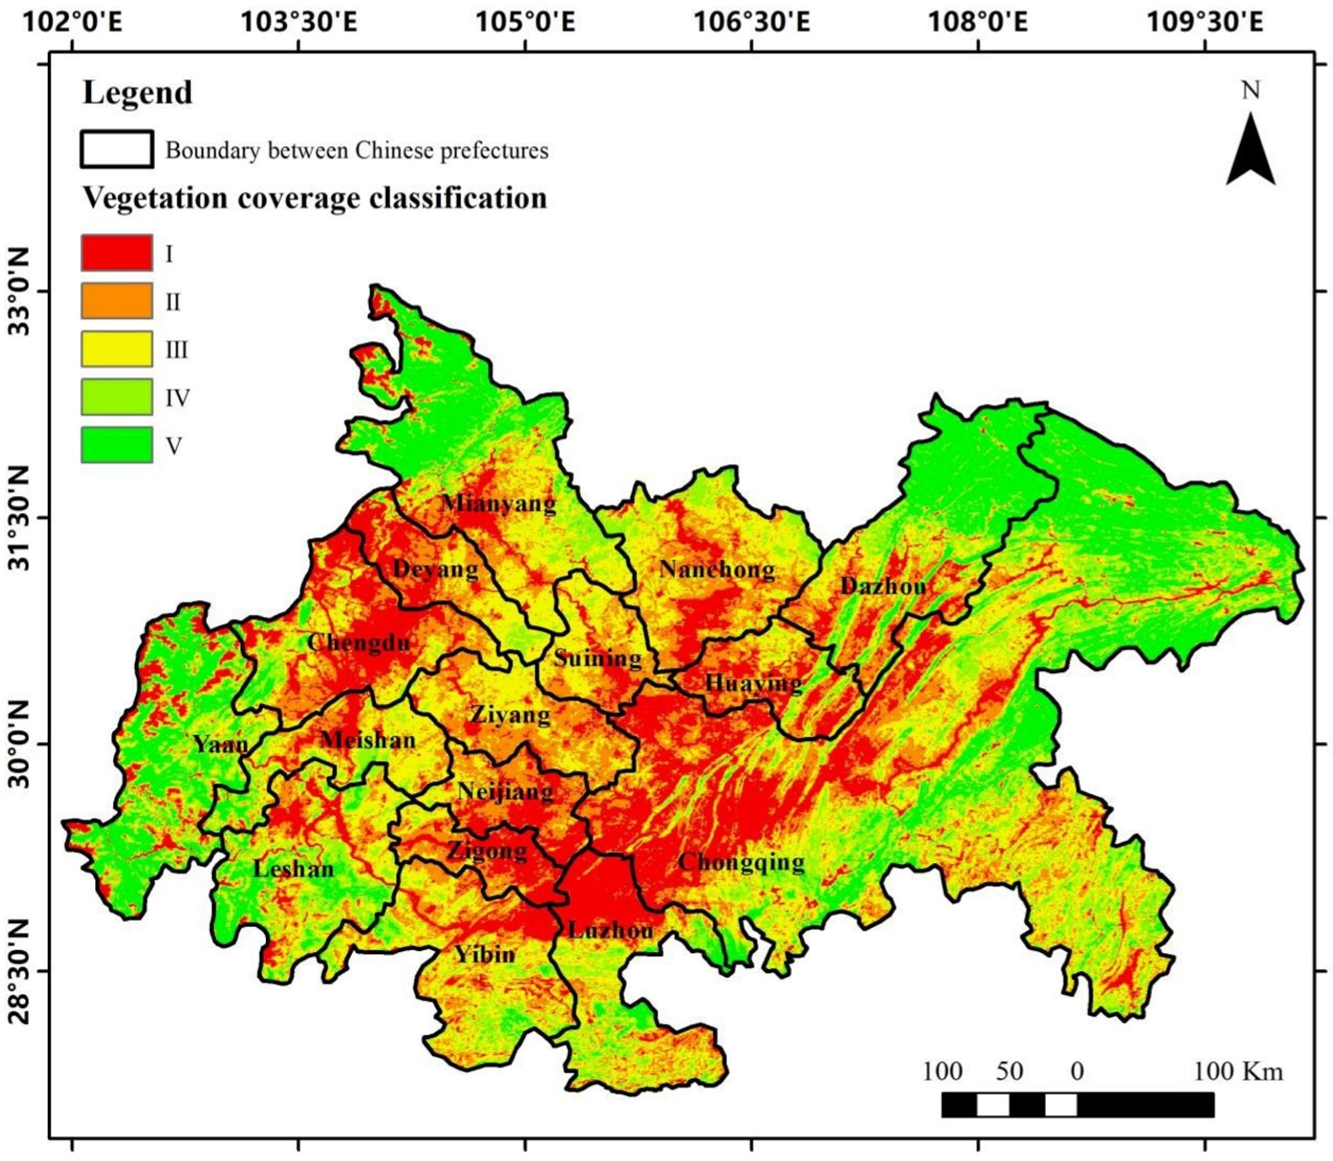
Figure 3: 21 year average FVC spatial distribution map of Chengdu Chongqing urban agglomeration; I indicates low vegetation coverage, II indicates low vegetation coverage, III represents moderate vegetation coverage, IV represents high vegetation coverage, and V represents high vegetation coverage
To better analyze the changes in the Chengdu-Chongqing urban agglomeration at the spatial scale, this study compares the annual FVC spatial pattern of the Chengdu-Chongqing urban agglomeration with a 5-year time interval (Fig. 4). From 2000 to 2021, the vegetation coverage of the Chengdu-Chongqing urban agglomeration showed a fluctuating growth trend, which can be generally divided into three stages: improvement-degradation-improvement. The first stage is from 2000 to 2005, during which the vegetation coverage area expanded, with the Yizhou, Deyang, Meishan, and Suining intersections showing an improvement trend, indicating that the ecological restoration and governance work of the Chengdu-Chongqing urban agglomeration was relatively successful during this stage. The second stage is from 2005 to 2010, during which the vegetation coverage of the urban agglomeration showed a significant degradation in the intersections of Yizhou, Deyang, Meishan, Suining, and Leshan. Referring to the historical background, this stage may have been caused by rapid urbanization and other factors. The third stage spans from 2010 to 2020, during which vegetation exhibited a gradual recovery trend, and the area of low vegetation coverage markedly decreased. Concurrently, the area of high vegetation coverage expanded, suggesting that vegetation restoration efforts yielded significant achievements over the past decade. This improvement in the ecological environment aligns with the findings reported in the literature [21].
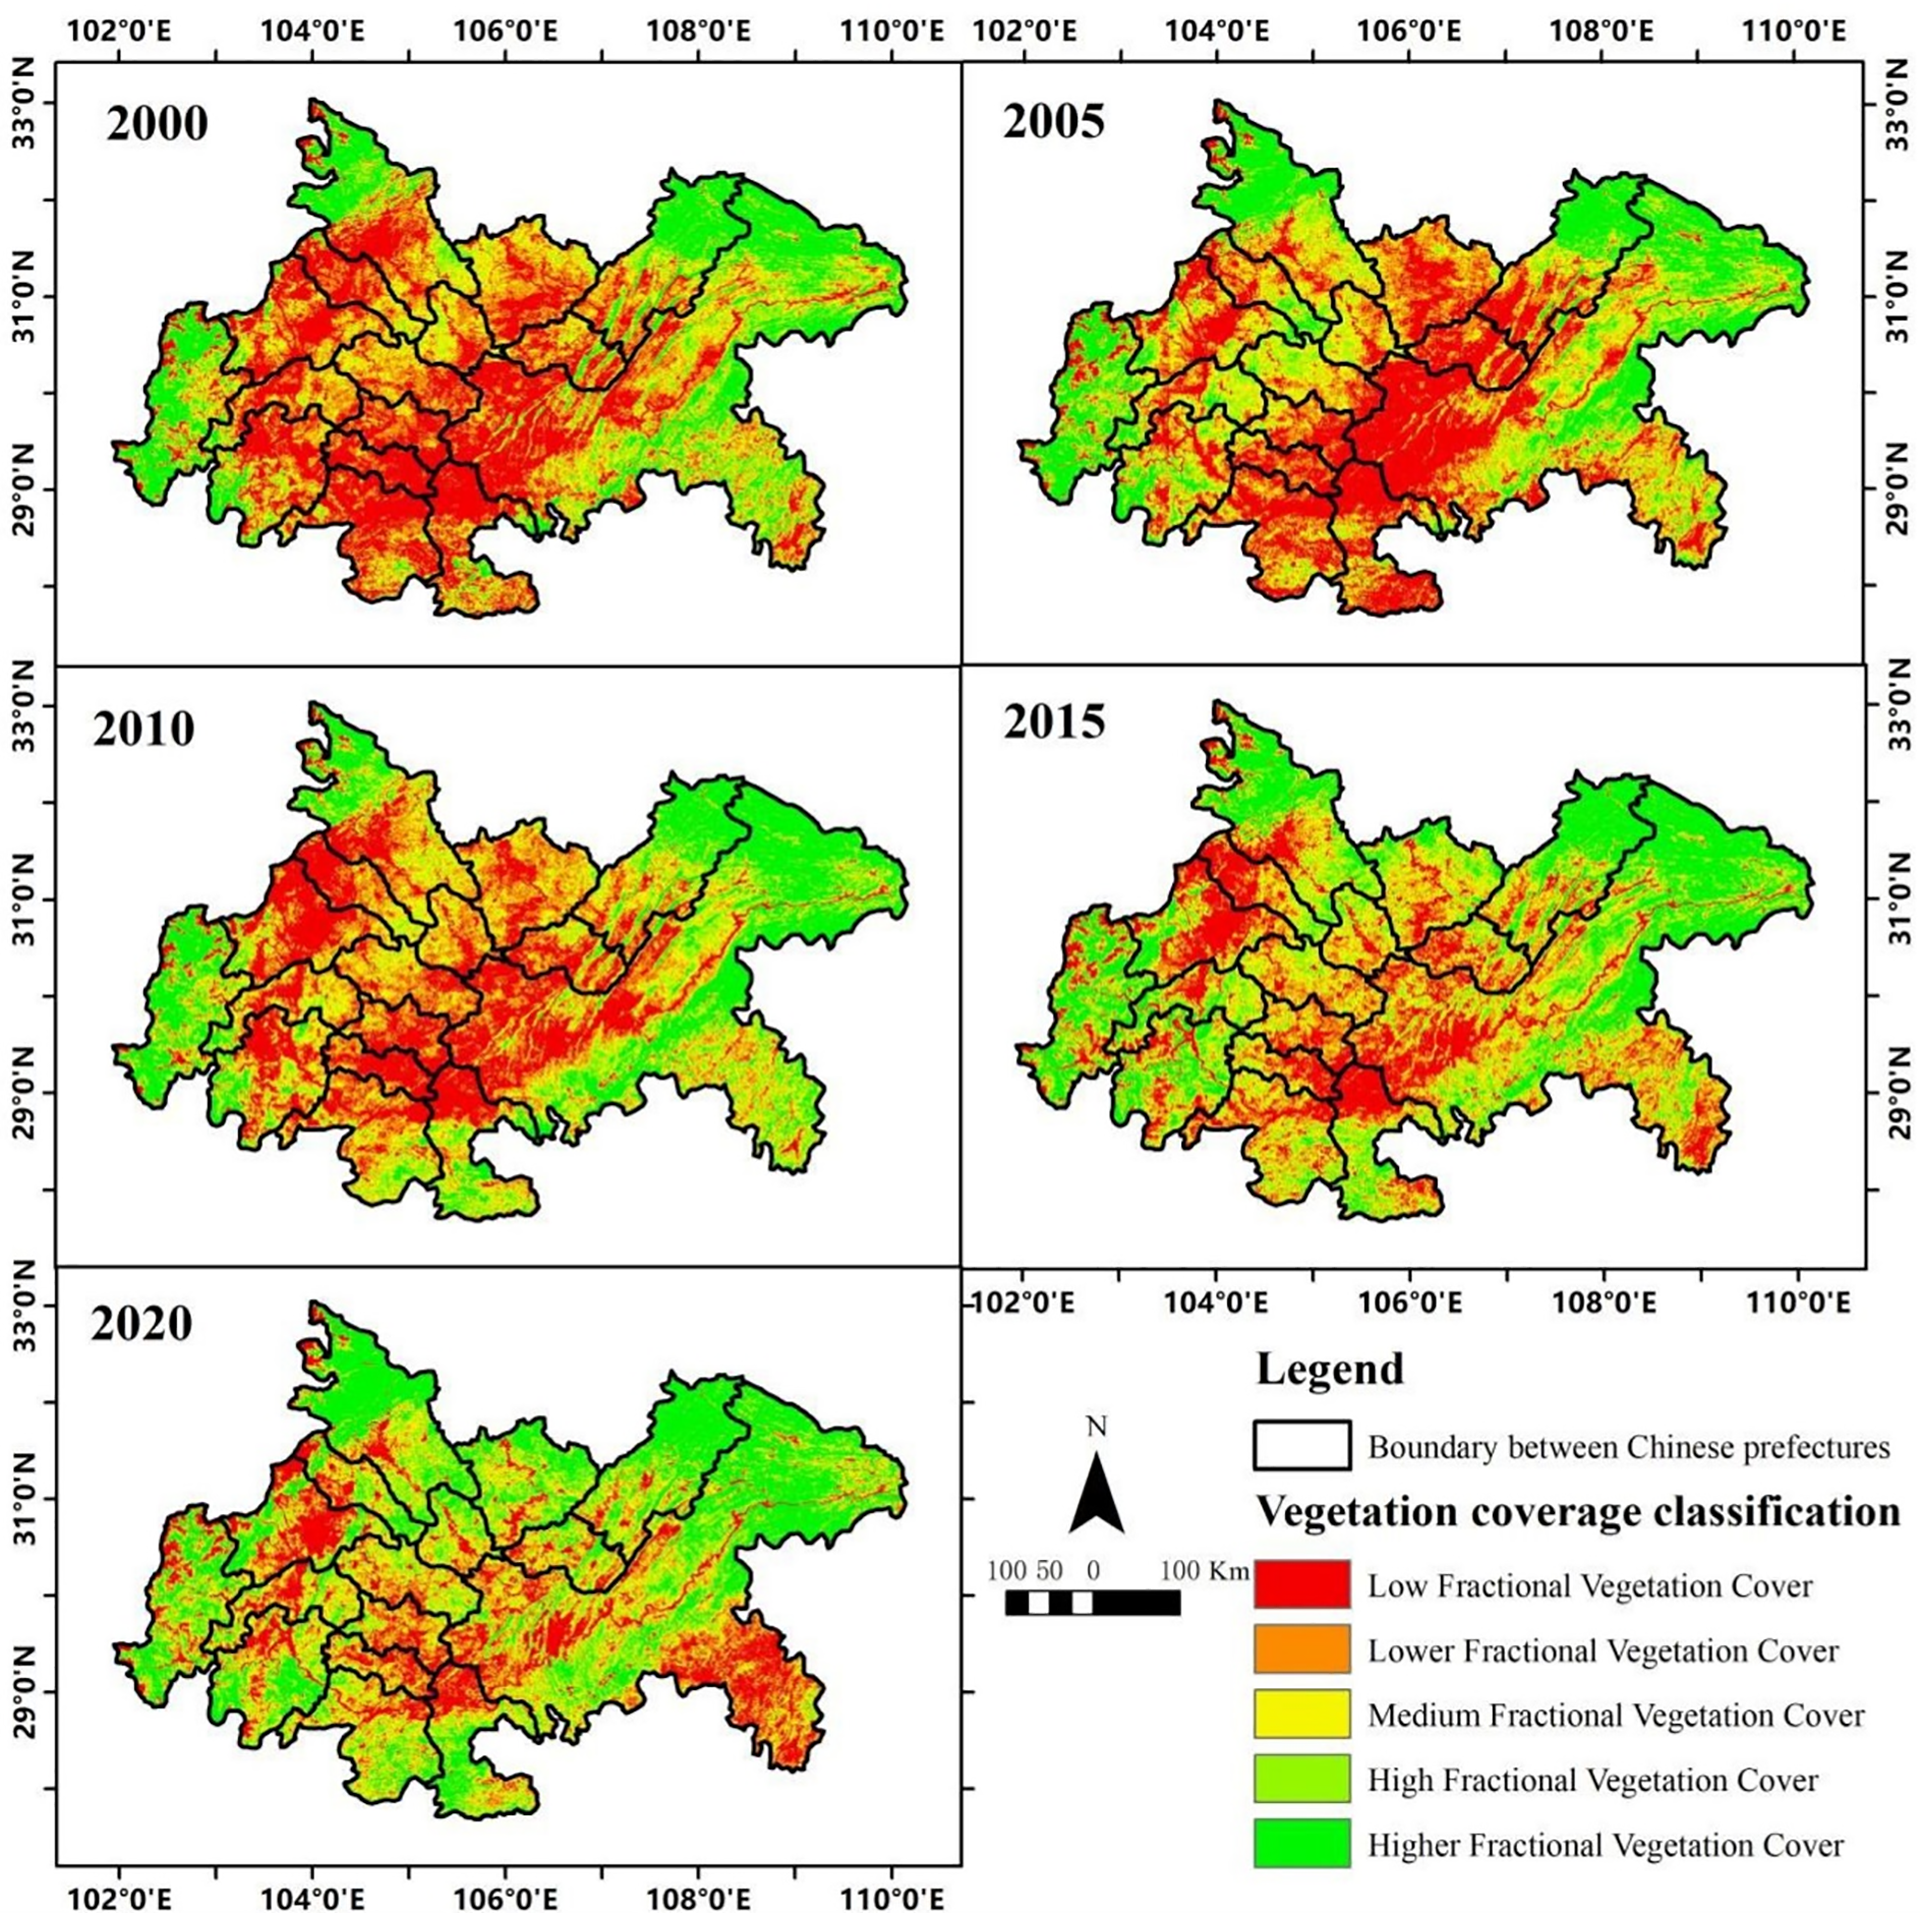
Figure 4: Changes in vegetation cover in the Chengdu Chongqing urban agglomeration from 2000 to 2020
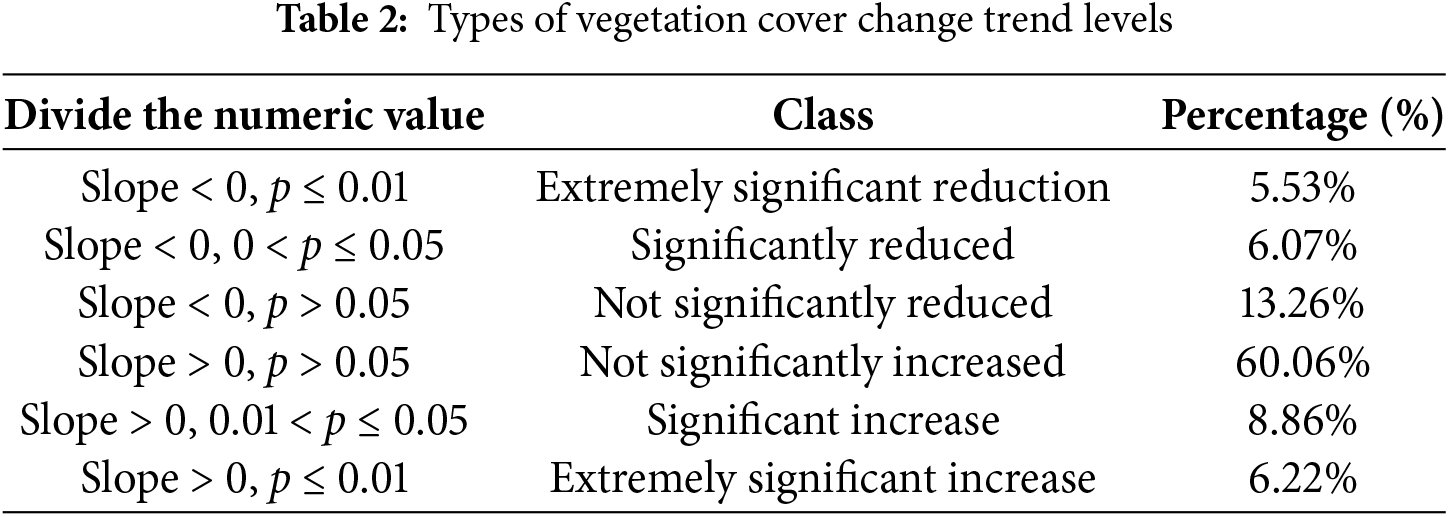
Based on the analysis of long-term time-series data from 2000 to 2020, the evolution of vegetation cover in the Chengdu-Chongqing urban agglomeration exhibited significant spatiotemporal heterogeneity (Table 2), where the slope represents the change rate—positive values indicate increases, and negative values indicate decreases. Spatially, approximately 82.18% of the study area showed no significant change in fractional vegetation cover (FVC), while areas with significant changes were highly fragmented. In the changing regions, positive evolution (vegetation increase) and negative evolution (vegetation decrease) were spatially interlaced, with the area of positive evolution (88.40%) significantly exceeding that of negative evolution (11.60%).
Specifically, areas with statistically significant vegetation increase (p < 0.01, highly significant) accounted for 6.22% of the total study area, displaying a typical point-like discrete pattern. These areas were primarily concentrated in several key regions: southeastern and central Chongqing; central Ya’an City; the contiguous zone spanning central Nanchong City, southeastern Mianyang City, southwestern Suining City, southeastern Deyang City, and Ziyang City; southern Luzhou City; and western Yibin City. Scattered occurrences were observed elsewhere.
Notably, vegetation degradation areas (highly significant decreases, 5.53% of the study area) exhibited spatial adjacency to enhancement zones. Regions with significant decreases were mainly distributed across distinct clusters: northern Mianyang City; the intersection of southeastern Mianyang City, central Nanchong City, southeastern Deyang City, and southwestern Suining City; northwestern Ziyang City; the contiguous area of northern and western Luzhou City, northern Zigong City, and southern Neijiang City; the transitional zone between central Ya’an City, southwestern Meishan City, and southern Leshan City; northwestern Dazhou City; and northern and southeastern Chongqing. This spatial coupling of degradation and enhancement suggests a dynamic balance mechanism within the regional ecosystem (Fig. 5).
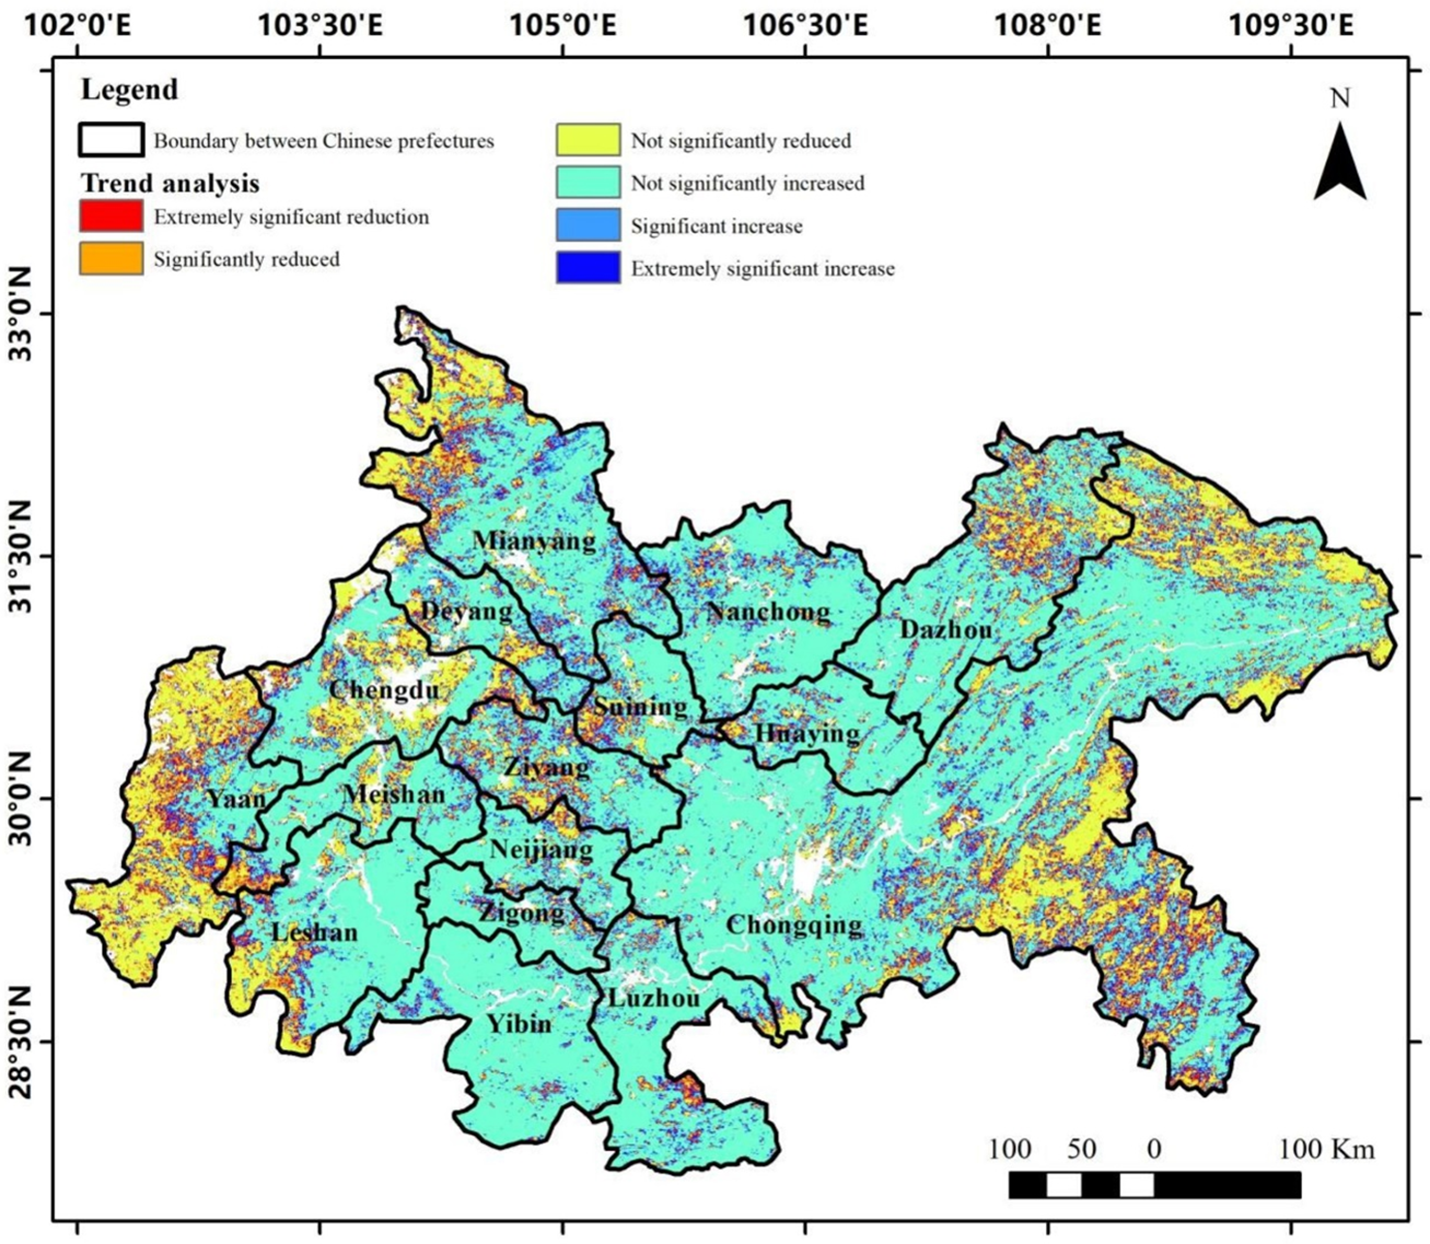
Figure 5: Vegetation change trends in the Chengdu Chongqing urban agglomeration from 2000 to 2020
3.3 Factors the Change in Fractional Vegetation Cover
Using the BRT (Boosted Regression Tree) model, this study analyzed the impacts of natural climate factors and human activity factors on fractional vegetation cover (FVC). The factor contribution rate was employed to quantify how different ecological factors influence FVC. In the Chengdu-Chongqing urban agglomeration, population growth exerted the strongest influence on FVC, accounting for 54.07% of the contribution. The relative influence of the remaining factors followed this hierarchical order: forestry added value; added value of agriculture, forestry, animal husbandry, and fishery; annual sunshine duration; annual precipitation; annual average temperature; tertiary industry added value; primary industry added value; and secondary industry added value (Fig. 6). Collectively, human activities (90.66%) had a far greater impact intensity on FVC than natural climate factors (9.34%).
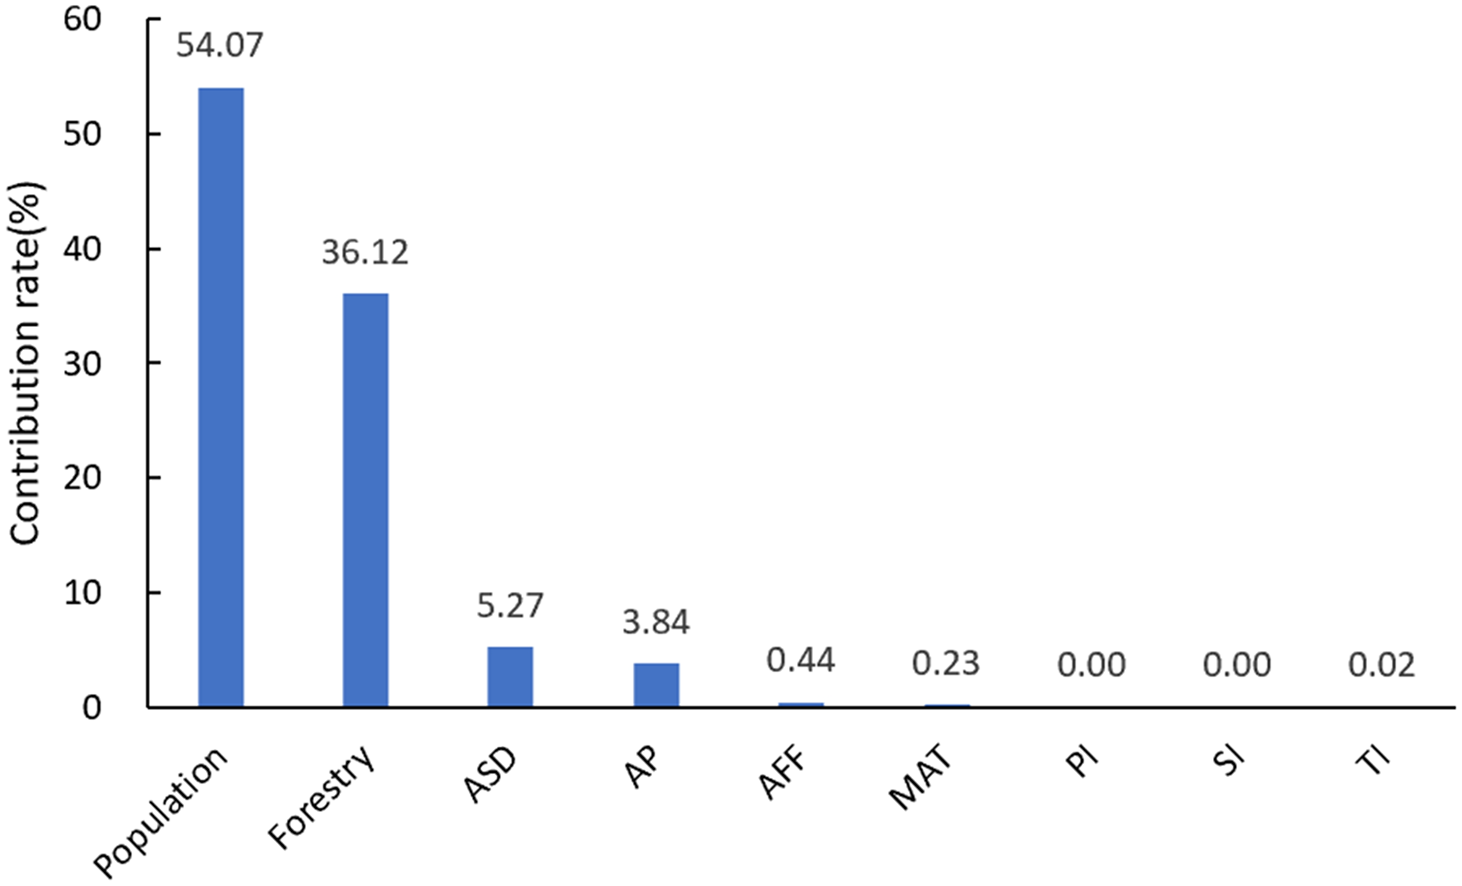
Figure 6: The impact of ecological factors on vegetation coverage in the Chengdu Chongqing urban agglomeration. ASD is Annual Sunshine Duration. AP is Annual Precipitation. AFF stands for Agriculture, Forestry and Fishing. MAT stands for Mean Annual Temperature. Primary Industry (PI) refers to agriculture, forestry, animal husbandry, fishery and related support services in China’s national accounting system. Secondary Industry (SI) in China includes mining, manufacturing, construction, and production/supply of electricity, heat, gas and water. Tertiary Industry (TI) in China covers all service activities beyond agriculture and industry, including public administration and non-profit organizations
Marginal effects can reflect the relationship between FVC and various ecological factors. The larger the marginal effect value, the greater the impact. The specific impact of each factor needs to be analyzed in combination with specific studies. In this study, the impact of categorical variables is analyzed specifically based on the size of the marginal effects, while continuous variables are based on the size of the marginal effects, looking at the overall trend of the curve. If the curve as a whole shows an upward trend, then this factor is positively correlated with the response variable, and vice versa. In terms of natural factors, annual rainfall of 1600–1700 and 1950–2050 mm has a positive impact on FVC; 1700–1950 and 2200–2450 mm have a negative impact; annual sunshine hours of 1700–2400 h have a negative impact on FVC; average annual temperature of 33.5–35.6°C has a negative impact (Fig. 7). In terms of human factors, the added value of the first and second industries has no significant impact on FVC. When the added value of the third industry is low, the vegetation coverage is good, but when the added value increases to a certain extent, FVC no longer changes; the total output value of forestry, agriculture, animal husbandry and fishery is positively correlated with FVC at a stage; the total output value of agriculture, forestry, animal husbandry and fishery generally has a positive impact on FVC, but there is a small negative impact within a certain interval.
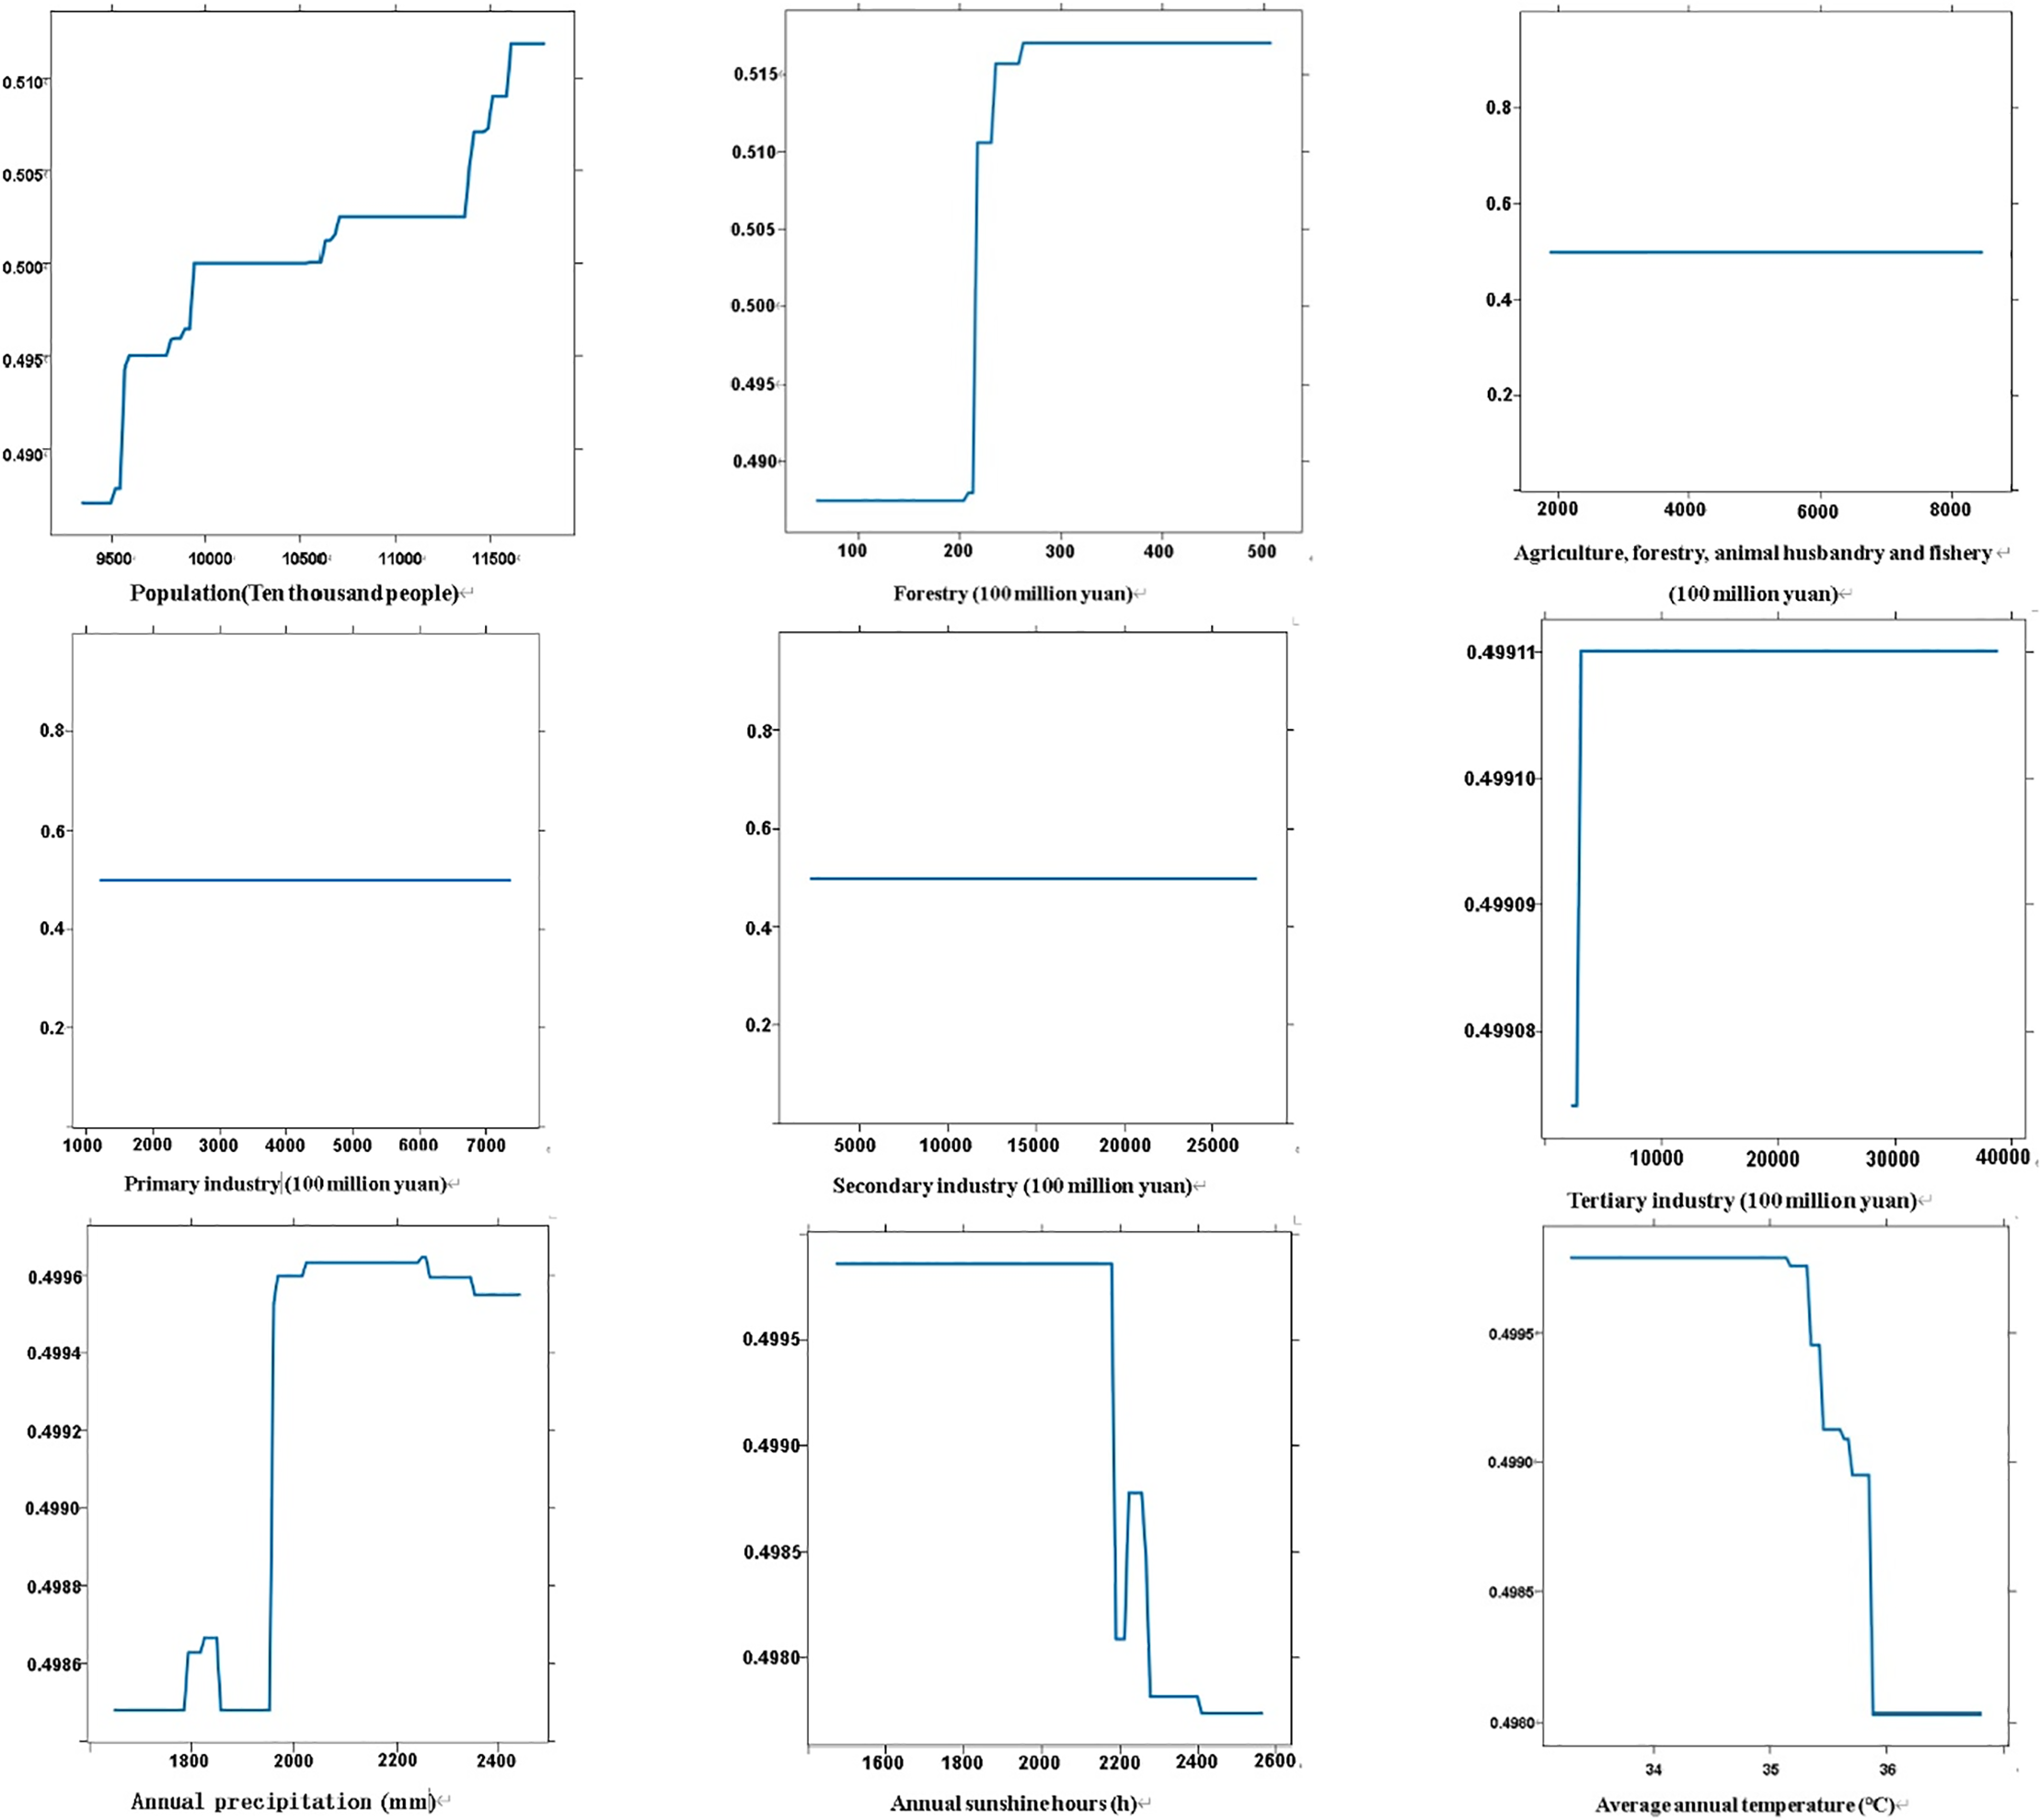
Figure 7: Marginal effect of ecological factors on vegetation coverage in the Chengdu Chongqing urban agglomeration
4.1 Spatiotemporal Variation Characteristics of Vegetation Coverage
This study reveals that from year 2000 to 2020, the Fractional Vegetation Cover (FVC) of the Chengdu-Chongqing urban agglomeration exhibited a fluctuating upward trend. This finding aligns with the overall increasing trend of the Normalized Difference Vegetation Index (NDVI) in the Chengdu-Chongqing region identified by Zhang et al. [22] for the period from 2001 to 2020. Both analyses indicate a positive trajectory in vegetation coverage within this region during the study timeframe. To further explore the average annual FVC of the Chengdu-Chongqing urban agglomeration, this article calculates an average annual FVC of 0.51 for the years spanning from 2000 to 2020, with a peak value recorded at 0.57 in 2019 and a minimum value of 0.46 observed in 2001. Notably, there was an increase in FVC by 0.10 from its value in 2000 to that in 2020. The highest interannual variation rate within this urban agglomeration occurred between 2011 and 2012, reaching a value of 0.06. Feng et al. [23], demonstrated through Landsat satellite data that China’s average urban vegetation coverage declined from 0.38 in 1990 to 0.35 in 2005 but began to increase post-2005, coinciding with the gradual implementation of national policies to expand urban green space. This general trend corroborates the findings of this study. Additionally, the Chongqing Urban and Rural Master Plan (2007–2020) emphasizes the construction of a resource-saving and environment-friendly city, with explicit focus on environmental protection that likely contributed to vegetation coverage growth. Similarly, the Chengdu Urban Master Plan (2003–2020) and Ziyang Urban Master Plan (1999–2020) prioritize the delineation of ecological protection red lines and conservation of ecological functional zones. These policy frameworks collectively explain the upward trend in vegetation coverage across the study area since 2005, which aligns with the results herein.
The average spatial distribution of FVC in the Chengdu-Chongqing urban agglomeration from 2000 to 2020 exhibited a pattern characterized by “low values in the center and high values in the surrounding areas”. Notably, three regions with high vegetation coverage were identified: northern Mianyang City, southern Ya’an-Leshan City, and northwestern Dazhou City, along with the northeastern boundary of Chongqing City. Conversely, two areas demonstrated low vegetation coverage: southwestern Dazhou-Guang’an, southwestern Chongqing-Neijiang-Zigong, northern Luzhou region, and central Mianyang-Deyang-Chengdu-Meishan central western region. In contrast, Zhou Lang et al.’s research results differ [24]; this discrepancy may be attributed to variations in research areas and data products utilized. Regarding spatial variation trends, vegetation coverage within the Chengdu-Chongqing urban agglomeration displayed an overall improvement from 2000 to 2020. Specifically, approximately 73.32% of the area showed no significant change over this period—findings that align closely with those of Zhou et al. [24]. The overarching trend reveals three distinct stages: improvement-degradation-improvement; a pattern that is corroborated by Wang et al. [25].
4.2 Driving Factors of Vegetation Coverage Changes
At present, there are many studies on the vegetation status of the Chengdu-Chongqing economic circle, but there is a lack of analysis on the impact of various driving factors on vegetation coverage using enhanced regression trees. This study takes vegetation coverage as the research object, based on long-term MOD13A1 image data of the Chengdu-Chongqing economic circle, and uses Google’s recently developed GEE cloud platform to study the vegetation coverage of the Chengdu Chongqing urban agglomeration. At the same time, this study selected three natural climate factors, namely annual precipitation, annual sunshine duration, and annual average temperature, as well as six human activity factors, namely added value of the first, second, and third industries, total output value of agriculture, forestry, animal husbandry, and fishery, total output value of forestry, and total population, for BRT model analysis.
This study quantified the driving mechanisms behind changes in FVC within the Chengdu-Chongqing economic circle using an BRT model. The findings indicate that human activities account for 90.66% of the variations, significantly surpassing natural climate factors, which contribute only 9.34%. Specifically, key human drivers include total population (27.3%), total forestry output value (19.8%), and the added value from agriculture, forestry, animal husbandry, and fishery sectors (15.2%). Although urbanization has led to the expansion of construction land at the expense of ecological space, various ecological policies—such as reforestation initiatives and delineating ecological red lines—have effectively enhanced vegetation coverage in major urban areas as well as in ecological protection zones like Ya’an and Leshan. In contrast, the influence of the tertiary industry on FVC is comparatively weaker at 5.1%, when juxtaposed with primary and secondary industries contributing 4.3% and 3.9%, respectively; notably low coverage areas in southwestern Dazhou are associated with extensive agricultural practices and coal mining activities. Among natural climate factors, annual precipitation exerts a more substantial impact on FVC (8.7%) than temperature (6.5%) or sunshine duration (9.1%). The eastern region of Dazhou benefits from uniform precipitation conducive to broad-leaved forest growth; meanwhile, vegetation recovery in Chengdu Plain relies on “synchronized rain and heat”. Conversely, Mianyang’s northern area experiences insufficient sunlight but ample precipitation due to terrain cover while maintaining high vegetation coverage. The rebound in FVC observed post-2005 is closely linked to national ecological policies coupled with technological advancements; for instance, Chongqing’s “Mountains, Rivers, Forests, Fields, Lakes, and Grasslands” project has resulted in an average annual increase of 0.8% in FVC across degraded regions surrounding its main city. The construction of Chengdu’s “Park City” has improved the coverage of the central urban area through three-dimensional greening, but industrial cities such as Neijiang and Zigong have lagged behind in recovery due to insufficient ecological investment [26]. In summary, the changes in vegetation cover in Chengdu Chongqing are the result of the synergistic effect of natural resilience and human regulation, and it is necessary to strengthen the “human land coordination” policy to maintain ecological resilience [21–23].
Based on the Google Earth Engine cloud platform, this study explored the temporal and spatial changes and trends of vegetation cover in the Chengdu-Chongqing urban agglomeration from 2000 to 2020, and studied the impact and marginal effects of different ecological factors on the vegetation cover in the region through the BRT model.
(1) Over the nearly two-decade period from year 2000 to 2020, vegetation coverage in the Chengdu-Chongqing urban agglomeration exhibited a consistently fluctuating upward trend (r2 = 0.94), with an average annual interannual change rate of 0.0058. The dynamics of vegetation coverage can be broadly divided into two phases: a stable stage from year 2000 to 2003, followed by a sustained increasing stage from year 2003 to 2020.
(2) Overall, during the study period, there was no significant change in vegetation coverage in most areas of the Chengdu Chongqing urban agglomeration, accounting for 73.32% of the region. In other regions, vegetation degradation and vegetation improvement are intermingled, with vegetation coverage improvement showing a point like distribution, accounting for 15.08% of the area, and significant degradation only accounting for 11.60%.
(3) The vegetation cover of the Chengdu-Chongqing urban agglomeration was mainly affected by four factors: population, forestry, annual sunshine time and annual precipitation, with a total contribution rate of 99.31%. The influence of human activity factors on vegetation cover in this region is much greater than that of natural factors.
Acknowledgement: The author thanks the editor and reviewers for their review and suggestions.
Funding Statement: This work was supported by the Sichuan Science and Technology Program (Grant No. 2023NSFSC0250).
Author Contributions: The authors confirm contribution to the paper as follows: Wuyi Zhu conducted MODIS data collection and processing on the GEE platform, validated and analyzed the data, and drafted a manuscript. Meng Zou developed an enhanced regression tree model and edited the manuscript. Wenji Liu conducted a temporal analysis and edited the manuscript. Linlin Cui guided and supervised the analysis and model development, and drafted and edited the manuscript. All authors reviewed the results and approved the final version of the manuscript.
Availability of Data and Materials: The data that support the findings of this study are available from the Corresponding Author, Linlin Cui, upon reasonable request.
Ethics Approval: Not applicable.
Conflicts of Interest: The authors declare no conflicts of interest to report regarding the present study.
References
1. Cui LL, Chen YH, Yuan Y, Luo Y, Huang SQ, Li GS. Comprehensive evaluation system for vegetation ecological quality: a case study of Sichuan ecological protection redline areas. Front Plant Sci. 2023;14:1178485. doi:10.3389/fpls.2023.1178485. [Google Scholar] [PubMed] [CrossRef]
2. Zoungrana BJB, Conrad C, Thiel M, Amekudzi LK, Da ED. MODIS NDVI trends and fractional land cover change for improved assessments of vegetation degradation in Burkina Faso, West Africa. J Arid Env. 2018;153(38):66–75. doi:10.1016/j.jaridenv.2018.01.005. [Google Scholar] [CrossRef]
3. Lamchin M, Park T, Lee JY, Lee WK. Monitoring of vegetation dynamics in the mongolia using MODIS NDVIs and their relationship to rainfall by natural zone. J Indian Soc Remote Sens. 2015;43(2):325–37. doi:10.1007/s12524-014-0366-8. [Google Scholar] [CrossRef]
4. Wang X, Zhang X, Feng X, Liu S, Yin L, Chen Y. Trade-offs and synergies of ecosystem services in Karst area of China driven by grain-for-green program. Chin Geogr Sci. 2020;30(1):101–14. doi:10.1007/s11769-020-1098-z. [Google Scholar] [CrossRef]
5. Kong DD, Zhang Q, Singh VP, Shi PJ. Seasonal vegetation response to climate change in the Northern Hemisphere (1982–2013). Glob Planet Change. 2017;148(25):1–8. doi:10.1016/j.gloplacha.2016.10.020. [Google Scholar] [CrossRef]
6. Gao JS, Yang JY. Increases in vegetation cover increase response more to climate change than to human activities in the Baiyangdian watershed. Env Res Commun. 2025;7(2):025001. doi:10.1088/2515-7620/ad9816. [Google Scholar] [CrossRef]
7. Shi H, Yang J, Liu QJ, Li TH, Chen NC. Impacts of climate and land-use change on fraction vegetation coverage based on PLUS-Dimidiate pixel model. Sustainability. 2024;16(23):10430. doi:10.3390/su162310430. [Google Scholar] [CrossRef]
8. Shi XY, Yang HB, Chen YW, Liu RF, Guo TF, Yang LL, et al. Research on estimating potato fraction vegetation coverage (FVC) based on the vegetation index intersection method. Agronomy. 2024;14(8):1620. doi:10.3390/agronomy14081620. [Google Scholar] [CrossRef]
9. Mao ZJ, Wang MN, Chu JW, Sun JW, Liang W, Yu HY. Feature extraction and analysis of reclaimed vegetation in ecological restoration area of abandoned mines based on hyperspectral remote sensing images. J Arid Land. 2024;16(10):1409–25. doi:10.1007/s40333-024-0109-9. [Google Scholar] [CrossRef]
10. Yang H, Xiong M, Yao YX. MODIS-based spatiotemporal inversion and driving-factor analysis of cloud-free vegetation cover in Xinjiang from 2000 to 2024. Sensors. 2025;25(8):2394. doi:10.3390/s25082394. [Google Scholar] [PubMed] [CrossRef]
11. Xiao JY, Wang SJ, Bai XY, Zhou DQ, Tian YC. Determinants and spatial-temporal evolution of vegetation coverage in the karst critical zone of South China. Acta Ecol Sin. 2018;38(24):8799–812. doi:10.5846/stxb201805061010. [Google Scholar] [CrossRef]
12. Chen CN, Zhu LQ, Tian L, Li XG. Spatial-temporal changes in vegetation characteristics and climate in the Qinling-Daba Mountains. Acta Ecol Sin. 2019;39(9):3257–66. doi:10.5846/stxb201801300252. [Google Scholar] [CrossRef]
13. Lu H, Fan YW, Jiao LD, Wu Y. Assessment and spatial effect of urban agglomeration business environments: a case study of two urban agglomerations in China. Socio-Econ Plan Sci. 2024;92(3):101827. doi:10.1016/j.seps.2024.101827. [Google Scholar] [CrossRef]
14. Zhao XY, Tan SC, Li YP, Wu H, Wu RJ. Quantitative analysis of fractional vegetation cover in southern Sichuan urban agglomeration using optimal parameter geographic detector model. China Ecol Indic. 2024;158(2):111529. doi:10.1016/j.ecolind.2023.111529. [Google Scholar] [CrossRef]
15. Li WJ, Kang JW, Wang Y. Spatiotemporal changes and driving forces of ecological security in the Chengdu-Chongqing urban agglomeration, China: quantification using health-services-risk framework. J Clean Prod. 2023;389(3):136135. doi:10.1016/j.jclepro.2023.136135. [Google Scholar] [CrossRef]
16. Zhang KW, Zhang Q, Singh VP. Temporal dynamics of fractional vegetation cover in the Yellow River basin: a comprehensive analysis. Remote Sens. 2024;16(16):2991. doi:10.3390/rs16162991. [Google Scholar] [CrossRef]
17. Liu ZH, Bi HX, Zhao DY, Guan N, Wang N, Song YL. Determination of fractional vegetation cover threshold based on the integrated synergy-supply capacity of ecosystem services. Forests. 2025;16(4):587. doi:10.3390/f16040587. [Google Scholar] [CrossRef]
18. Xu Y, Guo ZD, Zeng ZW, Dai QY, Zhao C, Huang WT. Spatio-temporal variation and multi-dimensional detection of driving mechanism of PM2.5 concentration in the Chengdu-Chongqing urban agglomeration from 2000 to 2021. Env Sci. 2023;44(7):3724–37. (In Chinese). doi:10.13227/j.hjkx.202207276. [Google Scholar] [PubMed] [CrossRef]
19. Shaziayani WN, Ul-Saufie AZ, Ahmat H, Al-Jumeily D. Coupling of quantile regression into boosted regression trees (BRT) technique in forecasting emission model of pm10 concentration. Air Qual Atmos Health. 2021;10(14):1647–63. doi:10.1007/s11869-021-01045-3. [Google Scholar] [CrossRef]
20. Li XY, Sun AZ, Yang YP, Zhang DL, Wu SS. Modern pollen-vegetation coverage relationships and its application for Holocene vegetation reconstructions in the central Tianshan Mountains. Palaeogeogr Palaeocl. 2024;635(3–4):111963. doi:10.1016/j.palaeo.2023.111963. [Google Scholar] [CrossRef]
21. Xue FY, Wang X, Qing LX, Su ZX, Yang CJ. Urban expansion and vegetation changes in built-up areas in Chengdu-Chongqing area from 2001 to 2020. J Sichuan Sci Technol. 2024;45(1):23–32. (In Chinese). [Google Scholar]
22. Zhang Y, Zhang LQ, Wang JY, Dong GC, Wei YL. Quantitative analysis of NDVI driving factors based on the geographical detector model in the Chengdu-Chongqing region. China Ecol Indic. 2023;155(1):110978. doi:10.1016/j.ecolind.2023.110978. [Google Scholar] [CrossRef]
23. Feng F, Yang X, Jia BQ, Li XT, Li XW, Xu C, et al. Variability of urban fractional vegetation cover and its driving factors in 328 cities in China. Sci China Earth Sci. 2024;67(2):466–82. doi:10.1007/s11430-022-1219-2s. [Google Scholar] [CrossRef]
24. Zhou L, Zhu L, Lei B. Study on spatiotemporal changes of vegetation coverage and terrain differentiation characteristics in Chengdu-Chongqing twin cities economic circle from 2000 to 2023 based on MODIS pixel scale. Env Impact Asses. 2024;46(6):69–77. (In Chinese). doi:10.14068/j.ceia.2024.06.012. [Google Scholar] [CrossRef]
25. Wang JY, Fan YF, Yang Y, Zhang LQ, Zhang Y, Li SX, et al. Spatial-temporal evolution characteristics and driving force analysis of NDVI in the Minjiang River Basin. Water. 2020;14(18):2923. (In Chinese). doi:10.3390/w14182923. [Google Scholar] [CrossRef]
26. Xin Y, Sun MX, Zhang Y, Zhong DJ, Yang CJ. Spatiotemporal characteristics of vegetation cover and climate driving factors in Sichuan Province from 2000 to 2020. Bull Soil Water Conserv. 2022;42(4):312–9. (In Chinese). doi:10.13961/j.cnki.stbctb.2022.04.039. [Google Scholar] [CrossRef]
Cite This Article
 Copyright © 2025 The Author(s). Published by Tech Science Press.
This work is licensed under a Creative Commons Attribution 4.0 International License , which permits unrestricted use, distribution, and reproduction in any medium, provided the original work is properly cited.
 Downloads
 Citation Tools