
 Submit a Paper
 Propose a Special lssue
 Open Access
ARTICLE

A New Quantitative Entropic Method for Exploring the Urban Sprawl Mechanism: Taking Beijing as an Example
1 College of Public Administration, Nanjing Agricultural University, Nanjing, 210095, China
2Linyi City Natural Resources and Planning Bureau, Linyi, 276000, China
* Corresponding Author: Penghui Jiang. Email:
Revue Internationale de Géomatique 2025, 34, 461-485. https://doi.org/10.32604/rig.2025.065814
Received 21 March 2025; Accepted 30 June 2025; Issue published 29 July 2025
 View Full Text
 Download PDF
Abstract
Urban sprawl affects the sustainable development of the world’s economy and society. Confirming urban sprawl trends and proposing countermeasures have received significant attention. Cities are self-organizing systems with dissipative attributes, and city development is accompanied by urban entropy changes. Urban entropy change reveals the essence of urban sprawl; thus, it can be used to measure urban sprawl and better understand its phenomena. However, the literature on entropy change in urban sprawl research is limited to qualitative descriptions, and no convenient or effective quantitative metrics exist. This study bridges entropy changes and urban form metrics, analyzing the driving forces in Beijing as a demonstration case. The main contributions and results are as follows: (1) A new method was constructed to confirm compact or sprawling urban form development. (2) This research shows that the essence of urban sprawl is urban form distortions in an urban self-organizing system resulting from dominant driving forces. (3) This research also shows that urban development with general sprawl characteristics is accompanied by temporally fine-grained compact urban development, and the empirical results show that the urban development state paradigm was neither sprawl nor compact. In future urban management work, it is necessary to regularly monitor changes in various driving factors to prevent urban entropy increases and formulate or adjust urban development plans based on effective assessments. This study contributes by developing a new universal analysis tool and exploring the urban sprawl mechanism, with potential application scenarios that can be extended to any city or region worldwide.Keywords
Supplementary Material
Supplementary Material FileIn today’s world, urban sprawl has become a worldwide phenomenon, particularly in the process of urbanization [1–4]. To date, urban sprawl lacks a uniform definition but is generally understood as a low-density land use model involving a population shift to the suburbs, the expansion of built-up land in a disorderly and fragmented manner, and the adverse impacts on natural resources and the ecological environment [5–9].
Global urbanization continues to advance, and the urban sprawl phenomenon continues to intensify [10,11]. By 2050, approximately 68% of the world’s population will live in urban areas, and China’s urban population will reach 255 million [1]. From 2008 to 2018, China’s urban population increased by 30.36%, while the urban built-up area increased by 54.91% [12]. China’s urbanization deepens owing to the urban form as an outcome of urbanization [13]. Therefore, urban landscapes tend to be homogeneous and fragmented, accompanied by serious demographic and environmental problems [14]. It is imperative to solve the problem of urban sprawl.
A city is an enormous self-organizing system with dissipation properties metabolized through entropy changes [15]. The metabolic function must act on the urban form, known as urban form dependence [13]. Therefore, monitoring urban form changes can help detect urban entropy changes. In this study, urban entropy is conceptualized as the degree of spatial disorder within an urban system, drawing on principles from thermodynamics and information theory. It quantifies the complexity and irregularity of urban land-use configurations. Higher urban entropy typically indicates more fragmented and scattered development—commonly associated with sprawl—whereas lower entropy reflects compact and orderly spatial structures. This definition enables entropy to function as a theoretical and computational bridge between urban self-organization processes and observable morphological dynamics.
In the present literature, entropy change theory is mostly used to quantitatively describe urban equilibrium attributes. However, it is limited to descriptive explanations (see Section 1.1) because there remains a lack of quantitative methods to bridge entropy change and urban sprawl. This study attempts to address this aspect, with Beijing chosen as the case city.
Urban sprawl metrics vary by study content, researcher habits and value orientations, and country. Therefore, no unanimous conclusions can be drawn. In the early stages, urban sprawl research relied on single morphological indicators such as population density, built-up area or built-up density, and landscape metrics [16–20]. However, a follow-up study found that low density is not an essential or inevitable characteristic of urban sprawl in developing countries such as China, India, and Mexico [21]. The limitations of either built-up area or built-up density cannot describe urban form changes, and landscape metrics have difficulty reflecting internal urban spatial differences [6,22].
As research has progressed, scholars have begun to use multi-indicator methods to evaluate the degree of urban sprawl [1,18–21]. Galster et al. pioneered research on urban sprawl based on eight dimensions: land use density, continuity, concentration, and aggregation [20]. Yue et al. used the comprehensive sprawl index, economic efficiency, spatial form, and population density to assess the urban sprawl degree of 106 key cities in China [1]. Moreover, Jiang used 13 indices to study the urban sprawl in Beijing from three aspects: urban sprawl form, urban sprawl efficiency, and urban sprawl impact [6]. Yang et al. used seven indices to quantify and study the spatiotemporal patterns of urban sprawl from 1985 to 2013 in Beijing [23]. Hu et al. studied the close connection between urban-land expansion and farmland loss using six indices, including urban expansion intensity [24]. Jiang et al. employed kernel density estimation (KDE) and other indices to investigate the differences in the internal composite structure during urban built-up land sprawl [25]. Bhatta et al. discussed the ambiguity of the sprawl concept and reviewed various measurement techniques based on remote sensing data [26]. However, causality and correlation among different metrics always exist; these different metrics may often result in contradictory conclusions [27].
1.2 Entropy Methods Progress in Urban Sprawl Research
Entropy change is a substantive characteristic of large self-organizing systems [28]. Owing to urban form dependency [13], entropy change in a city must be accompanied by urban form change. Bridging entropy and urban form changes provides an avenue for researchers to understand the urban sprawl phenomena. Dietzel et al. divided urban development into compact and sprawl states and described it as a process of dynamic oscillations between the two states under the action of multiple driving forces [29,30]. Wang et al. developed the entropy change formula (Eq. (1) in Section 2.1) to qualitatively elaborate the game process among different urban development driving forces. Additionally, they suggested that comprehensive action could lead to urban structural changes that include urban forms [15]. Shannon’s entropy provided a new approach for measuring urban sprawl [31] and was considered a gate connecting entropy change and urban development; however, its limitation in describing the degree of spatial expansion is obvious [22]. Based on binary entropy, Chen et al. developed the spatial expansion degree index (SEDI) to measure urban sprawl degrees, which has an evident advantage over other commonly used measures [22]. However, the SEDI building process does not consider the relationship between urban entropy changes and urban form measurements.
This paper aims to construct a new analytical framework that bridges the entropy theory and urban morphological metrics, to better understand urban sprawl. By extending the SEDI with entropy-based dynamics, we provide a novel tool that enables both spatial pattern quantification and driving force interpretation. Although many researchers have investigated urban sprawl using entropy-based approaches [32,33], our study offers three distinct innovations beyond existing work:
1. A formalized entropy framework is proposed, linking thermodynamic entropy principles with morphological transformations through the SEDI. This transition from descriptive entropy to a dynamic causal model enables explicit representation of cyclical sprawl mechanisms.
2. The Boosted Regression Tree algorithm is introduced to capture temporal shifts in the relative influences of socioeconomic and geographical factors. This approach moves beyond static correlations and allows identification of stage-specific dominant factors across the urban evolution timeline.
3. A new interpretation of morphological dynamics is proposed, emphasizing the cyclicality of urban form. Based on refined spatiotemporal entropy trajectories, the analysis reveals a recurrent “compact–sprawl–compact” pattern, providing a more granular alternative to dichotomous evolutionary models.
The remainder of this paper is organized as follows. Section 2 builds the entropic model and introduces SEDI. Section 3 details the study area, data, and preprocessing procedures. Section 4 presents the spiral trends of urban development in Beijing and analyzes the dominant influencing factors. Section 5 reflects on the implications of the findings and the utility of the entropic approach. Section 5.4 summarizes key insights and provides future directions.
The specific aims of this study are threefold. First, we aim to construct a novel entropy-based quantitative model—SEDI—that bridges urban morphological metrics with thermodynamic entropy to better characterize the spatial structure of urban sprawl. Second, we seek to apply machine learning techniques BRT, to disentangle and quantify the stage-specific driving forces behind urban expansion. Third, we endeavor to explore the dynamic evolution of urban form in Beijing from 1980 to 2020, highlighting the shift between sprawl and compact phases and revealing the cyclical nature of urban spatial restructuring.
In a self-organizing system, positive incentive factors lead to entropy accumulation and negative entropy reduction, and the game results cause city development fluctuations [15]. Simultaneously, negatively oriented city development, including urban sprawl, is attributed to mismatches among various driving factors [15]. Thus, the above theory provides a basis for bridging entropy change and urban spending degree. To satisfy the former, the entropy change formula is first developed, followed by the introduction of the SEDI [22].
2.1 Developing the Entropy Change Formula
We develop an entropy change formula [15] to discuss the game process among the different urban development driving forces.
2.2 Introducing the Spatial Expansion Degree Index (SEDI)
The SEDI [22] is introduced as follows:
where n is the number of subzones and
where
When the situation of
2.3 Bridge Entropy Change and Urban Sprawl Measurement
Due to SEDI,
The greater the value of SEDI, the greater the urban sprawl degree; thus, we take the change value of SEDI as positive in Eq. (8). Therefore, the bridging entropy change and SEDI are expressed as follows:
where
From Eq. (8) and Fig. 1,

Figure 1: Relationship between urban development and
In practical terms, entropy in an urban context can be interpreted as the level of spatial disorder in land use patterns. A city with a compact and continuous structure tends to have lower entropy, while one that is sprawling and fragmented reflects higher entropy. The SEDI index, which measures the degree of spatial expansion and dispersion, captures this variation. Therefore, a higher SEDI value indicates a more disordered urban form and thus corresponds to a larger entropy change. This understanding provides an intuitive link between the thermodynamic concept of entropy and the spatial dynamics of urban sprawl.
2.4 Analysis Methods for Urban Expansion Drivers
2.4.1 The Landscape Expansion Index (LEI) for Urban Expansion Pattern Identification
To quantitatively describe the spatial expansion morphology of built-up land, the LEI is employed to identify its expansion patterns.
A0 represents the overlapping area between the buffer zone (set at a distance of 1 m) of the newly added built-up land patches and the original built-up land. Contrastingly, AV represents the overlapping area between the buffer zone and the non-built-up land. According to the LEI value, the expansion patterns can be classified into three types: Leapfrog (LEI = 0), Edge-expansion (0 < LEI ≤ 50), and Infilling (50 < LEI ≤ 100).
The landscape gradient analysis method can effectively reflect dynamic changes in urban landscape patterns. This study adopts the gradient belt analysis method. Taking Tiananmen Square in the city center of Beijing as the origin, 16 equidistant radial gradient belts are established outward, with a distance of 5 km between each gradient belt. This is used to study the variation patterns of built-up land along the urbanization gradient. Meanwhile, Fragstats 4.2 was utilized to calculate the landscape pattern indices within each gradient belt.
2.4.3 Machine Learning Methods
Machine learning methods can effectively address the shortcomings of conventional logistic regression by accounting for non-linear relationships. This study uses the boosted regression tree (BRT) method for driver analysis. The BRT method is a self-learning approach based on classification and regression trees, integrating a boosting algorithm and the classification regression tree method, significantly improving prediction accuracy and result stability. During computation, a series of new training datasets are obtained using a resampling method to randomly extract data from the training dataset. A classification regression tree is constructed for each new training dataset to analyze the impact of independent variables on dependent variables. Subsequently, the remaining data is cross-validated for the results, and the average of the generated multiple regression trees is used as the output.
The impact of the driving factors is quantified primarily through two methods: (1) The relative impact of each independent variable on built-up land expansion and SEDI (the contribution of each independent variable to the explained variation of the dependent variable, with the sum of the relative impacts of the independent variables being 100%); and (2) the relationship between a particular independent variable and SEDI when other independent variables are held constant. Therefore, in this study, the BRT method was utilized, using the “gbm” package in R language (version 4.3.0) to analyze the influence of multiple geographical, social, and economic factors on the landscape pattern of built-up land. Following the recommendation of Elith et al. [34], the learning rate is set to 0.001.
Beijing is the capital and political, economic, and cultural center of China. As Fig. 2 shows, Beijing has 16 districts under its jurisdiction with a total area of 16,410.54 square kilometers, and its central coordinates are 116°20′ E and 39°56′ N. Beijing is the only city in the world that has successfully hosted both the Summer and the Winter Olympic Games. In 2022, Beijing, with a permanent population of 21.84 million, achieved a nominal GDP of 4.16 trillion yuan, and a per capita regional GDP of 190,000 yuan [35]. Beijing has been rated as a world-class city by the Globalization and World Cities Study Group and Network (GaWC). Moreover, it ranks second in the human development index among Chinese cities (United Nations report).

Figure 2: Location of the study area (source: Ministry of Natural Resources of the People’s Republic of China)
3.2 Data Source and Data Processing
With a resolution of 30 m, the land use data (1980, 1990, 1995, 2000, 2005, 2010, 2015, and 2020) (Data in Supplementary Materials) used in this study were sourced from the Resource and Environment Science and Data Center [36]. Its classification system includes arable land, forestland, grassland, water body, unused land, and built-up land. In this study, no strict distinction between urban and rural areas exists, thereby allowing us to cover the entire city of Beijing. Built-up land includes urban areas (field grid code 51 in the map layers in Supplementary Materials), rural residential areas (field grid code 52), as well as road and factory areas (field grid code 53). To express the dynamic changes in built-up land over time, we divided built-up land into newly developed and past built-up land. The reclassified land use types are shown in Fig. 3.


Figure 3: The land use in 1980, 1990, 1995, 2000, 2005, 2010, 2015, and 2020. To facilitate the expression of the district names, we used the acronyms in the map, detailed as follows: DC—Dongcheng, FS—Fangshan, XC—Xicheng, TZ—Tongzhou, CY—Chaoyang, SY—Shuiyi, FT—Fengtai, CP—Changping, SHS—Shijingshan, DX—Daxing, HD—Haidian, HR—Huairou, MTG—Mentougou, PG—Pinggu, MY—Miyun, and YQ—Yanqing (a–h)
The selected years were chosen to ensure decadal consistency and reflect significant urban development phases. These years also coincide with stable and comparable national land-use datasets provided by official statistical sources, allowing for consistent cross-period comparison.
To calculate the SEDI values of Beijing in 1980, 1990, 1995, 2000, 2005, 2010, 2015, and 2020, land-use types were classified as built-up and non-built-up land. The ArcGIS Pro 3.0 software, obtained from ESRI (Environmental Systems Research Institute, Inc., Redlands, CA, USA), was used for data processing. Owing to the high computational costs, procedures were developed to improve the calculation efficiency (Codes in Supplementary Materials).
Considering previous studies [37,38] and data availability for Beijing City, this study explored the drivers of urban expansion from three main aspects: geography, economy, and society. Geographical indicators include elevation and slope; economic indicators include nighttime light index and real estate transaction area; and social indicators include population quantity and distance from the city center. Real estate transaction data were obtained from the Beijing government statistics, whereas other spatial data were sourced from the Resource and Environment Science and Data Center [36].
4 Results and Driving Force Analysis
Fig. 4 shows the resulting values of the SEDI of 1980, 1990, 1995, 2000, 2005, 2010, 2015, and 2020. The overall trend of the resulting values appears to be a spiral structure in which urban development follows the law of compact (1980–1990)-sprawl (1990–1995)-compact (1995–2000)-sprawl (2000–2015)-compact (2015–2020). According to the slope magnitude in Fig. 4, we can infer the urban development in Beijing with sprawl trends from 1980–2020. The overall urban development characteristics can be described as follows: the sprawl during the entire period and the compact and sprawl are alternatives in subphases.

Figure 4: The resulting values of SEDI
4.1.1 Compact Stage: 1980–1990
At the outset of China’s reform and opening up, the nascent state of the labor, capital, and other production factor markets at the national level slowed the urban development process. As shown in Fig. 3a,b, the newly developed land presented a punctiform scatter with less area on the urban exterior and had not yet formed relatively large parcels. Therefore, the national economic and social background led to a compact city at this stage.
In the second stage, urban development exhibited obvious sprawl. As shown in Fig. 3b,c, the spatial expansion form manifested as strip development along the urban center, and the latter presented punctiform scatter in the suburbs concentrated in the Shunyi, Changping, Fangshan, Tongzhou, and Daxing districts. The main driving forces causing these changes were analyzed as follows:
Policy driven. In 1993, Beijing built 14 satellite cities and ten edges. These large projects caused the radial spread of built-up land along the transportation route between the main and satellite cities.
Research has shown that the growth of built-up land during this period was highly positively correlated with GDP [39], with economic pull being the most important and fundamental driving factor. Economic development has pushed migrants into Beijing, and the increase in population has led to the creation of housing markets and urban infrastructure. The acreage of the central urban area was not sufficient to support the rapid growth in demand, resulting in Beijing’s urban development spreading to the suburbs.
4.1.3 Compact Stage: 1995–2000
As shown in Fig. 3c,d, the urban development at this stage is evidently compacted in the empty area of the central city and along the perimeter of the original built-up land area, mainly concentrated in Changping, Chaoyang, Fengtai, Tongzhou, and Daxing. During this period, Beijing began to implement the affordable housing system. Huilongguan, Tiantongyuan, and other affordable housing residential areas are typical of this period. Affordable housing was located close to peri-urban areas.
The sprawl degree was the most severe at this stage. Newly developed land was distributed as scatter and leapfrog outside the urban areas (from Fig. 3d–g). The main driving forces were as follows:
Event driven. During this period, the 2008 Olympics events and policy were the driving forces behind the large amount of newly developed land. Under the “New Beijing, Great Olympics” concept and the unified scientific planning by the government, the urban construction and layout were orderly and reasonable, which made Beijing a typical compact city. During this process, the urban infrastructure, ecological environment, transportation capacity, and modernization level of the city significantly improved. In 2012, Tongzhou District was approved as the Beijing Municipal Administrative Center, focusing on the evacuation and transfer of Beijing’s administrative institutions and related service departments.
4.1.5 Compact Stage: 2015–2020
Depopulation pulls. Improvements at the overall economic and urban levels attracted more people, with the permanent population rapidly increasing from 2000–2010. Fig. 5 shows that the permanent population curve of Beijing from 1978 to 2015 was upward and downward from 2015 to 2020.

Figure 5: Permanent population of Beijing (sourced from the Beijing Statistical Yearbook (https://nj.tjj.beijing.gov.cn/nj/main/2024-tjnj/zk/indexeh.htm, accessed on 29 June 2025))
In the preceding sections, the SEDI provided a detailed revelation of the phased urban development characteristics of compactness-spread-compactness, and corresponding descriptions were provided for each developmental stage. To further elucidate the urban development mechanisms of each stage, this study delves into spatial expansion patterns, comprehensive landscape pattern indices of gradient belts, and various driving factors influencing urban expansion. Simultaneously, it reveals the degree of response of the SEDI to various driving factors, aiming to explore the role of new quantitative entropic methods in urban expansion research.
4.2.1 Urban Expansion Patterns from 1980 to 2020
The built-up land area continuously increased from 1399 km2 in 1980 to 3744 km2 in 2020, representing a total expansion of 2344 km2 and a growth of 167.5%. Three expansion modes (leapfrog, edge, and infill) were observed across seven study periods (1980–1990, 1990–1995, 1995–2000, 2000–2005, 2005–2010, 2010–2015, and 2015–2020), with infill expansion being predominant (1068 km2), followed by edge expansion (1040 km2) and leapfrog expansion being the least (236 km2). As illustrated in Fig. 6, the growth of Beijing’s urban area is primarily characterized by the infill and edge expansion modes. Significant occurrences of both infill and edge sprawls were observed during the periods 1990–1995 and 2010–2015, while leapfrog urban sprawl appeared more prominently. With an equal expansion of the particle area, leapfrogging urban particles at greater distances contributed to higher overall entropy and SEDI values [22]. According to Fig. 4, the quantitative entropy of the city overall also showed a similar upward trend from 2000 to 2015, corresponding to a period of severe disorderly development during 2000–2015, demonstrating the SEDI’s effective capacity to reveal changes in urban expansion patterns.

Figure 6: Spatial distribution of sprawl modes of built-up land in Beijing from 1980 to 2020
4.2.2 Gradient Belt Landscape Index Analysis
Landscape pattern indices can comprehensively reflect the structural composition and spatial configuration characteristics of urban expansion, making them important indicators for detecting gradient features of urbanization and changes in processes [40]. The SEDI, used with other landscape indices, is essential to better depict spatial patterns and changes in urban sprawl at the regional level. Drawing on relevant studies [41–43], this study selects several landscape indices, including the Percentage of Landscape (PLAND), Mean Patch Size (MPS), Edge Density (ED), Patch Density (PD), Landscape Shape Index (LSI), and Aggregation Index (AI), to characterize the pattern of urban expansion through gradient analysis.
As illustrated in Fig. 7, the first to third gradient belts represent the urban center area, the fourth and fifth represent the outer urban area, the sixth to ninth represent the suburban area, and the tenth to sixteenth represent the exurban area. Among them, the sixth to sixteenth gradient belts can be collectively referred to as the urban-suburban area.
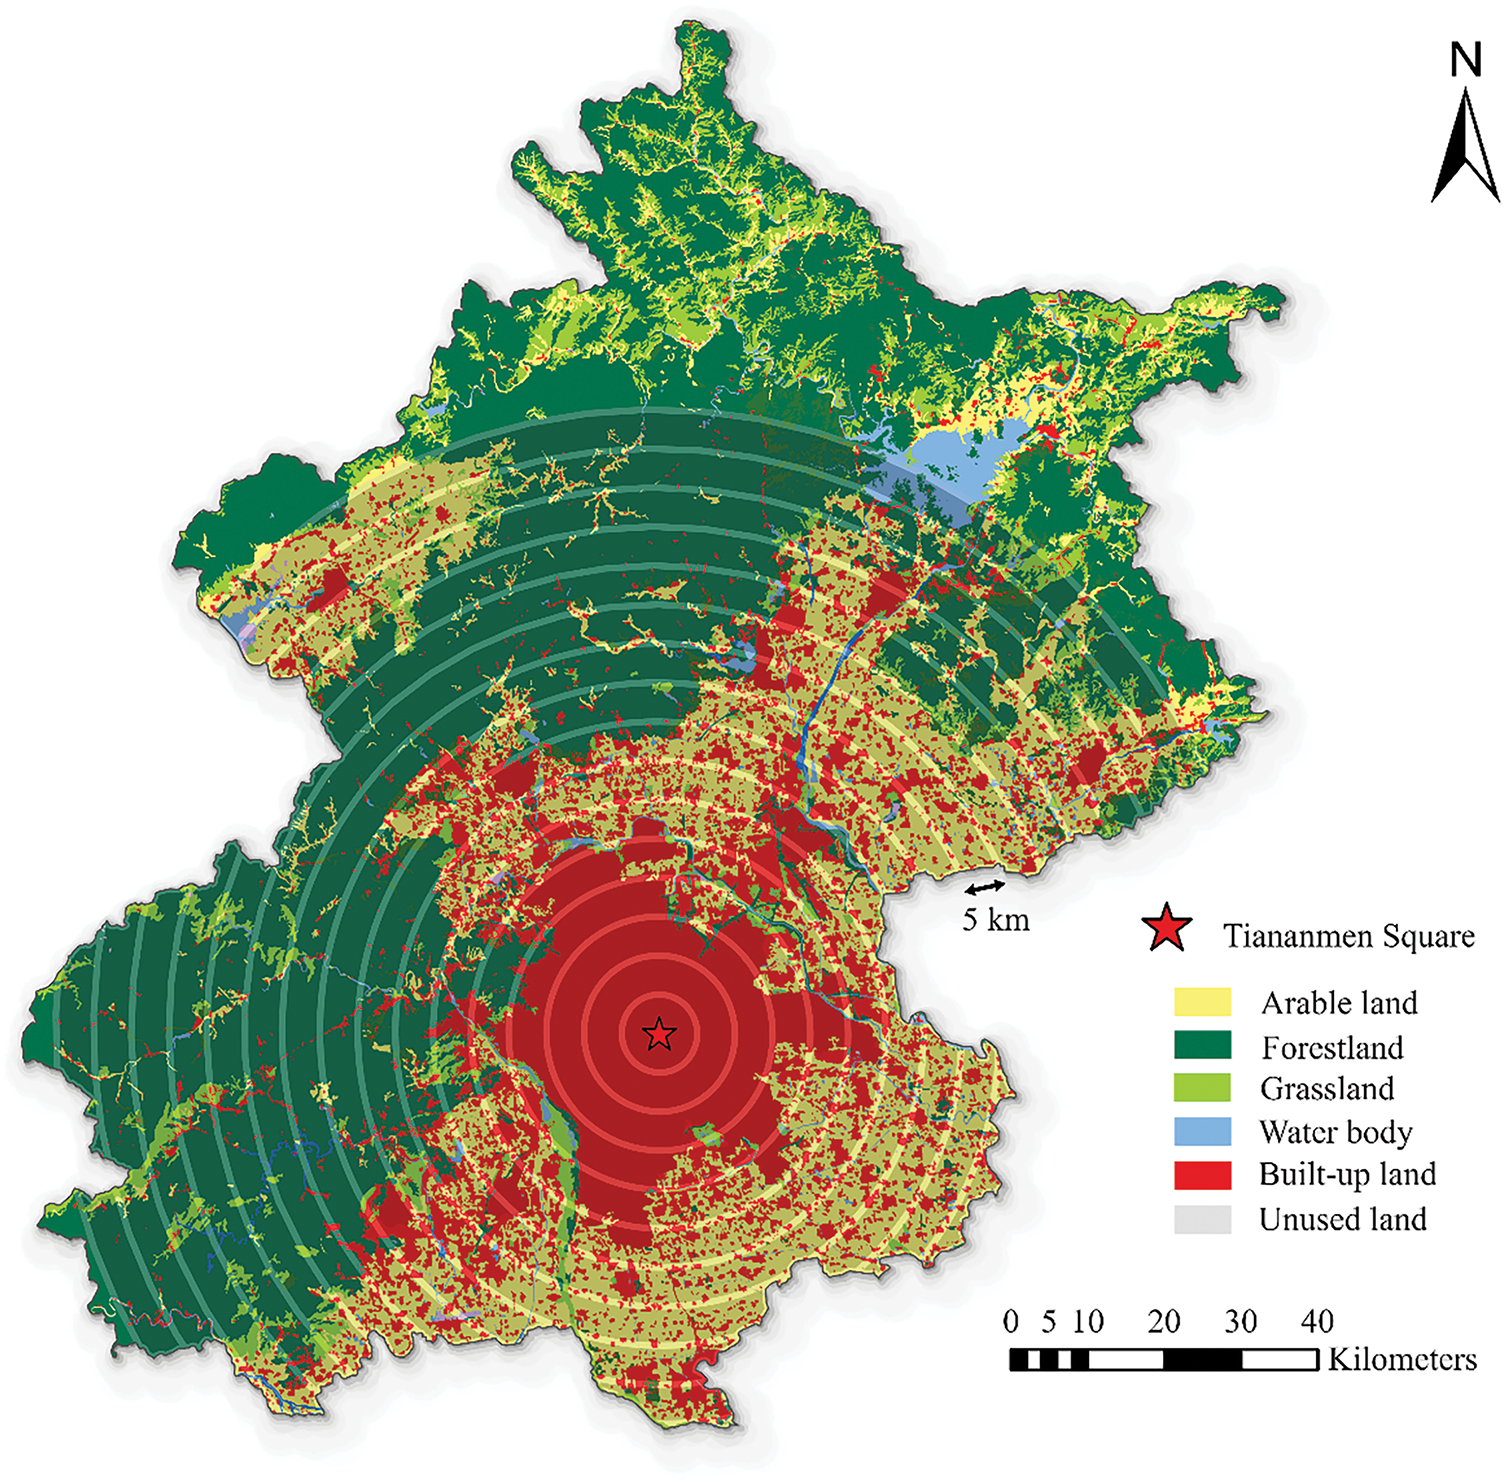
Figure 7: Setting of gradient bands in the study area
Fig. 8 illustrates the developmental status of different landscape indices. The PLAND in Beijing shows a decreasing trend from the city center towards the outskirts, indicating a gradual decrease in the dominance of built-up land further away from the city center. The MPS of built-up land in Beijing exhibits a sharp decrease along the gradient belts, with a nearly “cliff-like” decline between the second and third gradient belts after 2005. This reflects the extreme imbalance in regional development levels and the evident disorderly urban development after 2005.

Figure 8: The results of landscape indices on each gradient band
PD represents the aggregation degree of built-up land. Before and after 1990, two distinct patterns have existed, with peak values in the third and fourth gradient belts appearing primarily before 1995. This reflects the emergence of large-scale development after 1995 and a significant expansion of dispersed patches. ED is used to characterize the complexity of the edge patches. Overall, an “n” shaped trend was observed over the years, with peak values shifting from the third gradient belt in the 1980s to the fifth to seventh gradient belts, thereafter, indicating a transition from compact development to disorderly expansion, with complex patches moving outward.
LSI reflects the regularity of built-up land patches. The index values in the outskirts were similar across the years, with greater irregularity observed in the urban area from 1980 to 1990, followed by a decrease in subsequent years, indicating the effectiveness of integrated planning and development in the urban area. AI values indicate a stronger spatial correlation between built-up land patches. After 1990, the AI values showed an upward trend across all gradient belts, indicating an overall improvement in the regional integrity of Beijing, with increased connectivity between various urban blocks, particularly after 2015, presenting a trend towards compact development.
In summary, the six landscape indices explain changes in Beijing’s urban expansion patterns to varying degrees. The development characteristics of the city after 2000 differed significantly from those before 2000; however, an alternation between fragmentation and regularization was evident throughout the development process, with a spiral rise in regularization development. This is consistent with the “compact-sprawl” urban expansion pattern reflected in the SEDI for various years.
4.2.3 The Relative Influence of Each Driving Factor on Urban Expansion and SEDI
Owing to China’s initial stages of reform and opening up before the 21st century, the national-level production factor market has not yet fully developed. Considering the characteristics of Beijing’s urban development around 2000 and data availability, this study primarily focuses on the driving forces behind urban expansion and SEDI during the 21st century, specifically from 2000 to 2020. The RMSE for the calculations for each of the five years ranged from 0.008 to 0.159, indicating a small RMSE that effectively explains the variations in urban expansion and SEDI. Fig. 9 depicts the relative influence of geographic, social, and economic factors on Urban expansion and SEDI.

Figure 9: Relative influence of geographic, social, and economic factors
Through an in-depth analysis of the driving forces behind urban expansion and SEDI evolution, this study reveals that geographical factors generally exerted the greatest relative influence on urban expansion (24.89%–43.73%), followed by social factors (22.24%–39.28%) and economic factors (20.46%–37.62%). Regarding SEDI evolution, social (44.88%–64.43%) and economic (20.37%–46.94%) factors far outweighed geographical factors (7.77%–15.29%). These factors changed in importance with city development, with economic factors showing a declining trend in their impact on urban expansion.
Related urban studies indicate that rapid economic growth significantly alters urban patterns [44]. This study confirms this point while revealing the distinct phase-specific nature of economic influence. At the beginning of the 21st century, the effects of various factors on urban expansion were similar. However, after 2000, with the acceleration of Beijing’s urbanization and rapid economic development, the influence of various factors diverged significantly. From 2000 to 2010, factors, such as slope and economic indicators represented by the nighttime light index, exhibited a higher influence. Subsequently, from 2010 to 2020, social factors, such as population, replaced the dominance of the nighttime light index in influencing urban expansion. This reflects the phase-specific decline in urbanization following the slowdown in economic growth in 2010, leading to further planning and control measures for urban expansion.
Regarding the SEDI changes, the alternating spiral pattern of population and elevation impacted SEDI. Overall, after the transitional period of the first decade of the 21st century, the population largely explained the built-up land expansion (21.2%–26.23%) and SEDI variation (25.03%–53.06%) for each year. This indicates that population is the primary driving force behind the current urban expansion in Beijing. As the economic, political, and cultural center of China, Beijing has experienced a significant influx of migrants for a long time. With the population increase, the housing provided by cities has become increasingly insufficient to meet housing needs, leading to significant urban expansion. Without proper urban planning, disorderly expansion is inevitable in the urbanization process, leading to the growth of SEDI along with the expansion of built-up land patches during the urban construction process. Moreover, the spatial expansion of urban sprawl in the middle and later stages of urban development was influenced more by complex socioeconomic factors than that by geographical factors. The slow population growth from 2015 to 2020 led to a shift in the pattern, driving the compact development of Beijing’s urban area.
4.2.4 Stage-Specific Mechanisms in Urban Expansion Dynamics
To further interpret the dynamic evolution of driving mechanisms across different stages, we classified the period from 2000 to 2020 into two distinct phases. From 2000 to 2010, Beijing’s urban expansion was predominantly shaped by economic and geographic indicators, such as the nighttime light index and slope. This reflects a phase of infrastructure-led expansion, where mega-events like the 2008 Olympics catalyzed large-scale spatial restructuring. During this stage, urban growth followed a policy-induced model emphasizing rapid land conversion for construction and transportation hubs [45].
However, from 2010 to 2020, the mechanism shifted: social forces—particularly population density and administrative realignment—became the principal drivers. For example, the designation of Tongzhou as Beijing’s administrative sub-center triggered infill development and structural compactness. Simultaneously, land use regulation and market stabilization policies constrained further economic-driven outward sprawl. The declining influence of the nighttime light index and growing impact of slope and elevation during this period indicate spatial resistance due to land scarcity [46,47].
Notably, these transitions were captured by corresponding fluctuations in the SEDI, which increased significantly during the sprawl-dominated phase (2000–2010), reflecting higher spatial disorder, and stabilized or declined during the compact-driven phase (2010–2020), consistent with population-led structural consolidation. This suggests that SEDI not only quantifies spatial dispersion but also indirectly encodes the dominant mechanisms of expansion by responding sensitively to shifts in the spatial configuration and actor dominance. Recent studies emphasize that entropy-based metrics are valuable not only for pattern detection but also for revealing latent systemic drivers of urban morphology evolution [48,49].
This stage-specific evolution illustrates how urban sprawl is a product of not just static factors but a dynamic interaction of shifting policy regimes, market responses, and ecological constraints. These findings align with the urban agglomeration literature, which emphasizes how institutional change mediates the spatiotemporal rhythm of expansion through a nonlinear, phased trajectory [50,51].
4.2.5 The Relationship between SEDI and Geographic, Social, and Economic Factors
In-depth research was conducted on the marginal effects of specific driving factors on the SEDI to further explore the role of the novel method used for uncovering spatial expansion patterns and the urban sprawl phenomena.
According to Fig. 10, the influence of distance from the city center and geographic factors (elevation and slope) on the extent of urban-land expansion exhibits a decreasing trend. A distance of 20,000 m is a critical threshold that significantly divides the city’s spatial expansion capability, with rebounds in SEDI values occurring in all years except 2005 and 2010. Across all years, 200 m served as the boundary influenced by elevation. Conversely, differences were observed regarding slope, where a sharp drop occurred around 5 degrees, separating into two distinct gradients, and an inverted U-shaped variation was evident between 7 to 12 degrees of slopes. This suggests that a slope of 7 degrees marks an edge boundary for urban expansion, where urban construction patches may struggle to continue expanding, with a slight increase beyond 12 degrees. This could be attributed SEDI fluctuations caused by rural built-up land, with the effect becoming more pronounced as the year approaches 2020. This indicates the potential of SEDI in the field of urban–rural integration research.


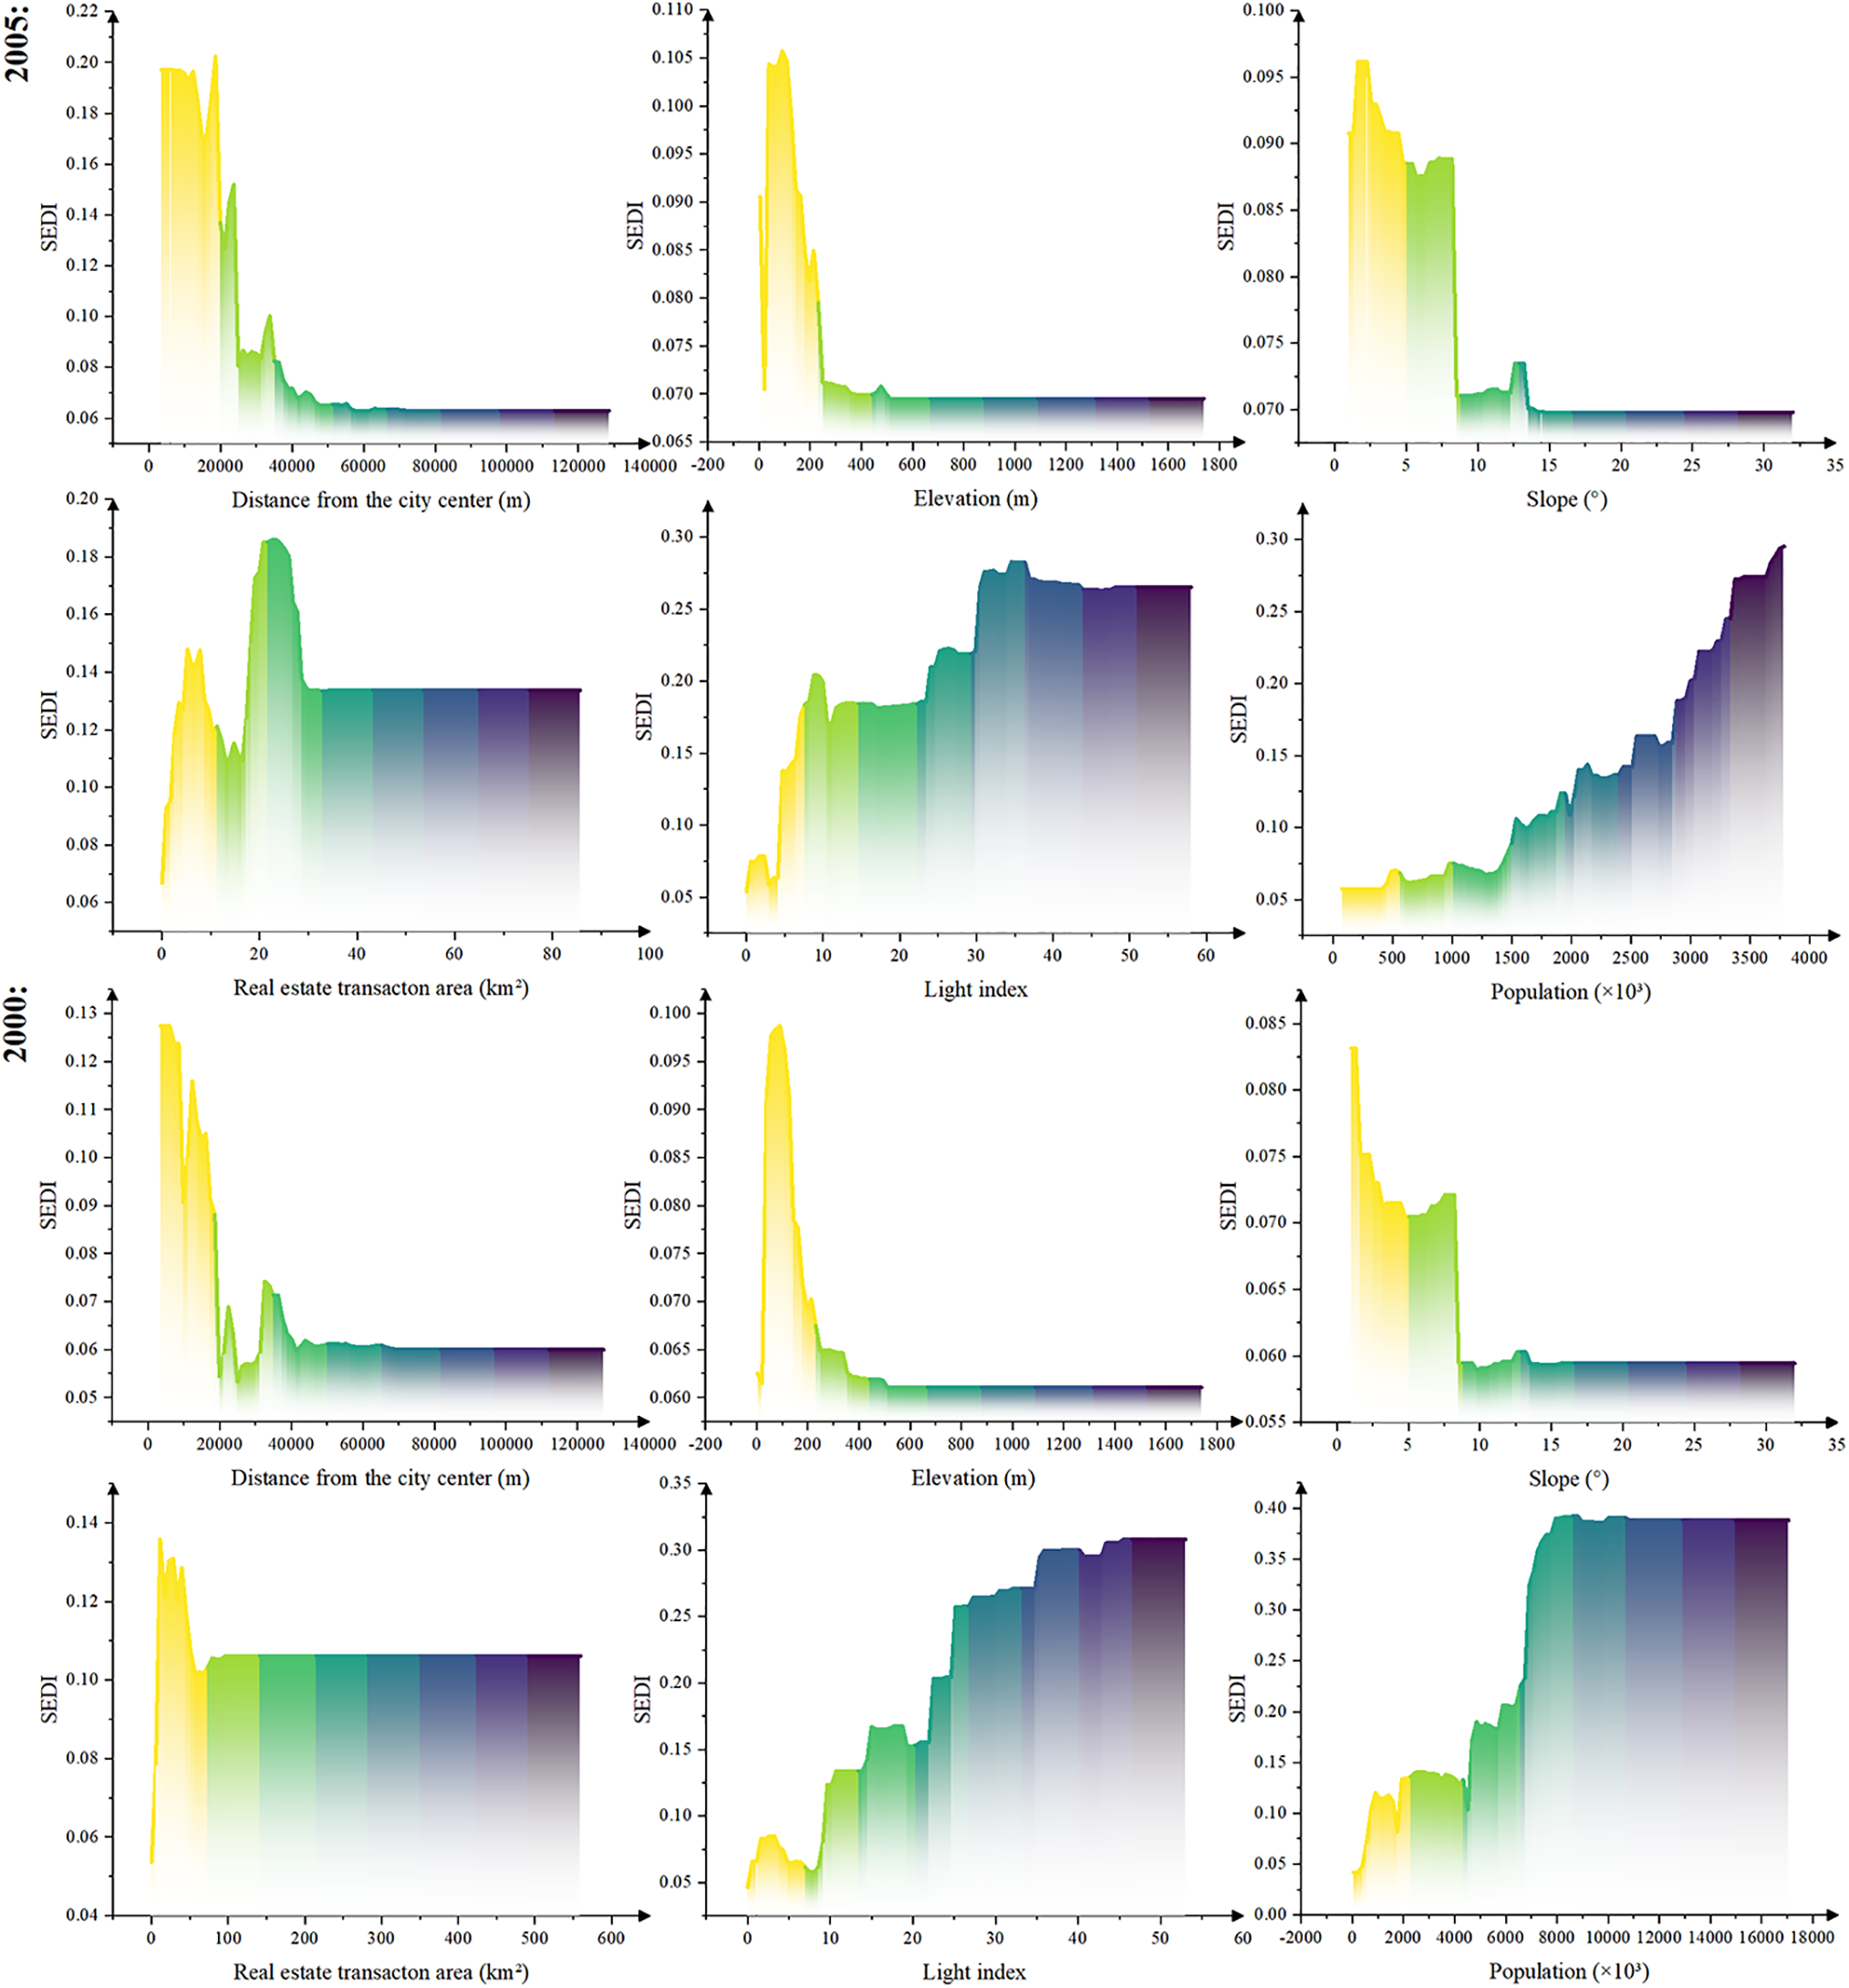
Figure 10: Partial dependences of geographic, social, and economic factors on SEDI
Compared with geographic elements, the differences in social and economic factors in spatial expansion were more pronounced. On the horizontal axis, the early population levels were relatively low, requiring relatively small population changes to drive urban spatial expansion or contraction. However, from 2010 to 2020, a larger population (over one million people) was needed to reach the marginal limit of SEDI growth, thus demonstrating the differential impact of population levels at different stages of urban development. The effect of the real estate transaction area on the SEDI also showed significant differences over different periods, with considerable disparities in the maximum impact level on the horizontal coordinate values (e.g., approximately 50 km2 in 2020 and approximately 10 km2 in 2000). This is partly due to non-market factors such as government, public facilities, and agency real estate transfers, which are largely influenced by policies and administrative orders rather than market mechanisms. The nighttime light index also exhibited variability, as evidenced by the “inverted U-shaped” collapse observed in 2010, which was not as prominent in other years. The nighttime light index effectively depicted economic activities [52,53], thus suggesting that the collapse may be associated with economic fluctuations at the time, such as the 2008 economic crisis.
Previous studies on urban sprawl have primarily employed either entropy-based metrics or morphological indices to detect expansion patterns, but often lack integrative modeling frameworks. For instance, Kumar [33] applied Shannon entropy to assess sprawl dynamics in Tumkur, India, while Şen [54] explored migration-driven sprawl in Gaziantep, Turkey. Both studies offer valuable insights but remain confined to descriptive characterizations. Similarly, recent reviews such as Tavares [55] examined the socio-environmental consequences of sprawl in Brazilian cities but did not incorporate entropy into a structured model of underlying mechanisms.
By contrast, our study not only introduces the SEDI to quantify entropy, but also incorporates phase-specific driver analysis via boosted regression trees. This integrative approach allows us to link spatial disorder with dominant social, economic, and geographic forces at different urbanization stages, establishing a dynamic feedback mechanism between entropy, urban morphology, and drivers. This approach shifts the analytical focus from static spatial descriptions to a structured, mechanism-oriented framework capable of capturing stage-specific interactions between urban entropy, morphology, and driving factors.
5.1 New Method Bridges Urban Morphological Analysis and Environmental Behavior Research
Urban morphology (form) research has always followed two approaches: (1) an approach based on spatial scale and emphasizes the procedural way of urban morphology from urban components to urban wholeness [56]; and (2) based on temporal scale and emphasizes the evolution process of urban form under driving factors such as political, social, economic, and planning processes, and other environmental behaviors [57]. By bridging the mathematical relationship between urban morphology and the factors driving urban development, our new method successfully connects the two approaches.
5.2 Urban Sprawl Is the Morphological Distortion of an Urban Self-Organizing System
Urban sprawl presents different characteristics in different cities at different stages, driven by different policy, social, market, and terrain factors [6,58,59], and is characterized by the process of entropy change under the action of driving factors. Cooperation and competition among driving forces are the source of the “ebb and flow” of urban forms. Urban sprawl or compaction at different stages results from the cumulative effects of entropy change. Thus, urban sprawl is an unhealthy urban form or a morphological distortion of an urban self-organizing system.
5.3 Outside of the Research Paradigm of Urban Development, either Sprawl or Compact
Urban form is an outcome of urbanization [13]. Batty argued that urban form is a function of urban spatial growth and time evolution, a concept that is reflected in the dynamic process of urban center to urban periphery development [60]. Beijing’s urban sprawl is evident, and falls within the paradigm of either sprawl or contact development [6,23–25]. However, this is rarely discussed outside of research contexts.
As described in the Results section, urban sprawl in Beijing exhibits periodic characteristics over time. Fig. 11 shows that only the trend line oscillates within the zone bounded by two lines between the two highest peaks or the two lowest valleys and that city development must appear with sprawl features. Simultaneously as in the Results section, Fig. 11 shows that urban development in the general sprawl characteristics is simultaneously accompanied by temporal fine-grained urban compact development, as evident in the 1980–1990 and 1995–2000 periods.

Figure 11: Urban sprawl trend map
These periodic features suggest that urban form does not evolve in a strictly linear trajectory but oscillates within alternating sprawl and compact phases. To further validate and enrich this cyclical understanding, future research may employ higher-frequency land-use data. Such data could help identify transient shifts—such as infill bursts or sudden regulatory responses—that are not visible in decadal trends, thereby refining the granularity and interpretability of the observed sprawl–compaction rhythms.
5.4 Conclusions and Suggestions
Evidently, urban sprawl has affected the world’s sustainable economic and social development and has become the subject of many debates. A city is a self-organizing system with a dissipative function accompanied by entropy change, which is widely accepted in theoretical urban development circles. Entropy change theory has been used as a qualitative tool in urban sprawl research; unfortunately, no successful quantitative tool exists. Thus, building a method that bridges entropy changes and urban sprawl metrics should open a new window to understanding urban sprawl. In this study, a new method was successfully developed and used to demonstrate urban changes in Beijing.
Research has shown that the new method can completely confirm urban sprawl trends and analyze urban form changes by dominant driving factors. This method contributes to the conclusion that urban sprawl is a form of distortion of an urban self-organizing system. In addition, combined with example verification, the new method is useful in leaving the research paradigm of either sprawl or a compact state in urban development.
An empirical study on Beijing shows that the city-form change appears to be a sprawl trend from 1980–2020 at a coarse temporal granularity. Evidently, the periodicity at fine temporal granularity follows the law of compact-sprawl-compact-sprawl-compact. In-depth research was conducted through the spatial identification of urban expansion patterns, comparative analysis of the gradient band landscape, and driving force analysis using machine-learning methods, thus confirming the characteristics of each developmental stage. Further exploration was performed using the emerging SEDI method. The driving factors of city form change include important events, politics, economy, population growth, and market pull. The development and change of the urban form in Beijing result from cooperation and games among the different driving factors. Moreover, the extent of urban sprawl is more influenced by complex socioeconomic factors than geographical factors in the later stages of urbanization development.
The SEDI-entropy framework proposed in this study provides a practical diagnostic tool for analyzing spatial disorder in urban growth. Urban planners can integrate this method into existing workflows by embedding SEDI indicators into GIS-based land monitoring systems or urban information platforms. It can be used to identify morphological instability at the urban fringe, assess the impact of growth boundaries, or guide zoning revisions. Entropy-based metrics, as employed in recent studies, have also proven useful in delineating urban boundaries and anticipating infrastructure requirements in sprawling contexts [61]. In particular, SEDI thresholds may serve as early-warning signals for uncontrolled sprawl, triggering planning reviews. While real-time monitoring is currently limited by the updated frequency of land-use data, routine assessments based on satellite imagery or land surveys are highly feasible. The required data includes consistent multi-temporal land-use maps, administrative urban boundaries, and auxiliary layers such as elevation, infrastructure, or planned land-use designations. These datasets are typically accessible from national remote sensing programs, cadastral archives, or municipal spatial planning departments.
Suggestions and future work. In urban management, regularly monitoring changes in various driving factors and effectively assessing the impact of these factors is imperative. Urban development plans should be formulated or adjusted to prevent urban sprawl deterioration based on the periodic law of urban form spread. This study contributes to a new universal analysis tool to confirm the urban sprawl trend in urban development. Therefore, its application scenario can be extended to any city or region worldwide.
Evidence from other urban systems reinforces this potential. Entropy-based metrics similar to SEDI have been effectively applied in cities like Changwon and Gimhae in Korea [62], and in various European metropolitan regions [32], where they captured spatial expansion dynamics under diverse regional settings. These examples confirm that the entropic framework developed in this study is not only theoretically transferable but also empirically adaptable, making it a promising tool for multi-city comparative studies.
In our follow-up research, we plan to apply the SEDI method to a broader range of cities with differing spatial structures and development paths. This extension will help further examine the method’s robustness and adaptability across various urban contexts, and refine threshold settings for identifying early-warning signals of spatial disorder. In particular, we intend to incorporate higher temporal resolution—such as annual or biennial land-use data—to capture short-term morphological fluctuations that may be masked by decadal trends. These steps will contribute to strengthening the method’s applicability in practical urban analysis and planning scenarios.
Acknowledgement: Not applicable.
Funding Statement: This study was supported by the National Natural Science Foundation of China (Grant No. 42171395, No. 41801298), the Natural Science Foundation of Jiangsu Province of China (Grant BK20220126, BK20180348).
Author Contributions: Conceptualization, Zhensen Wei; methodology, Zhensen Wei; investigation, Zhen Chen; writing—original draft preparation, Zhen Chen; writing—review and editing, Penghui Jiang. All authors reviewed the results and approved the final version of the manuscript.
Availability of Data and Materials: Data available on request from the authors. The data that support the findings of this study are available from the corresponding author, Penghui Jiang, upon reasonable request.
Ethics Approval: Not applicable.
Conflicts of Interest: The authors declare no conflicts of interest to report regarding the present study.
Supplementary Materials: The supplementary material is available online at https://www.techscience.com/doi/10.32604/rig.2025.065814/s1.
References
1. Yue W, Wu T, Liu X, Zhang L, Wu C, Ye Y, et al. Developing an urban sprawl index for China’s megacities. Acta Geogr Sin. 2020;75:2730–43. (In Chinese). doi:10.11821/dlxb202012013. [Google Scholar] [CrossRef]
2. Schneider A, Woodcock CE. Compact, dispersed, fragmented, extensive? A comparison of urban growth in twenty-five global cities using remotely sensed data, pattern metrics and census information. Urban Stud. 2008;45(3):659–92. doi:10.1177/0042098007087340. [Google Scholar] [CrossRef]
3. Salvati L, Zambon I, Chelli FM, Serra P. Do spatial patterns of urbanization and land consumption reflect different socioeconomic contexts in Europe? Sci Total Environ. 2018;625(4):722–30. doi:10.1016/j.scitotenv.2017.12.341. [Google Scholar] [PubMed] [CrossRef]
4. Hamidi S, Ewing R. A longitudinal study of changes in urban sprawl between 2000 and 2010 in the United States. Landsc Urban Plan. 2014;128(3):72–82. doi:10.1016/j.landurbplan.2014.04.021. [Google Scholar] [CrossRef]
5. Antrop M. Landscape change and the urbanization process in Europe. Landsc Urban Plan. 2004;67(1–4):9–26. doi:10.1016/S0169-2046(03)00026-4. [Google Scholar] [CrossRef]
6. Jiang F, Liu S, Yuan H, Zhang Q. Measuring urban sprawl in Beijing with geo-spatial indices. Acta Geogr Sin. 2007;62(6):649–58. (In Chinese). doi:10.11821/xb200706010. [Google Scholar] [CrossRef]
7. Fazal S. Urban expansion and loss of agricultural land—a GIS based study of Saharanpur City, India. Environ Urbanization. 2000;12(2):133–49. doi:10.1177/095624780001200211. [Google Scholar] [CrossRef]
8. Ewing R. Characteristics, causes, and effects of sprawl: a literature review. In: Marzluff JM, Shulenberger E, Endlicher W, Alberti M, Bradley G, Ryan C et al., editors. Urban ecology: an international perspective on the interaction between humans and nature. Boston, MA, USA: Springer US; 2008. p. 519–35. [Google Scholar]
9. Brueckner JK. Urban sprawl: diagnosis and remedies. Int Reg Sci Rev. 2000;23(2):160–71. doi:10.1177/016001700761012710. [Google Scholar] [CrossRef]
10. Zhang X, Zhou J, Song W. Simulating urban sprawl in China based on the artificial neural network-cellular automata-Markov model. Sustainability. 2020;12(11):4341. doi:10.3390/su12114341. [Google Scholar] [CrossRef]
11. Gao B, Huang Q, He C, Sun Z, Zhang D. How does sprawl differ across cities in China? A multi-scale investigation using nighttime light and census data. Landsc Urban Plan. 2016;148(3):89–98. doi:10.1016/j.landurbplan.2015.12.006. [Google Scholar] [CrossRef]
12. Zhang Y, Mao W, Zhang B. Distortion of government behaviour under target constraints: economic growth target and urban sprawl in China. Cities. 2022;131(2):104009. doi:10.1016/j.cities.2022.104009. [Google Scholar] [CrossRef]
13. Knox PL. The restless urban landscape: economic and sociocultural change and the transformation of metropolitan Washington, DC. Ann Assoc Am Geogr. 1991;81(2):181–209. doi:10.1111/j.1467-8306.1991.tb01686.x. [Google Scholar] [CrossRef]
14. Guo F, Qu X, Ma Y, Tong L. Spatiotemporal pattern evolution and influencing factors of shrinking cities: evidence from China. Cities. 2021;119(1):103391. doi:10.1016/j.cities.2021.103391. [Google Scholar] [CrossRef]
15. Wang Y. The analysis of entropy changes on the evolutional tendency of geographical environment. Acta Geogr Sin. 2011;66(11):1508–17. (In Chinese). doi:10.11821/xb201111007. [Google Scholar] [CrossRef]
16. Lang RE, LeFurgy J. Edgeless cities: examining the noncentered metropolis. Hous Policy Debate. 2003;14(3):427–60. doi:10.1080/10511482.2003.9521482. [Google Scholar] [CrossRef]
17. Burchfield M, Overman HG, Puga D, Turner MA. Causes of sprawl: a portrait from space. Q J Econ. 2006;121(2):587–633. doi:10.1162/qjec.2006.121.2.587. [Google Scholar] [CrossRef]
18. Laidley T. Measuring sprawl: a new index, recent trends, and future research. Urban Aff Rev. 2015;52(1):66–97. doi:10.1177/1078087414568812. [Google Scholar] [CrossRef]
19. Kasanko M, Barredo JI, Lavalle C, McCormick N, Demicheli L, Sagris V, et al. Are European cities becoming dispersed? A comparative analysis of 15 European urban areas. Landsc Urban Plan. 2006;77(1–2):111–30. doi:10.1016/j.landurbplan.2005.02.003. [Google Scholar] [CrossRef]
20. Galster G, Hanson R, Ratcliffe MR, Wolman H, Coleman S, Freihage J. Wrestling sprawl to the ground: defining and measuring an elusive concept. Hous Policy Debate. 2001;12(4):681–717. doi:10.1080/10511482.2001.9521426. [Google Scholar] [CrossRef]
21. Huang J, Lu XX, Sellers JM. A global comparative analysis of urban form: applying spatial metrics and remote sensing. Landsc Urban Plan. 2007;82(4):184–97. doi:10.1016/j.landurbplan.2007.02.010. [Google Scholar] [CrossRef]
22. Chen Z, Zhou Y, Jin X. A novel index based on binary entropy to confirm the spatial expansion degree of urban sprawl. Entropy. 2018;20(8):559. doi:10.3390/e20080559. [Google Scholar] [PubMed] [CrossRef]
23. Yang Y, Liu Y, Li Y, Du G. Quantifying spatio-temporal patterns of urban expansion in Beijing during 1985–2013 with rural-urban development transformation. Land Use Policy. 2018;74(7499):220–30. doi:10.1016/j.landusepol.2017.07.004. [Google Scholar] [CrossRef]
24. Hu Y, Kong X, Zheng J, Sun J, Wang L, Min M. Urban expansion and farmland loss in Beijing during 1980–2015. Sustainability. 2018;10(11):3927. doi:10.3390/su10113927. [Google Scholar] [CrossRef]
25. Jiang G, Ma W, Wang D, Zhou D, Zhang R, Zhou T. Identifying the internal structure evolution of urban built-up land sprawl (UBLS) from a composite structure perspective: a case study of the Beijing metropolitan area, China. Land Use Policy. 2017;62(2):258–67. doi:10.1016/j.landusepol.2016.12.014. [Google Scholar] [CrossRef]
26. Bhatta B, Saraswati S, Bandyopadhyay D. Urban sprawl measurement from remote sensing data. Appl Geogr. 2010;30(4):731–40. doi:10.1016/j.apgeog.2010.02.002. [Google Scholar] [CrossRef]
27. Riitters KH, O’Neill RV, Hunsaker CT, Wickham JD, Yankee DH, Timmins SP, et al. A factor analysis of landscape pattern and structure metrics. Landsc Ecol. 1995;10(1):23–39. doi:10.1007/BF00158551. [Google Scholar] [CrossRef]
28. Batty M. Cities as complex systems: scaling, interaction, networks, dynamics and urban morphologies. New York, NY, USA: Springer New York; 2009. [Google Scholar]
29. Blumenfeld H. The tidal wave of metropolitan expansion. J Am Inst Plan. 1954;20(1):3–14. doi:10.1080/01944365408979167. [Google Scholar] [CrossRef]
30. Dietzel C, Oguz H, Hemphill JJ, Clarke KC, Gazulis N. Diffusion and coalescence of the Houston metropolitan area: evidence supporting a new urban theory. Environ Plann B Plann Des. 2005;32(2):231–46. doi:10.1068/b31148. [Google Scholar] [CrossRef]
31. Yeh AGO, Li X. Measurement and monitoring of urban sprawl in a rapidly growing region using entropy. Photogramm Eng Remote Sens. 2001;67(1):83–90. [Google Scholar]
32. Altieri L, Cocchi D, Roli G. Measuring heterogeneity in urban expansion via spatial entropy. Environmetrics. 2019;30(2):e2548. doi:10.1002/env.2548. [Google Scholar] [CrossRef]
33. Kumar AK, Govindaraju, Rakesh CJ, Lokanath S. Appraising the degrees of sprawl, freedom and goodness of urban growth detection using geoinformatics approach—a study of tumkur city in Karnataka state, India. Nat Env Poll Tech. 2025;24(S1):77–96. doi:10.46488/nept.2024.v24is1.005. [Google Scholar] [CrossRef]
34. Elith J, Leathwick JR, Hastie T. A working guide to boosted regression trees. J Anim Ecol. 2008;77(4):802–13. doi:10.1111/j.1365-2656.2008.01390.x. [Google Scholar] [PubMed] [CrossRef]
35. Beijing Municipal Bureau of Statistics, Survey Office of the National Bureau of Statistics in Beijing. Statistical bulletin on national economic and social development of Beijing in 2022. Beijing, China: The People’s Government of Bejing Municipality; 2023. [Google Scholar]
36. Data Center for Resources and Environmental Sciences (RESDC) [Internet]. [cited 2025 Jan 1]. Available from: http://www.resdc.cn. [Google Scholar]
37. Lu D, Li L, Li G, Fan P, Ouyang Z, Moran E. Examining spatial patterns of urban distribution and impacts of physical conditions on urbanization in coastal and inland metropoles. Remote Sens. 2018;10(7):1101. doi:10.3390/rs10071101. [Google Scholar] [CrossRef]
38. Zhong Y, Lin A, He L, Zhou Z, Yuan M. Spatiotemporal dynamics and driving forces of urban land-use expansion: a case study of the Yangtze River economic belt, China. Remote Sens. 2020;12(2):287. doi:10.3390/rs12020287. [Google Scholar] [CrossRef]
39. Gong H, Li X, Zhang Y, Zhao W. Analyzing the mechanism of land use change in Beijing City from 1990 to 2000. Resour Sci. 2007;29:206–13. (In Chinese). doi:10.3321/j.issn:1007-7588.2007.03.031. [Google Scholar] [CrossRef]
40. Su S, Ma X, Xiao R. Agricultural landscape pattern changes in response to urbanization at ecoregional scale. Ecol Indic. 2014;40:10–8. doi:10.1016/j.ecolind.2013.12.013. [Google Scholar] [CrossRef]
41. Hastie T, Tibshirani R, Friedman J. The elements of statistical learning. New York, NY, USA: Springer; 2009. [Google Scholar]
42. Müller D, Leitão PJ, Sikor T. Comparing the determinants of cropland abandonment in Albania and Romania using boosted regression trees. Agric Syst. 2013;117:66–77. doi:10.1016/j.agsy.2012.12.010. [Google Scholar] [CrossRef]
43. Dong G, Xu E, Zhang H. Spatiotemporal variation of driving forces for settlement expansion in different types of counties. Sustainability. 2016;8(1):39. doi:10.3390/su8010039. [Google Scholar] [CrossRef]
44. Fang C, Li G, Wang S. Changing and differentiated urban landscape in China: spatiotemporal patterns and driving forces. Environ Sci Technol. 2016;50(5):2217–27. doi:10.1021/acs.est.5b05198. [Google Scholar] [PubMed] [CrossRef]
45. Li M, Cao Y, Song J, Li H, Liang M. Spatiotemporal characteristics and determinants of urban expansion in China: perspective of urban agglomerations. Front Earth Sci. 2025;12:1523020. doi:10.3389/feart.2024.1523020. [Google Scholar] [CrossRef]
46. Zhao D, Liu K, Li J, Zhai J. Spatial reconstruction and determinants of industrial land in China’s urban expansion: a theoretical framework. Land. 2025;14(2):213. doi:10.3390/land14020213. [Google Scholar] [CrossRef]
47. Wu Q, Chang W, Song M, Zhu H. Measurement of urban-rural integration development level and diagnosis of obstacle factors: evidence from the Beijing-Tianjin-Hebei urban agglomeration, China. Land. 2025;14(2):261. doi:10.3390/land14020261. [Google Scholar] [CrossRef]
48. Wang R, Liu X, Zhao X, Cheng X, Qiu H. A novel entropy-based method for quantifying urban energy demand aggregation: implications for urban planning and policy. Sustain Cities Soc. 2024;103(3):105284. doi:10.1016/j.scs.2024.105284. [Google Scholar] [CrossRef]
49. Gao C, Lu H, Ding W, Larkham PJ. The relationship between urban form and land-use regulation in China: the case of Nanjing. Urban Morphol. 2024;28(1):3–26. doi:10.51347/um28.0001. [Google Scholar] [CrossRef]
50. Qin X, Qin X. Research on the level of high-quality urban development based on big data evaluation system: a study of 151 prefecture-level cities in China. Sustainability. 2025;17(3):836. doi:10.3390/su17030836. [Google Scholar] [CrossRef]
51. Du H, Liu J. Exploring spatial-temporal coupling and its driving factors of cultural and tourism industry in the Beijing-Tianjin-Hebei urban agglomeration, China. Sustainability. 2025;17(3):890. doi:10.3390/su17030890. [Google Scholar] [CrossRef]
52. Elvidge CD, Baugh KE, Kihn EA, Kroehl HW, Davis ER, Davis CW. Relation between satellite observed visible-near infrared emissions, population, economic activity and electric power consumption. Int J Remote Sens. 1997;18(6):1373–9. doi:10.1080/014311697218485. [Google Scholar] [CrossRef]
53. Ghosh T, Powell RL, Elvidge CD, Baugh KE, Sutton PC, Anderson S. Shedding light on the global distribution of economic activity. Open Geogr J. 2010;3(1):147–60. doi:10.2174/1874923201003010147. [Google Scholar] [CrossRef]
54. Şen G. Effects of urban sprawl due to migration on spatiotemporal land use-land cover change: a case study of Bartın in Türkiye. Sci Rep. 2025;15(1):815. doi:10.1038/s41598-025-85353-z. [Google Scholar] [PubMed] [CrossRef]
55. Tavares J. Urban sprawl and transformations in the urban fabric: contemporary challenges for Brazilian cities. Limaq. 2025;15(15):1–22. doi:10.26439/limaq2024.n14.6961. [Google Scholar] [CrossRef]
56. Whitehand JWR, Samuels I, Conzen MP. Conzen, M.R.G. 1960: Alnwick, Northumberland: a study in town-plan analysis. Prog Hum Geogr. 2009;33(6):859–64. doi:10.1177/0309132509334948. [Google Scholar] [CrossRef]
57. Lynch K, Rodwin L. A theory of urban form. J Am Inst Plan. 2007;24(4):201–14. [Google Scholar]
58. Pan F, Sun Y, Jiang N, Jian Z, Mei Y, Liu Q. Analysis of the coordination of built-up area expansion and population growth in the Shandong peninsula urban agglomeration. Sustainability. 2023;15(10):7763. doi:10.3390/su15107763. [Google Scholar] [CrossRef]
59. Frederic Deng F, Huang Y. Uneven land reform and urban sprawl in China: the case of Beijing. Prog Plan. 2004;61(3):211–36. doi:10.1016/j.progress.2003.10.004. [Google Scholar] [CrossRef]
60. Batty M. Models, methods and rationality in urban and regional planning: developments since 1960. Area. 1976;8(2):93–7. [Google Scholar]
61. Hildebrand N, Kummer S. Exploring urban environment heterogeneity: impact of urban sprawl on charging infrastructure demand over time. World Electr Veh J. 2024;15(12):589. doi:10.3390/wevj15120589. [Google Scholar] [CrossRef]
62. Cho KH, Lee DH, Kim TS, Jang GS. Measurement of 30-year urban expansion using spatial entropy in Changwon and Gimhae, Korea. Sustainability. 2021;13(2):632. doi:10.3390/su13020632. [Google Scholar] [CrossRef]
Cite This Article
 Copyright © 2025 The Author(s). Published by Tech Science Press.
This work is licensed under a Creative Commons Attribution 4.0 International License , which permits unrestricted use, distribution, and reproduction in any medium, provided the original work is properly cited.
 Downloads
 Citation Tools